Optimisation Model for Spatialisation of Population Based on Human Footprint Index Correction
Abstract
1. Introduction
2. Study Area and Data Sources
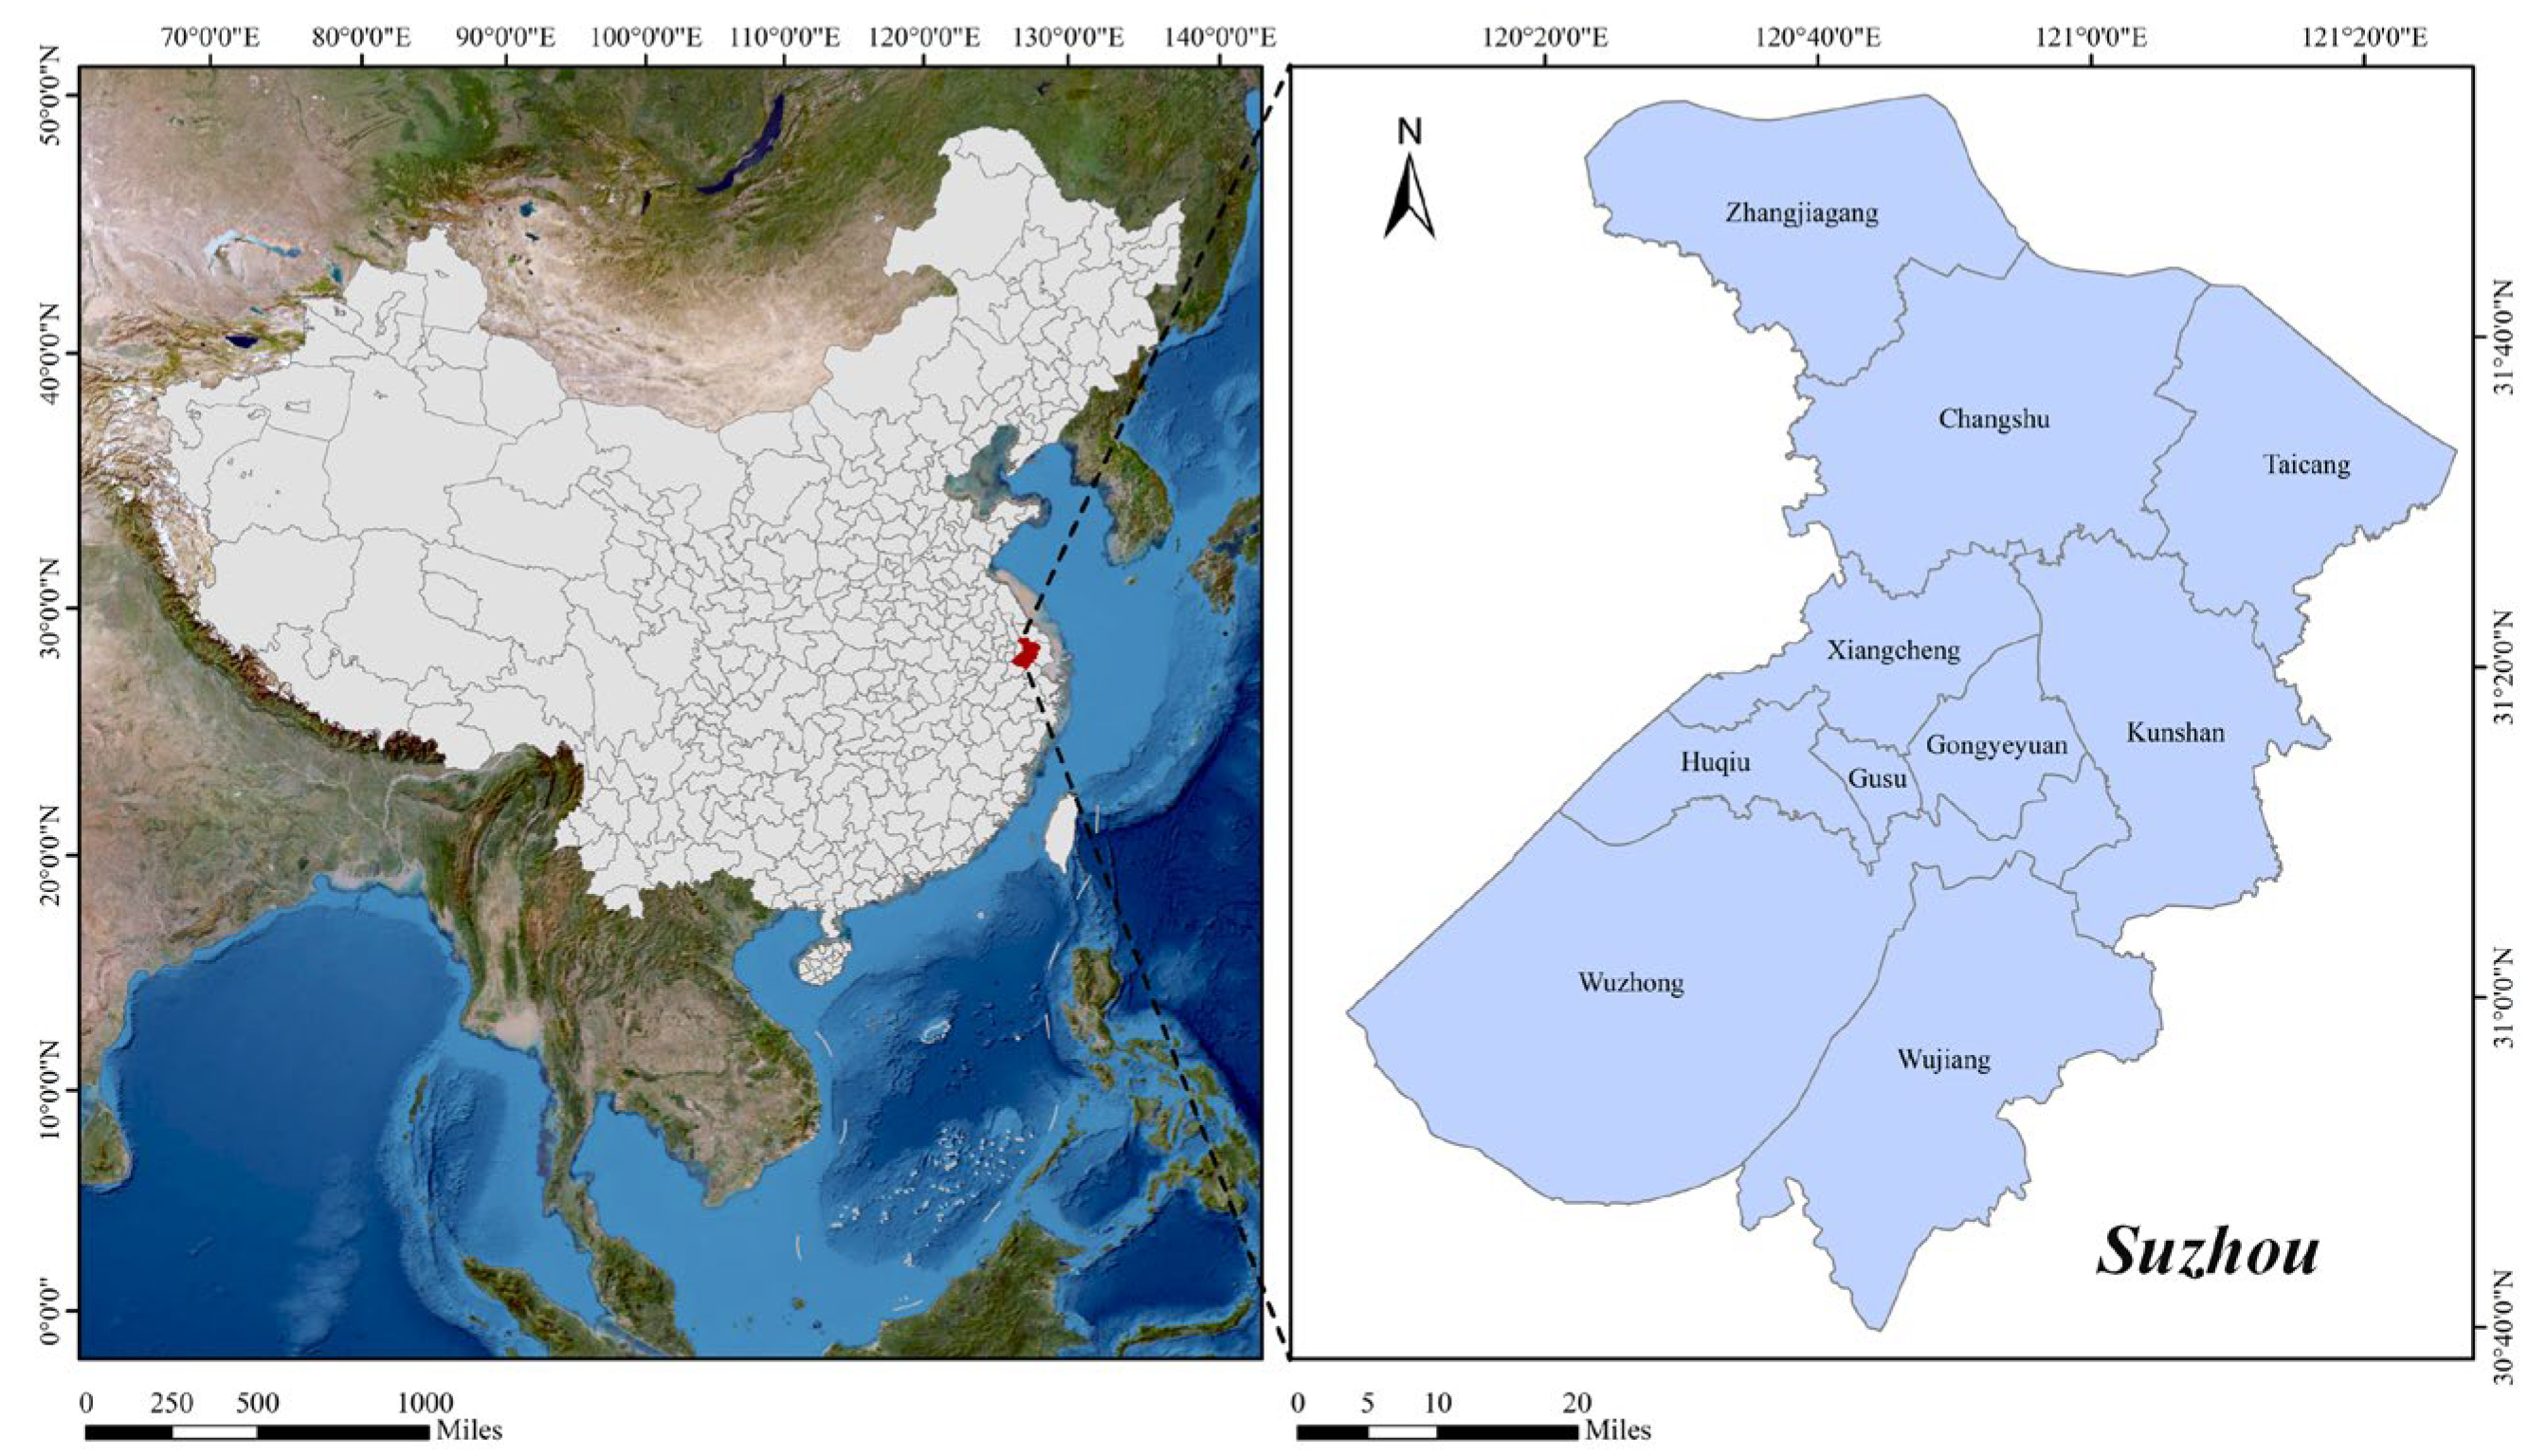
2.1. Overview of the Study Area
2.2. Data Sources
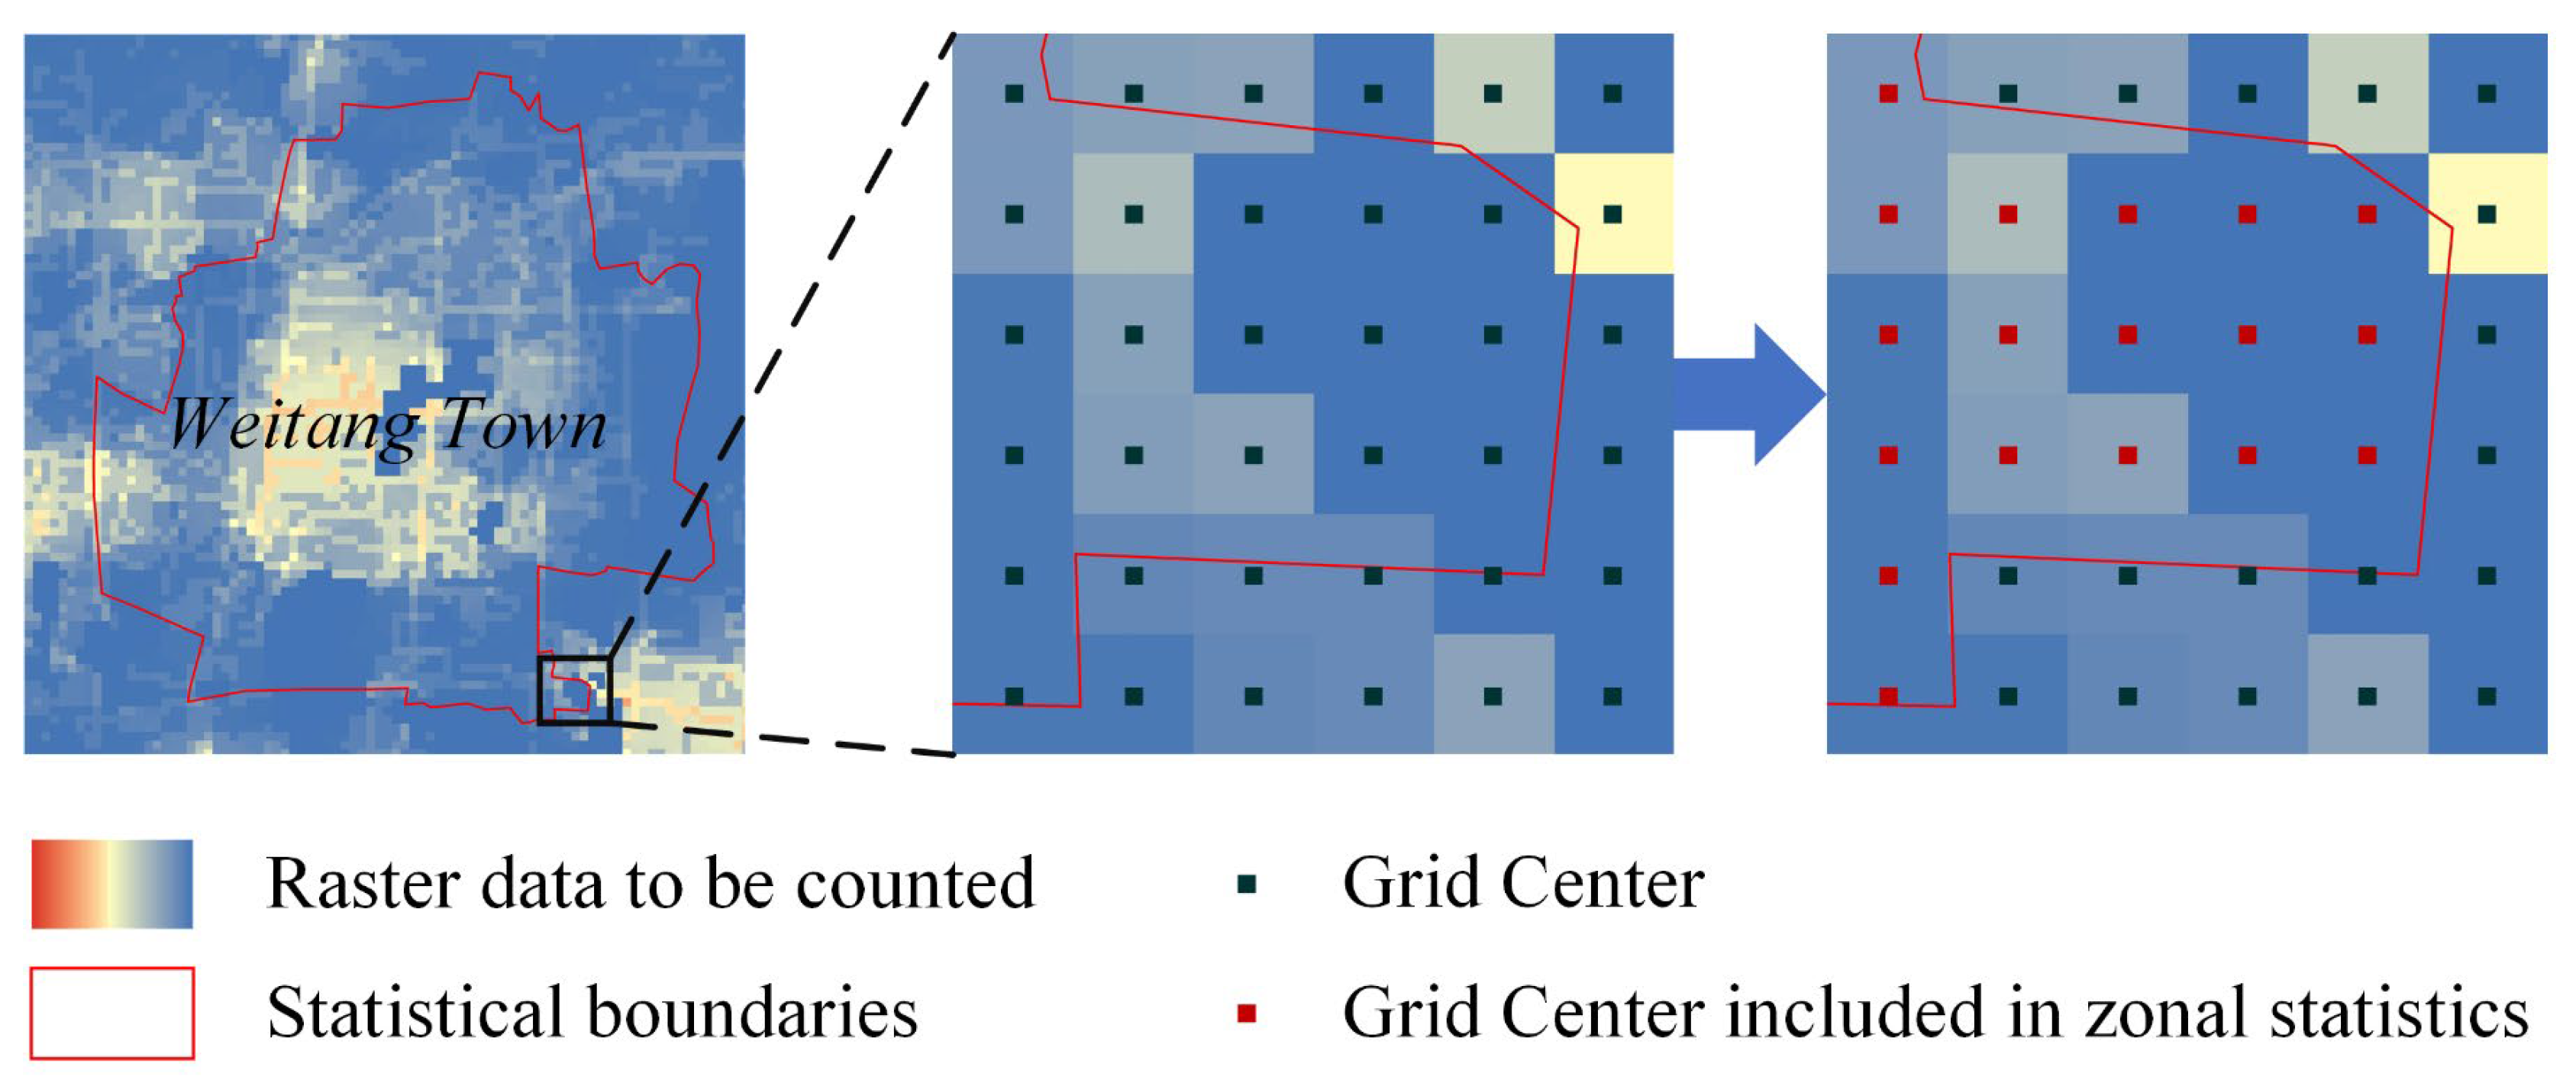
2.3. Data Processing
3. Methodology
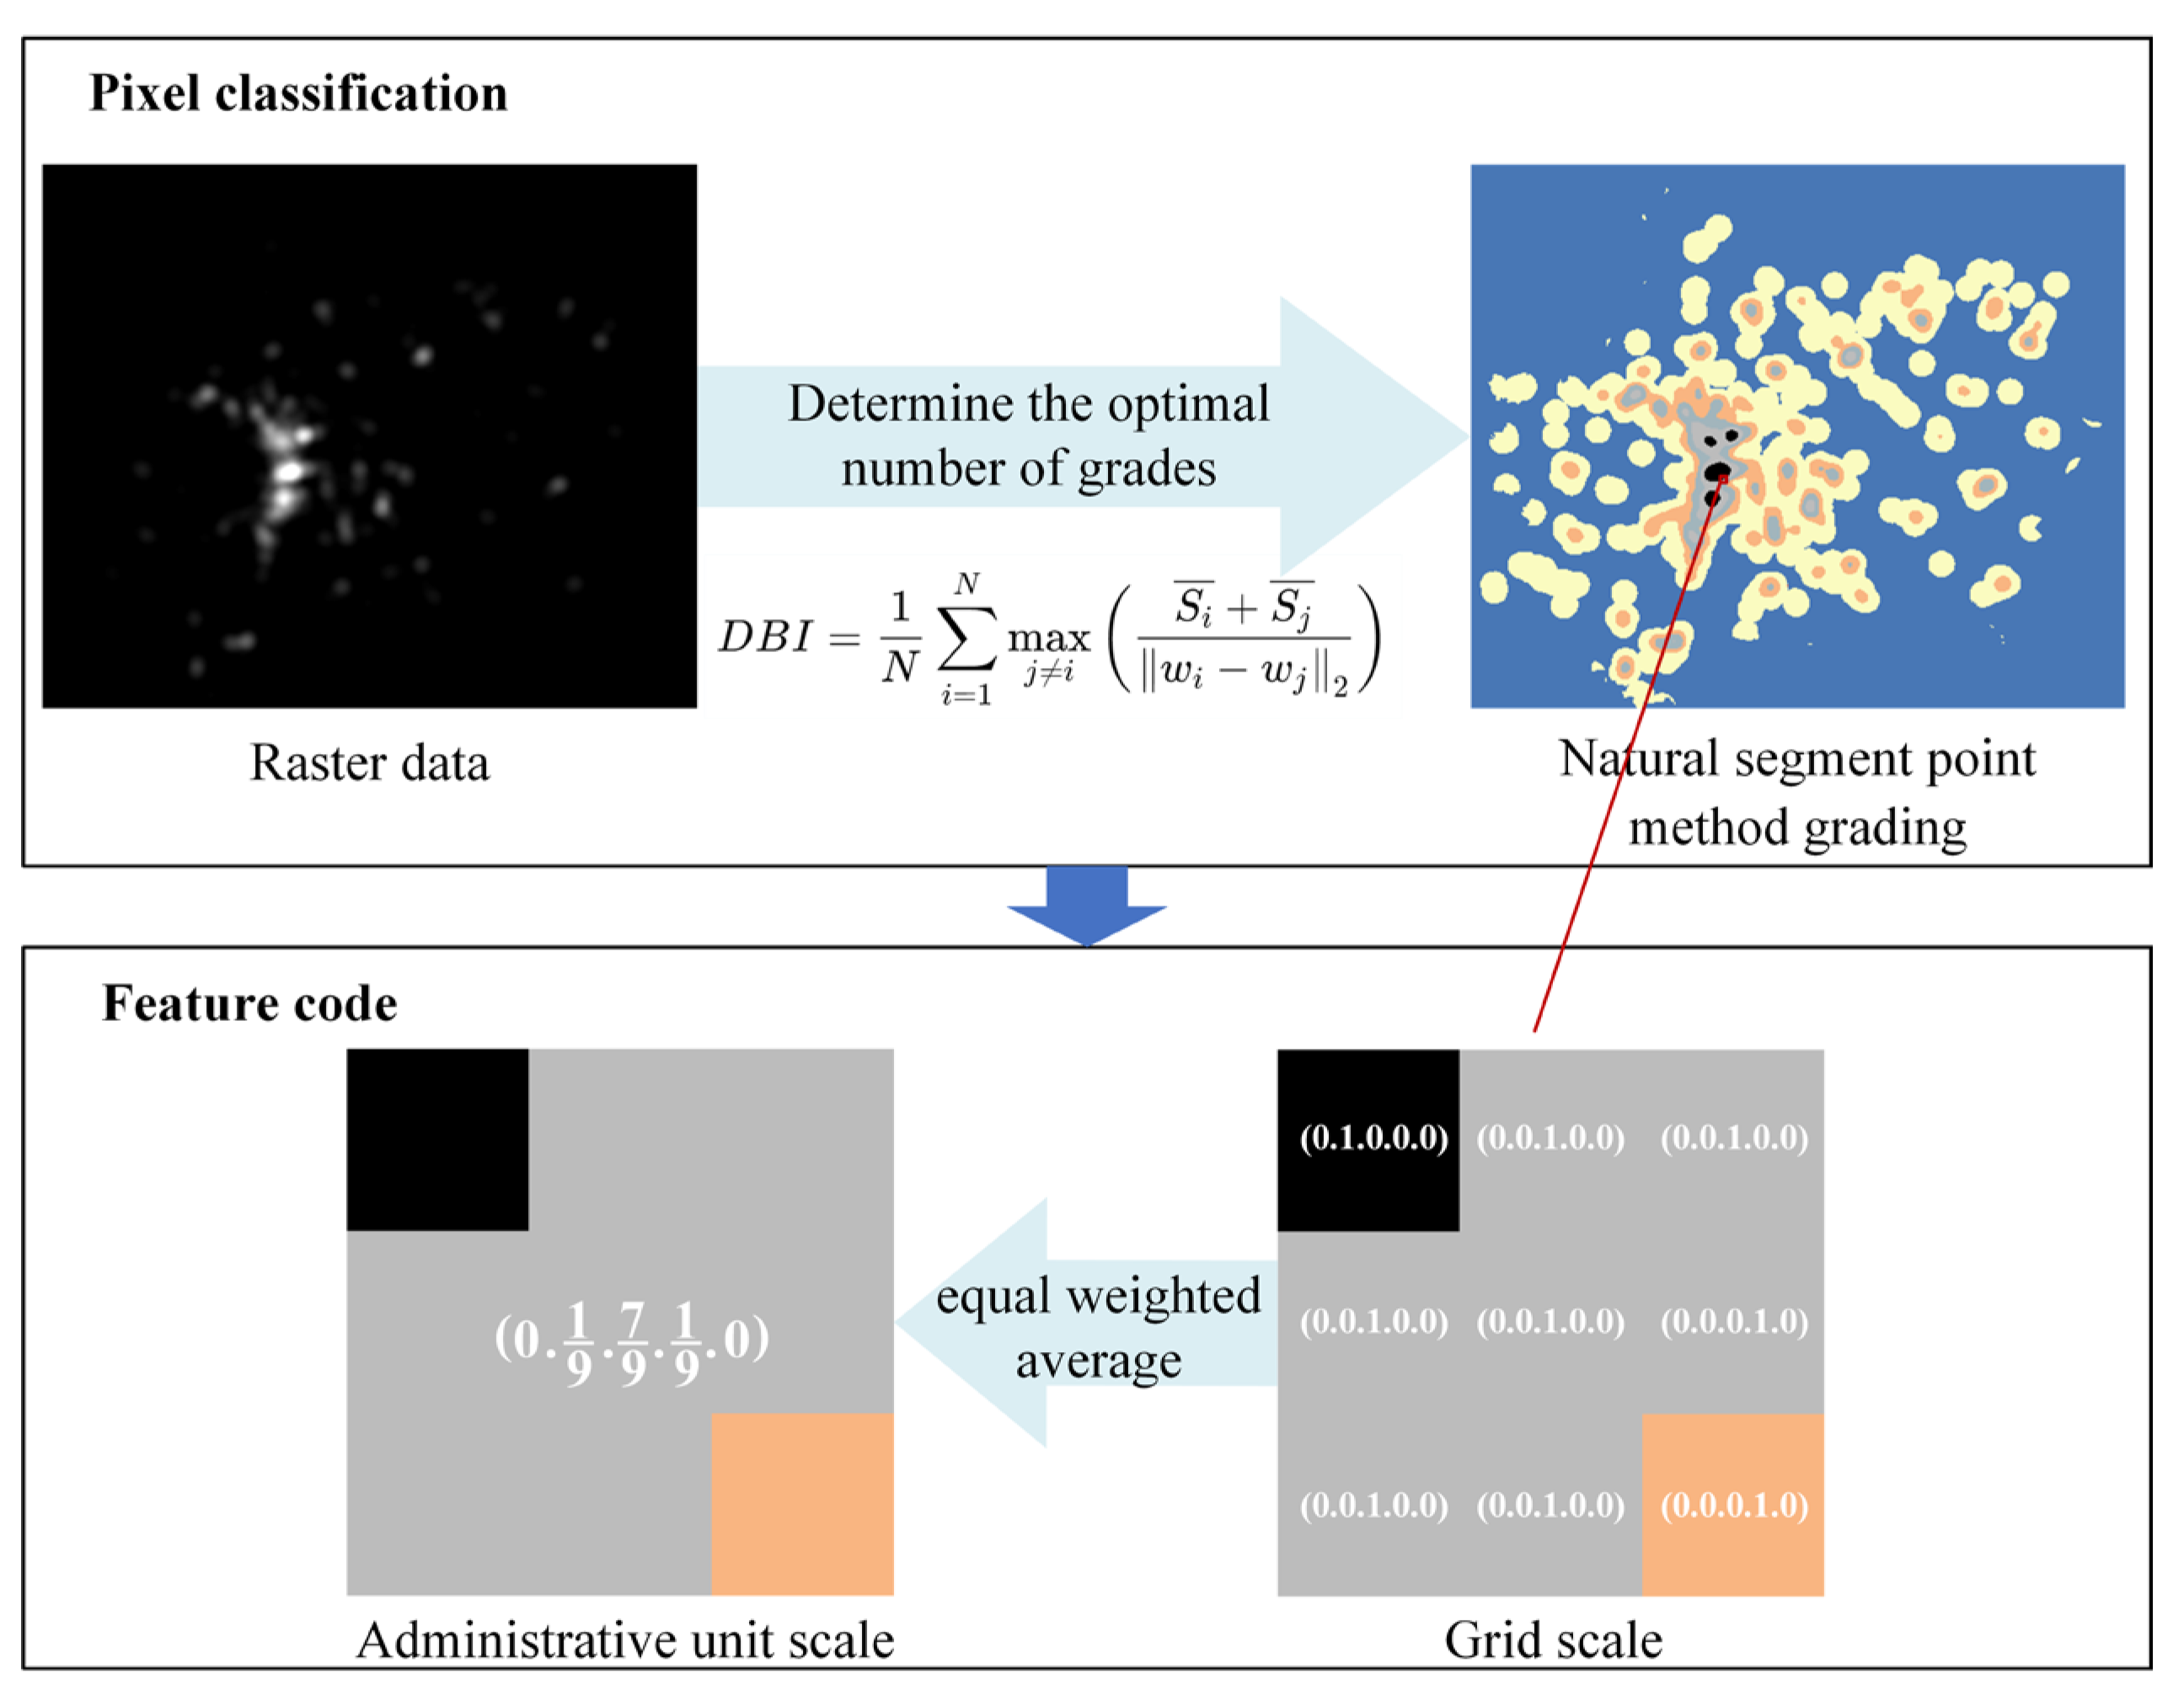
3.1. Hierarchical Feature Coding
3.2. Random Forest
- (1)
- n_estimators: This parameter defines the number of trees in the forest. Increasing the number of trees improves model stability and accuracy, but also increases computation time. A balance must be struck between performance and efficiency.
- (2)
- max_depth: This controls the maximum depth of each tree, preventing excessive growth and overfitting. Deeper trees capture more details but may lead to overfitting, while shallower trees may underfit the data.
- (3)
- max_features: This determines how many features to consider for each split. A lower value reduces feature correlation between trees, improving diversity and reducing overfitting, but may also decrease model accuracy if set too low.
- (4)
- min_samples_split: This sets the minimum number of samples required to split a node. A higher value results in simpler trees by preventing splits in nodes with few samples, thus reducing overfitting, but might also make the model too simplistic.
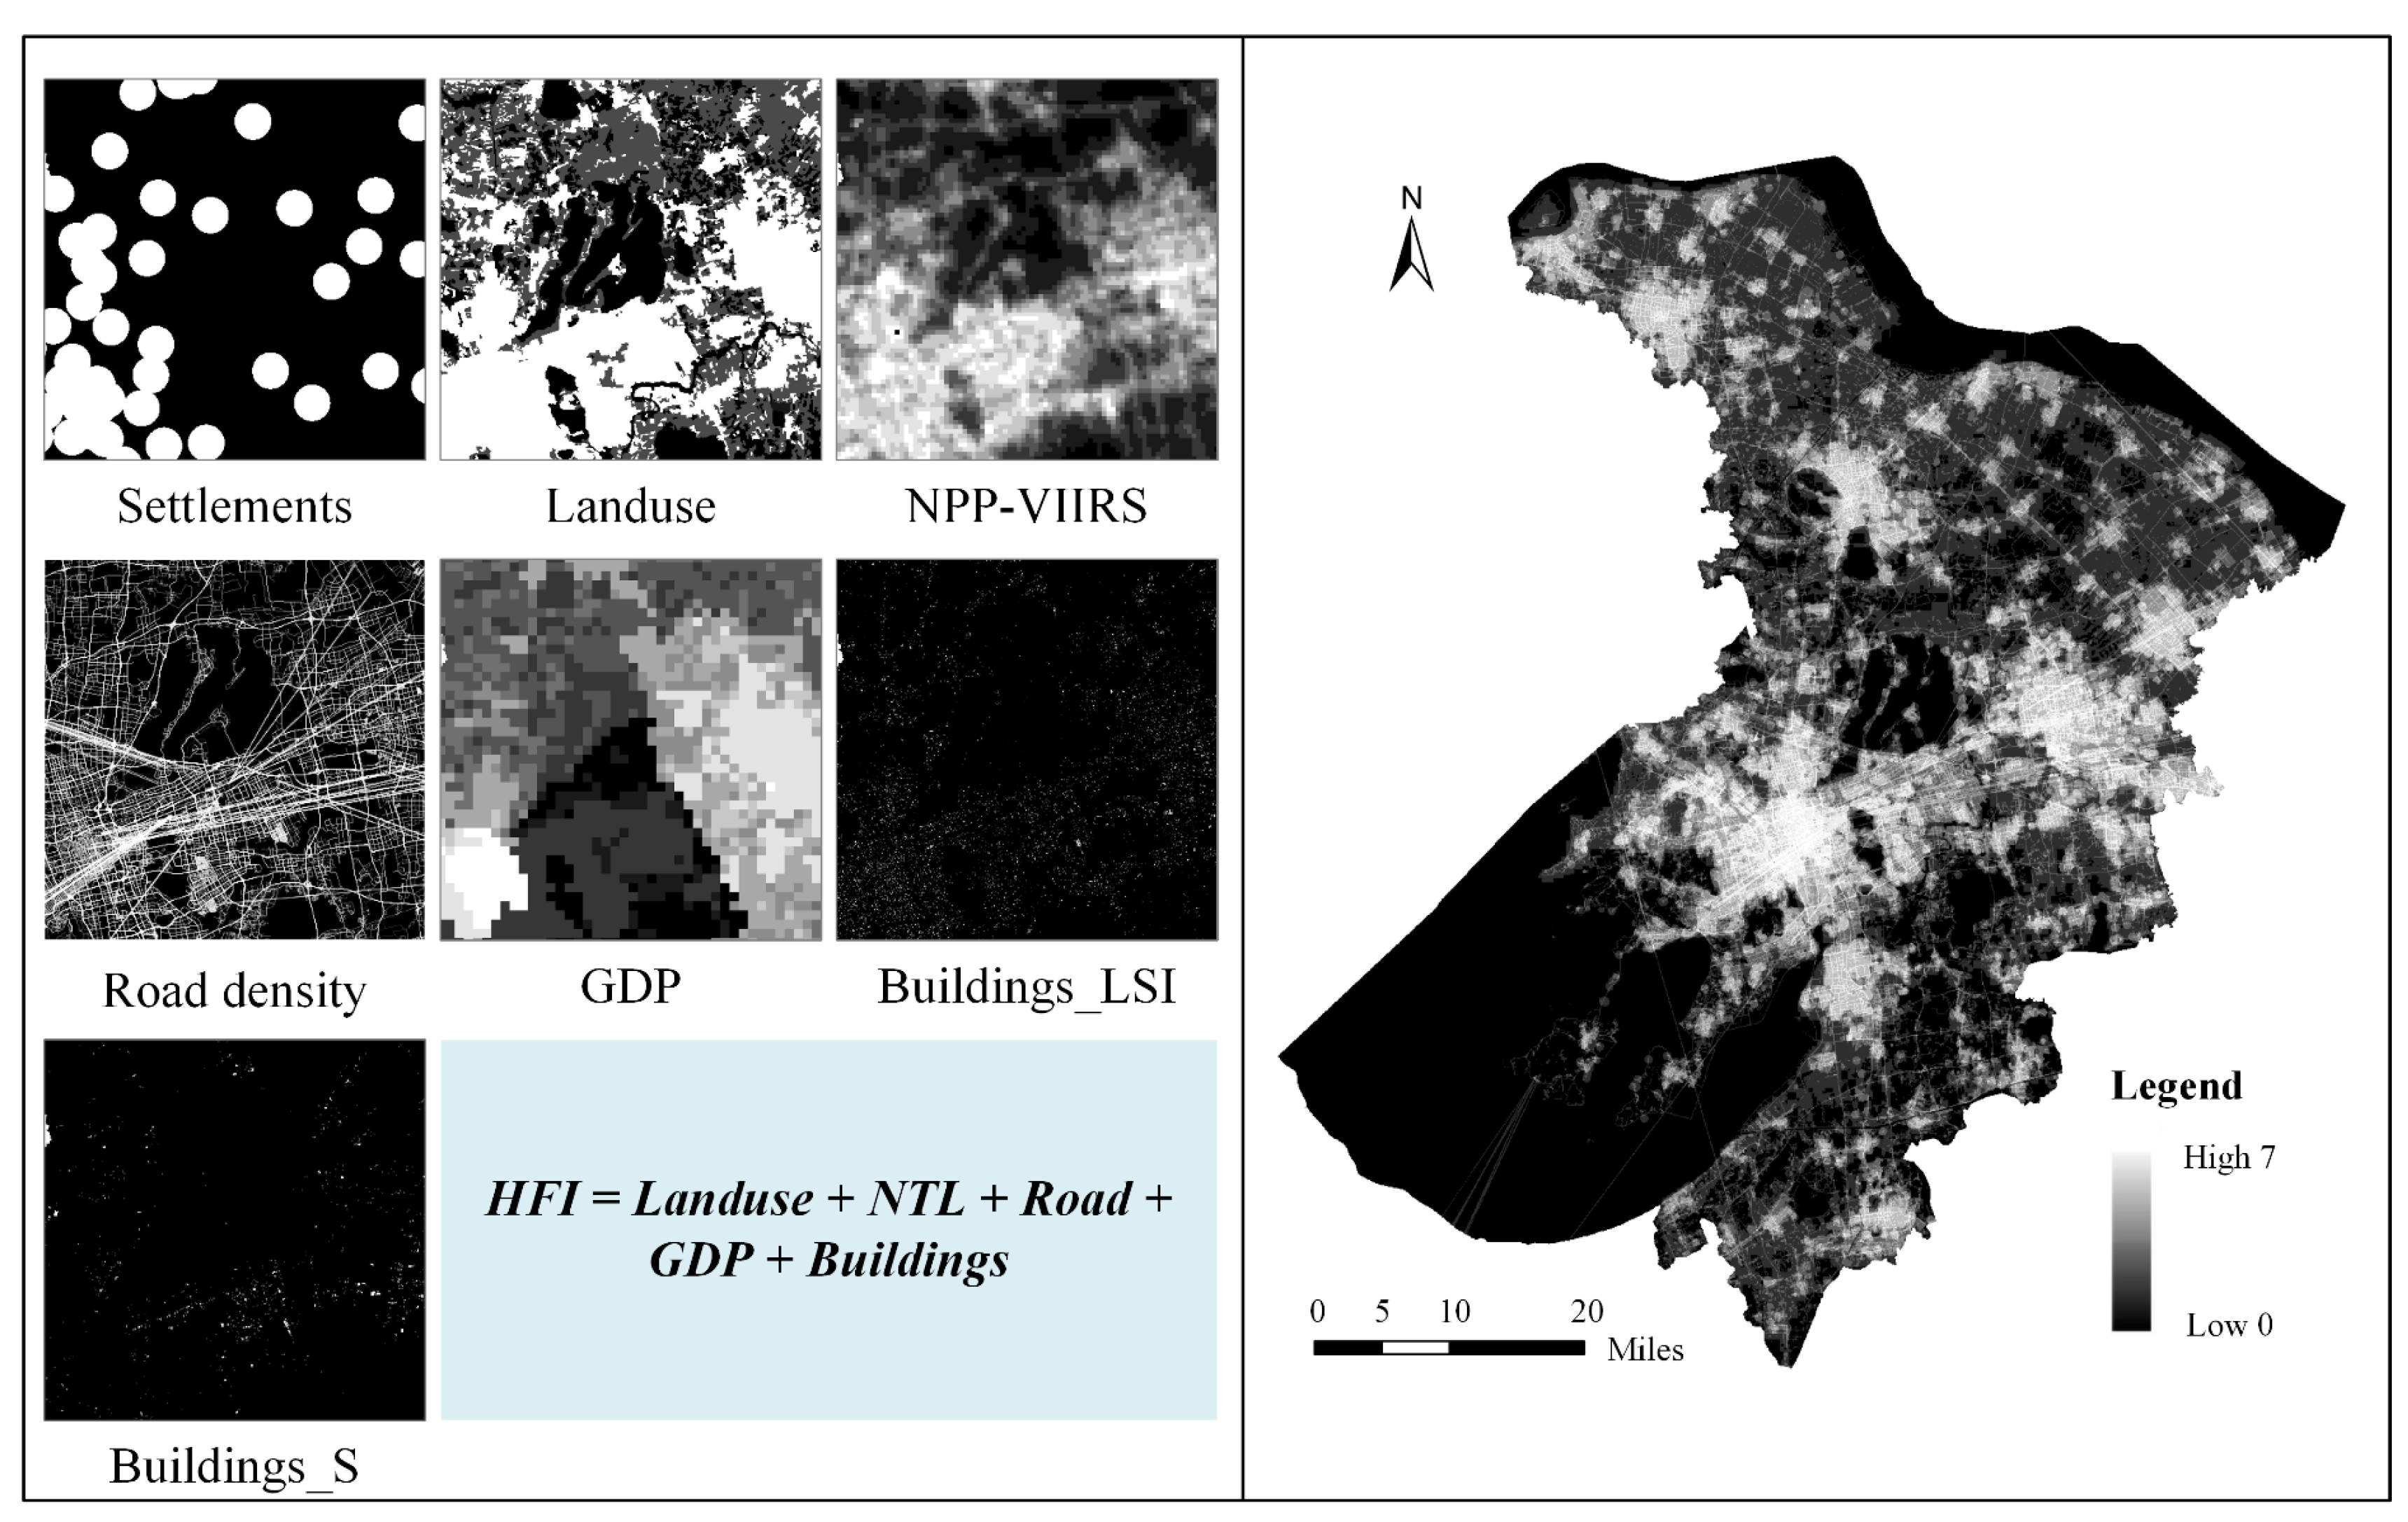
3.3. Human Footprint Index
3.4. Weighting Corrections and Population Distribution
3.4.1. Weight Correction
3.4.2. Population Decomposition
3.5. Validation of Accuracy
4. Experiments and Results
4.1. Random Forest-Based Weight Prediction
4.2. Construction of the Human Footprint Index
- (1)
- Land use
- (2)
- Settlements
- (3)
- Night lights
- (4)
- Roads
- (5)
- GDP
- (6)
- Building area
- (7)
- Building Shape Index
4.3. Spatialisation of Population Data Based on HFI Correction
4.4. Accuracy Validation and Result Analysis
4.4.1. Accuracy Comparison Validation
4.4.2. Validation of Partitioning Accuracy
5. Discussion and Conclusions
5.1. Adaptability of the Model to Different Regions
5.2. Limitations and Future Outlook
5.3. Conclusions
- (1)
- The coefficient of determination (R2) for the HFI-corrected population spatialisation dataset of Suzhou City is 92.8%, reflected an improvement of 11 percentage points over the random forest model alone and 23 percentage points compared to the WorldPop dataset. The Pearson correlation coefficient of 0.96 further confirms its strong alignment with actual population data.
- (2)
- The HFI-corrected optimisation model is particularly effective in medium-density areas, achieving an accuracy of 92.3% and a Pearson correlation of 0.96. This suggests the model effectively captures the complex relationship between human activities and population distribution, particularly in dispersed regions.
- (3)
- The hierarchical feature coding methodology significantly reduces inaccuracies in population spatialisation across different scales, increasing the model’s precision by an additional five percentage points and enhancing its overall applicability and reliability.
Author Contributions
Funding
Data Availability Statement
Acknowledgments
Conflicts of Interest
References
- Dmowska, A.; Stepinski, T.F. A High Resolution Population Grid for the Conterminous United States: The 2010 Edition. Comput. Environ. Urban Syst. 2017, 61, 13–23. [Google Scholar] [CrossRef]
- Zhao, S.; Liu, Y.; Zhang, R.; Fu, B. China’s Population Spatialization Based on Three Machine Learning Models. J. Clean. Prod. 2020, 256, 120644. [Google Scholar] [CrossRef]
- Mei, Y.; Gui, Z.; Wu, J.; Peng, D.; Li, R.; Wu, H.; Wei, Z. Population Spatialization with Pixel-Level Attribute Grading by Considering Scale Mismatch Issue in Regression Modeling. Geo-Spat. Inf. Sci. 2022, 25, 365–382. [Google Scholar] [CrossRef]
- Bao, W.; Gong, A.; Zhao, Y.; Chen, S.; Ba, W.; He, Y. High-Precision Population Spatialization in Metropolises Based on Ensemble Learning: A Case Study of Beijing, China. Remote Sens. 2022, 14, 3654. [Google Scholar] [CrossRef]
- He, M.; Xu, Y.; Li, N. Population Spatialization in Beijing City Based on Machine Learning and Multisource Remote Sensing Data. Remote Sens. 2020, 12, 1910. [Google Scholar] [CrossRef]
- Zhao, M.; Cheng, W.; Zhou, C.; Li, M.; Wang, N.; Liu, Q. GDP Spatialization and Economic Differences in South China Based on NPP-VIIRS Nighttime Light Imagery. Remote Sens. 2017, 9, 673. [Google Scholar] [CrossRef]
- Dong, C.; Zhang, Y.; Kang, F. Renkou Kongjianhua Jishu; China Population Publishing House: Beijing, China, 2024; ISBN 978-7-5101-8908-1. [Google Scholar]
- Leyk, S.; Gaughan, A.E.; Adamo, S.B.; De Sherbinin, A.; Balk, D.; Freire, S.; Rose, A.; Stevens, F.R.; Blankespoor, B.; Frye, C.; et al. The Spatial Allocation of Population: A Review of Large-Scale Gridded Population Data Products and Their Fitness for Use. Earth Syst. Sci. Data 2019, 11, 1385–1409. [Google Scholar] [CrossRef]
- Zhao, Y.; Li, Q.; Zhang, Y.; Du, X. Improving the Accuracy of Fine-Grained Population Mapping Using Population-Sensitive POIs. Remote Sens. 2019, 11, 2502. [Google Scholar] [CrossRef]
- Stevens, F.R.; Gaughan, A.E.; Linard, C.; Tatem, A.J. Disaggregating Census Data for Population Mapping Using Random Forests with Remotely-Sensed and Ancillary Data. PLoS ONE 2015, 10, e0107042. [Google Scholar] [CrossRef]
- Ye, T.; Zhao, N.; Yang, X.; Ouyang, Z.; Liu, X.; Chen, Q.; Hu, K.; Yue, W.; Qi, J.; Li, Z.; et al. Improved Population Mapping for China Using Remotely Sensed and Points-of-Interest Data within a Random Forests Model. Sci. Total Environ. 2019, 658, 936–946. [Google Scholar] [CrossRef]
- Xu, X. China Population Spatial Distribution Kilometer Grid Dataset. Data Registration and Publishing System of Resource and Environmental Science Data Center of Chinese Academy of Sciences. 2017. Available online: http://www.resdc.cn/DOI/DOI.aspx?DOIid=32 (accessed on 2 March 2024).
- Chen, Y.; Xu, C.; Ge, Y.; Zhang, X.; Zhou, Y. A 100 m Gridded Population Dataset of China’s Seventh Census Using Ensemble Learning and Big Geospatial Data. Earth Syst. Sci. Data 2024, 16, 3705–3718. [Google Scholar] [CrossRef]
- Goodchild, M.F.; Lam, N.S. Areal Interpolation: A Variant of the Traditional Spatial Program. Geo-Process. 1980, 1, 297–312. [Google Scholar]
- Tobler, W.R. Smooth Pycnophylactic Interpolation for Geographical Regions. J. Am. Stat. Assoc. 1979, 74, 519–530. [Google Scholar] [CrossRef]
- Guo, W.; Zhang, J.; Zhao, X.; Li, Y.; Liu, J.; Sun, W.; Fan, D. Combining Luojia1-01 Nighttime Light and Points-of-Interest Data for Fine Mapping of Population Spatialization Based on the Zonal Classification Method. IEEE J. Sel. Top. Appl. Earth Obs. Remote Sens. 2023, 16, 1589–1600. [Google Scholar] [CrossRef]
- Zhang, Y.; Wang, H.; Luo, K.; Wu, C.; Li, S. Study on Spatialization and Spatial Pattern of Population Based on Multi-Source Data—A Case Study of the Urban Agglomeration on the North Slope of Tianshan Mountain in Xinjiang, China. Sustainability 2024, 16, 4106. [Google Scholar] [CrossRef]
- Liu, L.; Cheng, G.; Yang, J.; Cheng, Y. Population Spatialization in Zhengzhou City Based on Multi-Source Data and Random Forest Model. Front. Earth Sci. 2023, 11, 1092664. [Google Scholar] [CrossRef]
- Wang, M.; Wang, Y.; Li, B.; Cai, Z.; Kang, M. A Population Spatialization Model at the Building Scale Using Random Forest. Remote Sens. 2022, 14, 1811. [Google Scholar] [CrossRef]
- Wu, J.; Gui, Z.; Shen, li.; Wu, Y.; Liu, H.; Li, R.; Mei, Y.; Peng, D. Population Spatialization by Considering Pixel⁃Level Attribute Grading and Spatial Association. Geomat. Inf. Sci. Wuhan. Univ. 2022, 47, 1364–1375. [Google Scholar] [CrossRef]
- Tan, M.; Liu, K.; Liu, L.; Zhu, Y.; Wang, D.; Min, T.; Kai, L.; Lin, L.; Yuanhui, Z.; Dashan, W. Spatialization of population in the Pearl River Delta in 30m grids using random forest model. Progress. Geogr. 2017, 36, 1304–1312. [Google Scholar] [CrossRef]
- Guo, Y.; Li, X. Spatiotemporal changes of urban construction land structure and driving mechanism in the Yellow River Basin based on random forest model. Prog. Geogr. 2023, 42, 12–26. [Google Scholar] [CrossRef]
- Qiu, G.; Bao, Y.; Yang, X.; Wang, C.; Ye, T.; Stein, A.; Jia, P. Local Population Mapping Using a Random Forest Model Based on Remote and Social Sensing Data: A Case Study in Zhengzhou, China. Remote Sens. 2020, 12, 1618. [Google Scholar] [CrossRef]
- Sanderson, E.W.; Jaiteh, M.; Levy, M.A.; Redford, K.H.; Wannebo, A.V.; Woolmer, G. The Human Footprint and the Last of the Wild. BioScience 2002, 52, 891. [Google Scholar] [CrossRef]
- Hua, T.; Zhao, W.; Cherubini, F.; Hu, X.; Pereira, P. Continuous Growth of Human Footprint Risks Compromising the Benefits of Protected Areas on the Qinghai-Tibet Plateau. Glob. Ecol. Conserv. 2022, 34, e02053. [Google Scholar] [CrossRef]
- Tapia-Armijos, M.F.; Homeier, J.; Draper Munt, D. Spatio-Temporal Analysis of the Human Footprint in South Ecuador: Influence of Human Pressure on Ecosystems and Effectiveness of Protected Areas. Appl. Geogr. 2017, 78, 22–32. [Google Scholar] [CrossRef]
- Woolmer, G.; Trombulak, S.C.; Ray, J.C.; Doran, P.J.; Anderson, M.G.; Baldwin, R.F.; Morgan, A.; Sanderson, E.W. Rescaling the Human Footprint: A Tool for Conservation Planning at an Ecoregional Scale. Landsc. Urban. Plan. 2008, 87, 42–53. [Google Scholar] [CrossRef]
- González-Abraham, C.; Ezcurra, E.; Garcillán, P.P.; Ortega-Rubio, A.; Kolb, M.; Bezaury Creel, J.E. The Human Footprint in Mexico: Physical Geography and Historical Legacies. PLoS ONE 2015, 10, e0121203. [Google Scholar] [CrossRef]
- Dong, C.; Qi, S.; Dai, Z.; Qiu, X.; Luo, T. Research on Accurate and Effective Identification of Ecosystem Surface Based on Human Footprint Index. Ecol. Indic. 2024, 162, 112013. [Google Scholar] [CrossRef]
- Dong, N.; Yang, X.; Cai, H.; Huang, D. Suitability Evaluation of Gridded Population Distribution: Acase Study in Rural Area of Xuanzhou District, China. Acta Geogr. Sin. 2017, 72, 2310–2324. [Google Scholar] [CrossRef]
- Luo, Y.; Dong, C.; Zhang, Y. Study on the Method of Evaluating the Suitable Grid for Population Spatialisation. J. Geo-Inf. Sci. 2023, 25, 896–908. [Google Scholar] [CrossRef]
- Duan, Q.; Luo, L. Summary and Prospect of Spatialization Method of Human Activity Intensity: Taking the Qinghai-Tibet Plateau as an Ex- Ample. J. Glaciol. Geocryol. 2021, 43, 1582–1593. [Google Scholar] [CrossRef]
- Chen, M.; Xian, Y.; Huang, Y.; Zhang, X.; Hu, M.; Guo, S.; Chen, L.; Liang, L. Fine-Scale Population Spatialization Data of China in 2018 Based on Real Location-Based Big Data. Sci. Data 2022, 9, 624. [Google Scholar] [CrossRef] [PubMed]
- Wu, X.; Wang, H.; Zhao, A.; Xie, Y. Spatialization Research on Shanghai′s Population Based on Multi-Source Data and XGBoost Model. Geomat. Spat. Inf. Technol. 2024, 47, 33–36. [Google Scholar]
- Duan, Q.; Luo, L. A Dataset of Human Footprint over the Qinghai-Tibet Plateau during 1990–2015. China Sci. Data 2020, 5, 303–312. [Google Scholar] [CrossRef]
- Luo, L.; Duan, Q.; Wang, L.; Zhao, W.; Zhuang, Y. Increased Human Pressures on the Alpine Ecosystem along the Qinghai-Tibet Railway. Reg. Environ. Chang. 2020, 20, 33. [Google Scholar] [CrossRef]
- Qu, Z.; Zhao, Y.; Luo, M.; Han, L.; Yang, S.; Zhang, L. The Effect of the Human Footprint and Climate Change on Landscape Ecological Risks: A Case Study of the Loess Plateau, China. Land 2022, 11, 217. [Google Scholar] [CrossRef]
- Ayram, C.A.C.; Etter, A.; Díaz-Timoté, J.; Buriticá, S.R.; Ramírez, W.; Corzo, G. Spatiotemporal evaluation of the human footprint in Colombia: Four decades of anthropic impact in highly biodiverse ecosystems. Ecol. Indic. 2020, 117, 106630. [Google Scholar] [CrossRef]


| Data | Data Type | Resolution | Data Source |
|---|---|---|---|
| Population Data | Tables | / | District/County Level: The Seventh National Census Bulletin of Suzhou Street Level: China Population Census Data by Township, Town, and Street 2020 |
| Administrative Boundary | Vector (Side) | / | Jiangsu Provincial Department of Natural Resources |
| POI | Vector (Point) | / | Goldmap |
| Land use | Raster | 30 m | China Multi-period Land Use/Cover Remote Sensing Monitoring Data (CNLUCC) |
| Night Lights | Raster | 500 m | Resources and Environment Data Centre |
| Roads | Vectors (lines) | / | OSM datasets |
| Settlements | Vector (Side) | / | Resources and Environment Data Centre |
| Building Footprint Data | Vector (Side) | / | 3D-GloBFP |
| GDP | Raster | 1 km | Resources and Environment Data Centre |
| Category | POI Type | Reason for Selection |
|---|---|---|
| Daily Life | Dining | Reflects basic living needs and daily activities, effectively representing population aggregation and activity frequency. |
| Shopping | ||
| Accommodation Services | ||
| Life Services | ||
| Business | Business and Residential Areas | Primary venues for economic activity in densely populated areas, influencing population distribution and movement. |
| Financial and Insurance | ||
| Transportation and Public Facilities | Transportation Facilities | Provides regional accessibility and convenience, directly affecting population spatial distribution and activity patterns. |
| Public Facilities | ||
| Education and Culture | Science, Education, and Cultural Facilities | Concentrated in population-dense areas, reflecting the distribution of social and cultural activities. |
| Health and Medical Care | Medical Care | Core to residents’ daily health needs, often located in densely populated areas, directly impacting population spatialisation. |
| Recreation and Tourism | Sports and Leisure | Attracts large numbers of residents and tourists, reflecting spatial distribution in leisure and tourism activities. |
| Scenic Spots | ||
| Government and Social Organisations | Government Agencies and Social Organisations | Centres of regional social and administrative activities, directly influencing social structure and population density. |
| Road Type | OSM Classification | Weight |
|---|---|---|
| Elevated and Express Roads | motorway, motorway_link, trunk, trunk_link | 1.0 |
| Main Roads | primary, primary_link, secondary, secondary_link | 0.8 |
| Secondary Roads | tertiary, tertiary_link | 0.6 |
| Branch Roads | residential, unclassified | 0.4 |
| Internal Roads and Others | footway, pedestrian, cycleway, steps, bridleway, path, track, living_street, service | 0.2 |
| HFIPop | RFPop | NoHFEPop | WorldPop | |
|---|---|---|---|---|
| MAE | 17,587.54220 | 29,121.32409 | 22,989.21765 | 38,288.72771 |
| RMSE | 27,446.31164 | 42,138.12982 | 36,129.38270 | 56,855.34566 |
| R2 | 0.92839 | 0.81681 | 0.87829 | 0.692692533 |
| MAPE | 16.75170 | 25.32145% | 21.46892% | 29.20127102% |
| Pearson | 0.96364 | 0.90820 | 0.936877 | 0.93634 |
Disclaimer/Publisher’s Note: The statements, opinions and data contained in all publications are solely those of the individual author(s) and contributor(s) and not of MDPI and/or the editor(s). MDPI and/or the editor(s) disclaim responsibility for any injury to people or property resulting from any ideas, methods, instructions or products referred to in the content. |
© 2024 by the authors. Published by MDPI on behalf of the International Society for Photogrammetry and Remote Sensing. Licensee MDPI, Basel, Switzerland. This article is an open access article distributed under the terms and conditions of the Creative Commons Attribution (CC BY) license (https://creativecommons.org/licenses/by/4.0/).
Share and Cite
Ren, D.; Qiu, X.; Dong, C.; Dai, Z.; Qi, S. Optimisation Model for Spatialisation of Population Based on Human Footprint Index Correction. ISPRS Int. J. Geo-Inf. 2024, 13, 429. https://doi.org/10.3390/ijgi13120429
Ren D, Qiu X, Dong C, Dai Z, Qi S. Optimisation Model for Spatialisation of Population Based on Human Footprint Index Correction. ISPRS International Journal of Geo-Information. 2024; 13(12):429. https://doi.org/10.3390/ijgi13120429
Chicago/Turabian StyleRen, Dongfeng, Xin Qiu, Chun Dong, Zhaoxin Dai, and Song Qi. 2024. "Optimisation Model for Spatialisation of Population Based on Human Footprint Index Correction" ISPRS International Journal of Geo-Information 13, no. 12: 429. https://doi.org/10.3390/ijgi13120429
APA StyleRen, D., Qiu, X., Dong, C., Dai, Z., & Qi, S. (2024). Optimisation Model for Spatialisation of Population Based on Human Footprint Index Correction. ISPRS International Journal of Geo-Information, 13(12), 429. https://doi.org/10.3390/ijgi13120429


