Abstract
This paper examines spatiotemporal patterns and socioeconomic influences on host participation in Airbnb’s short-term rental (STR) marketplace in San Francisco during the years 2019–2022, a four-year period that spans the COVID-19 pandemic. This provides the motivation for the study to examine how San Francisco’s demographic and socioeconomic fluctuations influenced Airbnb hosts to rent their properties on the platform. To do so, Airbnb property densities, indicators of host participation, are estimated at the census tract level and subsequently mapped in a GIS along with points of interest (POIs) located all over the city. Mapping unveils spatiotemporal patterns and changes in Airbnb property densities, which are also analyzed for spatial autocorrelation using Moran’s I. Clusters and outliers of property densities are identified using K-means clustering and geostatistical methods such as local indicators of spatial association (LISA) analysis. Locationally, San Francisco’s Airbnb hotspots are not located in the city’s core, unlike other major Airbnb markets in metropolitan areas. Instead, such hotspots are in the city’s northeastern neighborhoods around ethnic enclaves, in close proximity to POIs that are frequented by visitors, and have a higher proportion of hotel and lodging employment and lower median household income. A conceptual model posits associations of Airbnb property densities with sixteen demographic, socioeconomic factors, indicators of trust, social capital, and sustainability, along with proximity to points of interest. Ordinary least squares (OLS) regressions reveal that occupation in professional, scientific, and technical services, hotel and lodging employment, proximity to POIs, and proportion of Asian population are the dominant factors influencing host participation in San Francisco’s shared accommodation economy. The occupational influences are novel findings for San Francisco. These influences vary somewhat for two main types of properties—entire home/apartment and private rooms. Implications of these findings are discussed in relation to supply side motivations of Airbnb hosts to participate in San Francisco’s STR marketplace.
1. Introduction
Prior to the COVID-19 pandemic, in November 2019, an estimated 72.4 million American internet users aged 15 and over requested services provided by other people using the internet. This included hailing a ride using Uber or Lyft, reserving a room through Airbnb, or requesting a home repair through Angie’s List. During the pandemic, in November 2021, the number increased to 94 million [1]. Apart from these services, it became increasingly commonplace during the pandemic to order online grocery and food delivery using apps such as Instacart and DoorDash in urban, metropolitan areas of the United States. On the demand side, use of such gig economy platforms by consumers varied by race/ethnicity, age, educational attainment, income, and the location (urban, suburban, or rural) of those requesting such services [2]. On the supply side, surveys conducted in the one-year period August 2020–2021 have shown that a third of gig economy workers reported that their financial situation changed for the better during the pandemic, but a majority (41%) reported that their financial situation remained the same, compared with before the pandemic [3].
In this context, our study focuses on Airbnb, a popular shared accommodation platform, often used for short-term rentals. Airbnb has rapidly proliferated in many large, urban cities worldwide that are tourist hotspots. In such cities, Airbnb has provided avenues to homeowners to supplement their incomes by renting their homes or rooms to guests. In some cases, hosts are motivated by their positive attitudes towards sustainability and their belief that sharing is better for the environment. As Airbnb hosts continue to offer their homes to guests, neighborhoods in major cities have been transformed, often depleting housing stock, exacerbating affordability and gentrification issues. This has necessitated additional research on understanding the motivations of Airbnb hosts for participating in short-term rental markets (STRs) as part of the broader research on why individuals—both supply and demand-side actors participate in the sharing economy. It has been argued that such motivations can be explained in terms of demographic and socioeconomic attributes, attitudes towards trust and collaborative consumption, as well as the educational and professional backgrounds of actors [3].
Specifically, the objective of this study is to analyze spatiotemporal patterns of host participation in San Francisco’s STR markets, as measured by Airbnb property densities. In doing so, this study focuses on the supply side of Airbnb in San Francisco, the platform’s birthplace. As a locus of technology and innovation, the San Francisco Bay Area and the city itself have been hubs of conventions, conferences, and tourism. It has been documented that by hosting guests, many casual hosts can afford the city’s high cost of living and are able to pay for various expenses. Yet, rents have disproportionately increased in some of the city’s neighborhoods which have seen increasing participation in STR platforms. In some neighborhoods, tenant evictions have caused concern if a landlord concluded that they can earn more from short-term rentals than from a long-term tenant, thus violating local zoning and other ordinances and negatively affecting the quality of life in residential areas [4]. It thus becomes imperative to examine what are the factors that influence Airbnb hosts to participate in the city’s STR markets. On a related note, due to restrictions in human mobility due to the COVID-19 pandemic, the tourism and leisure industries have been adversely affected. Metropolitan destinations have experienced between 7.5–12.4% additional decreases in tourism visits compared to secondary cities and resorts [5]. Additionally, within large U.S. metro areas, household, business, and real estate demand shifted during the pandemic from central business districts (CBDs) to lower density suburbs and exurbs, creating a hollowing out donut effect [6]. This can potentially affect STR markets, and it is therefore quite timely to study Airbnb’s spatiotemporal patterns for San Francisco and motivations of its supply side participants, the hosts.
The research questions are
- (1)
- What are the spatial patterns and variations of host participation in San Francisco’s census tracts, as measured by Airbnb property densities during the period 2019–2022?
- (2)
- What are the spatial clusters and outliers of Airbnb property densities in San Francisco and what are their demographic, socioeconomic, and occupational attributes?
- (3)
- What are the influences of demographic, socioeconomic, occupational, and social capital factors, proximity to points of interests, and attitudes towards trust and sustainability on host participation in Airbnb’s STR markets in San Francisco?
These research questions are analyzed at the census tract level for the city. This choice is motivated by the fact that San Francisco’s neighborhoods are diverse in terms of their race/ethnic compositions, proximity to points of interest of cultural and economic significance, as well as their available supply of rental units. To account for this heterogeneity, we study Airbnb property density at the census tract level. Also, by virtue of being a standard census geography, robust demographic and socioeconomic data are available for census tracts in the U.S.
The remainder of this paper Is organized into sections on the literature review of geographic analysis of STR markets and key determinants of host participation in Airbnb, followed by the study’s conceptual model, methodology and data, findings and their implications, culminating in conclusions and directions for future research.
2. Literature Review
Research interest in the sharing economy, its platforms and mechanisms, digital and socioeconomic foundations has been steadily increasing among scholars in various fields. One key strand of research focuses on motivations of supply and demand-side actors to participate in the sharing economy and engage in collaborative consumption. Two studies [3,7] delve into the rise of crowd-based, peer-to-peer sharing economy phenomena and platforms and have reasoned that economic motivations, compulsions associated with living in big cities, attitude towards sustainable consumption, and the digitization of trust are some of the key socioeconomic factors that influence participation in the sharing economy.
Prior studies have applied theories such as self-determination theory [8], theory of reasoned action [9], disruptive innovation theory [10], and extended valence framework [11] to understand why people participate in the sharing economy. These studies have often found that participation in the sharing economy is motivated by many factors such as its sustainability, enjoyment of the activity, and economic gains [8]. Möhlmann [12] studied both ridesharing and STR platform consumers and found that their satisfaction and likelihood of using a sharing economy platform again is predominantly motivated by their perception of self-benefit and self-interest. This utilitarian outlook shows that sharing economy users may not necessarily have altruistic motivation. Lee et al. [11] reiterated and expanded this finding for ridesharing by determining along with perceived benefits, perceived risks, and trust in the platform were important determinants of users’ intention to participate in Uber’s ridesharing platform. For shared accommodation, previous studies have found that price and location were the two primary drivers of use for Airbnb guests [13]. Guttentag [10] found that Airbnb guests are motivated by cost savings, household amenities, and potential for a more authentic experience. On the supply side, prior studies have shown that financial incentives, the opportunity to interact with guests from diverse backgrounds, and the potential to acquire social capital related to global knowledge brought by guests as well as social connections motivated Airbnb hosts to participate in STR market platforms [14,15]. Viewed together, the main motivations for sharing economy participation vary depending on whether the actor is a supply or demand side participant. For shared accommodation platforms, motivations range from economic (cost savings or supplemental income) to more altruistic (reduce waste and be more sustainable) and communal (enjoyment by interacting with “others” and potentially increasing one own’s social capital).
The motivation of hosts to participate in the sharing economy has been examined in a variety of studies [16,17,18,19,20]. The motivating factors influencing host participation include economic benefit [16,20]; environmental [16,17,20]; helping others [17,18], reciprocity [18] and social good [16,19]. Two of these studies focus on accommodation sharing. Using structural equation modeling and data from CouchSurfing, a worldwide accommodation-sharing enterprise, a model was built that considered host’s helping attitude, degree of enterprise centrality, shared narratives, host’s tenure, desire to make friends, and reciprocity, as well as trust, in the intention for providers to share accommodations. The study confirmed the most important factors to be attitude of helping others, shared narratives, seeking to make friends and reciprocity [18]. A study of 606 Airbnb hosts found that social value orientation, social utility, service quality, monetary reward, and privacy policy effectiveness led to building hosts’ trust towards Airbnb, resulting in intention to continue being hosts [19].
Another key strand of research, particularly relevant to our study, is the spatial patterns of the sharing economy. In this area, several studies have analyzed geographic distributions of Airbnb properties in a number of major world cities such as New York City [21,22,23], Los Angeles [24,25], and San Francisco [26] in the United States; Syndey, Australia [27]; Madrid, Spain [28]; and Nanjing, China [29]. In some of these studies, the authors have examined spatial patterns of Airbnb properties to understand the motivations of hosts or the supply side actors. For New York city, prior studies have found that Airbnb property densities were highest in Manhattan and northern Brooklyn over the period 2015–2017 and there were no significant longitudinal variations in property densities [23]. Studies have also documented that in New York city, Airbnb locations are concentrated in parts of the city that have a young population, have a significant number of housing units, and high number of points of interest [22] and Airbnb property densities are associated with gender ratio, black race/ethnicity, median household income, and professional, scientific, and technical occupation, and attitudes toward sustainability [21,23]. Differences have also been observed between short- and long-term rental locations, depending on the distances of locations from the city center [21].
For Los Angeles, a recent study has found that Airbnb supply in Los Angeles has statistically significant spatial autocorrelation in the period 2014 to 2019 and a clear center-periphery pattern [25]. The high–high clusters were found to be predominant in the city center while low–low clusters were predominant in the city periphery. In addition, regression analysis revealed that key determinants of Airbnb supply in Los Angeles are resident population, housing units, income, rent, points of interest, and the distance to Hollywood, one of the city’s major entertainment hubs. For San Francisco, Airbnb property location data were analyzed to determine that in certain locations of the city and the Bay Area overall, reliable cancellation behavior of the host, host responsiveness, and sufficient demand for Airbnb rentals were key factors impacting an Airbnb host achieving superhost status in the city [26]. In Spain, spatial patterns of Airbnb supply were analyzed to determine that that the location of Airbnb rentals is determined by the numbers of homes and flats, including second homes and vacation homes. This was especially significant in coastal areas that have large stocks of such homes and are popular tourism destinations [28]. Among other interesting findings, this study also documented that there was strong correlation between Airbnb supply and hotel accommodation supply, which has implications for our study. Somewhat similar to these studies, a study of Airbnb supply in Nanjing China has found that the spatial distribution of Airbnb listings is correlated with the distribution of cultural attractions, universities, public transport accessibility, shopping centers, and business apartments. The findings from these studies have implications for regulating STR markets in light of concerns such as gentrification and depletion of housing stock causing crisis such as lack of affordable housing.
In the international realm, recent research studies in Spain have advanced methodologically the field of geospatial analysis of the sharing economy, although in ways different from the present approach [30,31,32,33]. A case study of the three cities of Madrid, Barcelona, and Palma de Mallorca analyzed the urban transformation from properties in these cities leading to mass tourism in the last several decades. Current spatial indicators and spatial autocorrelation analysis indicated present and future spatial patterns of Airbnb properties in these cities [32]. Another study examines factors related to Airbnb rentals relative to socioeconomic and tourism variables [33]. The ratio of Airbnb rental properties to number of households was influenced by income, education, and dwelling size, but the relationships were uneven. Study results differed by part of the city, and for different scales of analysis, ranging from census tracts to neighborhoods.
In summary, there is a noticeable growth in scholarly interest in analyzing what factors influence individuals to participate in the sharing economy and, in the case of Airbnb, how do such factors along with demographics and socioeconomic influences impact the motivation of an individual to host their property on the Airbnb platform causing spatial fluctuations in Airbnb property densities within a city. However, these issues have not yet been addressed for San Francisco. Considering the changes in tourism mobility due to the COVID-19 pandemic [5], it is especially opportune to study the supply side of Airbnb in San Francisco, in terms of its spatiotemporal patterns and various influences on Airbnb property listing densities.
3. Conceptual Model
The conceptual model is based on the spatially aware technology utilization model (SATUM) [34]. This model considers the spatial distribution and clustering of dependent variables as well as examining the associations of dependent variables with a set of demographic, educational, economic, ethnic/racial, social capital, attitudinal, trust, and proximity factors. The model has been applied to studying digital access, use, and purposeful use [35,36,37,38,39], as well as to densities of properties in the sharing economy [23,24]. The model’s unit analysis is a geographic areal unit—for example, it has been applied to units including nations [35], states and provinces [36], U.S. counties [40], and zip codes [24]. Accordingly, the values of variables represent the mean value of the variable for the individuals residing in the unit. In addition, dependent and independent variables can be categorized into groups, for example the group of economic variables.
The model for the present study, shown in Figure 1, consists of sixteen independent variables, which are categorized into seven groups.
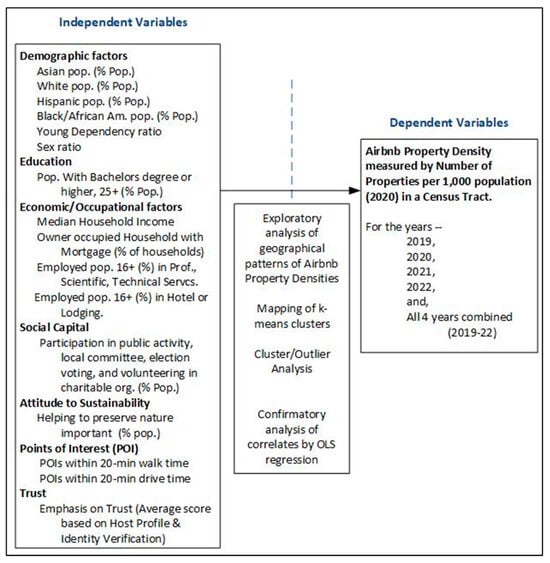
Figure 1.
Conceptual Model of Airbnb Rentals.
The model performs an exploratory analysis of the group of four dependent variables (one for each year 2019 through 2022) to assess how the variables are geographically clustered, i.e., the Airbnb population characteristics within the cluster are similar.
The model proceeds to examine the association of the independent variables with the dependent variable, Airbnb property density for each of four years and for the combined sample of all four years. Each association is further analyzed for spatial bias, i.e., a bias that is present when error terms are agglomerated spatially, meaning that there are significant geographic effects not being taken into account, a situation formally referred to as spatial auto-correction.
In summary, the conceptual model provides an understanding of the spatial arrangement of Airbnb property densities and clusters, and it examines the relationships of Airbnb property densities to a range of variables that are induced from the literature or author reasoning to be related to the dependent ones.
The independent variables are justified by induction from prior literature or by author reasoning. There are relatively few prior studies that utilized the SATUM model or a similar framework for the sharing economy, and specifically for Airbnb, so inducing from the literature is limited. The factors are examined by categories.
3.1. Demographic Factors
Age has been included in prior studies of Airbnb densities [24]. Its proxy of young dependency ratio, defined as population 0–19/population 20–64, was inversely significant for nearly all Airbnb dependent variables for Los Angeles, California [24]. In a study of New York City [23], the same proxy variables were significant for a quarter of the Airbnb factors. The explanation was that younger communities would attract renters and that youth would connote less neighborhood resistance. Hence, we include the young dependency ratio.
Racial and ethnicity variables were associated with Airbnb densities [24], although the specific categories differed in strength of association. In Los Angeles, percent Black was strongly associated and percent Asian weakly inverse in effect, a relative effect also evident in New York City. Percent Hispanic had no effect in the two studies. In the city of San Francisco, with a population of 873,959 in 2022, the racial/ethnic composition is 35% Asian alone, 5% Black/African American alone, 42% White alone, and 16% Hispanic [41]. Since the city is multi-ethnic/racial, this further justifies including the ethnic/racial variables. For the present study, we posit that percent Black is positively related to Airbnb density, percent Asian will be inverse, and percent Hispanic will have no effect.
3.2. Education
Education has been a strong factor in location of Airbnb properties in Barcelona, Spain, and Lisbon, Portugal [42] and in Melbourne and Sydney in Australia [43]. In Barcelona and Lisbon, Airbnb locations were located in areas associated with nine features, including a large proportion of highly educated persons [42], while in Melbourne and Sydney, education was the most important variable associated with host participation on the Airbnb platform [43]. In Los Angeles, college education was associated with Airbnb concentrations for two of the three years studied [24]. Hence, we include college education, as measured by completion of bachelor’s degree, in our model.
3.3. Economic/Occupational Factors
Income. Referring again to Los Angeles and New York, income was broadly and strongly inverse in effect. Our explanation is that a high-income neighborhood may dissuade renters from choosing that neighborhood, due to higher rents or fear of them, as well as disinclination of affluent homeowners to rent. On the other hand, income was a positive factor on Airbnb locations in Sydney and Melbourne, Australia [43]. The difference in Sydney can be explained by the proximity of affluent residential areas closely surrounding its downtown and extending east to the ocean, areas which are attractive to Airbnb properties due to multiple points of interest nearby. A similar pattern typifies Melbourne as well. Accordingly, we include median household income, without positing directionality of association.
Occupation. Prior studies of Airbnb properties have pointed to occupation as an independent factor. In Los Angeles, employment in finance and real estate was a strong correlation of Airbnb densities, and employment in manufacturing was a secondary factor. By contrast, in New York City, professional, scientific, and technical services (PSTS) employment was the most significant correlate, while hotel/lodging employment had no effect [23]. In studies of Melbourne and Sydney, tourism (and presumably tourism employment) was identified as a factor in the location of Airbnb properties [43]. Accordingly, for the present model, we posit that % of employed population in PSTS relative to employed population and % of employed population in hotel and lodging to be included in the model.
Owner-occupied Household with Mortgage. Although rarely included in models, a prior study of New York City [23] found that the ratio of owner-occupied households with a mortgage to all households was inversely associated with Airbnb densities for rental of shared rooms but not for private rooms or entire home or apartment. We reason that having a mortgage connotes that an owner has financial stability, which in turn would reduce the owner’s inclination to rent shared rooms and arguably private rooms. Hence, we include the ratio of owner-occupied household with mortgage to total households in the model as an independent variable.
Social Capital. Social capital is the implied economic advantage stemming from group activities. The benefits come from shared information, cooperation, and reciprocity of participating in a social network. Social capital encompasses a wide variety of specific benefits that flow from the trust, reciprocity, information, and cooperation associated with social networks. Möhlmann [12] has posited that the communal aspirations of the millennials lead to social capital which in turn motivates the sharing economy. This study, following the traditional framework of Putnam [44], proposes that social capital be represented by participation in public activity, serving on a local committee, voting in an election, and volunteering in a charitable organization. Although social capital was included but not significant in model of Airbnb utilization New York City, we posit social capital (as represented in the average of participation in public activity, servicing on a local committee, voting in an election, and volunteering in a charitable organization) to be positively associated with host participation in San Francisco.
Attitude toward Sustainability. Ecologically sustainable consumption is a construct used in Self Determination Theory and posited to be essential to the intent to share [8]. In a reverse causation, other studies [3,7] found that sharing economy applications increase the efficiency of services and provision of goods, thereby reducing waste that can impact the environment. In accordance these studies, we posit a host’s attitude toward greener consumption (specifically level of agreement with the statement, “Helping to preserve nature is important”) is positively associated with participation in Airbnb as part of the sharing economy.
Points of Interest (POI). We argue that points of interest naturally attract the majority of Airbnb customers, who have interests in touristic features of cities and places, regardless of whether their visit is mostly touristic or, in many cases, as an attraction accompanying a business visit. The importance of proximity to points of interest is reflected in a study of Barcelona and Lisbon, for which most of the Airbnb accommodations were in or near the central city, which have traditional high level of touristic attractions [18]. Similarly in a study of Sydney and Melbourne, Australia [43], Airbnb properties were located in city-center areas of high touristic visitation. Hence, we include points of interest, as measured by POI within 20 min walk time and POI with 20 min drive time, in the model as two posited correlates of Airbnb property density.
Trust. Trust is a multidimensional concept. In the present study, we adopt Botsman’s trust stack (stage 3) [45], which consists of the emphasis by the host on trusting renters, and in particular, whether or not the host required the renter’s driver’s license, Airbnb profile, and phone verification. This approach for a trust construct is consistent with trust in external institutions and governments [3]. We propose that the above-stated composite index measuring emphasis on trust by the host of the renter is associated with host participation.
4. Methodology and Data
4.1. Research Methodology
The research methodology is comprised of compiling a robust dataset of dependent variables, which are measures of Airbnb property densities in San Francisco at the census tract level. For this study, we compiled Airbnb property listings for three property types—entire home/apartment, private room, and shared room, for the month of August of each year during the period 2019–2022 for seasonal consistency. August was selected because August was the month with the highest average number of Airbnb properties listed in the City of San Francisco during the period 2019–2022. This period covers the COVID-19 pandemic. Individual listing locations were geocoded in a GIS, and then geocoded listings were compiled at the census tract level to obtain an aggregate count of listings per census tract. Then, for each tract, aggregate counts were divided by 2020 population, and the quotient was multiplied by 1000 to obtain a normalized measure of listings per 1000 population. We checked for population fluctuation given the effects of the pandemic while choosing the year 2020 population for purposes of normalization. These normalized measures of Airbnb listings per 1000 population are used as Airbnb property densities in the study. After normalization, we found that Airbnb property densities were abnormally high in a handful of census tracts. Upon further examination, these tracts were found to be sparsely populated with fewer than 500 inhabitants. In other cases, tracts had one or two Airbnb listings. Due to such anomalies, 18 census tracts were removed resulting in a sample size of n = 223 tracts for the study.
For each tract, we calculated Airbnb property densities for all properties and all years aggregated, for all properties for each year 2019, 2020, 2021, and 2022, and for two dominant property types—entire home/apartment and private rooms, for each of the four years. The third type of listing—shared room—was ultimately not analyzed in isolation, since a vast majority of census tracts had no private rooms listed during the study period. In total, thirteen density measures serve as indicators of Airbnb host participation in San Francisco’s STR market, as shown in Table 1.

Table 1.
Variables and Descriptive Statistics.
Next, data were compiled for demographic and socioeconomic indicators as well as indicators of trust, sustainability, and social capital. Data on points of interest were also compiled and aggregated at the census tract level. These sixteen indicators serve as the study’s independent variables. Correlation analysis was conducted pairwise, and Pearson’s correlation coefficient was calculated to diagnose multicollinearity. No significant issues were identified.
The independent variables were studied for correlations, and the variables included did not show any two variables with extremely high correlation. An example of one correlation finding is the relation of income with ethnic groups. The correlations of 2020 median household income with the following ethnic/racial categories were median income with %Asian (−0.468); with %Black/African American (−0.337), with %White (0.644), and with %Hispanic (−0.236), all significant at the 0.001 level.
Once all data were compiled, descriptive statistics were calculated for the 13 dependent and 16 independent variables. The 13 measures of Airbnb property densities were mapped in a GIS to analyze geographic patterns, agglomerations, and outliers. Descriptive mapping provides important visual cues. POI locations such as museums were overlaid on maps of Airbnb property densities for additional geographic context about concentrations of Airbnb properties in San Francisco relative to the city’s myriad neighborhoods. K-means cluster analysis, an unsupervised data mining method, was next applied to determine clusters of Airbnb in San Francisco, at the census tract level. For k-means, a value of k = 5 was used and cluster centers were calculated. Each cluster was characterized in terms of its demographic and socioeconomic attributes, and also in terms of indictors of trust, sustainability, and social capital, and POI locations. Such characterization unveils important underlying differences between the highest, moderate, and lowest clusters of Airbnb densities. Clusters were also mapped in a GIS showing their proximity to POIs and to provide an overall descriptive sense of agglomeration and dispersion of census tracts belonging to the same cluster.
GIS mapping was performed using ArcGIS Pro. Statistical analysis was done with the SPSS software (version 26), combined with the spatial statistics tools in ArcGIS Pro. Mapping was performed by inputting the Airbnb data in Excel files and joining them to a polygon layer for the census tracts of San Franciso city, enriched with demographic attributes. OLS regression (stepwise) was performed in SPSS and cluster analysis used the k-means cluster features of SPSS. Spatial autocorrelation was performed with the spatial statistics toolbox of ArcGIS Pro.
Based upon these visual cues, spatial autocorrelation analysis was employed, and Moran’s I test statistic was calculated for the 13 dependent variables, as follows:
zi is the deviation of an attribute for feature i from its mean, wi,j is the spatial weight between features i and j, n is the total number of features, and S0 is the sum of all spatial weights. Moran’s I measures the extent of spatial autocorrelation of each dependent variable. Moran’s I test is inferential; the null hypothesis is that the values of a variable are randomly distributed spatially. The test statistic ranges in value between −1 and +1. Moran’s I statistic value close to 0 for a dependent variable (Airbnb property density) would indicate spatial randomness while values close to −1 and +1 indicate the presence of spatial bias for a dependent variable that needs to be accounted for while examining associations of independent variables with the dependent variable in question. Interpretation of Moran’s I is performed using the p value for statistical significance (if p is not significant, the variable is randomly distributed spatially). Further, if the Z score is positive, the values of a variable are more geographically agglomerated (high values located near high ones and low values near low ones). If it is negative, the spatial pattern resembles a “checkerboard” pattern, in which high values are surrounded by low ones and vice versa.
Since Moran’s I is unable to uncover spatial heterogeneity and identify spatial clusters and outliers, local indicators of spatial association (LISA) analysis [46] was also conducted to determine spatial clusters and outliers of Airbnb density in the study area. Clusters and outliers are mapped in a GIS to visualize and subsequently contextualize statistically significant hotspots, coldspots, and outliers of Airbnb property density in San Francisco’s census tracts.
Finally, ordinary least squares (OLS) regression analysis is conducted to examine the associations of the sixteen independent variables with the thirteen dependent indicators of property density. OLS regressions were conducted in two batches, first for five dependent variables that represent densities for the combined years 2019–2022 and for each year, 2019, 2020, 2021, and 2022. The objective was to diagnose changes in OLS regression results over time, which would indicate a shift in host motivations to participate in Airbnb STR marketplace. The second batch of OLS models featured eight dependent variables, split in half for entire home/apartment and private room, the two main property types, for the aforementioned years. The variance inflation factor (VIF) was calculated for each OLS model and a VIF cutoff of 5.0 was used as a threshold of multicollinearity. VIF values greater than 5.0 indicate redundancy among explanatory variables. No multicollinearity problems were detected for any of the OLS models. For each OLS model, regression residuals are mapped in a GIS to visualize spatial patterns in terms of randomness versus agglomeration. The extent of spatial randomness is determined by computing Moran’s I of regression residuals. These Moran’s I values are compared with the Moran’s I values of the Airbnb property density dependent variables to gauge if the OLS models have been able to account for the presence of any spatial bias in the dependent variables themselves.
Finally, for each OLS model, three diagnostic measures—joint Wald, Koenker, and Jarque–Bera were examined, for ensuring that the models satisfy OLS regression assumptions. The joint Wald statistic is a test of joint significance of coefficients of individual independent variables. The Koenker (BP) test statistic is a test of variance of residuals not being constant. When this test is statistically significant, the relationships modeled are not consistent, either due to non-stationarity or heteroskedasticity. The Jarque–Bera test statistic is a goodness-of-fit test, on whether the residuals have skewness and kurtosis that correspond to a normal distribution. When this test is statistically significant, model predictions are likely to be biased. Measures of these three test statistics are reported later in the paper along with OLS regression results.
4.2. Data
San Francisco’s Airbnb property listings for the years 2019 to 2022 were collected from the site www.insideairbnb.com. Insideairbnb.com has scraped and compiled Airbnb listings data since 2014 and data from this site has been used in prior research studies [14]. A total of 28,474 listings are part of the dataset that are aggregated across 223 census tracts of the city of San Francisco, as discussed earlier. Data for the independent variables were compiled at the census tract level from a number of authoritative sources. Data for demographic, economic, and occupational attributes were sourced from Esri Demographics for the year 2020, which represents the start and rapid spread of the COVID-19 pandemic in much of California, including the city of San Francisco. Data for indicators of social capital and sustainability were compiled using consumer survey datasets of Esri/GfK MRI DoubleBase Survey. Doublebase is an integration of information from four consumer surveys, conducted annually of 20,000 U.S. adults, with focus on understanding consumer lifestyles and preferences, including attitudes towards sustainable consumption (used as sustainability indicator) and participation in public service (which is one part of the social capital indicator). POI listings data were collected from SafeGraph. SafeGraph’s POI dataset contains places where consumers spend time, money, or both. POIs include restaurants, grocery stores, malls, parks, museums, art galleries, theaters, aquariums, and more. Finally, the indicator for trust was compiled from attribute data corresponding to each Airbnb listing, from InsideAirbnb.com. These attributes correspond to host profile and identify verification provided for each listing, which indicates a host’s affinity for trust. All variables, corresponding data sources, and descriptive statistics are in Table 1.
5. Spatial Patterns of Airbnb Properties in San Francisco
Airbnb property densities were mapped using a Geographic Information System (GIS). GIS mapping provides visual cues about spatial patterns of property densities and reveals the extent of host participation in San Francisco’s STR markets. The thresholds for the categories in Figure 2, were determined by taking equal intervals of 160 for the first four categories, which vary from 0 to 640, with the highest category being greater than 640. For each of the years, 2019 to 2022, Airbnb property density is found to be the highest in the northern and eastern parts of the city. These areas (dark and light blue census tract polygons in Figure 2) comprise census tracts that are in Downtown and Tenderloin neighborhoods north of Market Street and east of the 101 Freeway near Union Square, which is a hotspot of hotel and lodging establishments. Moderately high concentrations of Airbnbs (dark green) are in census tracts that are contiguous to the previous set of census tracts (very high Airbnb densities) in the Downtown/Civic Center sub-region as well as in the Haight Ashbury neighborhood near Golden Gate Park.
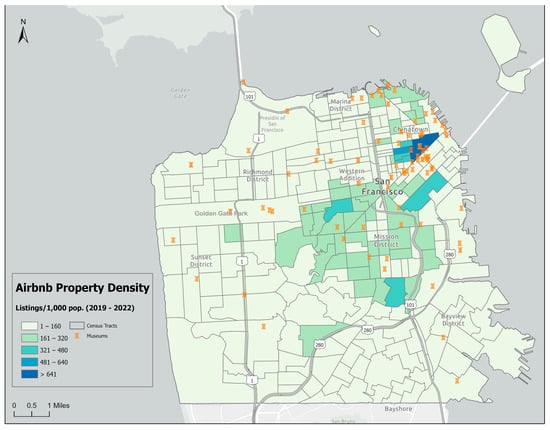
Figure 2.
Spatial Distribution of Airbnb Property Density, San Francisco, 2019–2022.
Moderate Airbnb property densities (light green) are found in the Northeast Waterfront Historic District that includes Sane Francisco’s popular tourist attraction Pier 39. Moderate concentrations are also noticed in Chinatown north of Market Street, and in Mission District, Bernal Heights, Noe Valley, south of Market Street. Parts of the Haight Ashbury neighborhood, adjacent to Golden Gate Park are also moderate in Airbnb property density. Property densities per capita are low (greenish off-white color in Figure 2) in the rest of the city, with densities between 1–40 properties per 1000 population (in 2022). These spatial patterns are largely consistent longitudinally and act as an aggregate over the 2019–2022 period.
5.1. Clusters of Property Densities
K-means clustering of Airbnb property densities yields five clusters of Airbnb property densities that are ranked from highest to lowest cluster center values as shown in Table 2. Clusters 1 and 2 have the highest to very nigh property densities, with 1 and 3 census tracts, respectively, as members of these clusters. Airbnb property density is moderate in cluster 3, with 11 clusters averaging a density of 0.100. Cluster 4 is dispersed over 65 census tracts and has moderate-low property density, while cluster 5 has lowest property density, and is dispersed over 143 census tracts. In other words, clusters 4 and 5 together account for over 93% of San Francisco in which host participation in Airbnb’s STR markets is minimal. The clusters are mapped in a GIS to reveal the extent of spatial contiguity and their locations relative to POIs and the various important freeways and U.S. highways that crisscross San Francisco.
Table 2.
K-means Clusters of Airbnb Property Density and their Characteristics, San Francisco, 2019–2022.
From Figure 3, it is evident that the census tracts belonging to clusters 1, 2, and 3 in which Airbnb property density is very high to moderately high are all concentrated north of Market Street in the northeastern periphery of the city, which is a hotspot of tourism, cultural attractions including museums, and related diversity. The four census tracts of clusters 1 and 2 are spatially contiguous and are located in San Francisco’s Financial District, in close proximity to Chinatown, a noted ethnic enclave of San Francisco. Members of cluster 3 are located both north and south of the census tracts in clusters 1 and 2, around tourist attractions such as Pier 39, which is home to retail and dining establishments and offers panoramic views of the San Fransisco Bay. These tracts are located on either side of U.S. 101 which cuts through downtown San Francisco providing a major gateway into the city. Cluster 4 census tracts surround the census tracts of clusters 1, 2, and 3, and have moderate-low Airbnb host participation. They are dispersed over several neighborhoods such as Haight Ashbury and Barnal Heights in Mission District, Marina District, and Chinatown in the central core and northeastern periphery of the city and include commercial and sports venues such as the Chase Center and Oracle Park, which are home of the city’s NBA and MLB franchises. One single census tract that belongs to cluster 4 is the location of San Francisco International airport, which is in close proximity to a number of hotels and lodging facilities. Cluster 5 census tracts, which accounts for almost two-thirds of the study area, are located away from downtown San Francisco and the city’s central business district for the most part in the city’s Bayview, Sunset, Richmond, and Marina districts. These tracts of the lowest Airbnb densities surround the central business district high Airbnb-density tracts of clusters 1 and 2. This is not unusual in central areas of US cities (consider, for example, that high Airbnb zip codes of mid-Manhattan and northern Brooklyn are surrounded by the low and lowest high Airbnb-density zip codes [23]. Viewed as a whole, the clusters grow outward from the city’s northeastern periphery where property densities are highest to the city’s core and western and southern fringes where property densities are the lowest. This is a contrast to Los Angeles, California, in which the distribution of Airbnb supply has a center-periphery pattern [25].
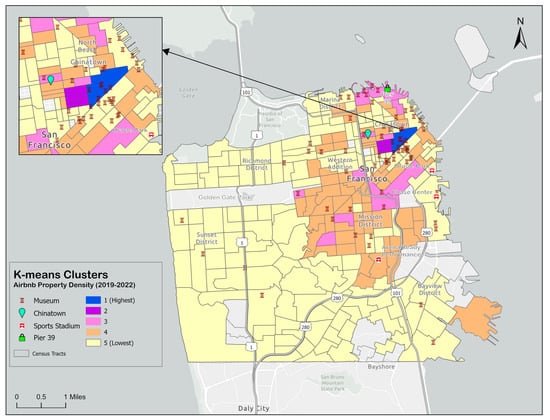
Figure 3.
K–means Clusters of Airbnb Property Density, San Francisco, 2019–2022.
The clusters are characterized in terms of the study’s sixteen independent variables. As shown in Table 2, the clusters are largely similar in terms of demographic attributes including age structure, race/ethnic composition, and educational attainment. However, four distinct contrasts emerge. The median income of clusters 1, 2, and 3 is up to three times lower than that of clusters 4 and 5, while these two clusters have up to seventeen times higher proportion of owner-occupied households with a mortgage. Viewed together, these point to economic motivations of hosts, albeit in different ways. Hosts in clusters 1, 2, and 3 are likely to supplement their incomes by hosting their properties on the Airbnb platform. On the contrary, Airbnb hosts in clusters 4 and 5 are likely to defray the costs of their mortgages by opening their homes to guests. From an occupational standpoint, there is a stark difference. The proportion of hotel and lodging employment is up to 47 times higher in the highest density cluster compared to the lowest density cluster, when cluster 1′s sole tract is excluded. This indicates that properties in clusters 1, 2, and 3 are in close proximity to hotels, which serve tourists and guests visiting some of the city’s vacation and financial hotspots. This is further reinforced by the finding that clusters 1 and 2 have almost five times as many POIs such as museums, retail and dining establishments, and tourist attractions such as Fisherman’s Wharf and Pier 39, within 20 min of walking time, compared to cluster 5. These contrasts between the clusters of Airbnb supply in San Francisco reconcile with the study’s later findings on associations between the dependent and independent variables.
5.2. Spatial Agglomeration and Clusters and Outliers of Airbnb Properties
Spatial autocorrelation analysis is employed to measure the extent of spatial agglomeration of Airbnb property densities in San Francisco’s census tracts. Moran’s I index of spatial autocorrelation for all measures of property density dependent variables listed in Table 3 and Table 4. When all properties (entire home/apartment, private room, and shared rooms) are aggregated across types and all four years, Airbnb property density is found to be statistically significantly clustered at the 0.001 level with a Moran’s I value of 0.176. For the individual years 2019 to 2022, property densities are also found to be significantly clustered at the 0.001 level, with Moran’s I values of 0.208 (2019), 0.180 (2020), 0.193 (2021), and 0.225 (2022). For entire home/apartment, the corresponding Moran’s I values are 0.381, 0.182, 0.278, and 0.158, for the consecutive years 2019 to 2022, all significant at the 0.001 level, while for private room, the values are 0.068, 0.070, 0.068, and 0.075, again all significant at the 0.001 level. This indicates statistically significant spatial agglomeration for these two property types as well. Longitudinally, the extent of clustering does not vary greatly over the four-year study period. The agglomeration of property densities indicates the presence of spatial bias, which has methodological implications for OLS regression models.
Table 3.
OLS Regression Findings, Airbnb Property Densities, 2019–2022.
Table 4.
OLS Regression Findings, Airbnb Property Densities, Entire Home/Apartment and Private Room, 2019–2022.
Since spatial autocorrelation analysis using Moran’s I is unable to uncover spatial heterogeneity and identify spatial clusters as well as outliers, we used local indicators of spatial association (LISA) analysis [46] to capture local spatial autocorrelation. LISA analysis reveals that statistically significant hotspots of Airbnb properties are in the Financial District, north and south of Market Street, one of San Francisco’s main thoroughfares, as shown in Figure 4. Statistically significant hotspots are also found in the Tenderloin, Nob Hill, Chinatown, and North Beach areas in the northeastern part of the city. Another hotspot is in the city’s core, in the northwestern corner of Mission District, and also parts of the Western Addition and Haight-Ashbury neighborhoods. We note that the U.S. 101, a gateway for visitors driving into San Francisco hugs many of these hotspots. Interestingly, statistically significant low-high outliers adjoin the hotspots and are located in these very same neighborhoods, predominantly in the northeastern periphery of the city. Coldspots of Airbnb are dominant in the west and south of San Francisco including Richmond and Sunset districts to the north and south of Golden Gate Park, respectively.
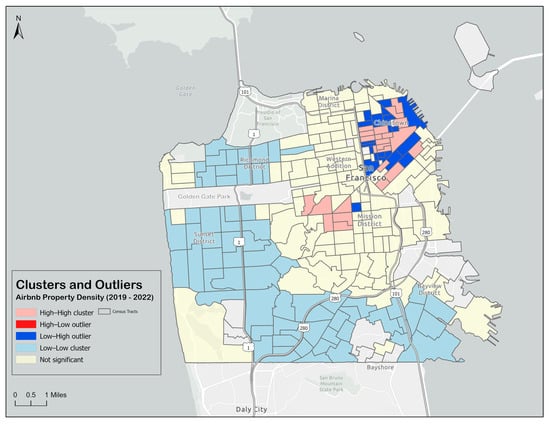
Figure 4.
LISA Clusters and Outliers Airbnb Property Density, San Francisco, 2019–2022.
In summary, spatial agglomeration of Airbnb property density in San Francisco does not have center-periphery pattern unlike Los Angeles [25]. Instead, the city’s spatial patterns and agglomerations of Airbnb’s properties closely resembles Airbnb supply patterns in Spain, where areas attractive to tourists, with an already established tourism sector, have higher Airbnb concentration. Like such areas of Spain, clusters of high Airbnb densities in San Francisco have significantly high hotel and lodging employment and are in close proximity of POIs frequented by tourists and others visiting the city [5,47].
6. Socioeconomic Influences on Host Participation
Two sets of OLS regressions were conducted to analyze influences of sixteen independent variables on Airbnb property densities, which are used as measures of host participation in Airbnb’s short-term rental markets in San Francisco. In the first set of OLS regressions, there are five dependent variables, indicating Airbnb property densities for the years 2019–2022 combined, and for each year, 2019, 2020, 2021, and 2022. In the second set of OLS regressions, there are eight dependent variables, four of which represent the densities of entire home/apartments, for the years 2019, 2020, 2021, and 2022, while the remaining four represent the densities of private rooms, for the same four years. As discussed earlier, entire home/apartment and private rooms are the two most dominant types of properties rented by Airbnb hosts in San Francisco during the study period. The sixteen independent variables span demographic indicators including race/ethnicity, educational attainment, occupational and economic variables, points of interest located within 20 min of walking time and 20 min of drive time from centroids of census tracts, and indicators of social capital, attitude toward sustainability, and trust.
For the first set of OLS regressions, the dominant correlates of Airbnb property densities in San Francisco are per capita employment in professional, scientific, and technical services, proportion of Asian population, points of interest located within 20 min of walk time, followed by hotel and lodging employment per capita. As shown in Table 3, these dominant correlates are consistent longitudinally across the study period, as well as when property densities are estimated for all four years (2019–2022) combined. The consistency of this quartet of correlates shows that factors influencing host participation in San Francisco’s short-term rental markets were not unduly influenced by the COVID-19 pandemic. The explanatory power of the five regression models, measured by the adjusted r-squared value, did fluctuate, and increased from 51.9% in 2019 to 57.6% in 2020, peaking at a high of 61.5% in 2021, before decreasing slightly to 59.3% in 2022. For the combined years (2019–2022), the adjusted r-squared value was 59.6%. These high coefficient of determination values shows the robustness of the study’s conceptual model. The variance inflation factor (VIF) does not exceed a threshold of 5.0 indicating that multicollinearity is not a concern.
Among the correlates, per capita employment in PSTS and hotel and lodging, along with POIs located within 20 min of walk time are found to be positively associated with Airbnb property densities. However, proportion of Asian population is inversely associated with Airbnb property densities. Those employed in PSTS provide professional, scientific, and technical services for clients in a variety of industries and in some cases, households. PSTS activities includes legal services, computer systems design, research and development, management, scientific, and technical consulting services, advertising, accounting, and tax preparation [48]. We reason that those employed in PSTS are likely to have some college education and are likely to be more aware of home-sharing platforms and consequently their benefits, such as the potential for supplemental income. It is also likely that those employed in PSTS possess more advanced digital skills leveraging which they engage with home-sharing platforms such as Airbnb, interact digitally with guests, and manage the reservation, cancellation, pricing, payment, and myriad other aspects of participating in STR markets. Our findings are consistent with a recent study [23] in which PSTS employed was found to positively influence Airbnb hosts to share their properties in New York City. Finally, as discussed in [23], on-demand companies are paving the path for white-collar workers to participate in the gig economy leveraging their electronic skills and digital privileges.
Hotel and lodging employment per capita is also found to be positively associated with Airbnb property density in San Francisco for all years except 2019 and as well as for the 2019–2022 period. Studies [49] have shown that market conditions that include presence of Airbnbs may impact hotel sales and consequent strategic pricing response by hotels. For San Francisco, which has been until recently renowned for its tourism and convention business, the presence of many high-end as well as discount hotels is likely to incentivize workers in hotel and lodging establishments to leverage their domain knowledge of the business and rent their own properties on Airbnb. Oftentimes, they are keyed to seasonal fluctuations in demand, consequent price fluctuations, and third-party services for Airbnb hosts such as room cleaning and key exchange services which facilitate the hosting process, which can reduce the cost of hosting [49]. In short, employment in hotel and lodging makes it more likely that those employed in this sector participate in STR marketplaces such as Airbnb. Overall, the positive association of the duo of PSTS and hotel and lodging employment is a novel finding of this study that has previously not been reported for San Francisco.
OLS regressions reveal that POIs, located within 20 min of walking time from the centroids of census tracts, are positively associated with Airbnb property densities when aggregated for the 4 years between 2019–2022, as well as for each individual year. Prior studies have documented similar findings. In New York City, the Airbnb supply was found to be concentrated in parts of the city where the number of points of interest representing eating and drinking, retail, sports and entertainment establishments, and tourist attractions were high. Accessibility to such POIs was found to positively influence Airbnb supply in New York City [22]. A recent study on spatial distribution of Airbnb supply in Los Angeles found that the number of POIs positively affects Airbnb supply in the city. Proximity to Hollywood (specifically, Hollywood Walk of Fame) was also found to be important; for every increase of distance to Hollywood by 1 km, Airbnb supply was found to decrease by 1.86 units [25]. Similar findings have also been documented for European tourism destinations such as Spain [28] and cities such as Barcelona [47]. In San Francisco, a popular tourism and convention destination, we reason that the proximity to POIs such as restaurants, malls, parks, museums, art galleries, and ethnic enclaves that offer glimpses of the city’s rich cultural diversity, increase the attractiveness of the city’s various neighborhoods to visitors, making it more likely that renters in such neighborhoods list their properties on Airbnb.
Finally, the proportion of Asian population is consistently inversely associated with Airbnb property density in San Francisco over the study period. The inverse association is longitudinally consistent as well including when property densities are aggregated over the period 2019–2022. It has been reasoned that low levels of home ownership among minority races and ethnic groups may adversely impact participation in STR markets by such groups. In addition, prior studies that have examined racial discrimination on STR platforms such as Airbnb have documented that minority race/ethnic groups, particularly Asians hosts in Oakland and Berkeley, are likely to earn significantly less income via rent than their White counterparts for similar rental properties [50]. Another study has found that Hispanic and Asian Airbnb hosts, on average, have almost 10% lower list price relative to their white counterparts, in San Francisco, after controlling for neighborhood property values, user reviews, and rental unit characteristics [51]. Researchers have explained that guests may perceive rentals hosted by minorities to be situated in inferior locations, or that the quality of such properties may be inferior to those hosts belonging to majority race/ethnic groups [52]. The likelihood of lower incomes or other forms of discrimination are likely to be deterrents for Asians to list their properties on Airbnb offering one possible explanation for the inverse association. Finally, a recent study has argued that minority race/ethnic groups in San Francisco are likely to price their Airbnbs lower to maintain occupancy levels, perhaps due to an expectation of discrimination in the online marketplace [53]. We reason that this may also dissuade Asians from participating in San Francisco’s STR marketplace offering another possible explanation for the inverse association. While this finding for San Francisco has not been previously documented to the best of our knowledge and is therefore novel, it merits further research.
Two additional sets of OLS regressions (in Table 4) were conducted for the two dominant property types—entire home/apartment and private rooms. For entire home/apartment, the dominant correlates for Airbnb property density are employment in PSTS, and POIs that are located within a walk time of 20 min from the centroid of census tracts in San Francisco (all years except 2020). Both of these factors are positively associated with property densities. Asian population is found to be inversely associated with Airbnb property densities for the years 2020, 2021, and 2022, but not 2019. These findings are largely consistent with the prior set of regression results (see Table 3). However, there are some notable differences. Unlike the previous set of regressions, hotel and lodging employment is found to be positively associated only for one year: 2022. Also, two other independent variables—owner occupied households with a mortgage and proportion of White population—are found to be positively associated with Airbnb densities, for the years 2019 and 2021 only. Social capital is found to have positive associations with Airbnb densities in 2019 and 2020, but not thereafter. The lack of association of entire home/apartment rental density with hotel/lodging employment (with the exception of year 2022) is because hotels are not competing directly with entire homes and apartments, since hotels do not rent home properties and infrequently offer large apartment-like suites. The explanatory power of the OLS models for entire home/apartment is comparable with the prior set of regressions, with the coefficients of determination varying between 47.9 percent in 2020 to 59.4% in 2022.
For private rooms, the findings are mostly consistent with the prior set of OLS regression results for entire home/apartment in Table 4. Both occupational variables (PSTS and hotel/lodging) are positively associated while proportion of Asian population is inversely associated. However, there are notable differences as well. POIs within 20 min of walk time are not found to have any association with the dependent variables, for any year, while median household income is found to be inversely associated for all years except 2022. Unlike entire home/apartment OLS models, there is no association with the proportion of White population, owner occupied households with a mortgage, and social capital. The coefficients of determination vary between 51.3 percent to 61.1 percent and are hence comparable with both prior sets of OLS models.
In the case of entire home/apartment, the positive association of Airbnb densities with owner occupied households with mortgage, and in the case of private room, the negative association of Airbnb densities with median household income, both point to economic motivations for Airbnb hosts. Hosts who are renting entire homes or apartments are likely using the supplemental income from homesharing to defray the costs of their mortgages. This relationship is manifest in the regressions for 2019 and 2021 only. For hosts renting private rooms, we reason that the income from the private room is not sufficient to defray mortgage costs, hence the absence of relationship. In a prior study of New York City in 2015–2017, with somewhat similar design to the present one, there were no such associations with hotel/lodging employment for any single year or the combined annual samples [24]. In the case of private rooms, OLS findings indicate that as median household income decreases, Airbnb densities increase in the years 2019–2021.
We reason that hosts are similarly motivated to supplement their household incomes or cover gaps in income, particularly during the pandemic by renting private rooms. The inverse association of median household income has been previously reported for New York City [23] and is consistent with Möhlmann [12] and Sundararajan [3] who argued that collaborative consumption generates cost savings for gig economy workers and provides extrinsic motivation to share their assets.
For entire home/apartment, the finding that proportion of White population is positively associated with Airbnb densities is consistent with contemporary reports that have documented that the sharing economy worker is overwhelmingly White. Further research is essential to determine why the significant association with the White population is present for the years 2019 and 2021, but not for 2020, when the COVID-19 pandemic started in California. The positive association of social capital with densities of entire home/apartment in 2019 and 2020 also merits further investigation.
The positive influence of social capital on entire home/apartment rentals in 2019 and 2020, but absence of association in 2021 and 2022 is explained by greater availability to conduct social activity physically pre-pandemic, compared to barriers to social activity during the pandemic, due to restrictions placed on communal gatherings. By contrast, for rental densities of a private room, there is an absence of any social capital associations over the four years, so the pandemic explanation does not hold up. This contrasting finding merits further research.
For walking to points of interest, there is association with entire home/apartment rentals for years 2019, 2021, and 2022, but lack of associations, over the four years, for private room rentals. We speculate that more renters would be present on average in entire homes/apartments compared to single homes, so the odds of someone taking advantage of walking to a POI is relatively greater in a home/apartment. Since unit occupancy data were not available, future research would be needed to validate this argument.
Overall, occupational factors (PSTS and hotel lodging employment), proximity to POIs, and minority population (proportion of Asian population), along with economic factors that point toward supplementing income by homesharing explain the variations of Airbnb property densities in San Francisco over the period 2019–2022. These demographic, occupational, economic, and accessibility influences on host participation in Airbnb’s STR markets in San Francisco are largely consistent longitudinally, but some differences are found between entire home/apartment and private room. No association is found with indicators of trust and sustainability, nor with age structure and educational attainment. The implications of these findings are discussed in the next section.
OLS regression residuals were mapped (Figure 5) to examine if the models were able to account to spatial agglomeration of Airbnb properties in San Francisco. Spatial autocorrelation of the regression residuals was also estimated, and Moran’s I values of residuals are given in Table 3 and Table 4. For all regressions, the extent of spatial agglomeration of the regression residuals was significantly lower than the agglomerations of the property densities. For the OLS models for all properties combined across all four years, and for the years 2021 and 2022 individually, the residuals are found to be randomly distributed. Figure 5 shows the random spatial distribution of regression residuals for all properties combined, across all years. Consequently, these models are able to account for the spatial agglomeration of Airbnbs.
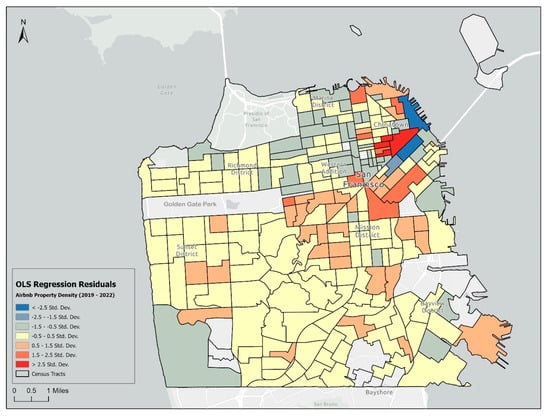
Figure 5.
Spatial Patterns of OLS Regression Residuals, Airbnb Property Density, 2019–2022.
For entire home/apartment, the residuals of the 2021 and 2022 models were found to be randomly distributed, but some agglomeration was still present for the years 2019 and 2020, indicating that the findings of these models have be treated with some caution. However, for private rooms, the residuals of all four OLS models are randomly distributed, indicating the robustness of these models.
Finally, although the joint Wald Statistic is consistently significant across all models indicating the lack of joint influences from independent variables, the significant Koenker and Jarque–Bera statistics (reported in Table 3 and Table 4) indicate that the OLS models have substantial heteroskedasticity and that the residuals do not conform to a normal distribution. These significant values of the Koenker and Jarque–Bera diagnostics indicate that the OLS models have not entirely met OLS assumptions and therefore have to be treated with some caution.
7. Implications
The findings confirm that the theoretical model does portray the spatial distribution, clustering, and outlines of Airbnb property densities for the census tracts of the city of San Francisco. It is evident that the Airbnb densities are highest in the tourist areas of San Francisco or just adjacent to those areas. This conforms to the distributions for New York City [23], Barcelona, Spain, and Lisbon, Portugal [42], and the Australian cities of Melbourne and Sydney [43]. For Los Angeles, even though it is more spread out horizontally and over a great land area that the aforementioned cities, it also has its greatest concentration in downtown LA, with entertainment, fashion, arts, and ethnic areas stretching north to Hollywood and the hills behind; it has a second smaller Airbnb concentration in Santa Monica [24]. The two centers are unique to Los Angeles and distinguish the major distinctive patterns of Airbnb concentrations.
Cluster analysis findings for San Franciso show that there are five distinctive clusters of Airbnb properties, based on the full set of dependent variables. The clusters are ordered from cluster one with highest Airbnb property density to cluster five with the lowest density. Clusters 1 and 2 comprise four census tracts in the central financial district, with moderate income but the highest access to points of interest within a 20 min walk and very high PSTS population % and high hotel/lodging employment for cluster 1. By contrast, cluster 5, the largest with 163 census tracts located mostly in the city’s south and west, has the highest proportion of youth, moderate-high income, high PSTS %, and a very high proportion of hotel/lodging workers, but by far the lowest points of interest within a 20 min walk. These differentiated city clusters relative to Airbnb, further demonstrate the exploratory strength of the model. In short, the theoretical model’s exploratory analysis is yielding not only a thorough profile of the geospatial aspects of Airbnb properties in San Francisco, but also allows for a structured comparison with the Airbnb spatial distributions in several cities in the U.S. and other nations.
The theoretical model also works well overall for the confirmatory OLS regression analysis of associated socioeconomic variables. The metrics confirming this are the high proportions of variance explained and the consistently large reduction from the spatial autocorrelation of the dependent variables, prior to the regression modeling, to that of the regression residuals after modeling.
The practical implications of the findings include governmental planning, adjustments for property hosts, and concerns about equity. In some cities, there are negative reactions to growing Airbnb densities for reasons of displacement of housing and businesses, presence of transitory visitors who might exhibit uncaring behavior, and loss of neighborhood culture. This research can help planners and politicians confront these issues with greater understanding of the geography of Airbnb properties and the spatial trending of densities. Furthermore, knowledge of the leading socioeconomic characteristics associated with high sharing-economy accommodation densities can be helpful in mitigating impacts. For example, if points of interest in the census are highly associated with Airbnb densities, then mid-range planning might strive to locate new points of interest away from current ones in order to potentially encourage decentralization of Airbnb high densities. If the city government plans to modify or introduce new regulations to mitigate or eliminate high densities of Airbnb, they can also assess positive and negative impacts of these reductions.
The powerful association in San Francisco of PSTS employment with Airbnb densities may be explained by the increased residential mobility of tech and professional workers during COVID, since they were untethered from being in their office or workplace every day. We speculate that the near doubling of the regression coefficient for PSTS with Airbnb densities from 2019 to 2020 might reflect this greater residential freedom of movement, and coefficient remained higher than for 2019 for the three years following. PSTS’s strong association might also reflect the higher income of PSTS workers, especially in the Bay Area. City planners need to consider the possible displacement of PSTS workers from city center/high tourism areas if regulations are introduced curtailing the Airbnb properties in those areas. Since high tech is one of the economic backbones of San Franciso and the Bay Area, planners might do anticipatory planning on where tech workers could find new residential hot spots if displacement were to occur.
An important implication stems from the inverse relationship of Airbnb accommodation densities with low income, low education, and Asian population. For disadvantaged people, largely of minority background, currently Airbnb offers very little, since very few of these accommodations are present in their neighborhoods. Equity considerations ideally would have led to expanded lower-cost Airbnb properties for these poorer areas. Even though our study along with others show that scenario to be largely not present today for San Francisco, government subsidies or other incentives might be introduced to encourage a type of sharing-economy, low-cost temporary housing. It might reduce San Francisco’s severe housing shortage for low-income people.
8. Conclusions, Limitations, and Future Research
This paper analyzes spatiotemporal patterns and socioeconomic influences on Airbnb host participation in San Francisco’s STR markets. While there is considerable analysis of demand side motivations of the sharing economy, corresponding work that focuses on the supply side is considerably deficient, especially for peer-to-peer accommodation sharing. In addition, for San Francisco, there is prior work on Airbnb pricing and related factors, but an analysis of supply side motivation has been missing thus far. This work fills this gap.
The research questions are answered as follows:
- (1)
- What are the spatial patterns and variations of host participation in San Francisco’s census tracts, as measured by Airbnb property densities during the period 2019–2022?
The spatial patterns of host participation show a very high Airbnb density level in the city center, with moderate densities extending to the southwest of the downtown into the Mission District. Although there are low-density tracts immediately surrounding the downtown city center, densities increase to moderate levels to the north of the downtown approaching and including the Fisherman’s Wharf area. There are scattered tracts of moderate Airbnb density, one just south of Golden Gate Park, and another in the Sunnyside neighborhood of San Francisco. More subtle spatial differences are revealed by the cluster and outlier analysis.
- (2)
- What are the spatial clusters and outliers of Airbnb property densities in San Francisco and what are their demographic, socioeconomic, and occupational attributes?
Spatiotemporal patterns of host participation are analyzed by estimating Airbnb property densities in San Francisco at the census tract level over the period 2019–2022, which includes the COVID-19 pandemic. The pandemic upended tourism economies in many major world cities including San Francisco. We find that Airbnb hotspots in San Francisco are persistently present in the city’s northeastern neighborhoods that are part of ethnic enclaves and are located in close proximity to POIs such as museums. Airbnb property densities are comparatively lower in the city core, which is a contrast to the core-periphery pattern of Airbnbs in other cities such as Los Angeles. In San Francisco, the high-density areas are also marked by higher proportions of workers in the hotel and lodging industry, who also have lower median household incomes, pointing to an economic motivation for them to become Airbnb hosts to supplement their incomes.
- (3)
- What are the influences of demographic, socioeconomic, occupational, and social capital factors, proximity to points of interests, and attitudes towards trust and sustainability on host participation in Airbnb’s STR markets in San Francisco?
A conceptual model of host participation in San Francisco’s STR markets posits associations of Airbnb property densities with sixteen demographic, socioeconomic variables, indicators of trust, social capital, and sustainability, along with proximity to POIs. We find that as an aggregate, Airbnb property densities are associated with employment in professional, scientific, technical services, and hotel and lodging employment, proximity to POIs within 20 min of walk time from the centroids of census tracts, and proportion of Asian population. The POI influence is not present for all years for entire homes/apartments and is completely absent for private rooms. Instead, the proportion of owner-occupied households with a mortgage (for entire home/apartment) and median household income (for private room) point to economic motivation of Airbnb hosts to defray the cost of their mortgage payments or generate supplemental income, by renting their properties on Airbnb. These influences are longitudinally consistent over the four-year study period for the most part, and apart from the economic motivations, do not appear to be influenced by the adverse effects of the COVID-19 pandemics on city economies that are reliant on tourism and convention business. These findings have implications for the expansion of STR platforms and increased host participation in such platforms in San Francisco, especially recognizing that cities around the world are tightening regulations to mitigate risks associated with gentrification and the depletion of housing stock exacerbating housing affordability issues.
The study has the following limitations. Due to ecological fallacy, a pitfall of georeferenced data, it remains to be verified if the demographic and socioeconomic associations at the census tract level will hold true for other census and non-census geographies such as zip codes. It is also unclear if this study’s findings are generalizable for other major U.S. and world cities such as New Your City, New York. Furthermore, while the regression models in the study have reasonably high predictive power, the underlying processes and therefore the findings may be impacted by complex and contradictory economic and social effects, such as prolonged mandated social distancing in public places in California during the pandemic, the exodus of technology industry workers from San Francisco due to the pandemic, and growing homeless population and crime in San Francisco’s central city. Additional research is recommended to account for such factors. While the study includes four years of data on the variables, it does not model and analyze the spatial changes in Airbnb densities comparatively over the four years, nor is a longitudinal spatial regression change analysis performed.
Author Contributions
Conceptualization: Avijit Sarkar and James B. Pick; methodology: Avijit Sarkar and James B. Pick; investigation: Avijit Sarkar, Shaista Jabeen, and James B. Pick; data curation: Avijit Sarkar, Shaista Jabeen, and James B. Pick; writing: Avijit Sarkar and James B. Pick; and supervision: Avijit Sarkar and James B. Pick. All authors have read and agreed to the published version of the manuscript.
Funding
The research was funded by internal research grants from School of Business and Society, University of Redlands.
Data Availability Statement
The data presented in this study are available on request from the corresponding author. The data are not publicly available due to their transformation and aggregation at the census tract level for the city of San Francisco.
Conflicts of Interest
The authors declare no conflict of interest.
References
- NTIA. Digital Nation Data Explorer; National Telecommunications and Information Administration: Washington, DC, USA, 2022. Available online: https://www.ntia.gov/other-publication/2022/digital-nation-data-explorer#sel=requestingServicesUser&disp=map (accessed on 19 June 2023).
- Pew Research Center. The State of Gig Work in 2021. Report. December 2021. Available online: https://www.pewresearch.org/internet/2021/12/08/the-state-of-gig-work-in-2021/ (accessed on 15 July 2023).
- Sundararajan, A. The Sharing Economy: The End of Employment and the Rise of Crowd-Based Capitalism; The MIT Press: Cambridge, MA, USA, 2016. [Google Scholar]
- County Board of Supervisors. Policy Analysis Report; City and County of San Francisco Board of Supervisors: San Francisco, CA, USA, 2015; Available online: https://sfbos.org/sites/default/files/FileCenter/Documents/52601-BLA.Short-TermRentals.051315.pdf (accessed on 12 October 2023).
- Adamiak, C. Tourism De-Metropolisation but Not De-Concentration: COVID-19 and World Destinations. ISPRS Int. J. Geo-Inf. 2023, 12, 139. [Google Scholar] [CrossRef]
- Ramani, A.; Bloom, N. The Donut Effect of COVID-19 on Cities (No. w28876). National Bureau of Economic Research. 2021. Available online: https://www.nber.org/papers/w28876 (accessed on 20 July 2023).
- Botsman, R.; Rogers, R. What’s Mine is Yours: The Rise of Collaborative Consumption; HarperCollins: London, UK, 2010. [Google Scholar]
- Hamari, J.; Sjöklint, M.; Ukkonen, A. The sharing economy: Why people participate in collaborative consumption. J. Assoc. Inf. Sci. Technol. 2016, 67, 2047–2059. [Google Scholar] [CrossRef]
- Barnes, S.J.; Mattsson, J. Understanding collaborative consumption: Test of a theoretical model. Technol. Forecast. Soc. Chang. 2017, 118, 281–292. [Google Scholar] [CrossRef]
- Guttentag, D. Airbnb: Disruptive innovation and the rise of an informal tourism accommodation sector. Curr. Issues Tour. 2015, 18, 1192–1217. [Google Scholar] [CrossRef]
- Lee, Z.W.; Chan, T.K.; Balaji, M.S.; Chong, A.Y.L. Why people participate in the sharing economy: An empirical investigation of Uber. Internet Res. 2018, 28, 829–850. [Google Scholar] [CrossRef]
- Möhlmann, M. Collaborative consumption: Determinants of satisfaction and the likelihood of using a sharing economy option again. J. Consum. Behav. 2015, 14, 193–207. [Google Scholar] [CrossRef]
- Sthapit, E.; Jiménez-Barreto, J. Sharing in the host–guest relationship: Perspectives on the Airbnb hospitality experience. Anatolia 2018, 29, 282–284. [Google Scholar] [CrossRef]
- Ladegaard, I. Hosting the comfortably exotic: Cosmopolitan aspirations in the sharing economy. Soc. Rev. 2018, 66, 381–400. [Google Scholar] [CrossRef]
- Visser, G.; Erasmus, I.; Miller, M. Airbnb: The emergence of a new accommodation type in Cape Town, South Africa. Tour. Rev. Int. 2017, 21, 151–168. [Google Scholar] [CrossRef]
- Bocker, L.; Meelen, T. Sharing for people, planet or profit? Analyzing motivations for intended sharing economy participation. Environ. Innov. Soc. Transit. 2017, 23, 28–39. [Google Scholar] [CrossRef]
- Willems, M.P.; Henkel, S.; Falk, T. To earn is not enough: A means-end analysis to uncover peer-providers’ participation motives in peer-to-peer carsharing. Technol. Forecast. Soc. Chang. 2017, 125, 38–47. [Google Scholar] [CrossRef]
- Kim, S.; Lee, K.Y.; Koo, C.; Yang, S.-B. Examining the influencing factors of intention to share accommodations in online hospitality exchange networks. J. Travel Tour. Mark. 2018, 35, 16–31. [Google Scholar] [CrossRef]
- Wang, Y.; Asaad, Y.; Filieri, R. What makes hosts trust Airbnb? Antecedents of hosts’ trust toward Airbnb and its impact on continuance intention. J. Travel Res. 2020, 59, 686–703. [Google Scholar] [CrossRef]
- Jiang, J.; Feng, R.; Li, E.Y. Uncovering the providers’ continuance intention of participation in the sharing economy: A moderated mediation model. Sustainability 2021, 1, 5095. [Google Scholar] [CrossRef]
- Coles, P.; Eesdal, M.; Elle, L.; Li, X.; Sundararajan, A. Airbnb usage across New York City Neighborhoods: Geographic Patterns and Regulatory Implications. In The Cambridge Handbook of the Law of the Sharing Economy; Cambridge Law Handbooks; Davidson, J., Finck, J., Infranca, I., Eds.; Cambridge University Press: Cambridge, UK, 2018; pp. 108–128. [Google Scholar] [CrossRef]
- Dudás, G.; Vida, G.; Kovalcsik, T.; Boros, L. A socio-economic analysis of Airbnb in New York City. Reg. Sta. 2017, 7, 135–151. [Google Scholar] [CrossRef]
- Sarkar, A.; Koohikamali, M.; Pick, J.B. Spatial and socioeconomic analysis of host participation in the shard accommodation economy—Airbnb in New York City. Inf. Technol. People 2020, 33, 983–1009. [Google Scholar] [CrossRef]
- Sarkar, A.; Koohikamali, M.; Pick, J.B. Spatiotemporal patterns and socioeconomic dimensions of shared accommodations: The case of Airbnb in Los Angeles, California. In ISPRS Annals of Photogrammetry, Remote Sensing and Spatial Information Sciences, Volume IV-4/W2: Proceedings of the 2nd International Symposium on Spatiotemporal Computing, Cambridge, MA, USA, 7–9 August 2017; ISPRS: Bethesda, MD, USA, 2017; pp. 107–114. [Google Scholar]
- Zhang, Z.; Fu, R.J. Spatial Distribution of Airbnb Supply in Los Angeles. Tour. Anal. 2022, 27, 467–477. [Google Scholar] [CrossRef]
- Gunter, U. What makes an Airbnb host a superhost? Empirical evidence from San Francisco and the Bay Area. Tour. Manag. 2018, 66, 26–37. [Google Scholar] [CrossRef]
- Thackway, W.T.; Ng, M.K.M.; Lee, C.L.; Shi, V.; Pettit, C.J. Spatial variability of the ‘Airbnb effect’: A spatially explicit analysis of Airbnb’s impact on housing prices in Sydney. ISPRS Int. J. Geo-Inf. 2022, 11, 65. [Google Scholar] [CrossRef]
- Adamiak, C.; Szyda, B.; Dubownik, A.; García-Álvarez, D. Airbnb offer in Spain—Spatial analysis of the pattern and determinants of its distribution. ISPRS Int. J. Geo-Inf. 2019, 8, 155. [Google Scholar] [CrossRef]
- Sun, S.; Zhang, S.; Wang, X. Characteristics and influencing factors of Airbnb spatial distribution in China’s rapid urbanization process: A case study of Nanjing. PLoS ONE 2021, 16, e0248647. [Google Scholar] [CrossRef] [PubMed]
- Chamizo-Nieto, F.J.; de Salazar, N.N.-G.; Rosa-Jiménez, C.; Reyes-Corredera, S. Indicators for measuring tourism intensification in urban areas through their associative network: Case studies from the Spanish Mediterranean coast. Europ. J. Tourism Res. 2022, 32, 3202. [Google Scholar] [CrossRef]
- Chamizo-Nieto, F.J.; de Salazar, N.N.-G.; Rosa-Jiménez, C.; Reyes-Corredera, S. Touristification and conflicts of interest in cruise destinations: The case of main cultural tourism cities on the Spanish Mediterranean Coast. Sustainability 2023, 15, 6403. [Google Scholar] [CrossRef]
- Garcia-Ayllon, S. Urban transformations as an indicator of sustainability in the P2P mass tourism phenomenon: The Airbnb case in Spain through three case studies. Sustainability 2018, 10, 2933. [Google Scholar] [CrossRef]
- Lagonigro, R.; Martori, J.C.; Apparicio, P. Understanding Airbnb spatial distribution in a southern European city: The case of Barcelona. Appl. Geogr. 2020, 115, 102136. [Google Scholar] [CrossRef]
- Pick, J.B.; Sarkar, A. Theories of the digital divide: Critical comparison. In Proceedings of the 49th Hawaii International Conference on System Sciences (HICSS), Koloa, HI, USA, 5–8 January 2016; IEEE Computer Society: Washington, DC, USA, 2016; pp. 3888–3897. [Google Scholar]
- Pick, J.B.; Nishida, T. Digital divides in the world and its regions: A spatial and multivariate analysis of technological utilization. Technol. Forecast. Soc. Chang. 2015, 91, 1–17. [Google Scholar] [CrossRef]
- Pick, J.B.; Sarkar, A.; Johnson, J. United States digital divide: State level analysis of spatial clustering and multivariate determinants of ICT utilization. Socio-Econ. Plan. Sci. 2015, 49, 16–32. [Google Scholar] [CrossRef]
- Ramadhanti, H.D.; Astuti, E.T. Digital divide and a spatial investigation of convergence in ICT development across provinces in Indonesia. J. Stat. Appl. Comput. Stat. Spec. Ed. 2020, 12, 69–83. [Google Scholar] [CrossRef]
- Myovella, G.; Karachuka, M.; Haucap, J. Determinants of digitalization and digital divide in Sub-Saharan African economies: A spatial Durbin analysis. Telecommun. Policy 2021, 45, 102224. [Google Scholar] [CrossRef]
- Ntim, S. COVID-19 Pandemic and disparity in household adaptations to school lockdown: Redressing the myth of educational equality. Int. J. Educ. 2022, 14, 37. [Google Scholar] [CrossRef]
- Pick, J.B.; Sarkar, S.; Rosales, J. A Spatial and regression analysis of social media in the United States Counties. Int. J. Geo-Inf. 2019, 8, 424. [Google Scholar] [CrossRef]
- United States Census. Population Estimates, San Francisco City, San Francisco County, California; US Census: Washington, DC, USA, 2023. Available online: https://www.census.gov/quickfacts/fact/table/sanfranciscocitycalifornia,US/PST045222 (accessed on 25 November 2023).
- Garha, N.S.; Azevedo, A.B. Geography of Airbnb in Barcelona and Lisbon: A comparative study. Finisterra 2021, 56, 151–173. [Google Scholar]
- Alizadeh, T.; Farid, R.; Sarkar, S. Towards understanding the socio-economic patterns of sharing economy in Australia: An investigation of Airbnb listings in Sydney and Melbourne metropolitan regions. Urban Policy Res. 2018, 36, 445–463. [Google Scholar] [CrossRef]
- Putnam, R. Bowling Alone: The Collapse and Revival of American Community, 1st ed.; Simon and Schuster: New York, NY, USA, 2001. [Google Scholar]
- Botsman, R. Who Can You Trust? How Technology Brought Us Together, and Why It Could Drive Us Apart; Hachette Book Group: New York, NY, USA, 2017. [Google Scholar]
- Anselin, L. Local indicators of spatial association—LISA. Geogr. Anal. 1995, 27, 93–115. [Google Scholar] [CrossRef]
- Gutiérrez, J.; García-Palomares, J.C.; Romanillos, G.; Salas-Olmedo, M.H. The eruption of Airbnb in tourist cities: Comparing spatial patterns of hotels and peer-to-peer accommodation in Barcelona. Tour. Manag. 2017, 62, 278–291. [Google Scholar] [CrossRef]
- Bureau of Labor Statistics. Industries at a Glance, Professional, Scientific, and Technical Services: NAICS 54. 2023. Available online: https://www.bls.gov/iag/tgs/iag54.htm (accessed on 15 August 2023).
- Li, H.; Srinivasan, K. Competitive dynamics in the sharing economy: An analysis in the context of Airbnb and hotels. Mark. Sci. 2019, 38, 365–391. [Google Scholar] [CrossRef]
- Gilheany, J.; Wang, D.; Xi, S. The Model Minority? Not on Airbnb.com: A Hedonic Pricing Model to Quantify Racial Bias Against Asian Americans. Technol. Sci. 2015. Available online: https://techscience.org/a/2015090104/ (accessed on 21 July 2023).
- Franco, J.; Kaker, V.; Voetz, I.; Wu, J. Effects of Host Race Information on Airbnb Listing Prices in San Francisco. MPRA Paper No. 69974. 2016. Available online: https://mpra.ub.uni-muenchen.de/69974/ (accessed on 6 July 2023).
- Edelman, B.G.; Luca, J. Digital Discrimination: The Case of Airbnb.com. In Harvard Business School NOM Unit Working Paper; Harvard Business School: Boston, MA, USA, 2014; p. 14-054. [Google Scholar]
- Kakar, V.; Voelz, J.; Wu, J.; Franco, J. The visible host: Does race guide Airbnb rental rates in San Francisco? J. Hous. Econ. 2018, 40, 25–40. [Google Scholar] [CrossRef]
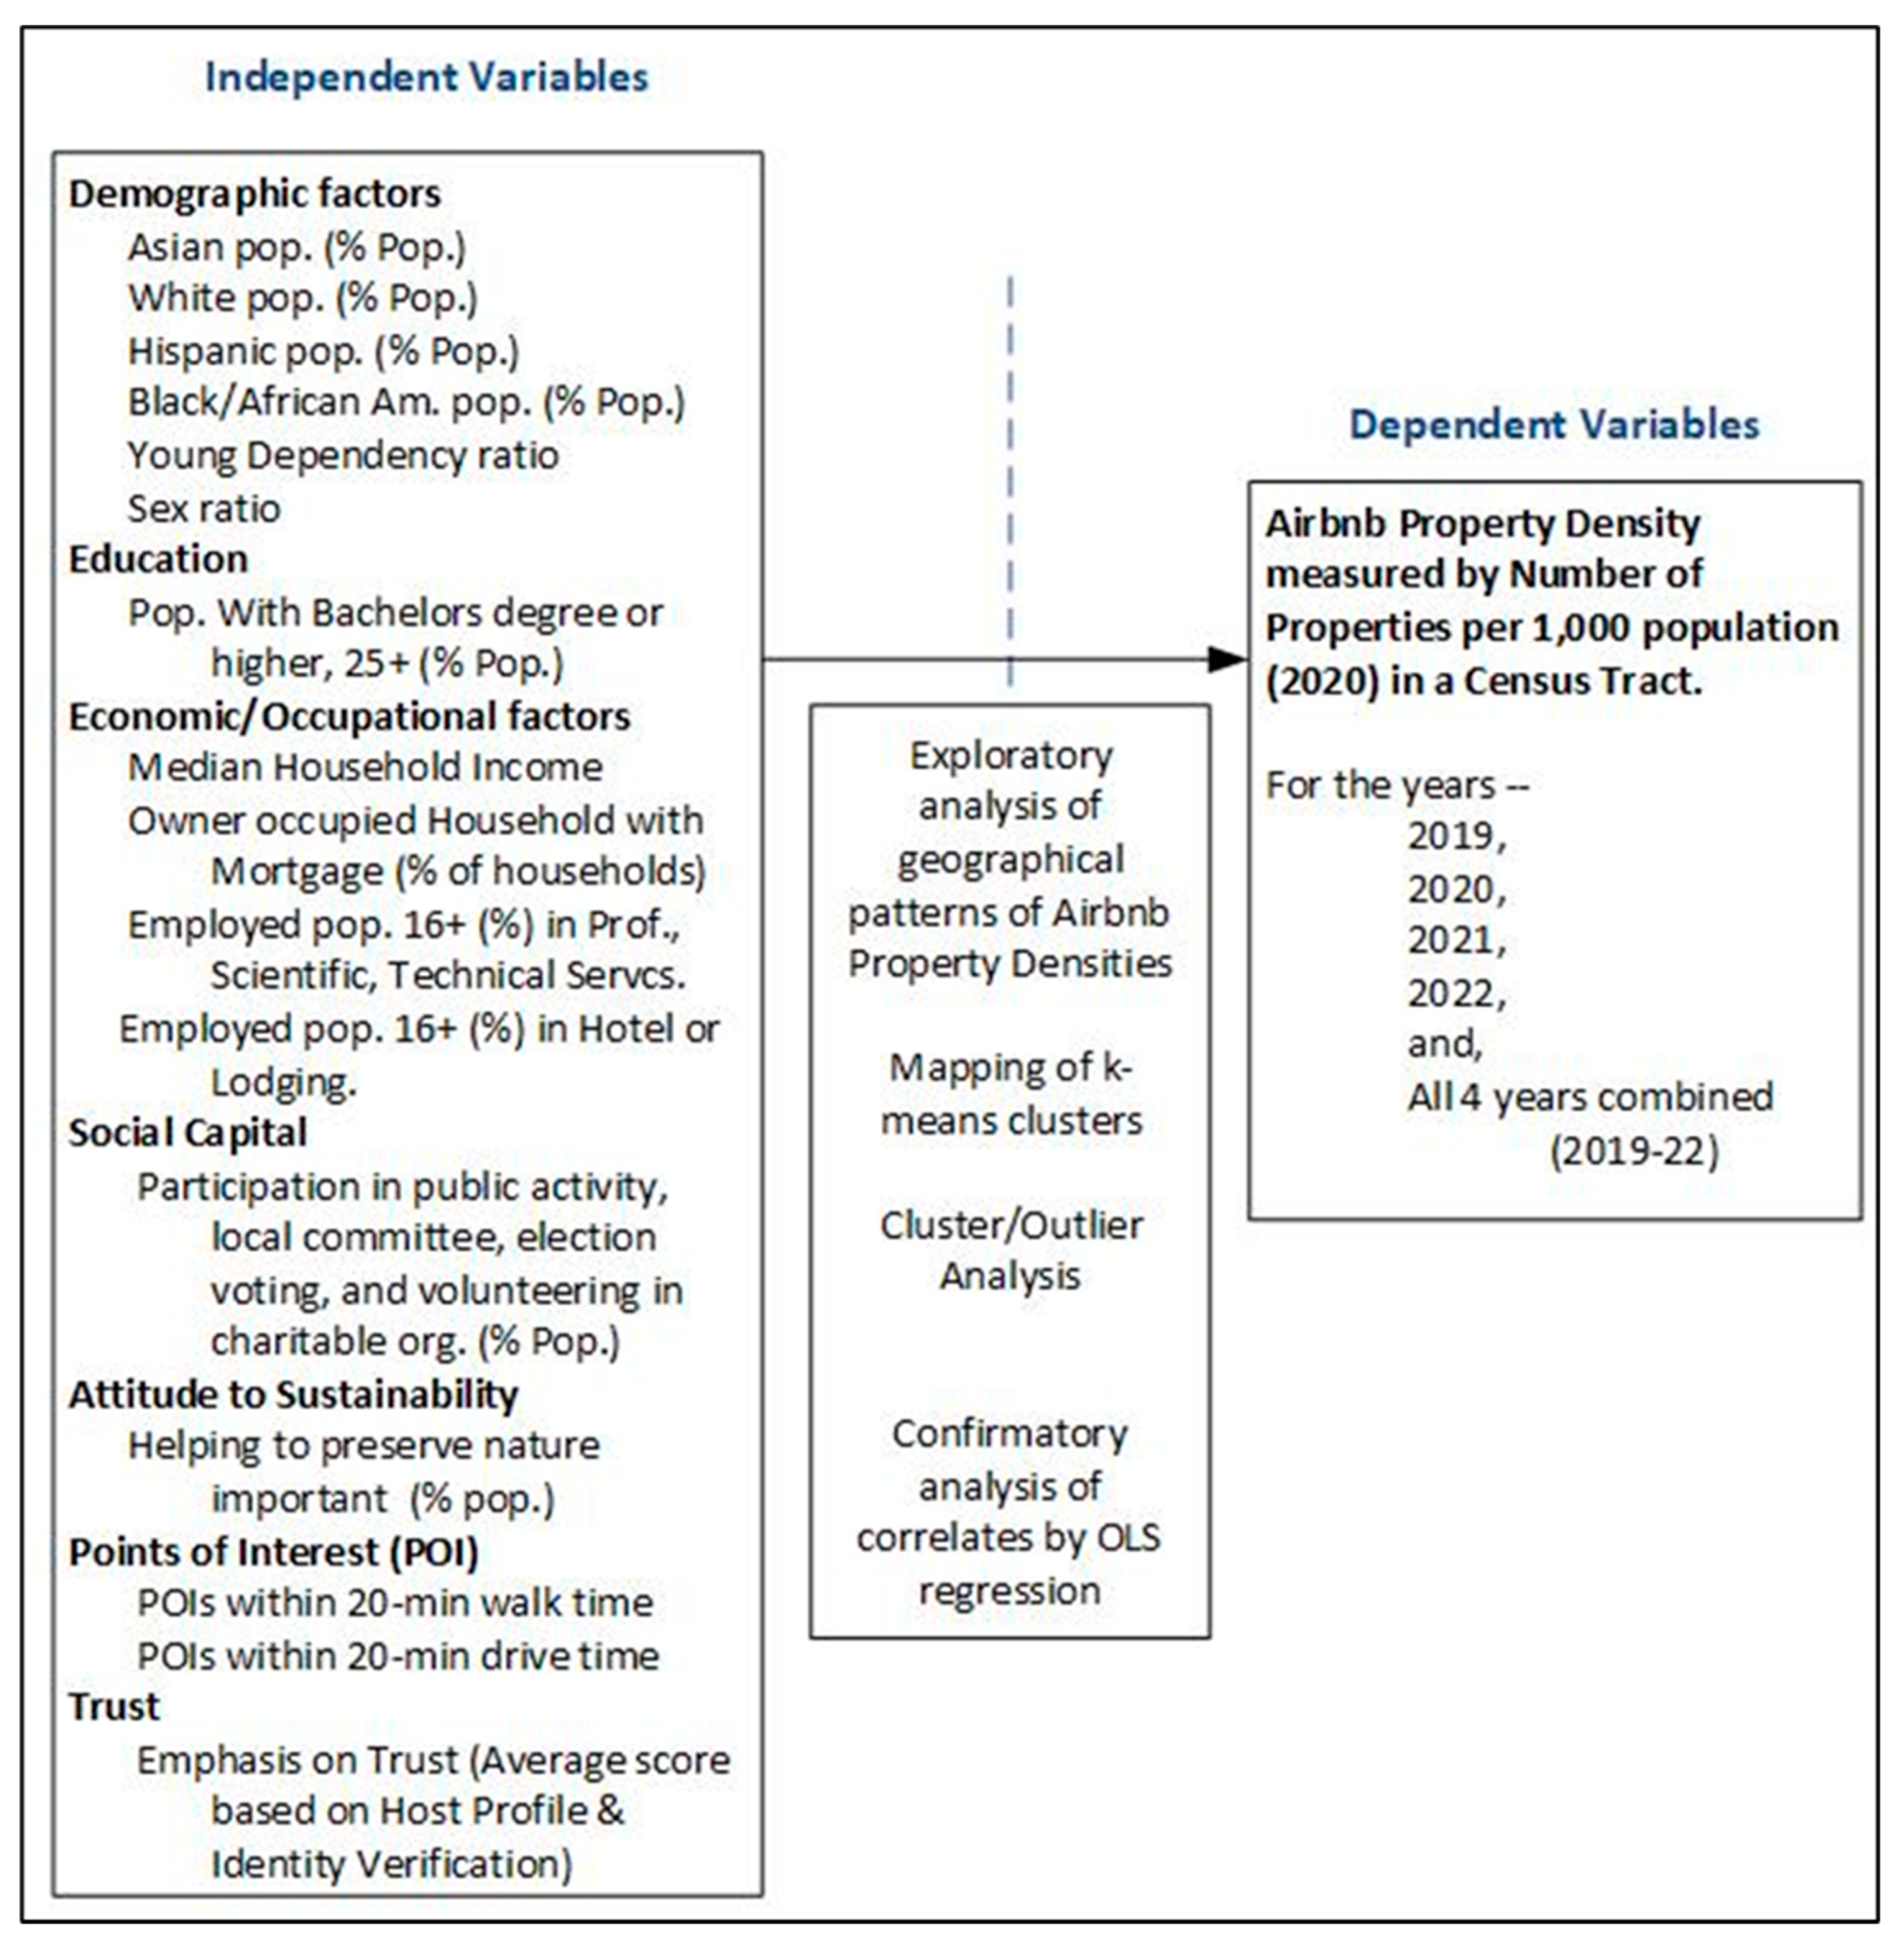
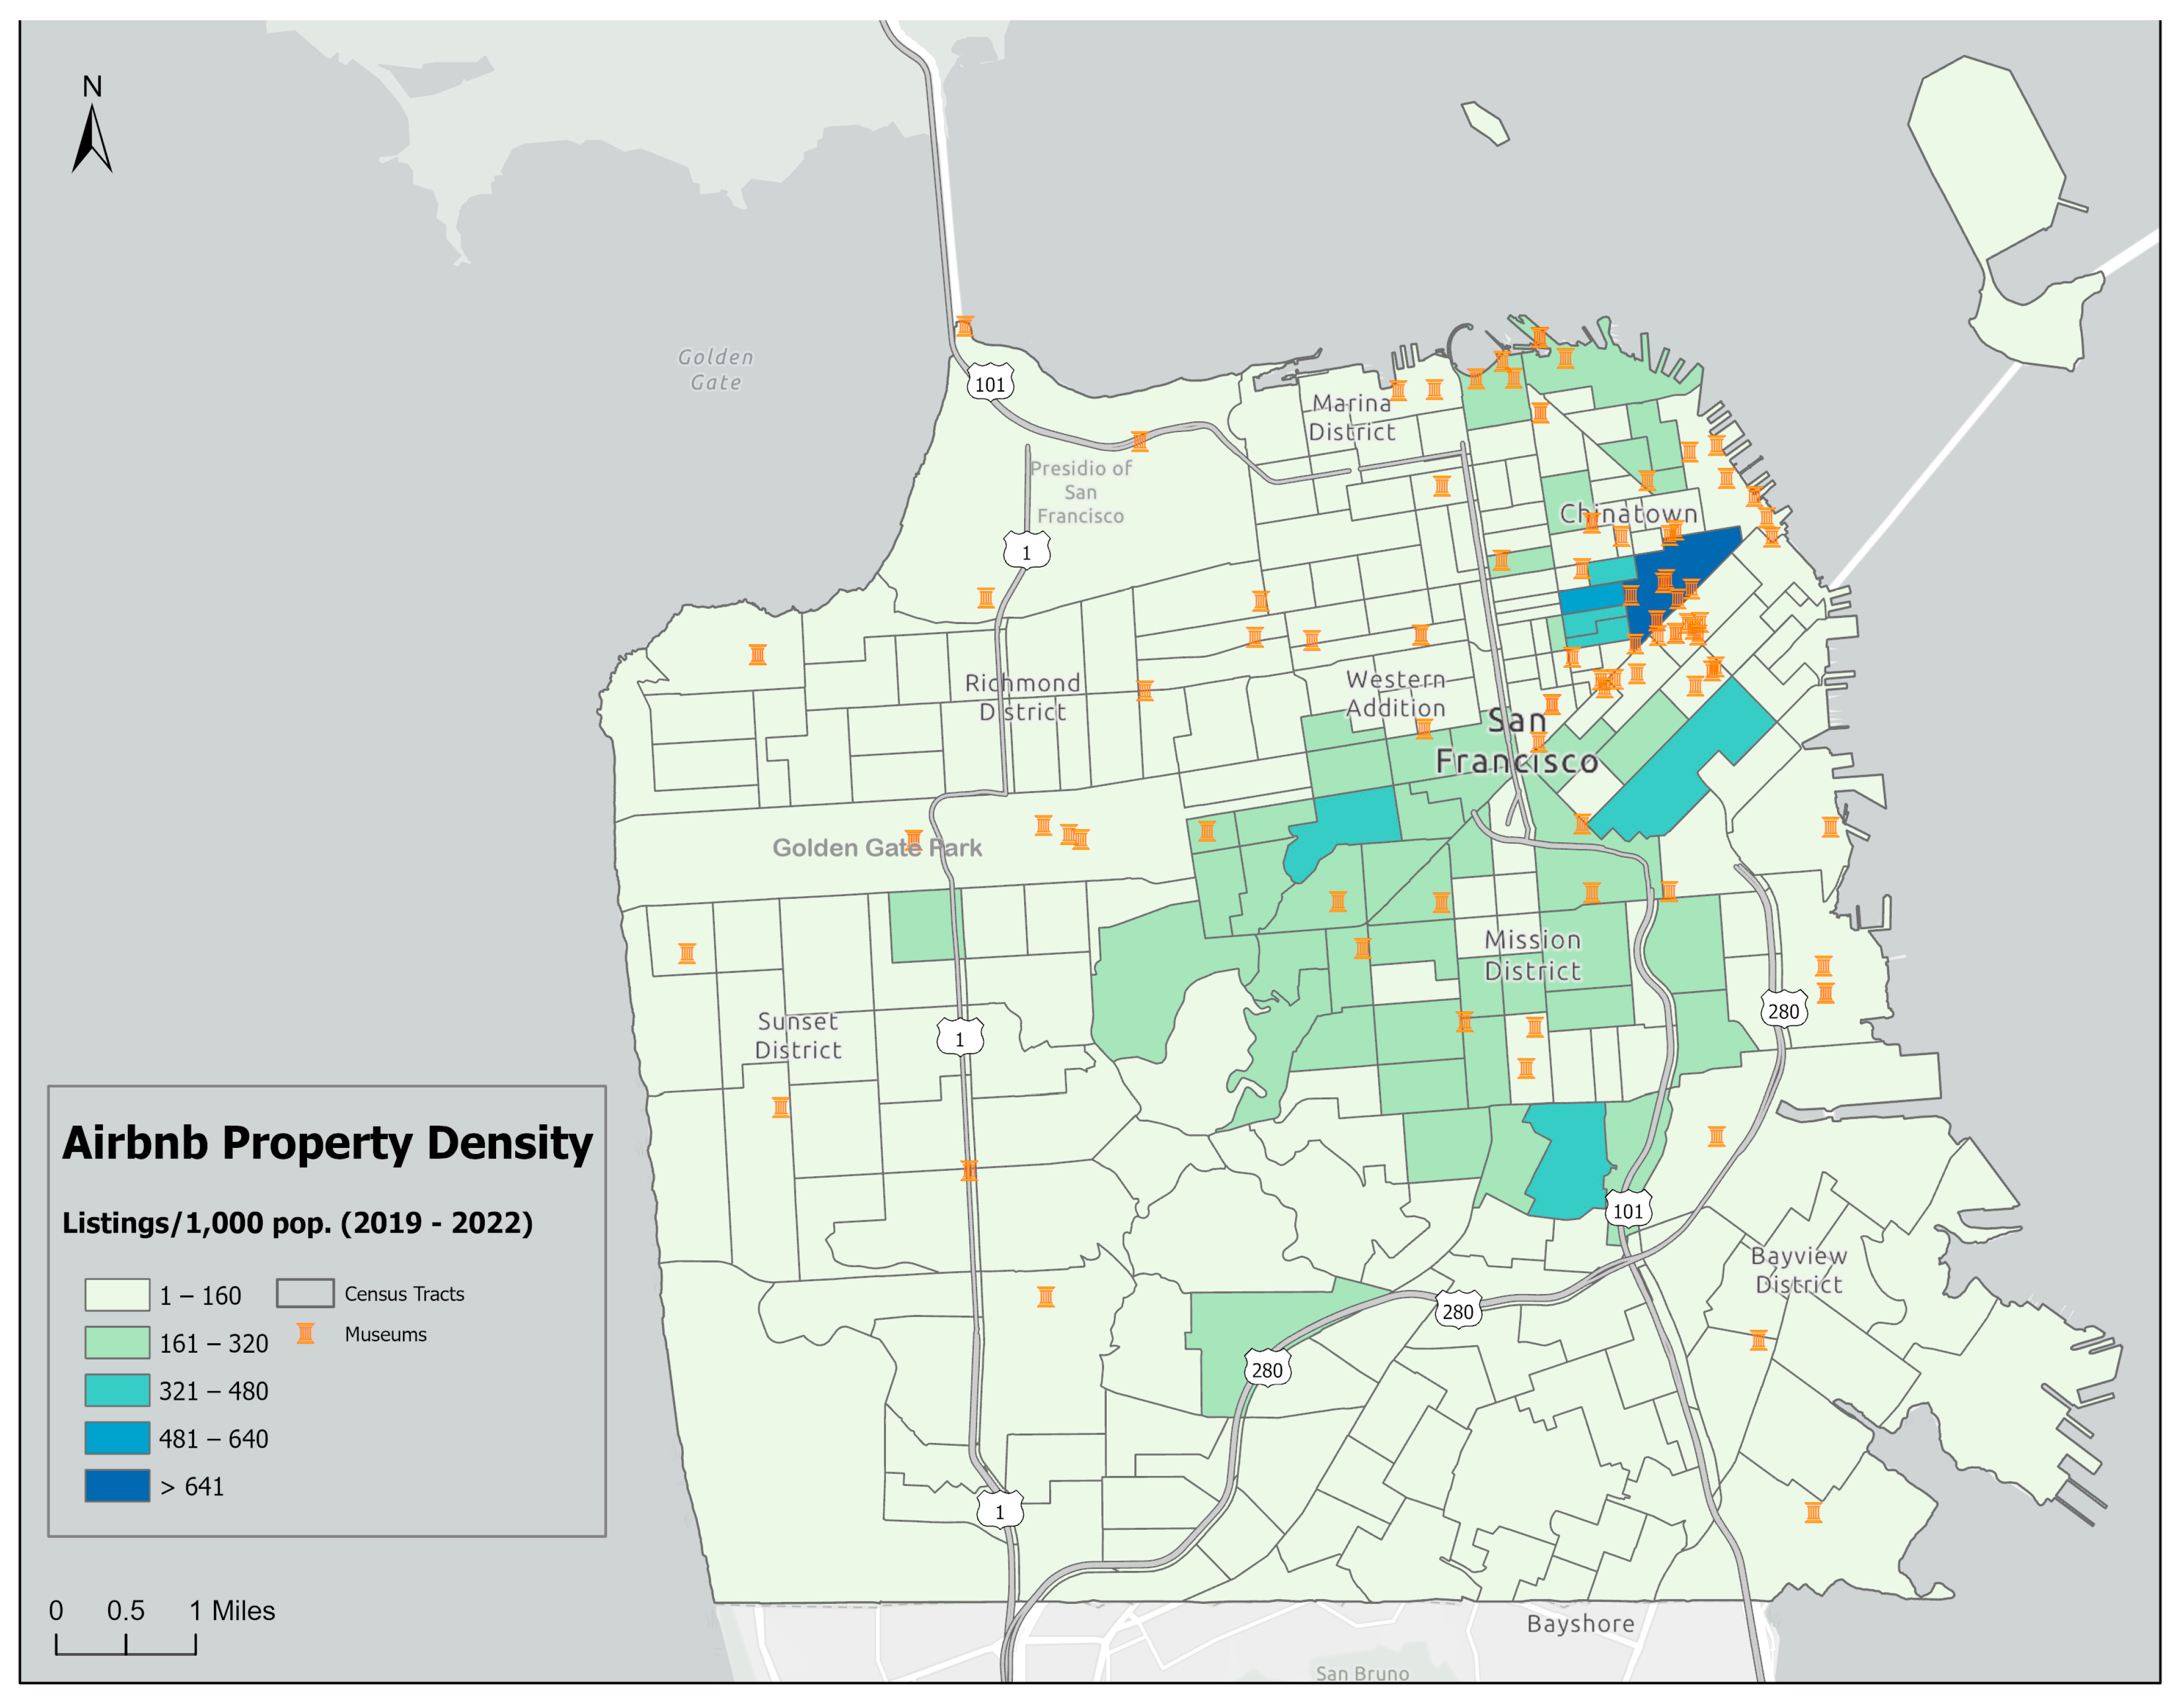
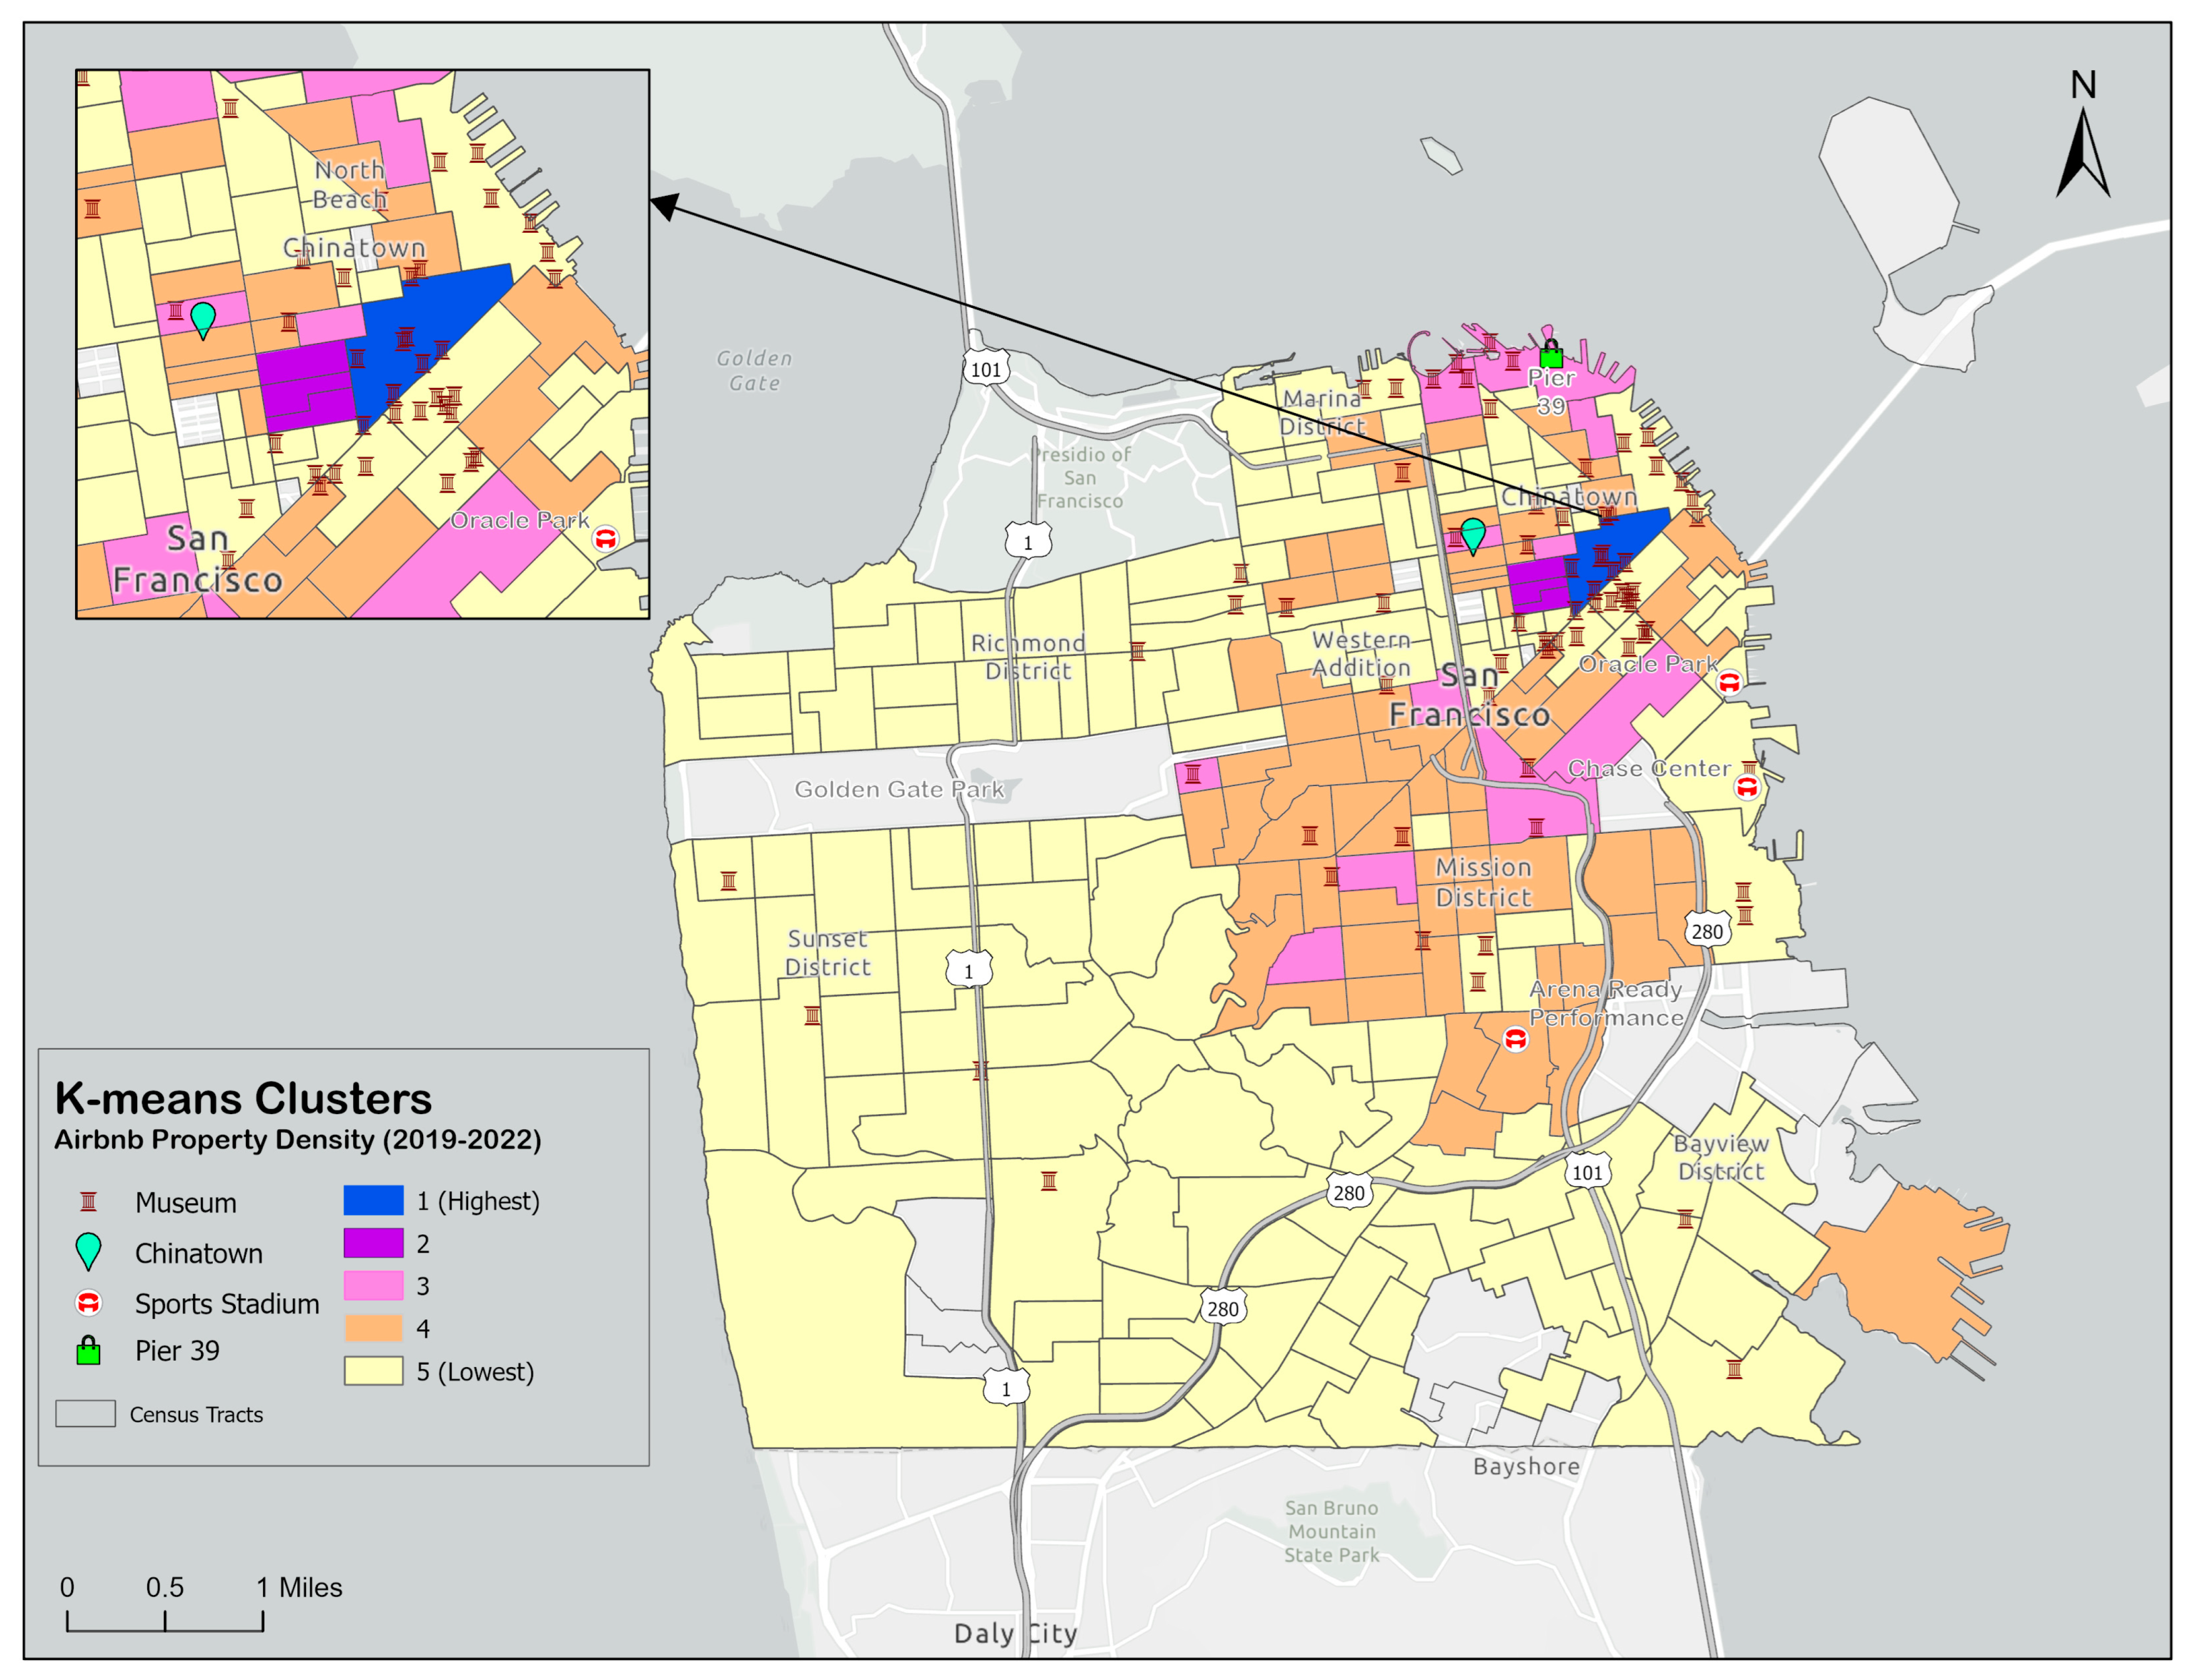
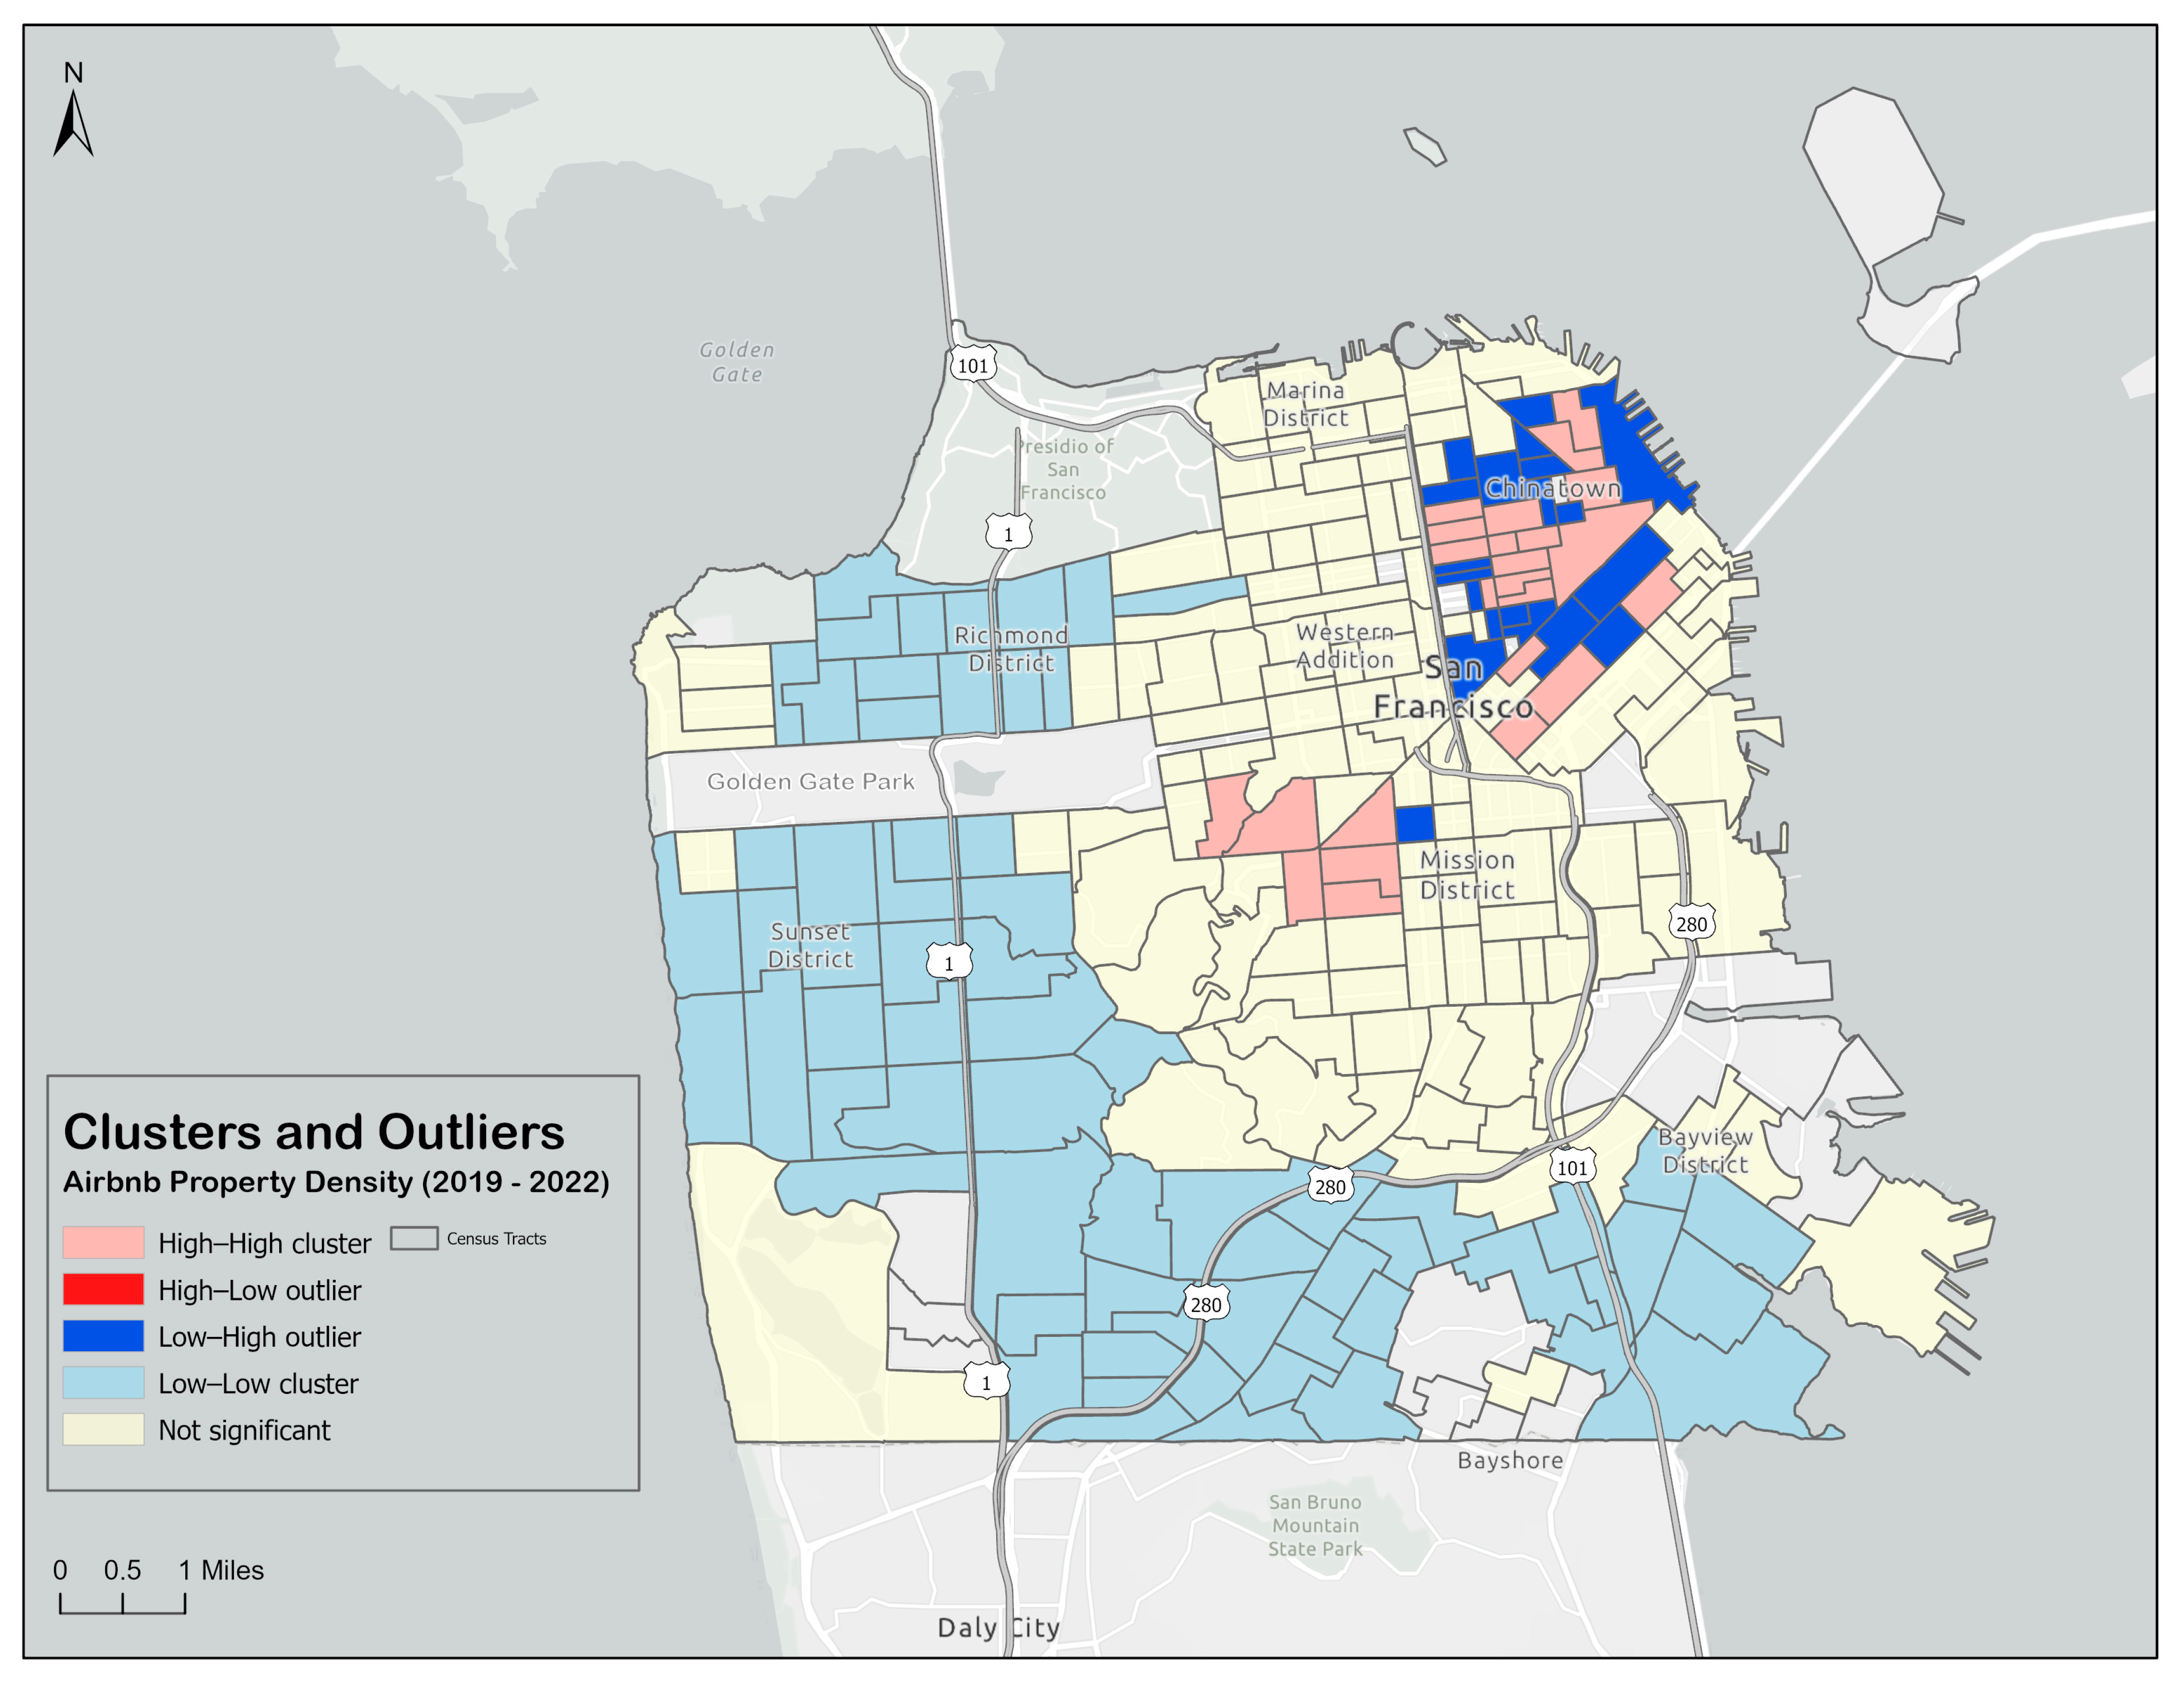
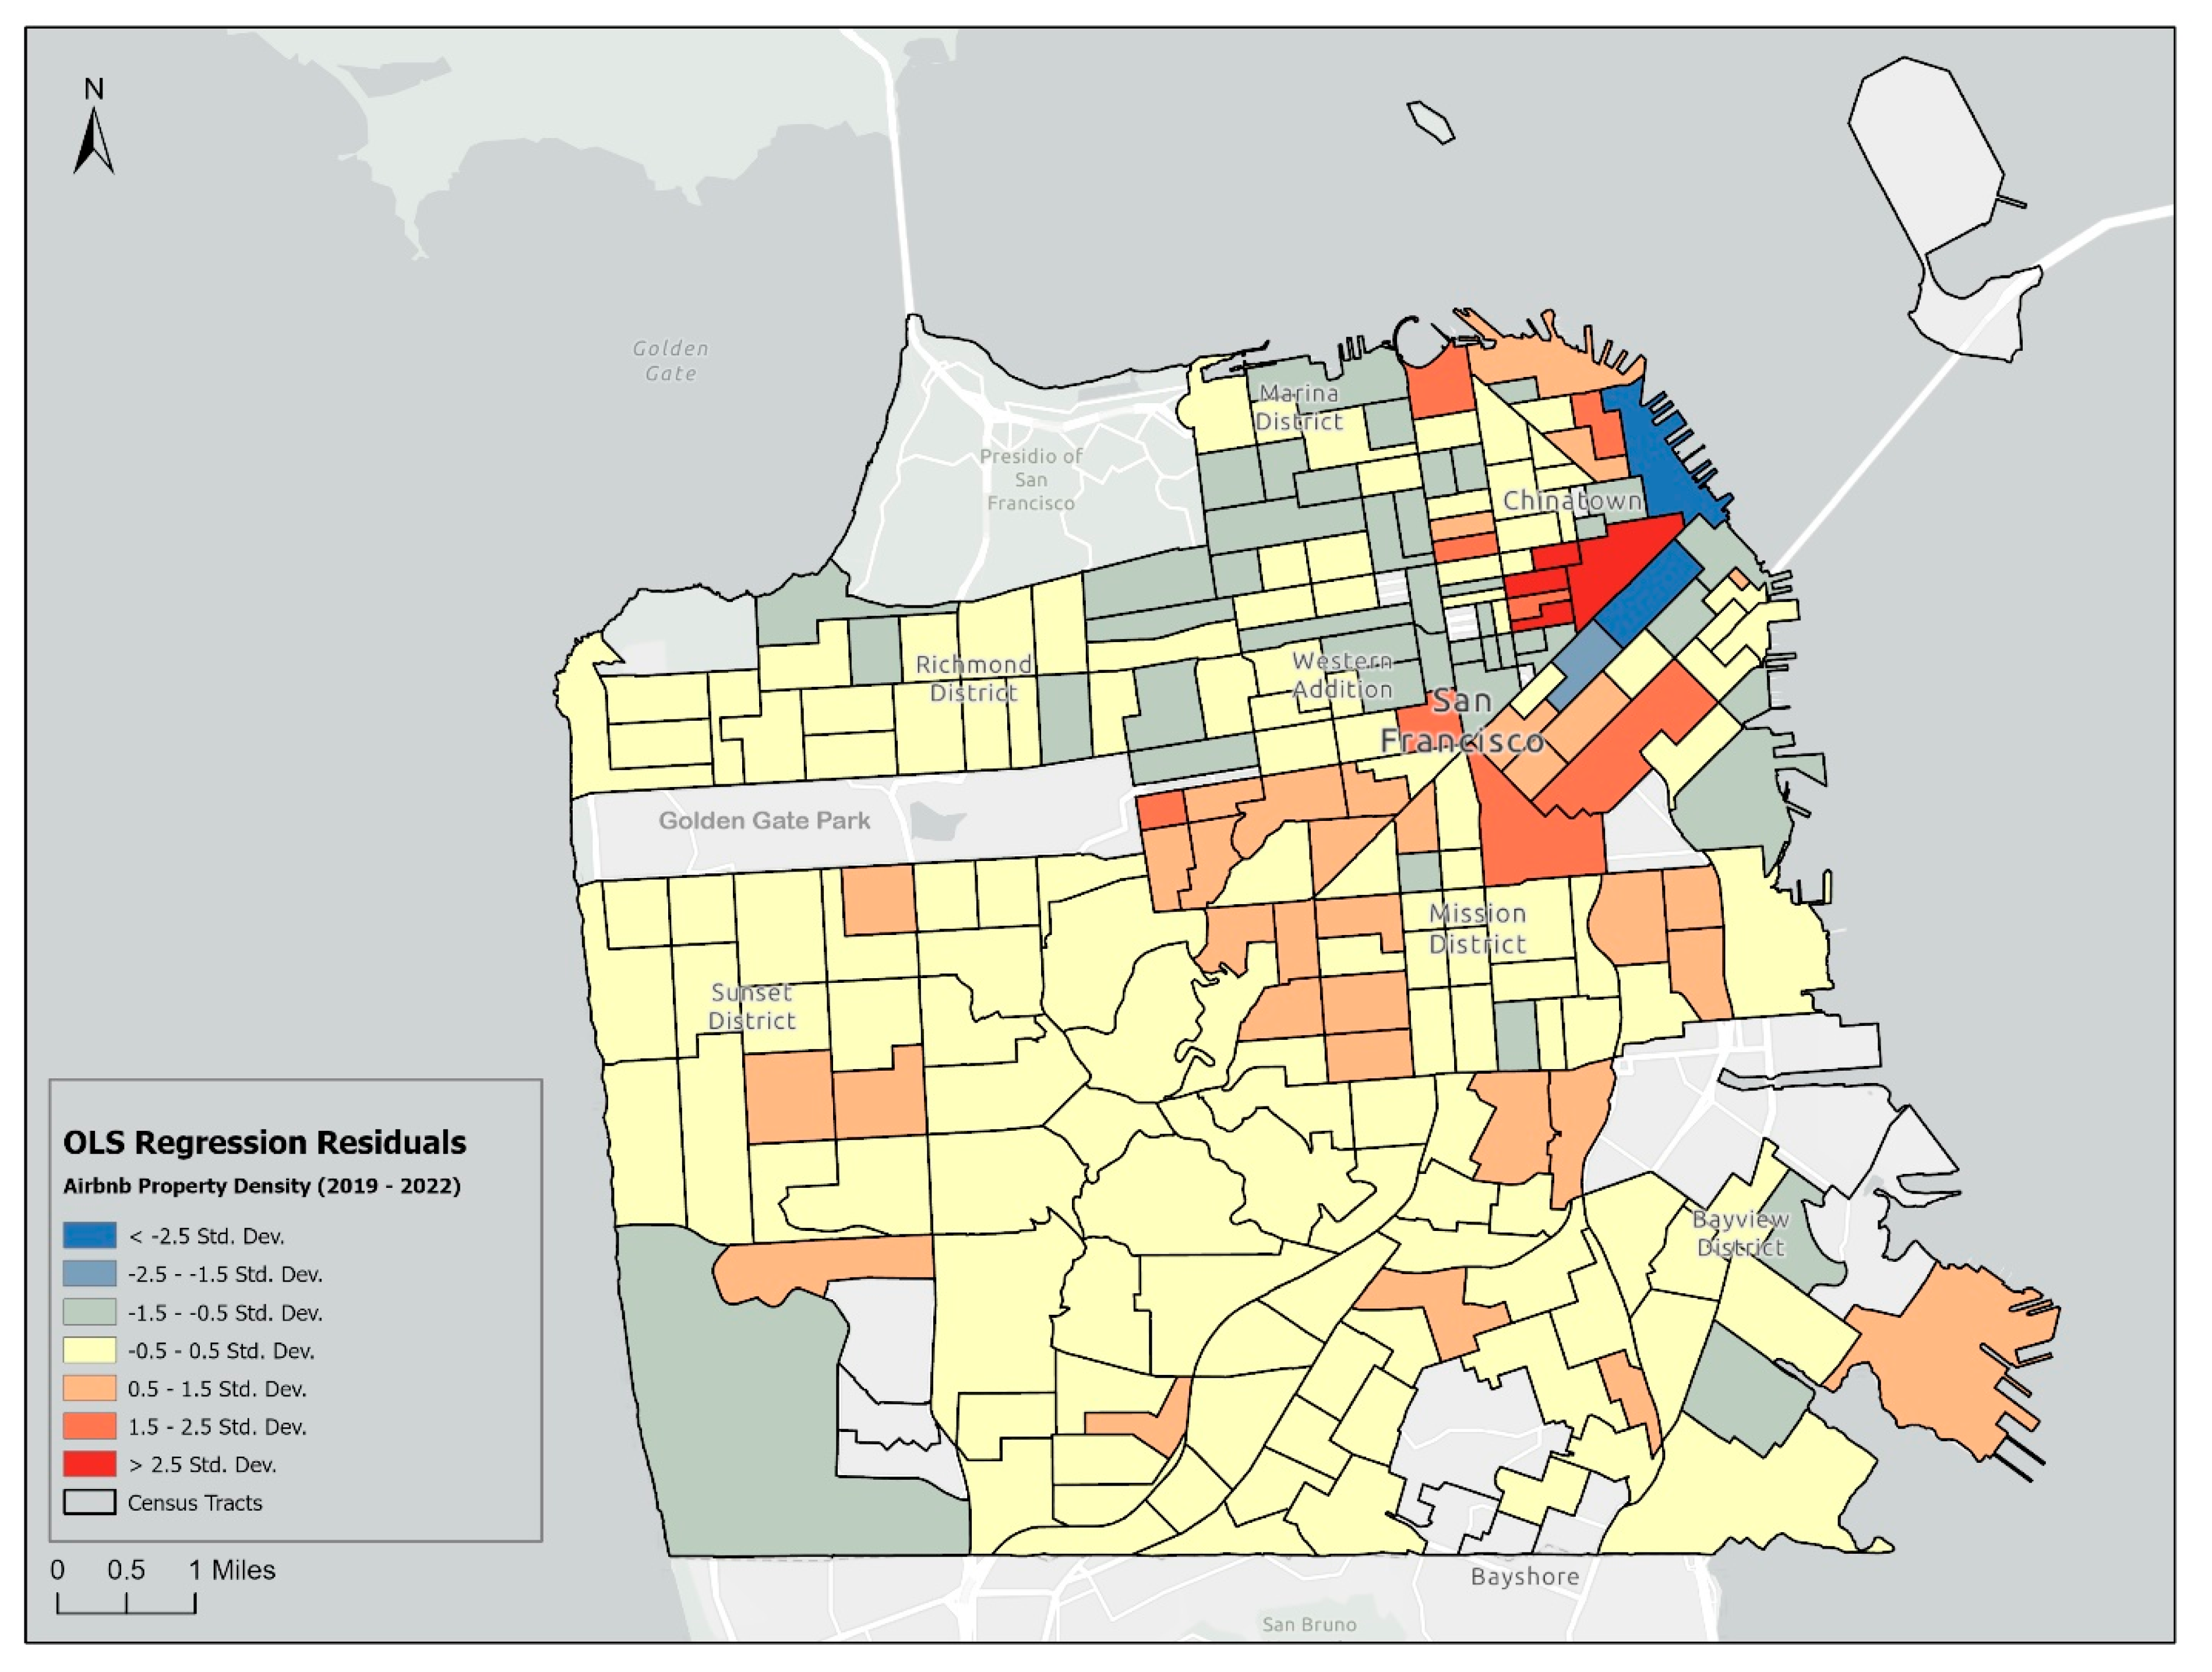
Disclaimer/Publisher’s Note: The statements, opinions and data contained in all publications are solely those of the individual author(s) and contributor(s) and not of MDPI and/or the editor(s). MDPI and/or the editor(s) disclaim responsibility for any injury to people or property resulting from any ideas, methods, instructions or products referred to in the content. |
© 2023 by the authors. Licensee MDPI, Basel, Switzerland. This article is an open access article distributed under the terms and conditions of the Creative Commons Attribution (CC BY) license (https://creativecommons.org/licenses/by/4.0/).