1. Introduction
Population aging is occurring in countries worldwide [
1,
2], especially in urban areas [
3,
4,
5]. According to the World Population Prospects Report, an estimated 10% of the global population was aged 65 or above in 2022, and it is projected to increase to 16% by 2050 [
6]. The increasing population aging trend highlights the need to build age-friendly living spaces in urban areas [
7,
8]. Cities such as Paris, Milan, Beijing, and Shanghai have successively promoted plans for convenient cities to ensure that daily necessities are available within a 15 min walk or bike ride from home [
9,
10,
11,
12,
13]. Communities represent the basic units of cities and the most closely related space to people’s daily lives, especially for retired elderly individuals [
14,
15]. Therefore, creating an accessible living circle for senior citizens within the community is critical to enhancing the age-friendliness of the community [
16].
Establishing and renovating elder-friendly facilities is crucial to creating a comprehensive community living circle for senior citizens [
17]. Among these facilities, senior-friendly restaurants play a vital role in providing essential daily meals for seniors. A senior-friendly restaurant is a dining place designed to meet older adults’ preferences and needs. This is achieved through the provision of, for example, a diverse, health-oriented menu for seniors, discounts for older people, and amenities that are tailored to their needs. As seniors’ mobility slows with age, cooking at home becomes difficult and hazardous [
18]. As a result, cooking three meals a day becomes a heavy burden [
19]. Therefore, as one of the much-needed elderly services in the community living circle, senior-friendly restaurants are established as an effective solution to address this issue.
Location plays a pivotal role in determining the utilization of senior-friendly restaurants. However, identifying the optimal locations for these restaurants within a community is challenging. The criteria for choosing these optimal locations are complex, requiring careful consideration of service equality and convenience. Furthermore, modeling service equality and convenience and determining the ideal location requires interdisciplinary collaboration encompassing fields such as geography, urban planning, and operations research [
20].
Senior-friendly restaurants should provide equal services to all community residents, and the reasons for this are outlined as follows. Whether operated in nonprofit or for-profit modes, a senior-friendly restaurant might receive substantial government funding during its operation [
21]. Nonprofit senior-friendly restaurants, typically established by local governments, often synergize with elderly care centers to provide diverse care services for seniors. For-profit senior-friendly restaurants, on the other hand, may offer a special menu at discounted rates for senior customers [
22] while catering to other demographic groups within the community. These establishments receive governmental subsidies for the meals provided to seniors [
19].
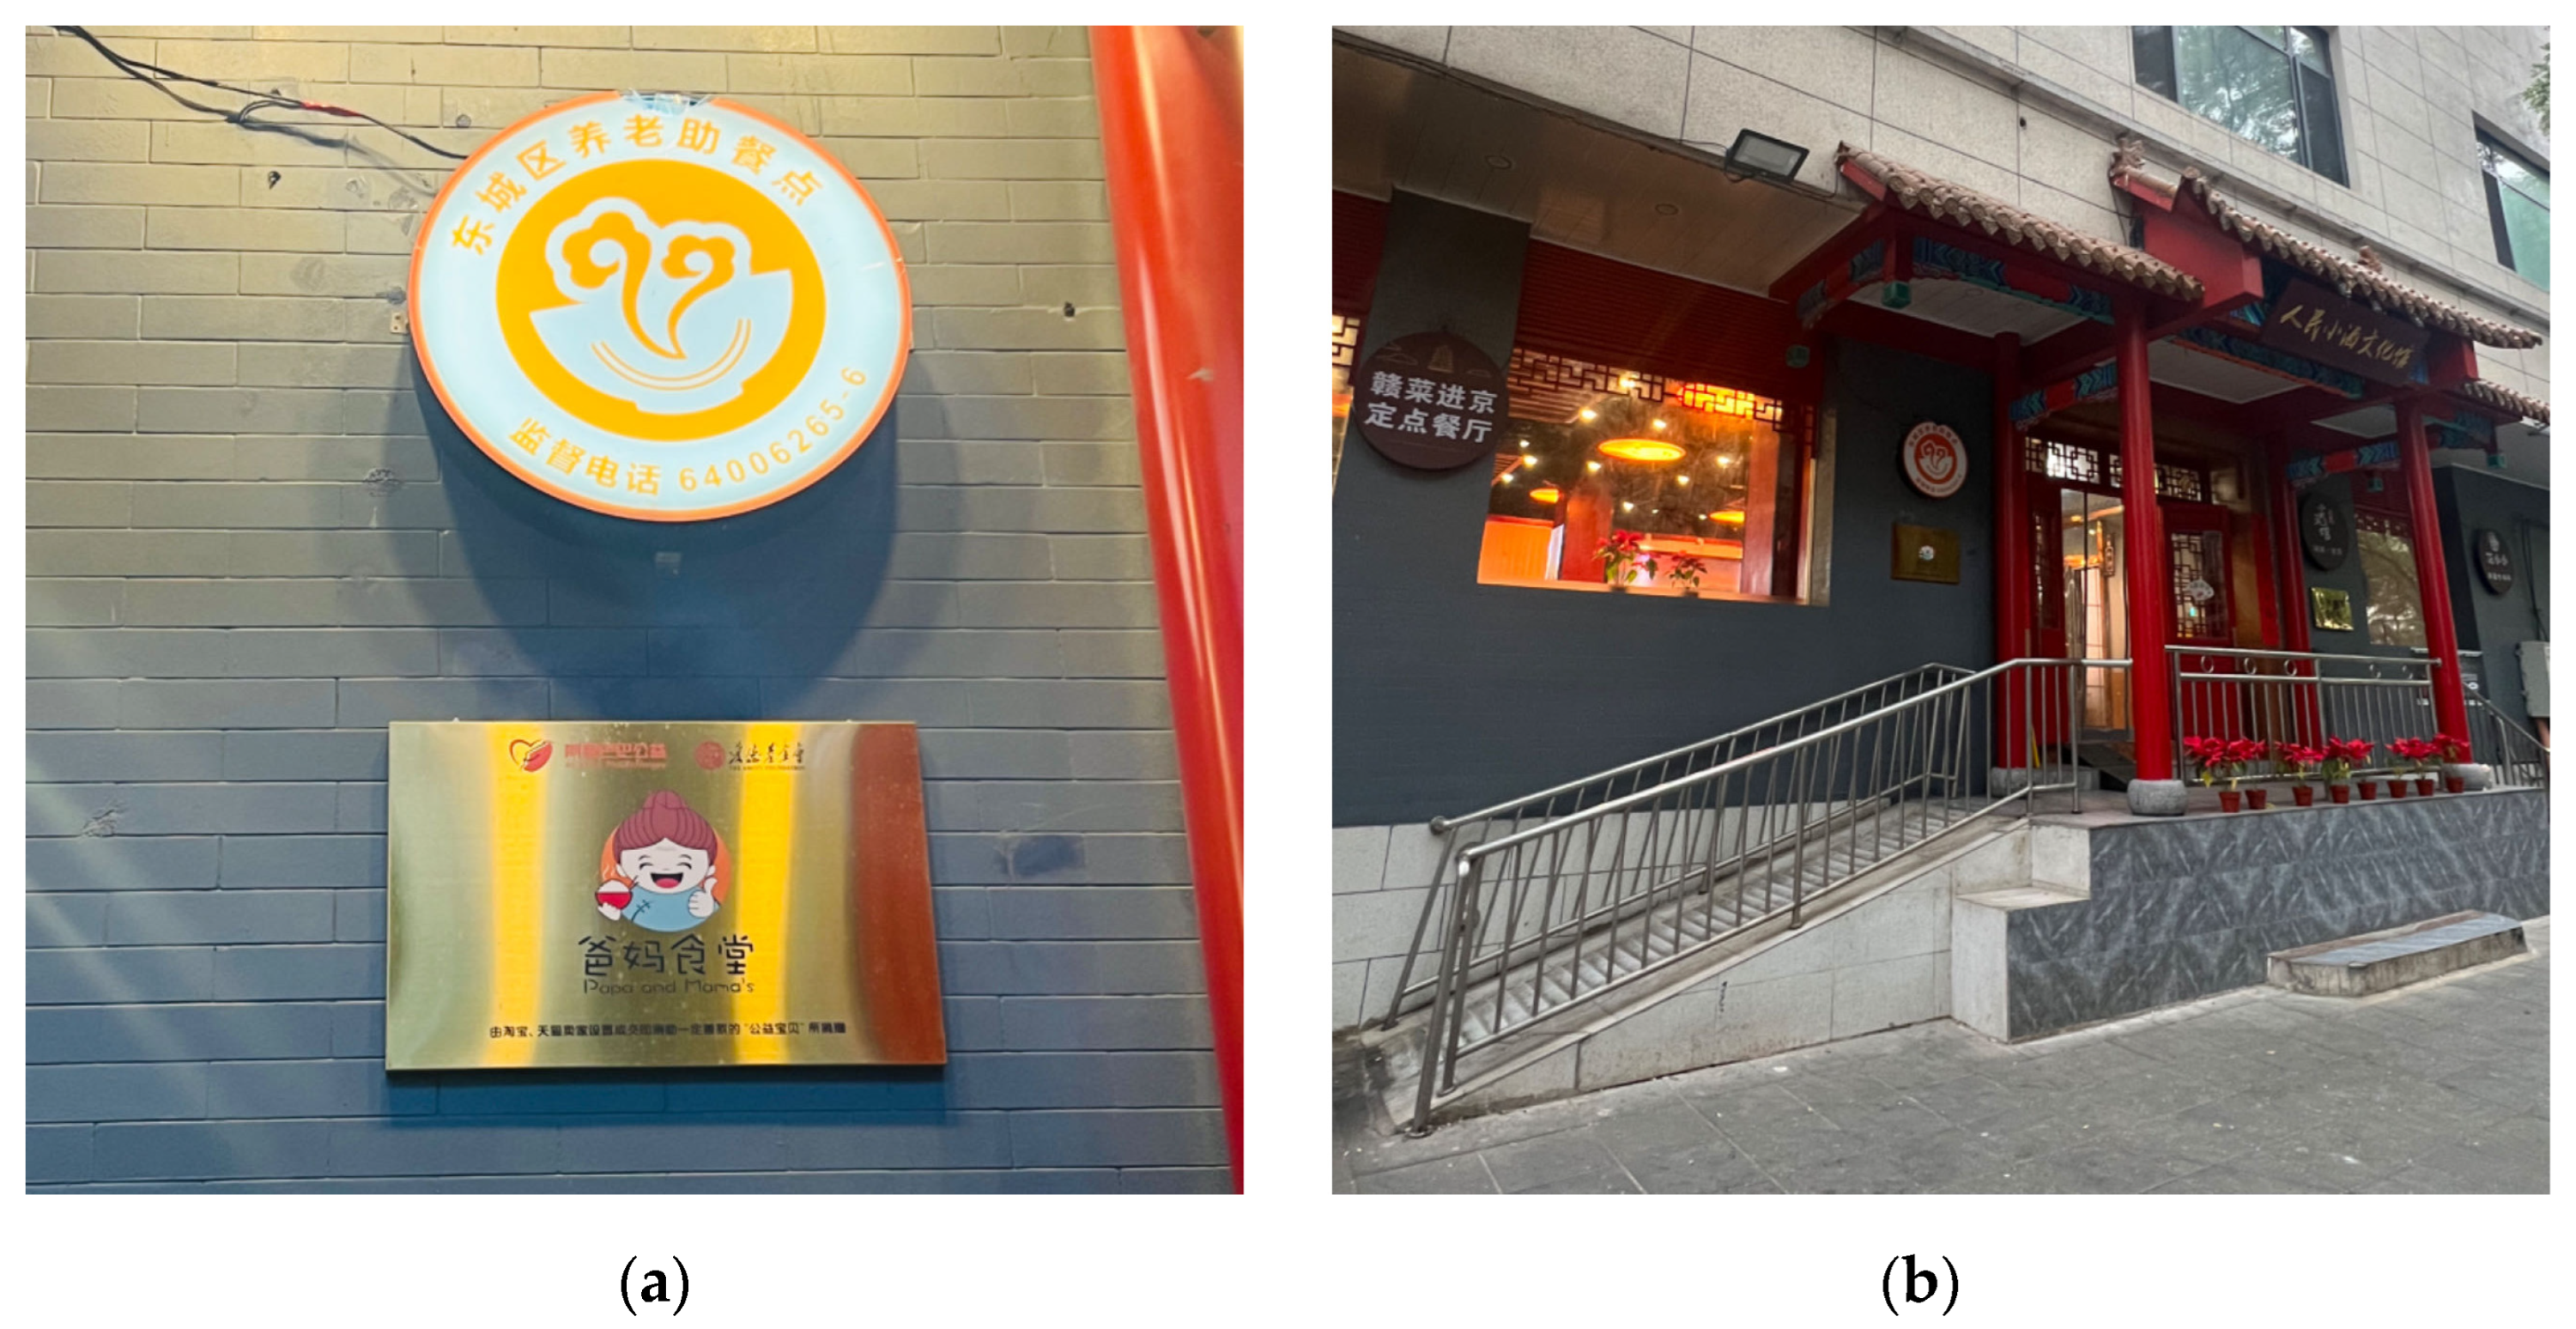
Figure 1 shows a senior-friendly restaurant located in Dongcheng District, Beijing. A third-party catering company operates this restaurant and offers a standard meal package priced at CNY 22 for individuals aged 60 and above. Senior citizens pay CNY 10 per meal, while the local government covers the remaining meal cost. The menu for elderly patrons is extensive, featuring a variety of options, including meat, eggs, vegetables, and staple foods. Furthermore, regarding environmental design, senior-friendly restaurants are typically equipped with age-friendly facilities. Consequently, the location of senior-friendly restaurants must be carefully chosen to ensure that the majority of senior residents within the community are encompassed within their service area.
The convenience of a senior-friendly restaurant’s location significantly influences seniors’ willingness to dine in, as indicated by recent research [
23]. Senior citizens tend to engage in multiple activities when they go out. They are more likely to visit a senior-friendly restaurant if it is situated near locations where they intend to visit either before or after their meal. For instance, many seniors partake in routine post-meal exercise. Therefore, locating senior-friendly restaurants in close proximity to recreational places could enhance their convenience and attractiveness.
Spatial optimization approaches provide a viable framework for optimally locating senior-friendly restaurants in communities. However, no existing model could be applied to this problem directly because this problem requires a connection between two commonly used objectives in spatial optimization: coverage maximization to address equality and distance minimization for convenience. To fill this research gap, this paper proposes a bi-objective optimization model, Community Senior-friendly Restaurants Location Problem (CSRLP), for locating senior-friendly restaurants in communities. The CSRLP model tries to maximize the number of senior citizens served by senior-friendly restaurants in the community and minimize the distance traveled between restaurants and recreational places, given the capacity limitations of recreational places. The remainder of this paper is organized as follows.
Section 2 introduces the research background of senior-friendly restaurants and the existing methods related to this problem. Then, we present the mathematical formulation of the CSRLP in
Section 3. We tested the model using both simulated and real-life datasets. The test results are provided in
Section 4. The discussion and conclusion of this study are also provided with suggestions for future research directions.
2. Related Works
A large proportion of senior citizens presently reside in urban areas [
24]. The “active aging” initiative was first introduced by the United Nations in 1999, promoting the notion that senior citizens can continue participating in various life domains, including social, cultural, and spiritual activities [
25,
26]. Establishing age-friendly cities or communities is crucial in guaranteeing active aging [
27]. In response, the World Health Organization (WHO) launched the “Global Age-Friendly Cities” project in 2006 and issued the Global Age-Friendly Cities Guide in 2007, identifying the main characteristics of age-friendly cities [
5]. The guide emphasizes the importance of outdoor spaces and buildings as crucial aspects of creating age-friendly cities, which necessitates the establishment of age-friendly public service facilities throughout the entire community [
24].
Senior-friendly restaurants, recognized as crucial public facilities providing essential food for the older population, are established in various countries. For example, the public welfare organization “Montfort Care” in Singapore has launched the “GoodLife! Makan” restaurant, providing dining services to senior citizens through cooking together in community kitchens [
28]. The nonprofit organization “Mather LifeWays” in the United States introduced the award-winning Café Plus concept, creating a place where people aged 50 and above could have meals, engage in educational and recreational activities, and engage in exercise [
29,
30]. Several cities in China, such as Beijing, Shanghai, and Xi’an, have established elderly dining services with government subsidies, such as the Qingfeng Steamed Dumpling Shop and the Huifeng Dumpling Restaurant [
19].
Eating in senior-friendly restaurants has become popular among many senior citizens. Some senior citizens find it more convenient to eat in a senior-friendly restaurant since their households typically consist of only one or two members, and preparing food in their own kitchen is energy-consuming [
31]. Some seniors have also discovered that dining out is cheaper than making it at home [
32]. Furthermore, senior citizens might also desire the opportunity to socialize with friends while dining in restaurants, fulfilling their need for companionship [
33].
Location plays a crucial role in determining the extent of benefits that a senior-friendly restaurant can offer the community. The local community is the primary space where senior citizens spend their later years after retirement [
34,
35]. Therefore, the location selection of senior-friendly restaurants must be integrated with other facilities in the community. For example, in Singapore, the “GoodLife! Makan” restaurants usually open on the first level of apartments, thus increasing accessibility for senior citizens [
36]. Establishing senior-friendly restaurants in communities is also an essential part of the “15 min community elderly care service circle” plan in China, which aims to provide senior citizens with various elderly care facilities within a 15 min reach from their homes.
Senior-friendly restaurants must ensure equal accessibility for as many senior residents in a community as possible, as they receive direct or indirect government funds [
23]. Equality can be measured by the number of residents who can access a facility within a certain distance or travel time. For example, the percentage of the population within the maximum allowable distance to the public health care facility becomes the objective of maximizing the performance of health care delivery services [
37].
The location of senior-friendly restaurants should also be convenient for seniors’ activities. Compared with other age groups, senior citizens have unique daily travel behaviors due to their age and physical abilities [
38]. Therefore, the location of restaurants should be close to other facilities frequently visited by senior citizens. Dining in these senior-friendly restaurants aligns with their daily travel behavior characteristics and can improve the quality of life for senior citizens in the community elderly care circle [
39].
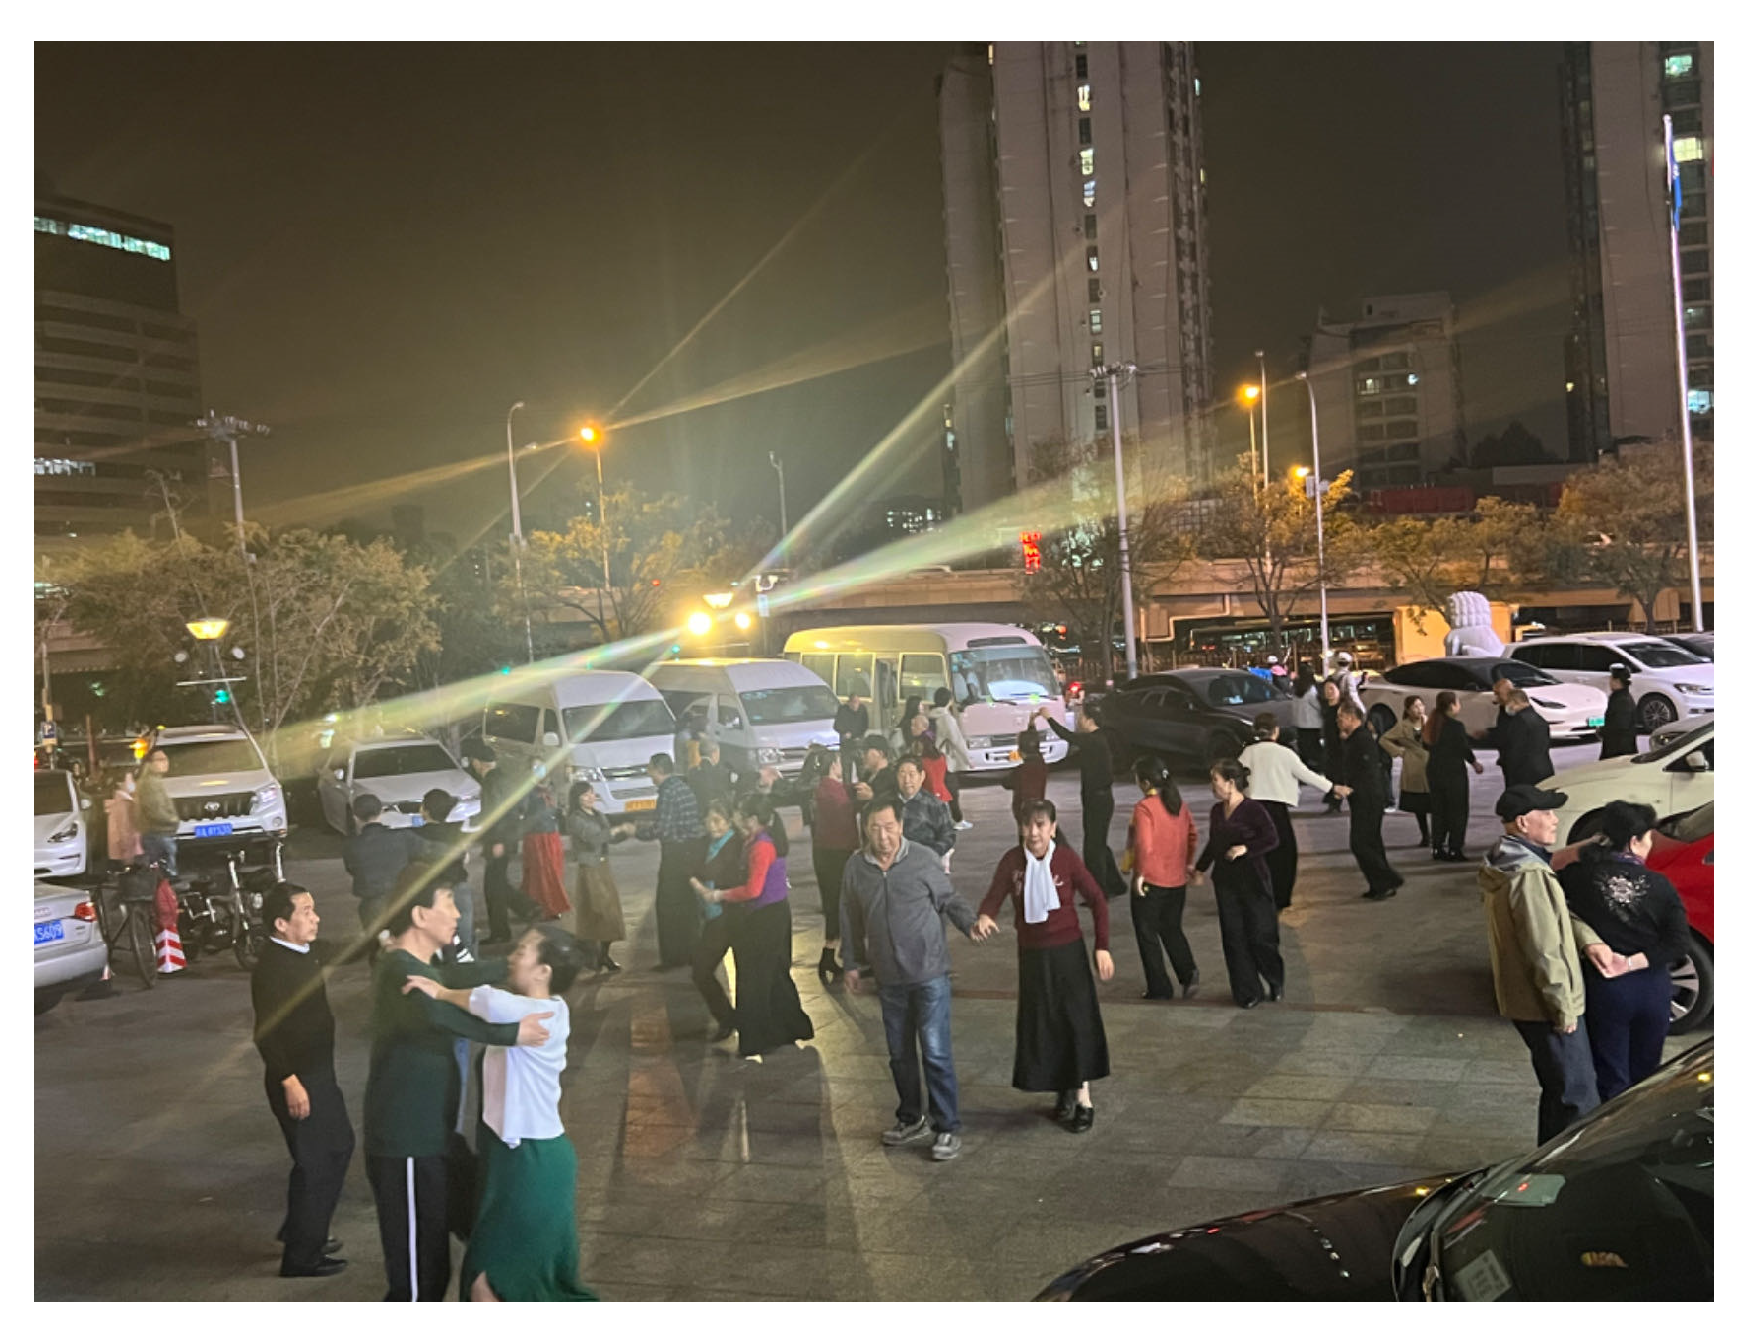
Although there are still debates about medical evidence for exercising before or after a meal, some studies suggest that engaging in exercise as soon as possible after a meal, rather than after a longer interval or before eating, has a more significant acute beneficial impact on postprandial hyperglycemia [
40]. In China, there is also a proverb, “饭后百步走,活到九十九”, which translates to “Walk a hundred steps after each meal and you’ll live till ninety-nine” in English. It suggests that engaging in light physical activity, such as walking after meals, can contribute to a long and healthy life. This could explain why the majority of elderly individuals choose to participate in physical activities after meals.
Figure 2 is a photo taken at around 7 p.m., capturing the scene of Chinese elderly individuals engaging in square dance exercises for fitness after dinner. Therefore, it is necessary to locate senior-friendly restaurants with recreational places within the living circle to improve convenience for senior citizens.
Simultaneously, scholars have been investigating the role of mobility characteristics in the social activity patterns of older adults, analyzing the relationship between various social activity locations and the mobility characteristics of older individuals [
41]. Wang et al.’s study concluded that nearby outdoor environments supportive of physical activity, especially at the residential and neighborhood levels, can promote aging in place for older adults [
42]. Future research into the activity behavior of seniors could potentially contribute to the more effective optimization of public service facility locations within communities.
Accessible recreational places play an important role in enhancing senior citizens’ physical and mental health and improving their sense of happiness [
43,
44]. As the physical strength of senior citizens declines markedly with aging, their daily activity space tends to shrink gradually [
45]. The spatial accessibility of different activity locations is a crucial factor influencing the daily outdoor participation of senior citizens [
46]. By locating senior-friendly restaurants near recreational places, the attractiveness of the recreational places to senior citizens can be further enhanced, thus achieving the goal of healthy aging.
Finding optimal locations for senior-friendly restaurants is a facility location problem that can be addressed using a variety of methods [
47]. The suitability analysis method, which relies on weighted scoring to determine optimal locations, is a commonly used method for location selection. The suitability analysis method usually involves consecutive steps, including identifying key location factors, assigning weights to each factor, scoring each location, calculating the weighted score for each location, and selecting the optimal option [
48]. Multicriteria decision analysis (MCDA) [
49] and the analytic hierarchy process (AHP) [
50] are integrated into the suitability analysis method to help explore alternative criteria and the relative importance of factors. The suitability analysis method has been widely applied in many location selection applications, such as parcel delivery and pickup locations [
49], furniture factories [
51], and sports facilities [
52]. The suitability analysis method is straightforward and suitable for finding the optimal location for one facility at a time [
53]. However, when multiple facilities are involved, they must be located simultaneously. In this case, the suitability analysis method might fail to find the global optimal solution. Moreover, identifying key factors and assigning weights in suitability analysis heavily relies on the expertise of the analyst.
Spatial optimization models might provide viable ways to solve the location problem for senior-friendly restaurants by formulating and solving the problem as a mathematical programming model [
54]. A spatial optimization model is composed of objective functions and constraints, which are mathematical formulas representing the goal of the spatial optimization task and the limitations due to the environment and resources available, respectively. The objectives of spatial optimization problems can vary but usually involve maximizing coverage and minimizing cost, corresponding to the equality and convenience goals in locating senior-friendly restaurants. The most well-known spatial optimization model for coverage maximization is the Maximal Covering Location Problem (MCLP) [
55], which aims to find the optimal locations of facilities among candidate sites, so that the overall demand sites that the selected facilities can serve are maximized [
56]. The MCLP model could be applied to many areas, such as siting ambulance hubs [
57], warning sirens [
58], bank branches [
59], post offices [
60], and air pollution control sites [
61]. We note that the p-center problem, which aims to minimize the maximum accessibility between demand points and the nearest facilities in order to achieve access equality, might be another option for siting restaurants [
62]. However, the p-center model might not be the best option because it does not inherently guarantee that all travel distances remain within the feasible travel capabilities of the elderly population. While it is possible to refine the p-center model by incorporating the concept of service range, this often necessitates the establishment of a larger number of facilities to meet all demands. Such an approach can introduce significant challenges, especially when dealing with various limitations, such as environmental and resource limitations. On the other hand, the p-median problem tries to minimize the overall distance from demand sites to their closest facilities selected. As such, the efficiency will be improved [
63]. To the best of our knowledge, no study has developed a spatial optimization model to connect the coverage maximization and cost minimization objectives and applied such methods in senior-friendly restaurant location selection. In the next section, we introduce a new model to fill this research gap.
3. Methodology
In this section, we introduce the Community Senior-friendly Restaurants Location Problem (CSRLP), a bi-objective integer programming model for optimally siting senior-friendly restaurants considering both access equality and convenience regarding the after-meal activity of senior citizens. The CSRLP model is composed of two classic spatial optimization models: the MCLP model, the PMP model, and the Transportation Problem (TP) model. For the access equality goal, we used the MCLP model to maximize the joint coverage of senior-friendly restaurants so that most senior citizens can find at least one restaurant within walking distance [
64]. However, we noticed that the MCLP contains information regarding only whether a demand site is covered, while we do not know which facility covers each demand site. Therefore, we combined the PMP model with the MCLP model and applied the location-allocation mechanism in the PMP model to the MCLP model. By doing this, we will be able to know the number of senior customers in each senior-friendly restaurant. This is important because the senior customers in each restaurant will be assigned to nearby recreational areas, which are bounded by their capacity. To improve the convenience of senior citizens in accessing recreational places, we use the TP model to minimize the overall distance they travel after dining in a senior-friendly restaurant. In the CSRLP, we assume that senior citizens’ residence and recreational places’ capacities are known in advance.
The notations of parameters is shown in
Table 1.
The CSRLP model is formulated as follows:
The Objective Function (1) seeks to minimize the total number of uncovered senior citizens. The Objective Function (2) focuses on minimizing the total weighted travel distance between the senior-friendly restaurants and the recreational places. Constraints (3) ensure that each demand site is either assigned to and covered by one and only one senior-friendly restaurant or should be counted as uncovered in the objective function. Constraints (4) ensure that senior citizens in demand sites can dine in a nearby senior-friendly restaurant only if the restaurant is selected. Given that the Objective Function (1) minimizes the uncovered senior population, the Constraints (5) ensure that each demand site must be assigned to a senior-friendly restaurant if at least one selected restaurant can cover it. Constraint (6) specifies the number of senior-friendly restaurants to be built. Constraints (7) ensure that the total number of senior citizens assigned to a recreational place does not exceed the capacity of that recreational place. Constraints (8) ensure that senior citizens who are covered by a senior-friendly restaurant are assigned to a recreational place. We allow people who dine in the same restaurants to be assigned to different recreational places, and one recreational place can accept people from different restaurants.
Given a bi-objective model with possibly conflicting objectives, there might be no solution to optimize both objectives simultaneously. In this study, we used the weighted sum method to identify the Pareto front where a solution’s performance on one objective cannot be further improved without sacrificing the other [
65,
66]. The weighted sum method collapses the two objective functions into a single objective function with a set of weighting coefficients associated with each objective function [
67].
The combined objective function of the CSRLP model can be specified as follows:
minimize
where
;
and
are weighting coefficients indicating the relative importance of
and
.
4. Tests and Applications
This study proposes two sets of tests for evaluating the performance of the CSRLP model. In the first test, we used simulated random test datasets to evaluate the solution quality and processing time of the CSRLP model. In the second test, we assess the solutions generated by the CSRLP model in real-life applications.
We note that the values of the Objective Functions (1) and (2) have different magnitudes and are in different units. To better illustrate the trade-offs between the two objectives, we rescale the objective functions so that they are comparable. After rescaling, the objective function can be specified as:
minimize
where
;
; and
and
are the coefficients for rescaling Objective Functions (1) and (2), respectively. Depending on the dataset,
and
will have different values and will be demonstrated with the test cases.
We tested the CSRLP model with simulated random test datasets and tried to find the optimal solution within 3600 s. For real-life datasets, we allow the model to solve for a sufficiently long time to ensure that optimal solutions are successfully generated. We solve all problem instances using CPLEX 22.1 in a desktop computer with an Intel Core i7-12700 CPU and 64 GB of RAM.
4.1. Simulation Tests
The study area for the simulation test is a 1 km by 1 km square. In this area, we generate demand sites, where each demand site has one (1) senior citizen. We assume that the candidate senior-friendly restaurant locations are the same as the demand sites. We also randomly generated 50 recreation places, where the capacity of each recreation place was the total elderly population divided by the number of recreation areas. To test the performance of the CSRLP model in different problem sizes, we generate four datasets with different values, 100, 200, 500, and 1000. For each test dataset, we set the senior-friendly restaurants built () to range from 1 to 6. We will compare the coverage of senior citizens, the average travel distance from restaurants to recreation places, the solution time, and the optimality of the proposed model under different settings. In this test, the weighting coefficients were set as , and the scale factors and were set as 1 and 645, respectively.
Table 2 shows the results of the simulation test. The “N” column indicates the number of candidate senior-friendly restaurant locations. The “
” column indicates the number of senior-friendly restaurants built. The “
” and “
” columns indicate the value of the Objective Function
nd
respectively. The “
” and “
” columns indicate the rescale of
and
, respectively. The “Objective” column indicates the value of the objective function
The “
” and “
” columns indicate the population and the percentage of seniors covered, respectively. The “D” column represents the average travel distance from restaurants to recreation places. The “Time” and “Gap” columns are the solution time and the optimality gap, respectively. The result value of the optimality gap is less than 0.01%, which indicates that the model can obtain the optimal solutions. As shown in
Table 2, the number of senior citizens covered increases with the value of
, which means that the percentage of senior citizens covered is improved when more senior-friendly restaurants are built. However, the average distance does not always decrease with the increase in the value of
due to the capacity of the recreational places. Senior citizens will be assigned to farther recreational places if the number of seniors served increases and the nearby recreational places reach their capacity limit.
The test results also show that the computation time for solving the CSRLP model increases with the number of candidate senior-friendly restaurants () and the number of senior-friendly restaurants to be sited (). The CSRLP model could be solved optimally using a desktop computer for small and moderate-sized problems. However, for large and values, including () and (), the CSRLP model cannot be solved optimally within the 1 h time limit. The optimality gap for non-optimally solved problems ranges from 2.26% to 14.37%, which also increases with the problem size.
4.2. Applications
China is a country with a severe population aging problem. According to the seventh census of China, the population aged 60 and above in China was 264 million in 2020, accounting for 18.7% of the total population [
68]. Beijing, the capital of China, has a much higher proportion of senior citizens compared to the national average. By the end of 2021, the population aged 60 and above in Beijing reached 4.416 million, accounting for 20.18% of the total population [
69]. The increasing senior population requires an age-friendly society, communities, and facilities. Therefore, creating a friendly environment for senior citizens is one of the most critical tasks in Beijing. The Dongcheng District of Beijing was selected as a pilot to build the “15 min community living circle”, which involves setting up senior-friendly restaurants in communities to meet the dining needs of senior citizens [
70].
We applied the CSRLP model to help siting senior-friendly restaurants in two adjacent communities in Dongcheng District, Beijing, China. We are especially interested in the changing coverage and travel distance when more senior-friendly restaurants are included and the trade-offs between the two objectives when different weights are applied. The following sections provide the study area, application settings, and test results.
4.2.1. Study Area
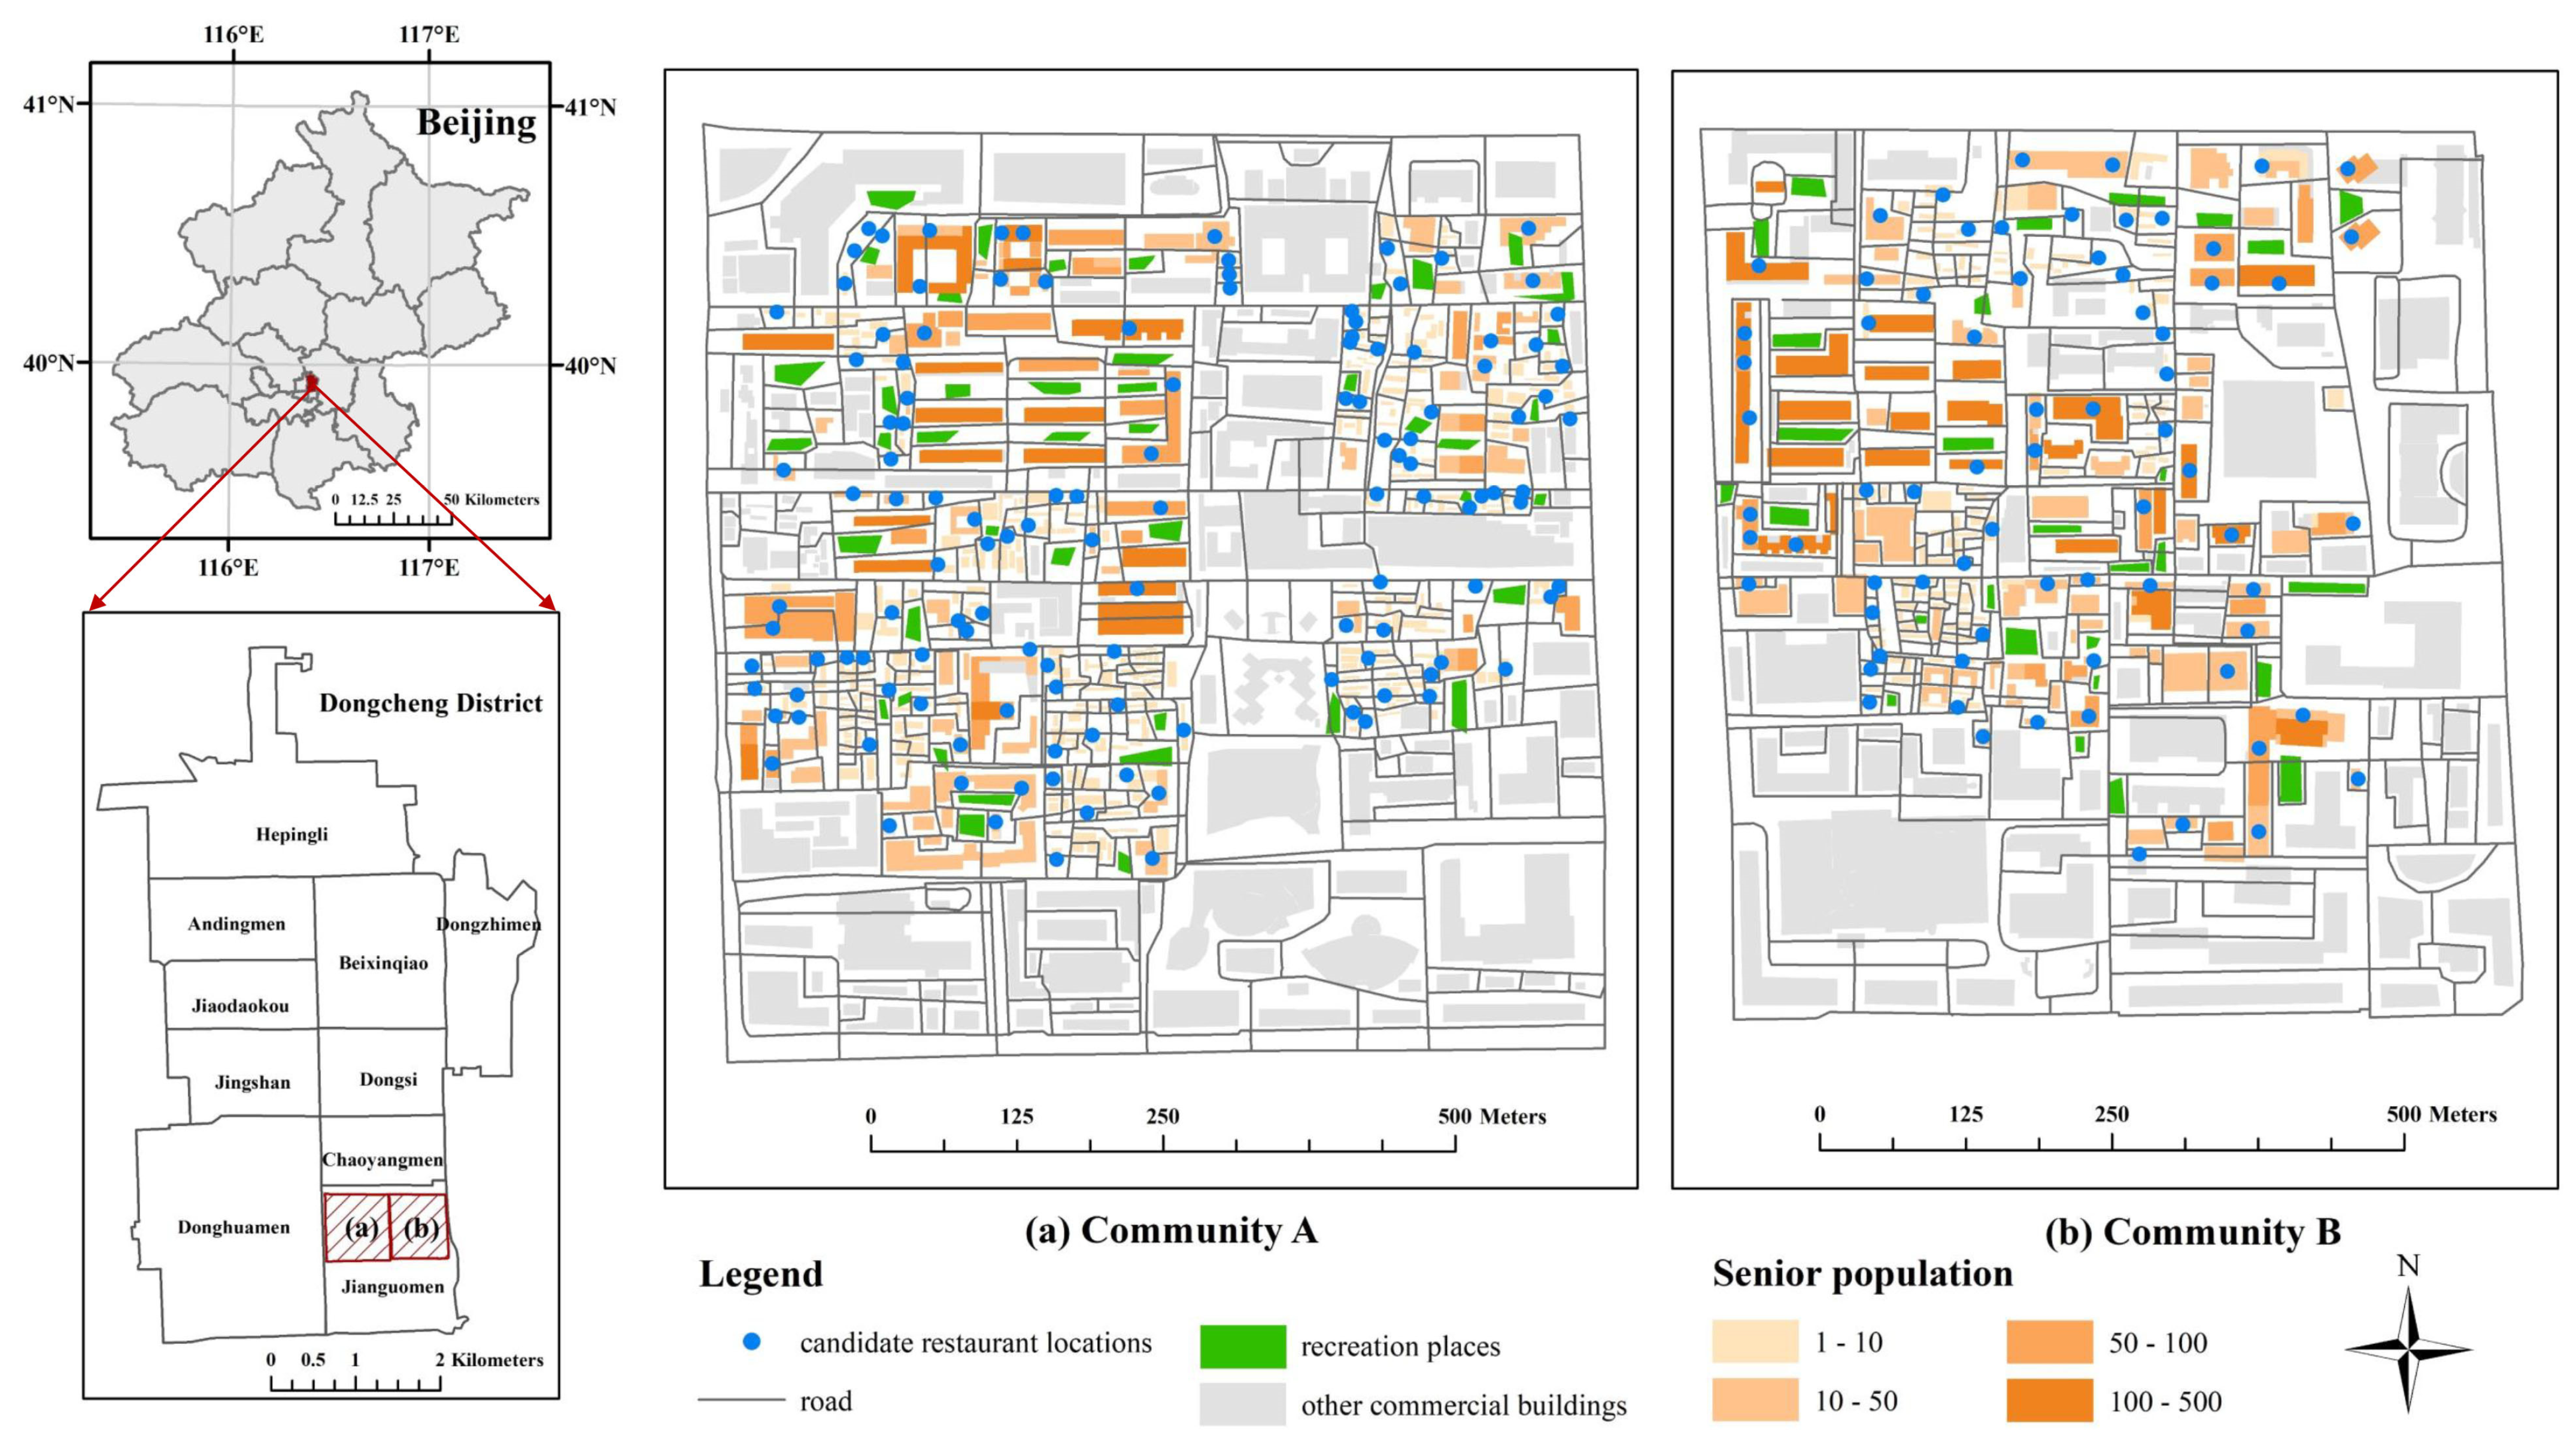
Figure 3 shows the two adjacent communities, Community A and Community B, involved in this study. Each residential building in the two communities serves as a demand site. We highlight the residential buildings in orange, and the intensity of the color reflects the senior population of each building. We marked all candidate senior-friendly restaurant locations with blue dots and recreation places with green polygons. The gray areas in the map are commercial buildings, which will not be included in the model. As shown in
Figure 3, both communities exhibit a mixture of high-density and low-density residential areas, but the spatial distribution patterns of residential areas and recreational places differ. In particular, Community A shows a more dispersed arrangement of residential areas and recreational places compared to Community B. We applied the CSRLP model in the two communities to compare and evaluate the impact of these two scenarios on the selection of locations for senior-friendly restaurants.
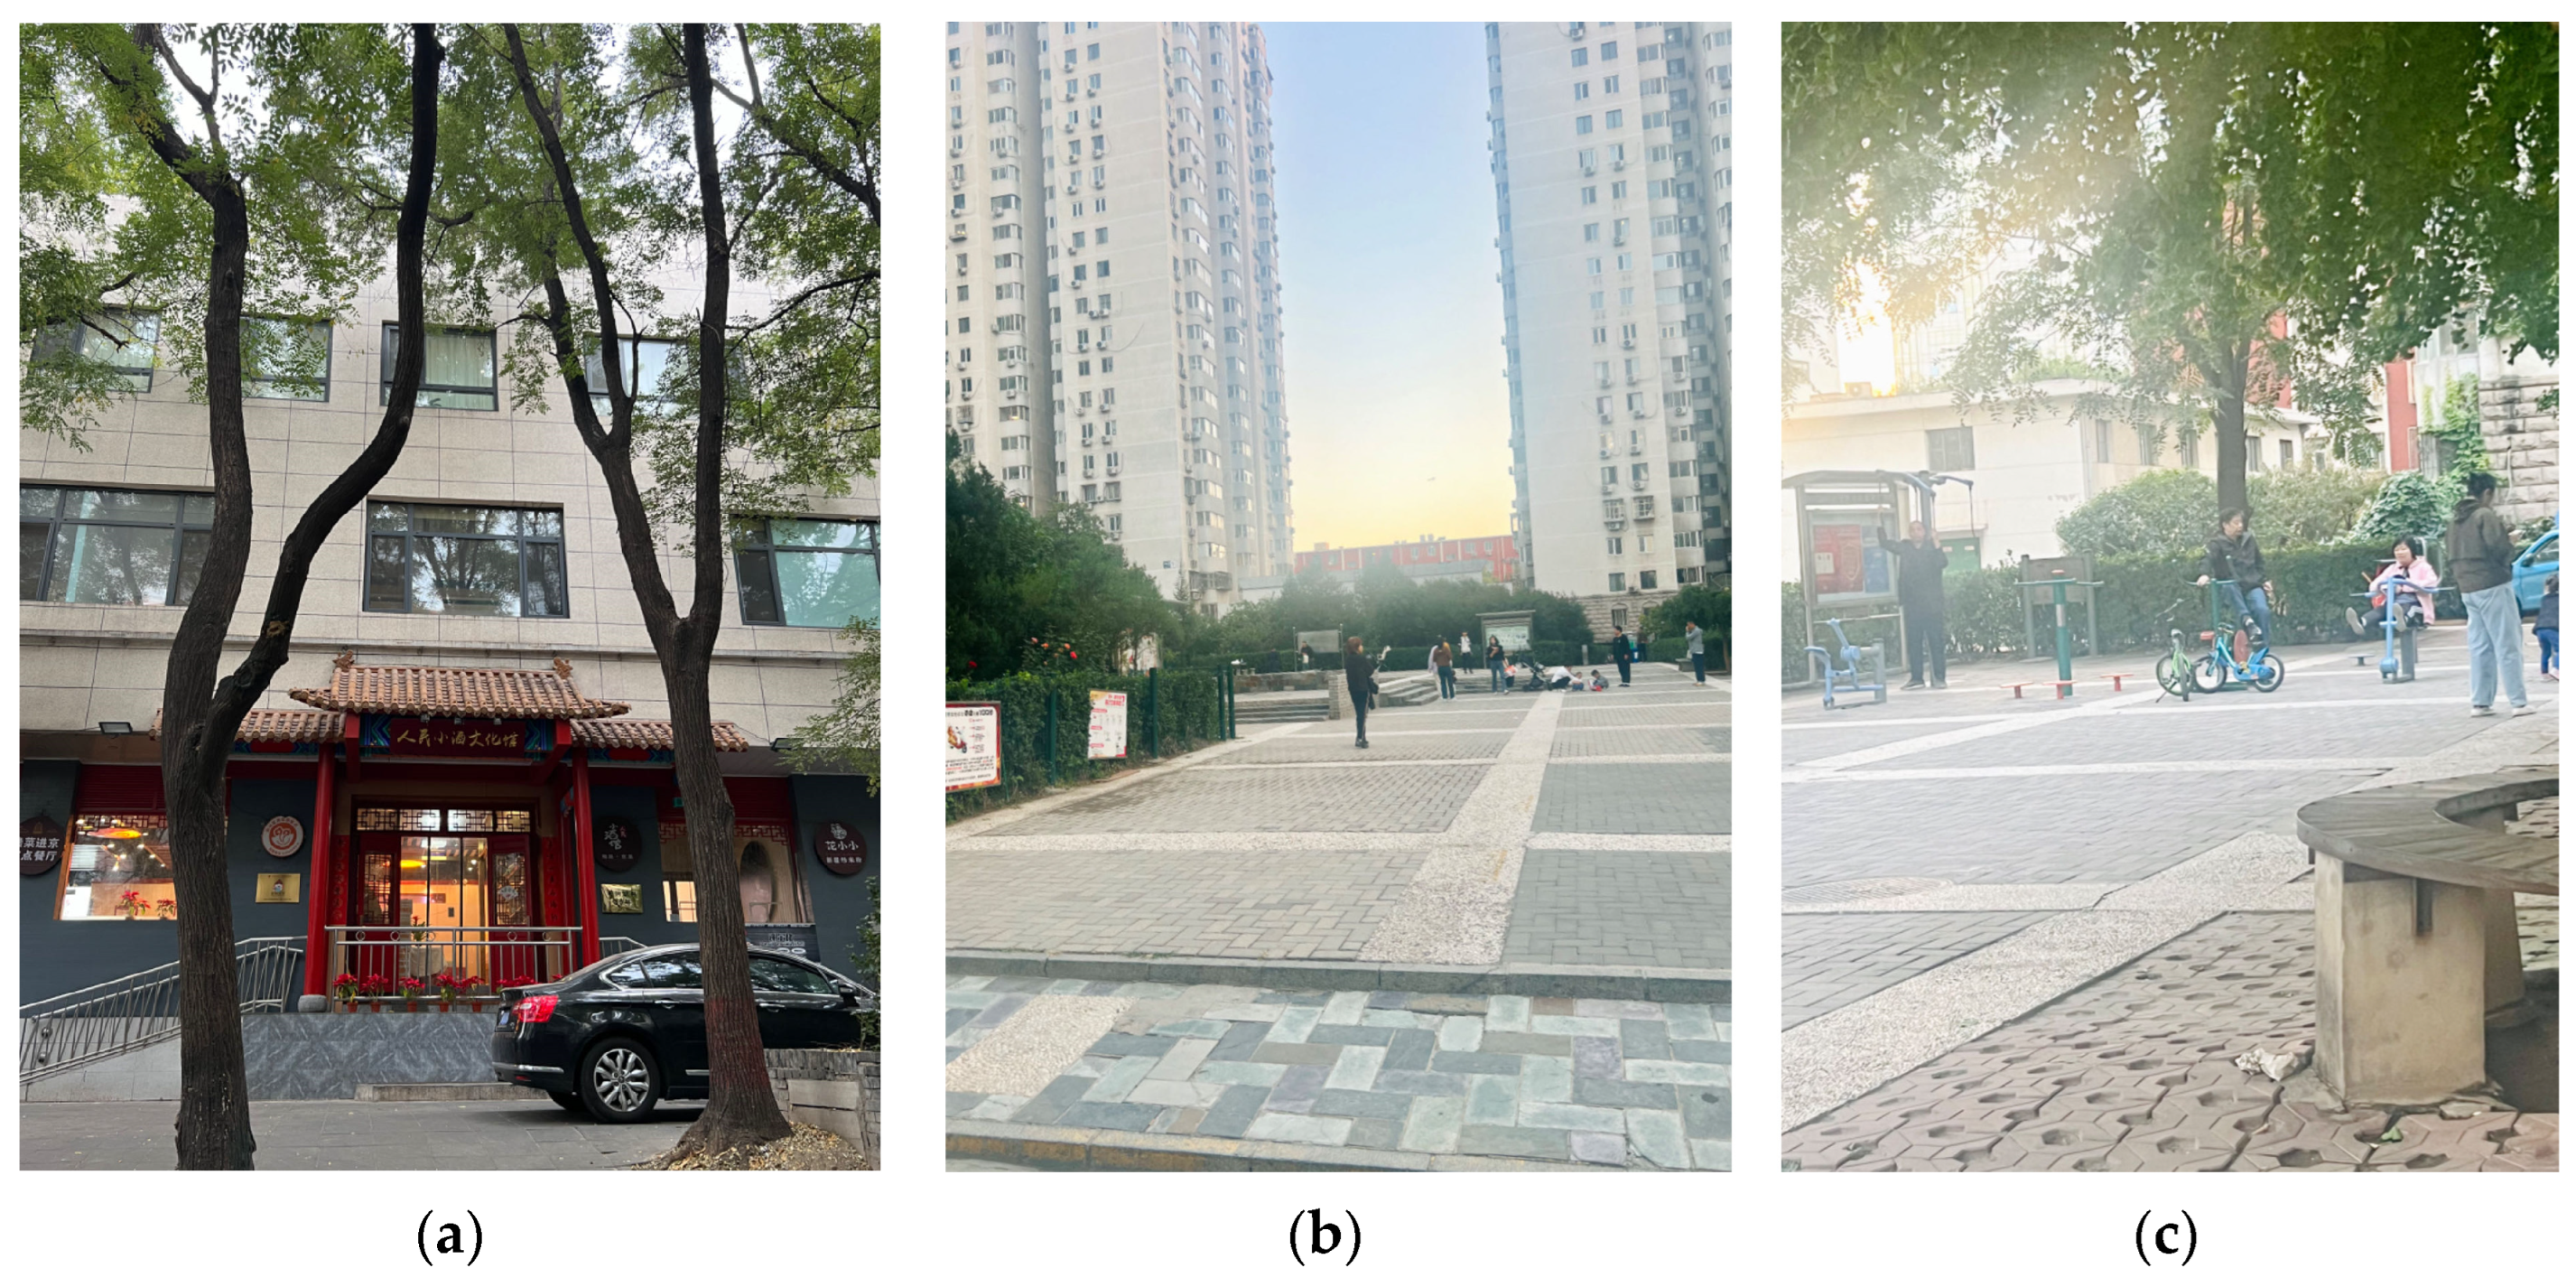
The candidate locations for the restaurants were acquired through fieldwork conducted by the authors within the study area. In the research area, residential buildings often have mixed usage, in which the first floor is for business, and the upper floors are apartments. Therefore, candidate restaurant locations were primarily chosen based on ground-level spaces within residential buildings suitable for commercial development (see
Figure 4a). We also assume that, at most, one senior-friendly restaurant is in a building.
The community recreational spaces data are also collected via fieldwork. In this research, the community recreational places are open spaces that are suitable for light physical activities of elderly citizens, such as pocket parks, plazas, and squares within a community (see
Figure 4b). Some of the recreational spaces are equipped with exercise equipment (as shown in
Figure 4c). Many elderly citizens have physical exercise in these areas, especially after meals.
4.2.2. Test Results for Community A
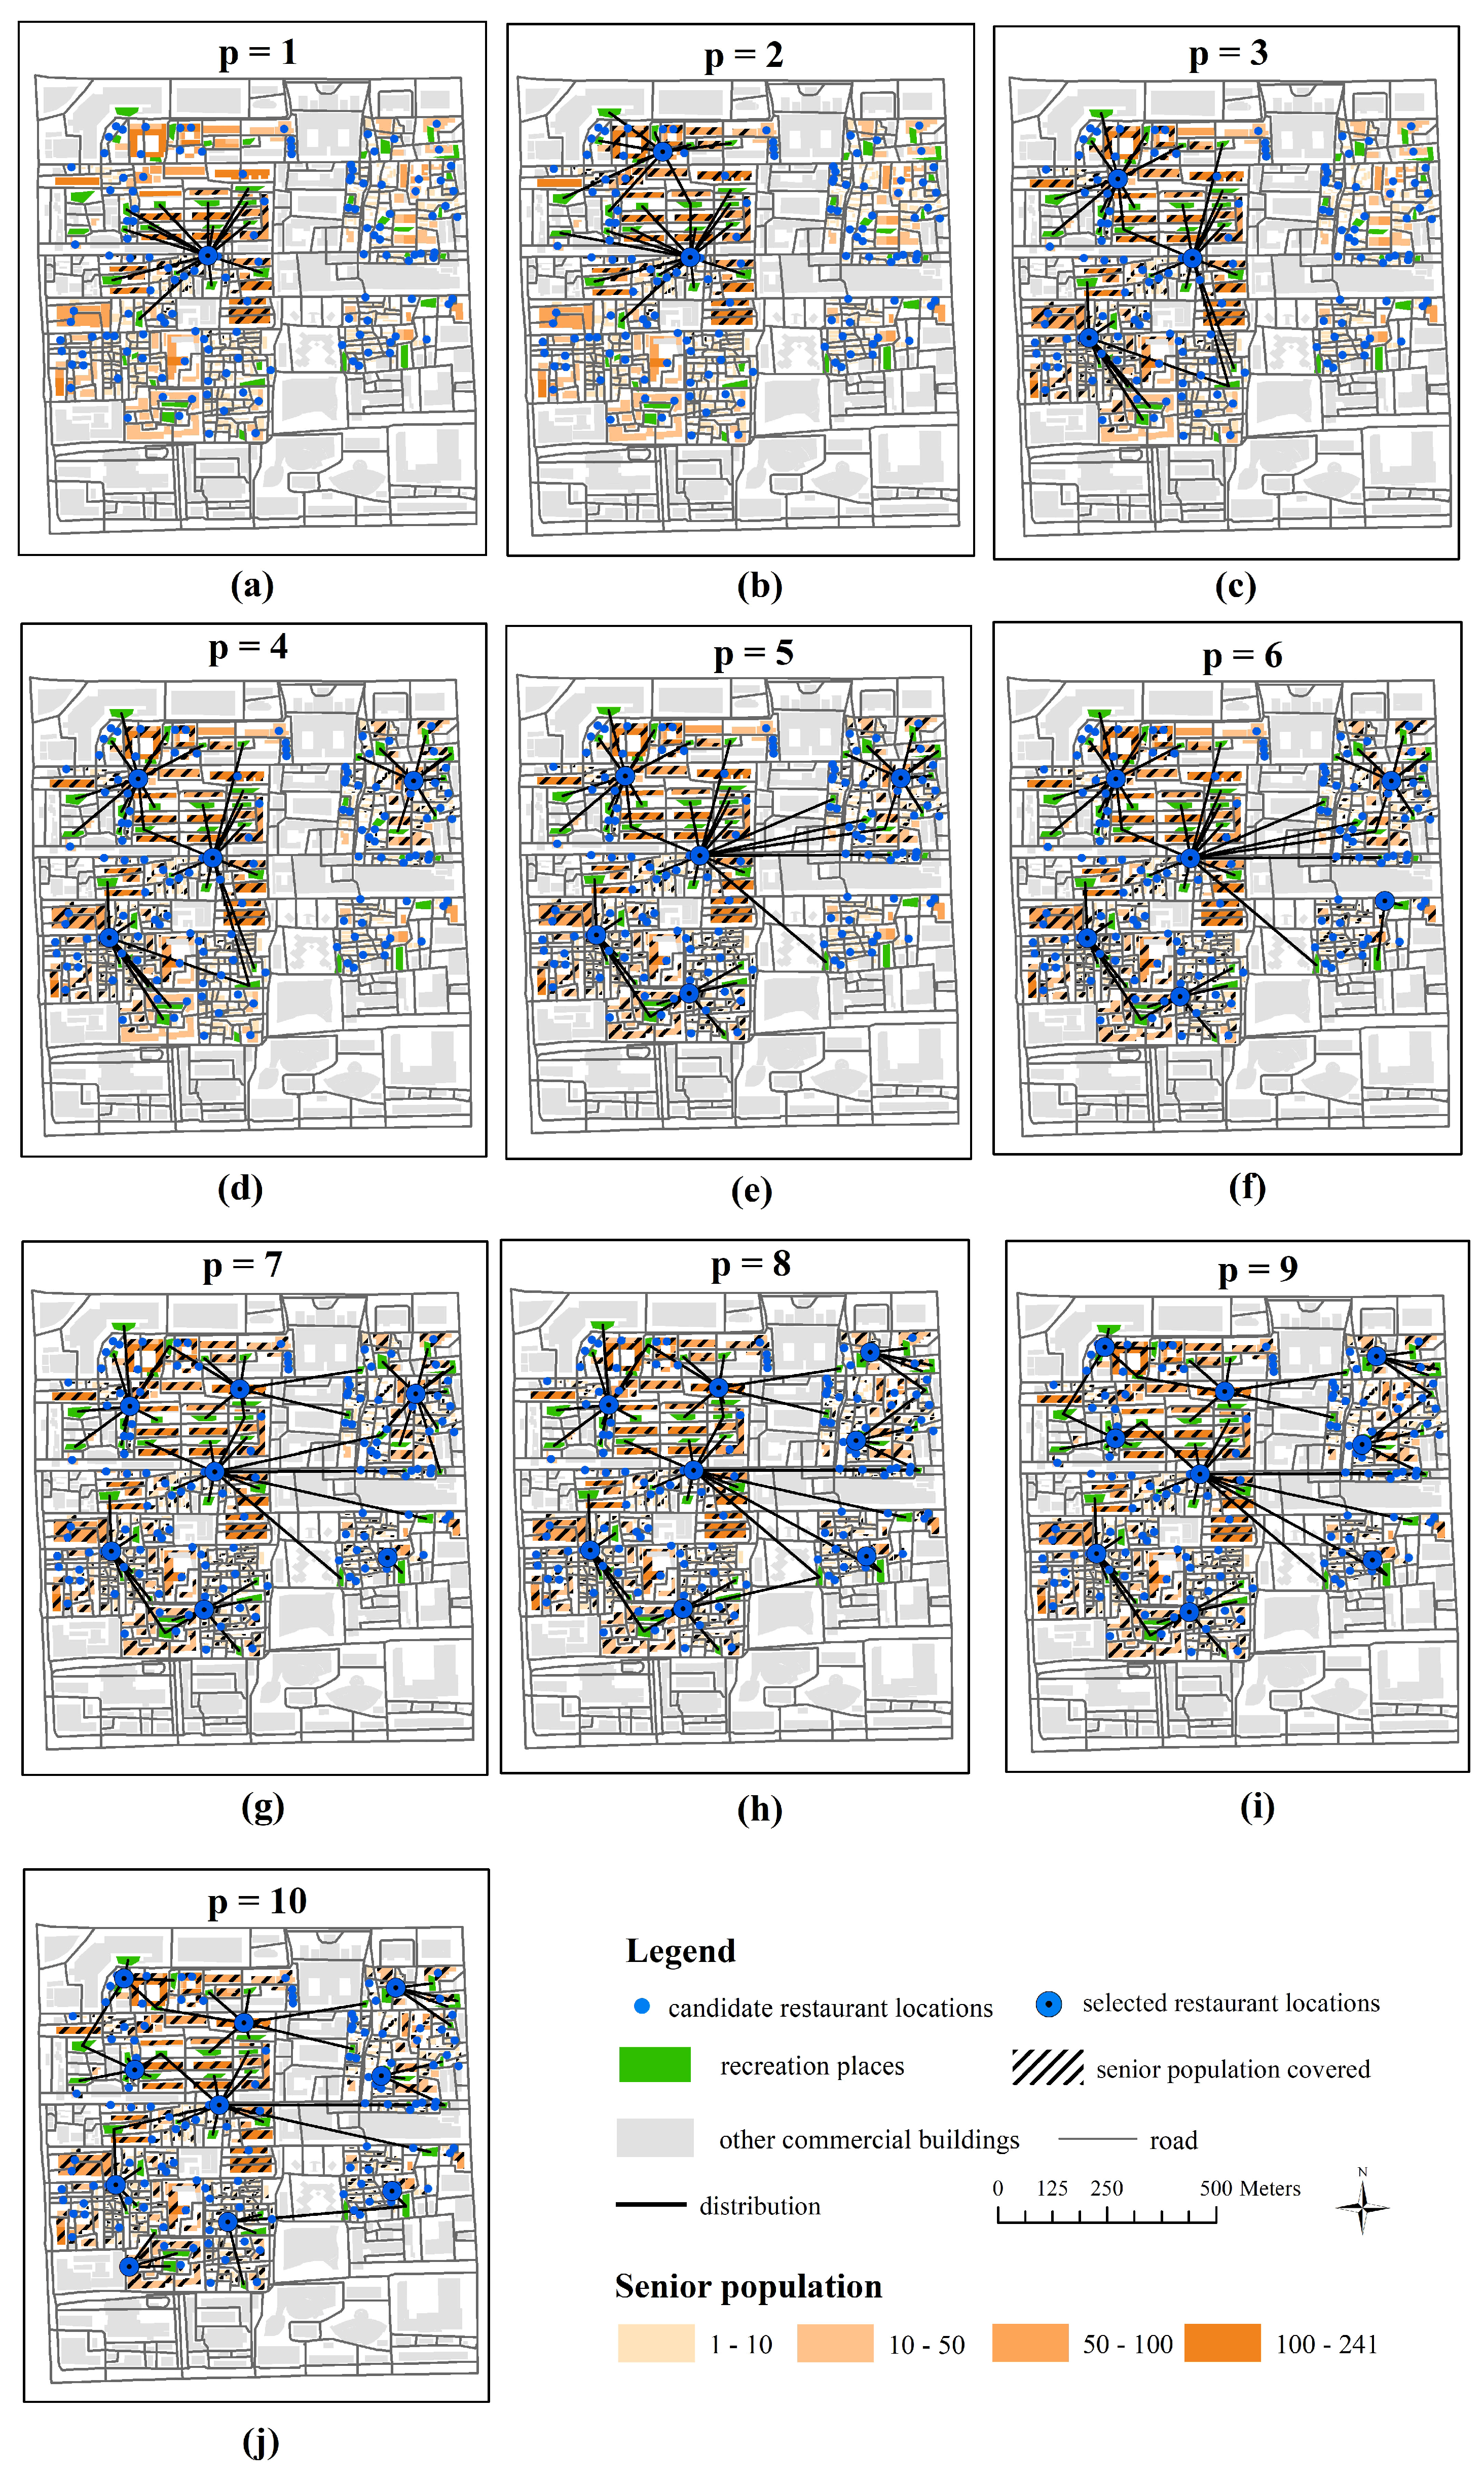
We first tested the CSRLP model in Community A with different values. The weighting coefficients were and the scale factors and were set to 121 and 126,324, respectively.
As shown in
Table 3, optimal solutions were obtained for
ranges from 1 to 10.
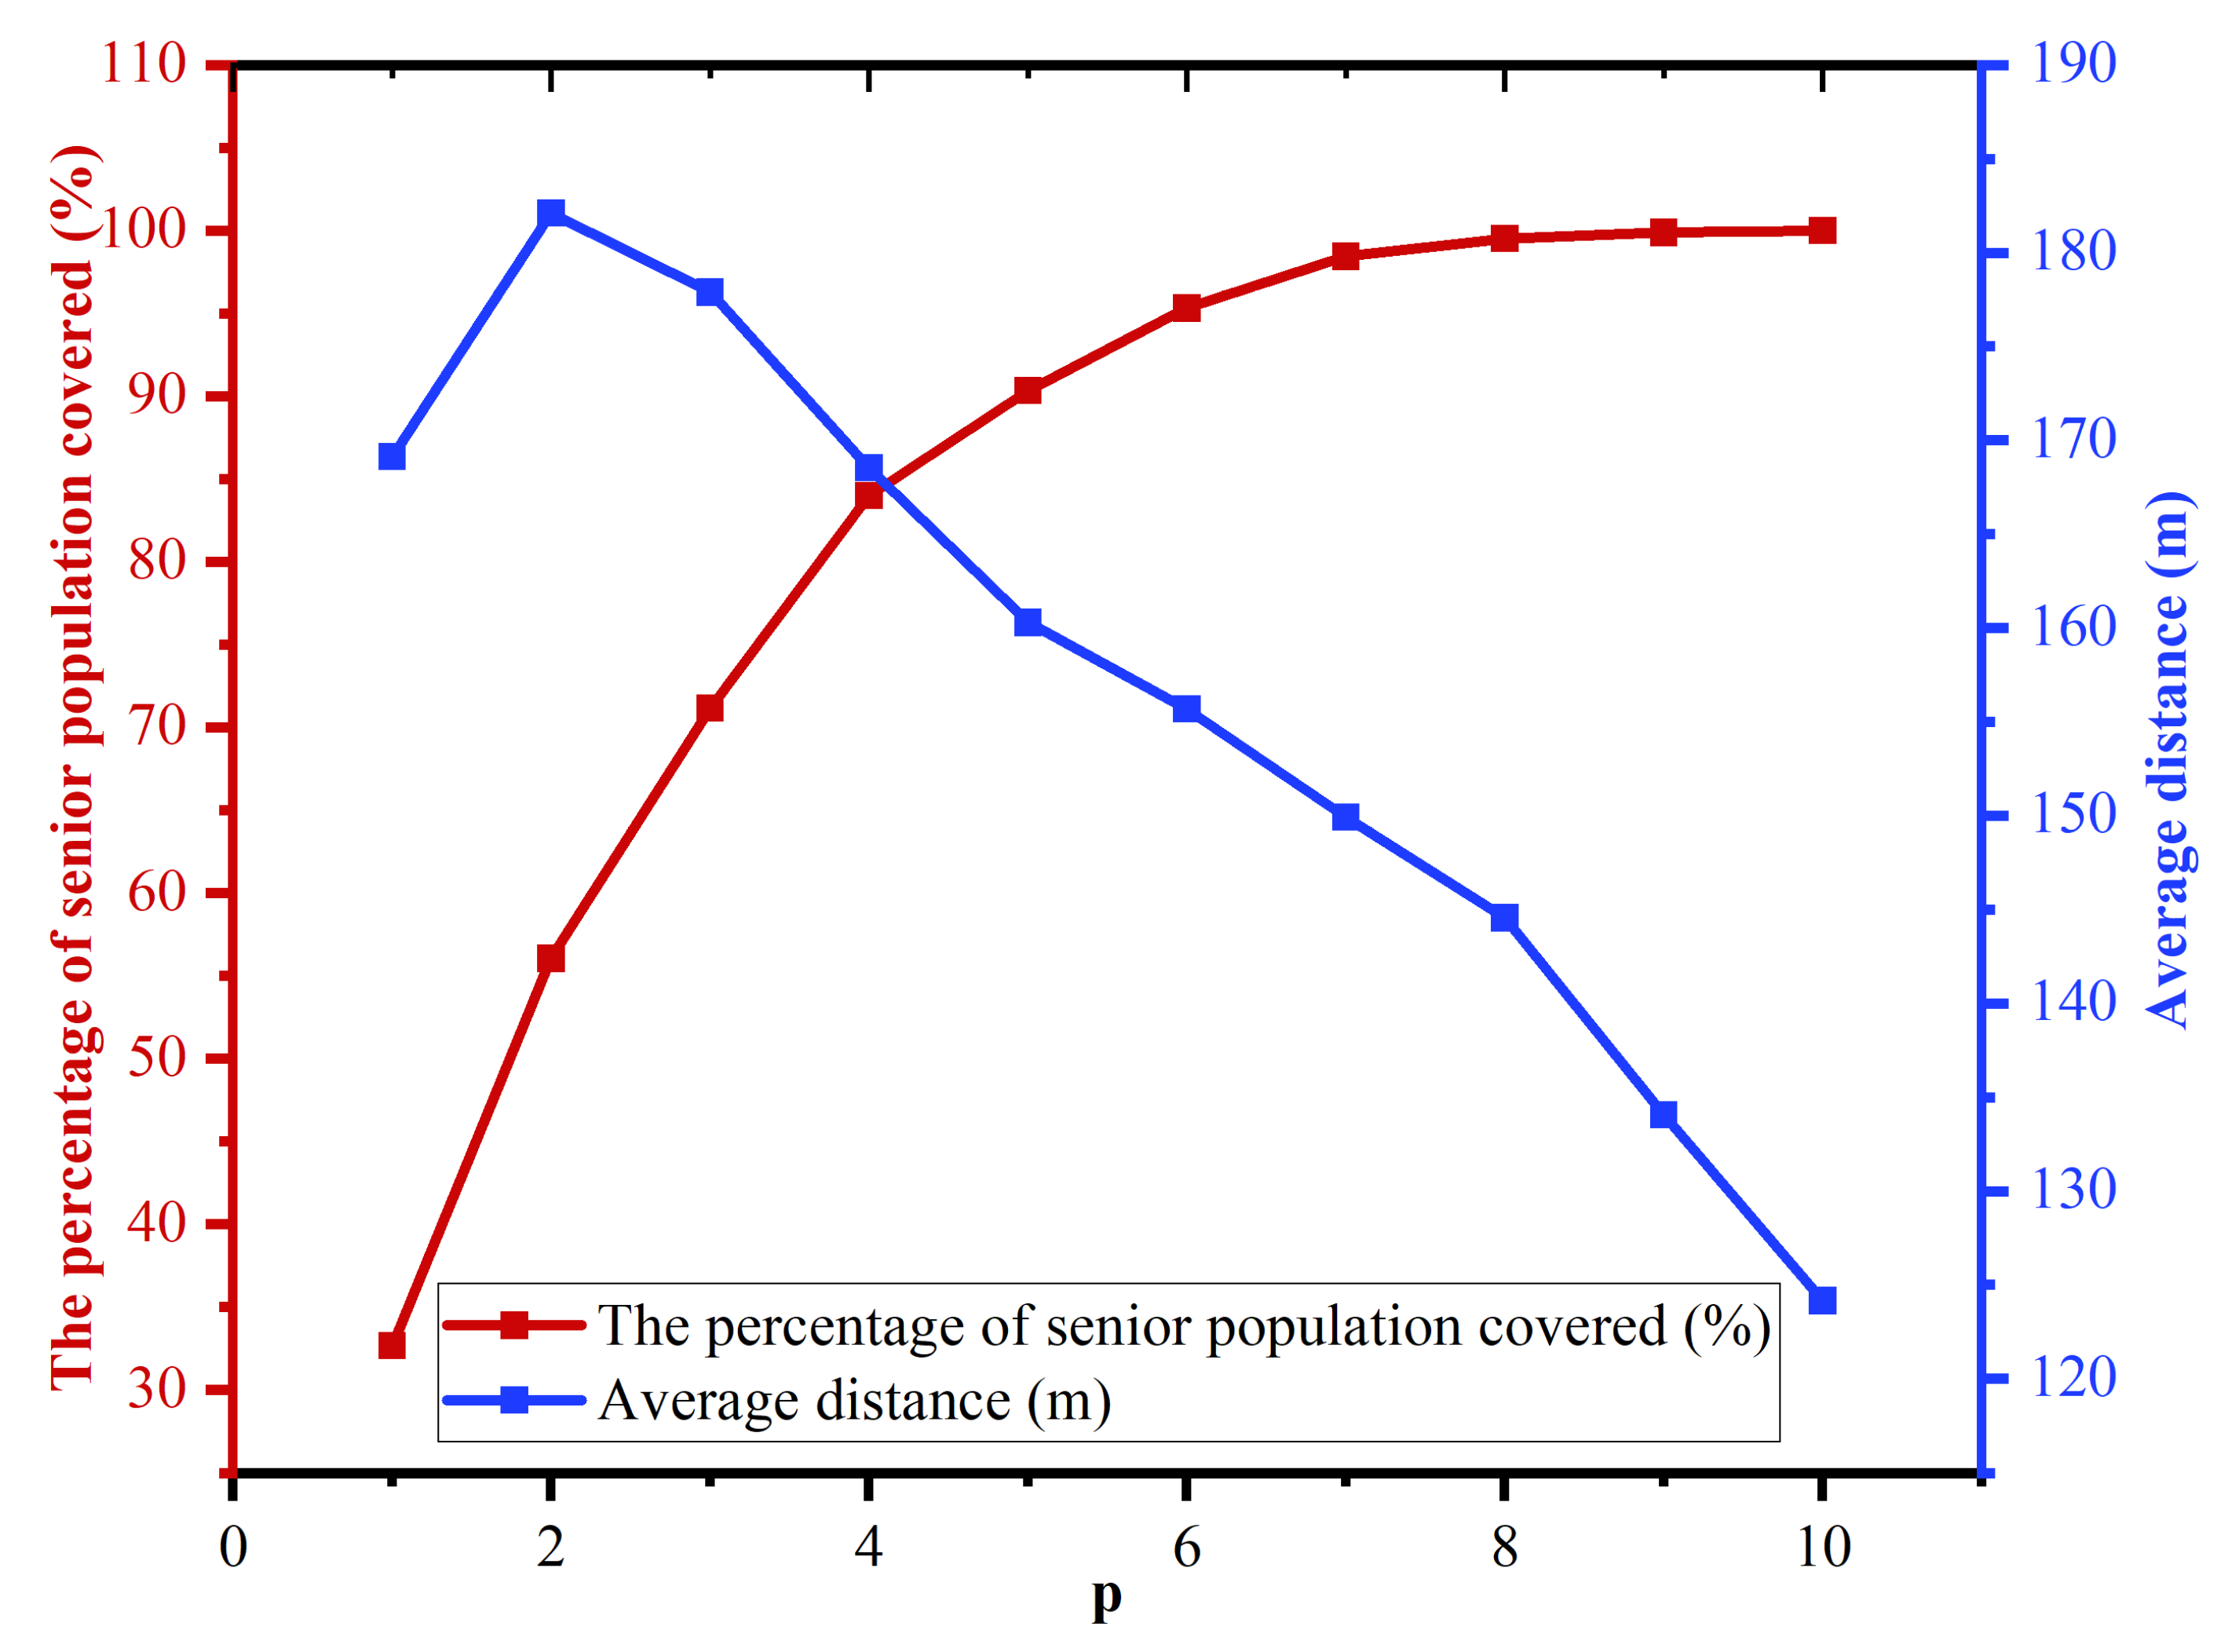
Figure 5 shows the coverage of senior citizens and the average travel distance from restaurants to recreation places for different
. The number of senior citizens covered always increases with the value of
, but the growth rate of coverage gradually slows down. The average distance always decreases except when
changes from one to two, and the rate of decrease remains relatively stable. When
, we have
, indicating that when 10 senior-friendly restaurants are established, we can achieve complete coverage for all senior citizens in this community. In this situation, each older adult will walk 124.17 m on average for post-meal recreational activities. When the number of senior-friendly restaurants built is six, the percentage of senior citizens covered exceeds 95%, reaching a high coverage. Then, the growth rate of coverage slows down significantly with the increase in
. In this case, each senior citizen needs to walk 155.69 m on average from restaurants to recreational places.
4.2.3. Test Results for Community B
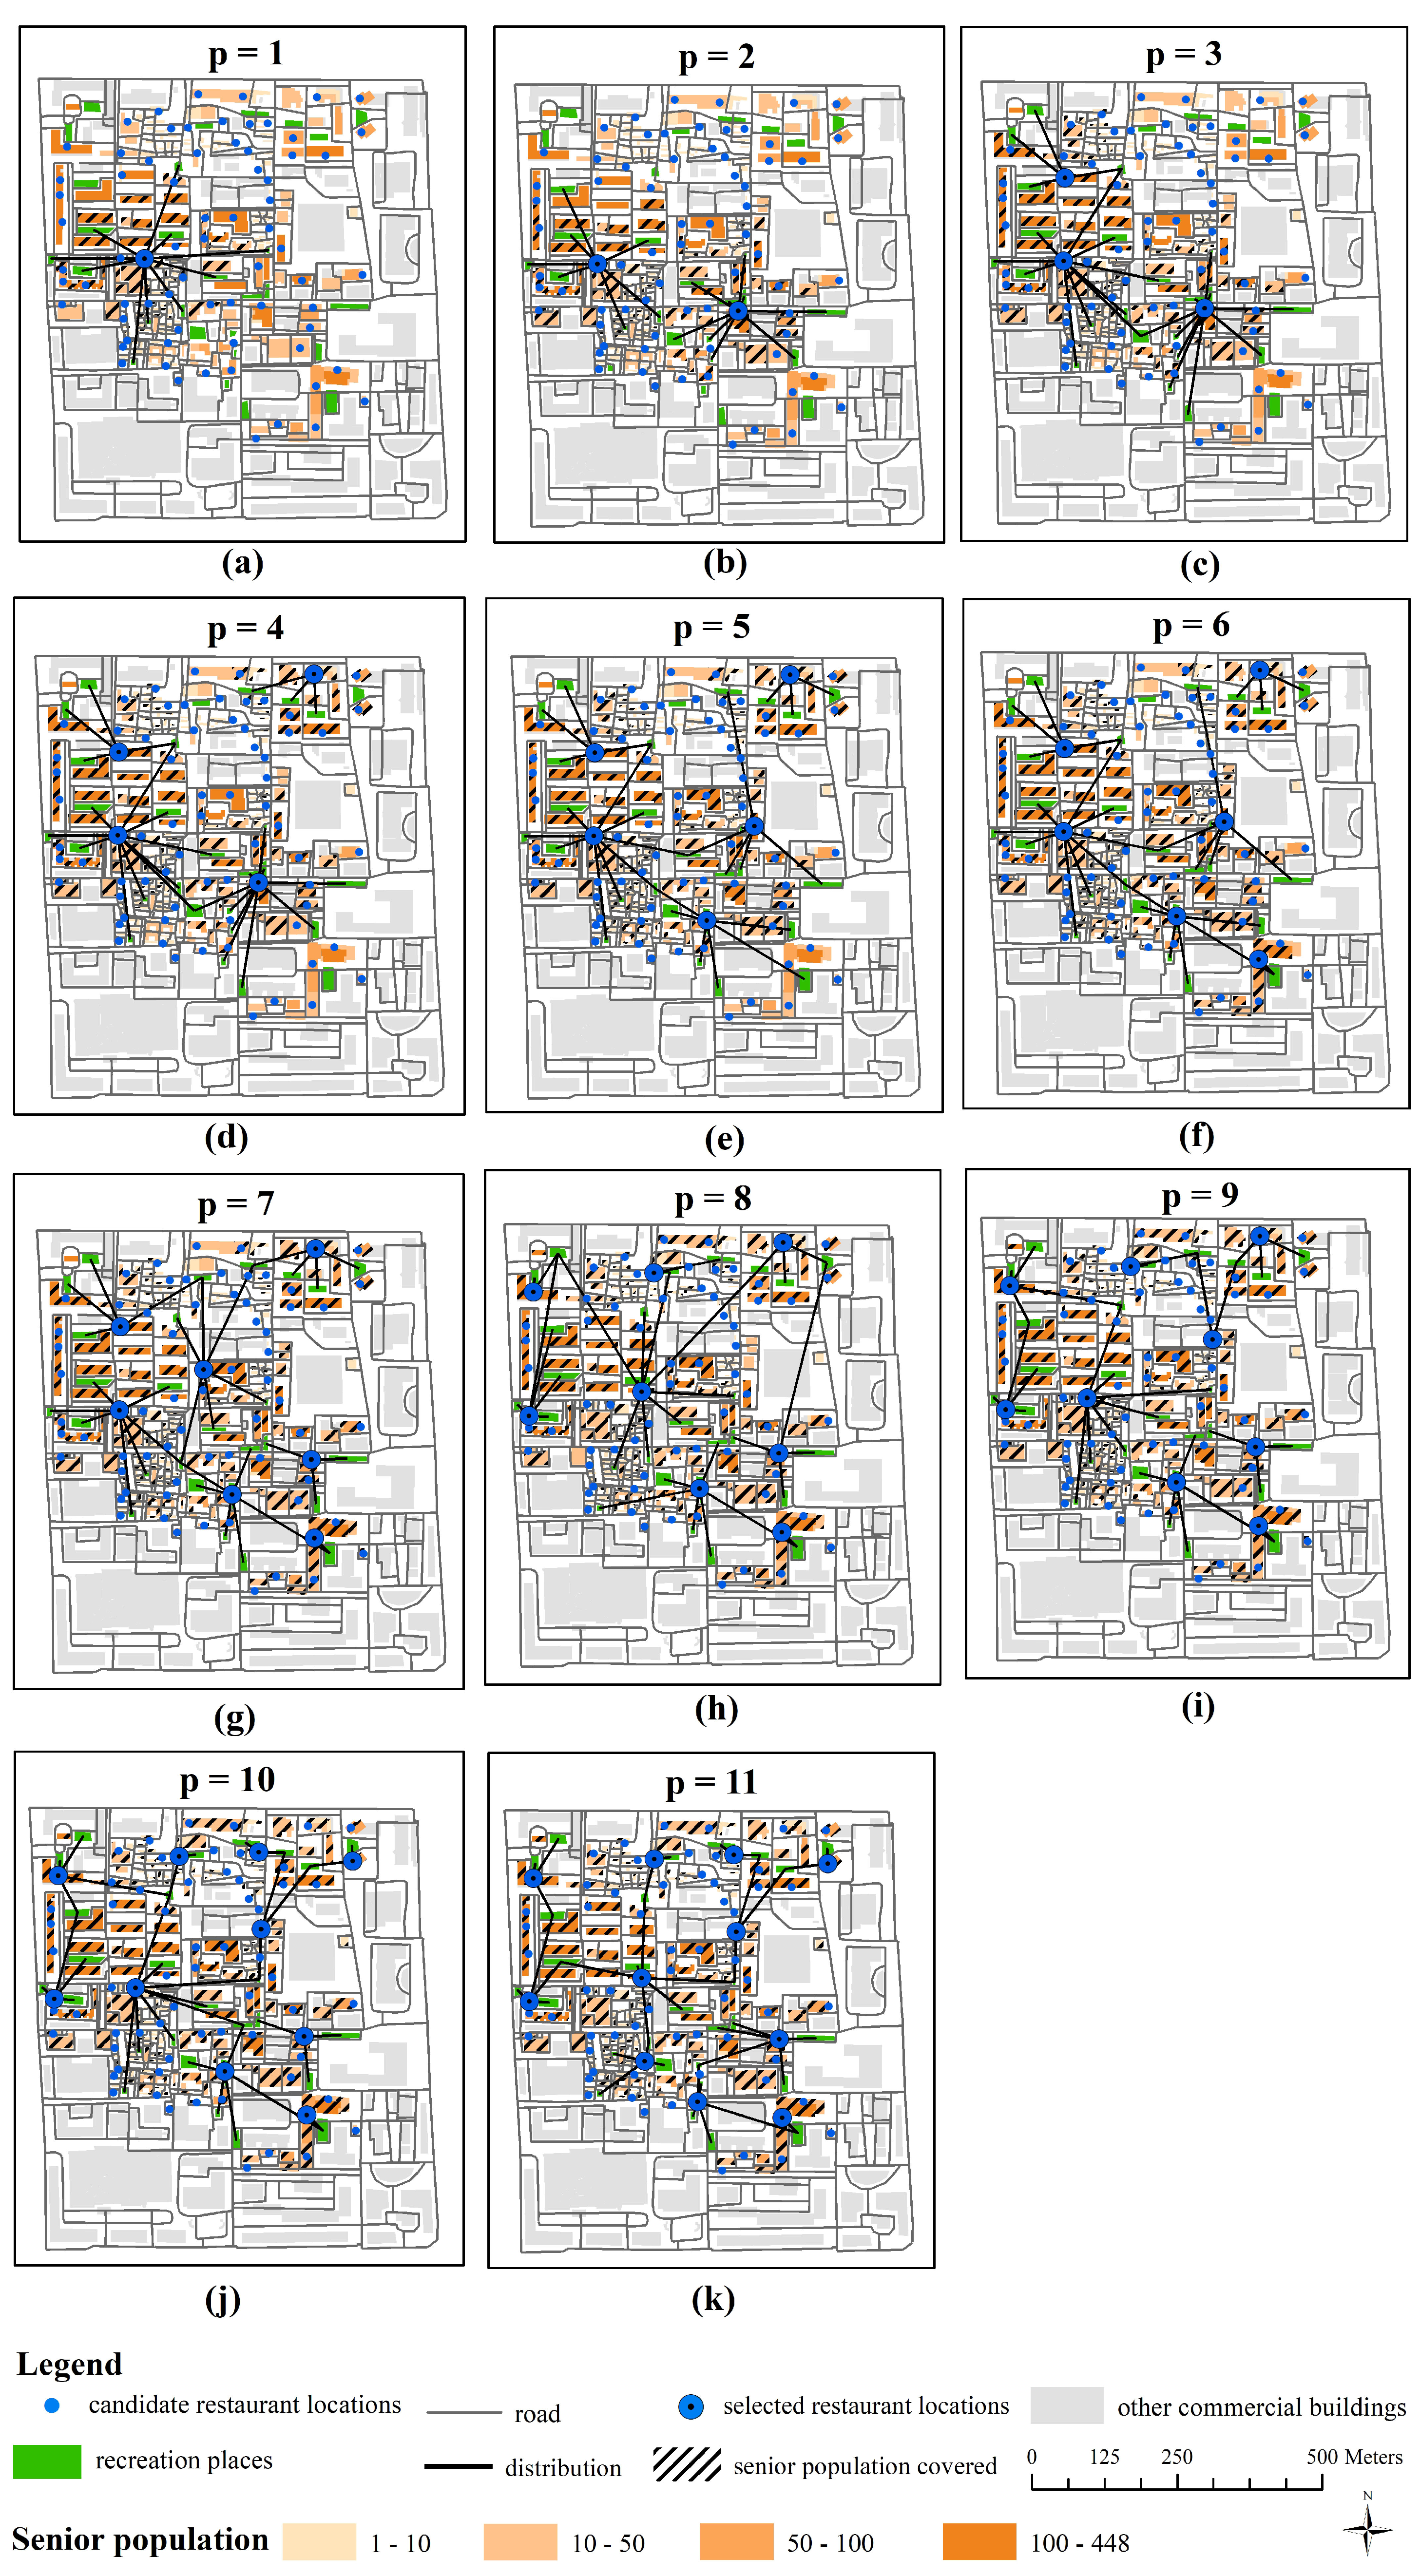
We applied the CSRLP model to Community B. The weighting coefficients are and the scale factors and were set to 225 and 339,525, respectively.
As shown in
Table 4, optimal solutions were obtained for
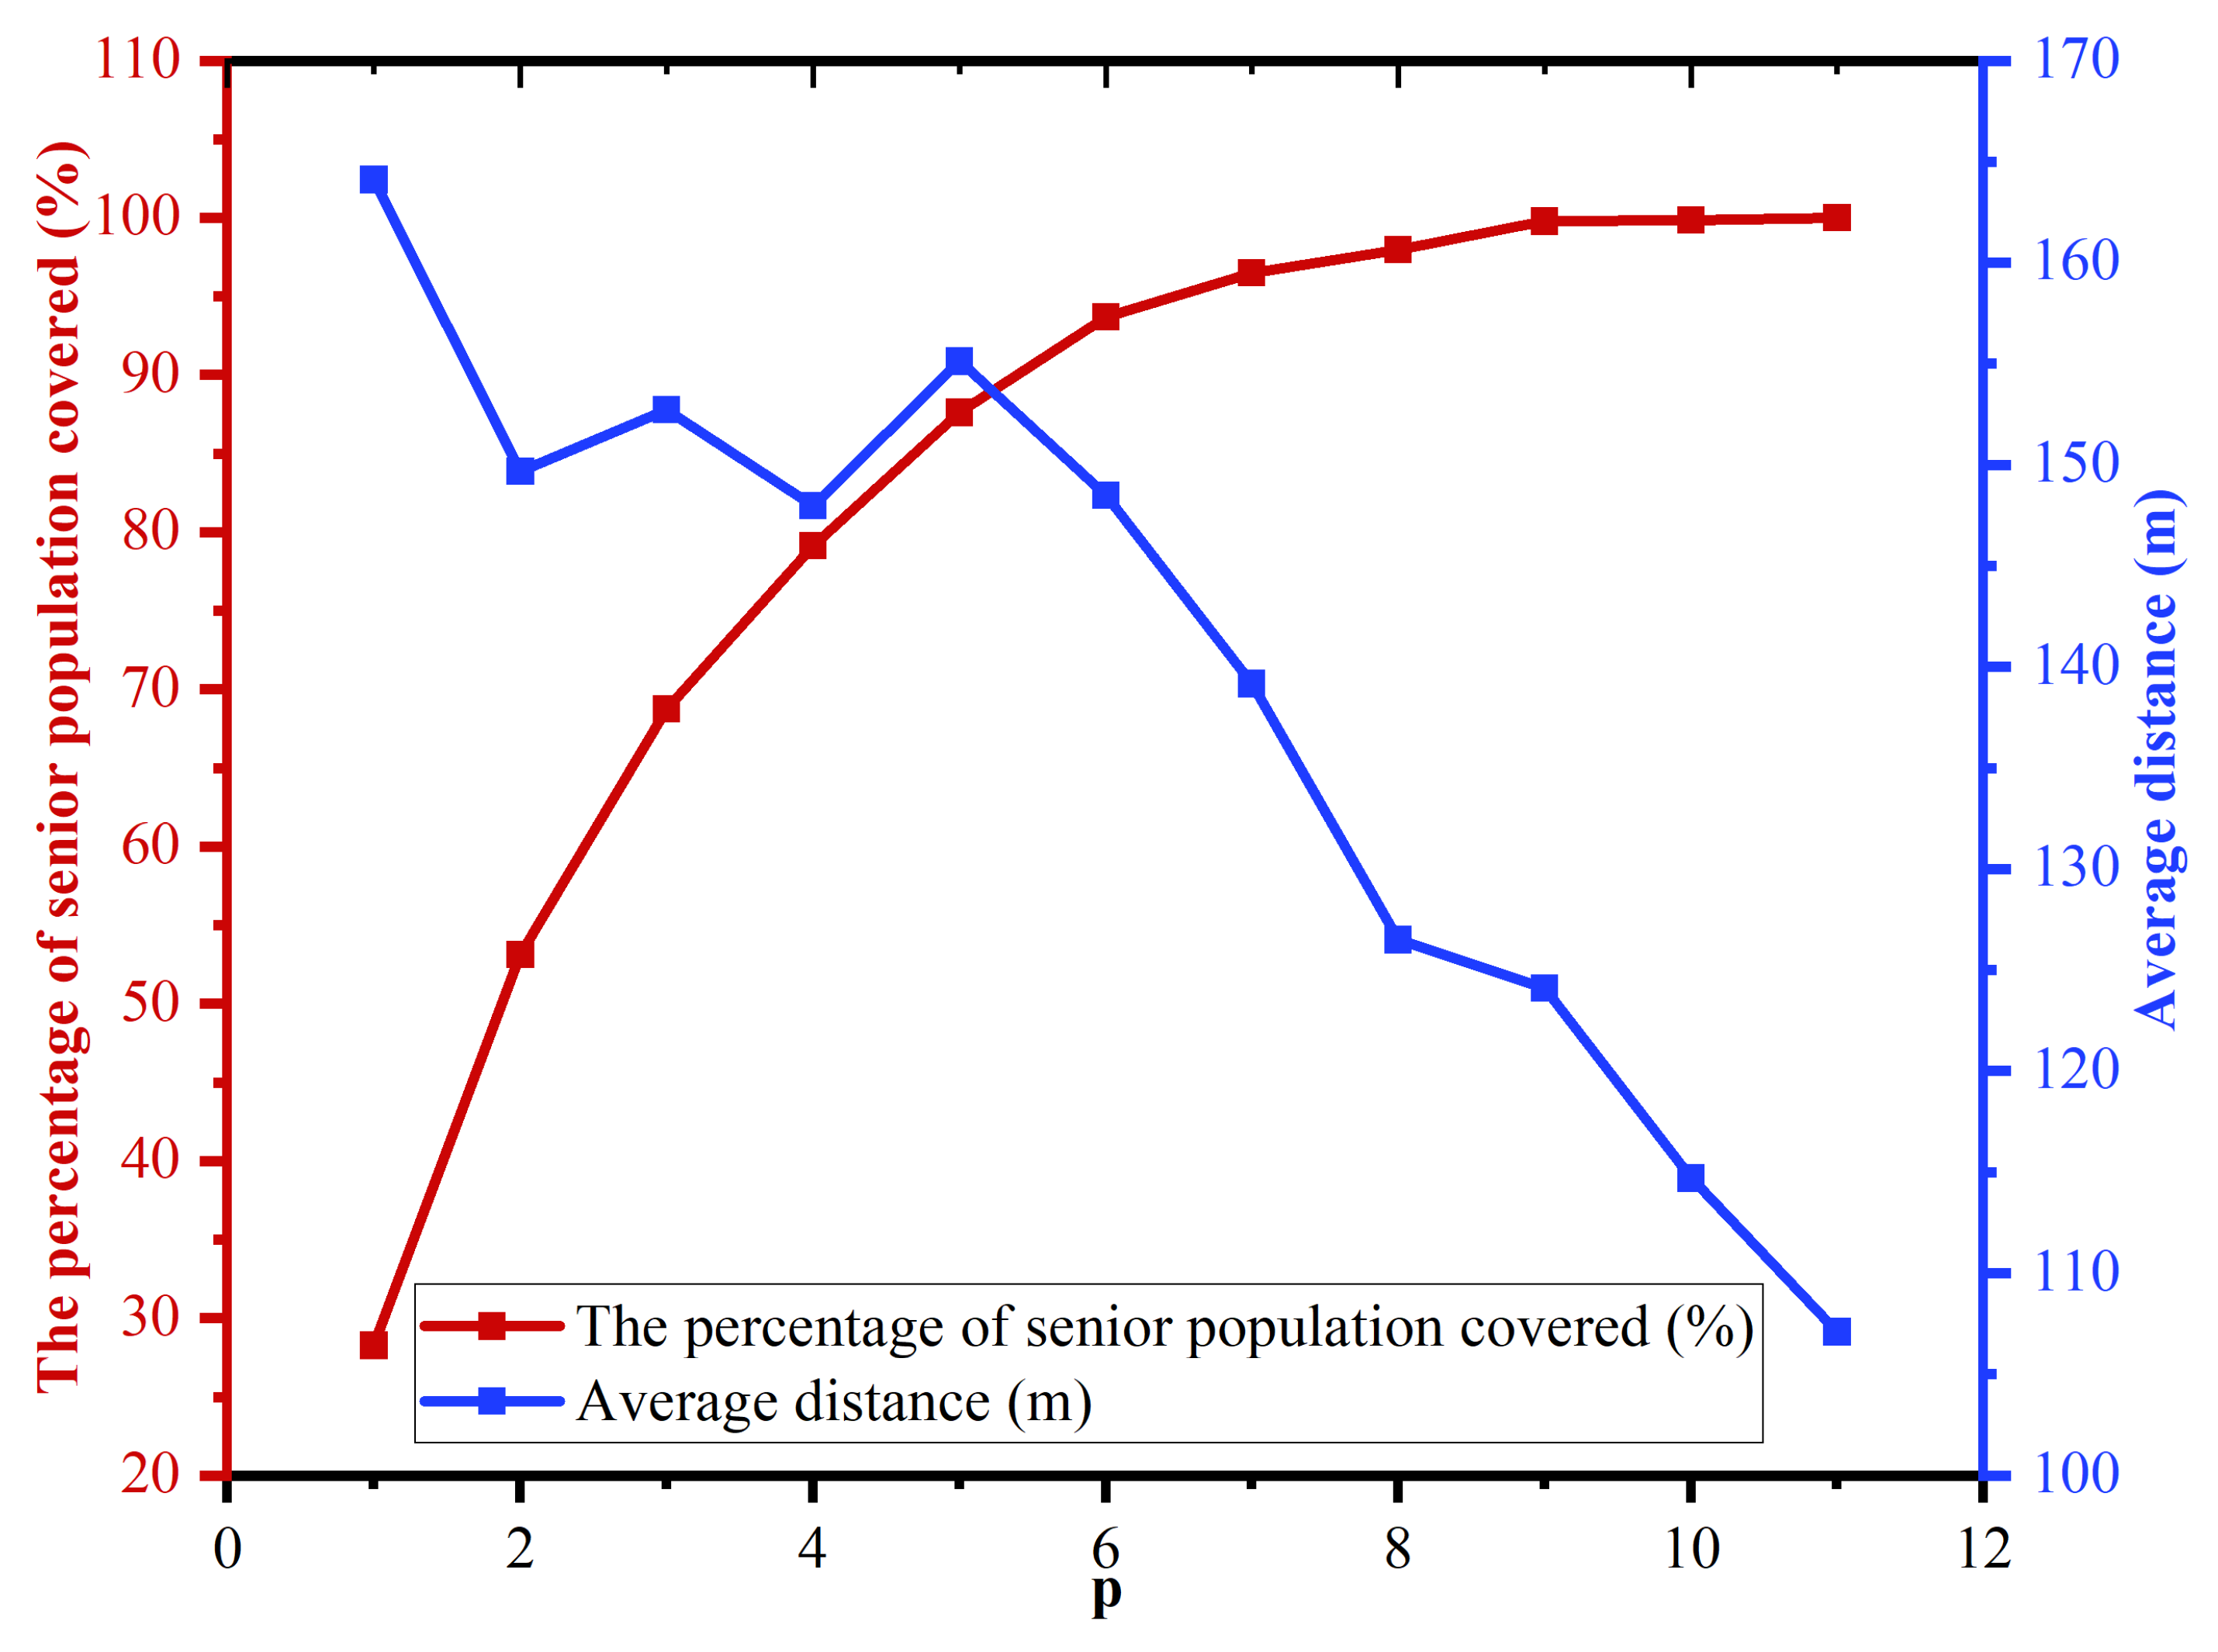
ranging from 1 to 11. As shown in
Figure 6, the number of senior citizens covered increases rapidly with the valve of
when the percentage of senior citizens covered is below 90% in Community B and then the growth rate slows down. The average distance fluctuates at approximately 150 m when
ranges from one to six. This is due to the limited capacity of nearby recreational places surrounding the concentrated high-density residential areas in the community. When
increases from 7 to 11, the average distance shows a continuous decreasing trend. When
is 11, we have
, indicating that 11 senior-friendly restaurants are needed to serve all senior citizens in this community. In this situation, each senior citizen needs to walk 107.11 m on average from restaurants to recreational places for activities. With six senior-friendly restaurants built, the coverage exceeds 90%, achieving a high coverage. In this scenario, each senior citizen needs to walk 148.49 m on average for post-meal recreational activities.
4.2.4. Comparison of Communities A and B
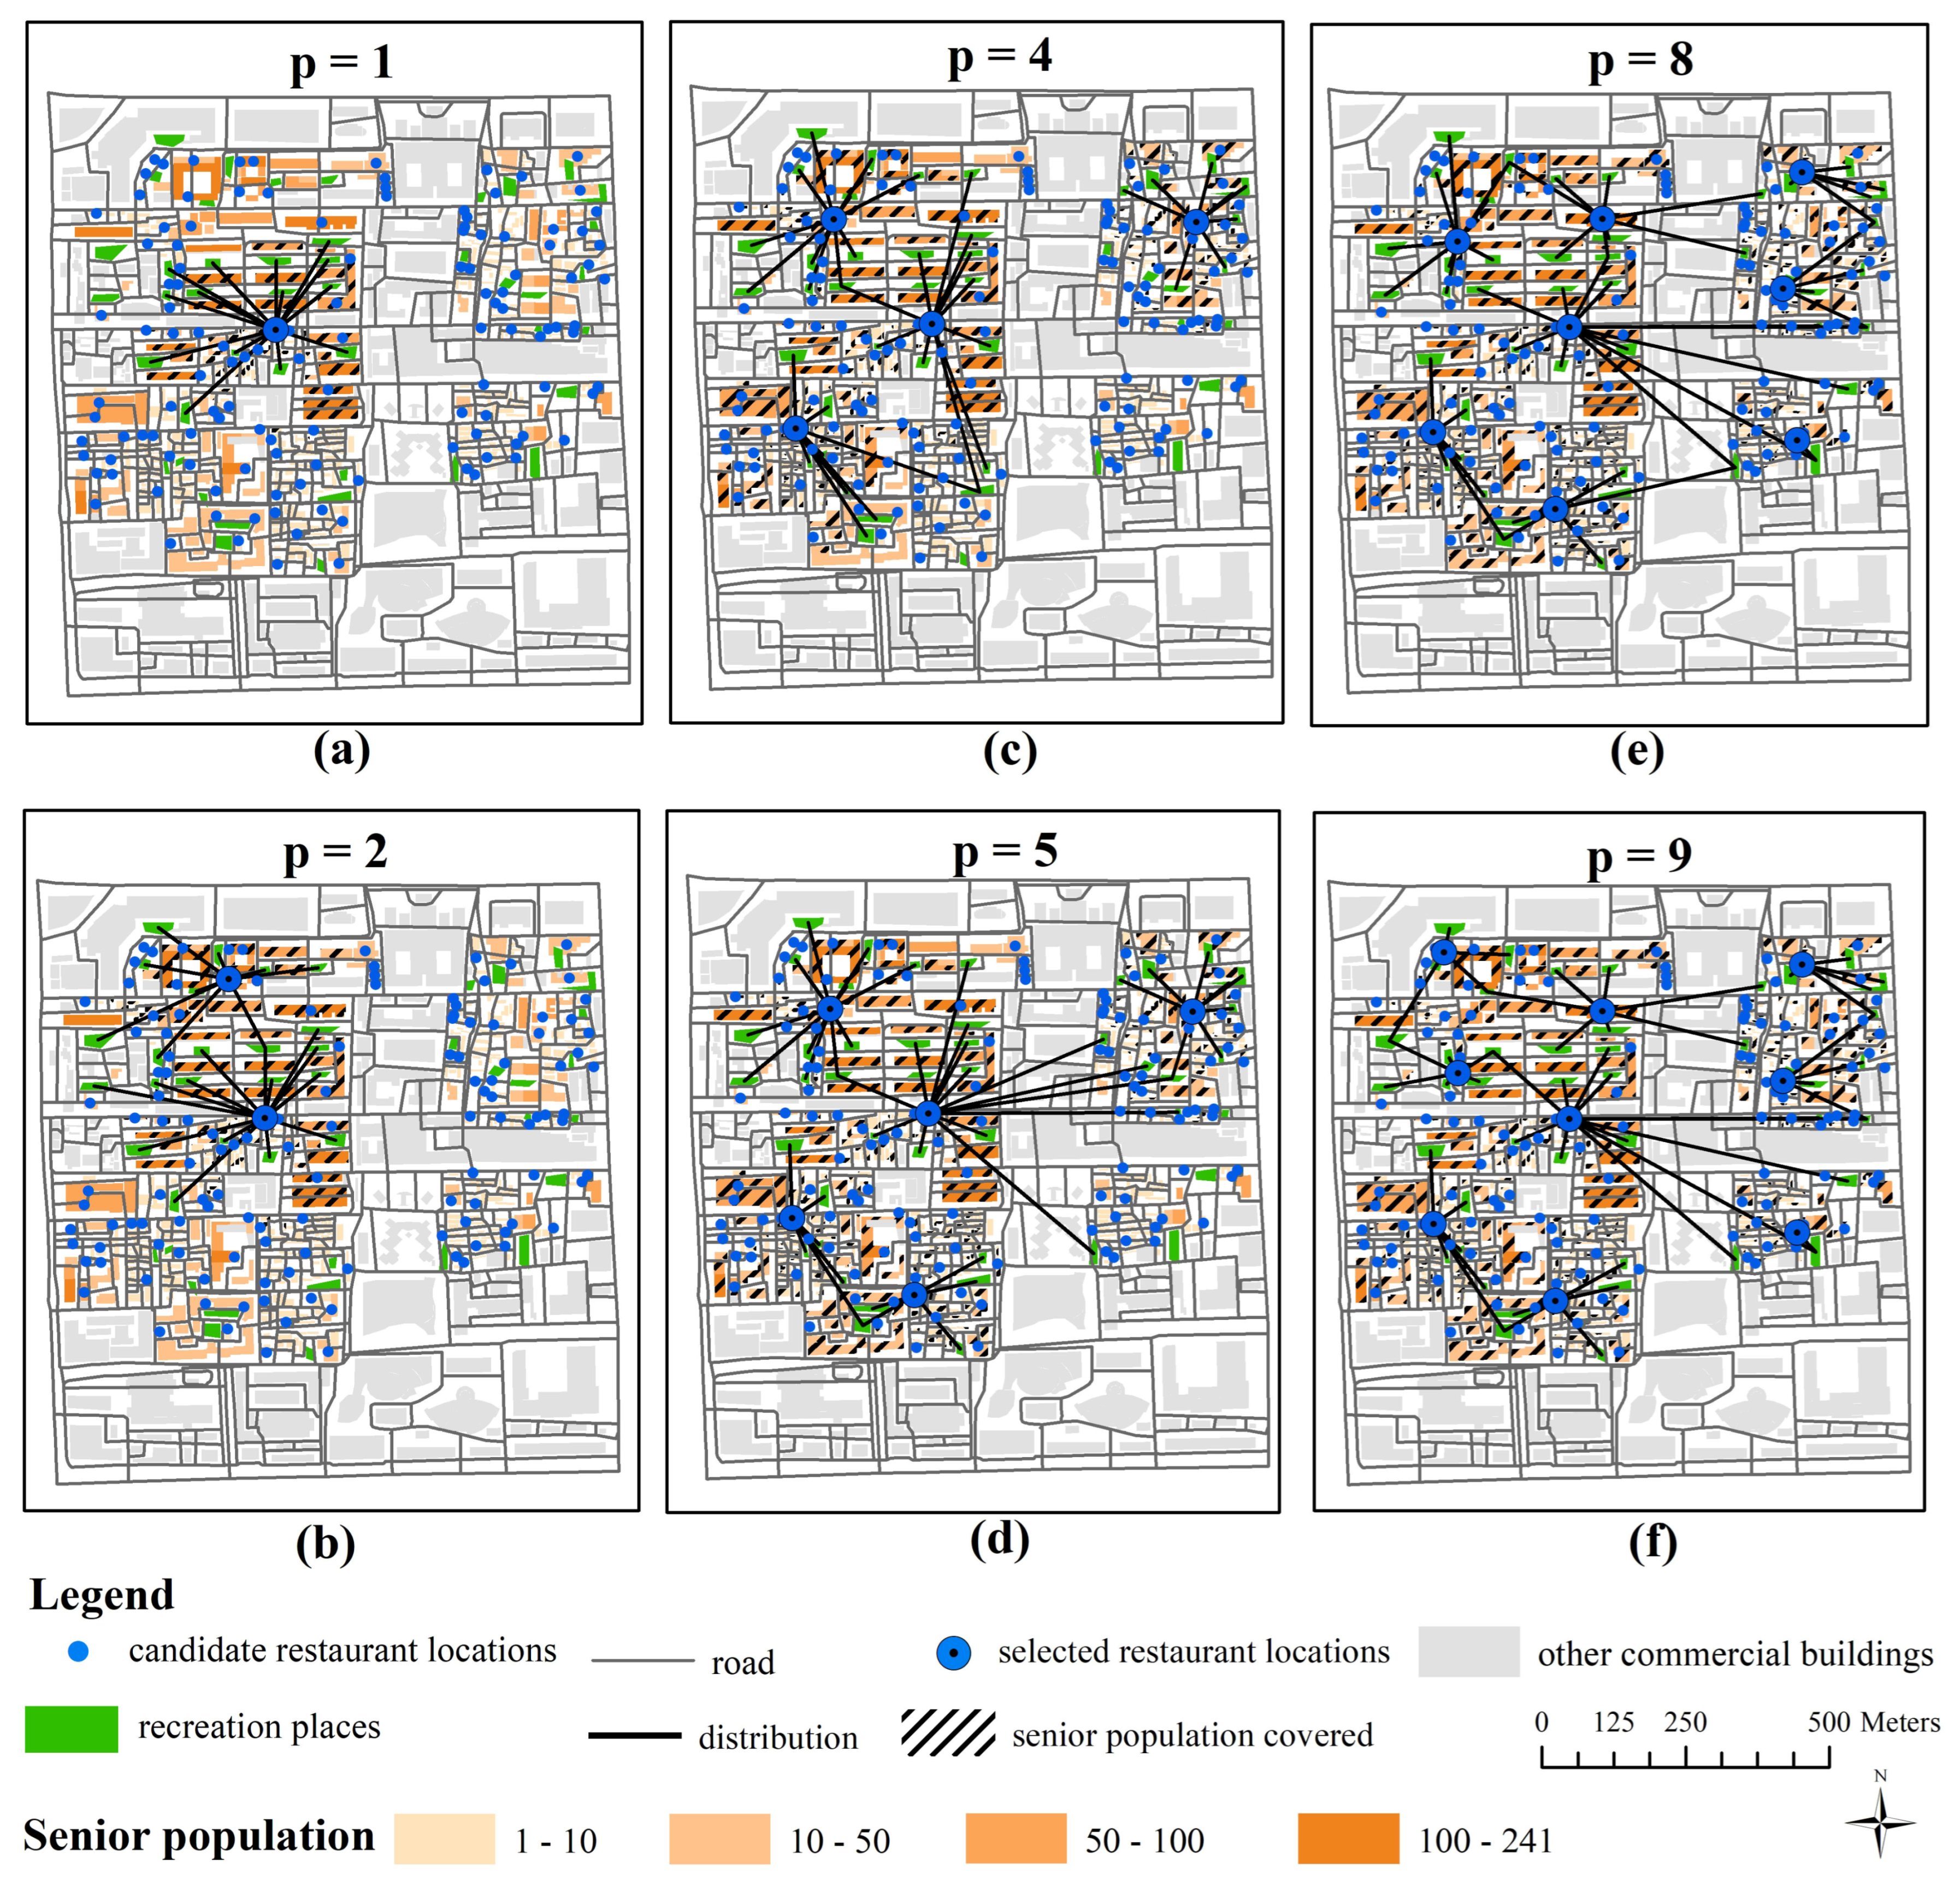
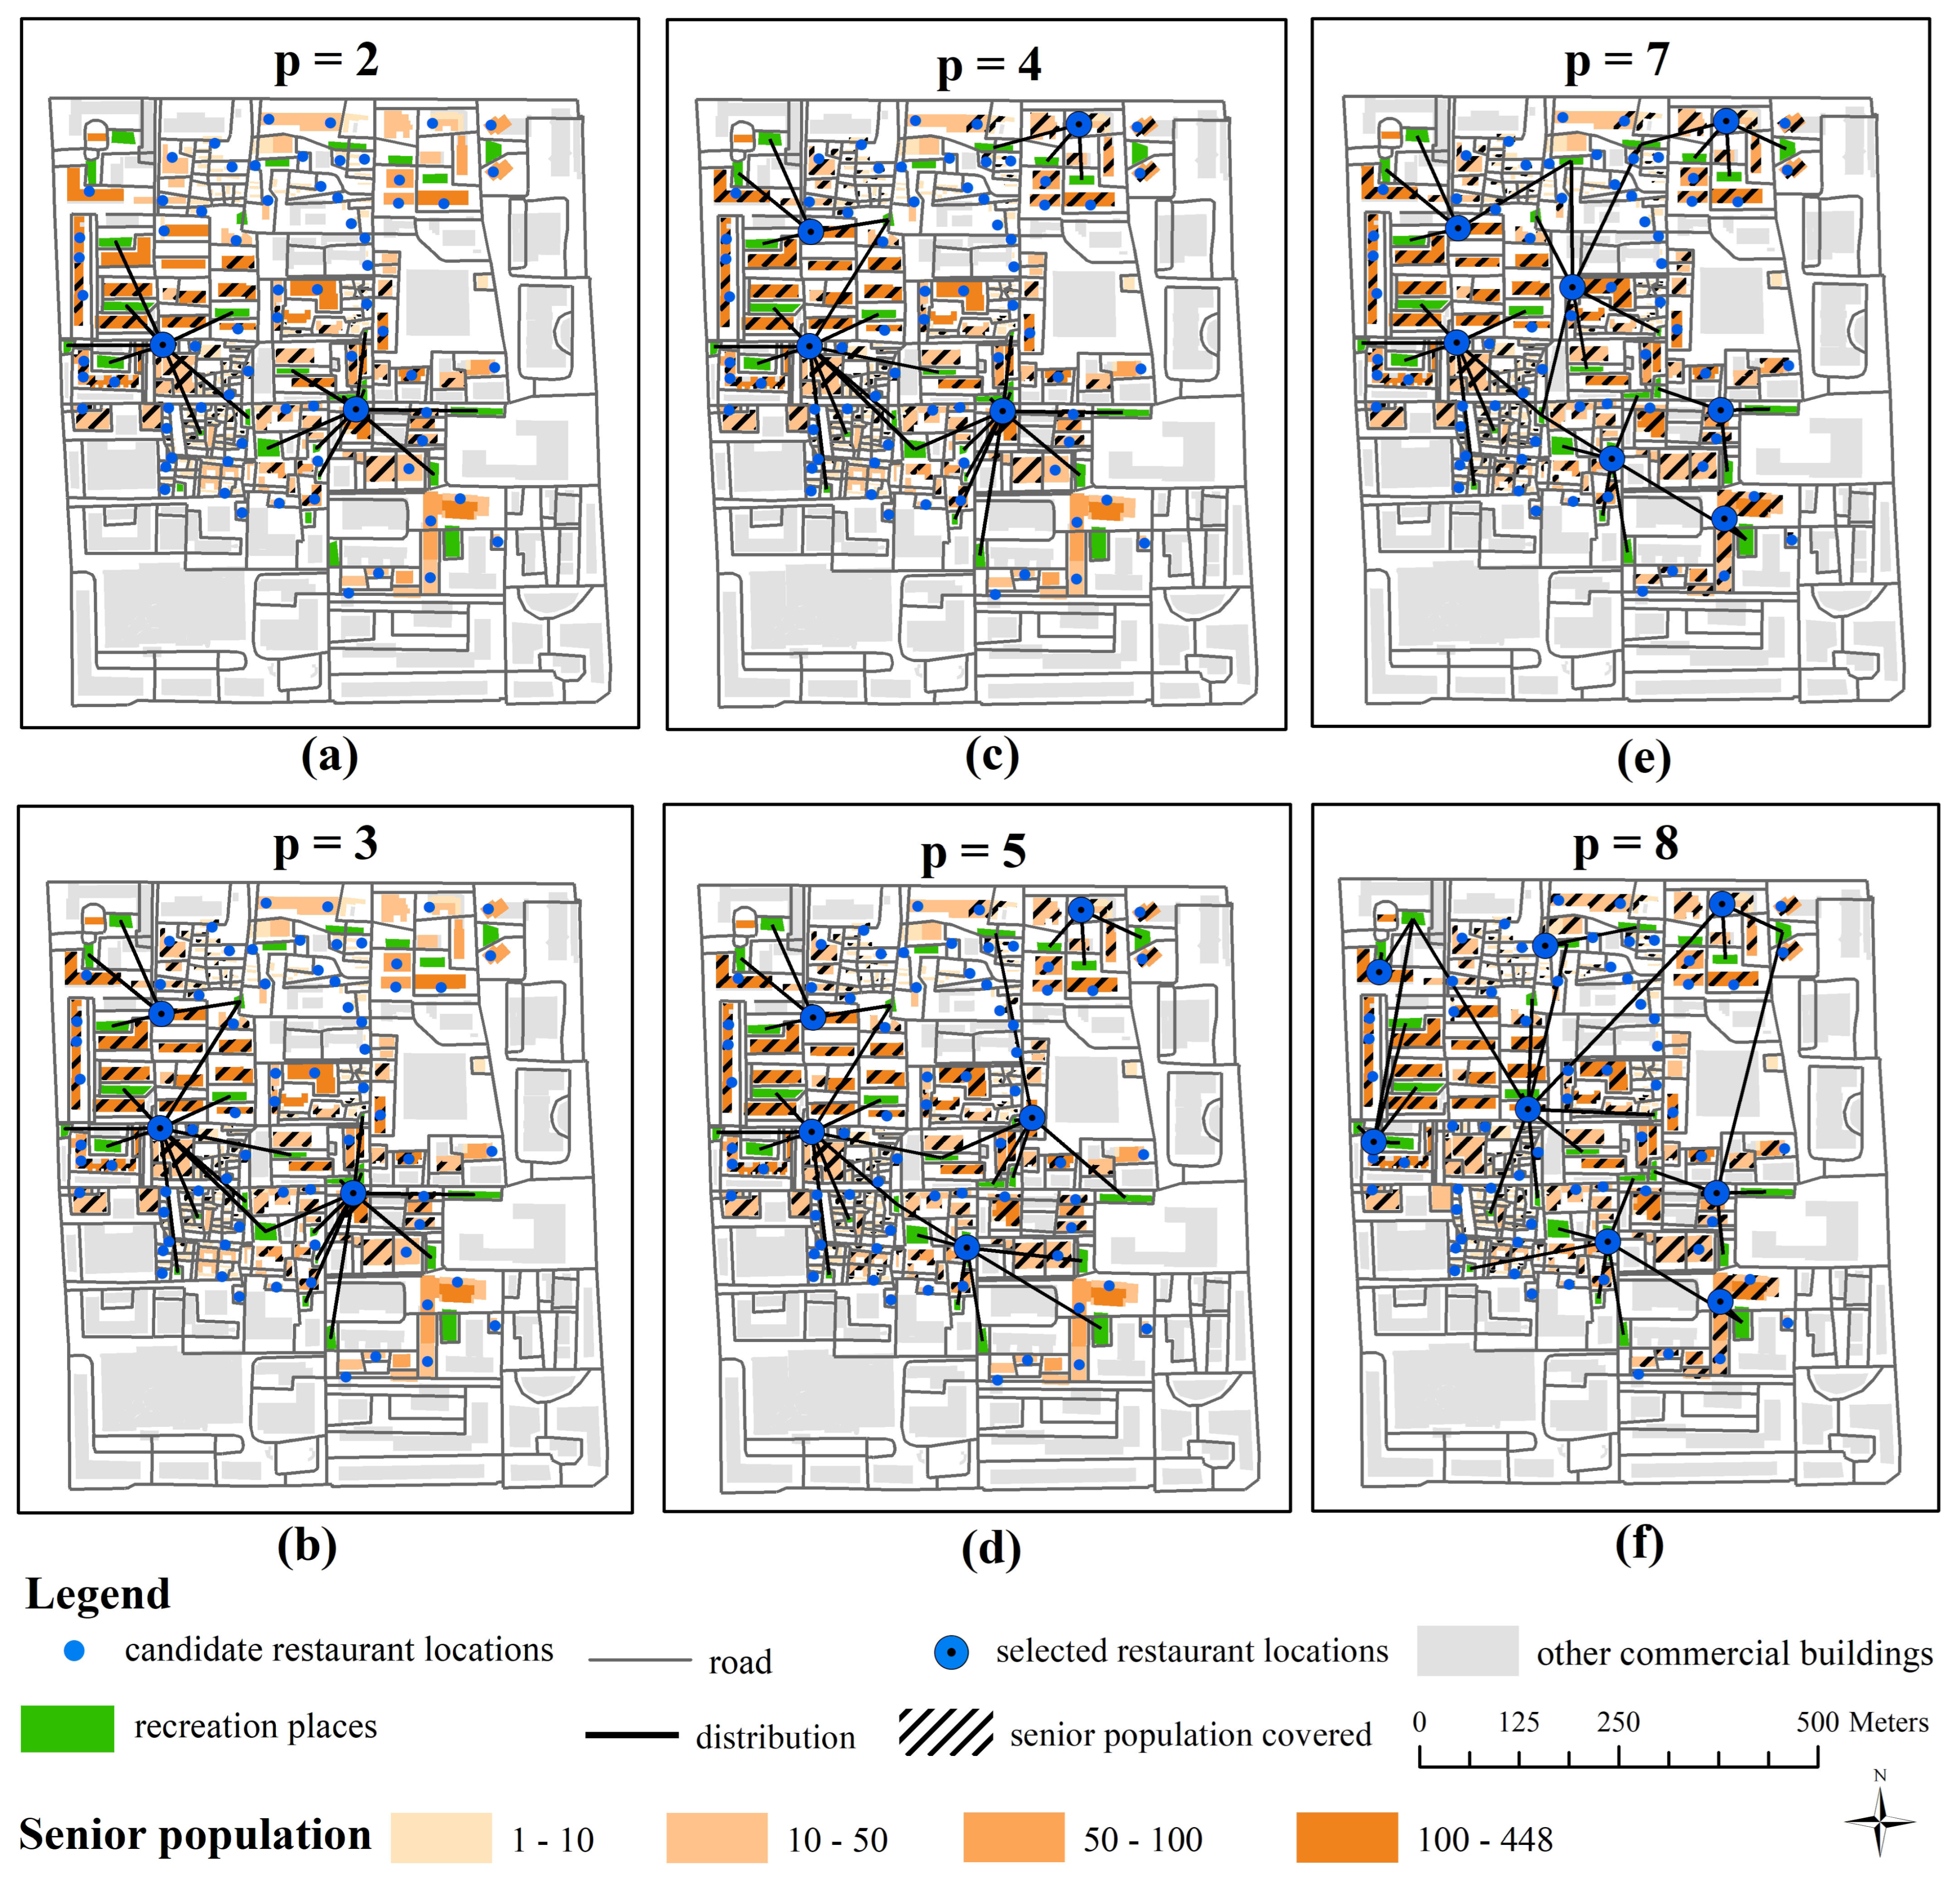
Figure 7 and
Figure 8 present the optimal solutions for Community A and Community B for selected
values, respectively (also see
Figure A1 and
Figure A2 in
Appendix A for all
values). When
is small, we observe an increasing trend in both the number of covered senior citizens and the average distance from restaurants to recreational places in both communities as
increases. For instance, in
Figure 7a,b, the number of restaurants in Community A increases from one to two. The same trend is more evident in the high-density residential areas of Community B, as shown in
Figure 8a–d, where the number of restaurants in Community B increases from two to three and then from four to five. These patterns arise due to the limited capacity of nearby recreational places. Increasing the number of senior-friendly restaurants expands their coverage to a larger population of senior citizens. However, when the capacity of nearby recreational places is reached, senior citizens will be allocated to locations farther away, leading to an increase in the average distance.
Further increasing the number of restaurants can effectively reduce the average distance.
Figure 7c,d show this pattern when the number of restaurants in Community A increases from four to five. The additional restaurants are located closer to recreational places, decreasing the overall average distance. However, this approach may cause some senior citizens previously assigned to these recreational places to be allocated to more distant places.
When senior-friendly restaurants already cover a large portion of senior citizens, the additional restaurants tend to be located near recreational places, further reducing the average distance. This is evident in
Figure 7e,f, where the number of restaurants in Community A increases from eight to nine, and in
Figure 8e,f, where the number of restaurants in Community B increases from seven to eight. However, this location selection leads to a greater disparity in travel distances among senior citizens. Placing restaurants near recreational areas benefits the majority of seniors by assigning them to closer facilities. However, we also note that a small portion of senior citizens are allocated to further recreational places.
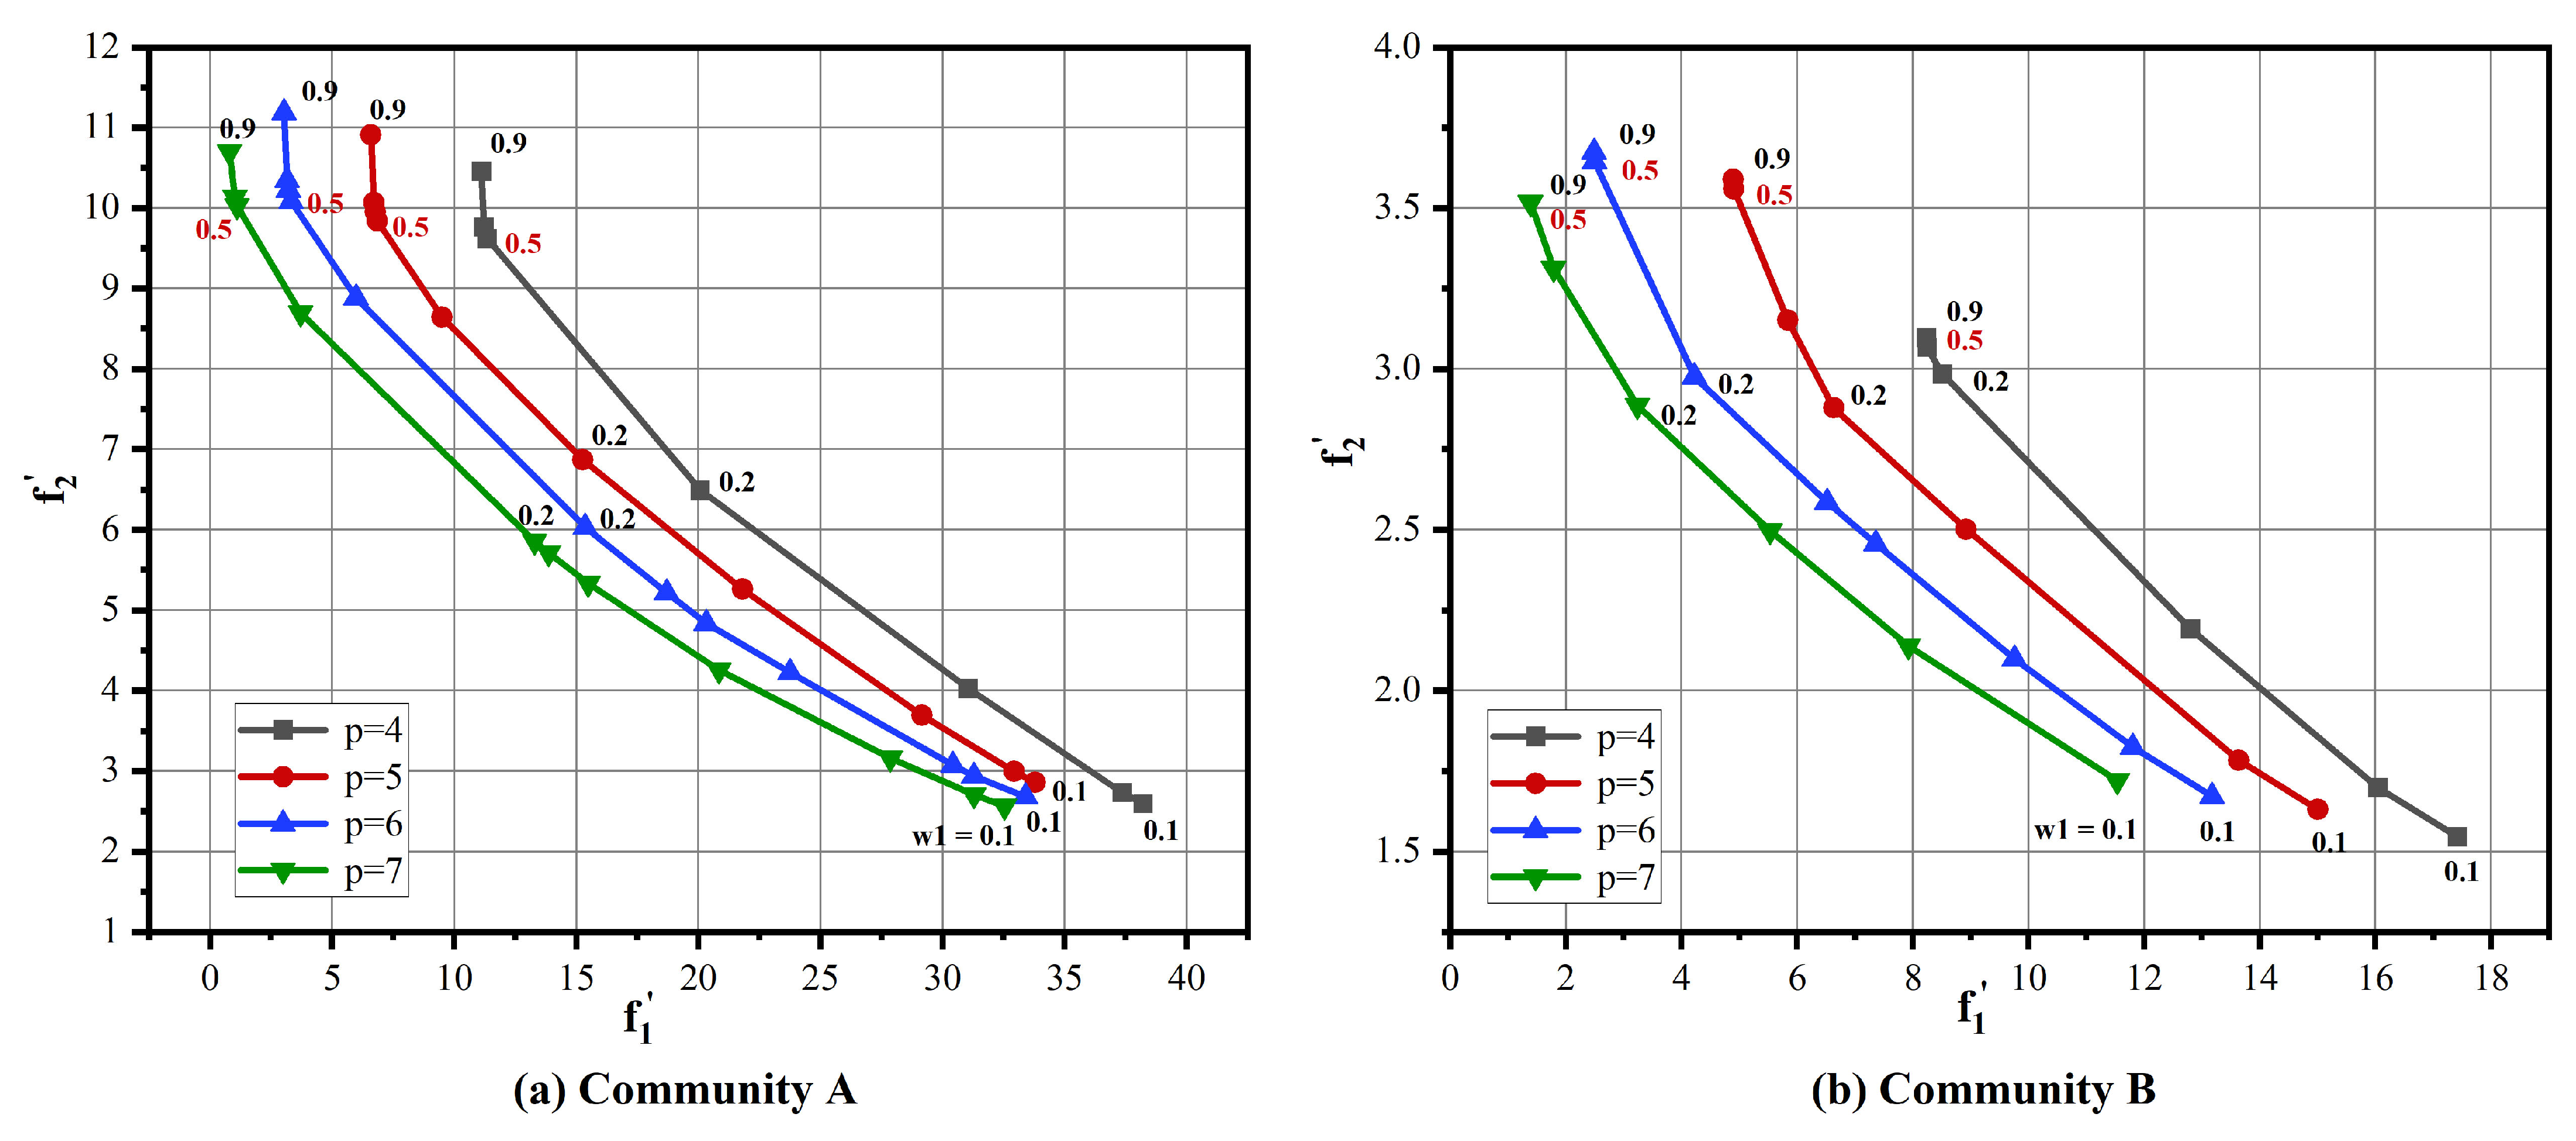
We obtained the Pareto optimal solution for
as four, five, six, and seven by increasing the value of
at 0.1 steps from 0.1 to 0.9.
Figure 9a,b show the solutions for Communities A and B, respectively. Some similar patterns can be observed in both communities. We note that
declines with increasing
and vice versa, indicating that one objective is improved by sacrificing the other objective. Furthermore,
always decreases with increasing
when the value of
is fixed. This indicates that as
increases, restaurants can always cover more senior citizens. However, the relationship between
and
is not monotonic. The overall distance depends on both the number of senior citizens covered and the distance between the restaurant locations and the recreational places.
5. Discussion
The patterns of optimally locating senior-friendly restaurants in the two communities have certain similarities. The CSRLP model always prioritizes the number of senior citizens covered when the number of restaurants to be built () is small. In this case, the selected restaurants are dispersed, and the overlap of service areas is minimal. As increases, the selected restaurants gradually move closer to recreational places. As a result, the increase in coverage for senior citizens slows down when is large. In this case, the location selection of senior-friendly restaurants is mainly influenced by the distance between restaurants and recreational places.
In both communities, senior citizens living close to the border areas of the community or residential clusters might face more challenges in receiving services from senior-friendly restaurants. We note that simply including more senior-friendly restaurants might not significantly improve the coverage of this population. Given that these people are only a small proportion of the overall senior population and reside in border areas, increasing the population’s coverage by adding additional restaurants might only have a small contribution to the overall objective value. Instead, allocating additional restaurants to reduce the travel distance between restaurants and recreational places might help reduce the objective value more efficiently.
This study provides a valuable instrument for urban planners aimed at identifying optimal locations for senior-friendly restaurants within communities. The CSRLP model proposed in this paper could potentially be extrapolated to help with location selection for other public service facilities. The implications of this research may be beneficial to stakeholders engaged in the planning and management of community facilities. In general, it is advantageous for senior-friendly restaurants to be dispersed throughout a community, achieving two essential objectives: First, this distribution minimizes overlapping service areas, thereby extending coverage to a greater number of senior citizens. Second, it lessens the potential competition for recreational space that may arise when multiple restaurants are situated in close proximity.
Through a comparative analysis of Community A and Community B, we found that locating senior-friendly restaurants in high-density residential areas may lead to insufficient capacity in nearby recreational places. Urban planners could consider further plans to increase the number of recreational places in these high-density residential areas. Additionally, placing restaurants near recreational places should take into account the issue of a small portion of senior citizens being allocated to more distant recreational places. One potential solution is to expand the capacity of nearby recreational places. Furthermore, as previously indicated, the needs of senior citizens living near the periphery of a community may be challenging to meet, particularly when the availability of senior-friendly restaurants is limited. Hence, planners should prioritize catering to the fundamental needs of this demographic. In scenarios where the placement of additional senior-friendly restaurants is impractical, communities may consider alternative solutions such as home delivery services [
19].
With the introduction of the concept of perceived accessibility, the assessment of a location’s accessibility can no longer rely solely on physical distance [
71]. Senior-friendly restaurants provide meal-assistance services for the elderly population, and their appeal is intricately linked to the dining experience, the satisfaction of elderly patrons, and the growing trend of the elderly population considering restaurant dining as an opportunity for social interaction to fulfill their companionship needs. To enhance the perceived accessibility of senior-friendly restaurants, various improvements can be considered. These include the addition of amenities like handrails, comfortable seating options, and menus tailored to meet the nutritional requirements of the elderly. In cases where very elderly individuals struggle to procure their meals independently and heavily rely on their family members, restaurants might explore the option of providing delivery services to cater to the specific needs of this demographic.
In the post-COVID scenario, elderly individuals may have become more accustomed to accessing food and activities through virtual means [
72]. However, virtual options are unlikely to entirely replace the physical act of seniors dining at the restaurant. In their post-retirement years, seniors often have the leisure time to visit these restaurants. Additionally, dining out provides a way for seniors to break the monotony of staying at home for extended periods and combat feelings of isolation.
We note that this study also has some limitations. Due to concerns regarding privacy and the availability of data, the senior population in Communities A and B is estimated by multiplying the total population by the ratio of senior citizens in the studied area. This method may yield results that diverge from the actual senior population count. Nevertheless, the validity of the CSRPL model’s demonstration remains unaffected. Furthermore, this study does not take into consideration the capacity of senior-friendly restaurants. Although integrating a capacity constraint into the CSRPL model is conceptually straightforward, it has been excluded for two reasons. First, in practical applications, the timing and duration of senior citizens’ restaurant visits vary, making it challenging to estimate a restaurant’s capacity based solely on its size. Second, once the locations of senior-friendly restaurants have been determined, these establishments can be designed in accordance with the distribution of demand, thereby ensuring that all nearby demand can be met.
6. Conclusions
The process of locating senior-friendly restaurants within communities ought to prioritize both equitable access and convenience. On the one hand, as these facilities receive government funding, their locations should be chosen to ensure that the majority of the senior population falls within the service area. On the other hand, the positioning of these restaurants should consider seniors’ behavioral patterns, such as routine post-meal exercise. Thus, minimizing the distance between senior-friendly restaurants and recreational places presents a viable strategy to promote senior citizen health and enhance the age-friendliness of the community. In this paper, we introduce a bi-objective CSRLP model designed to optimize both equality and convenience in the site selection of senior-friendly restaurants. We offer an integer linear formulation of the CSRPL, which incorporates service coverage, proximity to recreational places, and capacity constraints of said recreational places. Simulation tests reveal that the CSRPL model can be solved within a reasonable timeframe. We also applied the CSRPL model to the restaurant location selection process in two communities exhibiting differing demands and recreational place distribution patterns in Dongcheng District. We examined a variety of scenarios regarding different numbers of restaurants sited and different weight configurations. By consolidating the test results, this study offers crucial insights for planners and stakeholders involved in community planning and management.
Future research into the activity behavior of seniors could potentially contribute to the more effective optimization of public service facility locations within communities. In terms of convenience, the CSRLP model only considers the post-meal activity of senior citizens. However, beyond senior-friendly restaurants and recreational locations, the daily activity space of seniors forms a travel chain that includes multiple locations, such as grocery stores, healthcare facilities, and religious centers [
73]. Incorporating a comprehensive understanding of seniors’ daily activity spaces and travel chains might foster a deeper comprehension of the objectives and constraints involved in selecting locations for senior-friendly restaurants and other facilities. With advancements in smartphone and GPS technology, the collection of origin-destination data for seniors’ travel has become increasingly feasible. Future research could effectively utilize these data, thereby significantly enhancing the model’s accuracy and more closely aligning with the actual travel behavior of senior citizens. Beyond identifying senior-friendly restaurants, we can also adapt the CSRLP to solve location selection problems for various facilities by factoring in the daily movements of diverse social and demographic groups. For instance, the CSRLP could aid in selecting sites for healthcare facilities by considering the mobility patterns of disabled individuals [
74]. Additionally, integrating CSRLP with predictive analytics of Point-of-Interest (POI) data on young people’s travel behaviors could facilitate the establishment of youth-oriented amenities, such as cinemas and restaurants, in their preferred areas [
75,
76,
77].


