Article

A Latent-Factor-Model-Based Approach for Traffic Data Imputation with Road Network Information

1
Faculty of Information Technology, Beijing University of Technology, Beijing 100124, China
2
Faculty of Humanities and Social Sciences, Beijing University of Technology, Beijing 100124, China
*
Author to whom correspondence should be addressed.
ISPRS Int. J. Geo-Inf. 2023, 12(9), 378; https://doi.org/10.3390/ijgi12090378
Submission received: 7 July 2023 / Revised: 6 September 2023 / Accepted: 7 September 2023 / Published: 15 September 2023
(This article belongs to the Topic Artificial Intelligence in Navigation)

Abstract

:
With the rapid development of the economy, car ownership has grown rapidly, which causes many traffic problems. In recent years, intelligent transportation systems have been used to solve various traffic problems. To achieve effective and efficient traffic management, intelligent transportation systems need a large amount of complete traffic data. However, the current traffic data collection methods result in different forms of missing data. In the last twenty years, although many approaches have been proposed to impute missing data based on different mechanisms, these all have their limitations, which leads to low imputation accuracy, especially when the collected traffic data have a large amount of missing values. To this end, this paper proposes a latent-factor-model-based approach to impute the missing traffic data. In the proposed approach, the spatial information of the road network is first combined with the spatiotemporal matrix of the original traffic data. Then, the latent-factor-model-based algorithm is employed to impute the missing data in the combined matrix of the traffic data. Based on the real traffic data from METR-LA, we found that the imputation accuracy of the proposed approach was better than that of most of the current traffic-data-imputation approaches, especially when the original traffic data are limited.

1. Introduction

In the last ten years, with the rapid development of the world’s economy, car ownership has grown rapidly. Taking Sichuan Province as an example, the scale of the car manufacturing industry and the number of cars produced, as two main indicators of the national economy, have increased by 29.4% and 84.2% from January to April 2022, respectively, compared to the same period for the previous year [1]. The increasing number of cars has greatly increased the traffic pressure on the road network. The latest data from the Beijing Municipal Commission of Transport shows that, at 8:00 a.m. on 1 September 2022, the transportation congestion index of the main road network of Beijing was 8.0, which is considered to be serious traffic congestion [2]. Traffic congestion not only seriously affects people’s travel experience, but also causes many problems, such as air pollution, noise, etc. To handle these problems, intelligent transportation systems play an increasingly important role in traffic management [3]. Based on accurate traffic data prediction, intelligent transportation systems can effectively alleviate traffic congestion in the road network [4]. However, the accurate prediction of traffic data needs to be based on complete traffic data.
Currently, traffic data collection is mainly based on roadside facilities [5] (i.e., radar speed guns) or the GPS on cars [6,7]. However, both traffic data collection methods have their shortcomings, which leads to missing data [8]. By using roadside facilities, the traffic data of the roads can be continuously collected; however, the traffic data of roads without roadside facilities will be lacking. Based on the GPS data of cars, the traffic data of different roads can be calculated and collected. However, it is not possible for all roads in a road network to have cars with GPS at the same time, so there will be missing traffic data from roads with cars that do not have GPS. The missing traffic data will greatly reduce the effectiveness and efficiency of traffic management by intelligent transportation systems. At present, the main challenges in the research field of missing traffic data imputation include few public data sets, a high missing data rate, inaccurate data, etc. Currently, the main solutions to handle the above challenges are to use more accurate mechanisms or additional information to improve the imputation accuracy.
Based on these problems, in recent years, many approaches have been proposed to achieve missing traffic data imputation from different perspectives [9,10,11,12]. According to the mechanisms they use, the data imputation approaches can be roughly divided into three categories, which are interpolation-based approaches, regression-based approaches, and matrix-factorization-based approaches.
Interpolation is a widely used mechanism for missing data imputation [13]. The idea of interpolation is using the neighboring existing values to estimate the missing values based on different types of functions. For example, linear interpolation estimates the missing values by calculating the mean of the adjacent existing values. Polynomial interpolation estimates the missing values by constructing an n-degree polynomial function f ( x ) that satisfies all the conditions of the existing values. Spline interpolation estimates the missing values by constructing a set of piecewise lower-order polynomial functions that satisfy all the conditions of the existing values. In the last decade, many interpolation approaches have been proposed for missing traffic data imputation. For example, Ma et al. proposed a copula-based model for missing traffic data imputation [14]; Li et al. proposed an algorithm based on the spatial–temporal queuing mode [15]; Soriguera and Robuste found that the interpolation approaches omitting traffic dynamics and queue evolution cannot achieve accurate traffic data imputation and prediction [16].
The regression-based missing data imputation approaches use different functions to fit the temporal and spatial relationships of existing values to calculate the missing values according to the functions. Common regression models include linear regression, ridge regression, Lasso regression, ElasticNet regression, etc. [17,18,19].
The matrix-factorization-based approaches perform missing value imputation or estimation using lower-dimensional factor matrices or tensors to fit the existing values in the matrices or tensors. They have the advantages of wide applicability, easy expansion, high prediction accuracy, and easy interpretation [20,21].
Although, in the last twenty years, many approaches have been proposed to achieve missing traffic data imputation, most of these approaches have their limitations, which reduce their accuracy and efficiency in performing missing traffic data imputation in real applications:
  • Because the interpolation-based approach only considers the neighboring data of missing values and ignores the overall relevant data, the imputation accuracy of the interpolation-based approach is low;
  • Because it is difficult to fit the non-linear changes of traffic data by linear functions, the imputation accuracy of regression-based approaches is low when they are used to impute non-linear traffic data;
  • In real applications, many other forms information can be used to improve the accuracy of traffic data imputation, such as the road network structure, road conditions, etc. However, most of the current matrix-factorization-based approaches do not consider this information, which reduces their imputation accuracy.
Therefore, the motivation of this paper was to overcome the limitations of current traffic imputation approaches and use spatial information to improve the accuracy of the traffic data imputation of matrix-factorization-based approaches. In the proposed approach, a spatiotemporal matrix (i.e., road and time interval matrix) was used to represent the original traffic data. Then, the adjacent matrix of the road distance was constructed and combined with the spatiotemporal matrix in the road dimension. Finally, the latent-factor-model (LFM)-based algorithm [22] was used to impute the missing data in the combined matrix. The contributions of the proposed approach can be summarized as follows:
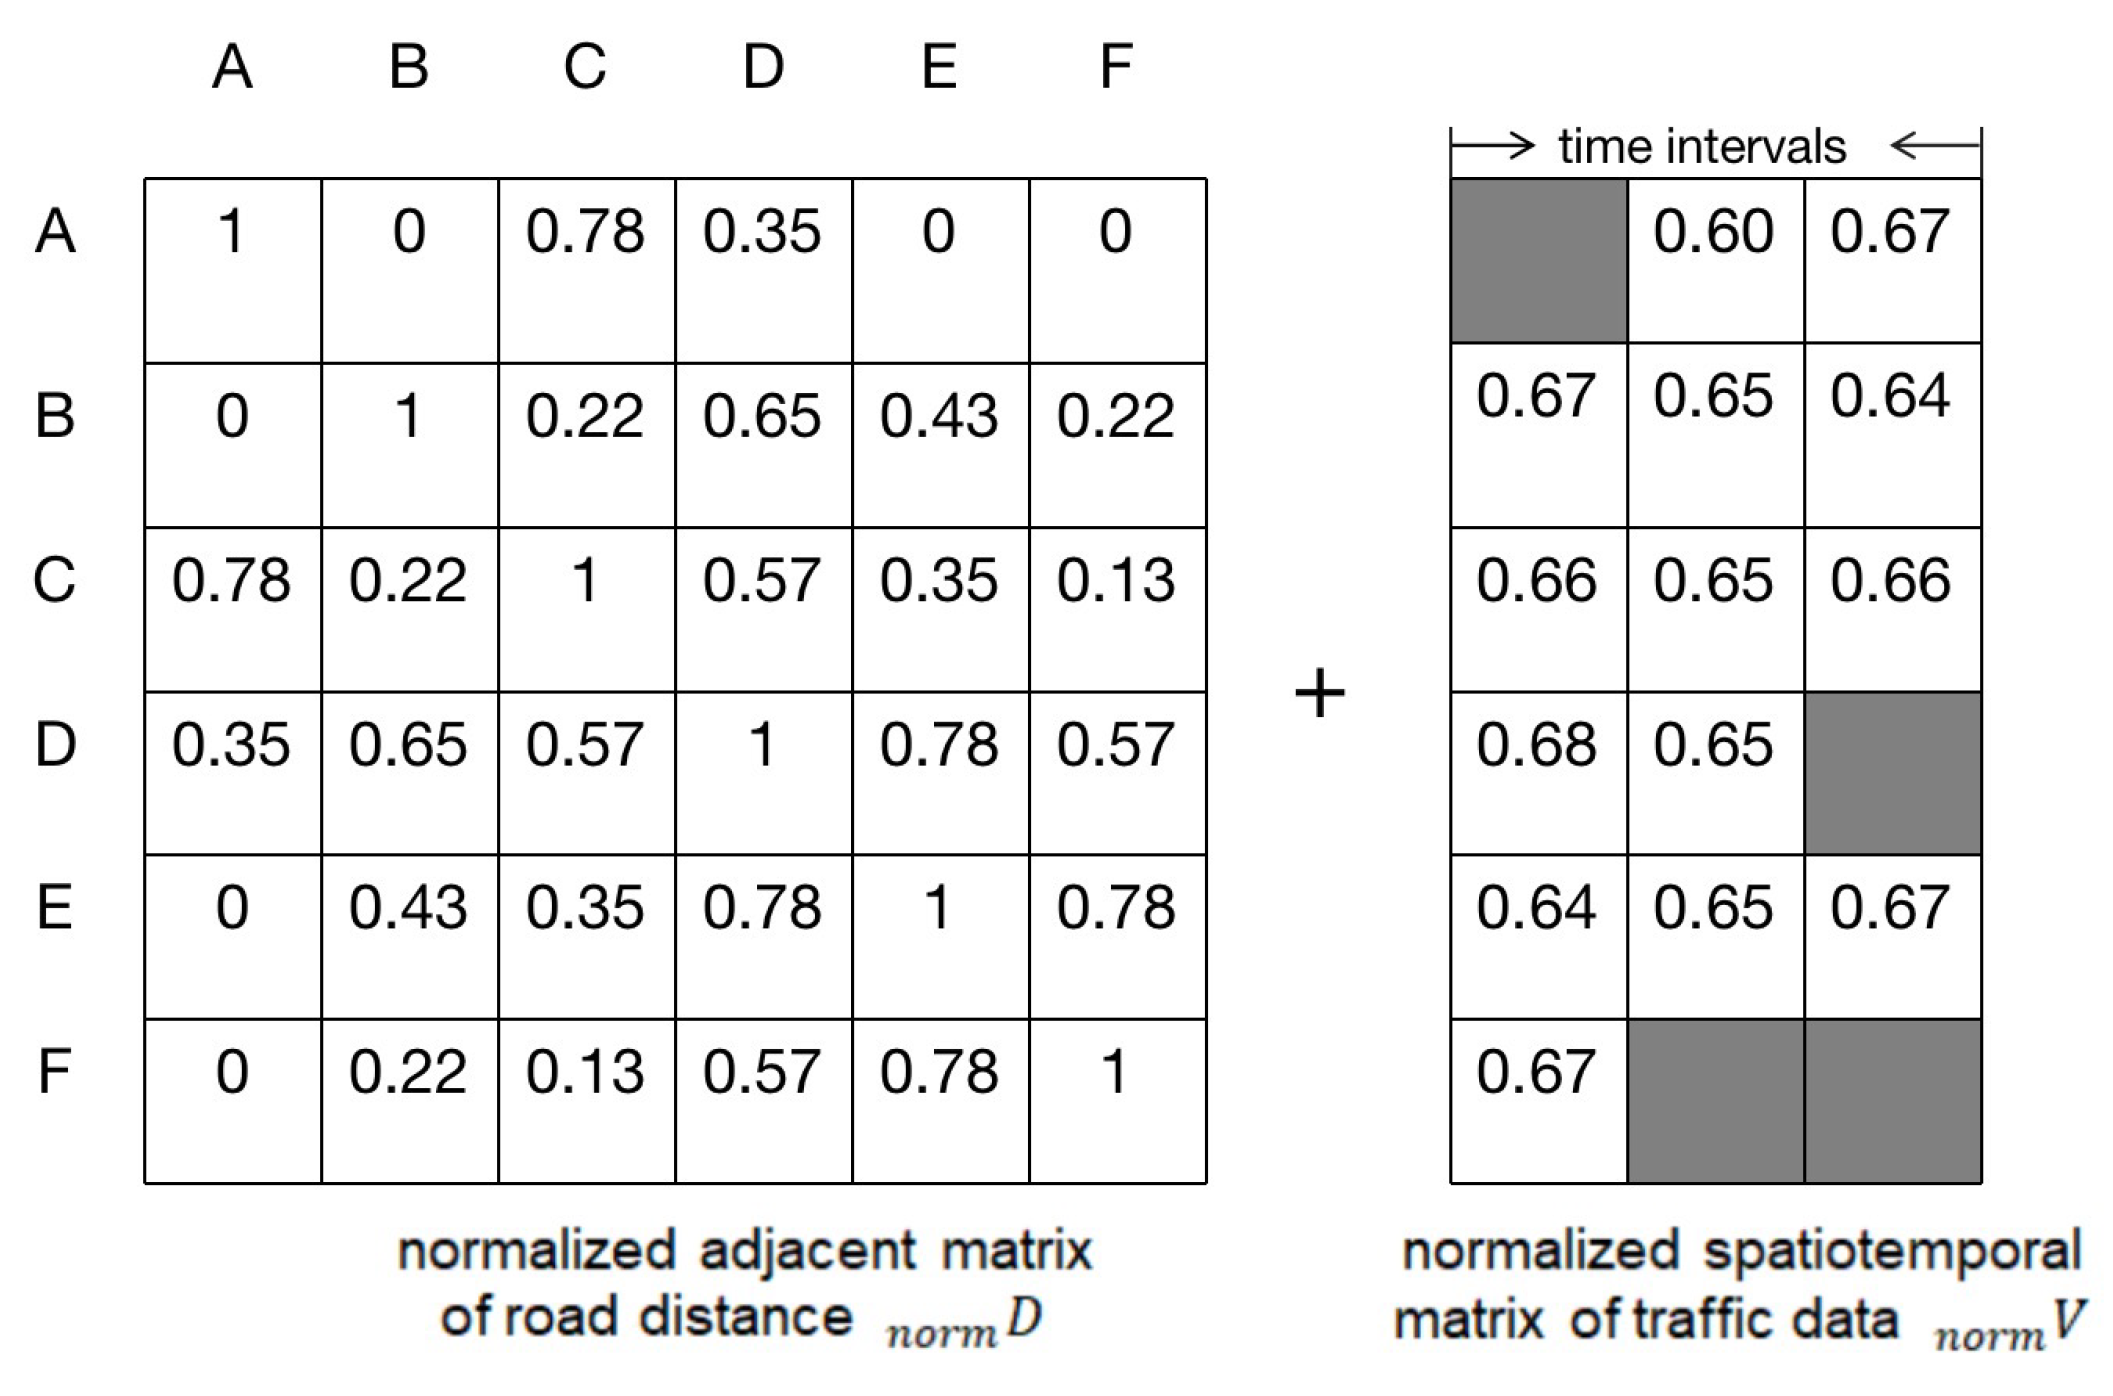
  • In the proposed approach, the adjacent matrix of road distance is proposed to represent the spatial information of the road network, which can be combined with original traffic data. This is an innovative mechanism to add auxiliary information to original traffic data;
  • The LFM-based data imputation algorithm is employed to impute the missing traffic data in the combined traffic data, so as to accurately impute the missing traffic data;
  • The real traffic dataset METR-LA is used to evaluate the performance of the proposed approach. The experimental results indicate that the proposed approach can achieve accurate traffic data imputation in different data missing patterns and with limited amount of traffic data.
The reminder of the paper is structured as follows. The related works are introduced and analyzed in Section 2. The traffic data imputation problem is given in Section 3. The basic principle of the proposed approach is described in Section 4. The experiments and analysis are provided in Section 5. Section 6 concludes the paper and gives our future research directions.

2. Related Works

In the last ten years, many missing traffic data imputation approaches were proposed from different perspectives [23,24,25,26,27,28,29]. In this section, we will introduce the representative approaches and compare them with the proposed approach.

2.1. Interpolation-Based Approaches

Some people used interpolation-based approaches to impute the missing data [30,31,32,33,34,35,36]. For example, Ma et al. proposed a copula-based model for missing traffic data imputation [14], which combined spatial dependency and marginal distribution from missing annual average daily traffic data. In their approach, copula, as a joint function, was used to capture the positive, negative or tail dependencies between values and impute missing values according to the captured dependencies. Li et al. proposed an algorithm based on the temporal–spatial queuing model [15]. Their algorithm used the correlations between the missing values and the values of upstream or downstream detectors to impute the missing traffic data and predict the future traffic data. Soriguera and Robuste found that the interpolation approaches omitting traffic dynamics and queue evolution cannot achieve accurate traffic data imputation and prediction [16]. Therefore, they proposed a traffic data interpolation approach through keeping the smoothness of imputed traffic data.
The interpolation-based approaches mainly use the neighboring data of missing data to achieve data imputation, which can quickly obtain the missing data without much calculation. Since the interpolation-based approaches only use the neighboring data of missing data to impute them and ignore the overall impacts of global data on the missing data, the imputation accuracy of interpolation-based approaches is low.

2.2. Regression Based Approaches

Some people used the regression-based approaches to impute the missing data [37,38,39,40]. For example, Rodrigue et al. proposed a framework to impute missing values in crowdsourcing traffic data [17]. In their framework, the multi-output Gaussian process was used to simulate the complex spatial and temporal correlations in the traffic data. By using Gaussian process regression, the framework could accurately impute the missing traffic data under medium and high loss rates. Li et al. proposed a data imputation method based on Bayesian vector autoregression [18], which can realize the imputation of missing data for mixed frequency traffic conflict data with irregular intervals. In their approach, a Gibbs sampler was mainly used for the Bayesian inference of missing model parameters and high-frequency variables. Li et al. proposed a multi-view learning method to estimate the missing values of traffic-related time series data [19]. Their method used collaborative filtering technology to impute the missing data by considering local and global changes in temporal and spatial views.
The regression-based approaches impute the missing data through fitting the collected data with various linear functions. However, the changes of many traffic data are nonlinear, such as traffic speed, traffic volume, etc., so the regression-based approaches cannot accurately impute these kinds of traffic data.

2.3. Matrix-Factorization-Based Approaches

Some people used the matrix-factorization-based approaches to impute the missing traffic data [41,42,43,44]. For example, Tan et al. proposed a tensor-completion-based approach for traffic volume prediction [20]. In their approach, the traffic volume data were modeled using a time intervals × days × weeks tensor. Then, the traffic volume prediction was achieved through using a Tucker decomposition and gradient-descent-based tensor completion algorithm to impute the missing data in future time intervals. Chen et al. proposed a truncated-nuclear-norm (TNN)-based low-rank tensor completion (LRTC) framework to impute the missing traffic data [21]. In their approach, a TNN was defined using a locations × days × time intervals tensor. Based on the defined TNN, the LRTC and alternative direction multiplier method (ADMM) are used to impute the missing data in the tensor.
The matrix-factorization-based approaches can achieve high accuracy in missing traffic data imputation. However, researchers found that the accuracy of the missing data imputation of matrix-factorization-based approaches is inversely proportional to the missing rate of collected traffic data. When the amount of missing values in the collected traffic data is large, the imputation accuracy of matrix-factorization-based approaches is low.

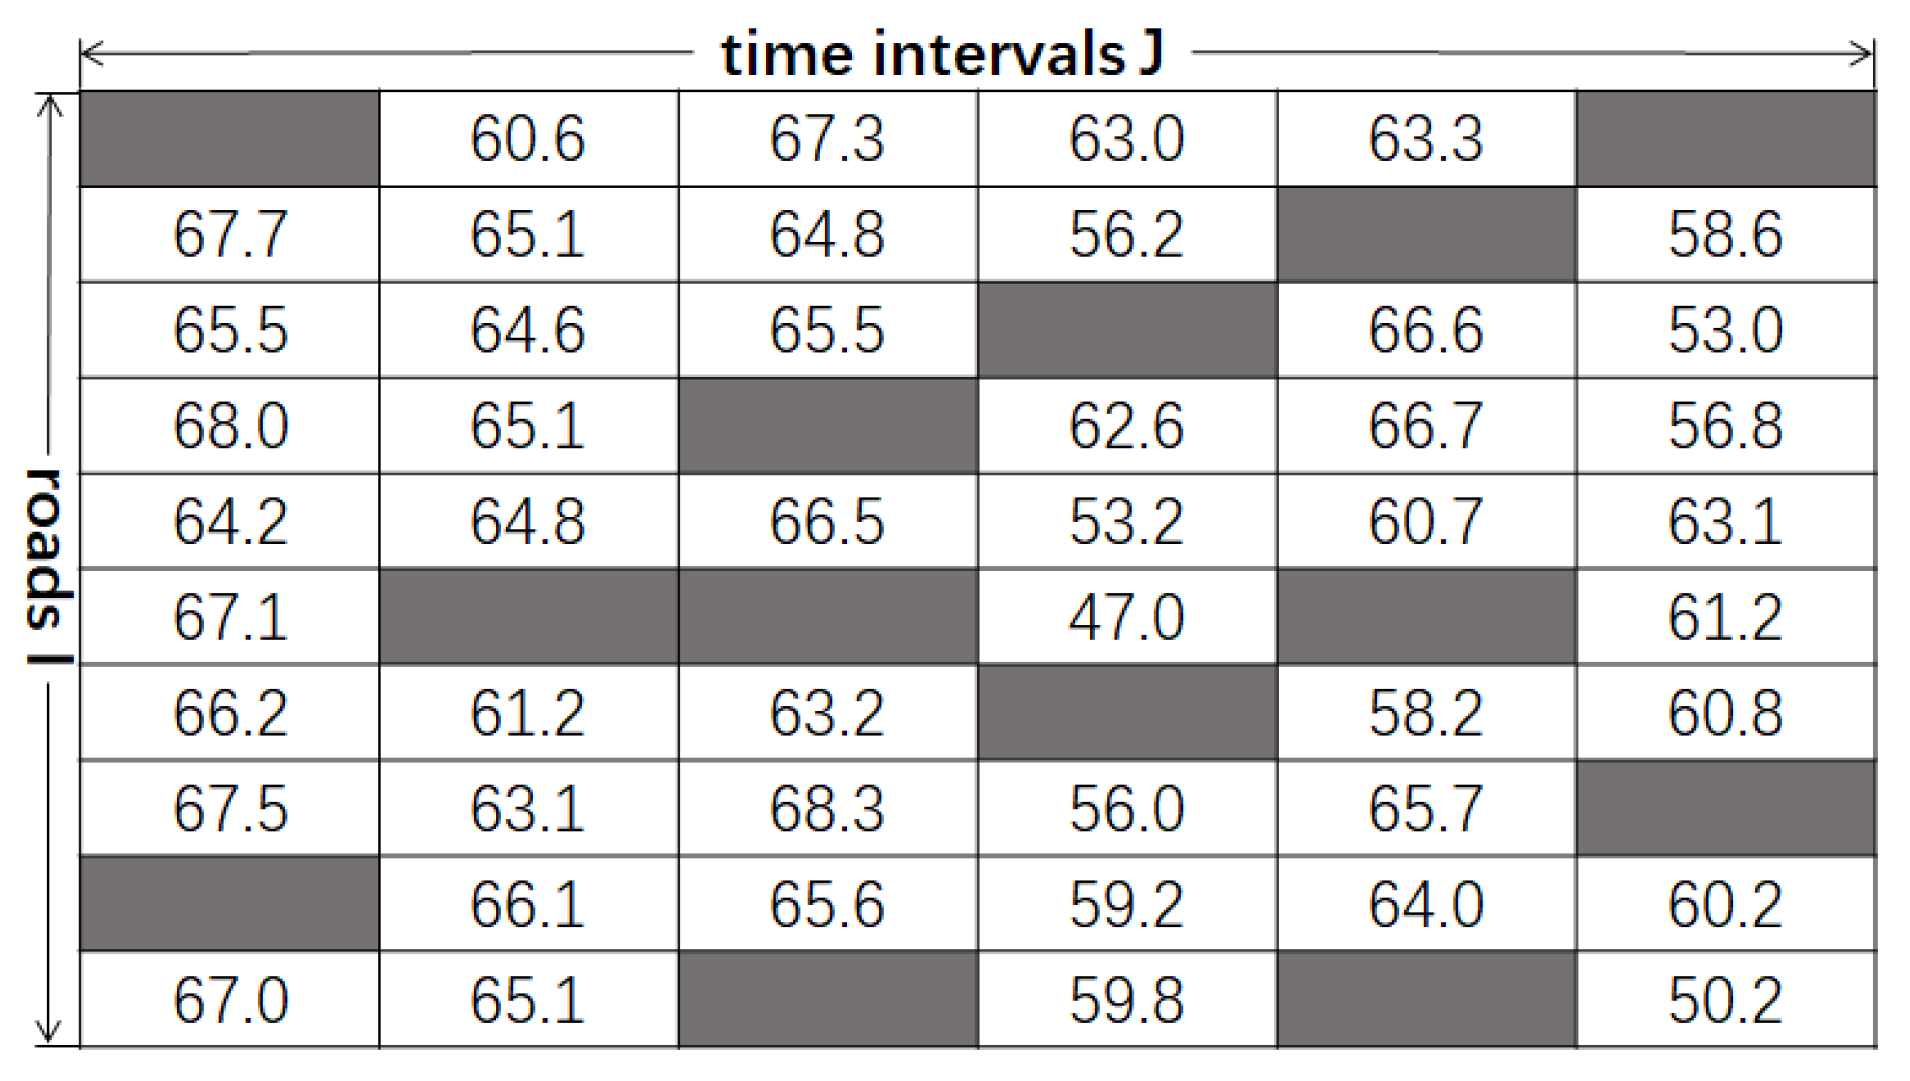
3. The Problem Description

Generally, the original traffic data of a road network have space and time features, which can be described by a spatiotemporal matrix, where the rows and columns of the matrix indicate different roads and time intervals, respectively. An example of spatiotemporal matrix of original traffic data V R I · J is given in Figure 1.
where an element of V (i.e., v i , j ) indicates the traffic value of the i road at the j time interval, the gray values indicate the missing traffic data values in the original traffic data (i.e., v i , j ).
During the traffic data collection, there are three main situations that will cause the traffic data to be missing, which can be described as follows.
  • Roadside facilities can continuously collect the traffic data of their roads. However, the traffic data of the roads without roadside facilities are all missing;
  • GPS data of cars can be used to calculate the traffic data of roads passed by cars. However, it is hard for all roads of a road network to have cars with GPS at the same time, so the traffic data of the roads without cars with GPS are missing;
  • Due to the network failure, when the collected data are uploaded to the database, the traffic data of all roads in some time intervals are missing.
The patterns of traffic data missing are different in the above three situations. If we use the spatiotemporal matrix to describe the traffic data of a road network, the traffic data missing pattern of roadside facilities is shown in Figure 2a, where the traffic data of roads without roadside facilities are missing. The traffic data missing pattern of GPS in cars is shown in Figure 2b, where the traffic data of roads without cars with GPS are missing (when several roadside facilities or their networks are unstable, the traffic data collected by them will also have this missing pattern). The traffic data missing pattern of network failure is shown in Figure 2c, where the traffic data of roads in some time intervals are missing.
Traffic data imputation is used to find suitable functions (i.e., f u n c t i o n ( · ) to estimate or evaluate missing traffic data values (i.e., v i , j V and v i , j ) based on existing traffic data values (i.e., v i , j V and v i , j ), which can be described as follows:
v ^ = f u n c t i o n ( v i , j V v i , j ) ,
The objective of the traffic data imputation is to minimize the difference between the imputed and real traffic data values, which can be described as follows:
o b j e c t i v e = m i n i = 1 I j = 1 J | v i , j v ^ i , j | ,
where the missing of traffic data in the j time interval on the i road or section in V is indicated.

4. LFM-Based Traffic Data Imputation Approach

In this section, the basic principles of the proposed LFM-based traffic data imputation approach are described in detail. First, the construction of the adjacent matrix of road distance is given. Then, the combination of the adjacent matrix of road distance and the spatiotemporal matrix of traffic data is introduced. Finally, the process of the LFM-based data imputation algorithm is provided.

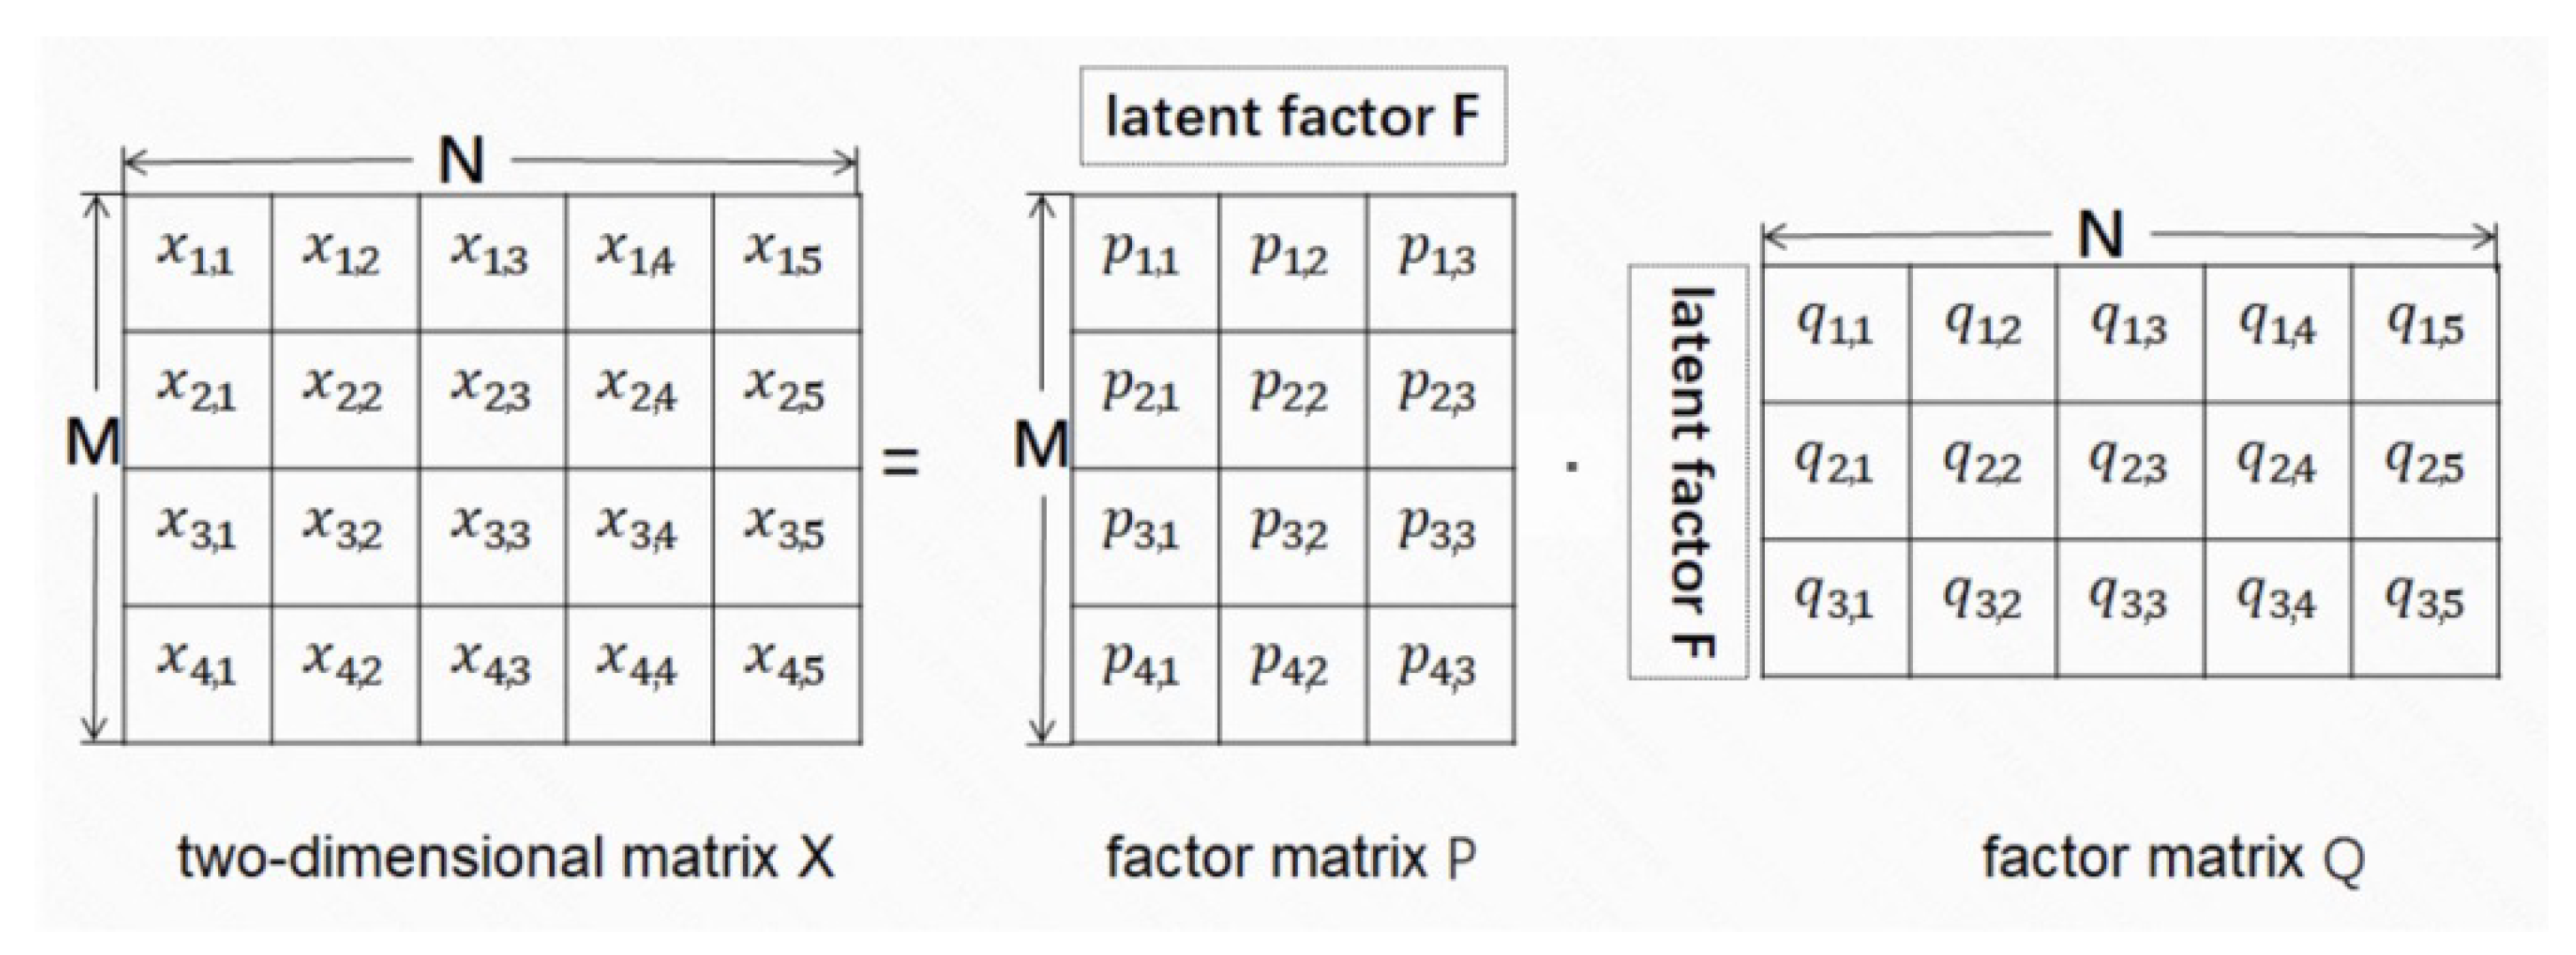
4.1. LFM-Based Factorization

LFM uses a series of factor values to represent the hidden relationships between two dimensions of a matrix. For a I · J matrix X R I · J , if we use F number of latent factors to represent the hidden relationships between two dimensions of X, the process of LFM based factorization of X can be described as X = P · Q , which is illustrated in Figure 3.
In Figure 3, P R I · F and Q R F · J are two factor matrices of X, where p i , f indicates in the i road and f latent factor in factor matrix P; similarly, q f , j indicates the f latent factor and j time interval in factor matrix Q. An element of X (i.e., x i , j ) can be calculated by the i row of factor matrix P and j column of factor matrix Q, which can be described as follows.
x i , j = P ( i , · ) · Q ( · , j ) = f = 1 F p i , f · q f , j ,

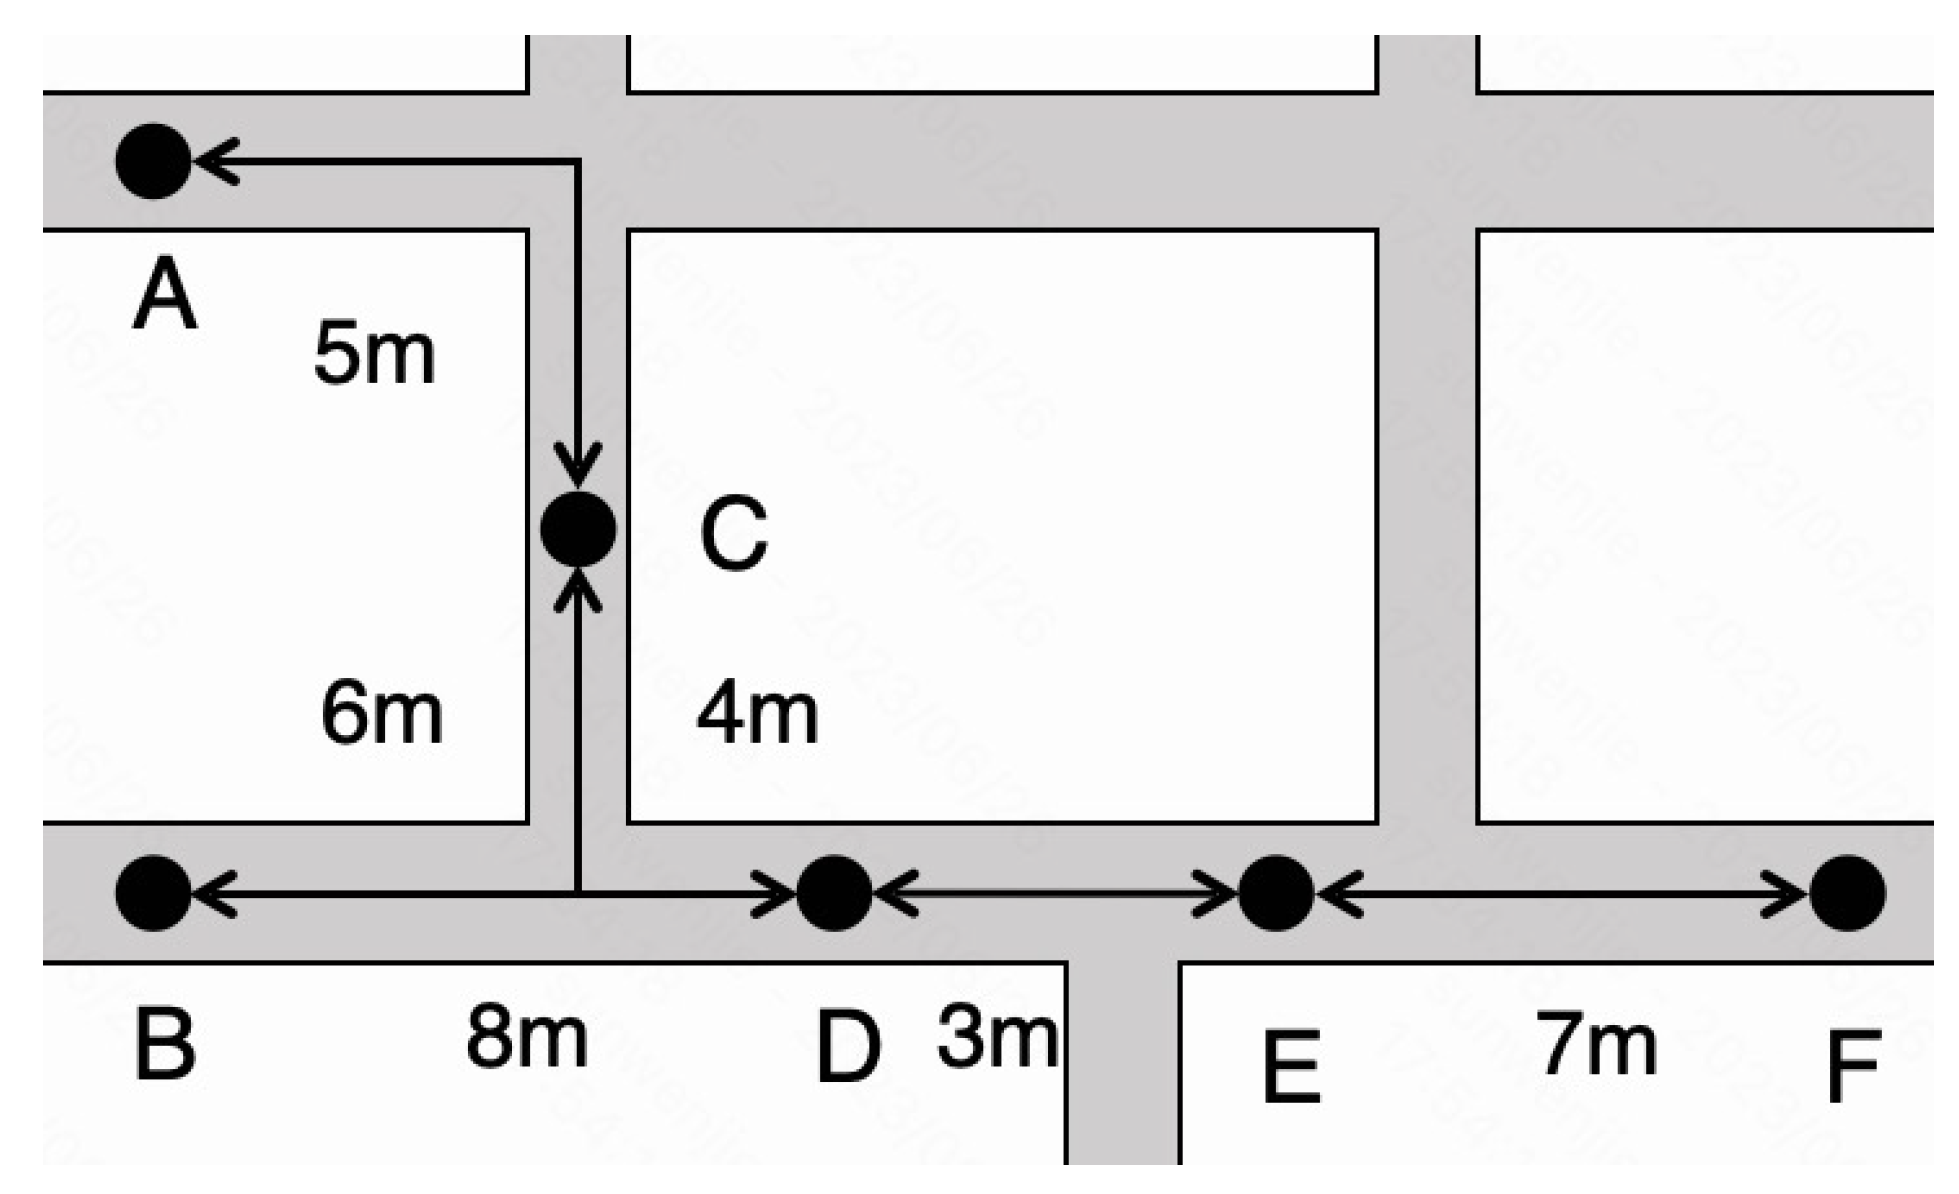
4.2. The Construction of the Adjacent Matrix of Road Distance

The spatiotemporal matrix of traffic data includes the traffic data of several roads in several continuous time intervals (see Figure 1). In a road network, the traffic data of roads have a wide range of relationships. For example, if the traffic data of a road are large, the traffic data on adjacent or neighboring roads will be large. Therefore, the accuracy of missing traffic data imputation can be greatly improved by adding spatial information on the road network. In the proposed approach, the adjacent matrix of road distance is proposed to represent spatial information on the road network.
Supposing there are I roads or sections in a road network, the adjacent matrix of road distance can be described by D R I · I , where an element of D ( d i 1 , i 2 = d i s ) represents the road accessible distance distance between the i 1 t h and i 2 t h roads. If the number of roads between the i 1 t h and i 2 t h roads is more than 3, d i s is set to the maximum distance between two roads (i.e., m a x ( d i 1 , i 2 D ) ) in the adjacent matrix of road distance. This setting is because the farther the distance between two roads, the weaker the relationship of traffic flow between the two roads. In the research field of urban planning and traffic engineering, it is verified that, if the distance between two roads is greater than three roads or sections, it may lead to inconsistency in the traffic flow data in a road network, while the impacts between roads with a distance greater than three roads or sections are the least [45].
After the construction of the adjacent matrix of road distance, the distance values of the adjacent matrix are normalized, which are calculated as follows.
n o r m ( d i 1 , i 2 ) = 1 d i 1 , i 2 m a x ( d i 1 , i 2 D )
After normalization, the normalized adjacent matrix of road distance n o r m ( D ) R I · I is obtained.
An example of a road network is shown in Figure 4.
From Figure 4, it can be seen that the road network has six roads, which are A to F. The road-accessible distances between any two adjacent roads are given in the figure. The adjacent matrix of road distance D is shown in Figure 5a. Specifically, since the number of roads between roads A and F is 4 (i.e., more than 3), the distance between them is set to the maximum distance of roads in the adjacent matrix of road network, which is 18 (i.e., the distance between B and F). The normalized adjacent matrix of road distance n o r m ( D ) is shown in Figure 5b.

4.3. The Combination of the Adjacent Matrix of Road Distance and the Spatiotemporal Matrix of Traffic Data

In order to add the spatial information to the missing traffic data imputation, the normalized adjacent matrix of road distance n o r m ( D ) will be combined with the spatiotemporal matrix of traffic data V R I · J (see Section 3). Before the matrix combination, the spatiotemporal matrix of traffic data also needs to be normalized. An element of spatiotemporal matrix of traffic data (i.e., v i , j ) is normalized to n o r m ( v i , j ) based on the following equation.
n o r m ( v i , j ) = v i , j m i n V m a x V m i n V ,
where m i n V and m a x V are the minimum and maximum value of v i , j in V, respectively.
After normalization, the normalized adjacent matrix of road distance n o r m ( D ) is combined with the normalized spatiotemporal matrix of traffic data n o r m ( V ) from the dimension of roads. The combined matrix VD R M · N is illustrated in Figure 6, where M is I, N is I + J .

4.4. The Process of LFM-Based Data Imputation Algorithm

After the matrix combination, the LFM-based data imputation algorithm will be used to impute the missing data in the combined matrix (i.e., the missing data values on the part of the spatiotemporal matrix).
The idea of the LFM-based data imputation algorithm can be described as follows.
  • According to the length M and width N of the matrix VD and the number of latent factors F, two factor matrices, P R M · F and Q R F · N , are generated with random values; the Cartesian product of P and Q can construct the matrix VD , whose size is the same as matrix VD .
  • According to the value difference between the existing elements in VD and the corresponding elements of VD , the values of the factor matrices are alternatively updated by gradient descent algorithm. The objective function of the factor matrices update is shown in Equation (6)
    o b j = m i n x m , n 0 x m , n x ^ m , n 2 + λ p m , f 2 + q f , n 2 ,
    where λ p m , f 2 + q f , n 2 is the regularization part and λ is the parameter to control the regularization.
  • Repeat Step (2) until the above objective function is minimized, and the two matrices VD and VD are considered to be the same. The missing elements of VD can be found in  VD .
Based on the above idea, the LFM-based data imputation algorithm is described in Algorithm 1.
Algorithm 1 LFM-based data imputation algorithm
Require: The combined matrix VD R I · J ;
  Number of latent factors F;
Error threshold ε ;
Ensure: Full matrix VD
1:
Initialize matrix P R I · F and matrix Q R F · J with random values.
2:
Set parameters m a x _ i t e r (the maximum number of iterations), α (step size), λ (parameter that controls the regularization), o b j t and o b j t + 1 .
3:
while o b j t o b j t + 1 > ε i t e r < m a x _ i t e r do
4:
    VD = P · Q ;
5:
   for  p m , f  do
6:
        p m , f = p m , f + α ( ( x m , n f = 1 F p m , f q f , n ) q f , n λ p m , f ) ;
7:
   end for
8:
   for  q f , n  do
9:
        q f , n = q f , n + α ( ( x m , n f = 1 F p m , f q f , n ) p m , f λ q f , n ) ;
10:
  end for
11:
   o b j t = o b j t + 1 ;
12:
   o b j t + 1 = x m , n 0 x m , n x ^ m , n 2 + λ p m , f 2 + q f , n 2 ;
13:
   i t e r = i t e r + 1 ;
14:
end while
15:
return   VD
Algorithm 1 can be explained as follows. The inputs of the algorithm are the combined matrix VD , the number of latent factors F and the error threshold ε . The output of the algorithm is the completed matrix VD . At the beginning of the algorithm, factor matrices P and Q are initialized with random values (Line 1). Then, the parameters of the iteration are set, including the maximum number of iterations m a x _ i t e r , the step size α , and the regularization control parameter λ , and the objective value o b j t o b j t is calculated (Line 2). When the object value o b j t o b j t + 1 is larger than ε and i t e r is less than m a x _ i t e r , the values of factor matrices P and Q are updated according to the gradient descent algorithm [] (Lines 3 to 14). When the object value o b j t o b j t is less than ε or i t e r is large than m a x _ i t e r , we consider that matrix VD , combined by factor matrices P and Q, is the same as matrix VD . Finally, the completed matrix VD is returned.

5. Experiments and Analysis

In this section, the real-world traffic data were used to verify the performance of the proposed LFM-based traffic data imputation approach in different missing patterns, missing rates, and data sizes (i.e., the amount of collected traffic data).

5.1. The Data Set and General Settings of Experiments

The real-world public traffic speed data set METR-LA was used as the original traffic data in the experiments. METR-LA contains the traffic data collected by loop detectors on highways in Los Angeles County. The data were collected from 325 roads for 4 months (from 1 March 2012 to 30 June 2012), including 34,272 time intervals (a time interval is 5 min).
To reduce the effects of temporal information on traffic data, we only use the traffic data of 325 roads in 20 time intervals in the experiments, so the size of spatiotemporal matrix of the traffic data is 325 × 20 (i.e., V R 325 × 20 ).
To simulate different patterns of traffic data missing, we use different ways to remove traffic data from the original traffic data (see Figure 2).
As shown in Table 1, we used three different ways to remove traffic data from original traffic data to simulate different traffic data missing patterns. First, the traffic data of roads without roadside facilities are missing (removal of certain roads) (see Figure 2a). Second, the traffic data of roads without cars with GPS are missing (random removal) (see Figure 2b). Third, the traffic data of roads in some time intervals are missing (removal of certain time intervals) (see Figure 2c).
To simulate different missing rates of traffic data, for each traffic data missing pattern, 20%, 40%, 50%, and 70% of the data were removed, respectively, from the original traffic data as the missing traffic data.
Two error criteria (i.e., MAPE and RMSE) are used to indicate the accuracy of traffic data imputation approaches. MAPE refers to mean absolute percentage error. It is the average percentage error between true and predicted values, which uses absolute values to avoid offset of positive and negative errors. This indicator is sensitive to relative errors and will change when target variables are globally scaled. RMSE refers to root mean squared error, which is the square root of the mean of the sum of deviation squares between K imputed and real values. It is sensitive to error value, and can highlight them with greater impact. Both of them are calculated as follows.
M A P E = 1 K k = 1 K x k x ^ k x k · 100 % ,
R M S E = 1 K k = 1 K x k x ^ k 2 ,
where x k is a real traffic data value, x ^ k is the imputed traffic data value, and K is the number of missing traffic data values.

5.2. The Experimental Results and Analysis

5.2.1. The Accuracy of Different Traffic Data Imputation Approaches

In this experiment, the accuracy of the missing traffic data imputation of the proposed approach will be compared with current missing traffic data imputation approaches.
The baseline approaches used in this experiment are introduced as follows.
  • ARIMA: The Autoregressive Integrated Moving Average is a popular time series traffic data prediction and imputation approach. It uses the temporal relationships of data to predict or impute the missing data [46].
  • Mean interpolation, which uses the mean of temporal neighboring data around the missing data to achieve the imputation [47].
  • HaLRTC: High-accuracy low-rank tensor completion was proposed by Liu et al. in 2009. The HaLRTC algorithm applies the Alternating Direction Multiplier Method (ADMM) to the process of low-rank tensor completion for missing data imputation [48].
  • LRTC-TNN: Low-rank tensor completion and truncated nuclear norm was proposed by Chen et al. in 2020. As with HaLRTC, LRTC-TNN is also based on low-rank tensor completion, and uses a truncated nuclear norm to improve the imputation accuracy of missing data [21].
The experimental results are shown in Table 2.
Table 2 shows the accuracy of different approaches for traffic data imputation in different data missing patterns (i.e., removal of certain roads, random removal, and removal of certain time intervals, see Figure 2) and different data missing rates, where the columns of the table indicate different traffic data imputation approaches, while the rows of the table indicate different data missing patterns and missing rates. Among them, black font indicates that MAPE or RMSE is the lowest on this line.
From Table 2, it can be seen that that MEAN and ARIMA cannot impute the missing data in the missing pattern of removal of certain roads, because they all need the temporal neighboring data to impute the missing data. When roads do not have roadside facilities, the traffic data of the road in all time intervals are missing. For the other three traffic imputation approaches, when the missing rates of traffic data increase, the accuracy of traffic data imputation approaches decreases. The proposed approach has the most accurate imputation results in three traffic data imputation approaches. When the data missing rate is low (i.e., 20%, 40%, and 50%), the MAPEs and RMSEs of the proposed approach are lower than 4. When the data missing rate is 70%, the MAPE and RMSE of the proposed approach are only 4.77 and 5.06, respectively. This is because the proposed approach combines the adjacent matrix of road distance with the spatiotemporal matrix of traffic data, which greatly reduces the sparsity of the combined matrix, so as to improve the imputation accuracy. In addition, the missing value imputation of the proposed approach relies on a complete adjacent matrix rather than just certain values around the missing values, so the proposed approach can fit any missing patterns and high missing rates. LRTC-TNN has the second highest data imputation accuracy in three approaches. This is because LRTC-TNN adds a truncated nuclear norm (TNN) to the process of low-rank tensor completion, which improves the accuracy of missing data imputation. HaLRTC has the lowest data imputation accuracy in three approaches, this is because HaLRTC only uses the low-rank tensor completion algorithm without adding other algorithms or information. From the 5th to 8th rows of Table 2, it can be seen that, for the missing pattern of random removal, all approaches can impute the missing traffic data. As with the first four rows, when the missing rates of traffic data increase, the accuracy of traffic data imputation approaches decreases. For the same reason, the proposed approach still has the highest accuracy in most of missing rates, LRTC-TNN has the second highest accuracy in most of the missing rates and HaLRTC has the third highest accuracy. For MEAN and ARIMA, the accuracy of ARIMA is higher than MEAN. This is because ARIMA imputes the missing data by considering all time series data, while MEAN only considers the temporal neighboring data of missing data, which reduces the imputation accuracy of MEAN. From the last four rows of the table, it can be seen that, as with the above experiments, when the missing rates of traffic data increase, the accuracy of traffic data imputation approaches decreases. The proposed approach also has the highest accuracy in this missing pattern of traffic data.

5.2.2. The Imputation Accuracy of the Proposed Approach under Different Amounts of Collected Traffic Data

In this experiment, we use different amounts of collected traffic data to evaluate the imputation accuracy of the proposed approach.
Specifically, the spatiotemporal matrix of traffic data with different time intervals (i.e., 5, 10, and 15, where a time interval is 5 min), missing patterns (removal of certain roads, random removal, removal of certain time intervals), and missing rates (i.e., 20%, 40%, 50%, and 70%) are used in this experiment. MAPE and RMSE are still used to indicate the accuracy of the proposed approach.
The experimental results are shown in Table 3.
Table 3 shows the accuracy of the proposed approach for traffic data imputation in different amounts of collected traffic data, different data missing patterns (i.e., the removal of certain roads, random removal, and the removal of certain time intervals, see Figure 2), and different data missing rates, where the columns of the table indicate different amounts of collected traffic data, while the rows of the table indicate different data missing patterns and missing rates.
From Table 3, it can be seen that when the missing rates of traffic data increase, the accuracy of the traffic data imputation approaches decreases. When the amounts of collected traffic data increase, the imputation accuracy of the proposed approach increases. However, the difference of imputation accuracy of the proposed approach under different amounts of collected traffic data is not big. Therefore, we can say that the proposed approach can achieve accurate traffic data imputation with a very limited amount of collected traffic data. So, we can say the proposed approach has high completion accuracy under different amounts of collected traffic data, even if they are extremely small. As before, black font indicates that MAPE or RMSE is the lowest on this line.

6. Conclusions and Future Work

In this paper, an innovative approach is proposed to impute the missing traffic data. In the proposed approach, the additional spatial information of the road network is added to the original traffic data, so as to reduce the sparsity of the combined matrix. Then, the missing data in the combined matrix are imputed by using the LFM-based data imputation algorithm. The real traffic data set METR-LA is used to evaluate the performance of the proposed approach. The experimental results indicate that the proposed approach outperforms most of current approaches in terms of traffic data imputation, even when the collected traffic data are limited. In the future, we will add additional information into the original traffic data to further improve the accuracy of the traffic data imputation. In addition, we will also explore the weights of additional information and the original traffic data in the combined matrix.

Author Contributions

Xing Su: conceptualization (lead), methodology, writing—review and editing; Wenjie Sun: validation, methodology, writing—original draft; Chenting Song: supervision, data curation, writing—review and editing; Zhi Cai: supervision, data curation; Limin Guo: supervision, data curation. All authors have read and agreed to the published version of the manuscript.

Funding

This work is supported by the National Natural Science Foundation of China (No. 62276011, 62072016), the Natural Science Foundation of Beijing Municipality (No. 4212016), the International Research Cooperation Seed Fund of Beijing University of Technology (No. 2021B01), and the Urban Carbon Neutral Science and Technology Innovation Fund Project of Beijing University of Technology (No. 040000514122608).

Data Availability Statement

Not applicable.

Conflicts of Interest

The authors declare no conflict of interest.

References

  1. Zhang, Y. Automobile Production Increased by 84.2% Year on Year. 2022. Available online: https://epaper.scdaily.cn/shtml/scrb/20220317/271173.shtml (accessed on 7 June 2023).
  2. Beijing Municipal Commission of Tarnsport. 2022. Available online: http://jtw.beijing.gov.cn/ (accessed on 7 June 2023).
  3. Ks, A.; Me, B.; Ma, B. Intelligent Transportation Systems in a Developing Country: Benefits and Challenges of Implementation. Transp. Res. Procedia 2021, 55, 1373–1380. [Google Scholar]
  4. Ait Ouallane, A.; Bakali, A.; Bahnasse, A.; Broumi, S.; Talea, M. Fusion of engineering insights and emerging trends: Intelligent urban traffic management system. Inf. Fusion 2022, 88, 218–248. [Google Scholar] [CrossRef]
  5. Barceló, J.; Kuwahara, M.; Miska, M. Traffic Data Collection and Its Standardization. In Traffic Data Collection and Its Standardization; Springer: New York, NY, USA, 2010; pp. 1–10. [Google Scholar] [CrossRef]
  6. Sathish, S.; Ramachandra Rao, K. Real Time Vehicle Tracking and Driver Behaviour Analysis Using GPS/GSM/GPRS Technology. Int. J. Comput. Appl. 2015, 115. [Google Scholar]
  7. Wang, Y.; Wang, Y. Real-time traffic flow prediction using GPS-enabled floating car data. Transp. Res. Part Emerg. Technol. 2015, 308–321, 60. [Google Scholar]
  8. Li, Y.; Li, Z.; Li, L. Missing traffic data: Comparison of imputation methods. IET Intell. Transp. Syst. 2014, 8, 51–57. [Google Scholar] [CrossRef]
  9. Li, L.; Li, Y.; Li, Z. Efficient missing data imputing for traffic flow by considering temporal and spatial dependence. Transp. Res. Part Emerg. Technol. 2013, 34, 108–120. [Google Scholar] [CrossRef]
  10. Qu, L.; Zhang, Y.; Hu, J.; Jia, L.; Li, L. A BPCA based missing value imputing method for traffic flow volume data. In Proceedings of the 2008 IEEE Intelligent Vehicles Symposium, Eindhoven, The Netherlands, 4–6 June 2008; pp. 985–990. [Google Scholar] [CrossRef]
  11. Chan, R.K.C.; Lim, J.M.Y.; Parthiban, R. A neural network approach for traffic prediction and routing with missing data imputation for intelligent transportation system. Expert Syst. Appl. 2021, 171, 114573. [Google Scholar] [CrossRef]
  12. Yang, B.; Kang, Y.; Yuan, Y.; Huang, X.; Li, H. ST-LBAGAN: Spatio-temporal learnable bidirectional attention generative adversarial networks for missing traffic data imputation. Knowl.-Based Syst. 2021, 215, 106705. [Google Scholar] [CrossRef]
  13. Suga, S.; Fujimori, R.; Yamada, Y.; Ihara, F.; Takamura, D.; Hayashi, K.; Kurihara, S. Traffic information interpolation method based on traffic flow emergence using swarm intelligence. Artif. Life Robot. 2023, 28, 367–380. [Google Scholar] [CrossRef]
  14. Ma, X.; Luan, S.; Ding, C.; Liu, H.; Wang, Y. Spatial Interpolation of Missing Annual Average Daily Traffic Data Using Copula-Based Model. IEEE Intell. Transp. Syst. Mag. 2019, 11, 158–170. [Google Scholar] [CrossRef]
  15. Li, L.; Chen, X.; Li, Z.; Zhang, L. Freeway Travel-Time Estimation Based on Temporal–Spatial Queueing Model. IEEE Trans. Intell. Transp. Syst. 2013, 14, 1536–1541. [Google Scholar] [CrossRef]
  16. Soriguera, F.; Robuste, F. Requiem for Freeway Travel Time Estimation Methods Based on Blind Speed Interpolations Between Point Measurements. IEEE Trans. Intell. Transp. Syst. 2011, 12, 291–297. [Google Scholar] [CrossRef]
  17. Rodrigues, F.; Henrickson, K.; Pereira, F.C. Multi-Output Gaussian Processes for Crowdsourced Traffic Data Imputation. IEEE Trans. Intell. Transp. Syst. 2019, 20, 594–603. [Google Scholar] [CrossRef]
  18. Li, Z.; Yu, H.; Zhang, G.; Wang, J. A Bayesian vector autoregression-based data analytics approach to enable irregularly-spaced mixed-frequency traffic collision data imputation with missing values. Transp. Res. Part Emerg. Technol. 2019, 108, 302–319. [Google Scholar] [CrossRef]
  19. Li, L.; Zhang, J.; Wang, Y.; Ran, B. Missing Value Imputation for Traffic-Related Time Series Data Based on a Multi-View Learning Method. IEEE Trans. Intell. Transp. Syst. 2019, 20, 2933–2943. [Google Scholar] [CrossRef]
  20. Tan, H.; Feng, G.; Feng, J.; Wang, W.; Zhang, Y.J.; Li, F. A tensor-based method for missing traffic data completion. Transp. Res. Part Emerg. Technol. 2013, 28, 15–27. [Google Scholar] [CrossRef]
  21. Chen, X.; Yang, J.; Sun, L. A nonconvex low-rank tensor completion model for spatiotemporal traffic data imputation. Transp. Res. Part Emerg. Technol. 2020, 117, 102673. [Google Scholar] [CrossRef]
  22. Li, M.; Sheng, L.; Song, Y.; Song, J. An enhanced matrix completion method based on non-negative latent factors for recommendation system. Expert Syst. Appl. 2022, 201, 116985. [Google Scholar] [CrossRef]
  23. Liang, Y.; Zhao, Z.; Sun, L. Memory-augmented dynamic graph convolution networks for traffic data imputation with diverse missing patterns. Transp. Res. Part Emerg. Technol. 2022, 143, 103826. [Google Scholar] [CrossRef]
  24. Wang, P.; Hu, T.; Gao, F.; Wu, R.; Guo, W.; Zhu, X. A Hybrid Data-Driven Framework for Spatiotemporal Traffic Flow Data Imputation. IEEE Internet Things J. 2022, 9, 16343–16352. [Google Scholar] [CrossRef]
  25. Chang, G.; Zhang, Y.; Yao, D. Missing data imputation for traffic flow based on improved local least squares. Tsinghua Sci. Technol. 2012, 17, 304–309. [Google Scholar] [CrossRef]
  26. Chen, Y.; Lv, Y.; Wang, F.Y. Traffic Flow Imputation Using Parallel Data and Generative Adversarial Networks. IEEE Trans. Intell. Transp. Syst. 2020, 21, 1624–1630. [Google Scholar] [CrossRef]
  27. Chen, Y.; Chen, X.M. A novel reinforced dynamic graph convolutional network model with data imputation for network-wide traffic flow prediction. Transp. Res. Part Emerg. Technol. 2022, 143, 103820. [Google Scholar] [CrossRef]
  28. Huang, T.; Chakraborty, P.; Sharma, A. Deep convolutional generative adversarial networks for traffic data imputation encoding time series as images. Int. J. Transp. Sci. Technol. 2021, 12, 1–18. [Google Scholar] [CrossRef]
  29. Khayati, M.; Lerner, A.; Tymchenko, Z.; Cudré-Mauroux, P. Mind the gap: An experimental evaluation of imputation of missing values techniques in time series. Proc. VLDB Endow. 2020, 13, 768–782. [Google Scholar] [CrossRef]
  30. Tak, S.; Woo, S.; Yeo, H. Data-Driven Imputation Method for Traffic Data in Sectional Units of Road Links. IEEE Trans. Intell. Transp. Syst. 2016, 17, 1762–1771. [Google Scholar] [CrossRef]
  31. Bae, B.; Kim, H.; Lim, H.; Liu, Y.; Han, L.D.; Freeze, P.B. Missing data imputation for traffic flow speed using spatio-temporal cokriging. Transp. Res. Part Emerg. Technol. 2018, 88, 124–139. [Google Scholar] [CrossRef]
  32. Deb, R.; Liew, A.W.C. Missing value imputation for the analysis of incomplete traffic accident data. Inf. Sci. 2016, 339, 274–289. [Google Scholar] [CrossRef]
  33. Wang, S.; Mao, G. Fundamental Limits of Missing Traffic Data Estimation in Urban Networks. IEEE Trans. Intell. Transp. Syst. 2020, 21, 1191–1203. [Google Scholar] [CrossRef]
  34. Shaoxu, S.; Yu, S.; Aoqian, Z.; Lei, C.; Jianmin, W. Enriching Data Imputation under Similarity Rule Constraints. IEEE Trans. Knowl. Data Eng. 2018, 32, 275–287. [Google Scholar]
  35. Rekatsinas, T.; Chu, X.; Ilyas, I.F.; Ré, C. HoloClean: Holistic Data Repairs with Probabilistic Inference. Proc. VLDB Endow. 2017, 10, 1190–1201. [Google Scholar] [CrossRef]
  36. Breve, B.; Caruccio, L.; Deufemia, V.; Polese, G. RENUVER: A Missing Value Imputation Algorithm based on Relaxed Functional Dependencies. In Proceedings of the 25th International Conference on Extending Database Technology, EDBT 2022, Edinburgh, UK, 29 March–1 April 2022. [Google Scholar]
  37. Kaur, M.; Singh, S.; Aggarwal, N. Missing traffic data imputation using a dual-stage error-corrected boosting regressor with uncertainty estimation. Inf. Sci. 2022, 586, 344–373. [Google Scholar] [CrossRef]
  38. Haliduola, H.N.; Bretz, F.; Mansmann, U. Missing data imputation using utility-based regression and sampling approaches. Comput. Methods Programs Biomed. 2022, 226, 107172. [Google Scholar] [CrossRef]
  39. Templeton, G.F.; Kang, M.; Tahmasbi, N. Regression imputation optimizing sample size and emulation: Demonstrations and comparisons to prominent methods. Decis. Support Syst. 2021, 151, 113624. [Google Scholar] [CrossRef]
  40. Crambes, C.; Henchiri, Y. Regression imputation in the functional linear model with missing values in the response. J. Stat. Plan. Inference 2019, 201, 103–119. [Google Scholar] [CrossRef]
  41. Jia, X.; Dong, X.; Chen, M.; Yu, X. Missing data imputation for traffic congestion data based on joint matrix factorization. Knowl.-Based Syst. 2021, 225, 107114. [Google Scholar] [CrossRef]
  42. Nie, T.; Qin, G.; Sun, J. Truncated tensor Schatten p-norm based approach for spatiotemporal traffic data imputation with complicated missing patterns. Transp. Res. Part Emerg. Technol. 2022, 141, 103737. [Google Scholar] [CrossRef]
  43. Chen, X.; He, Z.; Sun, L. A Bayesian tensor decomposition approach for spatiotemporal traffic data imputation. Transp. Res. Part Emerg. Technol. 2019, 98, 73–84. [Google Scholar] [CrossRef]
  44. de, M.; Goulart, J.; Kibangou, A.; Favier, G. Traffic data imputation via tensor completion based on soft thresholding of Tucker core. Transp. Res. Part Emerg. Technol. 2017, 85, 348–362. [Google Scholar] [CrossRef]
  45. Hidas, P.; Hoogendoorn, S.P. Impact of spatial network structure on traffic flow. Transp. Res. Part Methodol. 2011, 1582–1597, 45. [Google Scholar]
  46. Acun, F.; Gol, E.A. Traffic Prediction on Large Scale Traffic Networks Using ARIMA and K-Means. In Proceedings of the 2021 29th Signal Processing and Communications Applications Conference (SIU), Istanbul, Turkey, 9–11 June 2021; pp. 1–4. [Google Scholar] [CrossRef]
  47. Sefidian, A.M.; Daneshpour, N. Missing value imputation using a novel grey based fuzzy c-means, mutual information based feature selection, and regression model. Expert Syst. Appl. 2019, 115, 68–94. [Google Scholar] [CrossRef]
  48. Liu, J.; Musialski, P.; Wonka, P.; Ye, J. Tensor completion for estimating missing values in visual data. In Proceedings of the 2009 IEEE 12th International Conference on Computer Vision, Kyoto, Japan, 29 September–2 October 2009; pp. 2114–2121. [Google Scholar] [CrossRef]
Figure 1. An example of a spatiotemporal matrix of original traffic data V R I · J .
Ijgi 12 00378 g001
Figure 2. Three kinds of traffic data missing patterns.
Ijgi 12 00378 g002
Figure 3. The process of LFM based factorization of X.
Ijgi 12 00378 g003
Figure 4. An example of road network.
Ijgi 12 00378 g004
Figure 5. The original and normalized adjacent matrix of road network.
Ijgi 12 00378 g005
Figure 6. The combined matrix VD .
Ijgi 12 00378 g006
Table 1. The three data missing patterns in the experiment.
Data SizeMissing PatternsPattern Names
Spatiotemporal matrix: 20 × 325 In roadsRemoval of certain roads
Roads: 20GPSRandom removal
Time intervals: 325In time intervalsRemoval of certain time intervals
Table 2. MAPE and RMSE for the three missing patterns.
Missing
Patterns
Missing
Rates
ARIMAMEANHaLRTCLRTC-TNNOUR
Removal of
certain roads
20%N/AN/A6.74/6.675.67/5.013.45/3.13
40%N/AN/A7.73/7.786.73/7.893.56/3.17
50%N/AN/A8.76/6.087.01/8.073.56/3.40
70%N/AN/A9.26/10.898.45/9.774.77/5.06
Random
removal
20%8.50/3.569.70/3.195.83/3.474.65/3.063.43/3.26
40%8.67/9.8820.51/19.836.76/6.835.12/4.903.87/3.45
50%10.66/11.2025.05/26.897.30/8.075.50/5.415.73/5.70
70%12.45/13.3736.37/36.098.89/10.766.53/7.045.70/6.00
Removal of
certain time
intervals
20%6.49/7.0710.48/11.148.79/9.696.93/6.193.47/3.01
40%8.45/7.9820.76/21.5210.19/10.277.59/8.503.80/3.47
50%10.04/11.8925.73/21.2412.37/10.118.61/7.973.77/3.64
70%12.09/11.1736.33/35.8514.34/16.948.41/8.455.46/4.77
Table 3. MAPE and RMSE for three missing patterns in different data sizes.
Missing
Patterns
Missing
Rates
5 Time Intervals10 Time Intervals15 Time Intervals
Removal of
certain roads
20 % 3.78/3.473.57/3.263.45/3.13
40 % 3.90/3.263.84/3.293.56/3.17
50 % 4.07/3.563.85/3.373.56/3.40
70 % 5.90/4.895.98/4.985.77/5.06
Random
removal
20 % 4.03/3.473.56/3.343.43/3.26
40 % 4.13/3.983.93/3.673.88/3.45
50 % 5.89/5.045.57/4.845.43/4.73
70 % 6.04/5.135.83/5.025.70/5.00
Removal of
certain time
points
20 % 3.73/3.473.24/3.123.23/3.01
40 % 3.86/3.893.78/3.273.80/3.39
50 % 4.01/3.783.90/3.433.77/3.37
70 % 5.74/4.885.38/4.655.46/4.77
Disclaimer/Publisher’s Note: The statements, opinions and data contained in all publications are solely those of the individual author(s) and contributor(s) and not of MDPI and/or the editor(s). MDPI and/or the editor(s) disclaim responsibility for any injury to people or property resulting from any ideas, methods, instructions or products referred to in the content.

