Article

Exploring Divergent Patterns and Dynamics of Urban and Active Rural Developments—A Case Study of Dezhou City

1
Key Laboratory of Regional Sustainable Development Modeling, Institute of Geographic Sciences and Natural Resources Research, Chinese Academy of Sciences, Beijing 100101, China
2
College of Resources and Environment, University of Chinese Academy of Sciences, Beijing 100049, China
*
Author to whom correspondence should be addressed.
ISPRS Int. J. Geo-Inf. 2023, 12(9), 362; https://doi.org/10.3390/ijgi12090362
Submission received: 30 June 2023 / Revised: 16 August 2023 / Accepted: 29 August 2023 / Published: 1 September 2023

Abstract

:
Clarifying urban-rural spatial explicit structure changes is of great significance for understanding the urban-rural relationship evolution. Previous studies have mostly focused on urban internal spatial structure evolutions and less on the regional scale when it comes to exploring urban and rural evolutions. Nighttime light can timely reflect the human activities in regions and provides great potential for investigating the evolutions of urban and rural spatial explicit structures. Here, taking Dezhou City, a rapidly urbanizing city in China, as a case study, we employed the local contour tree method and nighttime light data to map urban and active rural extents from 2012 to 2020 and further explored their respective development processes. This study showed that unlike in rural regions, the internally explicit structures of urban regions were more complex, and there were often multiple hotspots inside them. The area of the urban-rural region increased significantly by 39.3% from 2012 to 2020 (p < 0.05). Populations were greatly responsible for the spatial explicit structure changes of urban and active rural regions. The urban and rural region rankings of the identified counties were basically consistent with the urban and rural population rankings. Unlike the perspectives of earlier land use (i.e., built-up land or impervious surface), this study underlined urban and active rural regions in view of the scope of active human activities. These results can likely help policymakers understand current active human activity extents and provide a data-based reference for future public services and infrastructure planning.

1. Introduction

Driven by urbanization and industrialization, the flows of materials, information, capital and people between urban and rural areas are very frequent, and the influences between them are gradually deepening [1,2]. Urban structure refers to the form and method of the relationship and interaction between the elements of urban organizations, including economic structure, social structure, the formation of various regions within a city and its distribution and configuration. In recent years, it has received more attention in urban research and planning circles [3,4,5]. However, there are few studies on rural regions’ internally spatial explicit structures because of their relatively single internal organizational structures. The concept of urban-rural integrated development has been therefore put forward. Urban-rural integrated development is the integration of urban-rural planning, industrial development, infrastructure construction, public services, employment market, social management, the gradual disappearance of urban and rural differences, and finally, the process of integration [6,7,8,9]. Furthermore, relevant research should not be limited to cities but should also include rural areas in the research category. The concept of urban structure needs to be expanded to urban-rural structures. The urban-rural structures are mainly reflected in the population distribution, industrial structure, economic development and spatial structure between urban-rural regions [10,11]. Urban-rural population, industry and economic development issues [12,13,14,15] are often studied by scholars, but urban-rural spatial explicit structure is less mentioned. Urban-rural spatial explicit structure is the result of different development forces in a given region and is also a direct reflection of regional functions [16,17,18].
What is the specific scope of the urban-rural spatial explicit structure? What is the development history of urban-rural spatial explicit structure? What is the functional partition of urban-rural spatial explicit structure? How will the flows of population, capital and materials between urban-rural regions affect the urban-rural spatial explicit structure? Studying these problems can help us to understand the process and mechanisms of urban-rural integration and can likely help solve a series of problems in the process of urban-rural integration, such as rural hollowing and the large urban-rural income gap [2,19].
All research questions on urban and rural topics need to be supported by data and facts. Obtaining fine data can help us better understand the internal mechanisms and specific conditions of urban and rural development. In urban regions, there are kinds of data such as cell phone signaling, Point of Interest (POI), taxi trajectory data and land use data that can be employed to research urban structure. For example, taxi trajectory data were employed to identify urban centers, and the following results showed that the taxi track data could be used to accurately identify the urban center of Shanghai in different periods [20]. POI data were also used to detect the city’s primary and secondary centers [21]. It was found that most of the city’s urban centers had comprehensive functions. In addition, a series of data such as housing, mobile signaling, road network and GPS location were widely used to conduct urban studies [22,23,24].
However, in rural regions, researchers are often limited by data acquisition and are usually difficult to carry out fine-resolution data-based research work. When it comes to rural issues, previous researchers mostly obtained research data through field research or statistical yearbooks [25,26,27]. Field research is the most commonly used method, but it requires a lot of manpower and material resources. It is not very convenient to carry out large-scale research. Statistics can only show the overall situation and are usually difficult to use in geospatial rural issues.
With the development of remote sensing technology, researchers began to study urban-rural spatial explicit structures through the remote sensing monitoring data of land use. For example, remote sensing interpretation technology was used to identify the changes of paddy fields in the suburbs of Bangkok to study the expansion of urban-rural mixed areas [28]. With the help of GIS technology, land use data were used to explore the changes in the urban-rural landscape pattern in Tianjin Binhai New District [29]. Although land use data has made a significant contribution to the study of urban-rural spatial explicit structures, it is difficult to reflect the situation of urban-rural population, economy and industrial activity agglomeration, and it ignores the role of human activities in urban and rural spatial explicit structure.
Fortunately, with the continuous advancement of remote sensing monitoring technology, satellites can directly monitor the state of human activity at nighttime, that is, nighttime light. Nighttime light data can be used to detect human activities, and is widely used in GDP, population, military conflict, urbanization monitoring and other research and analysis related to human activities [30,31,32,33]. Nighttime light data can be employed to monitor light changes when human activity changes in urban-rural regions, which can be used to monitor the change of urban and rural spatial morphology [34,35]. However, studies on urban-rural region spatial morphology and its changes using nighttime light data are still lacking. This is mainly because the proximity of nighttime light to human activities is rather weak in rural regions. Therefore, we tried to design an algorithm to improve the quality of nighttime light data to enhance the ability to identify rural regions. Inspired by an earlier work [36], we employed the localized contour tree method to identify spatial urban and rural patterns in Dezhou City of China. In addition, the hierarchy and attributes of the detected centers were analyzed and calculated.
In this study, the following research questions are addressed: (1) How nighttime light data can be improved to highlight rural regions? And (2) How is the change of urban-rural spatial explicit structures affected by human activities?

2. Materials and Methods

2.1. Study Area

Dezhou City, with a total area of 1.04 × 10⁴ km2 and ~5.6 million people at the bottom of 2022, is located in East China and the western part of the Shandong Province. Because of its location in the alluvial plain of the Yellow River, which flooded frequently throughout the history of Dezhou City, resulting in the topography of high southwest and low northeast. Dezhou City is significantly affected by the monsoon climate and has obvious cold-hot and dry-wet boundary, which is suitable for agricultural production. At the same time, Dezhou City is also the transportation hub of China. Good agricultural planting conditions have led to ~47% (2.63 million) of the population in Dezhou being agricultural population. Due to the limited cropland resources (~6.43 × 10³ km2 in 2021), the per capita cropland area is only 1.15 × 10⁻³ km2. Less per capita land resources and more jobs and income opportunities in cities attracted surplus rural laborers to cities. With the continuous growth of China’s total population and rapid urbanization, the rural population of Dezhou has decreased from 4.26 million in 2000 to 3.98 million in 2020, while the urban population has nearly doubled from 1.1 million in 2000 to 2.02 million in 2020. Therefore, Dezhou is a typical representative of the dramatic changes in urban-rural relations in the urbanization process in China (Figure 1).

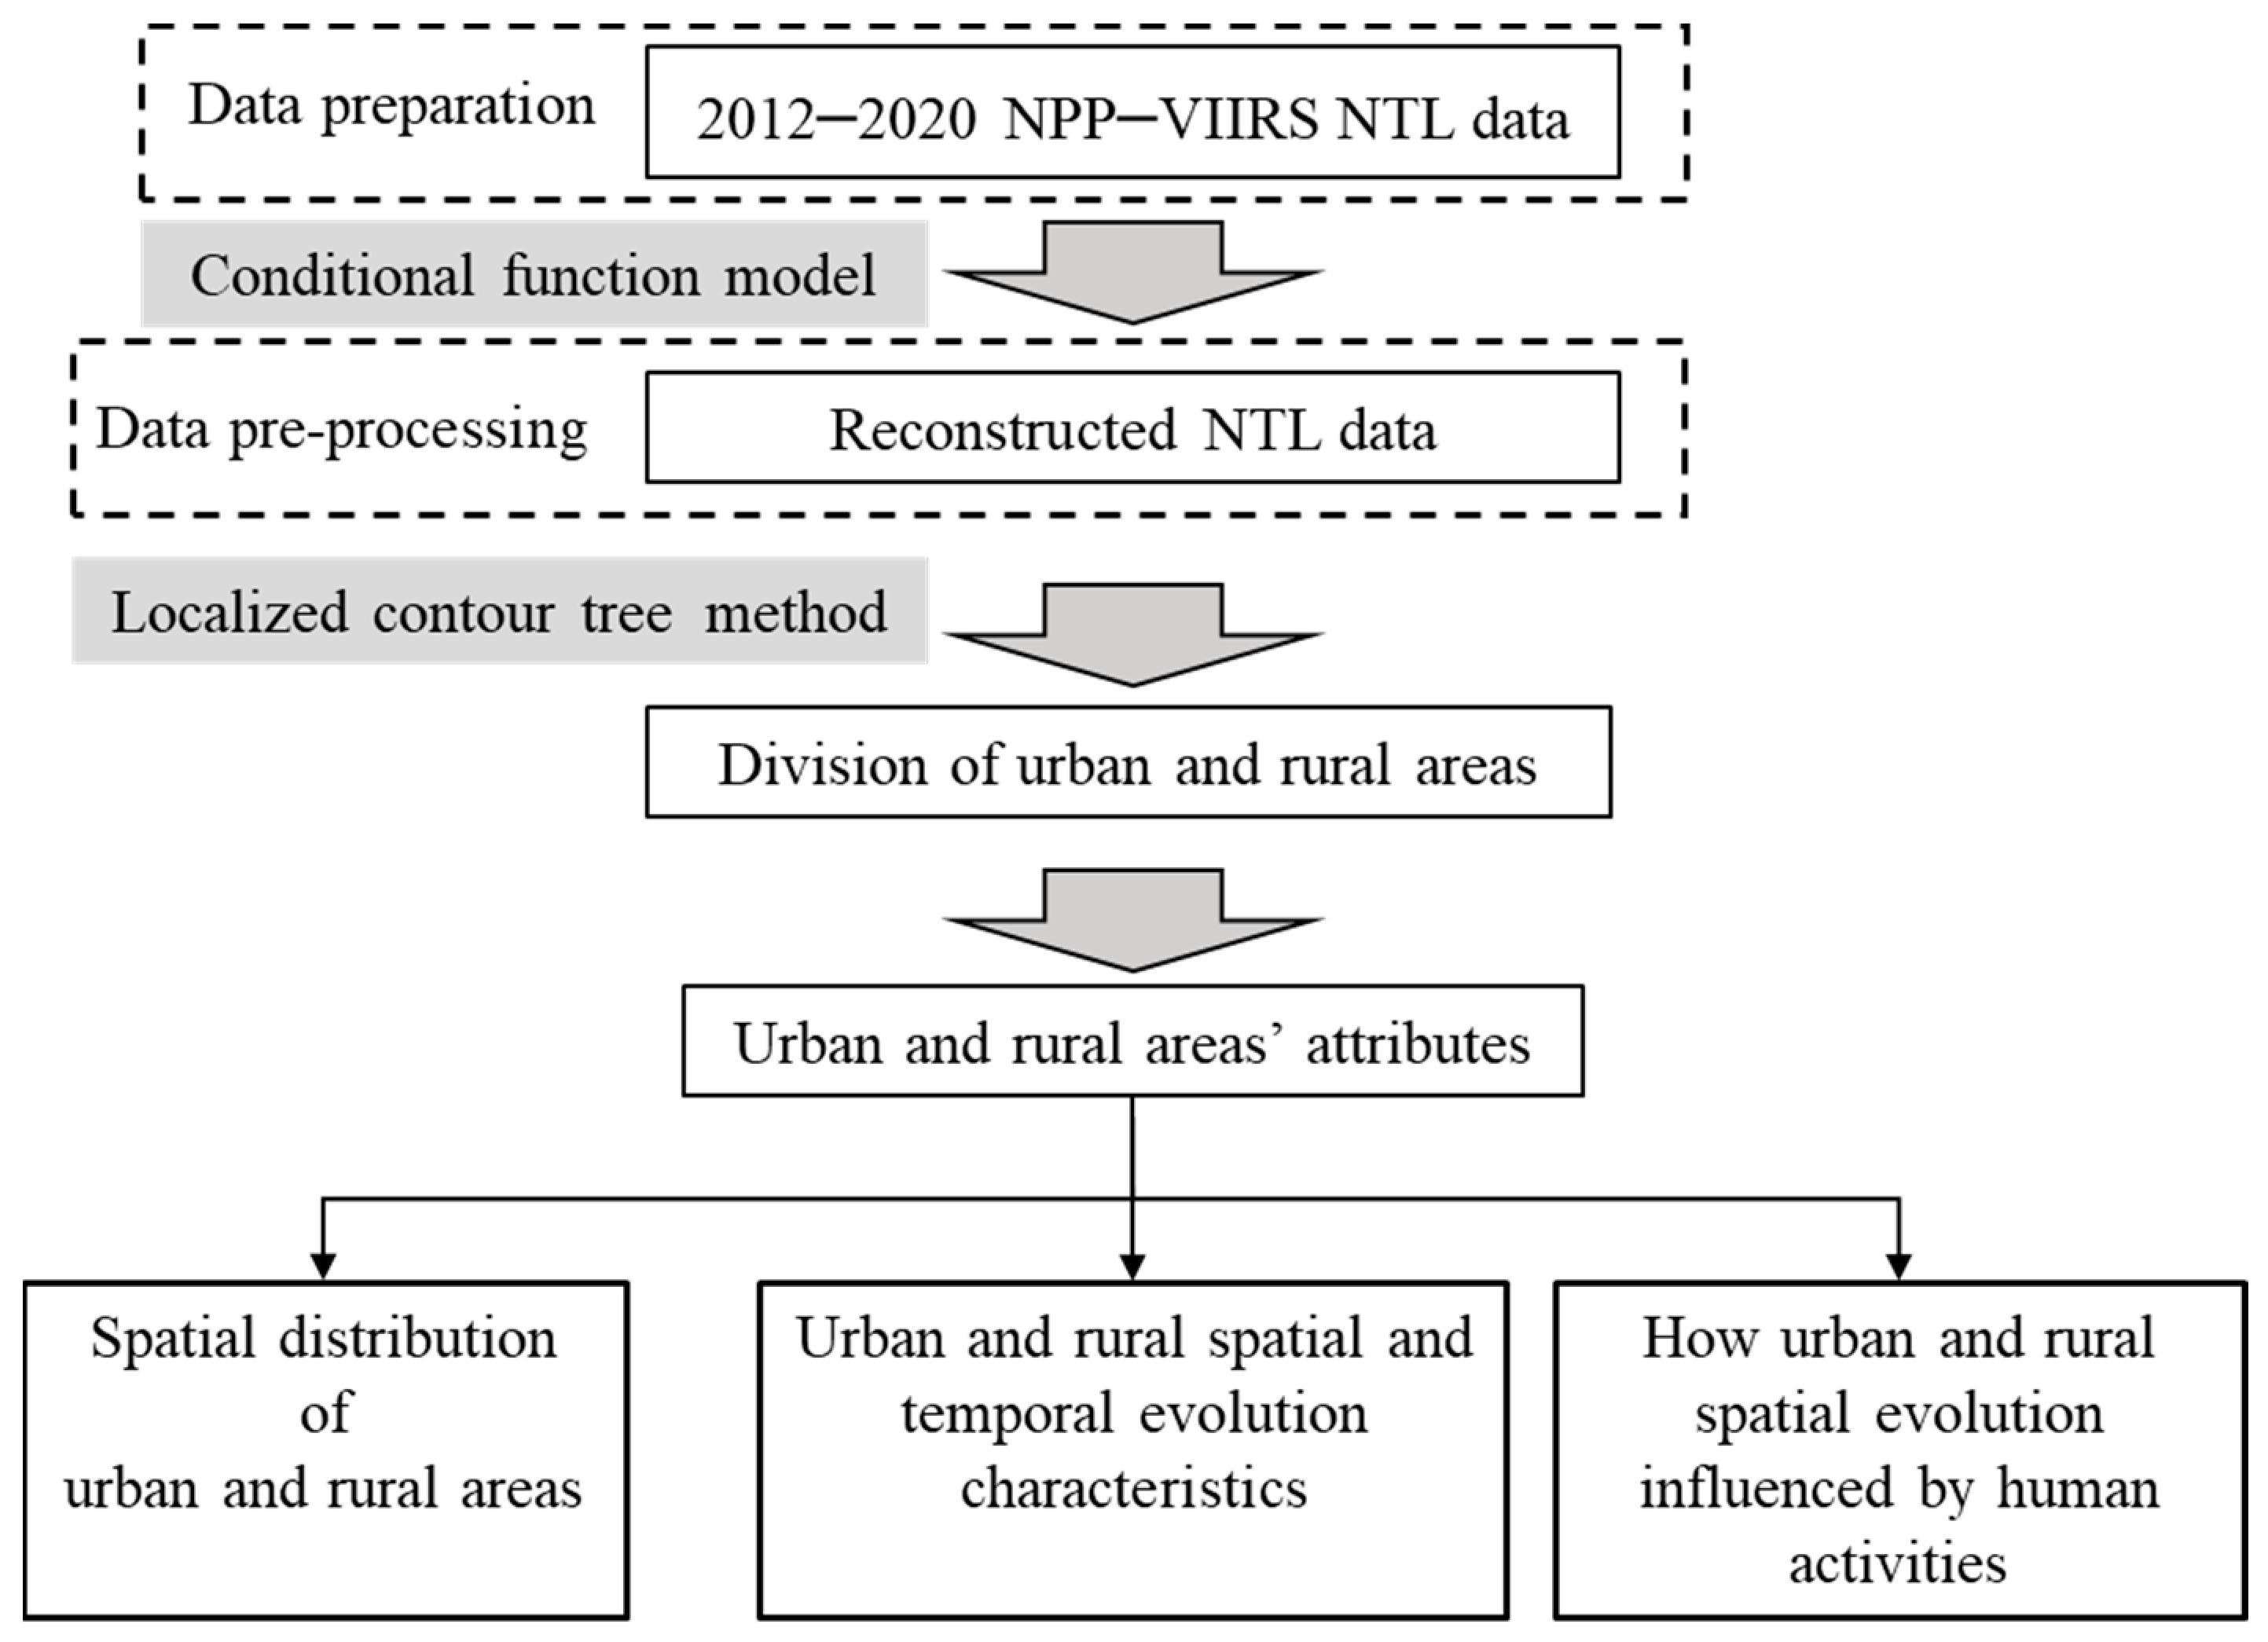
2.2. Data Sources and Processing

At present, the commonly used nighttime light data mainly comes from two satellites. One is the Defense Meteorological Satellite Program (DMSP), which is the polar orbit satellite program of the United States Department of Defense [37]. The spatial resolution of the sensor is 3000 m. The spatial resolution of the nighttime light products is usually 1000 m, and the time series is 1992–2013 [38]. The other is the new generation of Earth observation satellite Suomi NPP, which was launched in 2011 [39]. The visible infrared imaging radiometer suite (VIIRS) carried by the satellite can obtain new nighttime light remote sensing images, and the spatial resolution is also improved to 750 m. The spatial resolution of the nighttime light remote sensing products is 500 m. Our study selected NPP-VIIRS nighttime light data during 2012–2020. The data comes from the National Ocean Center Meteorological Agency (https://eogdata.mines.edu/nighttime_light/annual/v20/, confirmed available access on 31 August 2023), and the cloud cover pixel has been corrected [40].
To investigate urban and rural variations, the NPP-VIIRS data were utilized [37,41]. Additionally, nighttime light in rural regions is easily overlooked because of the huge difference in brightness between rural and urban regions. This study employed a conditional function model to reconstruct the nighttime light data. Also, the reconstruct processing is potentially helpful for eliminating the impacts of extreme maximum value. The reconstructed nighttime light data could better highlight the rural regions (Figure 2). The calculation formula is as follows:
Y i = l o g 10 Y i + 1 l o g 10 X m a x + 1
where Y i is the reconstructed nighttime light value; X i is the original nighttime light value; X m a x is the maximum nighttime light value in the region. In this study, this study fixed X m a x to 200. Based on reconstructed nighttime light data, a three-by-three Gaussian filter with sigma 1 was used to smooth the NPP-VIIRS nighttime light data to reduce noise. Additionally, this study also used the GDP and demographic yearbook data of Dezhou City from 2012 to 2020 to evaluate the results of urban-rural division and explored the driving mechanism of urban-rural spatial explicit structure changes.

2.3. Methods

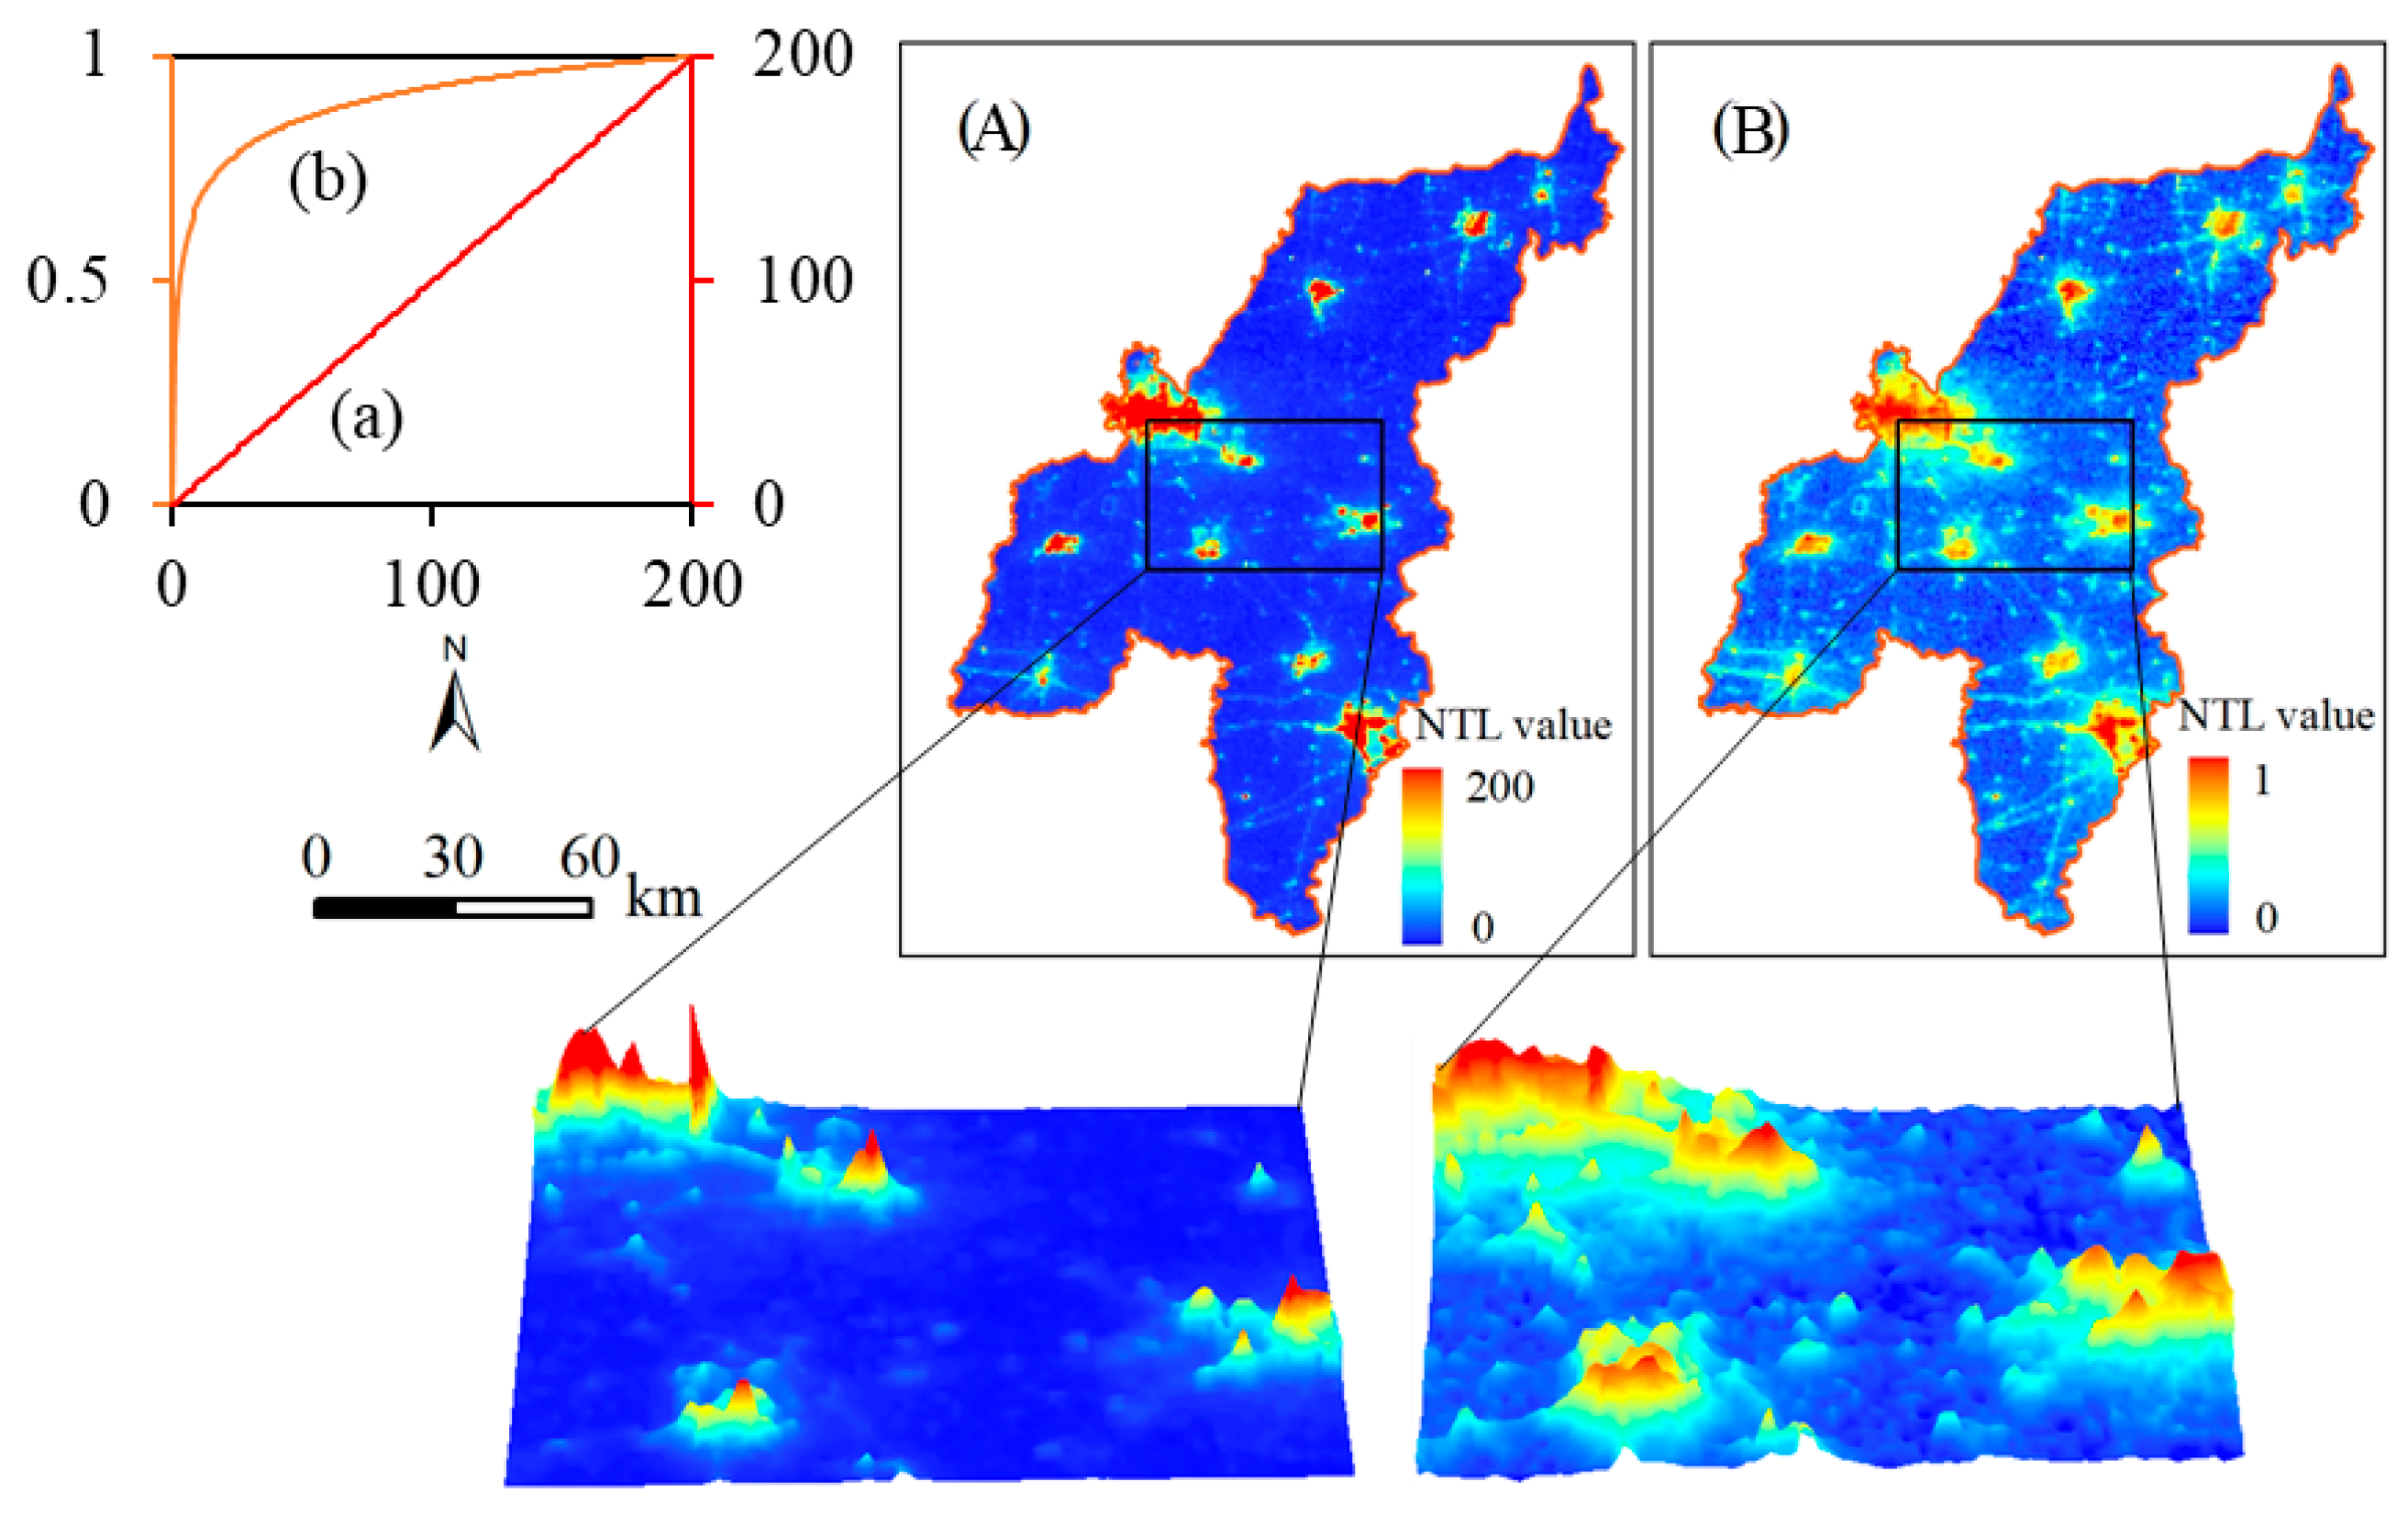
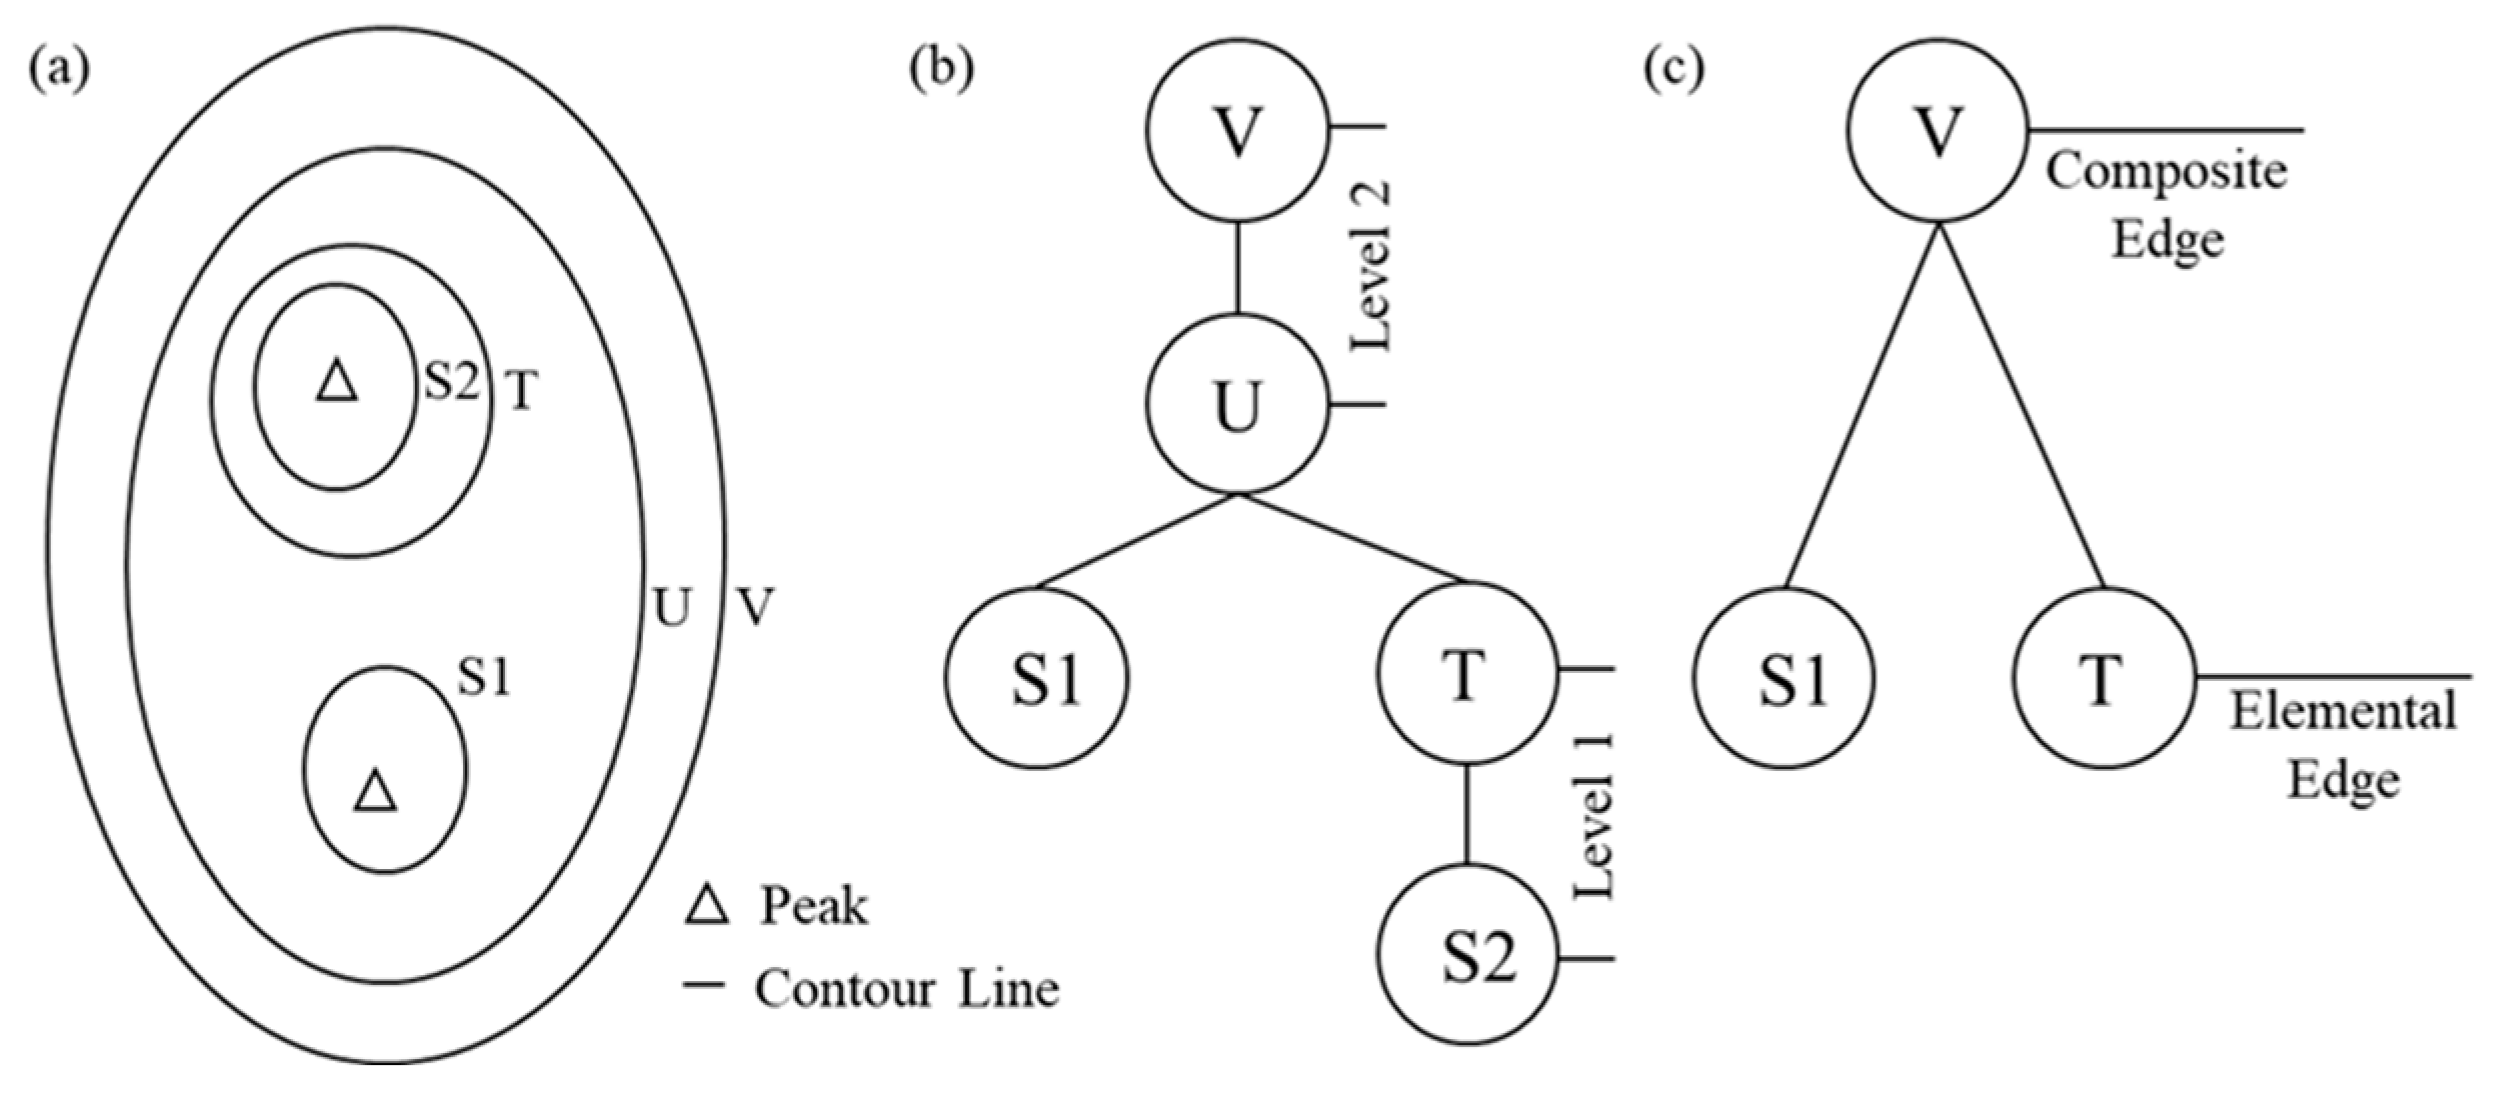
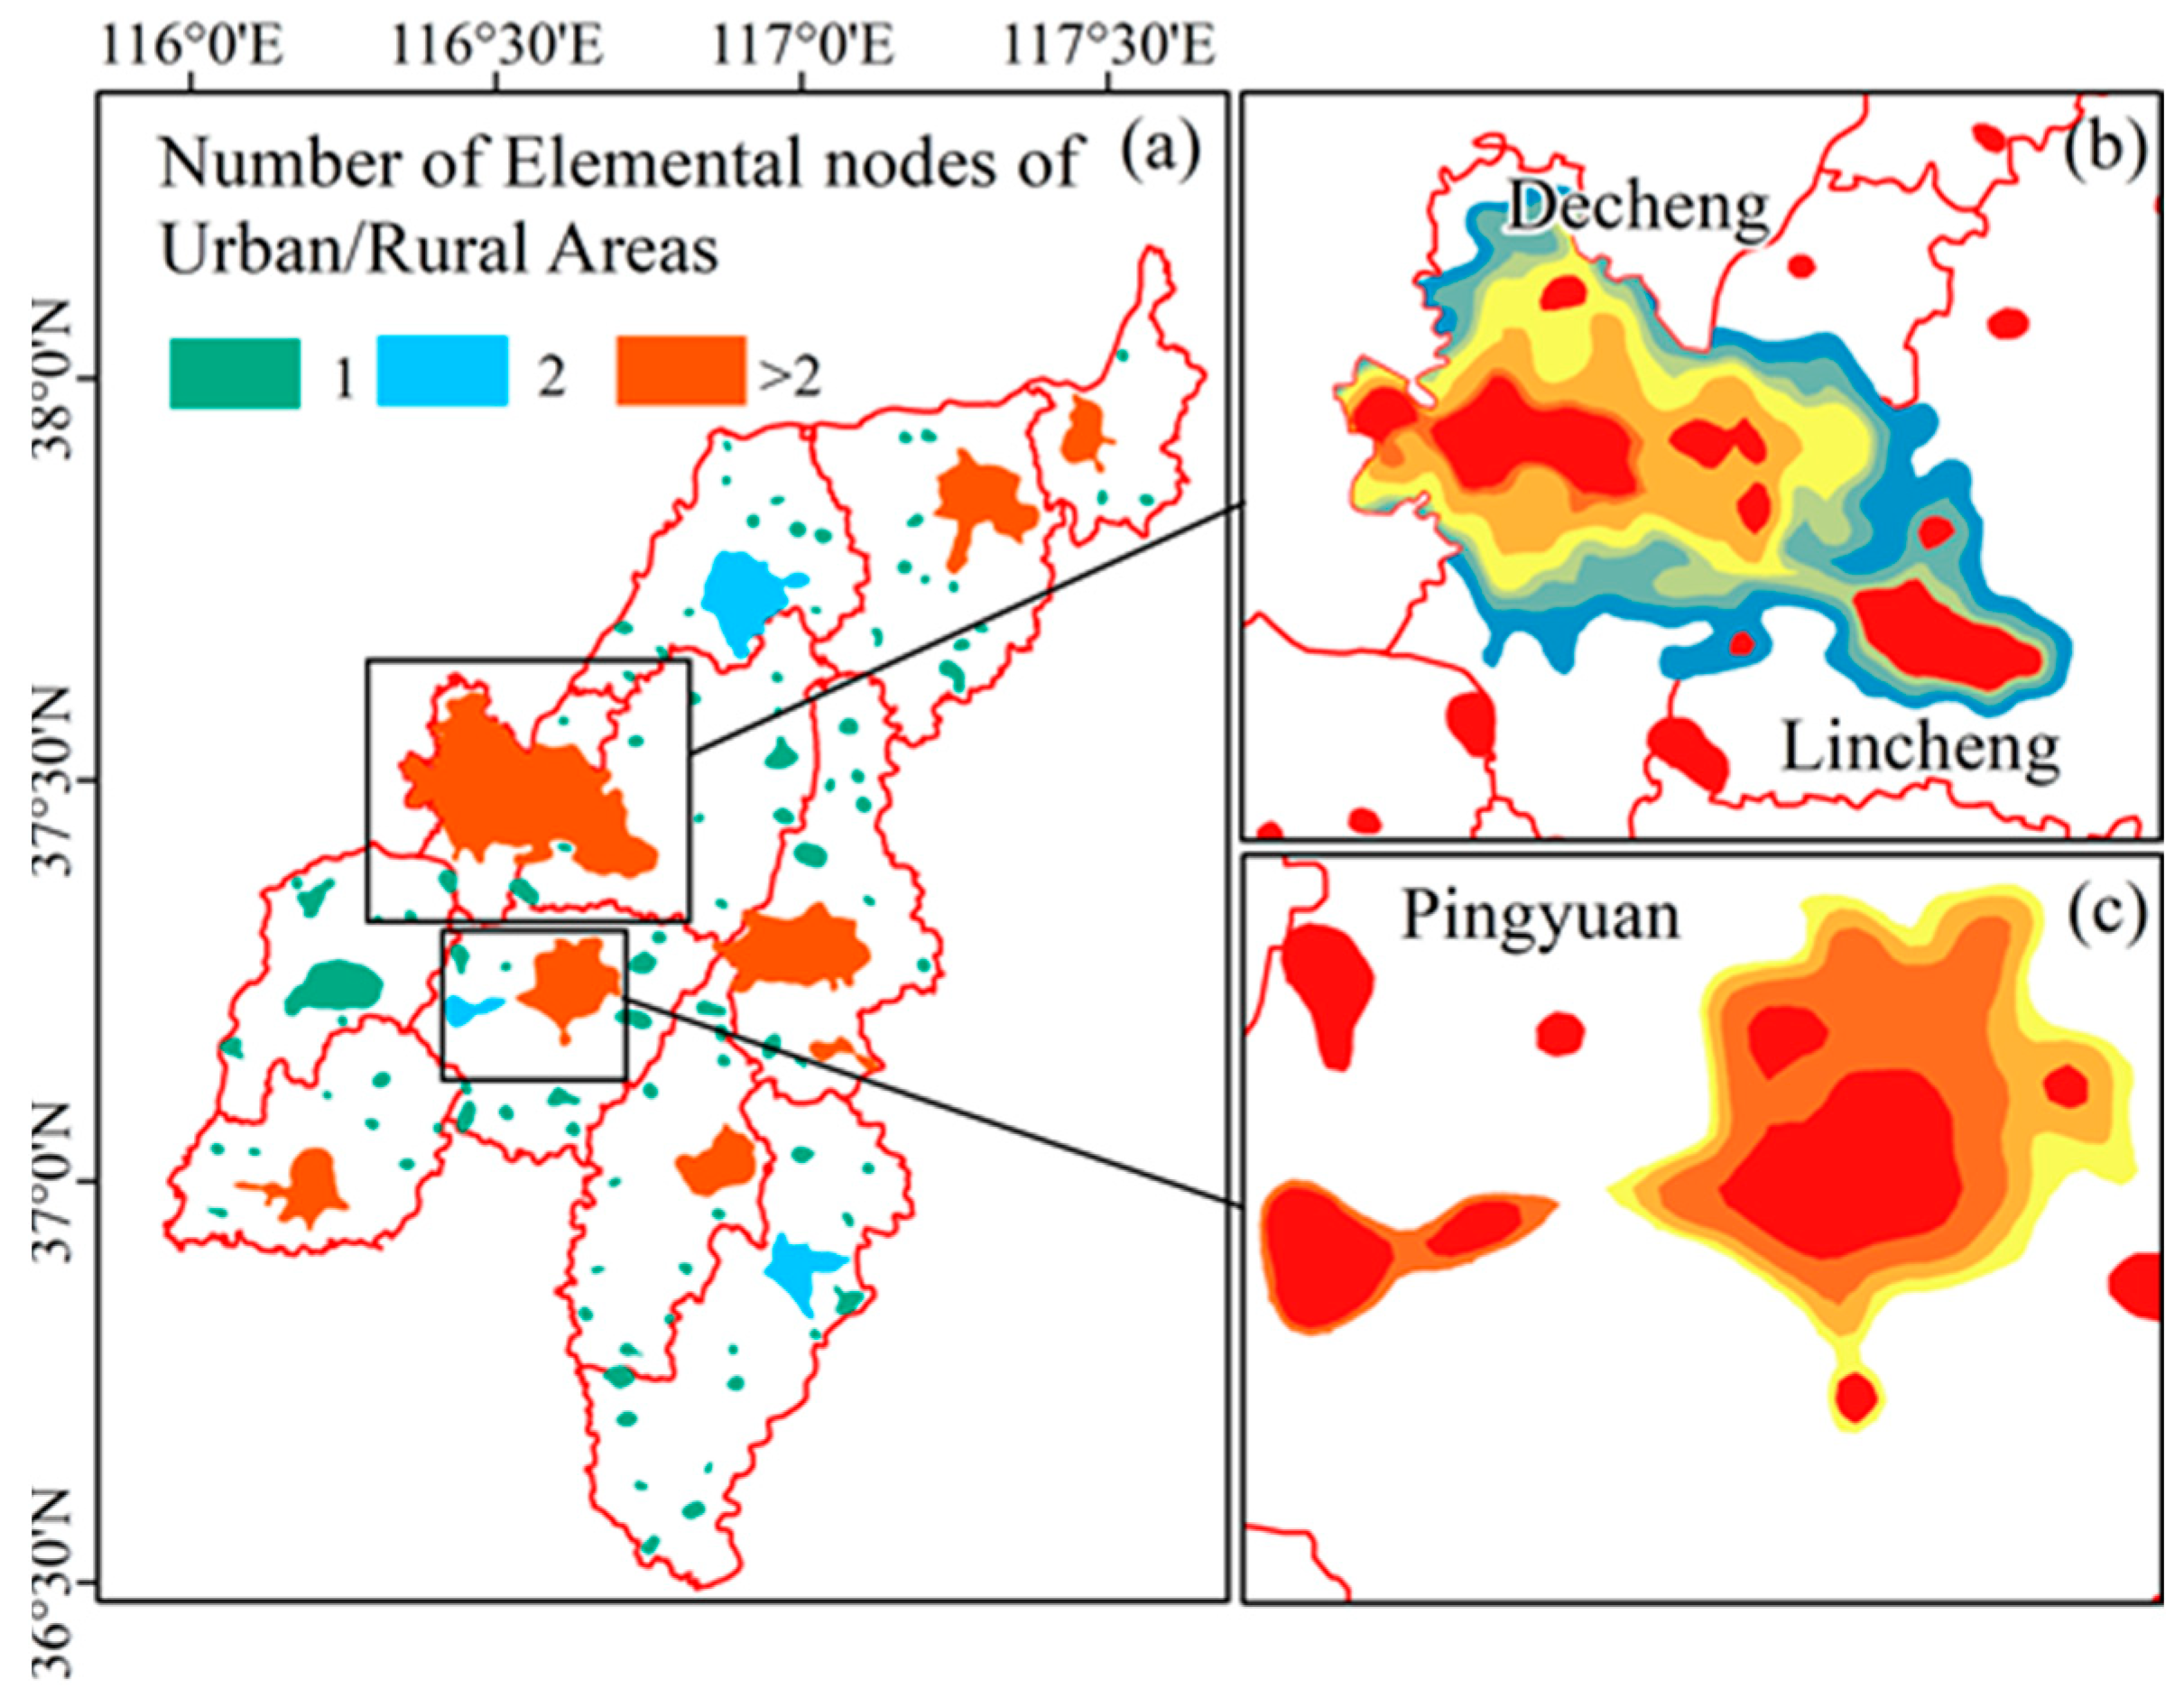
2.3.1. Localized Contour Tree of Nighttime Light Data

Urban-rural regions are the main bearing areas of human activities [11,12]. Nighttime light is the most intuitive manifestation of human activities, and there is a high correlation with the strength of human activities [34]. Therefore, the intensity distribution of nighttime light can be conceptualized as a continuous surface, representing the intensity of human activity, where the terrain corresponding to an urban or rural center is like a mountaintop [36,42].
Such a peak can be represented by a set of contour lines on a topographic map. Similarly, the identification of urban-rural spatial structures includes the detection of a set of nighttime light density contour lines on the digital surface. The structural relationship of the contour lines can be represented by the contour tree. The initial use scenario of localized contour tree method is to explore and determine the surface depression through digital elevation model (DEM) [36]. Therefore, this study tried to apply the localized contour tree method to the structure determination of urban-rural regions through nighttime light.
The localized contour tree method uses one or more bifurcation tree(s) to represent a contour map [36]. A contour tree is composed of Nodes and Links. A Node represents a contour line, and a Link represents a topological relationship between two adjacent Nodes. The localized contour tree method mainly consists of three parts: (1) determining the position of seed contour; (2) generating the regular contour tree; (3) simplifying the contour tree. Figure 3 shows how to use the contour map of nighttime light intensity to generate regular and simplified contour trees.
Firstly, this study defined the contour line that contained only one local nighttime light value peak and had no other contours inside as “seed contour line”. S1 and S2 are two seed contour lines in Figure 3a. In multi-center urban/rural regions, there are multiple nighttime light value peak points, and there will certainly be multiple seed contours. This study defined these seed contour lines as level 1 Nodes and identified the surrounding contours from level 1 Nodes outward. If the nearest contour of the seed contour line contains only its seed contour, the contour will be delimited at the same level as the seed contour line. If a contour line contains two or more individual seed contour lines, then we think the contour line’s level is higher than the seed contour lines it contains. For example, the contour lines S1 and S2 in Figure 3a belong to the seed contour line, the contour line S2 and T belong to the same level 1 Node, and S1 belongs to other level 1 Node. Since there are two independent level 1 Nodes, T and S1, the contour line U can be identified as a level 2 Node. The contour V contains U. Therefore, V also belongs to the level 2 Node. This recognition process will continue until all contour lines are identified and then finally construct a regular contour tree (Figure 3b). Then, the regular contour tree of Figure 3b is simplified to reflect the hierarchical structure of different level Nodes. In Figure 3b, contour line S2 and T belong to level 1 and can be considered as a branch in the contour tree map. Since there are no other seed contour lines in this branch, we can consider this branch an elemental region. The outermost contour line (T) of this branch represents the spatial range of this branch. Therefore, we only retain the contour line S1 and T in Figure 3b, representing two different branches. This identification method can be applied to the identification of all branches in the contour tree, such as the identification of branches belonging to the contour lines U and V in Figure 3b. In the identification of urban-rural spatial range, V (Figure 3c) can be regarded as a sub-tree because it contains two independent level 1 Nodes, and no other contour line contains it. Meanwhile, V can be regarded as a two-Node sub-tree.
It is possible for a single grid cell to be an urban/rural region, but the scope of urban/rural regions should not be too small. However, areas that are too small cannot be considered urban/rural regions. Considering the above problem, we defined the minimum urban/rural region as 1 km2 of areas. Meanwhile, in this study, the extent of contour V represents urban or rural regions. We believe that all major urban/rural regions can be detected with these preset parameters.

2.3.2. Calculation of Urban and Rural Attributes

To further analyze the differences between urban-rural regions, this study used five nighttime light statistics, similar to a previous study [42], including minimum light intensity (MIN), maximum light intensity (MAX), total nighttime light intensity (TNTL), average light intensity (AI) and standard deviation of light intensity (STD). Analogously, area (S) and compactness index (CI) were used to quantify the morphological and geometric characteristics of urban-rural regions. CI is a shape indicator defined by perimeter and area of urban/rural regions. In general, the circle is the most compact, and CI value is 1. The definitions of the above seven urban/rural attributes are shown in Table 1.

2.3.3. Urban-Rural Division Method

In China, the basic administrative unit is divided from top to bottom into province-city-county-township/town-village. Among them, the county seat is the most basic carrying unit of the urban region, while the township/town and village represent the vast rural region. At the same time, the intensity and scope of human and economic activities in urban regions are significantly higher than those in rural regions [11]. Therefore, this can be used as a basis for the division of urban-rural regions in Dezhou City.
Firstly, this study obtained the spatial range of hotspots of human activities by using localized contour tree method [36]. Then, taking the county as the smallest unit of the urban region, the hotspot area with the largest area of human activities within the county was designated as the city, and the other areas were designated as rural regions. Finally, specifically speaking, Dezhou City had 11 counties, so the top 11 hotspots were cities. However, in the continuous development of urban-rural regions, there might be the situation of the integration of the development of the two counties, resulting in the integration of the urban space scope of the two counties. In this case, we need to talk about the number of city limits separately, rather than just taking the first X bit of area as the city limits. The flow chart of this study is as follows in Figure 4.

3. Results

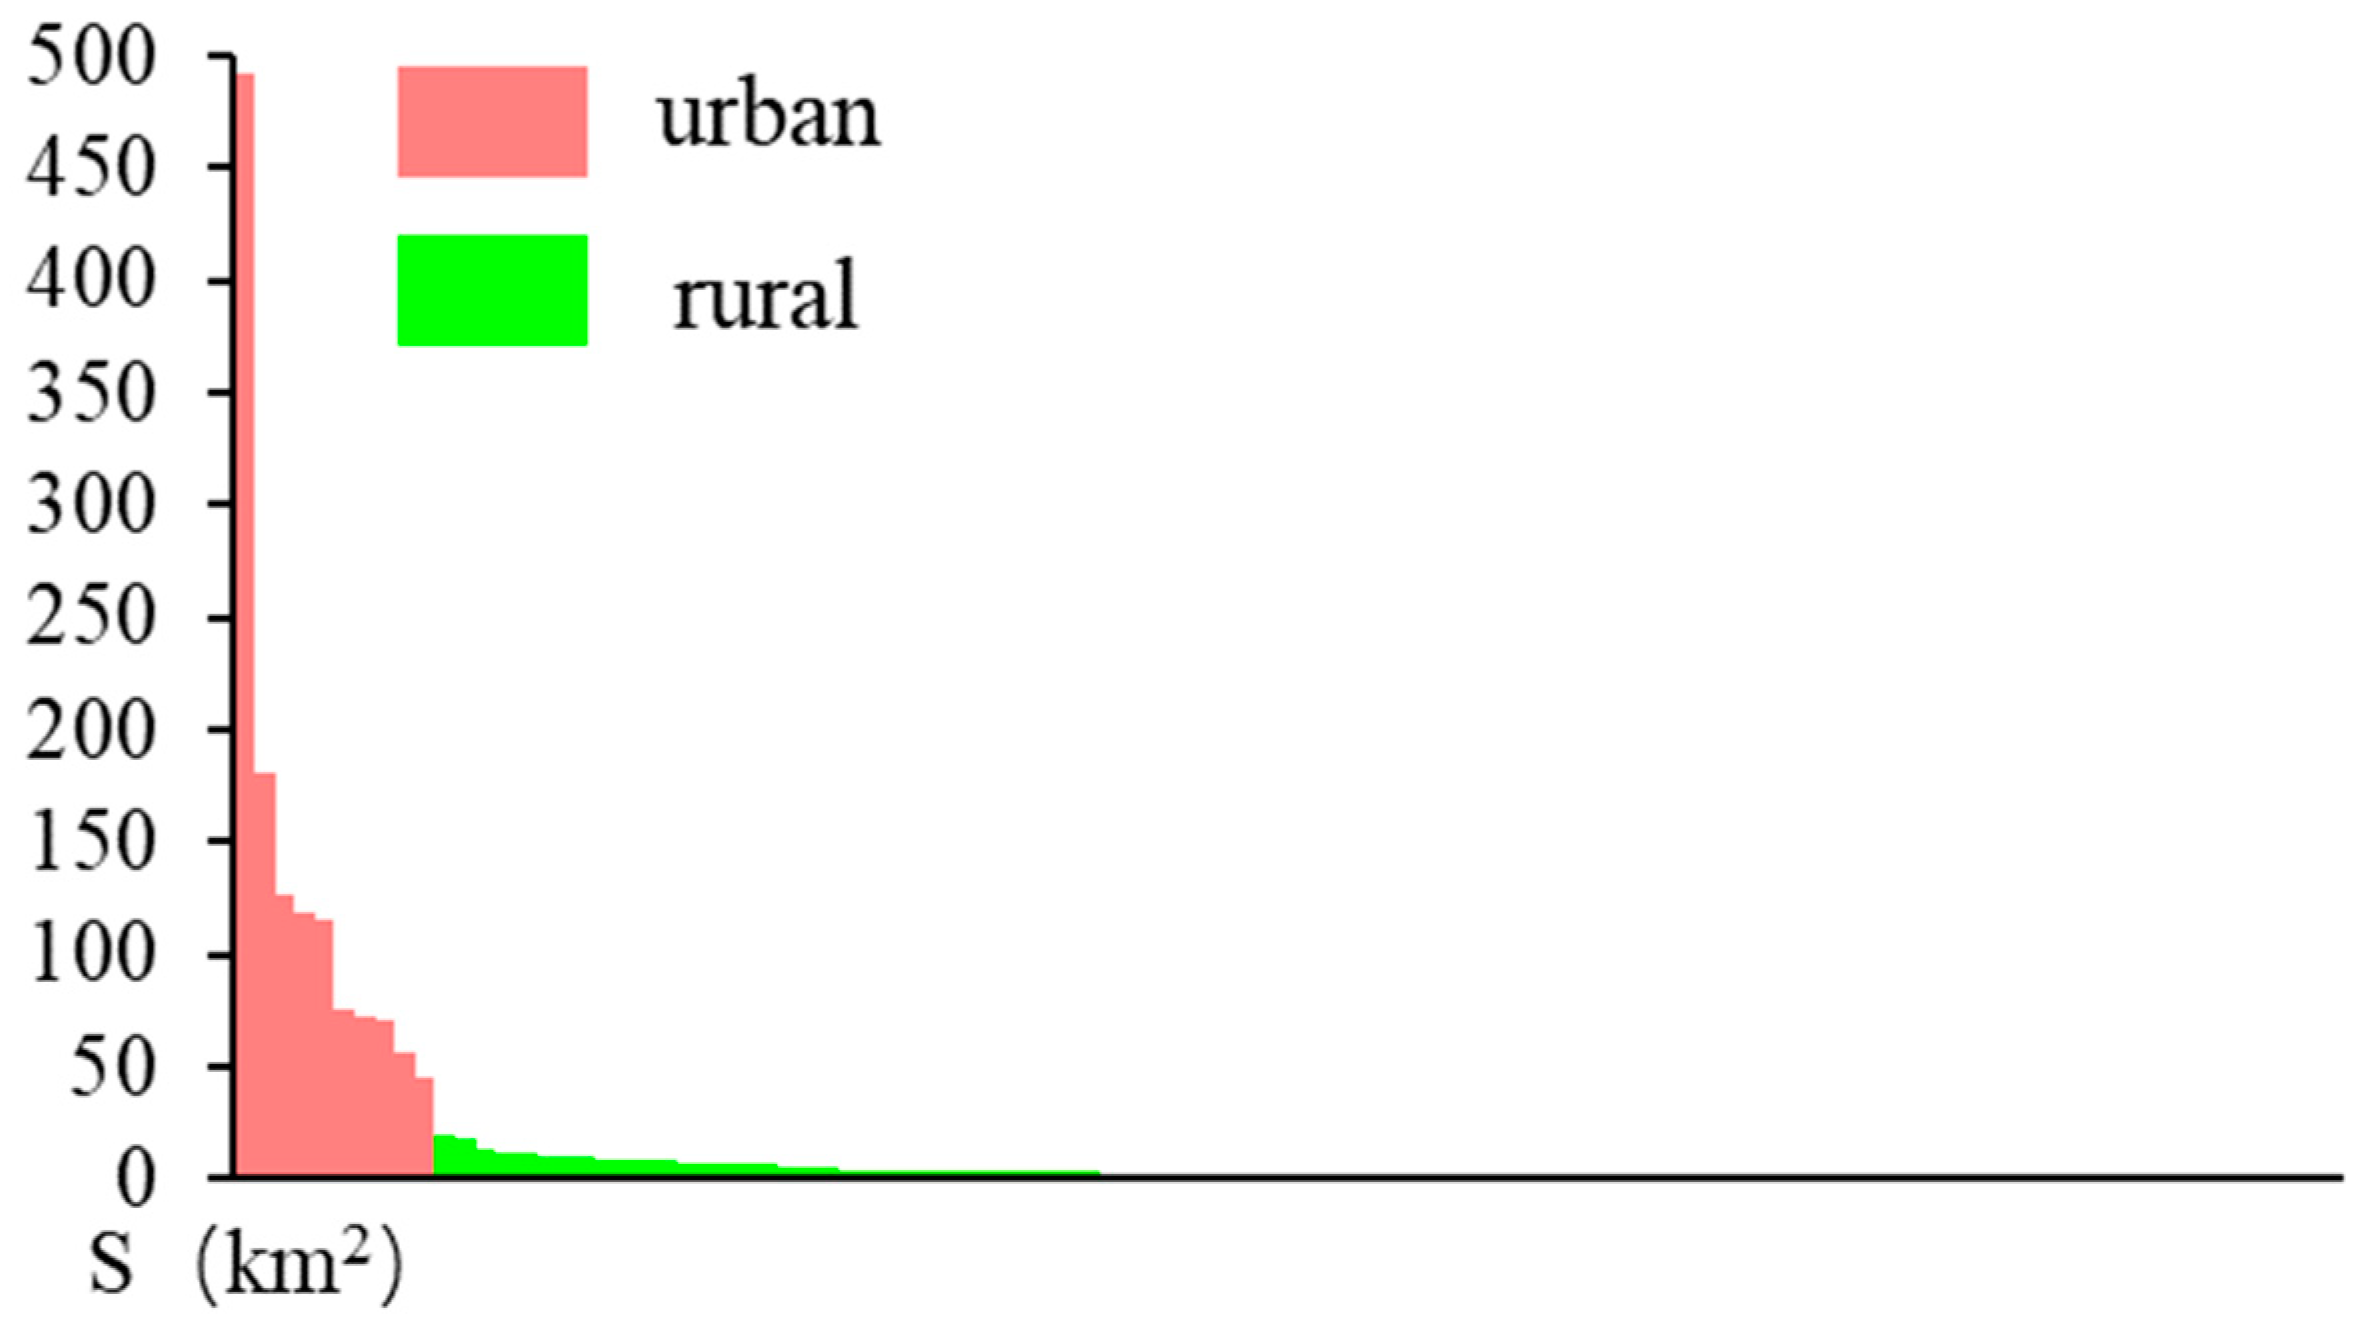
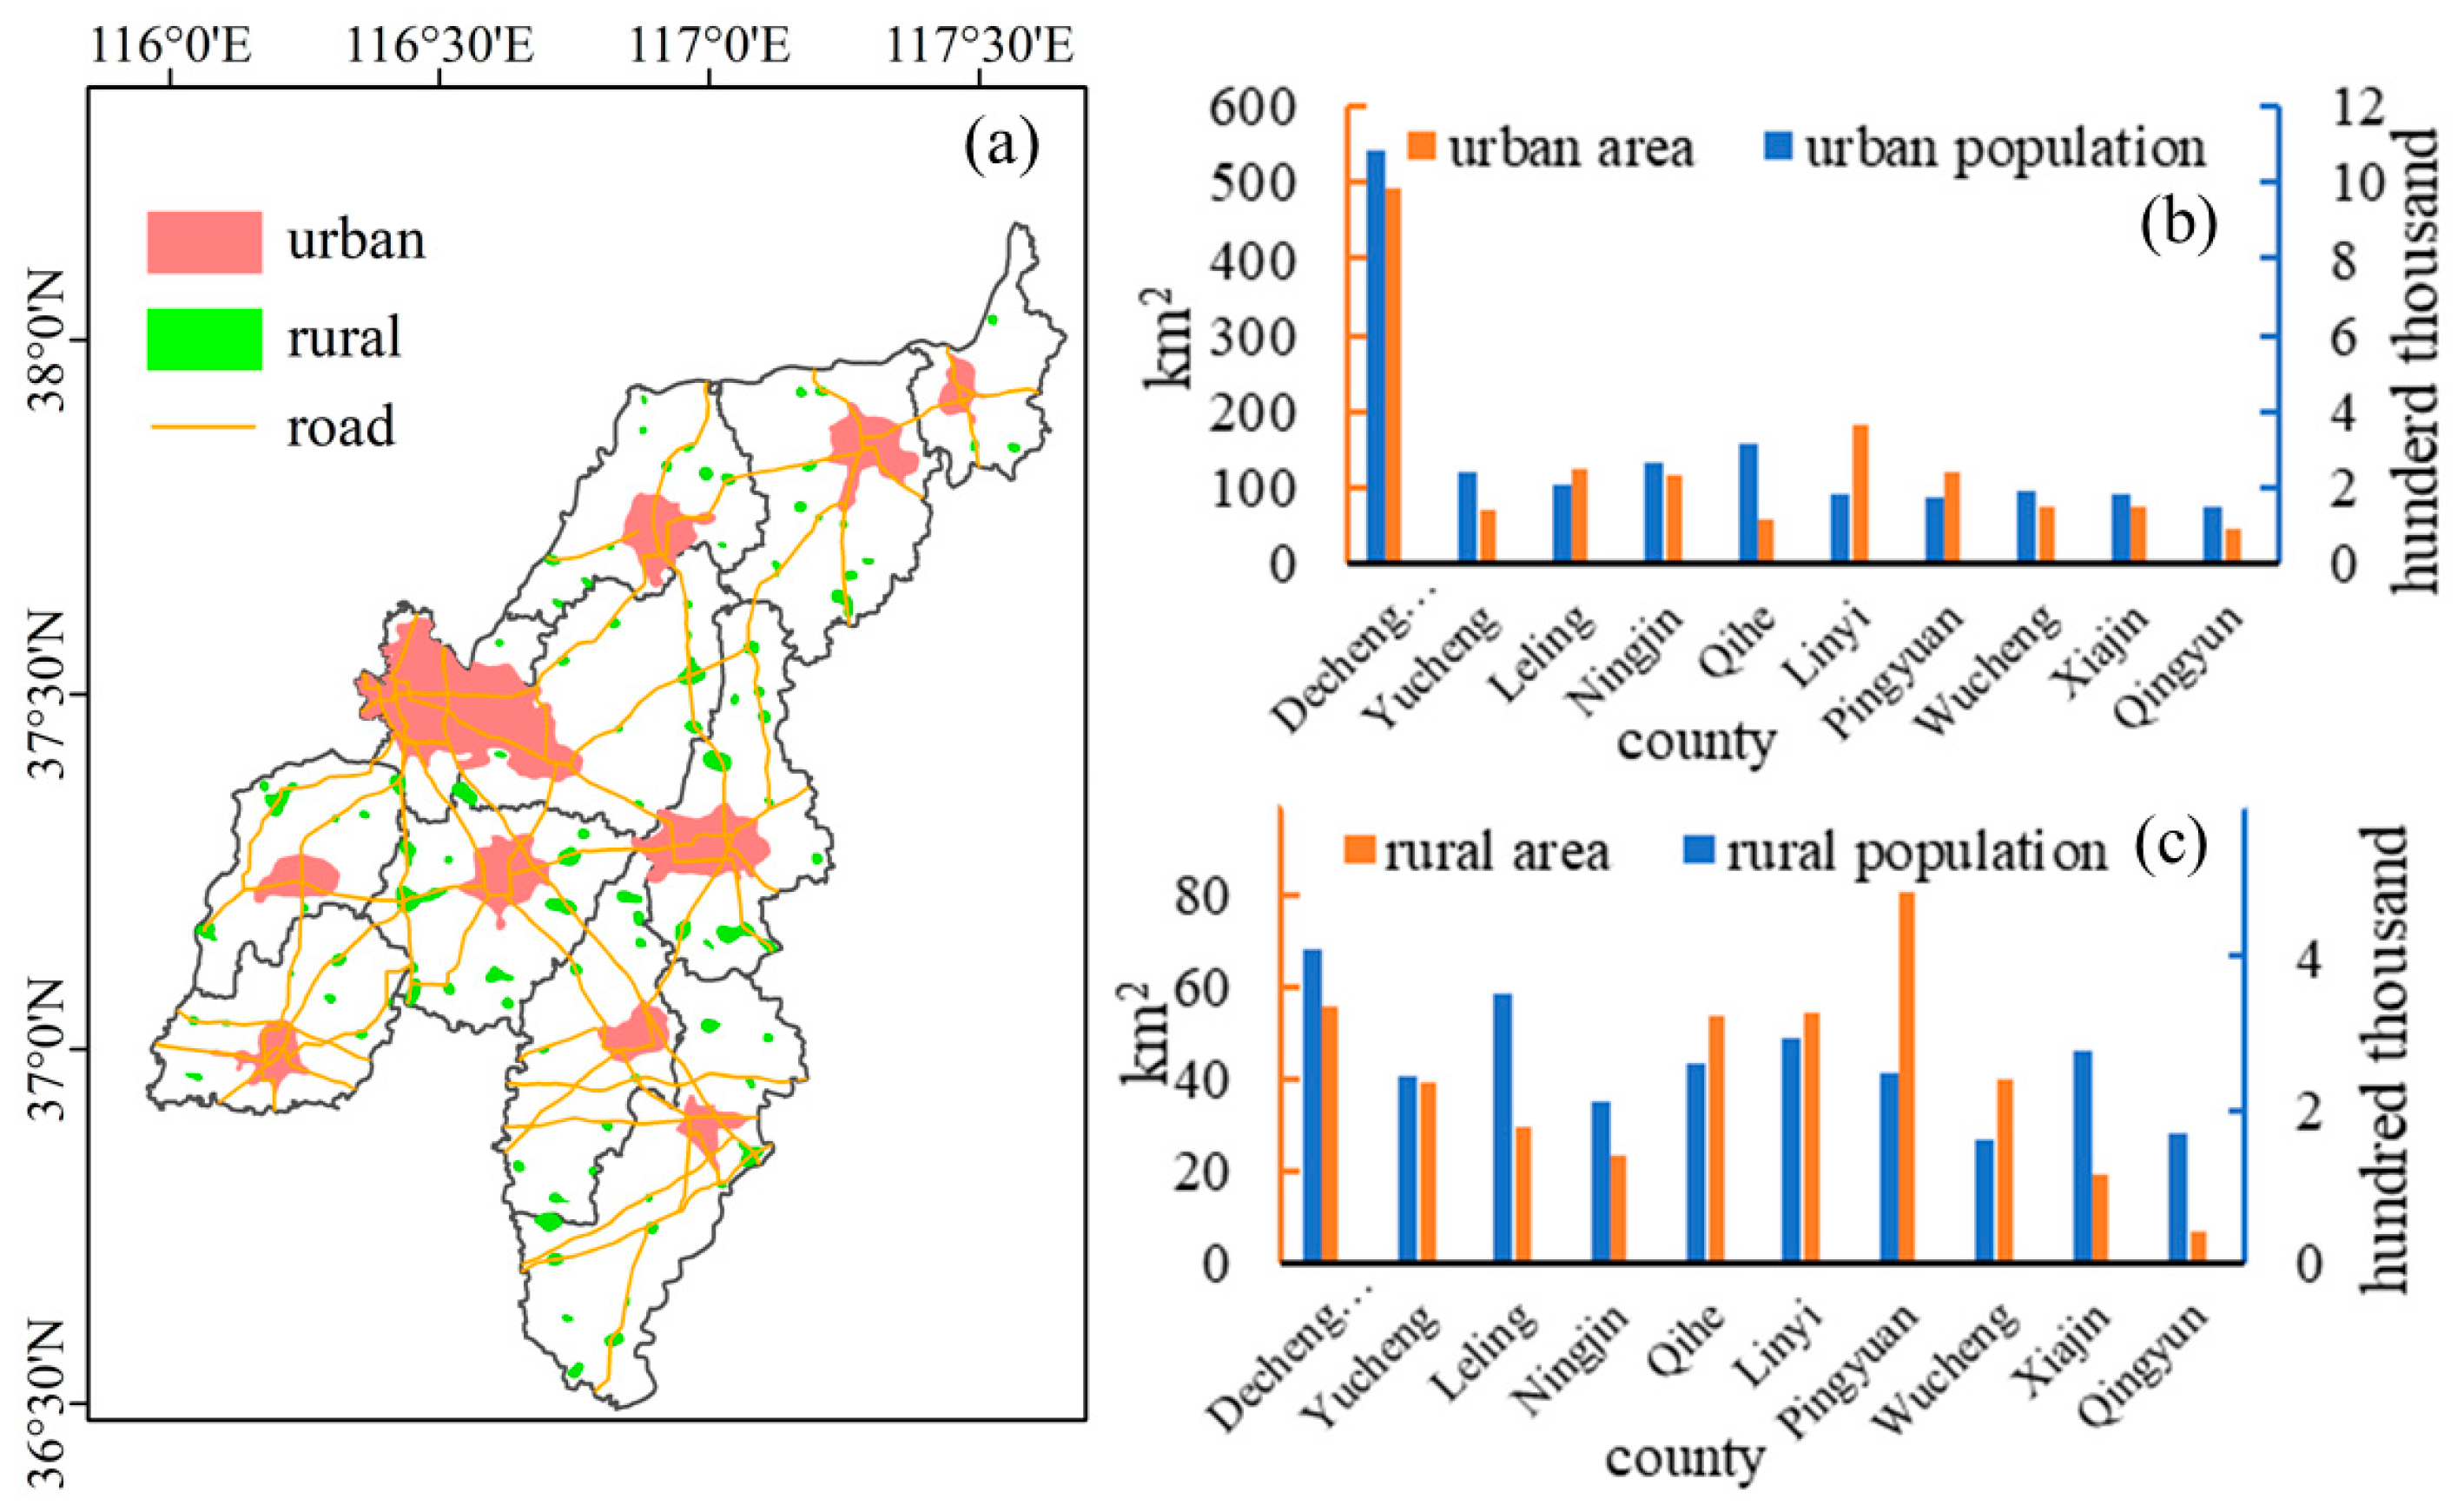
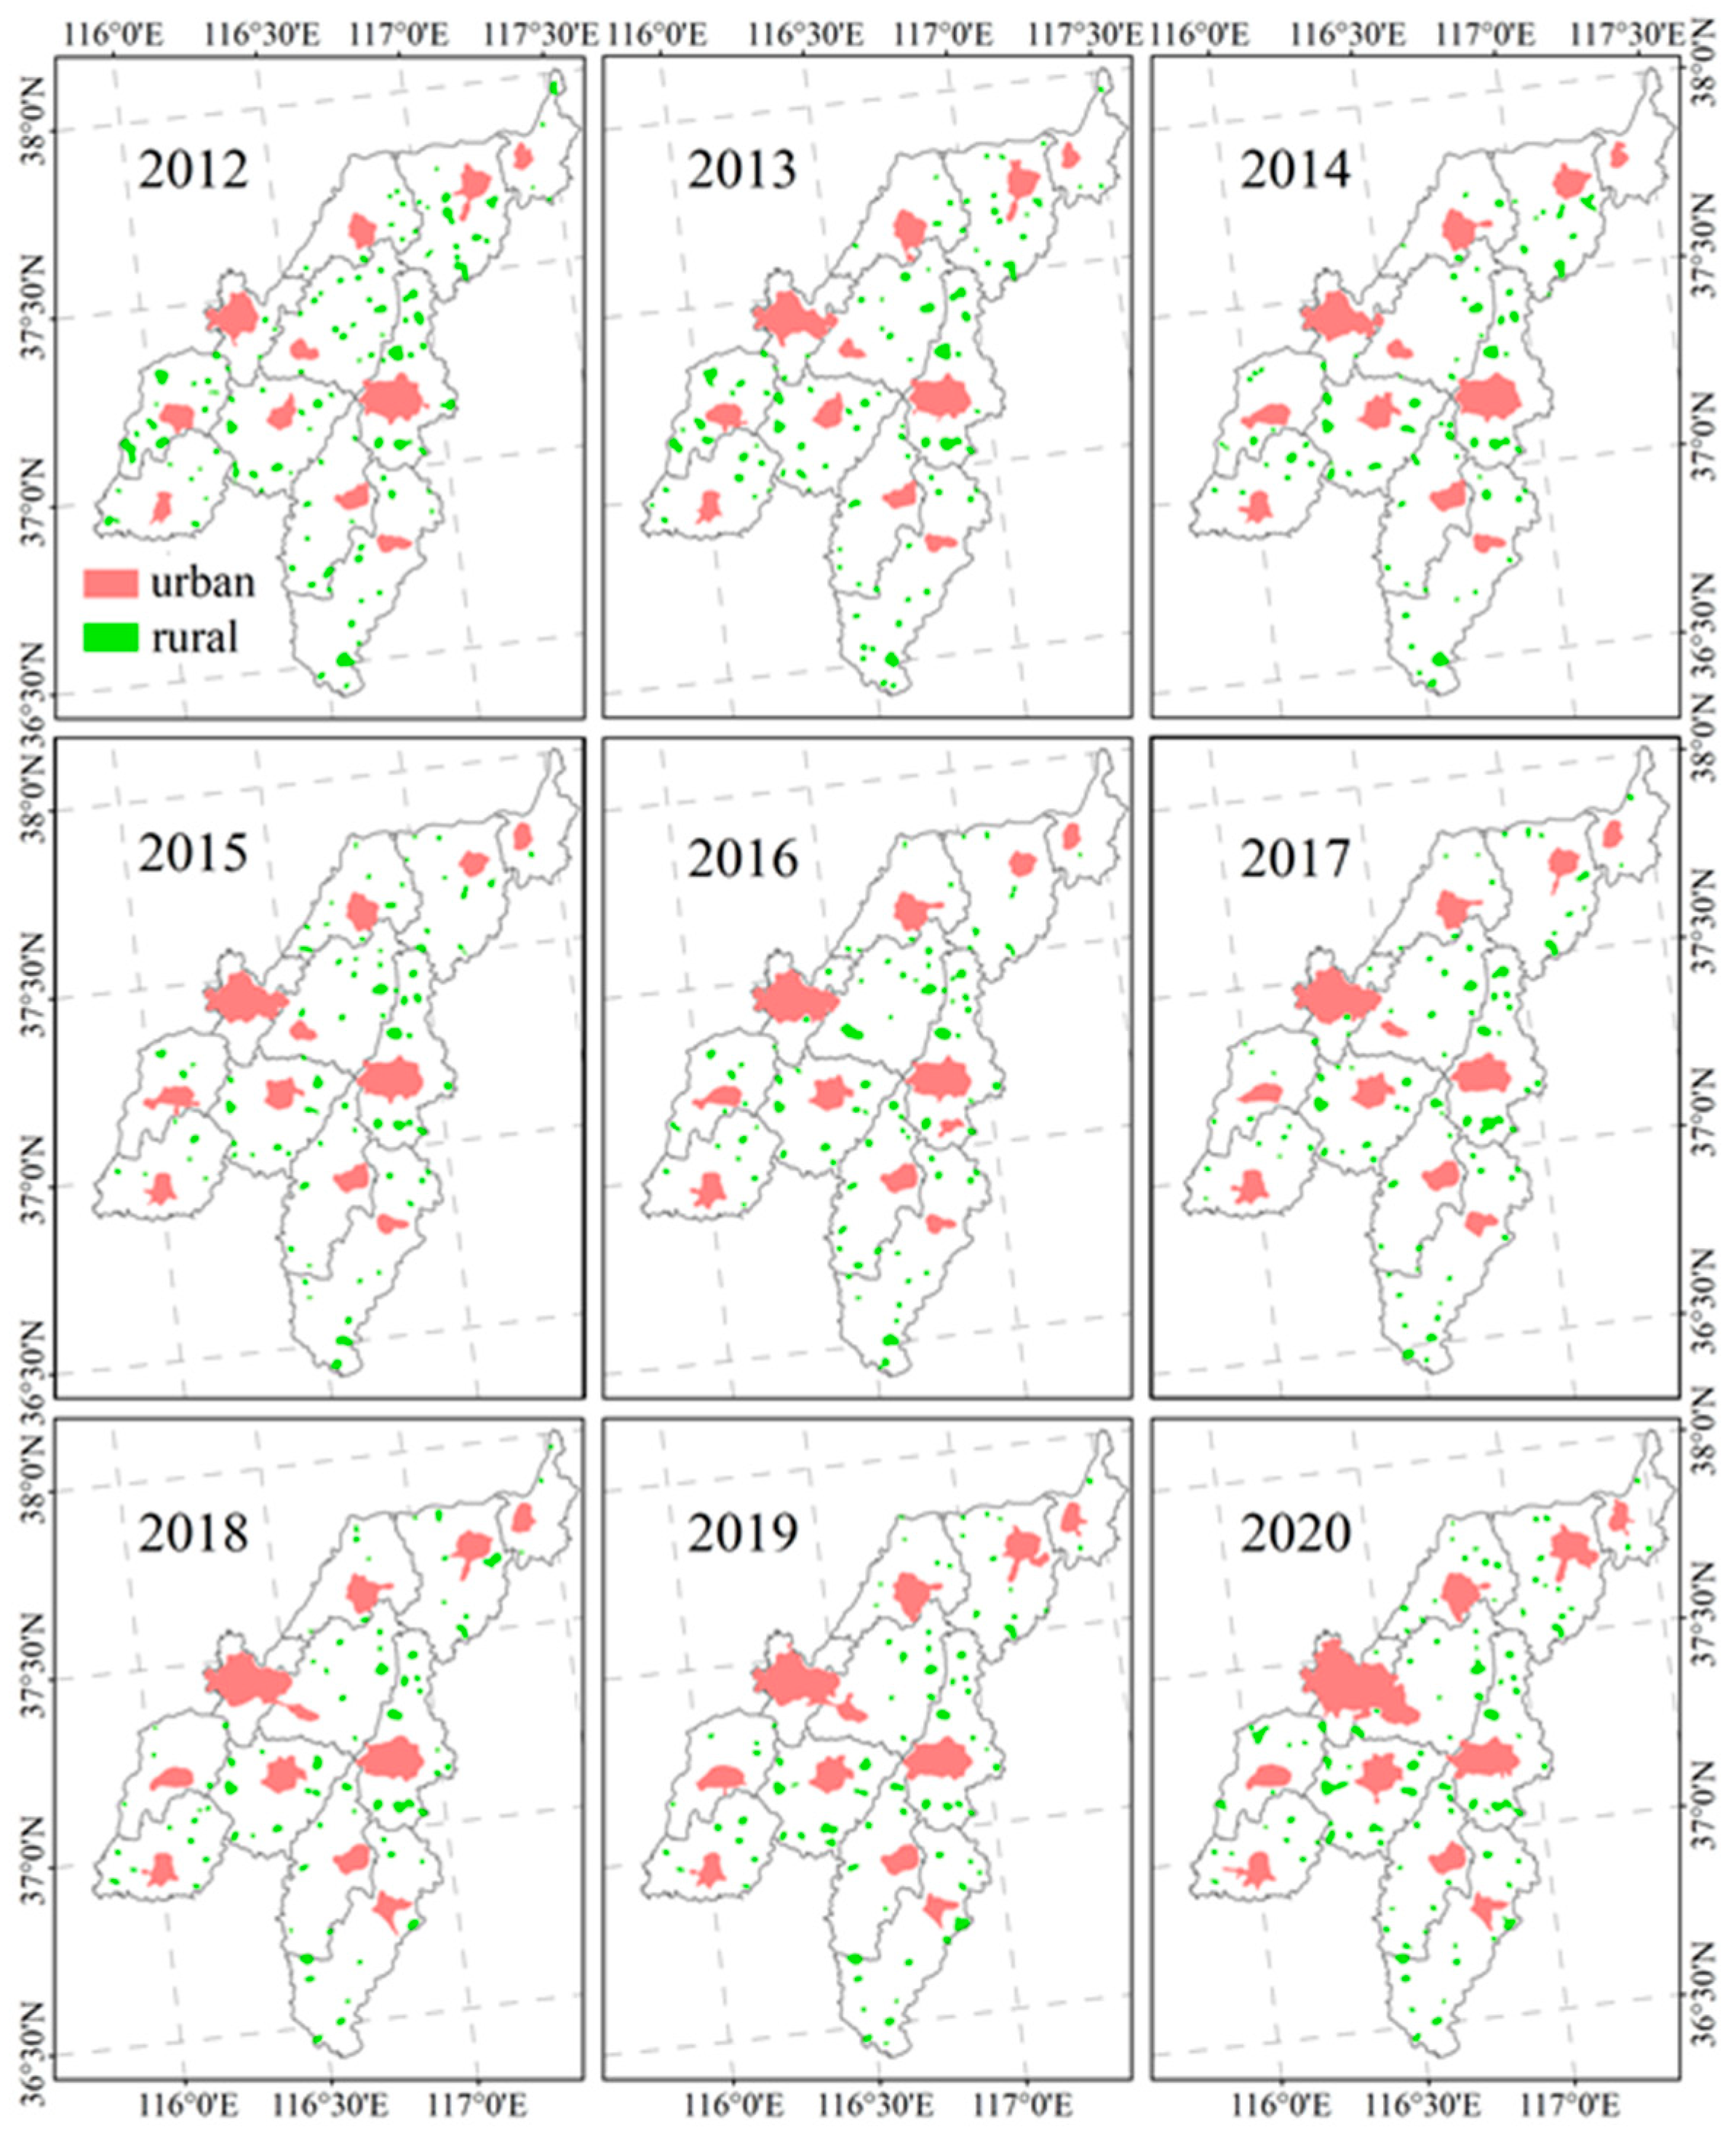
3.1. Identification and Analysis of Urban and Active-Rural Regions

This study removed the closed lines with areas of less than 1 km2 to eliminate potential urban-rural regions that were too small, as mentioned in Section 2.3.1. Then, we applied the localized contour tree method to generate contour trees during 2012–2020. Taking the simplified contour tree for 2020 as an example, Figure 5a shows the nighttime light contour maps and the nested hierarchical structures in Dezhou City. We obtained 105 sub-trees. Among them, 94 were one-Node sub-trees (green features in Figure 5a), 3 were two-Node sub-trees (blue features in Figure 5a), and the others belonged to 3 or more complex sub-trees (orange features in Figure 5a).
The largest sub-tree had seven levels and was the economic center of Dezhou City, located in Decheng County and Lincheng County in the west, as shown in Figure 5b. And it turns out that the urban regions of the two counties are interconnected. Initially, regions with two or more Nodes are basically urban regions, while regions with only one Node are basically rural regions. Because urban regions tend to be more extensive, and there is often more than one area of intensive human activity, human and socio-economic activities in rural regions tend to be homogeneous and generally concentrated in one place.
One-Node sub-trees are the main part of the total. On the map, these areas are basically rural regions. One-Node sub-trees mainly consist of towns, factories and villages. The size of a town is smaller than a county and bigger than a village. For most towns in China, there are usually at least one or two main roads through the town. In some places, there could be a river through the town. Homes and other buildings often unfold along the road or river, which makes the construction of the town simpler than that of a county (Figure A3a–g). Besides towns, factories are also extracted from nighttime light data. Figure A3h–j shows that the factories are far away from the city and surrounded by croplands. Industrial production consumes a lot of electricity, but cropland regions without lamplight make the factories the brightest spot(s) in these regions. Therefore, they can also be extracted when two or more villages are spaced together, producing nighttime lights that are close to the brightness of towns, though these cases are less common.
This study divided urban-rural regions of 2020 according to the Section 2.3.2. The spatial distributions of urban-rural regions in Dezhou City were shown in Figure 6. Overall, urban-rural regions showed uniform distribution patterns. The urban regions of each county are well identified, and there is generally only one central region, as other areas are rural regions. Urban and rural regions are connected by roads, and most rural regions are distributed along roads (Figure 6a). Notably, the urban region of Lincheng County and Decheng District was integrated into a rural region. This is mainly because the county town of Lincheng County is close to Decheng District, and Decheng District is the economic center of the whole Dezhou City. The development direction of Lincheng County gradually expands westward until it is integrated with Decheng District.
Rural regions are distributed in the periphery of the city, and their sizes are far smaller than the cities’. The number of urban regions in Dezhou City in 2020 is 10, but its area reaches 1354.5 km2, accounting for 79.13% of the total urban-rural regions. There are 95 rural regions, covering an area of 357.3 km2 and 20.87% of the total urban-rural regions (Appendix A, Figure A1). The populations and urban/rural regions of each county in Dezhou City also maintain high consistency (Figure 6b,c).

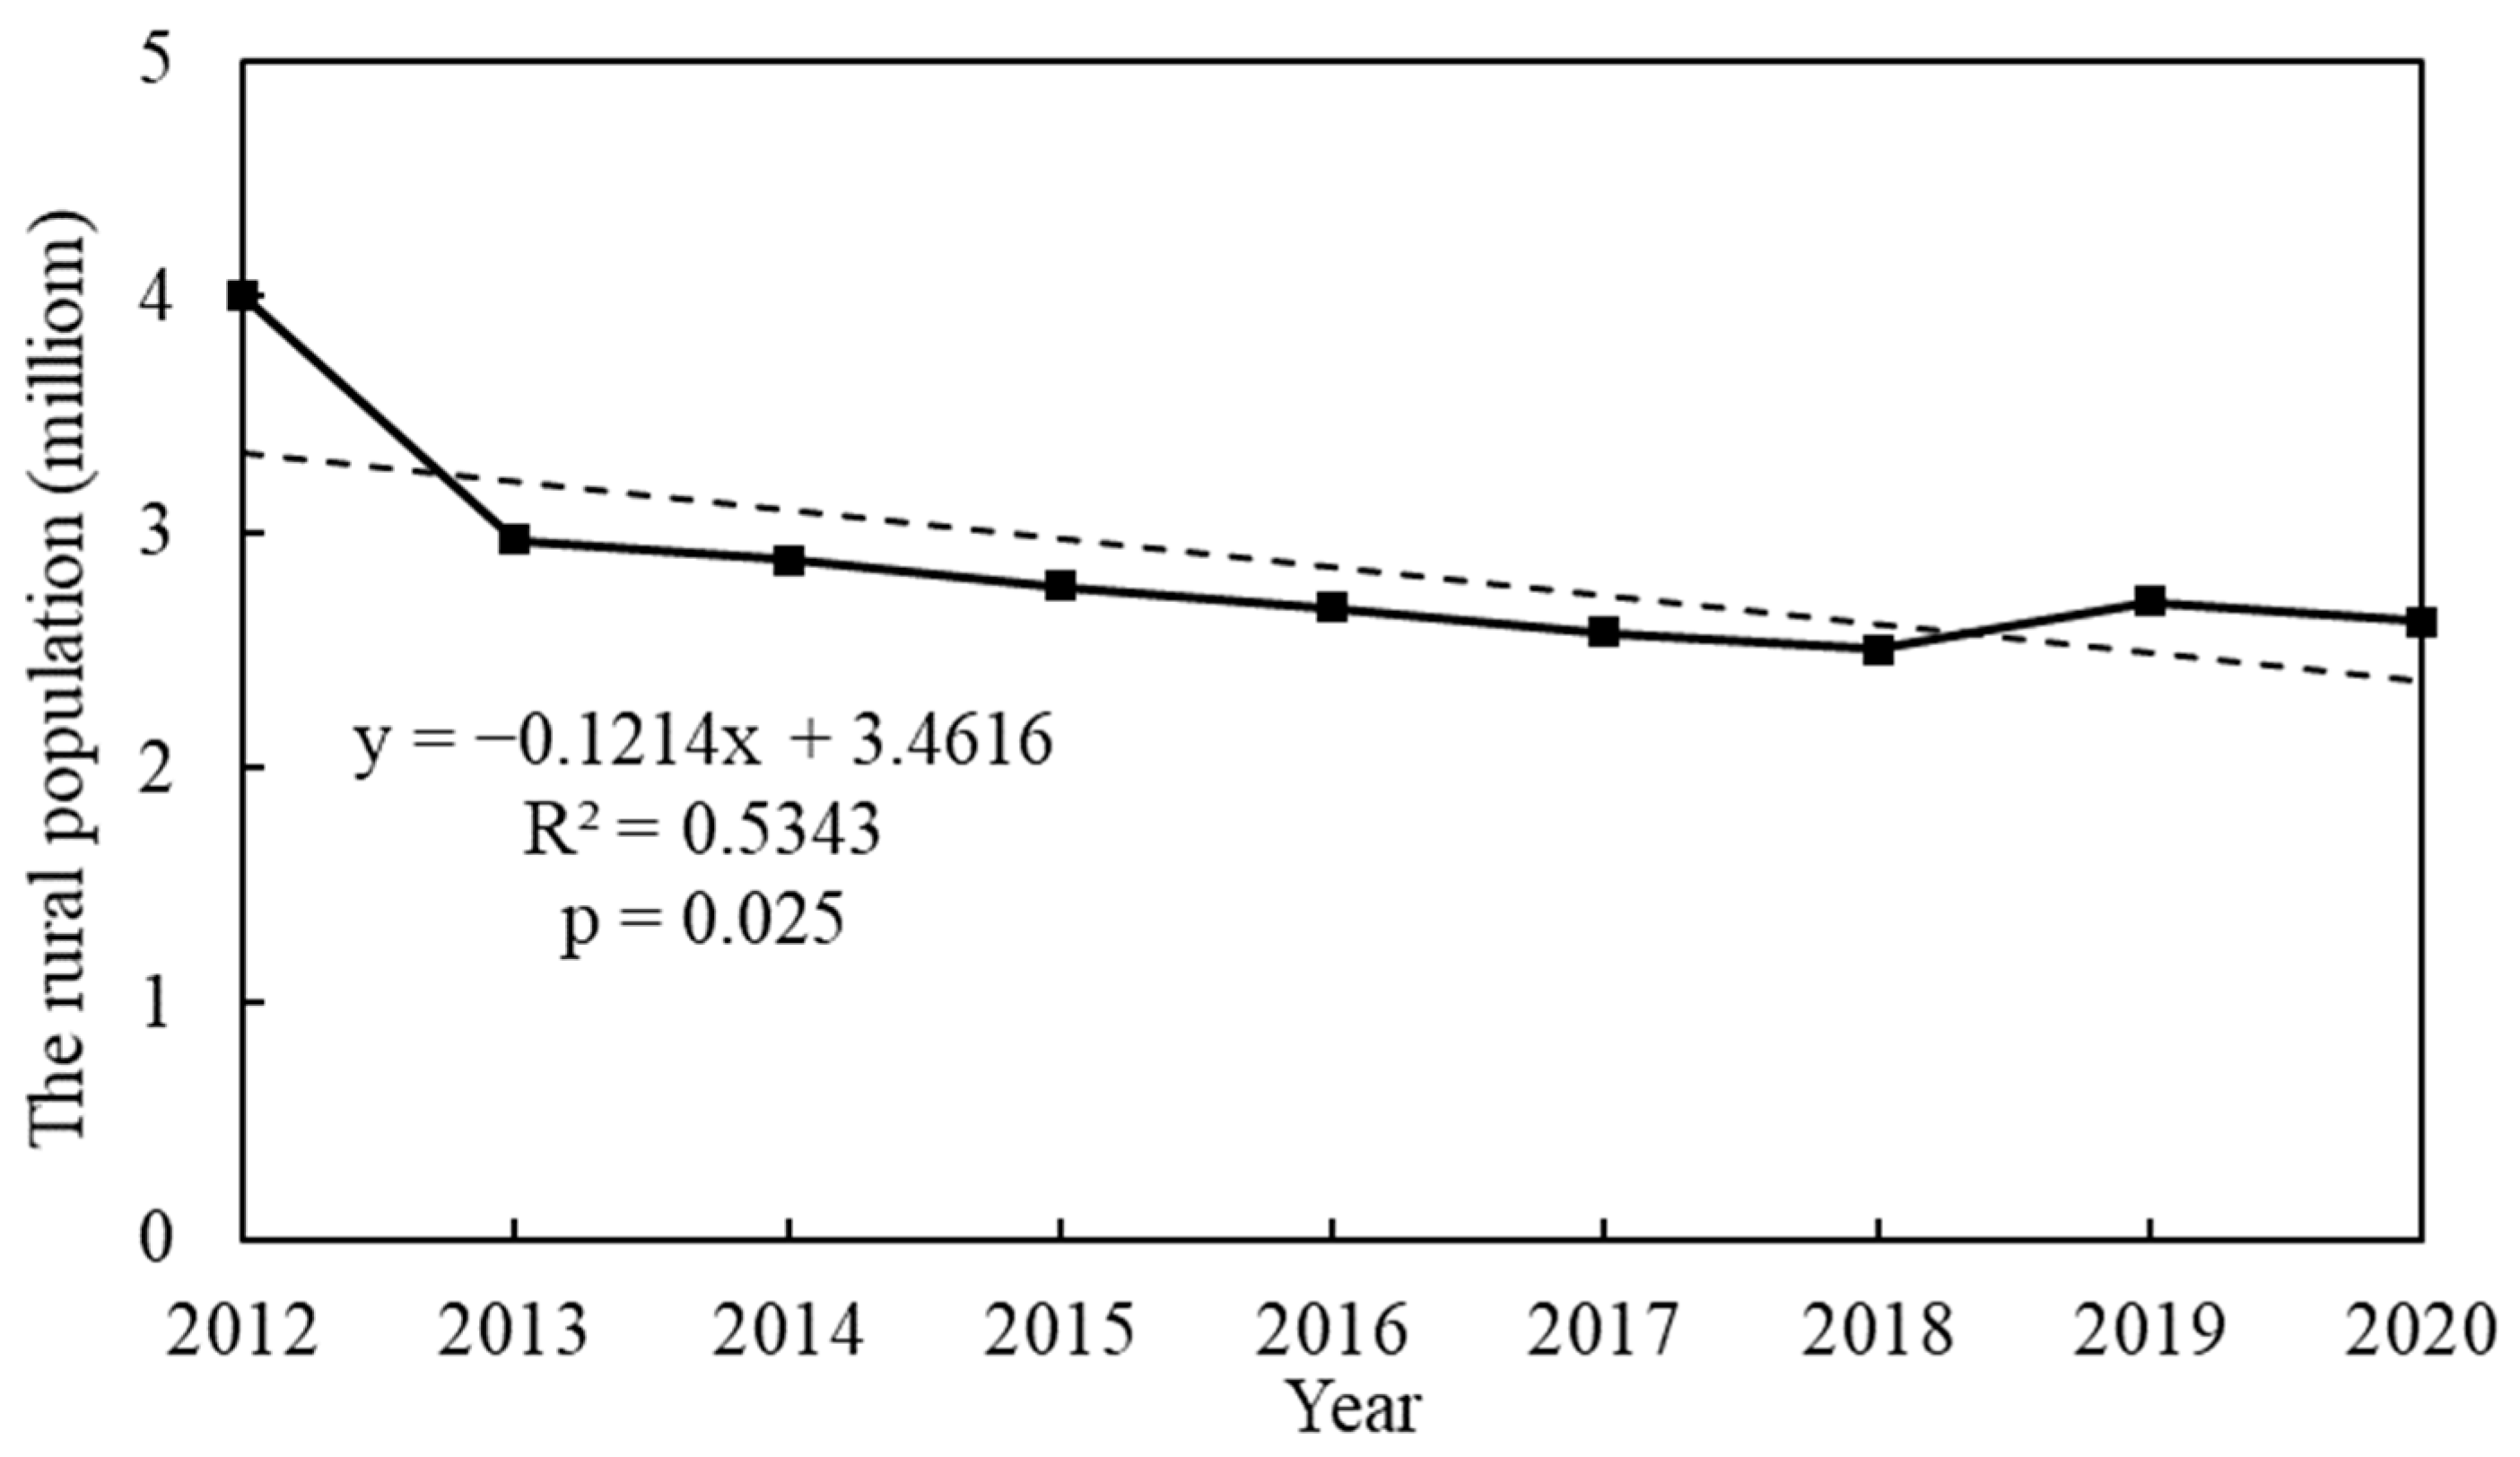
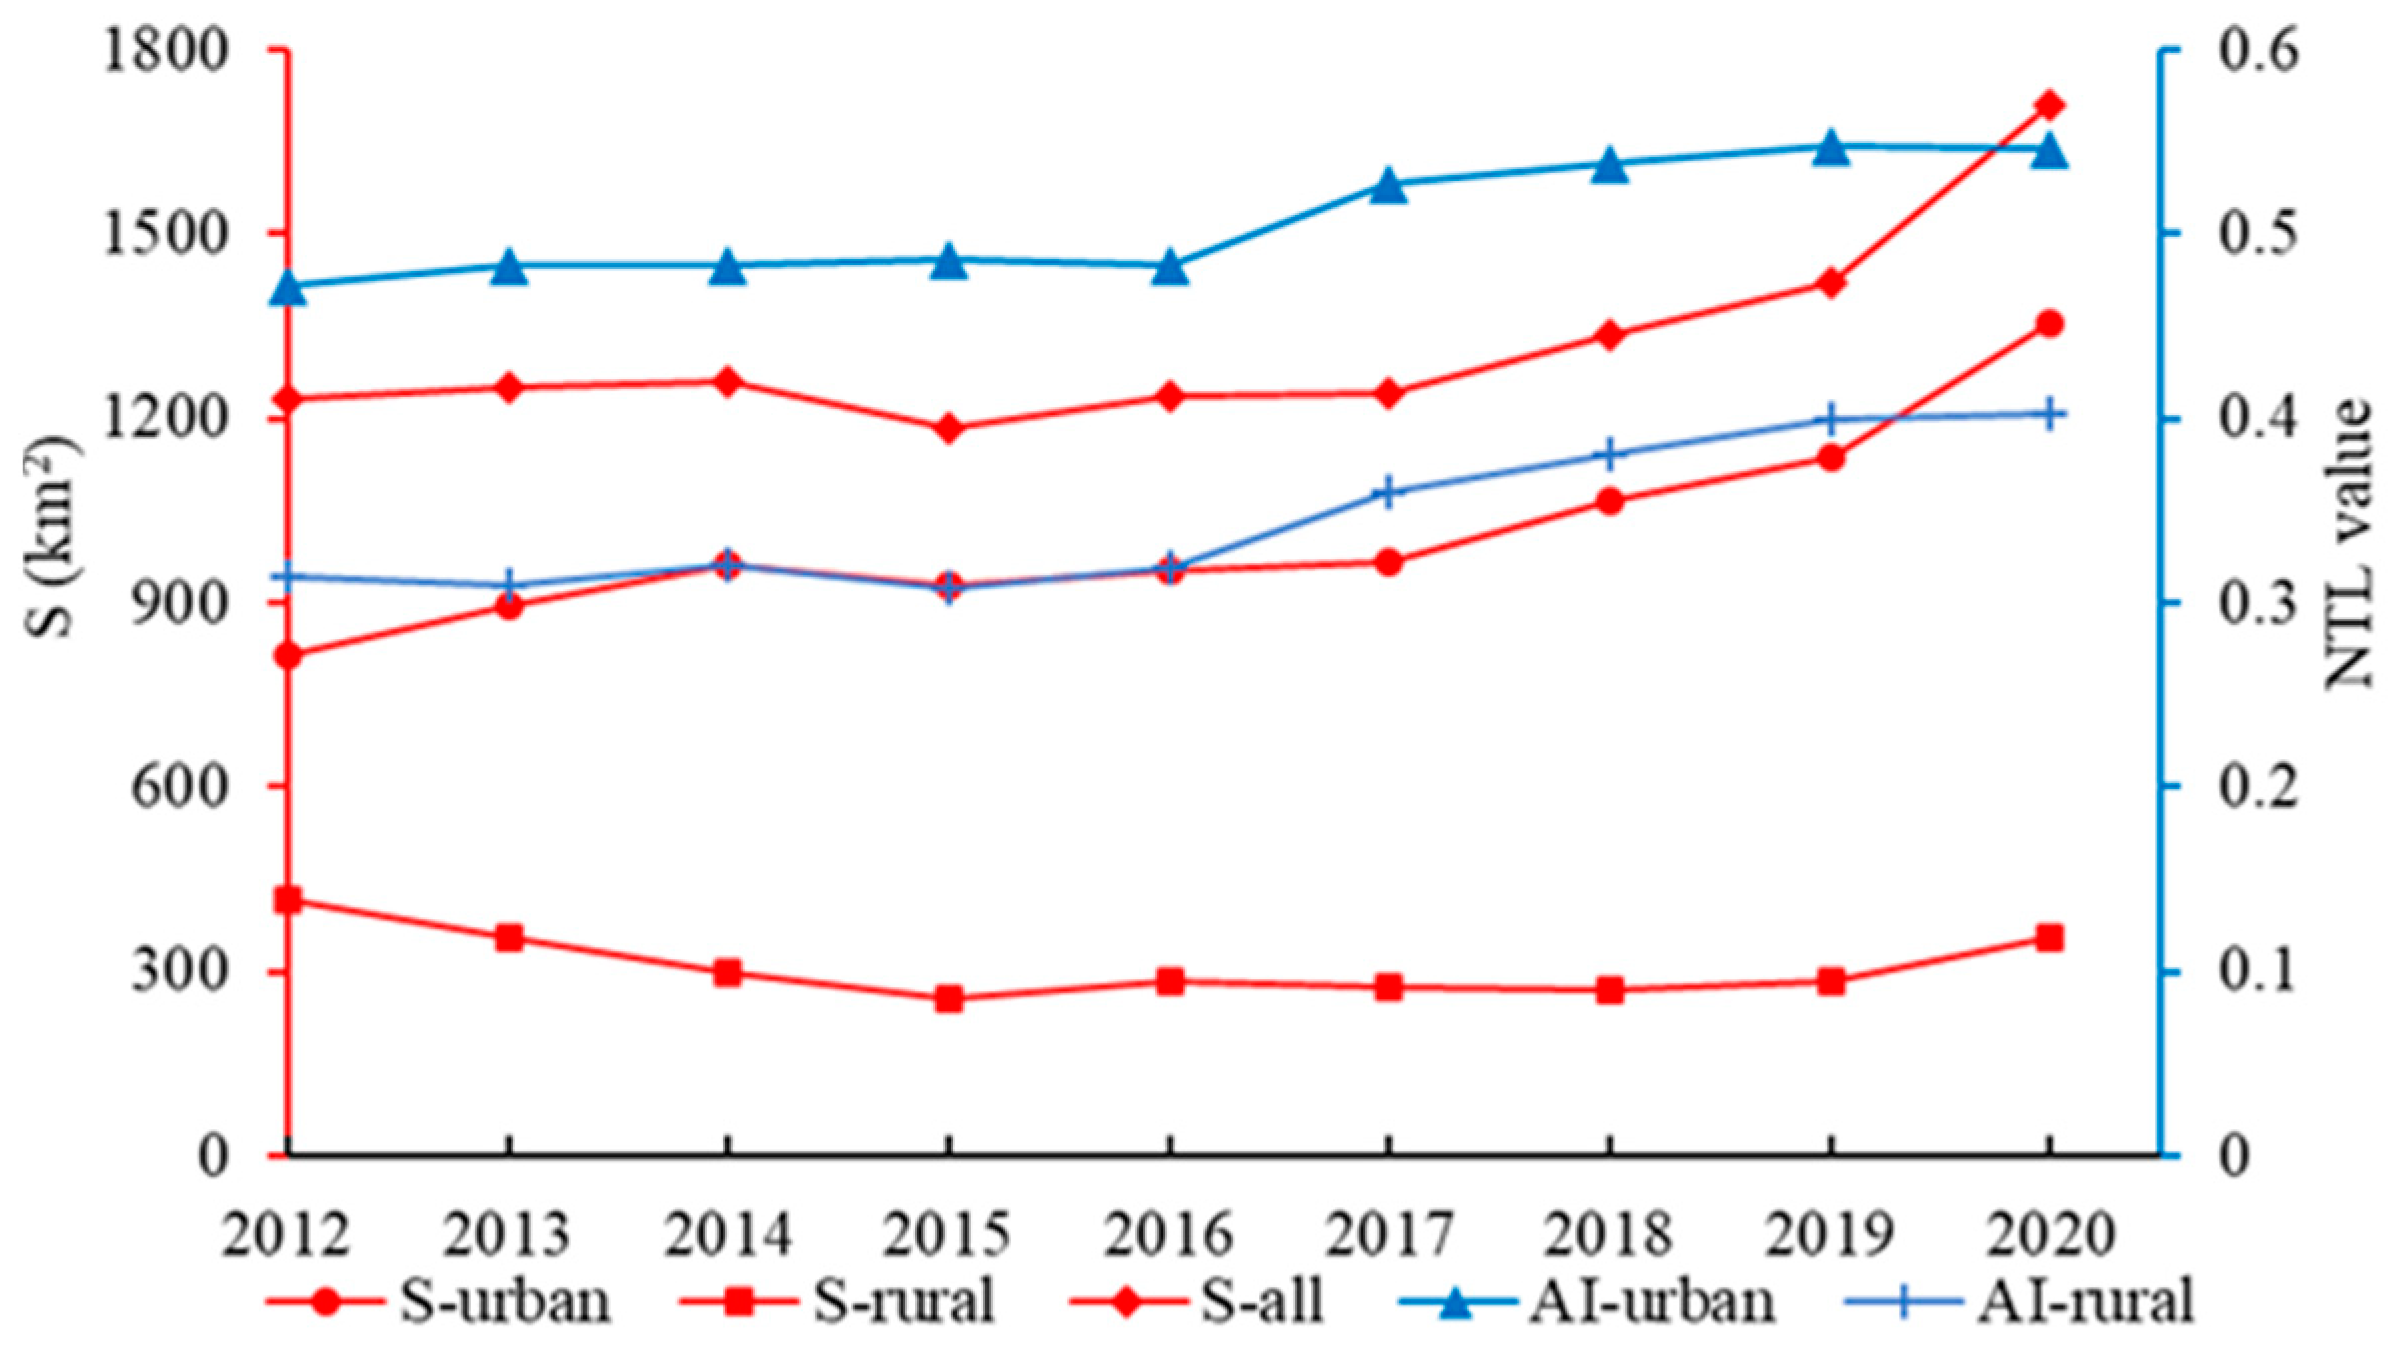
3.2. Spatial and Temporal Evolution Characteristics of Urban-Rural Regions

The spatial patterns of urban and rural regions in Dezhou City remained basically unchanged during 2012–2020 (Figure 7). It is noteworthy that the urban regions of Decheng District and Lingyi County were separated from each other in 2012–2017 and merged into the same area after 2018. Rural regions are scattered around urban regions, and the number is decreasing. The urban-rural regions of Dezhou City have been increasing significantly (p < 0.05), going from 1229 km2 in 2012 to 1711 km2 in 2020 (Figure 8). Specifically, the large influx of rural populations into urban regions has led to an increasing demand for construction land. At the same time, the scope of human activities in urban regions has been expanded. For example, the urban region expanded from 813.44 km2 to 1354.47 km2. The area of rural regions decreased first and then increased slightly, going from 415.68 km2 in 2012 to 357.26 km2 in 2020.
Nighttime lights have been used to reflect the level of energy consumption and economic activity in a country or region [43,44,45]. By comparing the intensity of urban lighting in different countries or regions, we can therefore roughly judge their level of economic development. The nighttime light brightness in urban regions is higher than that in rural regions, indicating that the development level of urban regions is higher than that of rural regions. The average nighttime light values in urban-rural regions of Dezhou City showed a significantly increasing trend (p < 0.05). The average nighttime light values in urban regions increased from 0.47 in 2012 to 0.55 in 2020 (slope = 0.011, p < 0.05), and those in rural regions increased from 0.31 in 2012 to 0.4 in 2020 (slope = 0.013, p < 0.05). This suggests that levels of urban and rural developments in Dezhou City both improved in the past nine years.

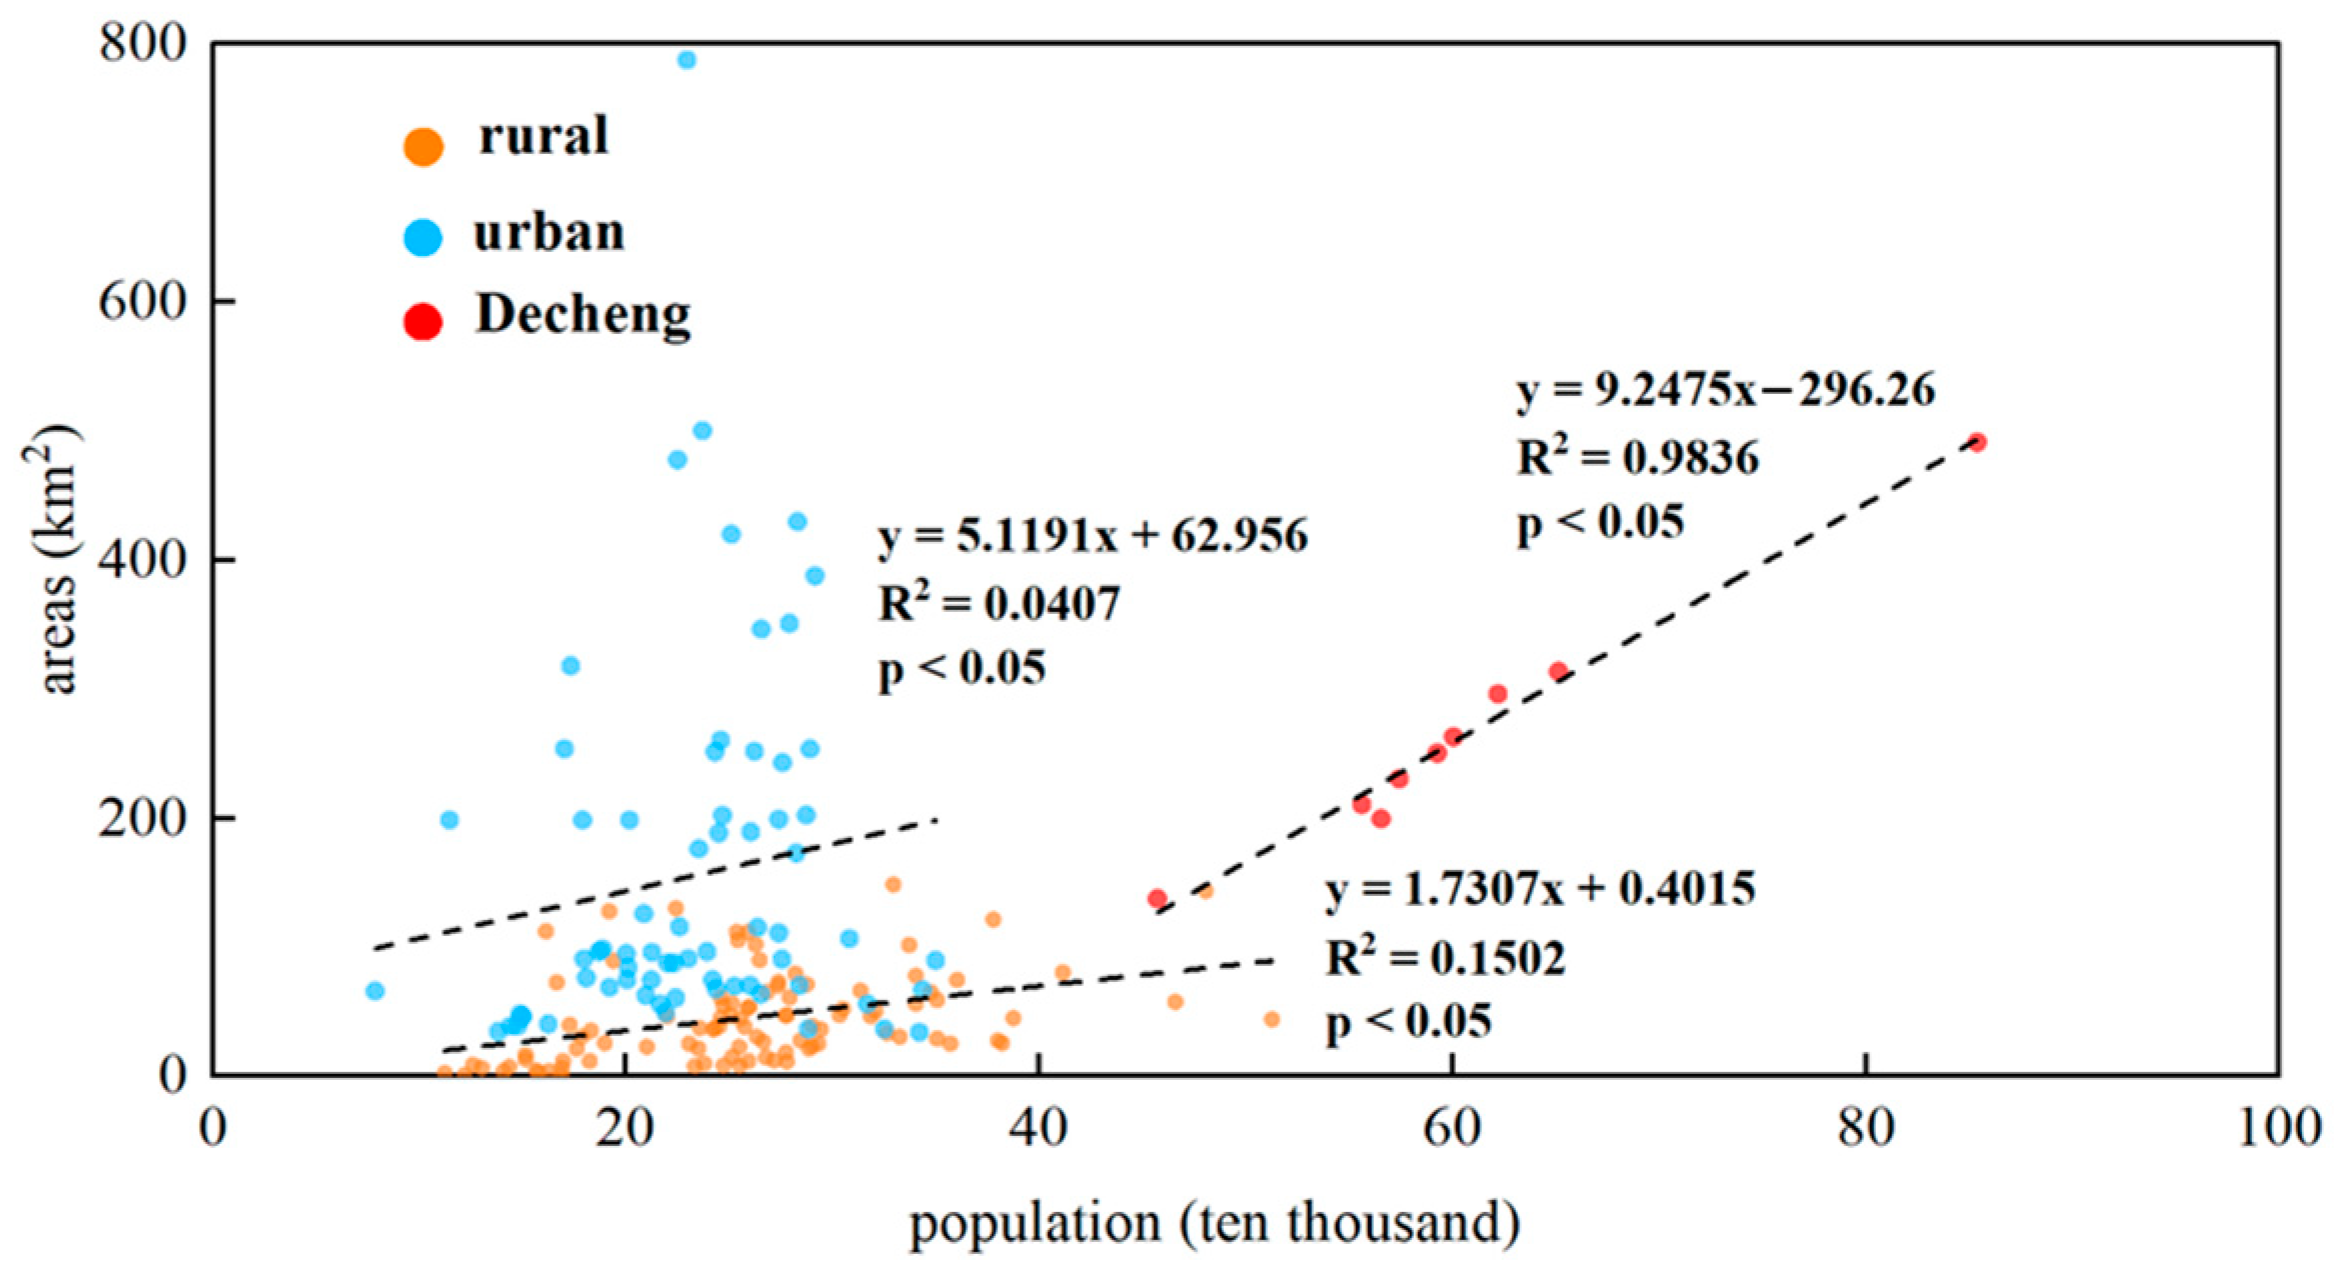
3.3. Urban and Rural Spatial Evolution Has Been Greatly Influenced by Human Activities

Nighttime light is the feedback of human activities. The intensity and scope of nighttime light will be directly affected by human activities. To further investigate the influencing factors of spatial and temporal changes in urban-rural regions, this study combined the area (S) of urban-rural regions with the rural and urban populations. Then, we counted the rural/urban areas and corresponding populations at the county scale and generated scatter plots to check their correlations at the rural/urban levels, respectively (Figure 9). For the rural regions, the rural populations and areas showed a significant positive correlation (p < 0.05). For every increase of ten thousand people in rural regions, the rural regions will also expand 1 km2. However, the rural populations of Dezhou City significantly shrunk by 1.2 × 10⁵ people/a in 2012–2020 (p < 0.05, Figure A2). For urban regions, the urban populations and corresponding areas showed a significant positive correlation (p < 0.05). Additionally, for Decheng District, as the economic center of Dezhou City, its urban populations and area showed a more significant positive correlation (R2 = 0.98, p < 0.05). During 2012–2020, the urban population of Decheng County increased from 4.57 × 10⁵ to 8.54 × 10⁵, an increase of 86.8%. The area of urban regions increased from 138 km2 to 492 km2.
Overall, decreased rural populations led to the reduction of active-rural regions, especially before the year 2015. By contrast, the influx of population into cities is an important reason for the continuous expansion of urban regions. The influx of rural population into urban regions has brought a lot of labor, promoted industrial expansion and required more infrastructure and public services to support more and more people, which has led to increasing urban human activities. Urban structure tends to be more complex and expanding to the edge. Relevant data showed that the number of industrial enterprises in Dezhou increased from 610 in 2000 to 1496 in 2020. However, the rural population of Dezhou has decreased from 4.26 million to 3.98 million, while the urban population has nearly doubled from 1.1 million to 2.02 million with the rapid urbanization development. For rural regions, although the population is declining, the links with the urban regions are increasing. Urban industries are partially transferred to rural regions through spillover effects. Infrastructure conditions in rural regions are also improving. This leads to increased nighttime light intensity in rural regions but at a slower rate than in urban regions.

4. Discussion

4.1. Spatial Explicit Structure of the Urban-Rural Regions

Through the nighttime light data obtained from NPP/VIIRS and localized contour tree method, this study explored the polycentric structures of urban-rural regions in Dezhou City. Also, this study calculated the nighttime light intensity, location and morphological attributes of each urban-rural region. Based on the identified results, we divided the identification results into urban-rural regions. Decheng District is the most predominant overall and is both a commercial center and a public service center. Rural regions are predominant in Dezhou City, scattered across the counties and cities. Rural regions generally show the characteristics of having small areas and single functions [11,46]. Lights emitted at nighttime by some large factories far from urban regions are also identified as rural regions. Various roads are connected in series as intermediaries in various urban-rural regions. The development of transportation conditions is one of the important indicators to measure the urbanization of a region [47]. For relatively backward areas, towns tend to be distributed along roads and gradually connect with other surrounding towns.

4.2. Spatial-Temporal Evolution of Urban-Rural Regions

The spatial ranges of urban-rural regions extracted by nighttime light can well match the real change process of human activities [32,43]. As we can see from Figure 8, rural regions first shrink and then expand while urban regions continue to expand. For China, urbanization makes urban regions need many laborers, while rural regions face the problem of surplus labor [48]. Therefore, most young and middle-aged rural people choose to move to cities to get better job opportunities and increase their income. As a result, human activities in rural regions are largely reduced.
Interestingly, from the perspective of land use, China’s urban-rural regions are showing a trend of expansion [11,49]. The reason for this difference may be because there are differences in the definition of rural regions. In our study, the rural regions are defined as active-rural regions. Nighttime lighting is an intuitive manifestation of human activities [43]. Due to the outflow of rural populations, the intensity of human activities in many rural regions has weakened. However, rural houses will not decrease with the outflow of populations. On the contrary, when people make money in the city, they return to new houses in rural regions. Therefore, the rural changes in this study show different results from land use (i.e., built-up land or impervious surface).
In addition, we also found rural regions showed a trend of agglomeration. The number of rural regions in Dezhou City is decreasing, but the average nighttime light brightness in rural regions is increasing. This shows that the population loss in rural regions far from urban regions or inconvenient transportation is serious, resulting in human activities in the region not being detected. Most young rural workers choose to flow into urban regions to find jobs, while older people and children follow them to cities or live in larger rural regions around cities [11,50].

4.3. Localized Contour Tree Method Used in This Study

This study compared nighttime lighting data with topographic elevation data to explore the hotspots of human activities and divided them into urban-rural regions according to their attributes. The localized contour tree method has multiple advantages in spatial urban and rural form and internal structure detection. Firstly, the localized contour tree method identifies the spatial distribution range of urban-rural regions based on nighttime light data. It can help us understand where human activities are strong and where they are relatively weak. Secondly, the attribute information (area, density, orientation and elongation) of urban and rural areas can be identified by the local contour tree method. At the same time, the scope of urban-rural regions identified without administrative boundaries can better reflect the natural state of human activities. Thirdly, the method can also identify the spatial hierarchy of the initial urban region, which can be used for the multi-center identification of urban areas. It is worth noting that when the local contour tree method is applied to different regions, the parameters selected are different in the extraction range [36,42]. The value must be determined based on local conditions. Since the resolution of nighttime light data is only 500 m, it is not able to identify small rural regions well [51]. It is hoped that finer spatial resolution data will be available in the future to refine this study [52].

4.4. Potential Applications and Limitations

These findings in this study have great potential that can be directly applied to urban and rural planning. For example, regarding the bustling urban core regions with evidently increasing nighttime lights, common infrastructures are suggested to improve in order to meet the needs of the public, such as parking spaces and traffic signs. For urban-rural fringe regions with evidently decreasing nighttime lights, urban planning decision makers are suggested to investigate the development potentials by visiting surveys. Maybe these regions could provide some valuable references for determinations of urban development boundary. For rural regions with evidently increasing nighttime lights, rural planning decision makers are suggested to well define the village classification and development direction. In contrast, the rural regions with evidently decreasing nighttime lights could be the object of village combinations.
This study used nighttime light data to extract ranges in both urban and rural regions. However, the spatial resolution of nighttime light data is just 500 m, which has a limited extraction ability for small rural regions [51]. In future studies, if the temporal and spatial resolution of data can be further improved, it will help refine the research results and further explore the mechanism of urban and rural spatial-temporal pattern evolution [35,52]. Additionally, in this study, nighttime light values were reconstructed in the range of 0–1. Additionally, it is important to note that the localized contour tree method needs to debug parameters to achieve the best extraction effect, which limits its parameter application in other regions.

5. Conclusions

Based on the NPP/VIIRS composite data, a reconstruction method of nighttime light was proposed to enhance the brightness of nighttime light value in rural regions. Subsequently, this study evaluated the application of the localized contour tree method to the identification of urban-rural regions in Dezhou City. Our results showed that the localized contour tree method could effectively identify the spatial scope and internal structure of urban-rural regions. Finally, with the help of urban-rural division method, the identified results were divided into urban-rural regions. Based on the division results, this study concluded that the expansion speed in developed regions was significantly higher than that in less developed regions. The rural regions showed a shrinking tendency. There are certain differences in the factors that affect urban-rural regions. They are mainly related to the populations, but in general, both urban-rural regions are growing, and the average intensity of human activity is increasing. The results showed that urban-rural regions belonged to an area of mutual influence. From the perspective of spatial scale, in the process of rural development, its boundary is constantly approaching the city, and the boundary of urban regions is also expanding. Therefore, in future urban planning, it is not possible to limit the planning scope within the urban space, but the coordination between rural planning and urban planning should be considered to focus on urban-rural fringe spatial planning and other issues.

Author Contributions

Conceptualization, Huimin Zhong and Zhengjia Liu. Methodology, Huimin Zhong and Zhengjia Liu. Software, Huimin Zhong. Writing—original draft preparation, Huimin Zhong and Zhengjia Liu. Writing—review, editing and revision, Huimin Zhong, Yihang Huang and Zhengjia Liu. All authors have read and agreed to the published version of the manuscript.

Funding

This study is funded by the Strategic Priority Research Program of the Chinese Academy of Sciences (Grant No. XDA23070302), National Key Research and Development Program of China (grant no. 2022YFC3802801), and the “Kezhen and Bingwei” Young Scientist Program of IGSNRR (grant no. 2022RC001).

Data Availability Statement

Not applicable.

Conflicts of Interest

The authors declare no conflict of interest.

Appendix A

Figure A1. The area statistics of urban and rural areas in 2020 were obtained by using nighttime light data and local contour tree and urban and rural division method.
Ijgi 12 00362 g0a1
Figure A2. The rural population change in Dezhou City during 2012–2020.
Ijgi 12 00362 g0a2
Figure A3. Satellite remote sensing images of some rural areas in the results of urban-rural structure identification, of which, (ag) town, (hj) factory and (k,l) villages.
Ijgi 12 00362 g0a3

References

  1. Mayer, H.; Habersetzer, A.; Meili, R. Rural-urban linkages and sustainable regional development: The role of entrepreneurs in linking peripheries and centers. Sustainability 2016, 8, 745. [Google Scholar] [CrossRef]
  2. Liu, Y.; Liu, Y.; Chen, Y.; Long, H. The process and driving forces of rural hollowing in China under rapid urbanization. J. Geogr. Sci. 2010, 20, 876–888. [Google Scholar] [CrossRef]
  3. Davoudi, S. European briefing: Polycentricity in european spatial planning: From an analytical tool to a normative agenda. Eur. Plan. Stud. 2003, 11, 979–999. [Google Scholar] [CrossRef]
  4. Meijers, E. Measuring polycentricity and its promises. Eur. Plan. Stud. 2008, 16, 1313–1323. [Google Scholar] [CrossRef]
  5. Cox, D.T.C.; Sánchez de Miguel, A.; Bennie, J.; Dzurjak, S.A.; Gaston, K.J. Majority of artificially lit Earth surface associated with the non-urban population. Sci. Total Environ. 2022, 841, 156782. [Google Scholar] [CrossRef]
  6. Almeida, M.; Loupa-Ramos, I.; Menezes, H.; Carvalho-Ribeiro, S.; Guiomar, N.; Pinto-Correia, T. Urban population looking for rural landscapes: Different appreciation patterns identified in Southern Europe. Land Use Policy 2016, 53, 44–55. [Google Scholar] [CrossRef]
  7. Chen, K.; Long, H.; Liao, L.; Tu, S.; Li, T. Land use transitions and urban-rural integrated development: Theoretical framework and China’s evidence. Land Use Policy 2020, 92, 104465. [Google Scholar] [CrossRef]
  8. Penazzi, S.; Accorsi, R.; Manzini, R. Planning low carbon urban-rural ecosystems: An integrated transport land-use model. J. Clean. Prod. 2019, 235, 96–111. [Google Scholar] [CrossRef]
  9. Peng, J.; Liu, Q.; Blaschke, T.; Zhang, Z.; Liu, Y.; Hu, Y.n.; Wang, M.; Xu, Z.; Wu, J. Integrating land development size, pattern, and density to identify urban–rural fringe in a metropolitan region. Landsc. Ecol. 2020, 35, 2045–2059. [Google Scholar] [CrossRef]
  10. Cui, J.; Luo, J.; Kong, X.; Sun, J.; Gu, J. Characterising the hierarchical structure of urban-rural system at county level using a method based on interconnection analysis. J. Rural Stud. 2022, 93, 263–272. [Google Scholar] [CrossRef]
  11. Liu, Y. Introduction to land use and rural sustainability in China. Land Use Policy 2018, 74, 1–4. [Google Scholar] [CrossRef]
  12. Wang, C.; Liu, Y.; Kong, X.; Li, J. Spatiotemporal decoupling between population and construction land in urban and rural Hubei province. Sustainability 2017, 9, 1258. [Google Scholar] [CrossRef]
  13. Wang, X.; Hong, J.; Fan, P.; Xu, S.; Chai, Z.; Zhuo, Y. Is China’s urban–rural difference in population aging rational? An international comparison with key indicators. Growth Change 2021, 52, 1866–1891. [Google Scholar] [CrossRef]
  14. Silva, S.; Soares, I.; Pinho, C. Electricity residential demand elasticities: Urban versus rural areas in Portugal. Energy 2018, 144, 627–632. [Google Scholar] [CrossRef]
  15. Liu, J.; Nijkamp, P.; Lin, D. Urban-rural imbalance and tourism-led growth in China. Ann. Tourism Res. 2017, 64, 24–36. [Google Scholar] [CrossRef]
  16. Liu, Y.; Long, C. Urban and rural income gap: Does urban spatial form matter in China? SAGE Open. 2021, 11, 21582440211002215. [Google Scholar] [CrossRef]
  17. Ma, W.; Jiang, G.; Li, W.; Zhou, T. How do population decline, urban sprawl and industrial transformation impact land use change in rural residential areas? A comparative regional analysis at the peri-urban interface. J. Clean. Prod. 2018, 205, 76–85. [Google Scholar] [CrossRef]
  18. Wei, W.; Zhang, X.; Liu, C.; Zhou, J.; Xie, B.; Li, C. Spatial interaction of urban-rural system and influence pattern in the arid inland river basin—A case study in Shiyang river basin in Northwest China. Pol. J. Environ. Stud. 2021, 30, 3307–3316. [Google Scholar] [CrossRef]
  19. Su, C.-W.; Liu, T.-Y.; Chang, H.-L.; Jiang, X.-Z. Is urbanization narrowing the urban-rural income gap? A cross-regional study of China. Habitat Int. 2015, 48, 79–86. [Google Scholar] [CrossRef]
  20. Sun, M.; Fan, H. Detecting and analyzing urban centers based on the localized contour tree method using taxi trajectory data: A case study of Shanghai. ISPRS Int. J. Geo-Inf. 2021, 10, 220. [Google Scholar] [CrossRef]
  21. Deng, Y.; Liu, J.; Liu, Y.; Luo, A. Detecting urban polycentric structure from POI data. ISPRS Int. J. Geo-Inf. 2019, 8, 283. [Google Scholar] [CrossRef]
  22. Ladle, A.; Galpern, P.; Doyle-Baker, P. Measuring the use of green space with urban resource selection functions: An application using smartphone GPS locations. Landsc. Urban Plann. 2018, 179, 107–115. [Google Scholar] [CrossRef]
  23. Zhai, Y.; Wu, H.; Fan, H.; Wang, D. Using mobile signaling data to exam urban park service radius in Shanghai: Methods and limitations. Comput. Environ. Urban Syst. 2018, 71, 27–40. [Google Scholar] [CrossRef]
  24. Zou, H.; Yue, Y.; Li, Q.-Q. Urban traffic state explained by road networks and spatial variance: Approach using floating car data. Transportat. Res. Rec. 2014, 2467, 40–48. [Google Scholar] [CrossRef]
  25. Huang, J.; Rozelle, S.; Zhu, X.; Zhao, S.; Sheng, Y. Agricultural and rural development in China during the past four decades: An introduction. Aust. J. Agric. Resour. Econ. 2020, 64, 1–13. [Google Scholar] [CrossRef]
  26. Kaufman, C.N. Where are the values voters? Ideological constraint and stability among rural, suburban, and urban populations in the United States. J. Rural Stud. 2021, 88, 169–180. [Google Scholar] [CrossRef]
  27. Liu, X.; Liu, Z.; Zhong, H.; Jian, Y.; Shi, L. Multi-dimension evaluation of rural development degree and its uncertainties: A comparison analysis based on three different weighting assignment methods. Ecol. Indic. 2021, 130, 108096. [Google Scholar] [CrossRef]
  28. Hara, Y.; Takeuchi, K.; Okubo, S. Urbanization linked with past agricultural landuse patterns in the urban fringe of a deltaic Asian mega-city: A case study in Bangkok. Landsc. Urban Plann. 2005, 73, 16–28. [Google Scholar] [CrossRef]
  29. Gu, F.X.; Liu, W.B. Change detection of coastal landscape pattern using gis: A case study of Tianjin Binhai new area. Adv. Mater. Res. 2012, 418, 2032–2035. [Google Scholar] [CrossRef]
  30. He, C.; Ma, Q.; Li, T.; Yang, Y.; Liu, Z. Spatiotemporal dynamics of electric power consumption in Chinese Mainland from 1995 to 2008 modeled using DMSP/OLS stable nighttime lights data. J. Geogr. Sci. 2012, 22, 125–136. [Google Scholar] [CrossRef]
  31. Li, X.; Li, D. Can night-time light images play a role in evaluating the Syrian Crisis? Int. J. Remote Sens. 2014, 35, 6648–6661. [Google Scholar] [CrossRef]
  32. Ma, T.; Zhou, Y.; Zhou, C.; Haynie, S.; Pei, T.; Xu, T. Night-time light derived estimation of spatio-temporal characteristics of urbanization dynamics using DMSP/OLS satellite data. Remote Sens. Environ. 2015, 158, 453–464. [Google Scholar] [CrossRef]
  33. Zhuo, L.; Ichinose, T.; Zheng, J.; Chen, J.; Shi, P.J.; Li, X. Modelling the population density of China at the pixel level based on DMSP/OLS non-radiance-calibrated night-time light images. Int. J. Remote Sens. 2009, 30, 1003–1018. [Google Scholar] [CrossRef]
  34. Levin, N.; Kyba, C.C.M.; Zhang, Q.; Sánchez de Miguel, A.; Román, M.O.; Li, X.; Portnov, B.A.; Molthan, A.L.; Jechow, A.; Miller, S.D.; et al. Remote sensing of night lights: A review and an outlook for the future. Remote Sens. Environ. 2020, 237, 111443. [Google Scholar] [CrossRef]
  35. Chen, Z.; Yu, S.; You, X.; Yang, C.; Wang, C.; Lin, J.; Wu, W.; Yu, B. New nighttime light landscape metrics for analyzing urban-rural differentiation in economic development at township: A case study of Fujian province, China. Appl. Geog. 2023, 150, 102841. [Google Scholar] [CrossRef]
  36. Wu, Q.; Liu, H.; Wang, S.; Yu, B.; Beck, R.; Hinkel, K. A localized contour tree method for deriving geometric and topological properties of complex surface depressions based on high-resolution topographical data. Int. J. Geogr. Inf. Sci. 2015, 29, 2041–2060. [Google Scholar] [CrossRef]
  37. Elvidge, C.D.; Baugh, K.E.; Kihn, E.A.; Kroehl, H.W.; Davis, E.R. Mapping city lights with nighttime data from the dmsp operational linescan system. Photogramm. Eng. Remote Sens. 1997, 63, 727–734. [Google Scholar]
  38. Zhang, B.; Li, J.; Wang, M.; Duan, P.; Li, C. Using DMSP/OLS and NPP/VIIRS images to analyze the expansion of 21 urban agglomerations in mainland China. J. Urban. Plan. Dev. 2021, 147, 04021024. [Google Scholar] [CrossRef]
  39. Justice, C.O.; Román, M.O.; Csiszar, I.; Vermote, E.F.; Wolfe, R.E.; Hook, S.J.; Friedl, M.; Wang, Z.; Schaaf, C.B.; Miura, T.; et al. Land and cryosphere products from Suomi NPP VIIRS: Overview and status. J. Geophys. Res. 2013, 118, 9753–9765. [Google Scholar] [CrossRef]
  40. Shi, K.; Huang, C.; Yu, B.; Yin, B.; Huang, Y.; Wu, J. Evaluation of NPP-VIIRS night-time light composite data for extracting built-up urban areas. Remote. Sens. Lett. 2014, 5, 358–366. [Google Scholar] [CrossRef]
  41. Elvidge, C.D.; Baugh, K.; Zhizhin, M.; Hsu, F.C.; Ghosh, T. VIIRS night-time lights. Int. J. Remote Sens. 2017, 38, 5860–5879. [Google Scholar] [CrossRef]
  42. Chen, Z.; Yu, B.; Song, W.; Liu, H.; Wu, Q.; Shi, K.; Wu, J. A New Approach for Detecting Urban Centers and Their Spatial Structure With Nighttime Light Remote Sensing. IEEE Tran. Geosci. Remote 2017, 55, 6305–6319. [Google Scholar] [CrossRef]
  43. Li, D.; Zhao, X.; Li, X. Remote sensing of human beings-a perspective from nighttime light. Geo-spat. Inf. Sci. 2016, 19, 69–79. [Google Scholar] [CrossRef]
  44. Chen, J.; Liu, J.; Qi, J.; Gao, M.; Cheng, S.; Li, K.; Xu, C. City- and county-level spatio-temporal energy consumption and efficiency datasets for China from 1997 to 2017. Sci. Data. 2022, 9, 101. [Google Scholar] [CrossRef]
  45. Zheng, J.; Feng, G.; Ren, Z.; Qi, N.; Coffman, D.M.; Zhou, Y.; Wang, S. China’s energy consumption and economic activity at the regional level. Energy 2022, 259, 124948. [Google Scholar] [CrossRef]
  46. Qu, Y.; Jiang, G.-h.; Li, Z.; Tian, Y.; Wei, S. Understanding rural land use transition and regional consolidation implications in China. Land Use Policy 2019, 82, 742–753. [Google Scholar] [CrossRef]
  47. Lu, H.; Zhao, P.; Hu, H.; Zeng, L.; Wu, K.S.; Lv, D. Transport infrastructure and urban-rural income disparity: A municipal-level analysis in China. J. Transp. Geog. 2022, 99, 103292. [Google Scholar] [CrossRef]
  48. Gao, J.; Song, G.; Sun, X. Does labor migration affect rural land transfer? Evidence from China. Land Use Policy 2020, 99, 105096. [Google Scholar] [CrossRef]
  49. Ning, J.; Liu, J.; Kuang, W.; Xu, X.; Zhang, S.; Yan, C.; Li, R.; Wu, S.; Hu, Y.; Du, G.; et al. Spatiotemporal patterns and characteristics of land-use change in China during 2010–2015. J. Geogr. Sci. 2018, 28, 547–562. [Google Scholar] [CrossRef]
  50. Zhang, H.; Zhang, S.; Liu, Z. Evolution and influencing factors of China’s rural population distribution patterns since 1990. PLoS ONE 2020, 15, e0233637. [Google Scholar] [CrossRef]
  51. Gibson, J.; Olivia, S.; Boe-Gibson, G.; Li, C. Which night lights data should we use in economics, and where? J. Dev. Econ. 2021, 149, 102602. [Google Scholar] [CrossRef]
  52. Guo, H.; Dou, C.; Chen, H.; Liu, J.; Fu, B.; Li, X.; Zou, Z.; Liang, D. SDGSAT-1: The world’s first scientific satellite for sustainable development goals. Sci. Bull. 2023, 68, 34–38. [Google Scholar] [CrossRef]
Figure 1. Location, digital elevation model (DEM) and land use map in 2020 of the study area.
Ijgi 12 00362 g001
Figure 2. A schematic diagram for nighttime light data before (a,A) and after (b,B) conditional function model reconstruction.
Ijgi 12 00362 g002
Figure 3. Urban and rural region detection using localization contour tree method, referring to the earlier studies [36,42]. (a) Nighttime light intensity contour map; (b) Regular contour tree; and (c) Simplified contour tree.
Ijgi 12 00362 g003
Figure 4. Flowchart of the methodology adopted in this study.
Ijgi 12 00362 g004
Figure 5. Nighttime light contour map of 2020. (a) Dezhou City, (b) Decheng and Lincheng County of Dezhou City and (c) Pingyuan County of Dezhou City.
Ijgi 12 00362 g005
Figure 6. (a) Spatial distribution maps of urban-rural regions in 2020. (b) Histogram of urban region and population in each county. (c) Histogram of rural region and population in each county.
Ijgi 12 00362 g006
Figure 7. Spatial and temporal evolution characteristics of urban-rural regions during 2012–2020.
Ijgi 12 00362 g007
Figure 8. Annual values of area (red line) and nighttime lights (blue line) of urban-rural regions.
Ijgi 12 00362 g008
Figure 9. Scatter plots of the urban (blue dots), rural (orange dots) and Decheng (red dots) populations and corresponding areas.
Ijgi 12 00362 g009
Table 1. Definitions of statistics of nighttime light value and morphometric characteristics.
AttributeDefinition
Minimum Intensity (MIN) MIN = m i n i = 1 N x i : N is the number of pixels in an urban/rural region and x i is the nighttime light intensity value of the ith pixel.
Maximum Intensity (MAX) MAX = m a x i = 1 N x i
Total Nighttime Light Intensity (TNTL) TNTL = i = 1 n x i
Area (S) S = N × CS : CS is the grid cell size. S is the area of an urban/rural region.
Average Intensity (AI) AI = TNTL / S
Standard Deviation of Intensity (STD) STD = 1 N i = 1 N x i x ¯ 2 : x ¯ indicates the average nighttime light value in a contour object.
Compactness index (CI) CI = 4 π S / P 2 : P is the perimeter of an urban/rural region.
Disclaimer/Publisher’s Note: The statements, opinions and data contained in all publications are solely those of the individual author(s) and contributor(s) and not of MDPI and/or the editor(s). MDPI and/or the editor(s) disclaim responsibility for any injury to people or property resulting from any ideas, methods, instructions or products referred to in the content.

