

Urban Architectural Style Recognition and Dataset Construction Method under Deep Learning of street View Images: A Case Study of Wuhan

Abstract
1. Introduction
2. Related Works
2.1. Street View Image-Based Urban Data
2.2. Deep Learning Technology in the Field of Architectural Study
3. Materials and Methods
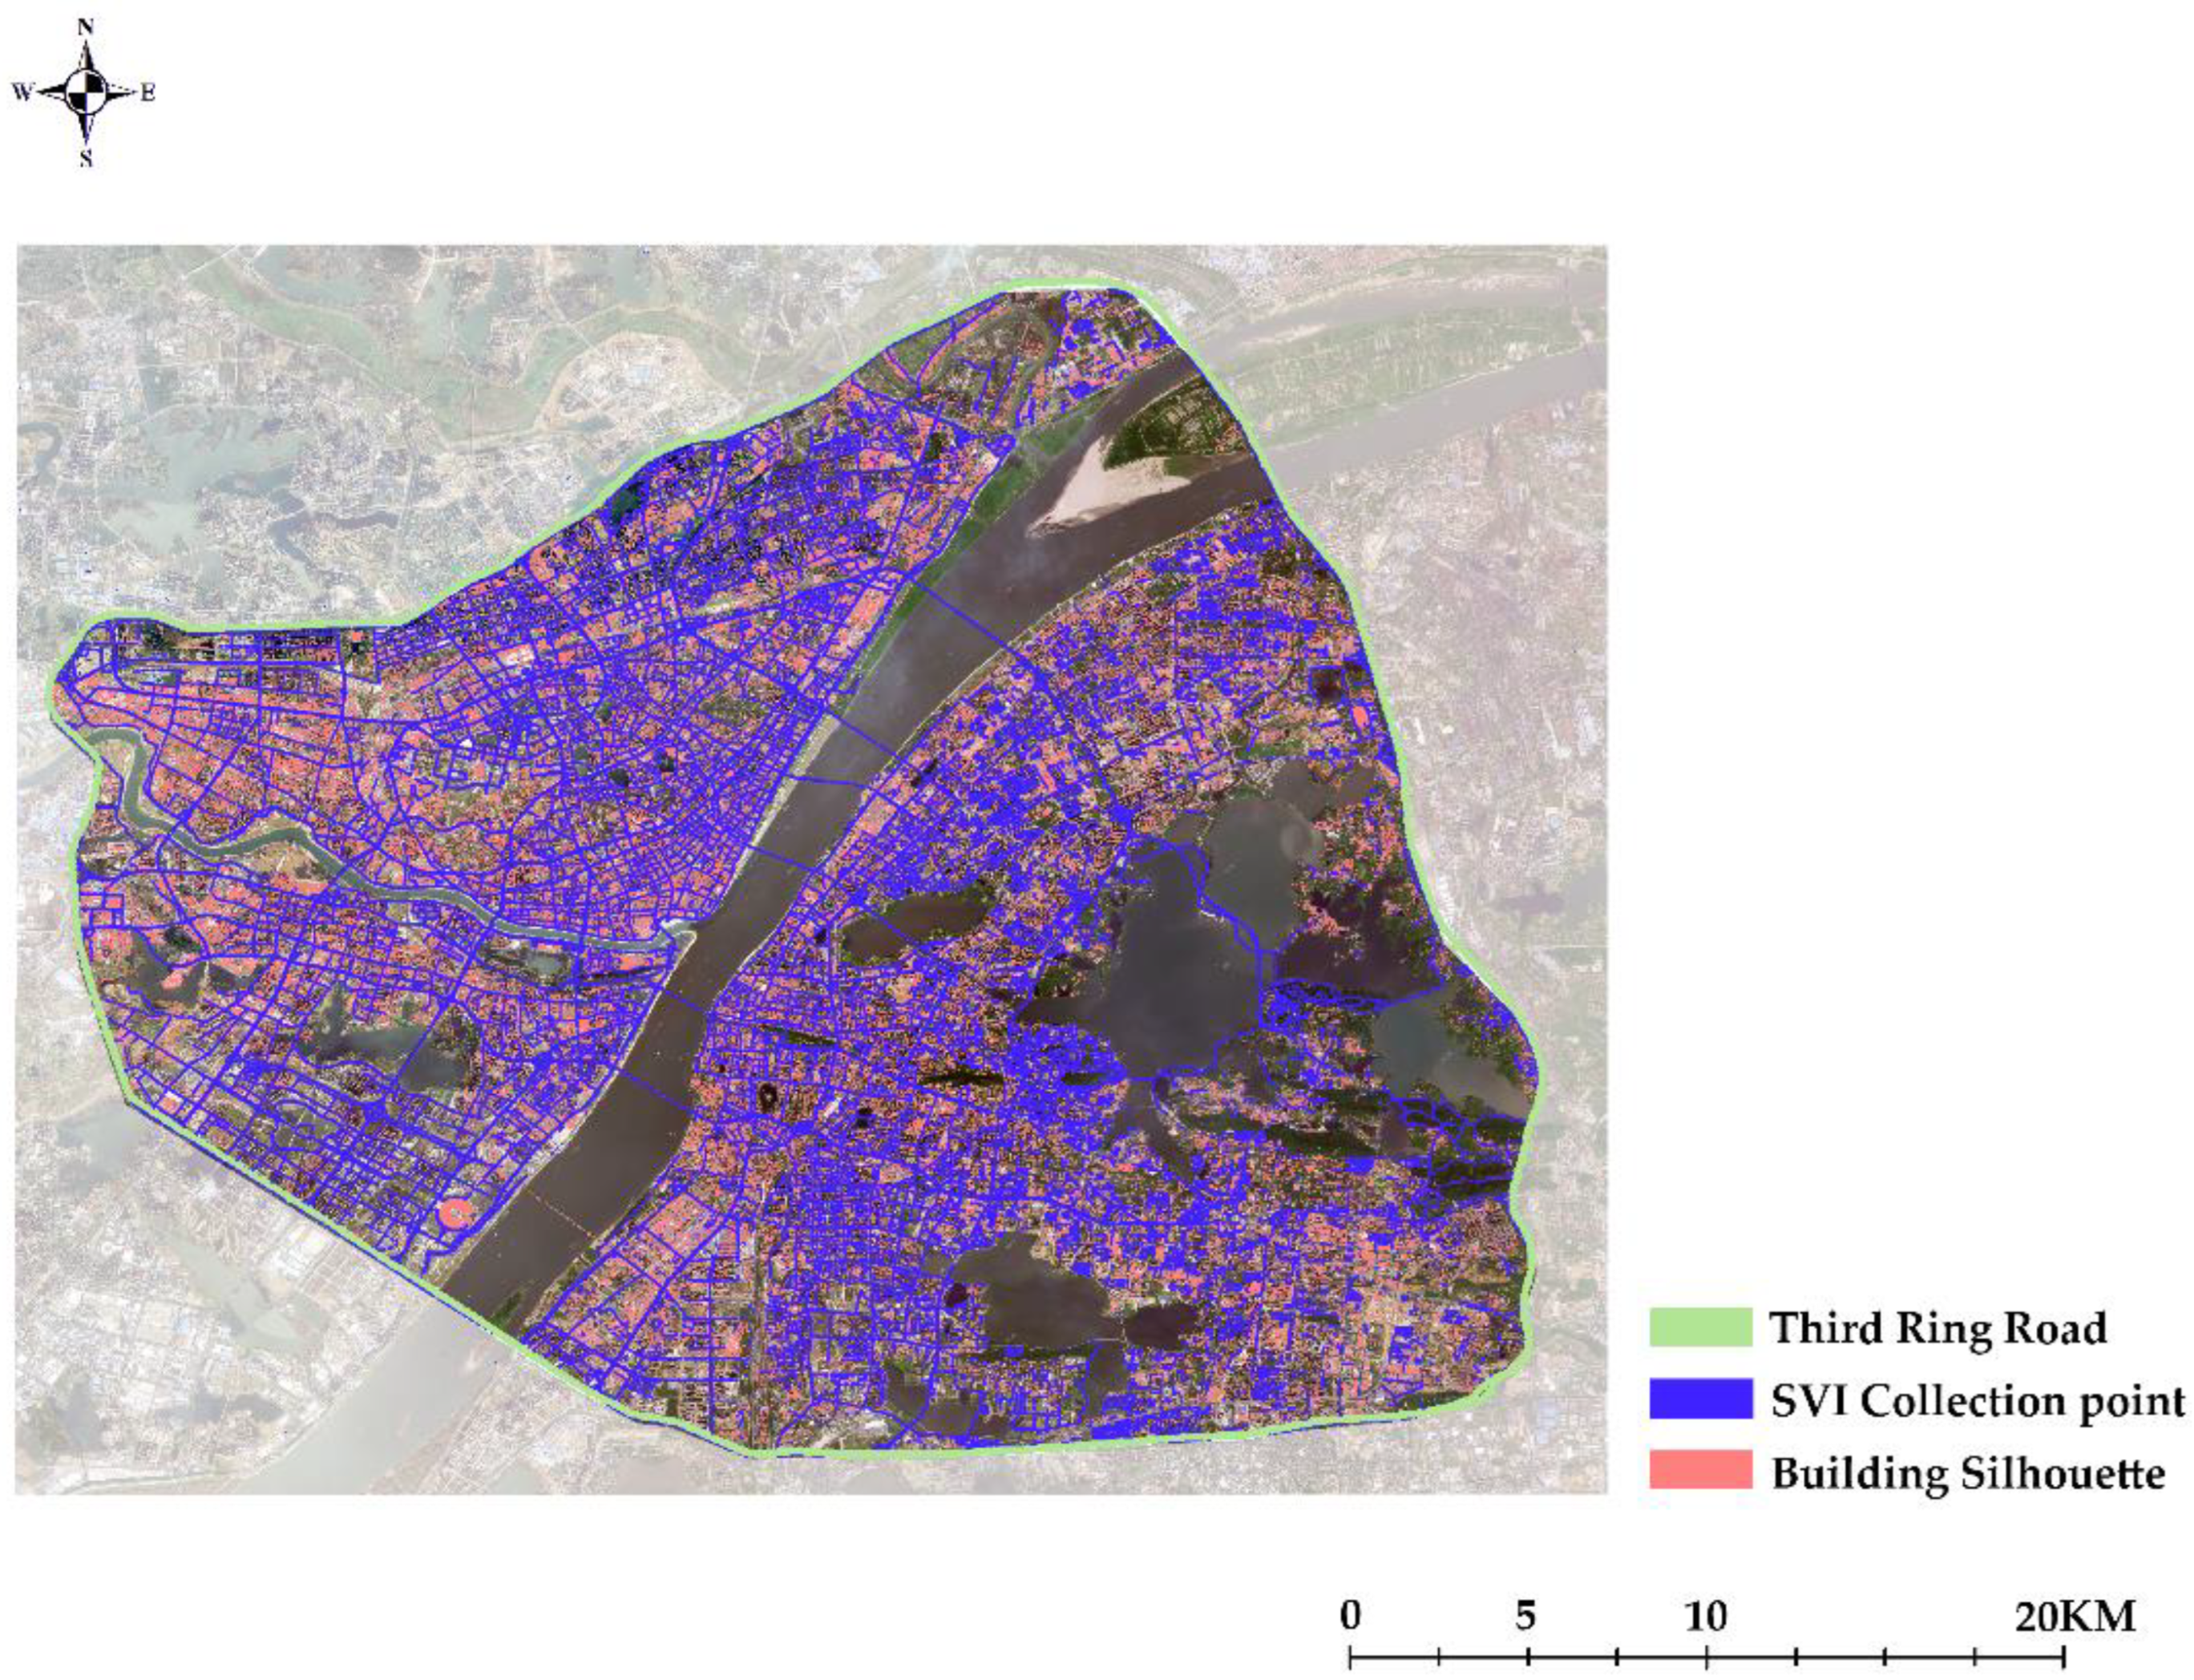
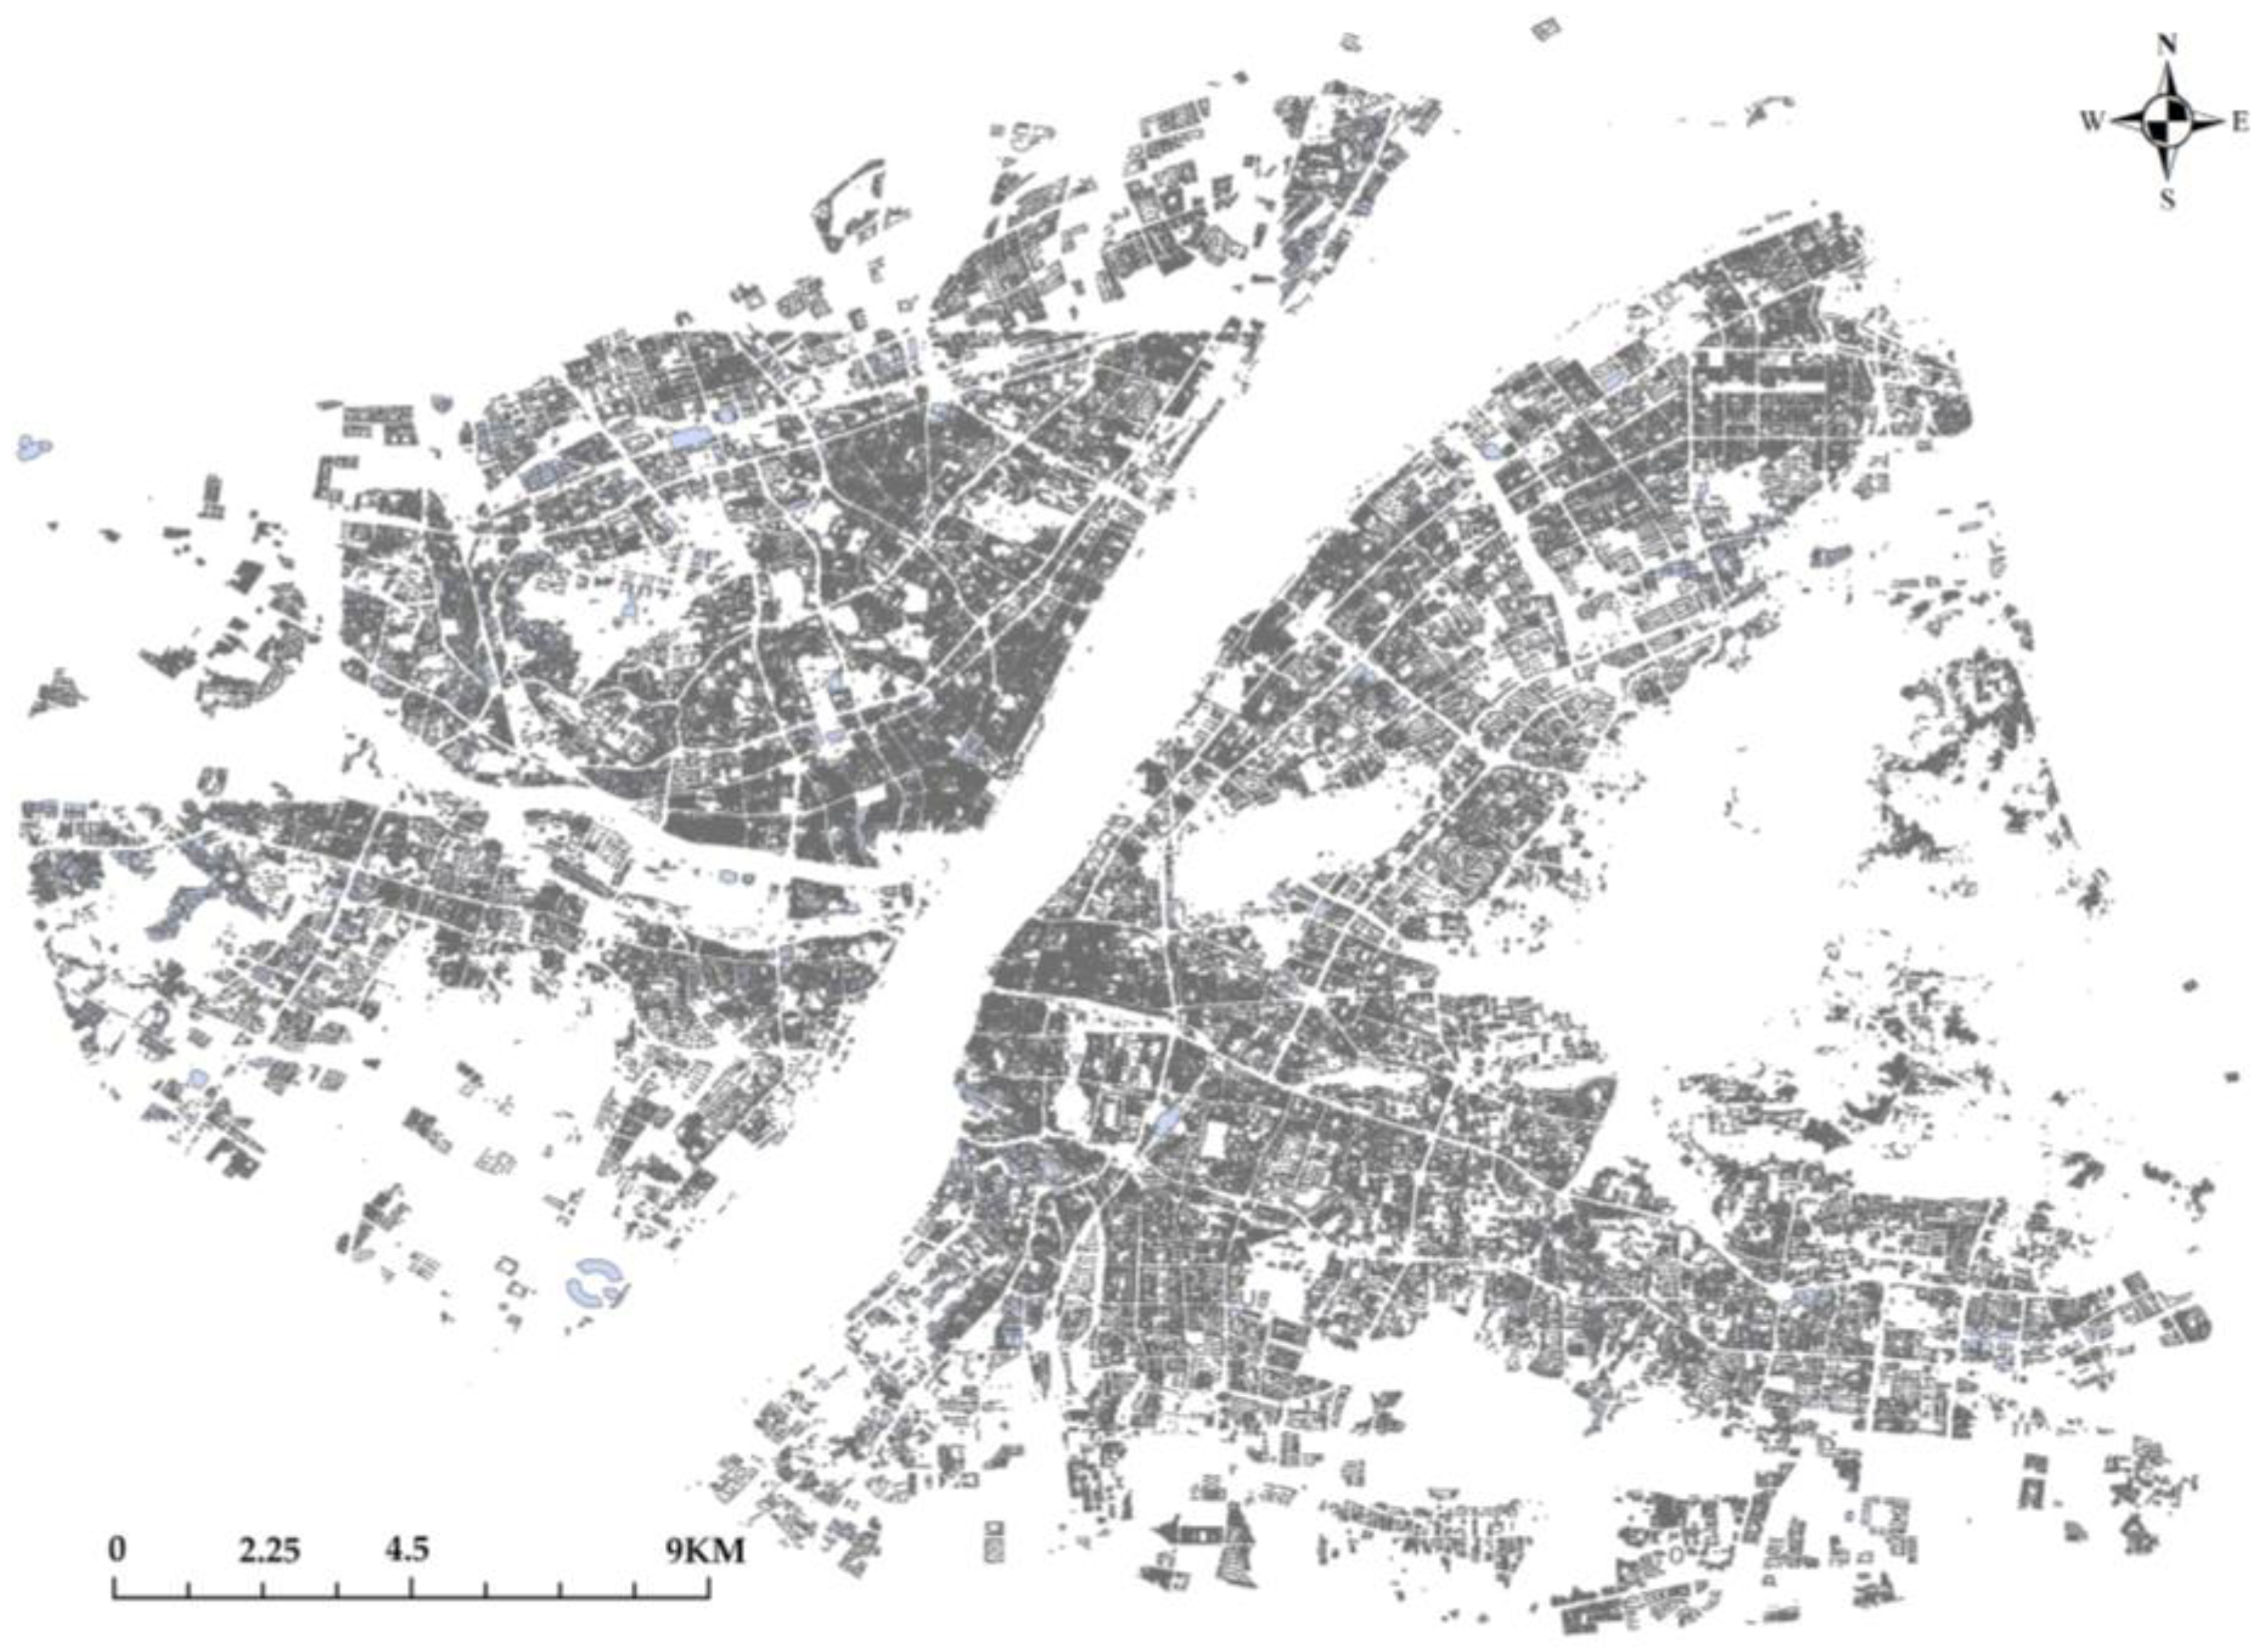
3.1. Study Area
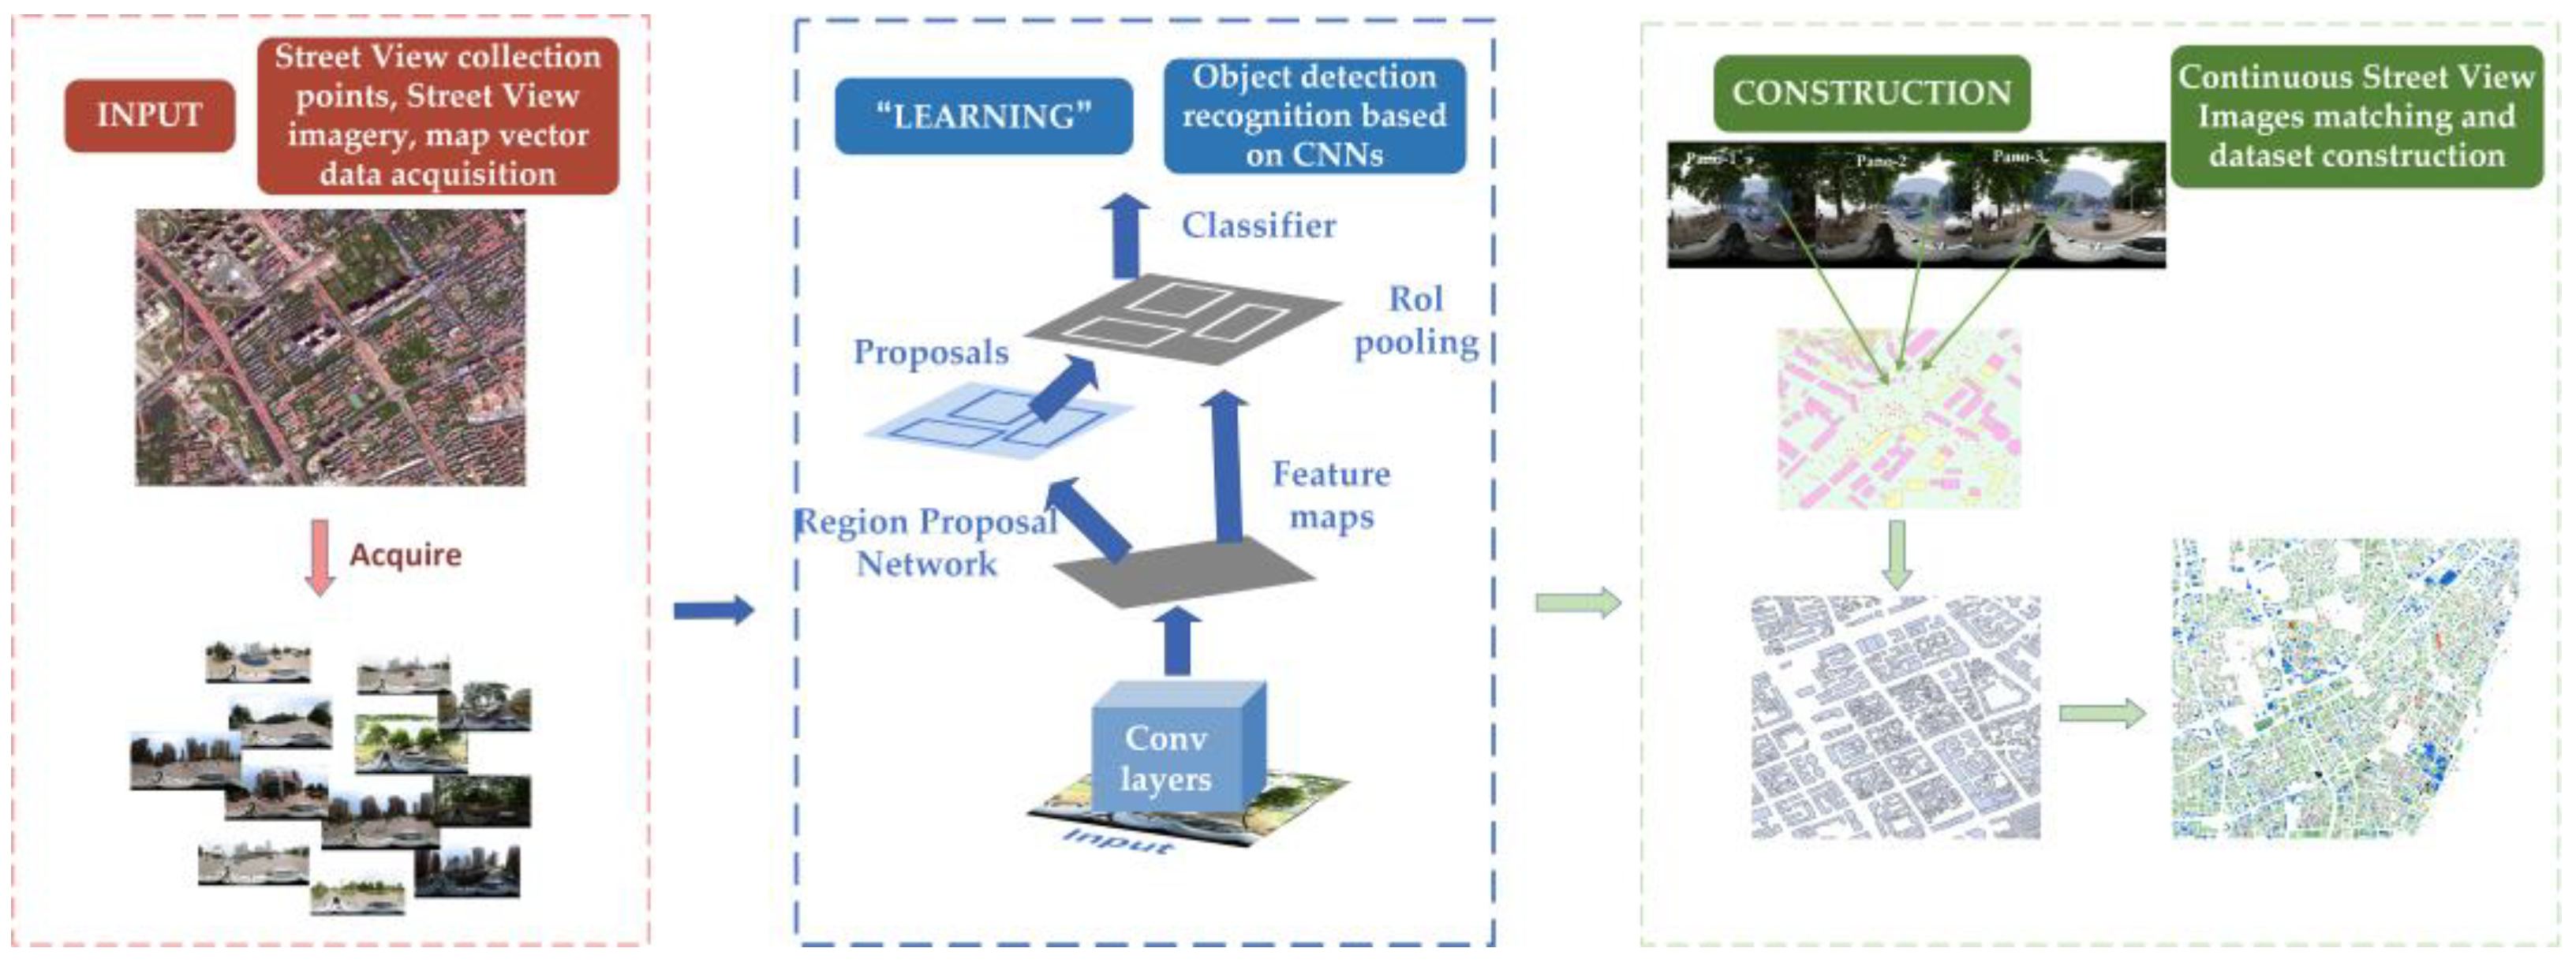
3.2. Methodology
3.2.1. Architectural Style Classification Based on Building Components and Characteristics
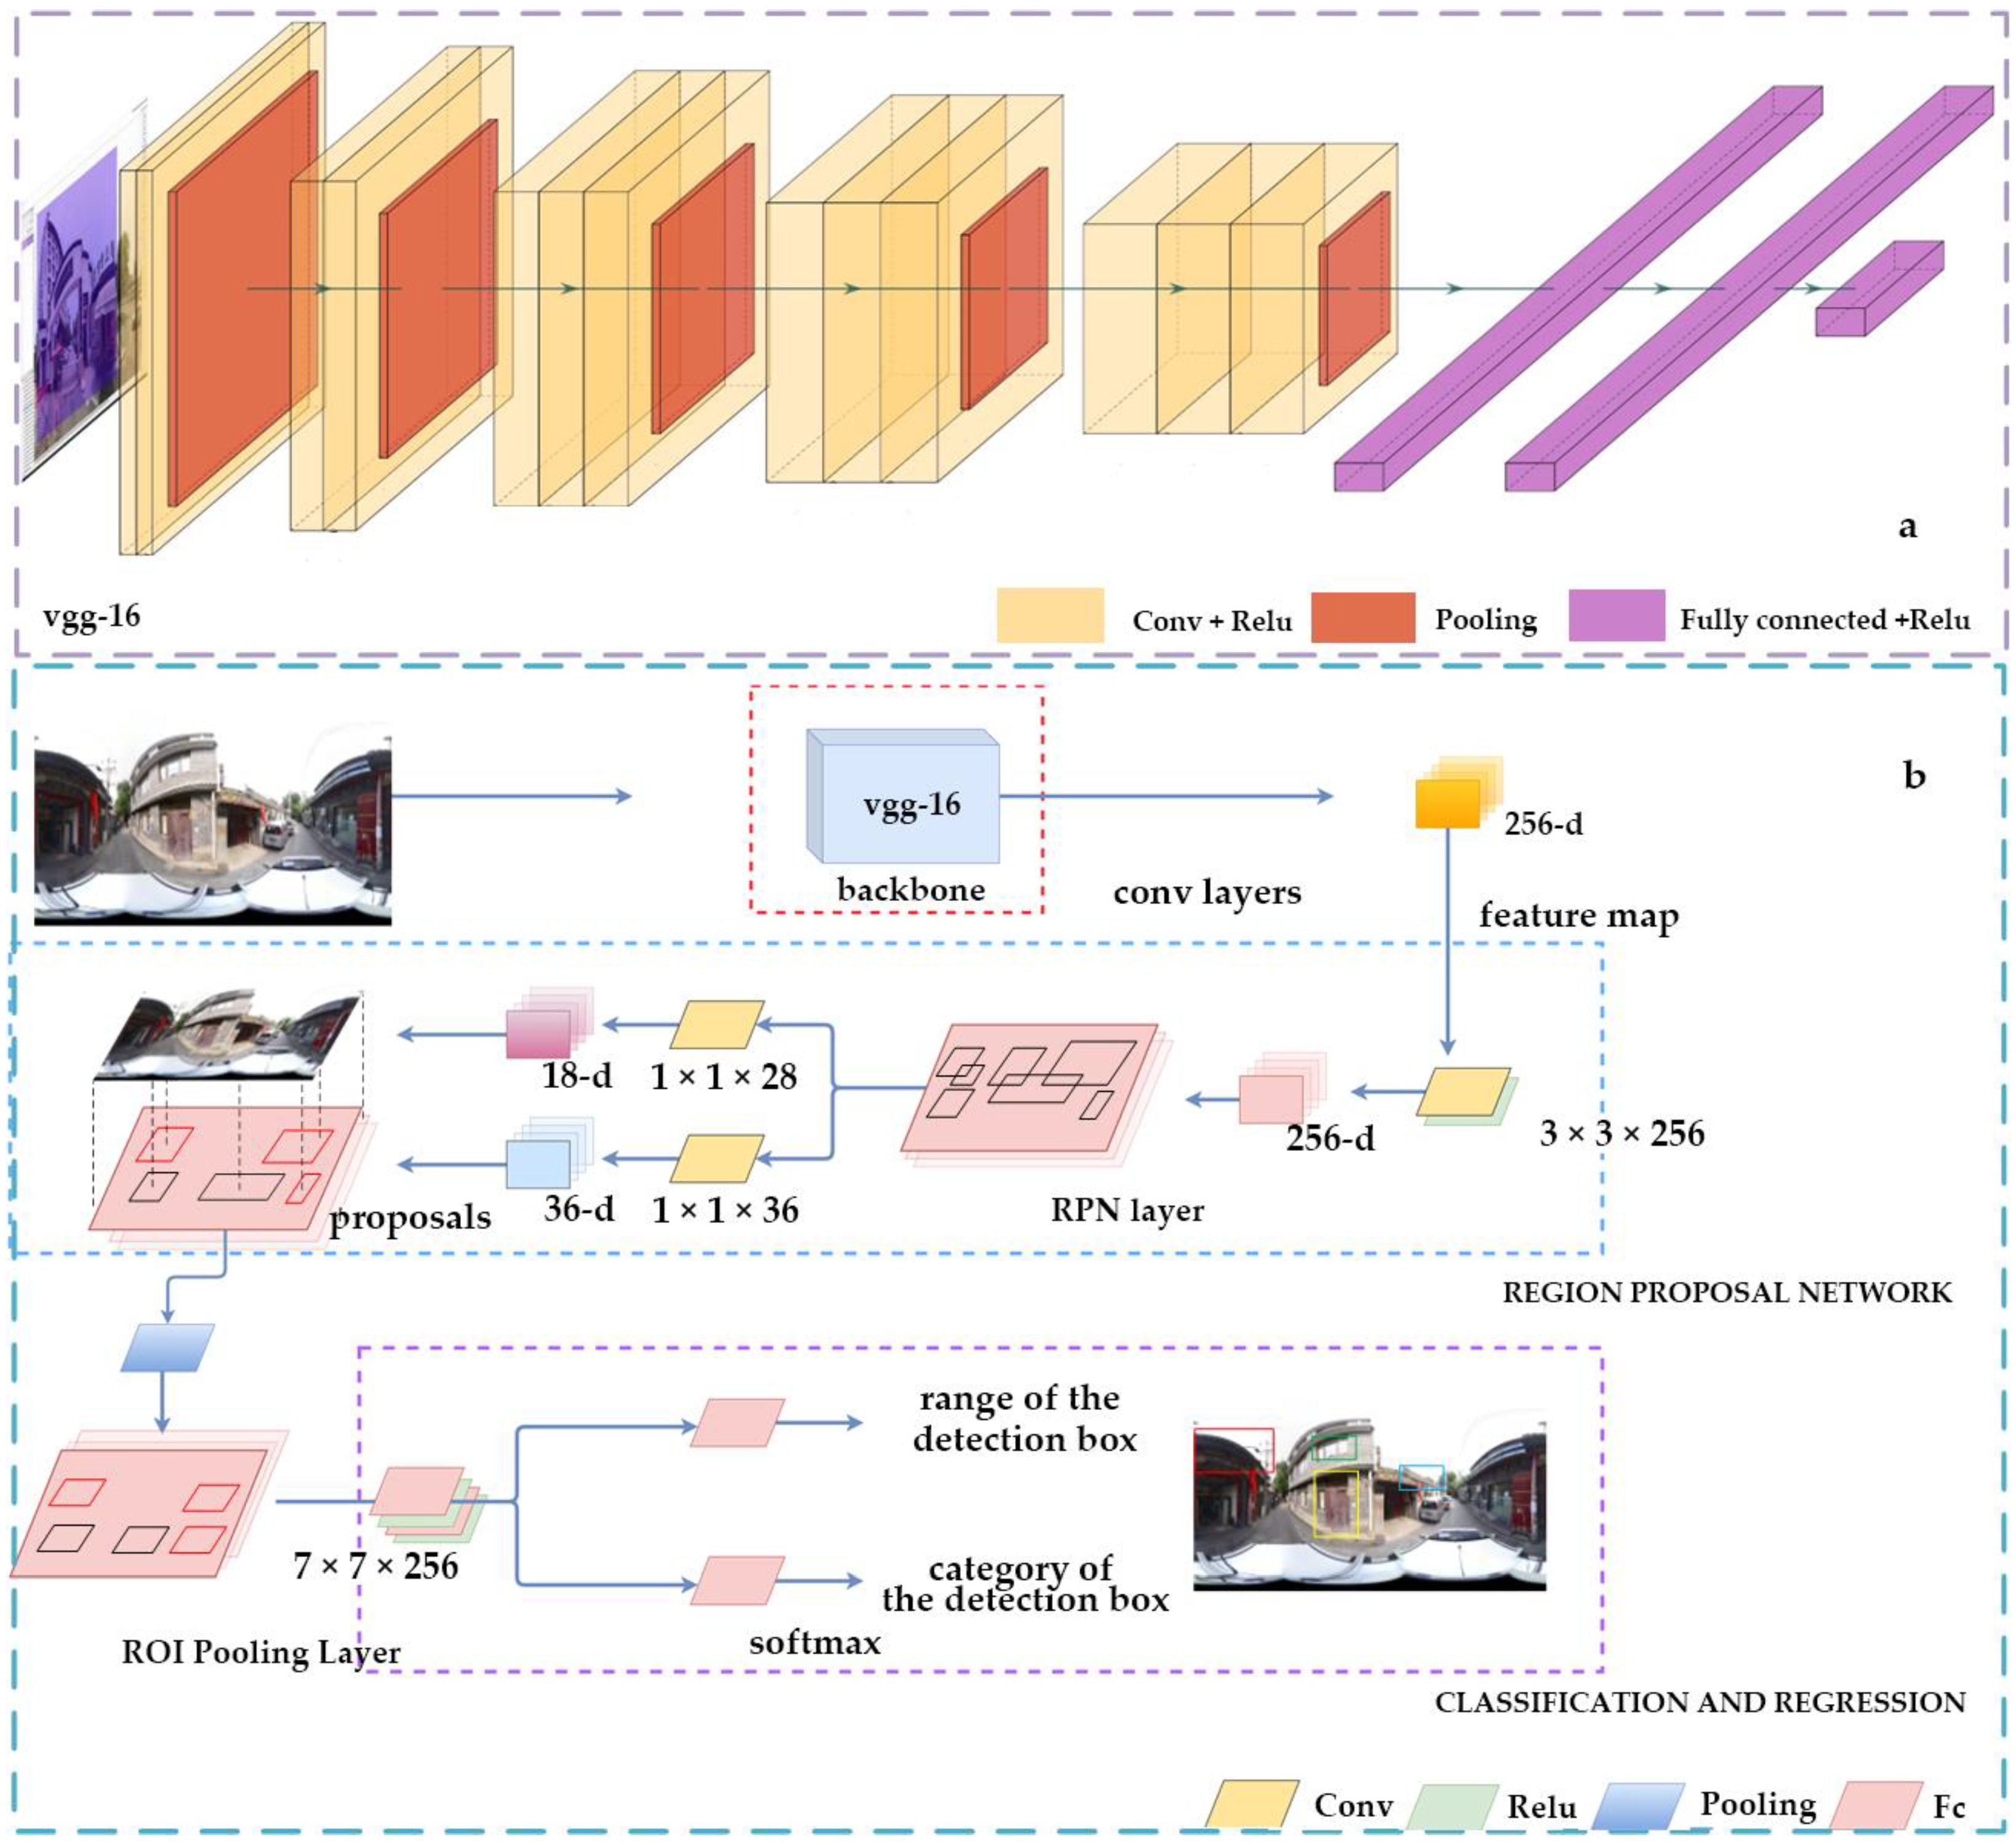
3.2.2. Deep Learning Network for Street View Architectural Style
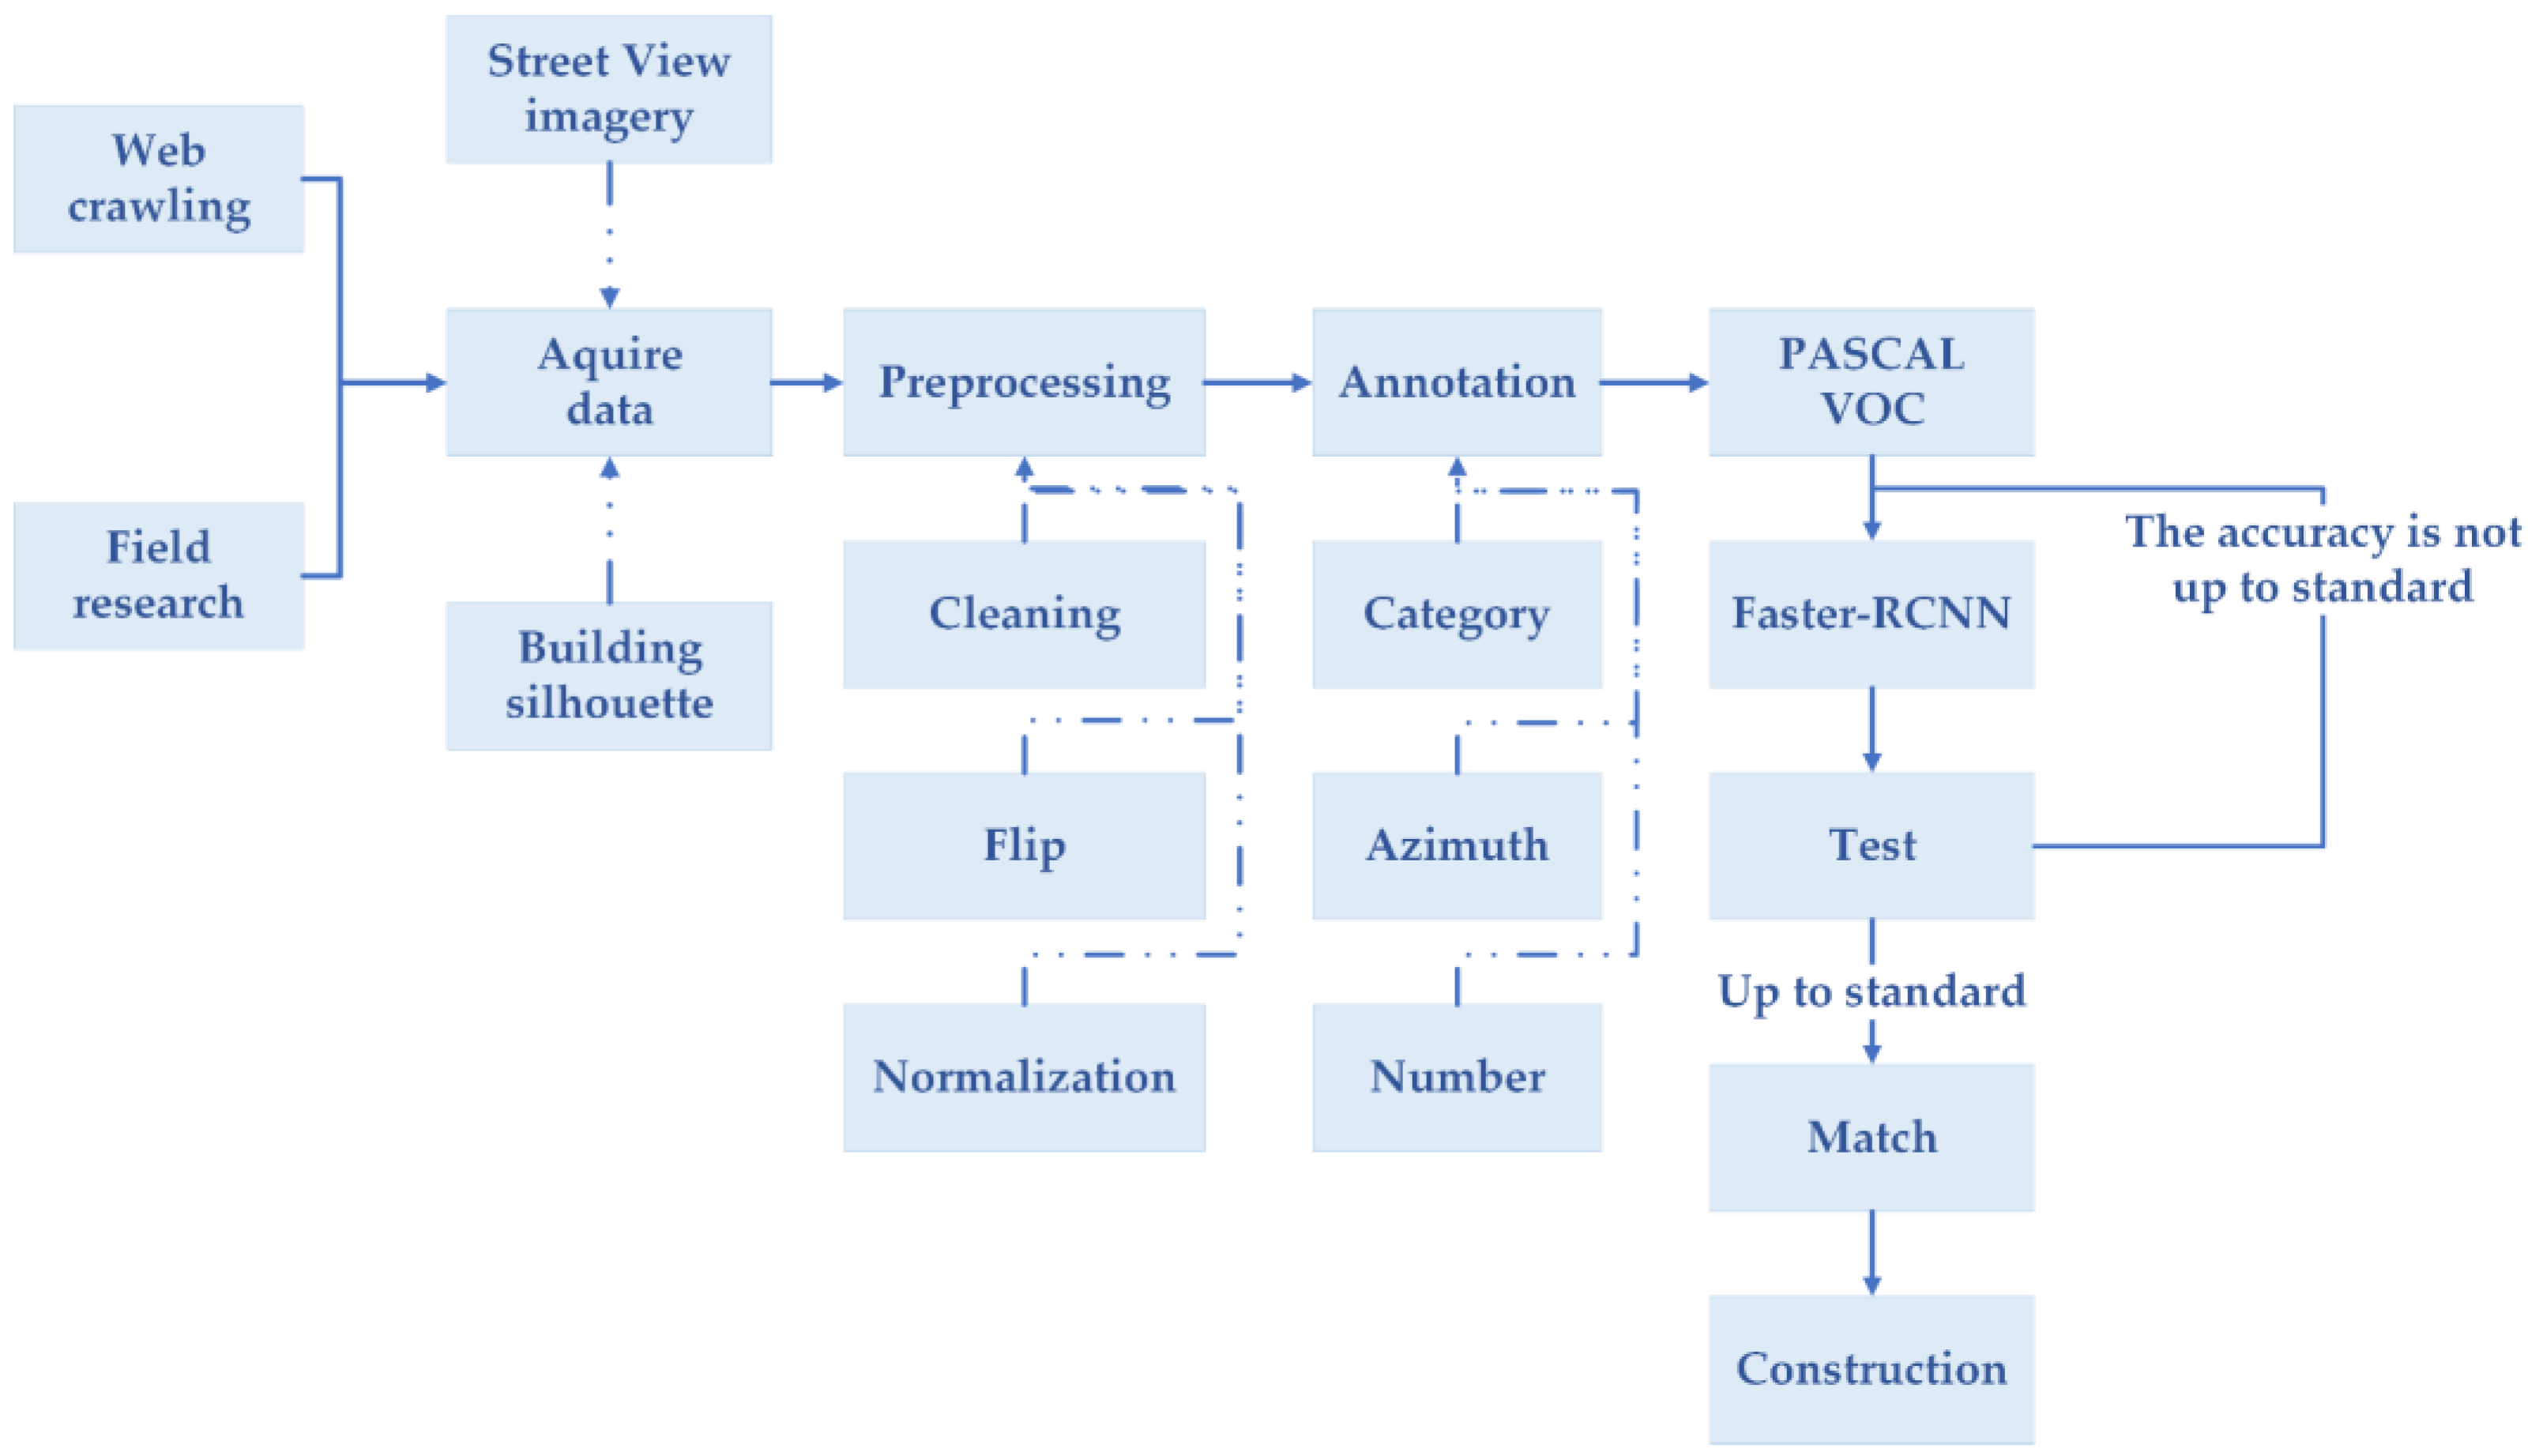
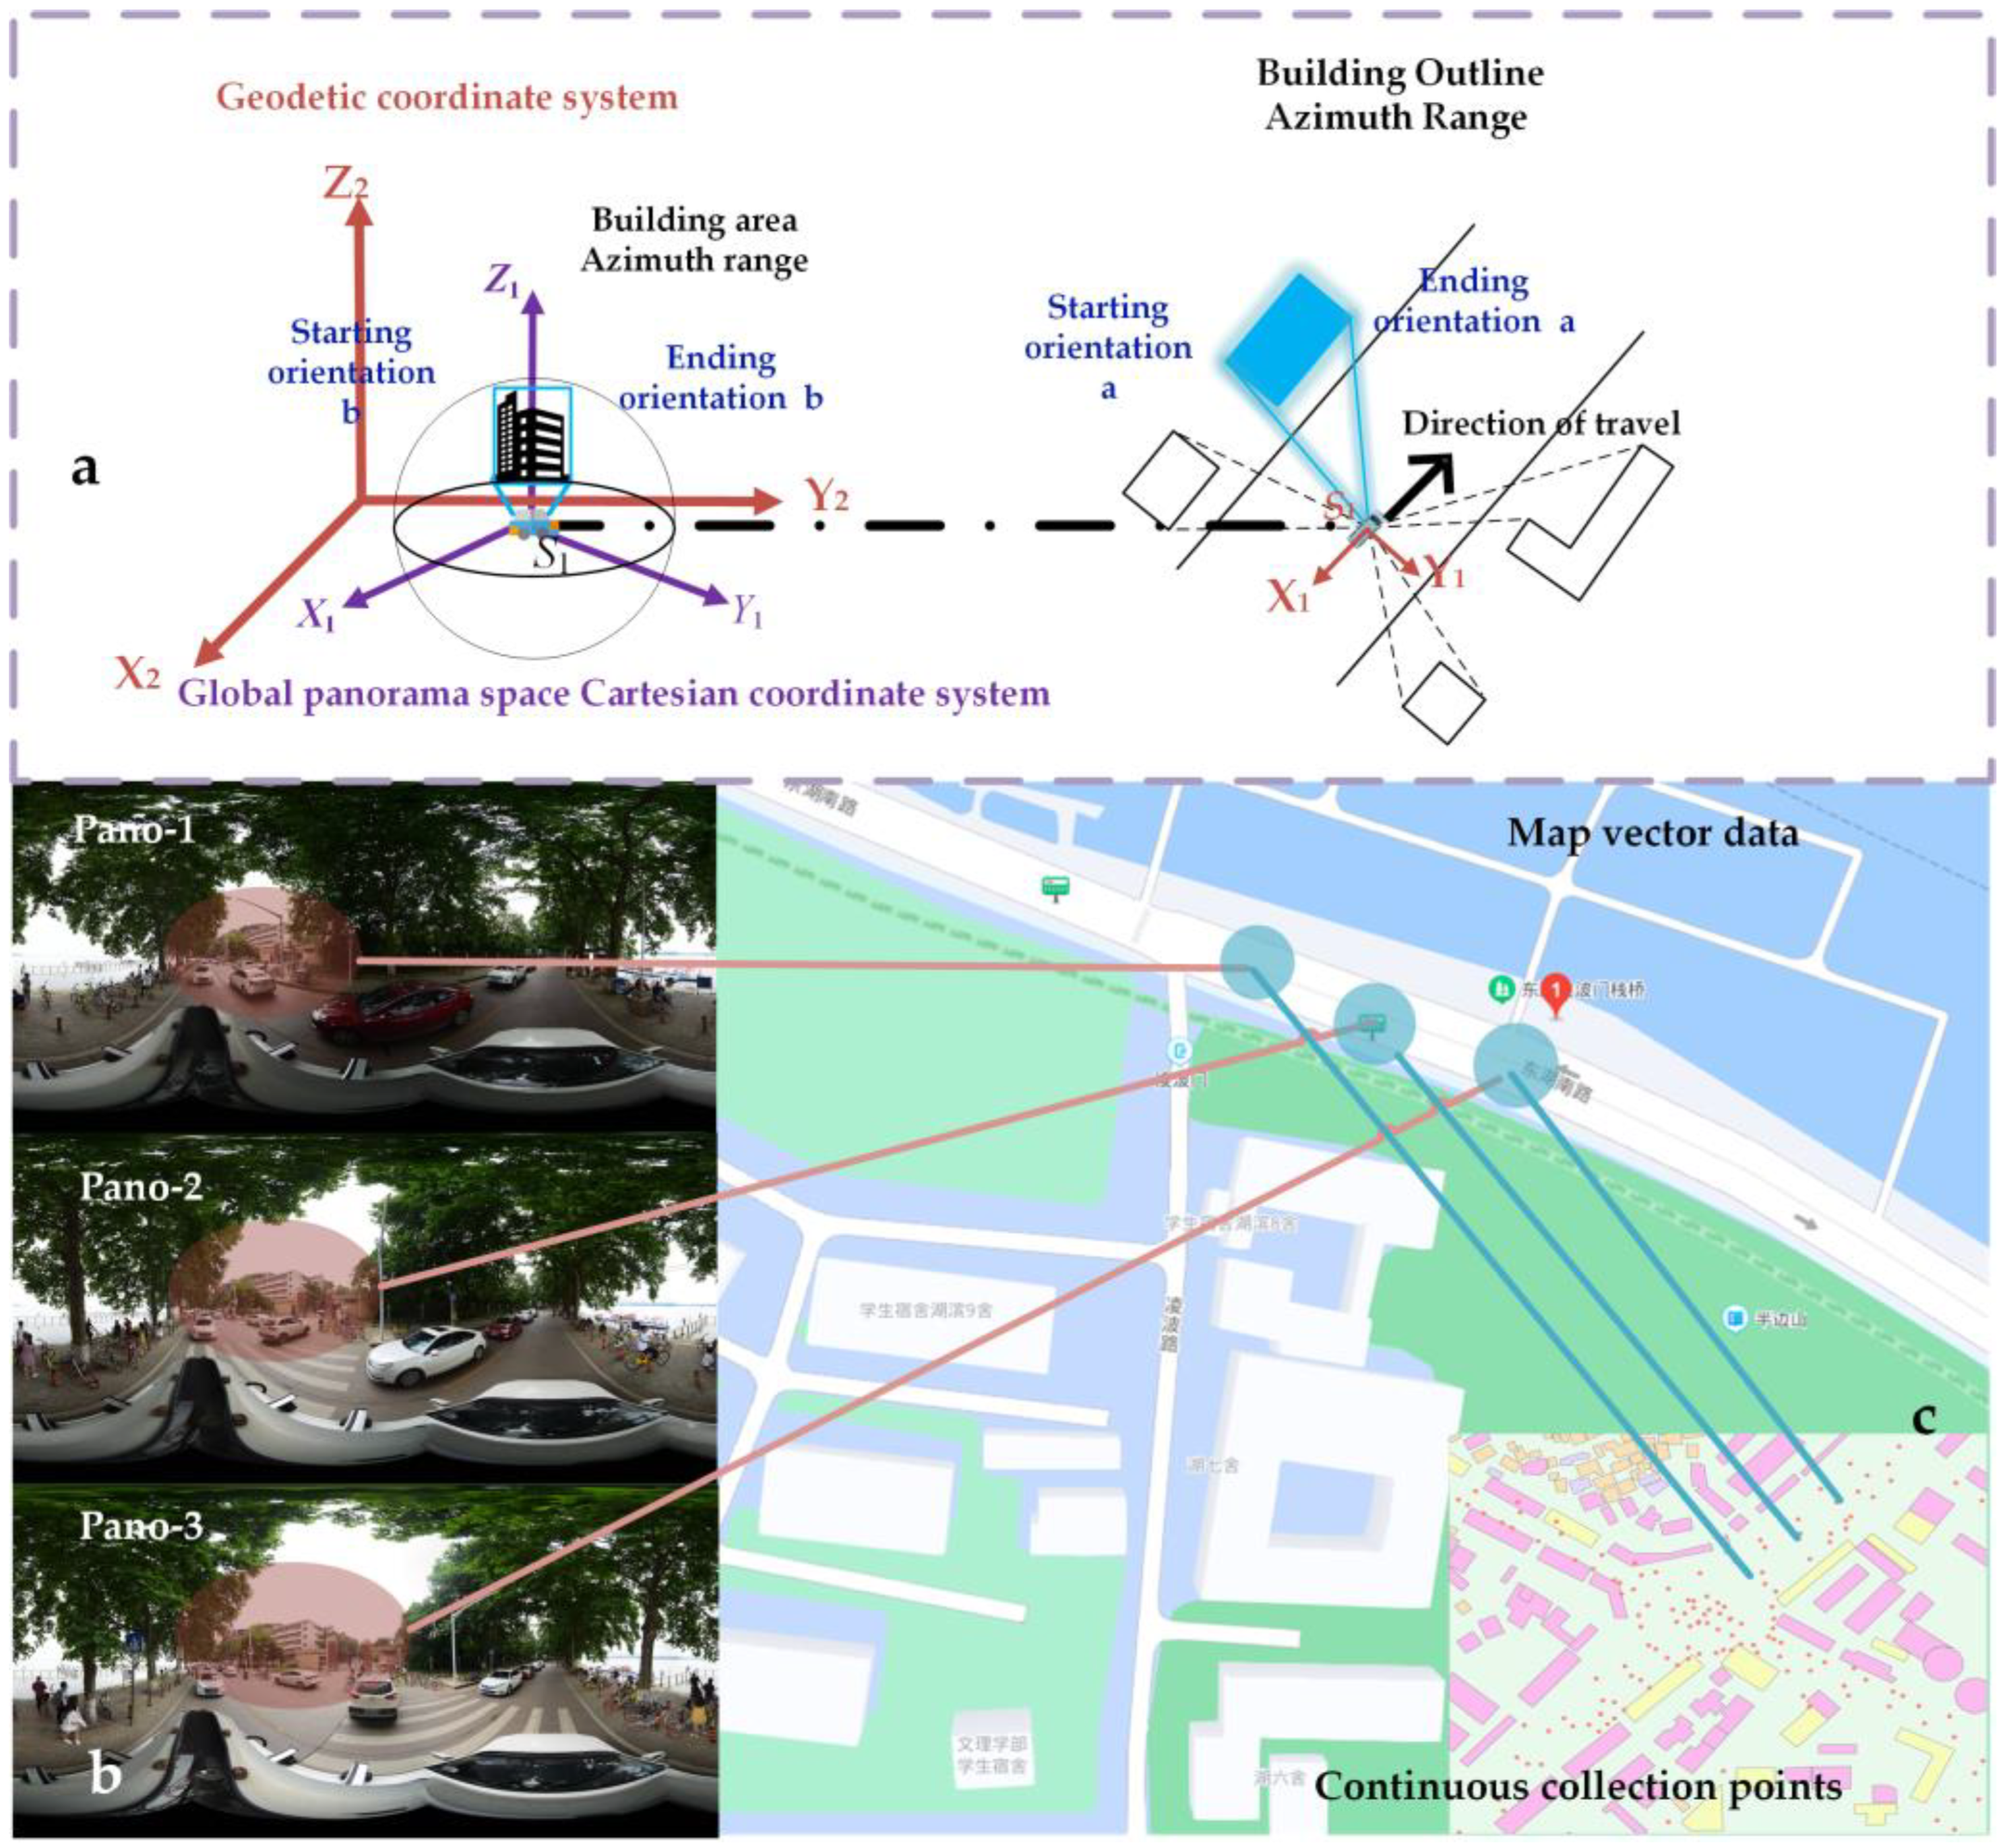
3.2.3. Street View Architectural Style Dataset Construction
4. Results
4.1. Street View Image Annotation
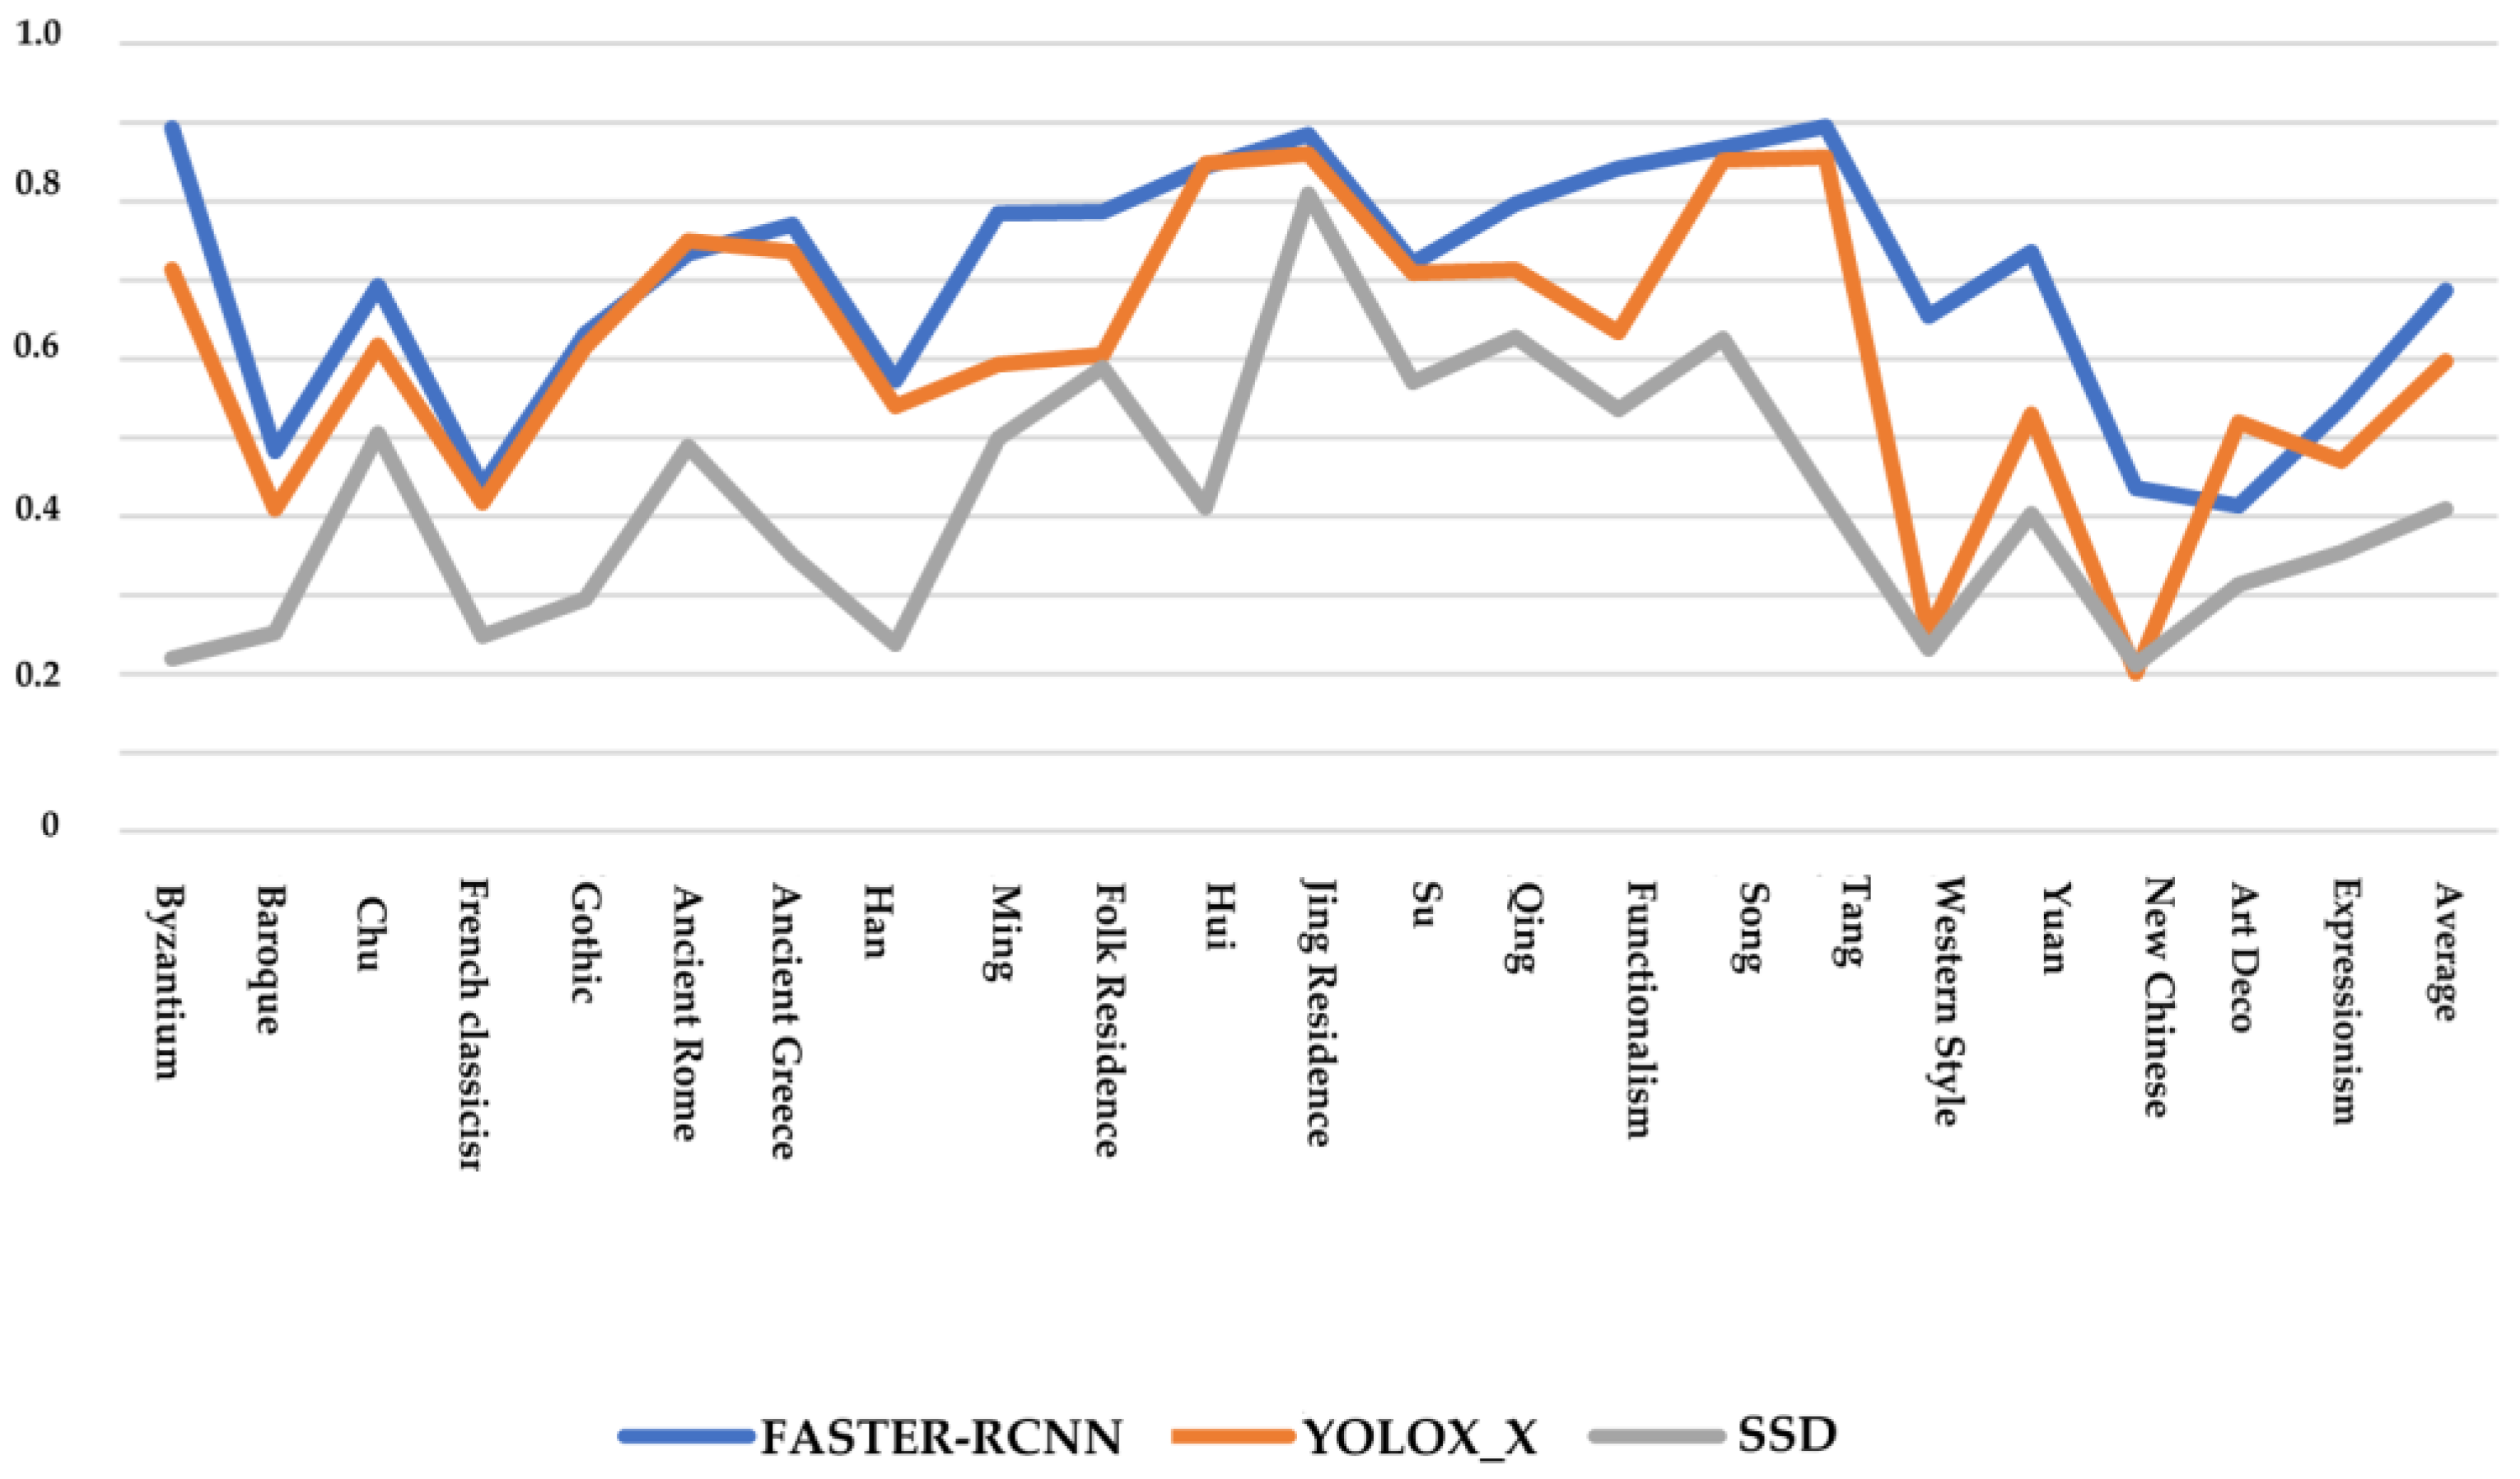
4.2. Model Comparison
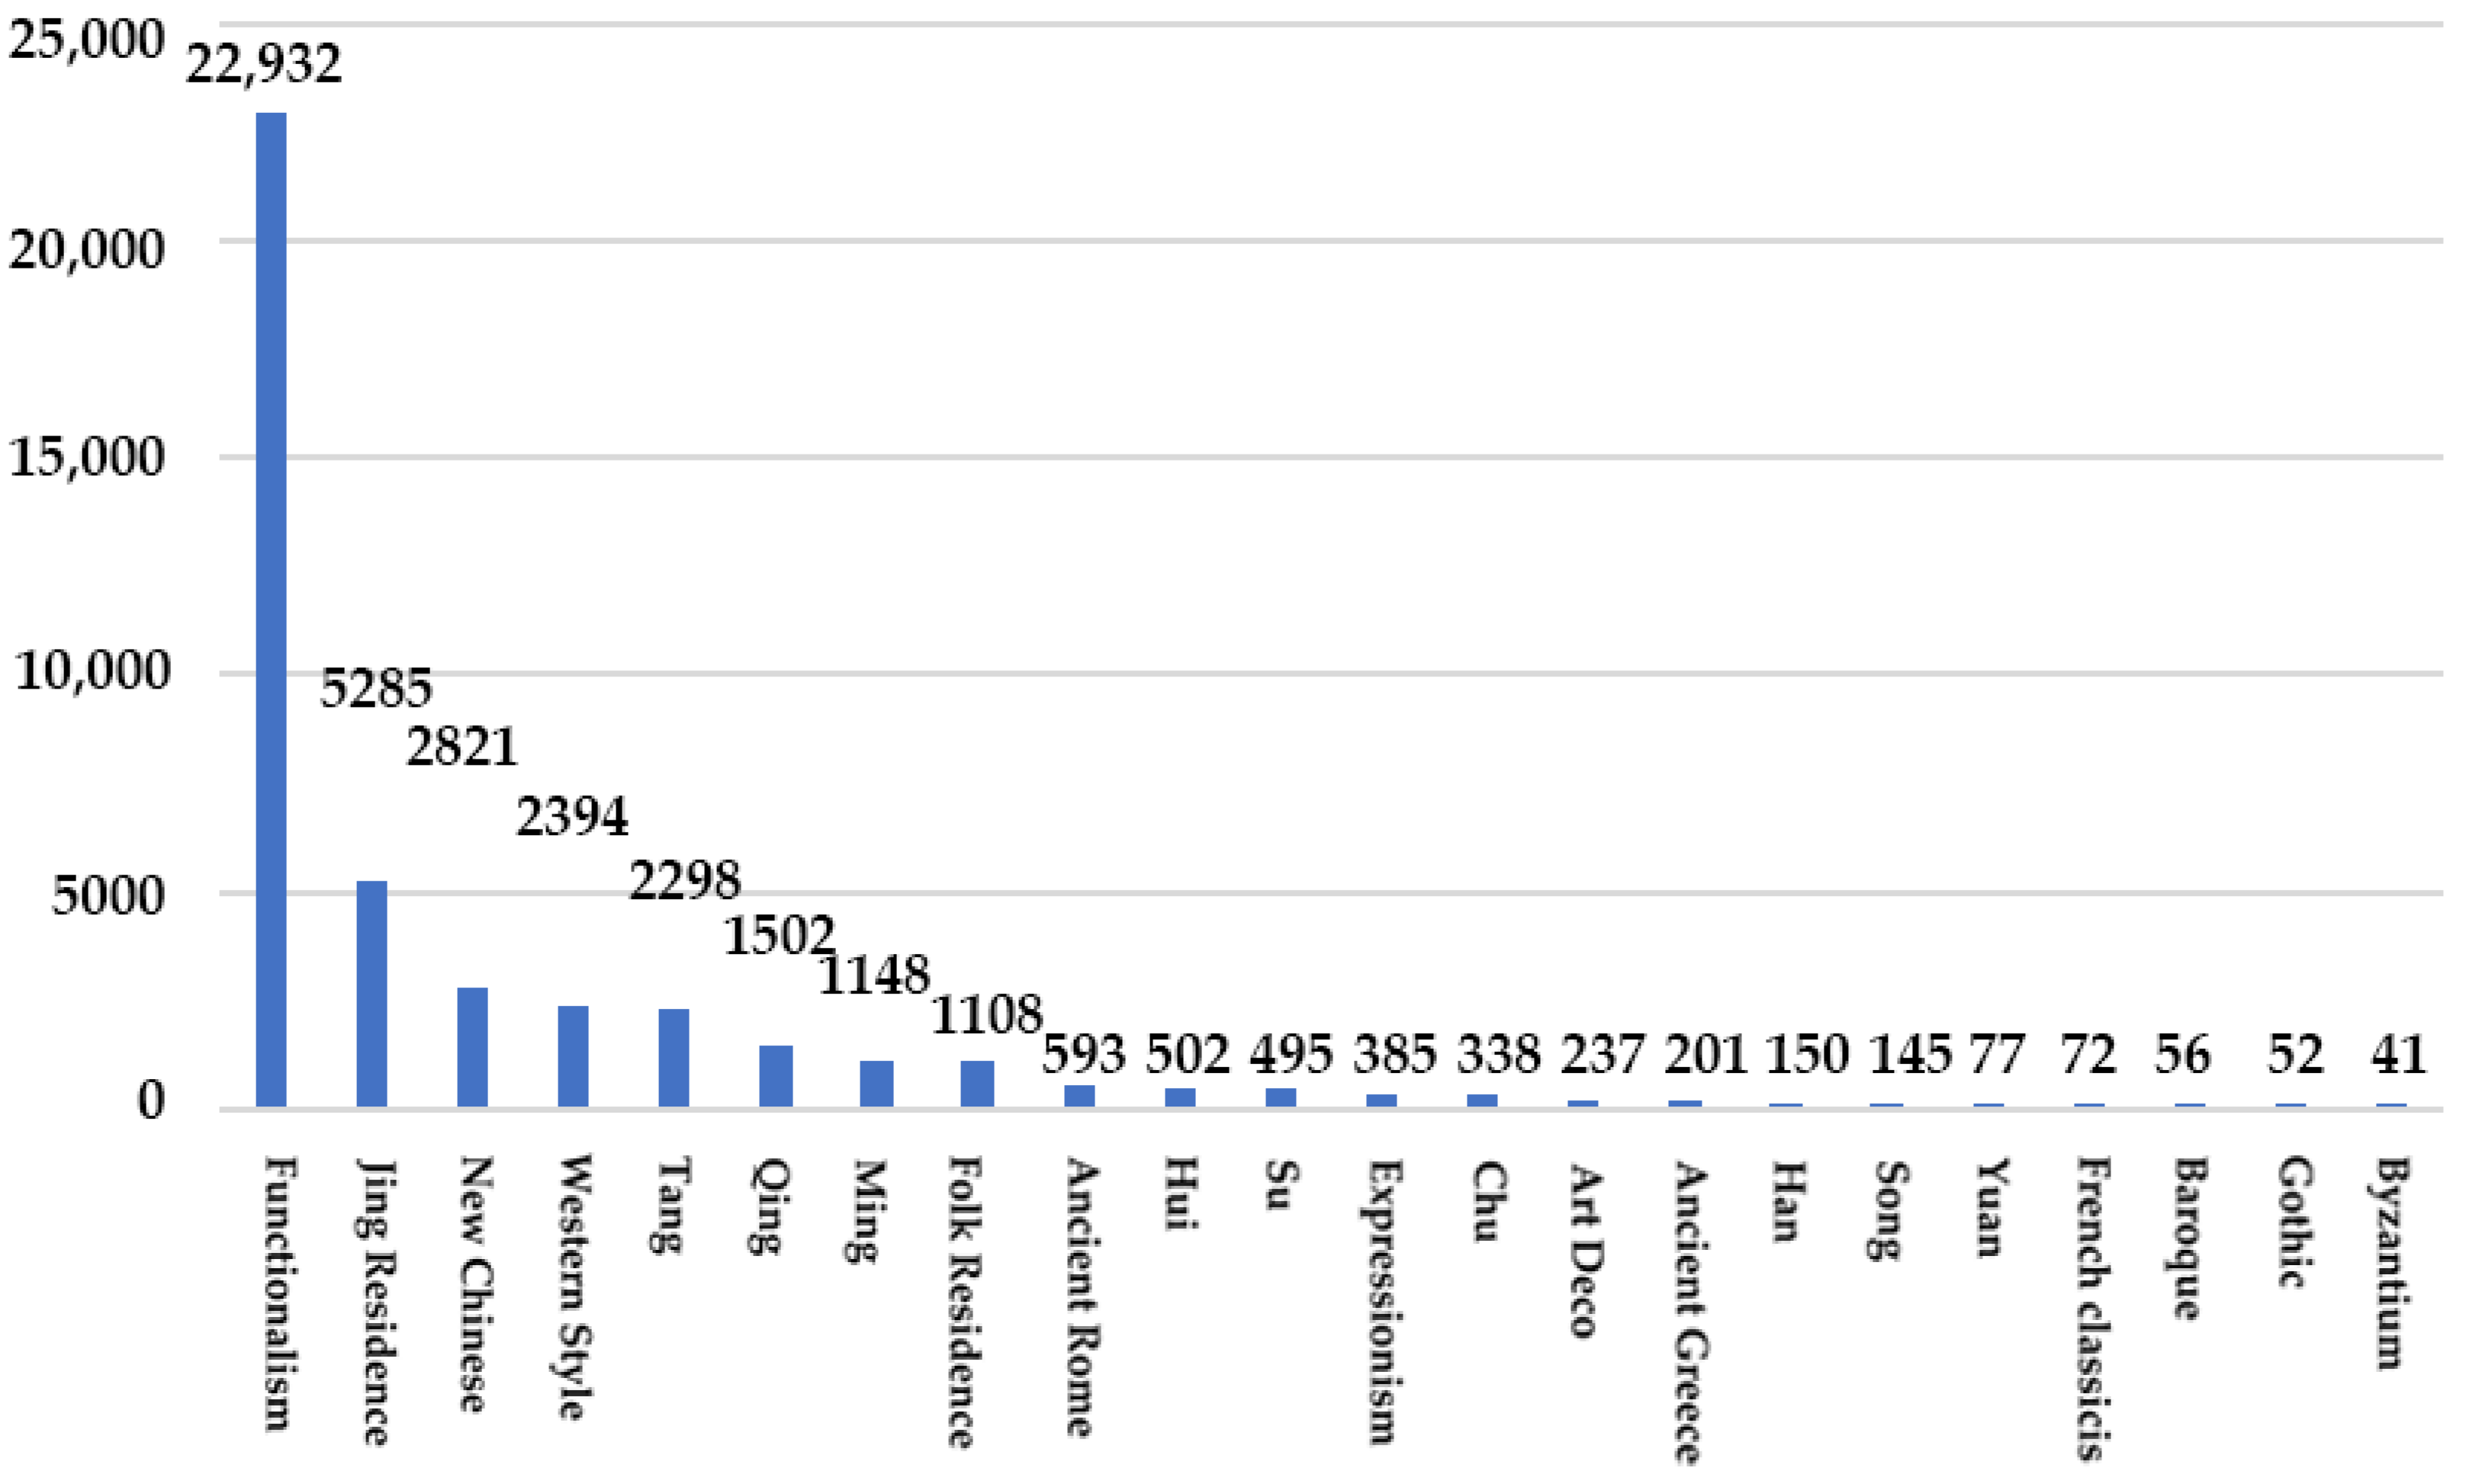
4.3. Results and Analysis of Architectural Style Dataset
4.4. Dataset Validity
5. Discussion
5.1. Street View Imagery as an Agent for Deep Learning
5.2. The Model’s Performance in Architectural Style Detection and Classification
5.3. Sensitivity Analysis of the CNN Model
5.4. Promoting the Development of Research in the Field of Architectural Styles
6. Conclusions
Author Contributions
Funding
Data Availability Statement
Conflicts of Interest
References
- Voulodimos, A.; Doulamis, N.; Doulamis, A.; Protopapadakis, E. Deep Learning for Computer Vision: A Brief Review. Comput. Intell. Neurosci. 2018, 2018, 7068349. [Google Scholar] [CrossRef]
- Chen, X.; Meng, Q.; Hu, D.; Zhang, L.; Yang, J. Evaluating Greenery around Streets Using Baidu Panoramic Street View Images And the Panoramic Green View Index. Forests 2019, 10, 1109. [Google Scholar] [CrossRef]
- Zhang, L.; Pei, T.; Chen, Y.; Song, C.; Liu, X. A review of urban environment assessment based on streetscape images. J. Geo-Inf. Sci. 2019, 21, 46–58. [Google Scholar]
- Guan, F.; Fang, Z.; Yu, T.; Feng, M.; Yang, F. Detecting visually salient scene areas and deriving their relative spatial relations from continuous street-view panoramas. Int. J. Digit. Earth 2020, 13, 1504–1531. [Google Scholar] [CrossRef]
- Cinnamon, J.; Jahiu, L. Panoramic Street-Level Imagery in Data-Driven Urban Research: A Comprehensive Global Review of Applications, Techniques, and Practical Considerations. ISPRS Int. J. Geo-Inf. 2021, 10, 471. [Google Scholar] [CrossRef]
- Li, Y.; Guo, J.; Chen, Y. A New Approach for Tourists’Visual Behavior Patterns and Perception Evaluation based on Multi-source Data. J. Geo-Inf. Sci. 2022, 24, 2004–2020. [Google Scholar]
- Li, Y.; Jingxiong, H.; Liang, J.; Zhang, Y.; Chen, Y. Research on Visual Attraction and Influencing Factors of Perception of Commercial Street Space in Cultural Heritage Site: Taking Gulangyu Longtou Road as an Example. West. J. Hum. Settl. 2022, 37, 114–121. [Google Scholar]
- Biljecki, F.; Ito, K. Street view imagery in urban analytics and GIS: A review. Landsc. Urban Plan. 2021, 215, 104217. [Google Scholar] [CrossRef]
- Ning, H.; Li, Z.; Ye, X.; Wang, S.; Wang, W.; Huang, X. Exploring the vertical dimension of street view image based on deep learning: A case study on lowest floor elevation estimation. Int. J. Geogr. Inf. Sci. 2022, 36, 1317–1342. [Google Scholar] [CrossRef]
- Liu, Z.; Lv, J.; Yao, Y.; Zhang, J.; Kou, S.; Guan, Q. Research Method of Interpretable Urban Perception Model based on Street View Imagery. J. Geo-Inf. Sci. 2022, 24, 2045–2057. [Google Scholar]
- Mahabir, R.; Schuchard, R.; Crooks, A.; Croitoru, A.; Stefanidis, A. Crowdsourcing Street View Imagery: A Comparison of Mapillary and OpenStreetCam. ISPRS Int. J. Geo-Inf. 2020, 9, 341. [Google Scholar] [CrossRef]
- Li, Z.; Liu, F.; Yang, W.; Peng, S.; Zhou, J. A Survey of Convolutional Neural Networks: Analysis, Applications, and Prospects. IEEE Trans. Neural Netw. Learn. Syst. 2022, 33, 6999–7019. [Google Scholar] [CrossRef] [PubMed]
- Liu, J.e.; An, F.P. Image Classification Algorithm Based on Deep Learning-Kernel Function. Sci. Program. 2020, 2020, 7607612. [Google Scholar] [CrossRef]
- Barbosa, R.C.; Ayub, M.S.; Rosa, R.L.; Rodriguez, D.Z.; Wuttisittikulkij, L. Lightweight PVIDNet: A Priority Vehicles Detection Network Model Based on Deep Learning for Intelligent Traffic Lights. Sensors 2020, 20, 6218. [Google Scholar] [CrossRef]
- Khalil, R.A.; Jones, E.; Babar, M.I.; Jan, T.; Zafar, M.H.; Alhussain, T. Speech Emotion Recognition Using Deep Learning Techniques: A Review. IEEE Access 2019, 7, 117327–117345. [Google Scholar] [CrossRef]
- Zhou, H.; He, S.; Cai, Y.; Wang, M.; Su, S. Social inequalities in neighborhood visual walkability: Using street view imagery and deep learning technologies to facilitate healthy city planning. Sustain. Cities Soc. 2019, 50, 101605. [Google Scholar] [CrossRef]
- Yang, L.; Liu, J.; Liang, Y.; Lu, Y.; Yang, H. Spatially Varying Effects of Street Greenery on Walking Time of Older Adults. ISPRS Int. J. Geo-Inf. 2021, 10, 596. [Google Scholar] [CrossRef]
- Li, X.; Ratti, C.; Seiferling, I. Quantifying the shade provision of street trees in urban landscape: A case study in Boston, USA, using Google Street View. Landsc. Urban Plan. 2018, 169, 81–91. [Google Scholar] [CrossRef]
- Wang, W.X.; Guo, H.; Li, X.M.; Tang, S.J.; Xia, J.Z.; Lv, Z.H. Deep learning for assessment of environmental satisfaction using BIM big data in energy efficient building digital twins. Sustain. Energy Technol. Assess. 2022, 50, 101897. [Google Scholar] [CrossRef]
- Chen, D.; Wawrzynski, P.; Lv, Z. Cyber security in smart cities: A review of deep learning- based applications and case studies. Sustain. Cities Soc. 2021, 66, 102655. [Google Scholar] [CrossRef]
- Zeng, N.; Zhang, H.; Song, B.; Liu, W.; Li, Y.; Dobaie, A.M. Facial expression recognition via learning deep sparse autoencoders. Neurocomputing 2018, 273, 643–649. [Google Scholar] [CrossRef]
- Guo, Y.H.; Wang, C.F.; Yu, S.X.; McKenna, F.; Law, K.H. AdaLN: A Vision Transformer for Multidomain Learning and Predisaster Building Information Extraction from Images. J. Comput. Civ. Eng. 2022, 36, 04022024. [Google Scholar] [CrossRef]
- Wang, C.F.; Hornauer, S.; Yu, S.X.; McKenna, F.; Law, K.H. Instance segmentation of soft-story buildings from street-view images with semiautomatic annotation. Earthq. Eng. Struct. Dyn. 2022, 52, 2520–2532. [Google Scholar] [CrossRef]
- Yu, Q.; Wang, C.F.; McKenna, F.; Yu, S.X.; Taciroglu, E.; Cetiner, B.; Law, K.H. Rapid visual screening of soft-story buildings from street view images using deep learning classification. Earthq. Eng. Eng. Vib. 2020, 19, 827–838. [Google Scholar] [CrossRef]
- Wang, C.F.; Yu, Q.; Law, K.H.; McKenna, F.; Yu, S.X.; Taciroglu, E.; Zsarnoczay, A.; Elhaddad, W.; Cetiner, B. Machine learning-based regional scale intelligent modeling of building information for natural hazard risk management. Autom. Constr. 2021, 122, 103474. [Google Scholar] [CrossRef]
- Wang, C.F.; Antos, S.; Goldsmith, J.; Triveno, L. Visual Perception of Building and Household Vulnerability from Streets. arXiv 2022, arXiv:2205.14460. [Google Scholar] [CrossRef]
- Mocanu, E.; Mocanu, D.C.; Nguyen, P.H.; Liotta, A.; Webber, M.E.; Gibescu, M.; Slootweg, J.G. On-Line Building Energy Optimization Using Deep Reinforcement Learning. IEEE Trans. Smart Grid 2019, 10, 3698–3708. [Google Scholar] [CrossRef]
- Fan, C.; Xiao, F.; Zhao, Y. A short-term building cooling load prediction method using deep learning algorithms. Appl. Energy 2017, 195, 222–233. [Google Scholar] [CrossRef]
- Runge, J.; Zmeureanu, R. A Review of Deep Learning Techniques for Forecasting Energy Use in Buildings. Energies 2021, 14, 608. [Google Scholar] [CrossRef]
- Fan, C.; Sun, Y.J.; Zhao, Y.; Song, M.J.; Wang, J.Y. Deep learning-based feature engineering methods for improved building energy prediction. Appl. Energy 2019, 240, 35–45. [Google Scholar] [CrossRef]
- Shon, D.; Noh, B.; Byun, N. Identification and Extracting Method of Exterior Building Information on 3D Map. Buildings 2022, 12, 452. [Google Scholar] [CrossRef]
- Yin, J.C.; Wu, F.; Qiu, Y.; Li, A.P.; Liu, C.Y.; Gong, X.Y. A Multiscale and Multitask Deep Learning Framework for Automatic Building Extraction. Remote Sens. 2022, 14, 4744. [Google Scholar] [CrossRef]
- Zhang, J.X.; Fukuda, T.; Yabuki, N. Development of a City-Scale Approach for Facade Color Measurement with Building Functional Classification Using Deep Learning and Street View Images. ISPRS Int. J. Geo-Inf. 2021, 10, 551. [Google Scholar] [CrossRef]
- Pardamean, B.; Muljo, H.H.; Cenggoro, T.W.; Chandra, B.J.; Rahutomo, R. Using transfer learning for smart building management system. J. Big Data 2019, 6, 110. [Google Scholar] [CrossRef]
- Han, X.; Wang, L.; Seo, S.H.; He, J.; Jung, T. Measuring Perceived Psychological Stress in Urban Built Environments Using Google Street View and Deep Learning. Front. Public Health 2022, 10, 1295. [Google Scholar] [CrossRef]
- Ji, Y.; Dong, Y.; Hou, M.; Qi, Y.; Huo, P. Automatic identification method of ancient building ridge beast based on convolutional neural network. Geomat. World 2021, 28, 54–60. [Google Scholar]
- Shan, L.; Zhang, L. Application of Intelligent Technology in Facade Style Recognition of Harbin Modern Architecture. Sustainability 2022, 14, 7073. [Google Scholar] [CrossRef]
- Yoshimura, Y.; Cai, B.; Wang, Z.; Ratti, C. Deep Learning Architect: Classification for Architectural Design through the Eye of Artificial Intelligence. In Computational Urban Planning and Management for Smart Cities; Geertman, S., Zhan, Q., Allan, A., Pettit, C., Eds.; Springer International Publishing: Cham, Switzerland, 2019; pp. 249–265. [Google Scholar]
- Zhang, L.; Pei, T.; Wang, X.; Wu, M.; Song, C.; Guo, S.; Chen, Y. Quantifying the Urban Visual Perception of Chinese Traditional-Style Building with Street View Images. Appl. Sci. 2020, 10, 5963. [Google Scholar] [CrossRef]
- Han, Q.; Yin, C.; Deng, Y.; Liu, P. Towards Classification of Architectural Styles of Chinese Traditional Settlements Using Deep Learning: A Dataset, a New Framework, and Its Interpretability. Remote Sens. 2022, 14, 5250. [Google Scholar] [CrossRef]
- Kalfarisi, R.; Hmosze, M.; Wu, Z.Y. Detecting and Geolocating City-Scale Soft-Story Buildings by Deep Machine Learning for Urban Seismic Resilience. Nat. Hazards Rev. 2022, 23, 04021062. [Google Scholar] [CrossRef]
- Liu, C.; Sepasgozar, S.M.E.; Zhang, Q.; Ge, L.L. A novel attention-based deep learning method for post-disaster building damage classification. Expert Syst. Appl. 2022, 202, 117268. [Google Scholar] [CrossRef]
- Obeso, A.M.; Benois-Pineau, J.; Acosta, A.A.R.; Vazquez, M.S.G. Architectural style classification of Mexican historical buildings using deep convolutional neural networks and sparse features. J. Electron. Imaging 2017, 26, 011016. [Google Scholar] [CrossRef]
- Kang, J.; Koerner, M.; Wang, Y.; Taubenboeck, H.; Zhu, X.X. Building instance classification using street view images. ISPRS J. Photogramm. Remote Sens. 2018, 145, 44–59. [Google Scholar] [CrossRef]
- Yi, Y.K.; Zhang, Y.; Myung, J. House style recognition using deep convolutional neural network. Autom. Constr. 2020, 118, 103307. [Google Scholar] [CrossRef]
- Xu, H.; Wang, L.; Fang, Z.; He, M.; Hou, X.; Zuo, L.; Guan, F.; Xiong, C.; Gong, Y.; Pang, Q.; et al. Mapping of street-facing architectural style and map generation method under street view imagery. Geomat. Inf. Sci. Wuhan Univ. 2021, 46, 13. [Google Scholar] [CrossRef]
- Sun, M.; Zhang, F.; Duarte, F.; Ratti, C. Understanding architecture age and style through deep learning. Cities 2022, 128, 103787. [Google Scholar] [CrossRef]
- Zhao, P.; Miao, Q.; Song, J.; Qi, Y.; Liu, R.; Ge, D. Architectural Style Classification Based on Feature Extraction Module. IEEE Access 2018, 6, 52598–52606. [Google Scholar] [CrossRef]
- Wang, B.; Zhang, S.; Zhang, J.; Cai, Z. Architectural style classification based on CNN and channel-spatial attention. Signal Image Video Process. 2022, 17, 99–107. [Google Scholar] [CrossRef]
- Lamas, A.; Tabik, S.; Cruz, P.; Montes, R.; Martinez-Sevilla, A.; Cruz, T.; Herrera, F. MonuMAI: Dataset, deep learning pipeline and citizen science based app for monumental heritage taxonomy and classification. Neurocomputing 2021, 420, 266–280. [Google Scholar] [CrossRef]
- Sun, H.; Hong, X.; Wei, Q. The Classification Method of Urban Architectural Styles Based on Deep Learning and Street View Imagery. Hydraul. Civ. Eng. Technol. VII 2022, 31, 823–830. [Google Scholar] [CrossRef]
- Revaud, J.; Heo, M.; de Rezende, R.S.; You, C.; Jeong, S.G. Did It Change? Learning to Detect Point-Of-Interest Changes for Proactive Map Updates. In Proceedings of the IEEE/CVF Conference on Computer Vision and Pattern Recognition (CVPR), Long Beach, CA, USA, 15–20 June 2019; pp. 4081–4090. [Google Scholar]
- Bao, X.; Wang, S. Survey of object detection algorithm based on deep learning. Sens. Microsyst. 2022, 41, 5–9. [Google Scholar] [CrossRef]
- Zhang, f.; Liu, Y. Street view imagery: Methods and applications based on artificial intelligence. J. Remote Sens. 2021, 25, 1043–1054. [Google Scholar] [CrossRef]
- Anguelov, D.; Dulong, C.; Filip, D.; Frueh, C.; Lafon, S.; Lyon, R.; Ogale, A.; Vincent, L.; Weaver, J. Google Street View: Capturing the World at Street Level. Computer 2010, 43, 32–38. [Google Scholar] [CrossRef]
- Cheng, L.; Chu, S.; Zong, W.; Li, S.; Wu, J.; Li, M. Use of Tencent Street View Imagery for Visual Perception of Streets. ISPRS Int. J. Geo-Inf. 2017, 6, 265. [Google Scholar] [CrossRef]
- Ren, S.Q.; He, K.M.; Girshick, R.; Sun, J. Faster R-CNN: Towards Real-Time Object Detection with Region Proposal Networks. IEEE Trans. Pattern Anal. Mach. Intell. 2017, 39, 1137–1149. [Google Scholar] [CrossRef] [PubMed]
- Cheng, S.; Ma, H.; Liu, S. Acceptance Derivation and Local Presentation in Transplantation: An Analysis of Modern Japanese Architects’ Architectural Style in Qingdao (1914–1945). Urban Archit. 2023, 20, 191–195. [Google Scholar]
- Chai, X.; Qin, J.; Ying, C.; Jin, S.; Rao, X. Study on the façade style of the Bund building complex in Shanghai. Urban Archit. 2022, 19, 119–122. [Google Scholar]
- Yang, D. A brief analysis of the formation and characteristics of Harbin’s modern architectural style. Ind. Des. 2022, 8, 95–97. [Google Scholar]
- Qin, Z.; Zhang, W.; Wen, Y.; Lu, J. A Study on the Style Types and Characteristics of Christian Church Architecture: A Case Study of Nanjing. Urban Archit. 2023, 20, 200–203. [Google Scholar]


| Chronological [47] | Functional [44] |
|---|---|
| This categorization method divides buildings into groups based on a more than ten-year gradient. Attention should be paid to the differences between the buildings with more emphasis on the aesthetic experience than the age of the building. | This classification method primarily classifies buildings into several categories (residential, office, industrial, and shop), and focuses more on the function of the building. However, the exact function of the building can have a significant errors based on appearance alone because the shape of the building facade depends significantly on the personal subjective vision of the architect. |
| Number | Category | Example | Feature |
|---|---|---|---|
| 1. | Functionalism |  | One of the most common architectural styles in the city, it focuses more on the function of the building than on the exterior features. |
| 2. | Expressionism |  | Most of them are streamlined and attract attention with exaggerated shapes in their features. |
| 3. | New Chinese |  | An architectural form that combines Chinese and modern architecture. It retains the charm and essence of Chinese houses. Following the layout format of traditional houses, the tiled sloping roofs of traditional houses are continued. |
| 4. | Western style |  | This style features simple and precise lines, pays attention to symmetry, and uses color, light and shade. Representative features include Roman columns, line feet, convex belly windows, dormer windows, etc. |
| 5. | Art Deco |  | The Art Deco style incorporates traditional craft motifs with the colors of the machine age. Rich colors, striking geometric patterns, setbacks, and many decorations often characterize this style. |
| 6. | Folk Residence |  | Representative features include Chinese corner eaves, Five mile towers, and European champagne stone columns. This style is known for its comfortable space layout, rich decoration, and Republican-style decoration style. |
| 7. | Han |  | The foundations, structures, and carvings follow the archetype of ancient Chinese architecture. Common features include straight ridges. This style has wooden structures such as buckets. Mainly red, black and yellow. It is located on a base or high platform. |
| 8. | Tang |  | This style is magnificent and rigorous. The bucket is large, the eaves are far-reaching, the lifting is gentle, the roof atmosphere is stable, the color painting is complex and elegant, and the two colors vermilion and white are commonly used. |
| 9. | Song |  | Delicate and intricate, with attention to decoration. The roof is interspersed with rich, staggered three-dimensional silhouettes. The ridge and corners of the roof are upturned, with various colorful paintings, carvings, doors, and windows. |
| 10. | Yuan |  | Extensive and uninhibited, affected by economy and culture, this architectural development is in a withered state; the Yuan dynasty mainly used logs as beams, and the appearance is extensive. Yuan architecture features multi-use column shifting, column reduction, and reduced wood frame structure. |
| 11. | Ming |  | The Ming style is rigorous and steady in its decoration, color painting, and decoration archetype. Many works of materials such as masonry, glass, and hardwood were left, and bricks were commonly used in residential walls. The hierarchy is strict. The people were forbidden to use brackets and colors. |
| 12. | Qing |  | Representative forms include hard mountain architecture, hanging mountain style architecture, hill building, cutting-edge architecture, etc. |
| 13. | Su |  | This is the architectural style of the north and south garden layout. Representative features include roofs with high ridge angles, brick gatehouses, tile windows, and street-crossing buildings. |
| 14. | Chu |  | This style is the embodiment of “the unity of heaven and man” and “ritual law and patriarchal system”. The high-platform buildings are typical of the characteristics and level of Chu architecture, which occupies an important position in the history of architecture. |
| 15. | Jing Residence |  | The most typical example is the courtyard in Beijing. The yard is expansive and sparse, closed and private; the houses on all sides are independent, the appearance is regular, and the mid-line is symmetrical. |
| 16. | Hui |  | The main features are the unique horse-head wall, the closed high wall, the horse-head angle wall, horse-head staggered tiles, and white wall. |
| 17. | Gothic |  | The minaret is high, with pointed arches, large windows, and stained glass depictions of Biblical stories. |
| 18. | Baroque |  | This style features freedom of shape, pursuit of movement, preference for rich decoration, carvings, and intense colors. |
| 19. | French classicism |  | Employing the classical pillar style, rejecting national traditions and local characteristics, this style has majesty. The general representative works are relatively large-scale, majestic palace buildings and some monumental square complexes |
| 20. | Ancient Greece |  | Characteristic features include triangular pediments, high pedestals, and neatly arranged colonnades. |
| 21. | Ancient Rome |  | Ancient Roman architecture inherited the styles of ancient Greece and developed new architectural characteristics, mainly the broad application of arch structure (including barrel arches and cross arches) and the application of Tuscan-type columns and mixed-type columns. |
| 22. | Byzantium |  | It is characterized by the widespread use of vaulted roofs with prominent overall styling centers. In its use of color, attention is paid to both change and unity. |
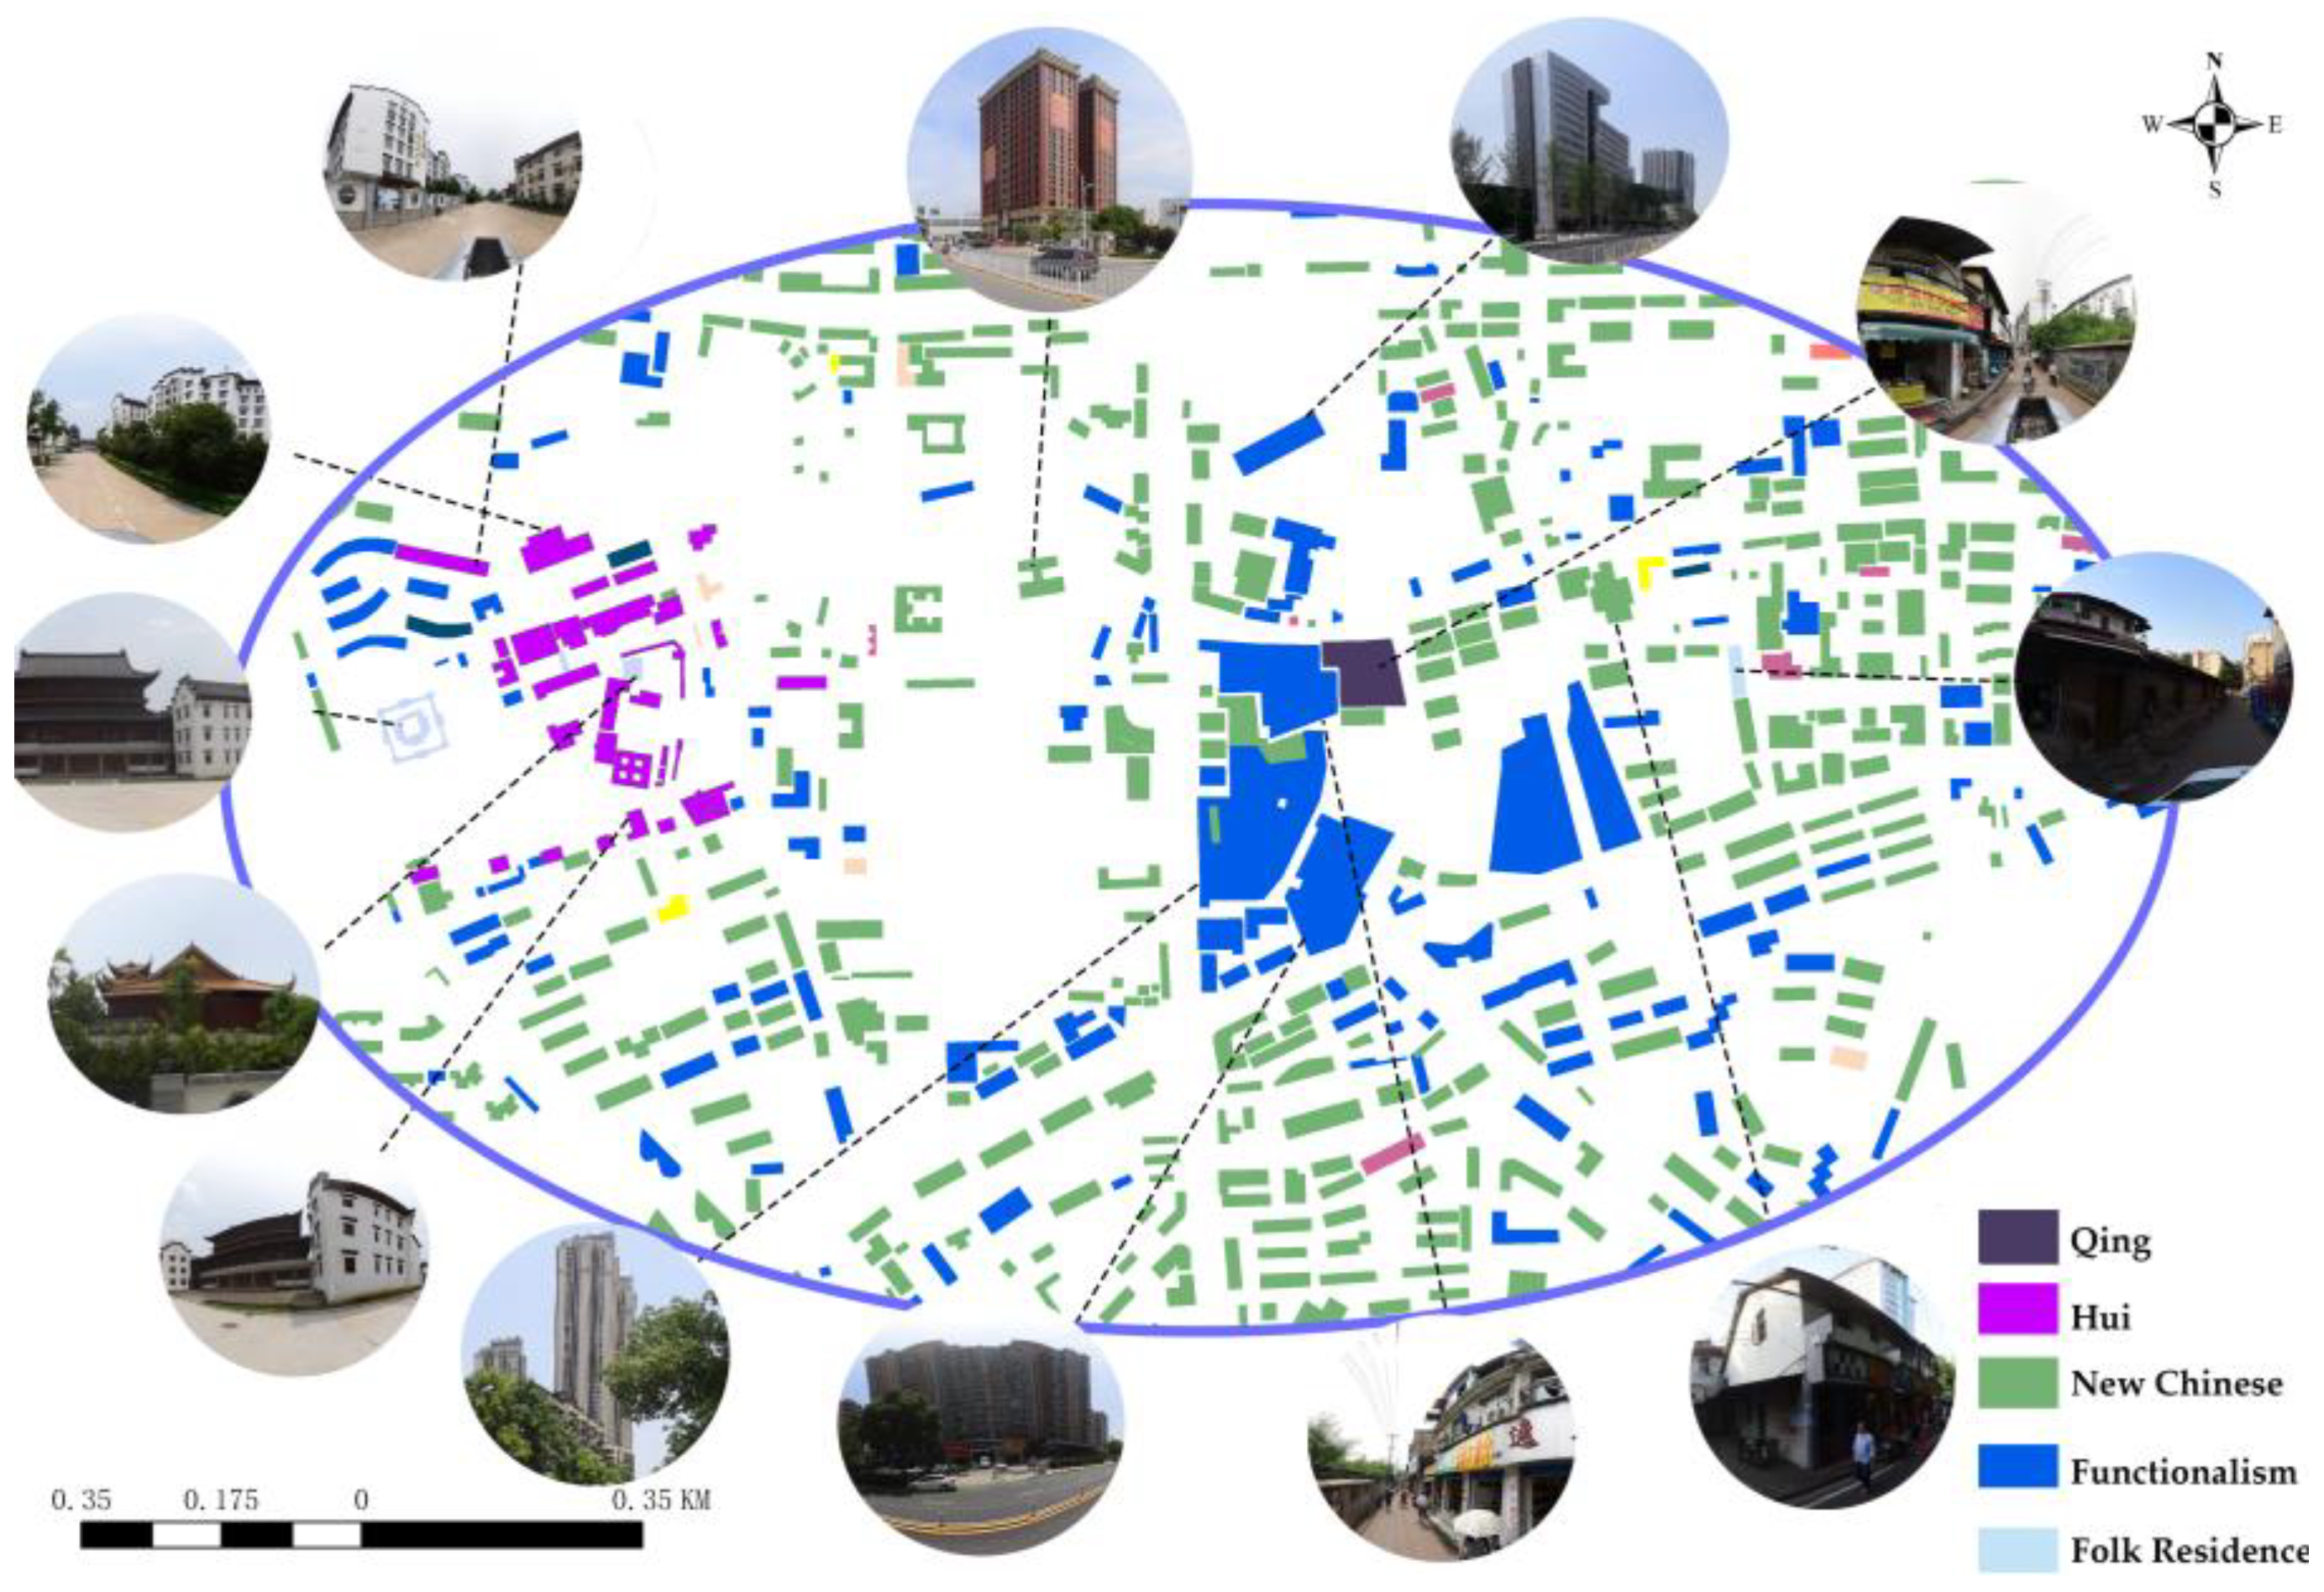
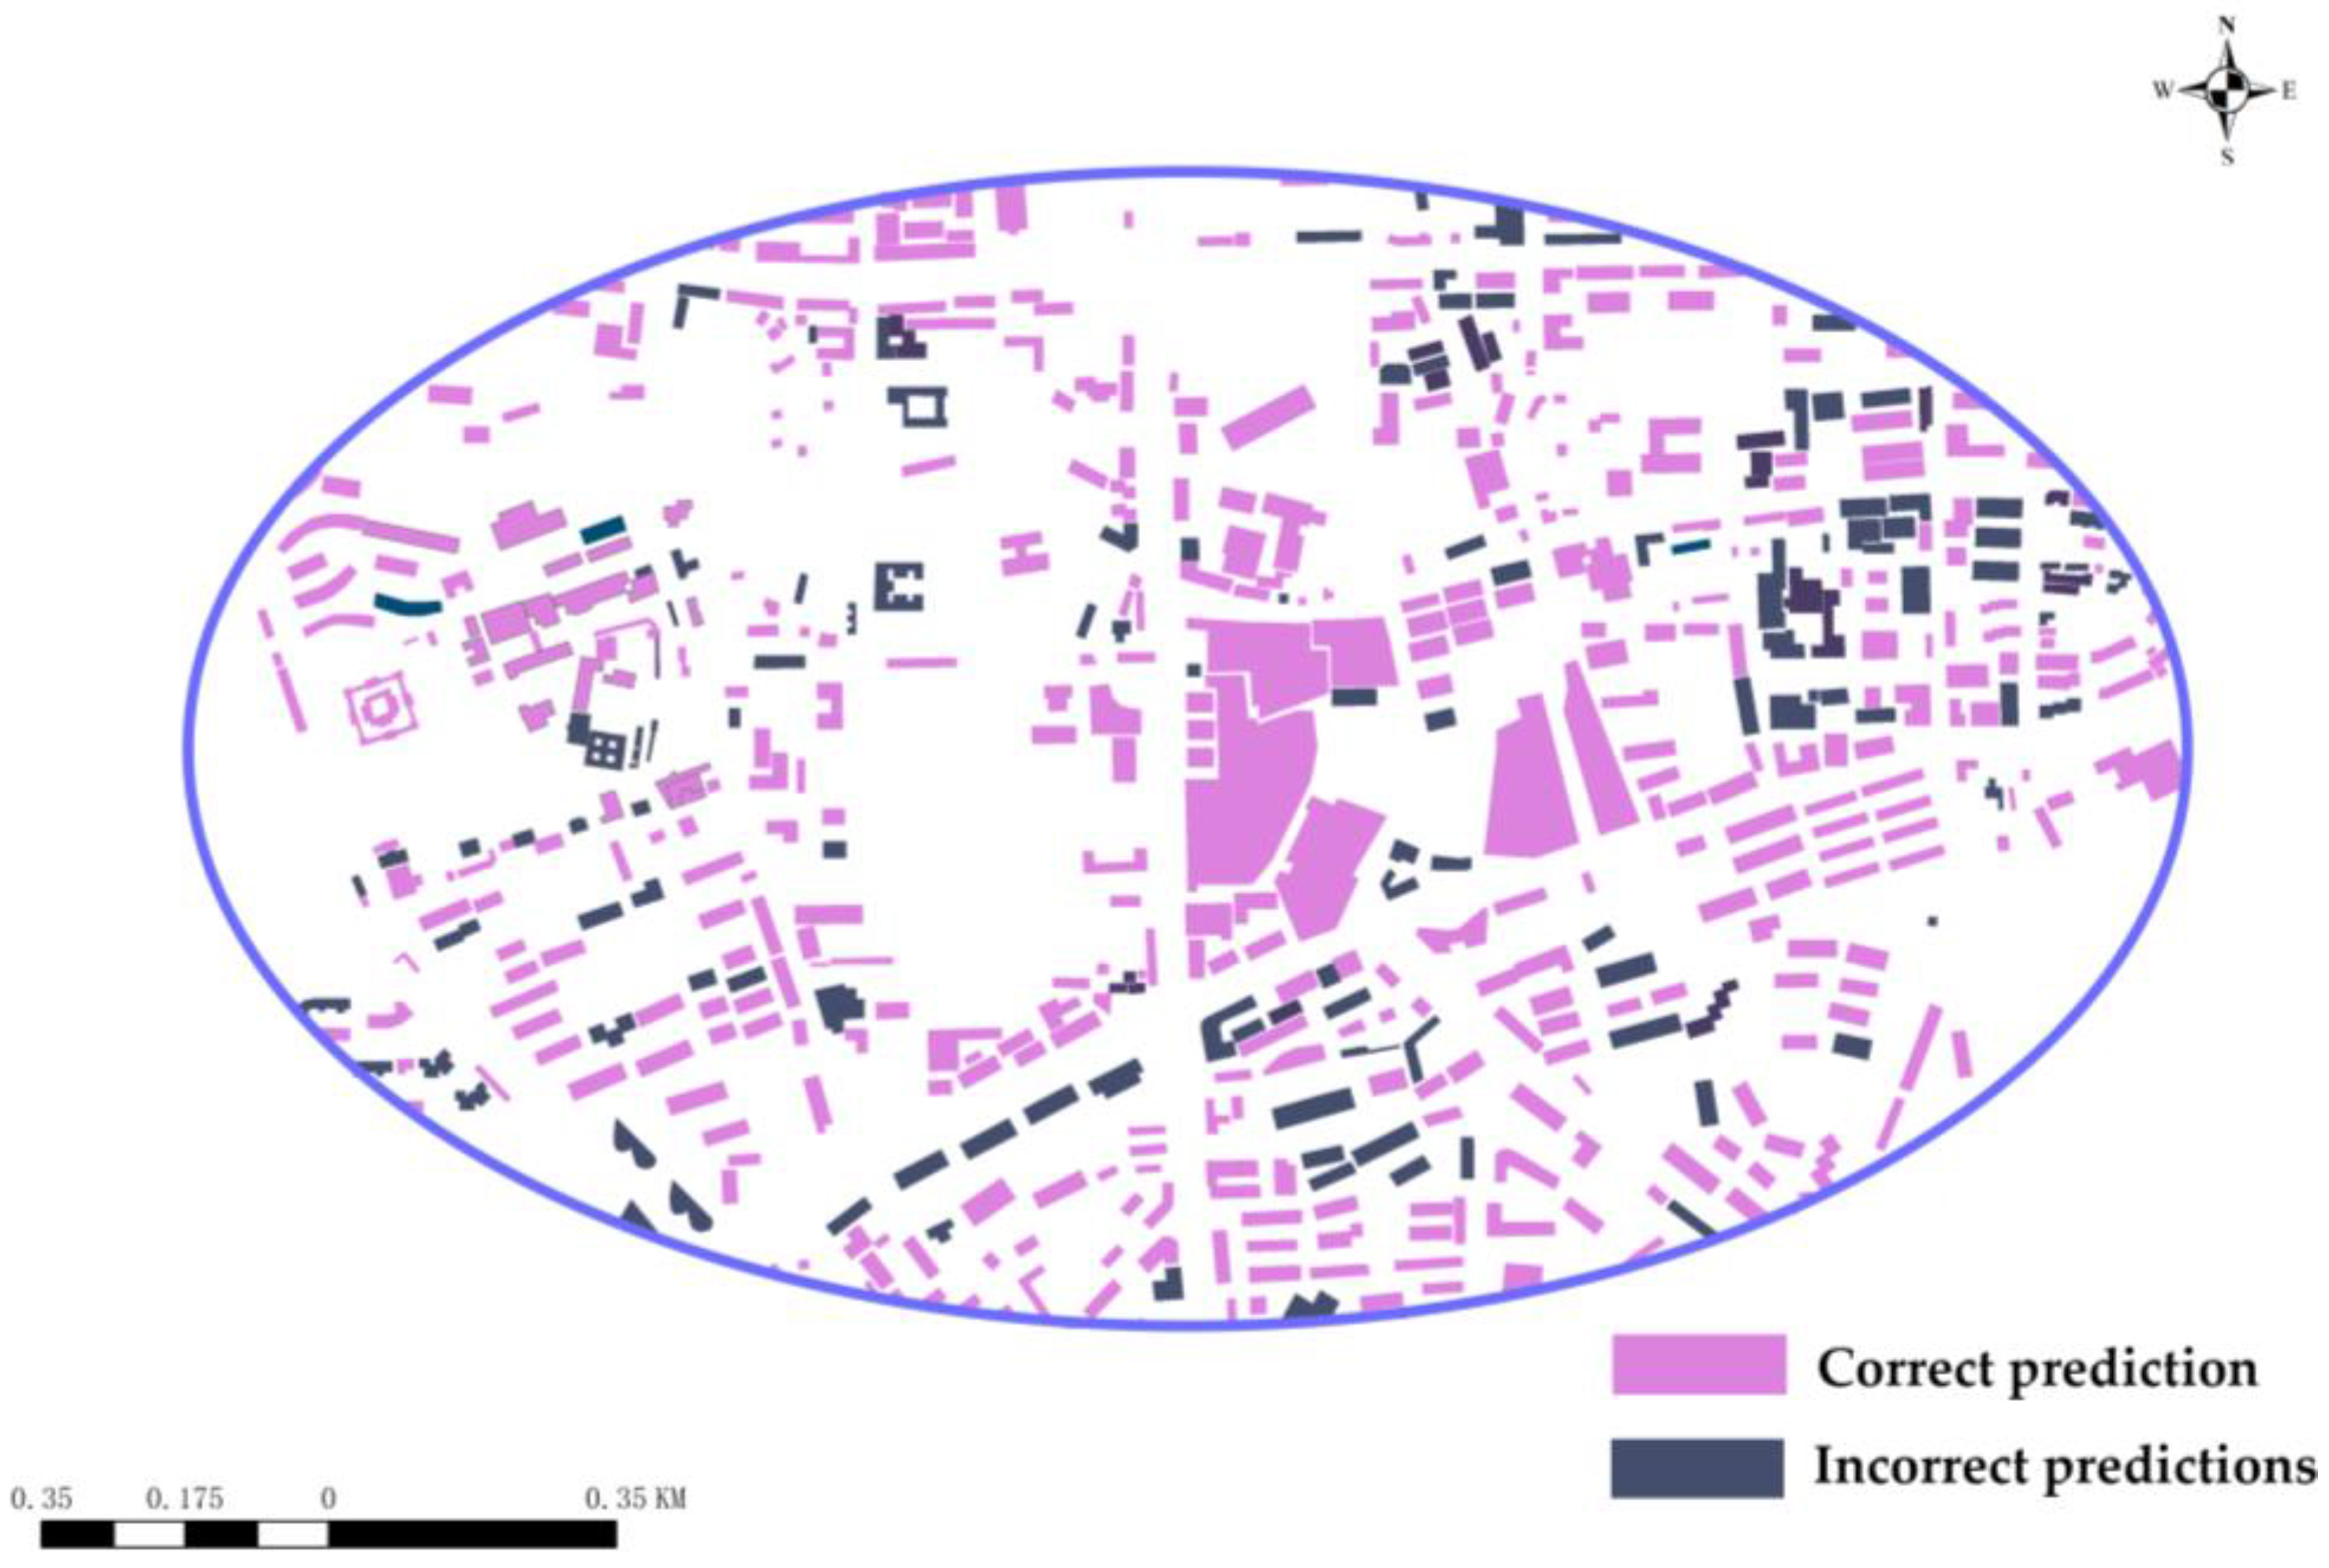
| Mapping Method | Correct Mapping | Error Mapping |
|---|---|---|
| Monographic Mapping | 419 | 81 |
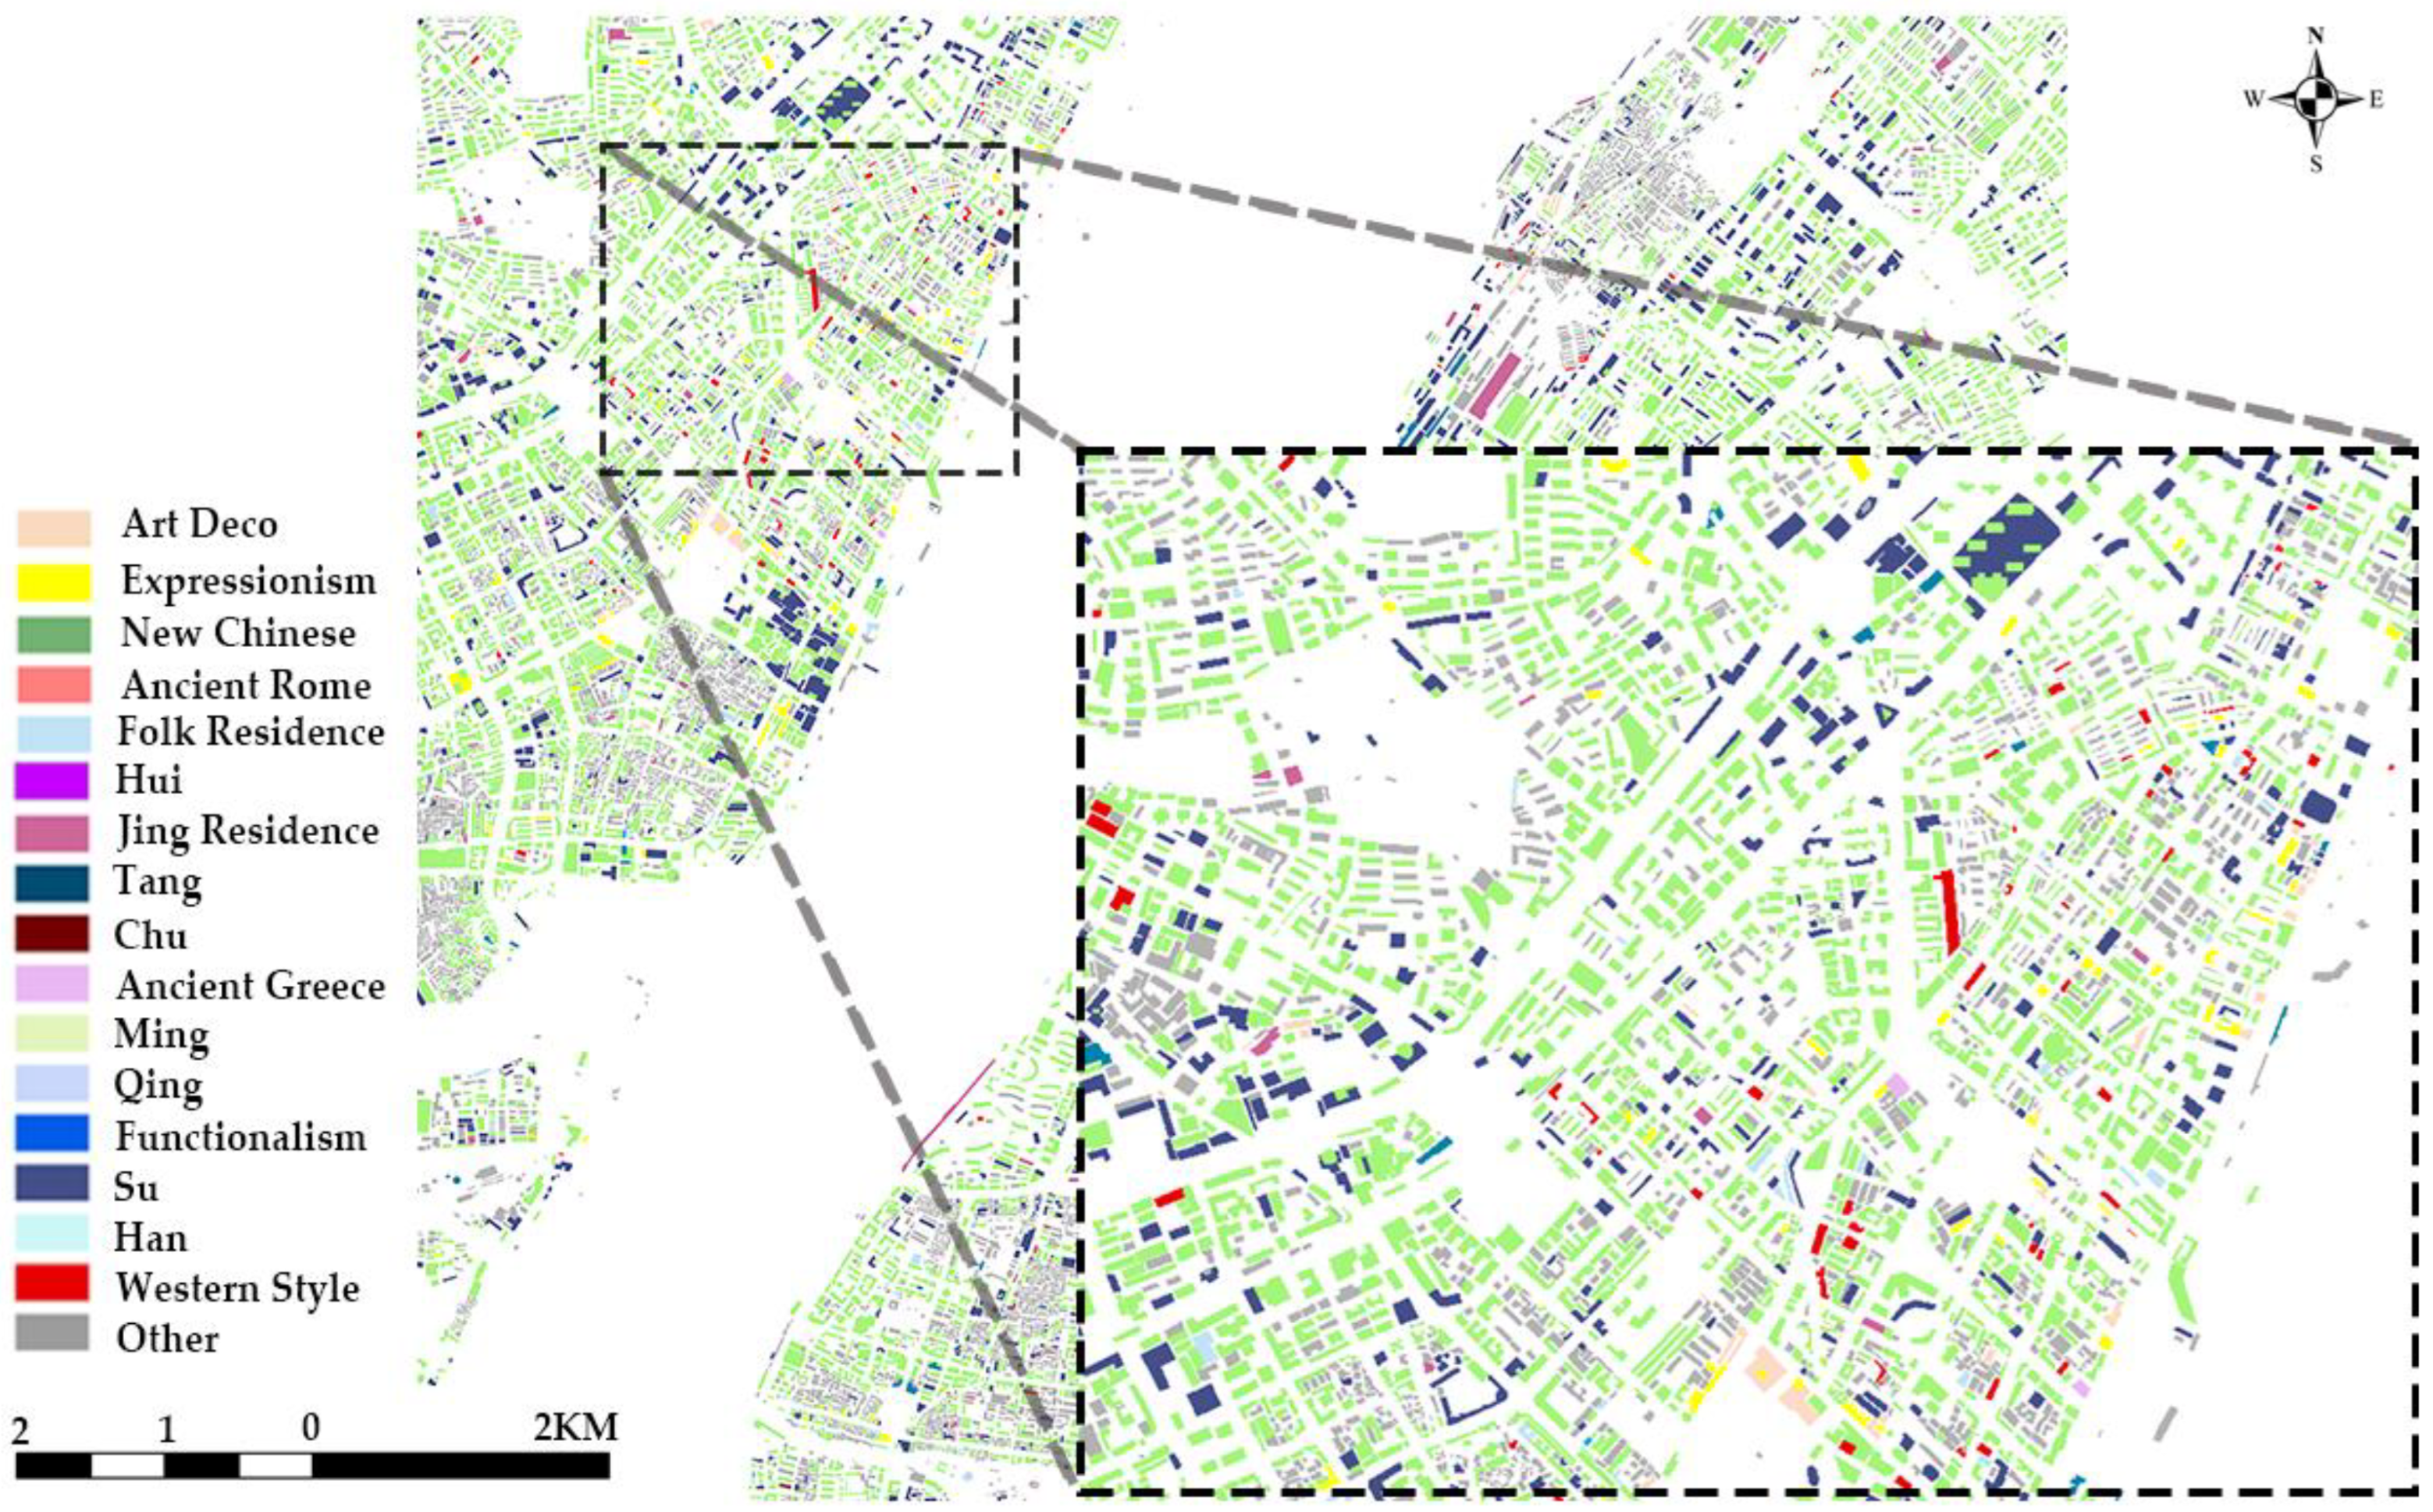
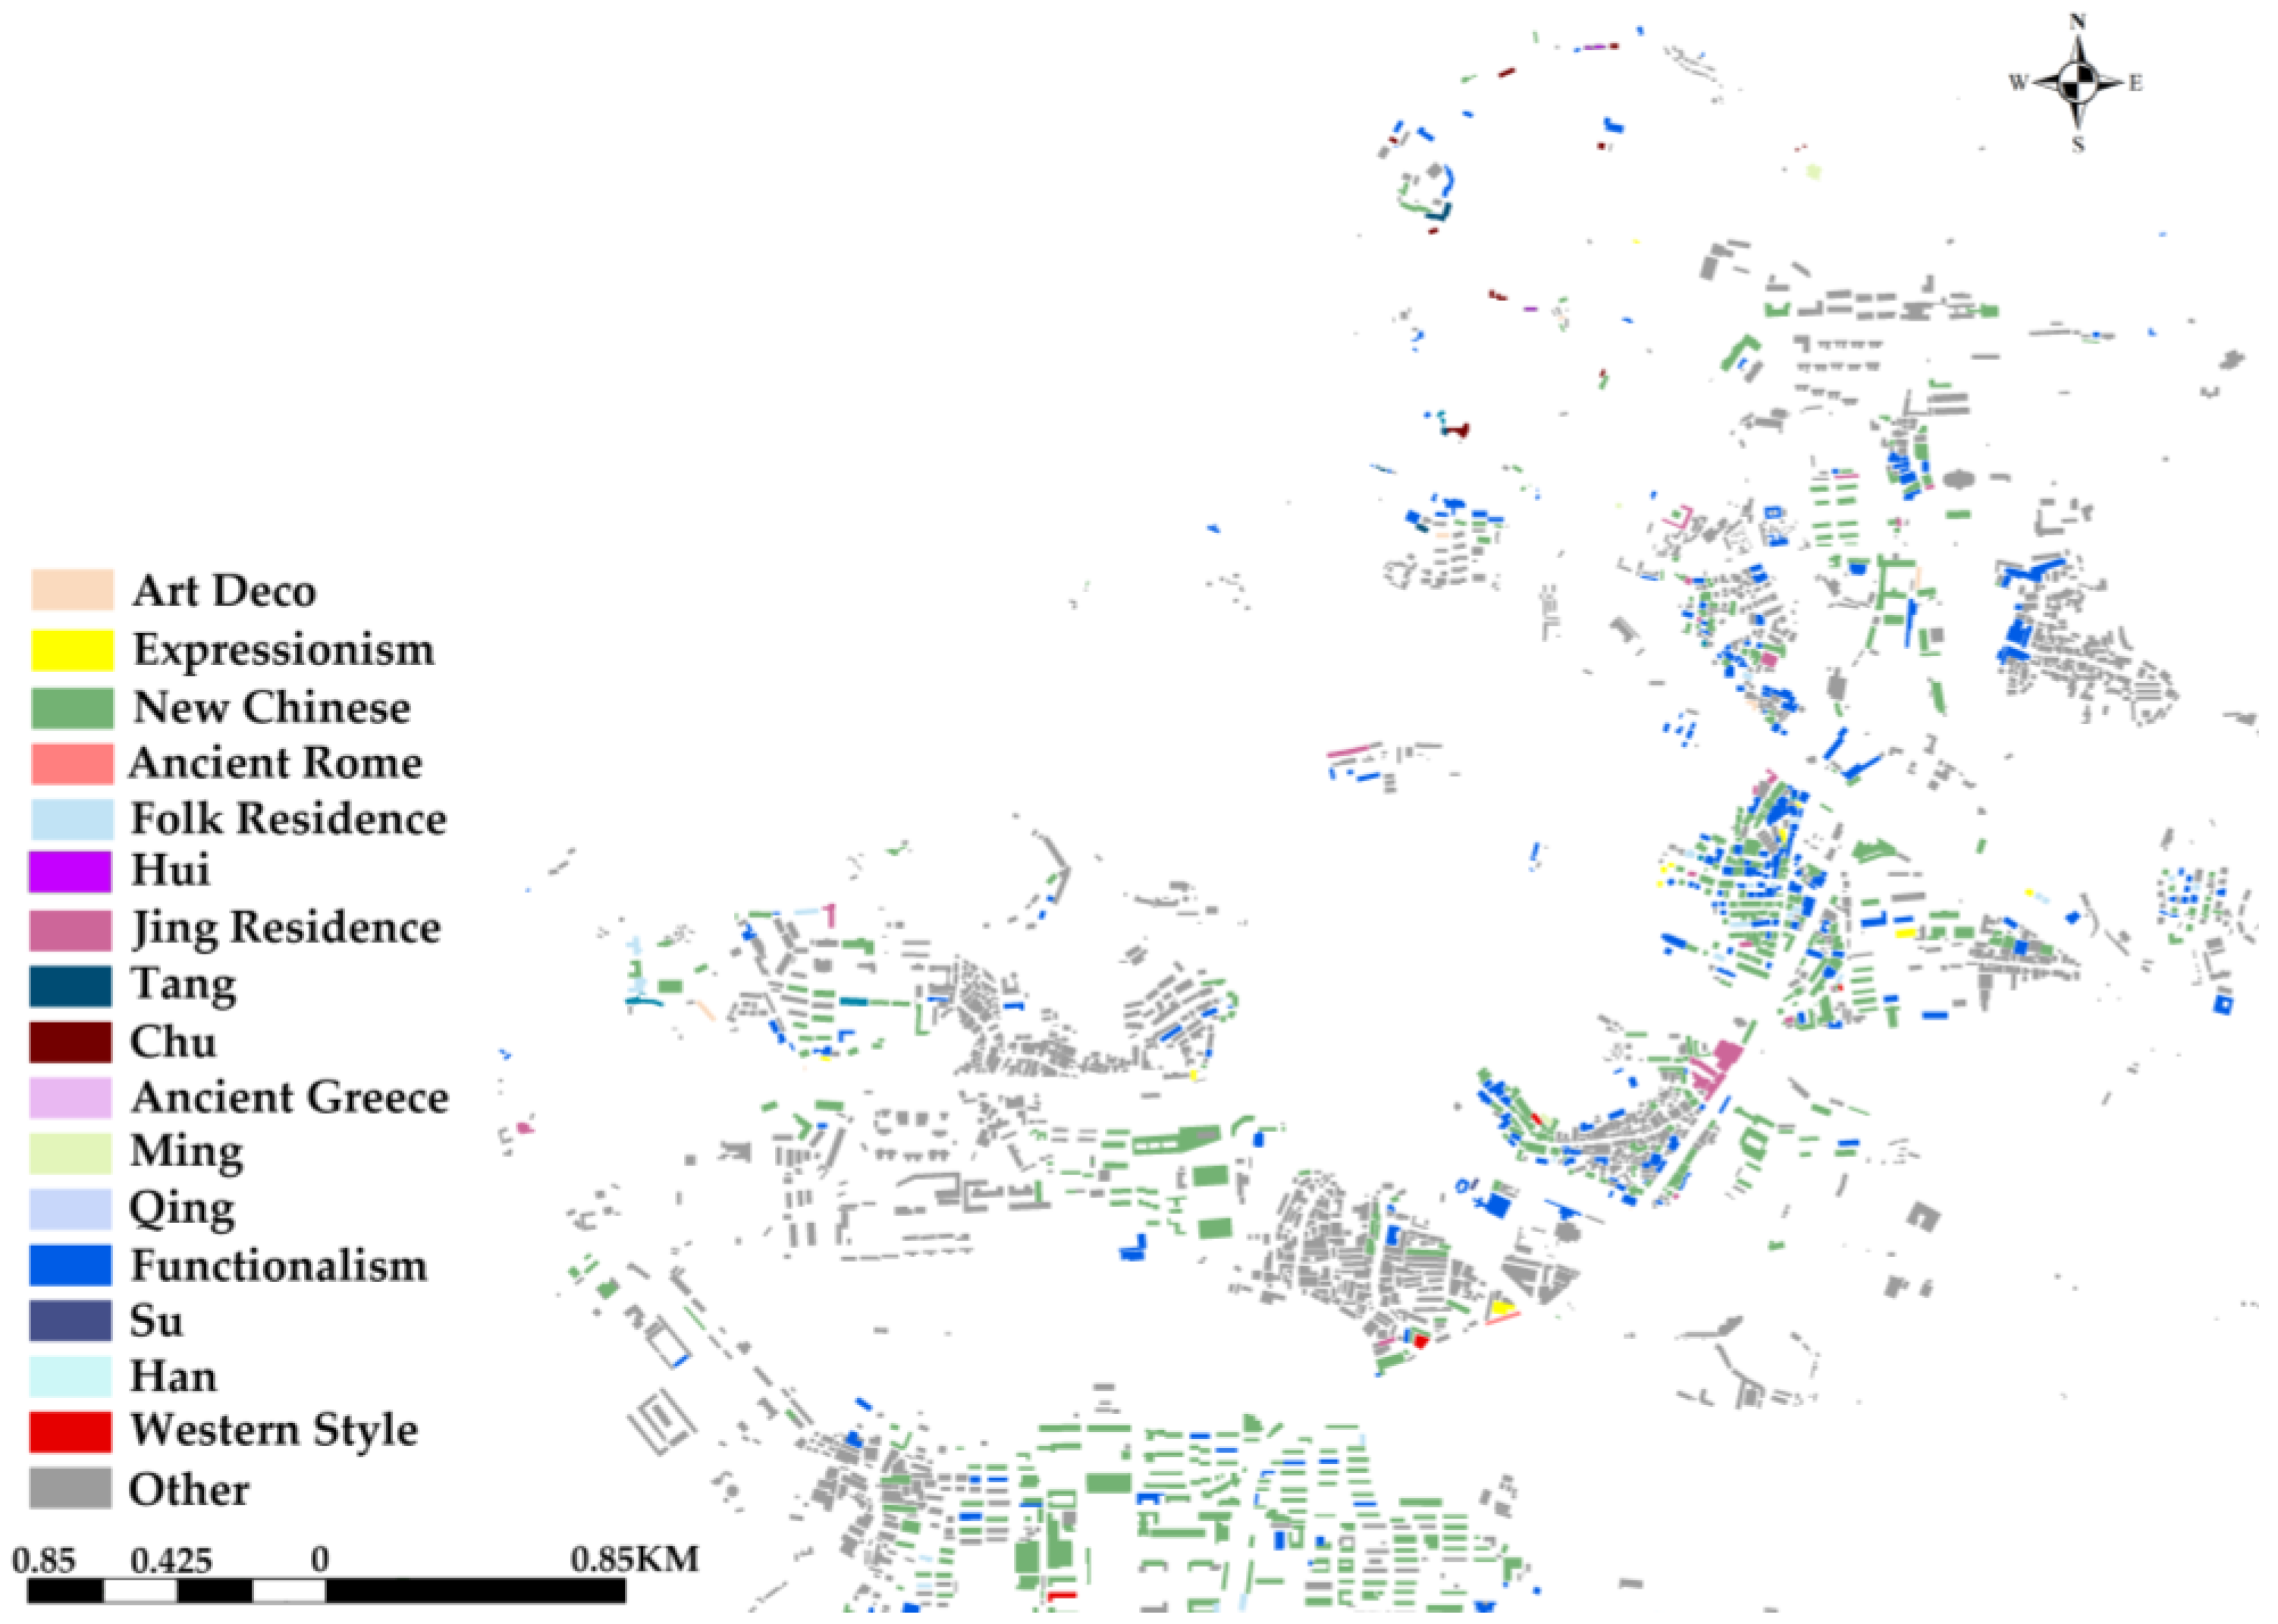
| Category | AP/% | Range |
|---|---|---|
| None | Q4 (0–25%) | |
| Art Deco | 0.4128 | |
| New Chinese | 0.4361 | Q3 (25–50%) |
| French Classicism | 0.4385 | |
| Baroque | 0.4828 | |
| Expressionism | 0.5379 | |
| Han | 0.5717 | |
| Gothic | 0.6316 | |
| Western-style | 0.6539 | Q2 (50–75%) |
| Chu | 0.6923 | |
| Su | 0.7219 | |
| Ancient Rome | 0.7336 | |
| Yuan | 0.7361 | |
| Ancient Greece | 0.7697 | |
| Ming | 0.7852 | |
| Folk Residence | 0.7861 | |
| Qing | 0.7959 | |
| Functionalism | 0.8412 | Q1(75–100%) |
| Hui | 0.8437 | |
| Song | 0.8673 | |
| Jing Residence | 0.8835 | |
| Byzantium | 0.8921 | |
| Tang | 0.8943 | |
| MAP | 0.7003 |
Disclaimer/Publisher’s Note: The statements, opinions and data contained in all publications are solely those of the individual author(s) and contributor(s) and not of MDPI and/or the editor(s). MDPI and/or the editor(s) disclaim responsibility for any injury to people or property resulting from any ideas, methods, instructions or products referred to in the content. |
© 2023 by the authors. Licensee MDPI, Basel, Switzerland. This article is an open access article distributed under the terms and conditions of the Creative Commons Attribution (CC BY) license (https://creativecommons.org/licenses/by/4.0/).
Share and Cite
Xu, H.; Sun, H.; Wang, L.; Yu, X.; Li, T. Urban Architectural Style Recognition and Dataset Construction Method under Deep Learning of street View Images: A Case Study of Wuhan. ISPRS Int. J. Geo-Inf. 2023, 12, 264. https://doi.org/10.3390/ijgi12070264
Xu H, Sun H, Wang L, Yu X, Li T. Urban Architectural Style Recognition and Dataset Construction Method under Deep Learning of street View Images: A Case Study of Wuhan. ISPRS International Journal of Geo-Information. 2023; 12(7):264. https://doi.org/10.3390/ijgi12070264
Chicago/Turabian StyleXu, Hong, Haozun Sun, Lubin Wang, Xincan Yu, and Tianyue Li. 2023. "Urban Architectural Style Recognition and Dataset Construction Method under Deep Learning of street View Images: A Case Study of Wuhan" ISPRS International Journal of Geo-Information 12, no. 7: 264. https://doi.org/10.3390/ijgi12070264
APA StyleXu, H., Sun, H., Wang, L., Yu, X., & Li, T. (2023). Urban Architectural Style Recognition and Dataset Construction Method under Deep Learning of street View Images: A Case Study of Wuhan. ISPRS International Journal of Geo-Information, 12(7), 264. https://doi.org/10.3390/ijgi12070264