Article

Interactive Thematic Map as a Means of Documenting and Visualizing Information about Cultural Heritage Objects

by
Tymoteusz Horbiński
* and
Maciej Smaczyński
Department of Cartography and Geomatics, Adam Mickiewicz University, 61-712 Poznań, Poland
*
Author to whom correspondence should be addressed.
ISPRS Int. J. Geo-Inf. 2023, 12(7), 257; https://doi.org/10.3390/ijgi12070257
Submission received: 20 April 2023 / Revised: 14 June 2023 / Accepted: 19 June 2023 / Published: 27 June 2023

Abstract

:
Technological progress in recent decades has made it possible to develop the process of documentation and visualization of cultural heritage objects. Despite numerous studies dealing with the documentation of cultural heritage objects, no standardized research methodology has yet been developed in this field. The interest of many specialists from different fields carrying out different work related to the documentation of cultural heritage objects has resulted in a large amount of data, which causes problems in its processing and visualization. As a rule, researchers focus on one method of data collection and, consequently, on one type of data visualization. The documentation of cultural heritage is very important. Therefore, the authors of this article have aimed to develop a methodological data collection process for the documentation and visualization of information about cultural heritage objects. This is particularly important in light of the development of new methods of measuring and inventorying cultural heritage objects, such as laser scanning or low-level aerial photogrammetry. The authors recognize the need to systematize the methodology of collecting and processing data on cultural heritage objects. In addition, it is critical to develop a methodology for visualizing the acquired data using terrestrial laser scanning (TLS) and unmanned aerial vehicle (UAV) technology. One of the most important assumptions of the article is to have universally understandable information about the object. The type of documentation and visualization of information developed in the article will be an interactive thematic map (using Leaflet.js and Three.js). Such a map will allow to collect and visualize all kinds of data, from attribute data to 3D models.

1. Introduction

Cultural heritage includes everything we have inherited from previous generations. It is a valuable asset that links the past to the present. For many countries, it is both part of the national identity and an important economic engine. However, cultural heritage is constantly threatened by natural and anthropogenic factors. Therefore, the documentation of cultural heritage is very important. Registering all elements of cultural heritage has many advantages when it comes to understanding its intrinsic value, assessing its significance, and preserving and managing it [1].
The documentation of architectural and archaeological objects and monuments is an activity for which information must be obtained from various sources [2]. One of these is direct field measurements using geodetic techniques. The use of geodetic measurements in archaeological research to produce accurate maps or topographic and architectural plans of research sites has been used for a long time, and geodetic measurements are now a standard procedure in archaeological work. With the development of measurement technology, the methodology of archaeological inventory and the measurement techniques used have also changed. In the past, the basic measuring instruments used at archaeological sites were a tape measure and a leveling instrument [3]. One of the most advanced optical instruments of the past, used since antiquity, i.e., since the 16th century, was the theodolite [3]. The theodolite, as a measuring instrument stabilized with a tripod, was used to measure horizontal and vertical angles to determine the mutual position of points on an archaeological site. In the second half of the 20th century, it was replaced by an electronic total station (Total Station Theodolite (TST)), which, in comparison to the theodolite, was additionally equipped with a rangefinder and enabled the recording of measurement data in the memory of the instrument [4]. An additional simplification in carrying out measurements was the development of measurement in the reflectorless system, which made it possible to carry out measurements without the use of a geodetic prism [5]. With the development of computer software, it became possible to transfer the measurement results into special software and to create a digital map of the archaeological site. Electronic total stations are most commonly used by archaeologists to measure the location of individual artifacts and to calculate the height of individual objects.
Electronic total stations, commonly used in archaeological work, are increasingly being replaced by the latest geodetic instruments, which allow detailed 3D modeling in a short time and make the models created available via digital products [6]. Currently, this is possible thanks to the use of LiDAR technology [7,8] and photogrammetry [9,10,11,12,13,14,15]. Airborne laser scanning (ALS—Airborne Laser Scanning) or LiDAR (Light Detection And Ranging) [16] has proven to be a real breakthrough in archaeological research. This technology has supplemented aerial photography as the primary data source for topographic mapping. In addition, airborne laser scanning allows for the acquisition of data with a ground sampling distance of <1 m, which is then used to generate DEM and DTM with high resolution that can be successfully used to investigate the relationships between archaeological remains and their surroundings [3]. This approach, known as landscape archaeology, is deservedly gaining popularity among scientists. Laser scanning technology can be used to create detailed point clouds. Terrestrial Laser Scanning (TLS), in particular, provides accurate coverage of the environment. However, its range is much shorter compared to airborne scanning (ALS), so it can be used to record objects in smaller areas, i.e., within archaeological research sites. Laser scanners are invaluable for obtaining precise spatial data in the field of recording cultural heritage objects. They are particularly important from an architectural point of view and are used for inventories of architectural, technical, and industrial objects. Precise data from laser scanning can be the basis for documenting a specific object, which is very important for the proper maintenance, management, and repair of culturally valuable structures [17,18].
Another source of data that enables the creation of 3D models is photogrammetric studies based on images taken from low altitudes by an unmanned aerial platform. Low-level aerial photogrammetry, which allows the creation of high-quality 3D models thanks to digital image processing, allows you to collect photographs that, in addition to being a source for creating a 3D model, are also photographic documentation of cultural heritage objects [19,20].
Data acquisition methods allow the development of advanced visualizations, such as 3D models, which are very difficult to create using traditional cartographic methods of field mapping and simple measurements [21]. The methods of laser and photogrammetric 3D data acquisition are non-invasive, prevent damage to archaeological objects and enable digital documentation and visualization of geometry [22].
One of the new ways of representing data on historical and cultural heritage objects is Historic Building Information Modeling (HBIM) [23]. The literature on architectural history points to problems related to the lack of standardization of processes related to the documentation of cultural heritage objects, the dispersion of information, and the use of outdated tools [24]. Many specialists from different fields, such as archaeology, architecture, civil engineering, and geodesy, are working on the development of cultural heritage documentation [25]. Usually, specialists with different backgrounds work separately rather than in teams, resulting in different and often duplicated work that produces scattered, different types and formats of data on cultural heritage objects [26,27,28]. Considering the above problems, the literature on this topic points to the need to develop and expand new methods for managing cultural heritage data [29,30]. In addition to the problems associated with the lack of a developed methodology in the inventory of cultural heritage objects, more and more new measurement data is being generated. The continuous development of modern measurement methods, such as laser scanning or low-altitude photogrammetry, means that researchers are able to generate more and more measurement data every day in an ever shorter time. From the issues outlined in the introduction, there is a need to develop a research process and determine the tools and their usefulness for the acquisition, processing, management, and visualization of cultural heritage objects. Such research will help to facilitate the archiving of the current state of individual cultural heritage objects, record their condition, and, if necessary, to enable their reconstruction. In addition, the development of a coherent and unified research methodology related to the collection, management, and visualization of data on cultural heritage objects has a direct impact and importance on the decision-making process related to their management and immediate environment.
Creating accurate 3D models using the latest measurement techniques presents several challenges. The first aspect is the selection and application of appropriate methods of cartographic representation to effectively present a given object. The second aspect is the possibilities related to the implementation of the created 3D model in technological environments that allow the further presentation of the data and its dissemination to the largest possible audience. The aim of this article is to develop a methodology for optimizing and collecting data on cultural heritage objects and visualizing them in the Internet environment.

2. Related Works

Various studies related to cultural heritage registration have looked at the different uses and benefits of documentation. For example, 3D documentation technology has been used to record the tangible features of urban morphology and architectural typology. Scans were used to capture and document the physical environment of the abandoned village of Tinbak in Qatar. The research conducted by Ferwati et al. [31] was enriched by documenting oral testimonies (residents of the area) and photographic records.
In the article by Sanchez–Calvillo et al. [32], cultural heritage in the form of vernacular architecture in the state of Michoacan (Mexico) was documented using audiovisual methods and documentary film. The research was based on the fieldwork that contributed to the film but also on the documentation and analysis of this endangered cultural heritage. The main product, however, was a documentary film in which a society that still lives and maintains vernacular architecture also played a major role.
An interactive thematic map was used by Lorek and Horbiński [33] to visualize and document the changes at the European A1/A4. By analyzing archival cartographic sources, the authors of this study were able to present individual spatial changes to both the roads and the interchange itself. Based on six archival maps, they presented almost 200 years of history of this important traffic junction.
High-resolution measurement data quickly found application in research on the discovery of archaeological remains and in cultural heritage work [34,35,36]. The research carried out has shown that in areas where there were walls and ditches in the past, which were once described in detail and of which no traces remain today, these could be made visible as small changes in the height of the terrain using LiDAR data [37]. In addition, it should be emphasized that the LiDAR sensor allows the registration of multiple signals of the reflected laser pulse, which makes it possible to record the land surface under the tree canopies [38,39,40]. This makes LiDAR a valuable source of 3D information for the discovery of archaeological remains in forested areas, where other exploration methods largely fail.
Due to the destruction of culturally valuable objects, more and more work has been devoted to the inventory and presentation of cultural heritage objects in recent years. Research on the reconstruction and presentation of cultural heritage objects in virtual reality has been presented by Lütjens et al. [41], Walmsley and Kersten [42], and Büyüksalih et al. [43], among others. In such work, it is very important to use different available data, e.g., analog historical documentation and digital spatial data. An example of such an approach is the research to create an immersive virtual reality for the residence of the first rulers of the Piast dynasty on a spar at Lake Lednica (Ostrów Lednicki) in Poland [44]. The geovisualization in the form of a virtual reality walk in a cultural heritage site was evaluated by a group of experts in the field of the Middle Ages and by a group of role-players.
An example of the use of Historic Building Information Modelling (HBIM) technology is the work of Carvajal-Ramírez et al. [45], who undertook a survey of the ruins of Cortijo del Fraile in Spain. The research used photogrammetric data from low-level aerial vehicles (UAV) for a detailed inventory of the structure. The researchers then developed models in the software CAD and carried out texturing.
In summary, there are many techniques for obtaining data on cultural property. Each of these techniques makes it possible to obtain different spatial data of a given object, which in turn determines the possibility of developing different visualizations and forms of representation of data and the object.

3. Methodology

3.1. Obtaining Information about Cultural Heritage Objects

The literature review above has shown that information about cultural heritage properties can be obtained and visualized in many ways. The main methods of data collection include:
  • archival and current maps and databases [46],
  • historical documentation, scientific studies [21],
  • field survey, photographic documentation, traditional measurement methods [3,4],
  • UAV, laser scanning [17,18,19,20].
The correct acquisition, collection, and processing of data determine the possibility of their correct visualization. The research undertaken by the authors in relation to the process of data acquisition of cultural heritage objects is a key aspect in working towards the visualization of these data. In addition, the way the data is collected and presented is important and influences the possibility of sharing and dissemination.
In this methodological approach, the authors focus on topographical objects such as windmills from the Wielkopolska region. According to the research by Lorek [47], the windmill belongs to a group of objects that formed the cultural landscape of Wielkopolska in the nineteenth and twentieth centuries. Over the next years, as a result of economic changes, these objects lost their importance and disappeared from space. Currently, relatively few windmills are legally protected, despite the fact that they are important objects of the cultural heritage of the region [46], so it is important to document and visualize information about them in order to promote social knowledge and effectively protect this element of cultural heritage.

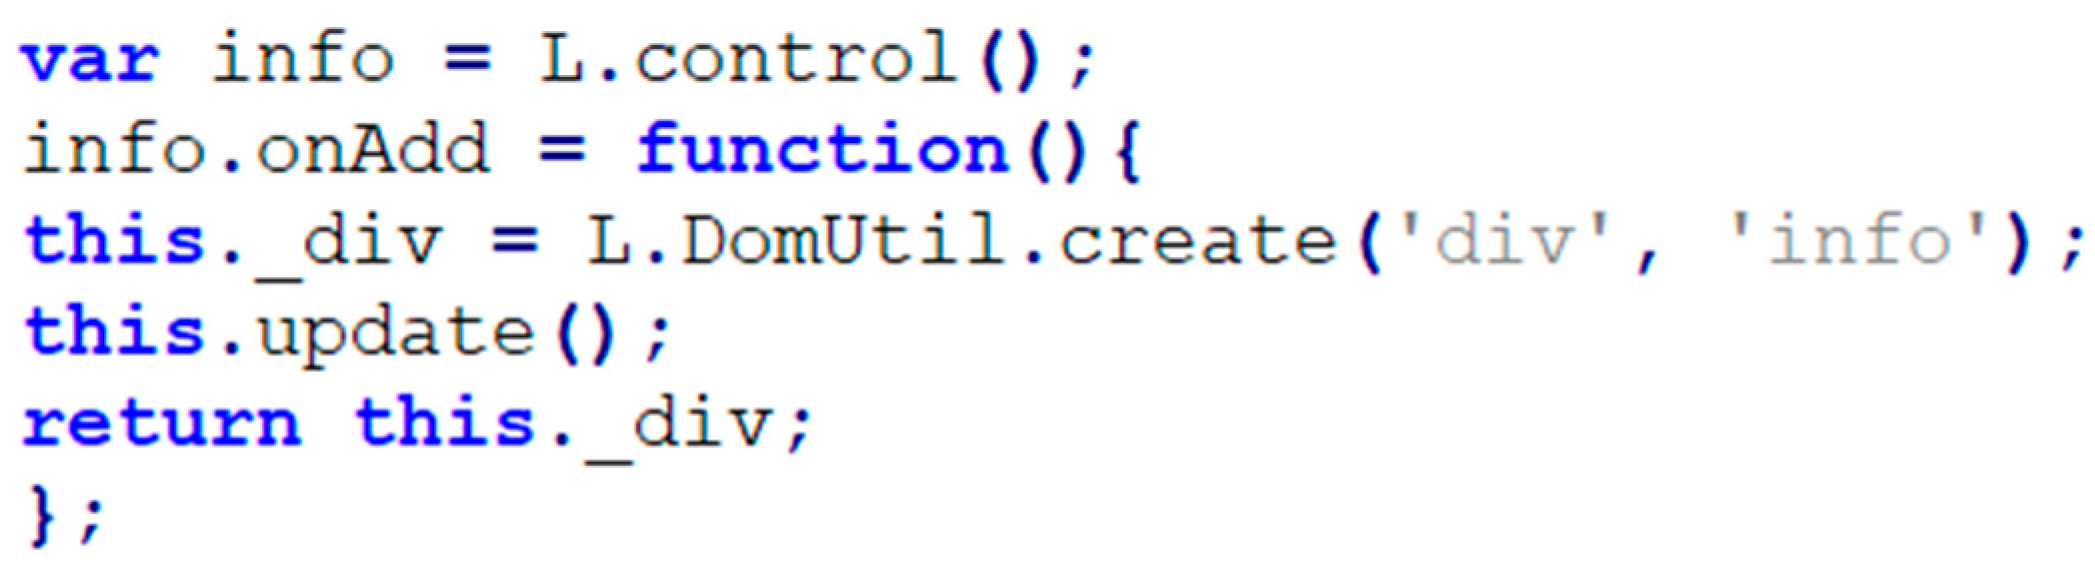
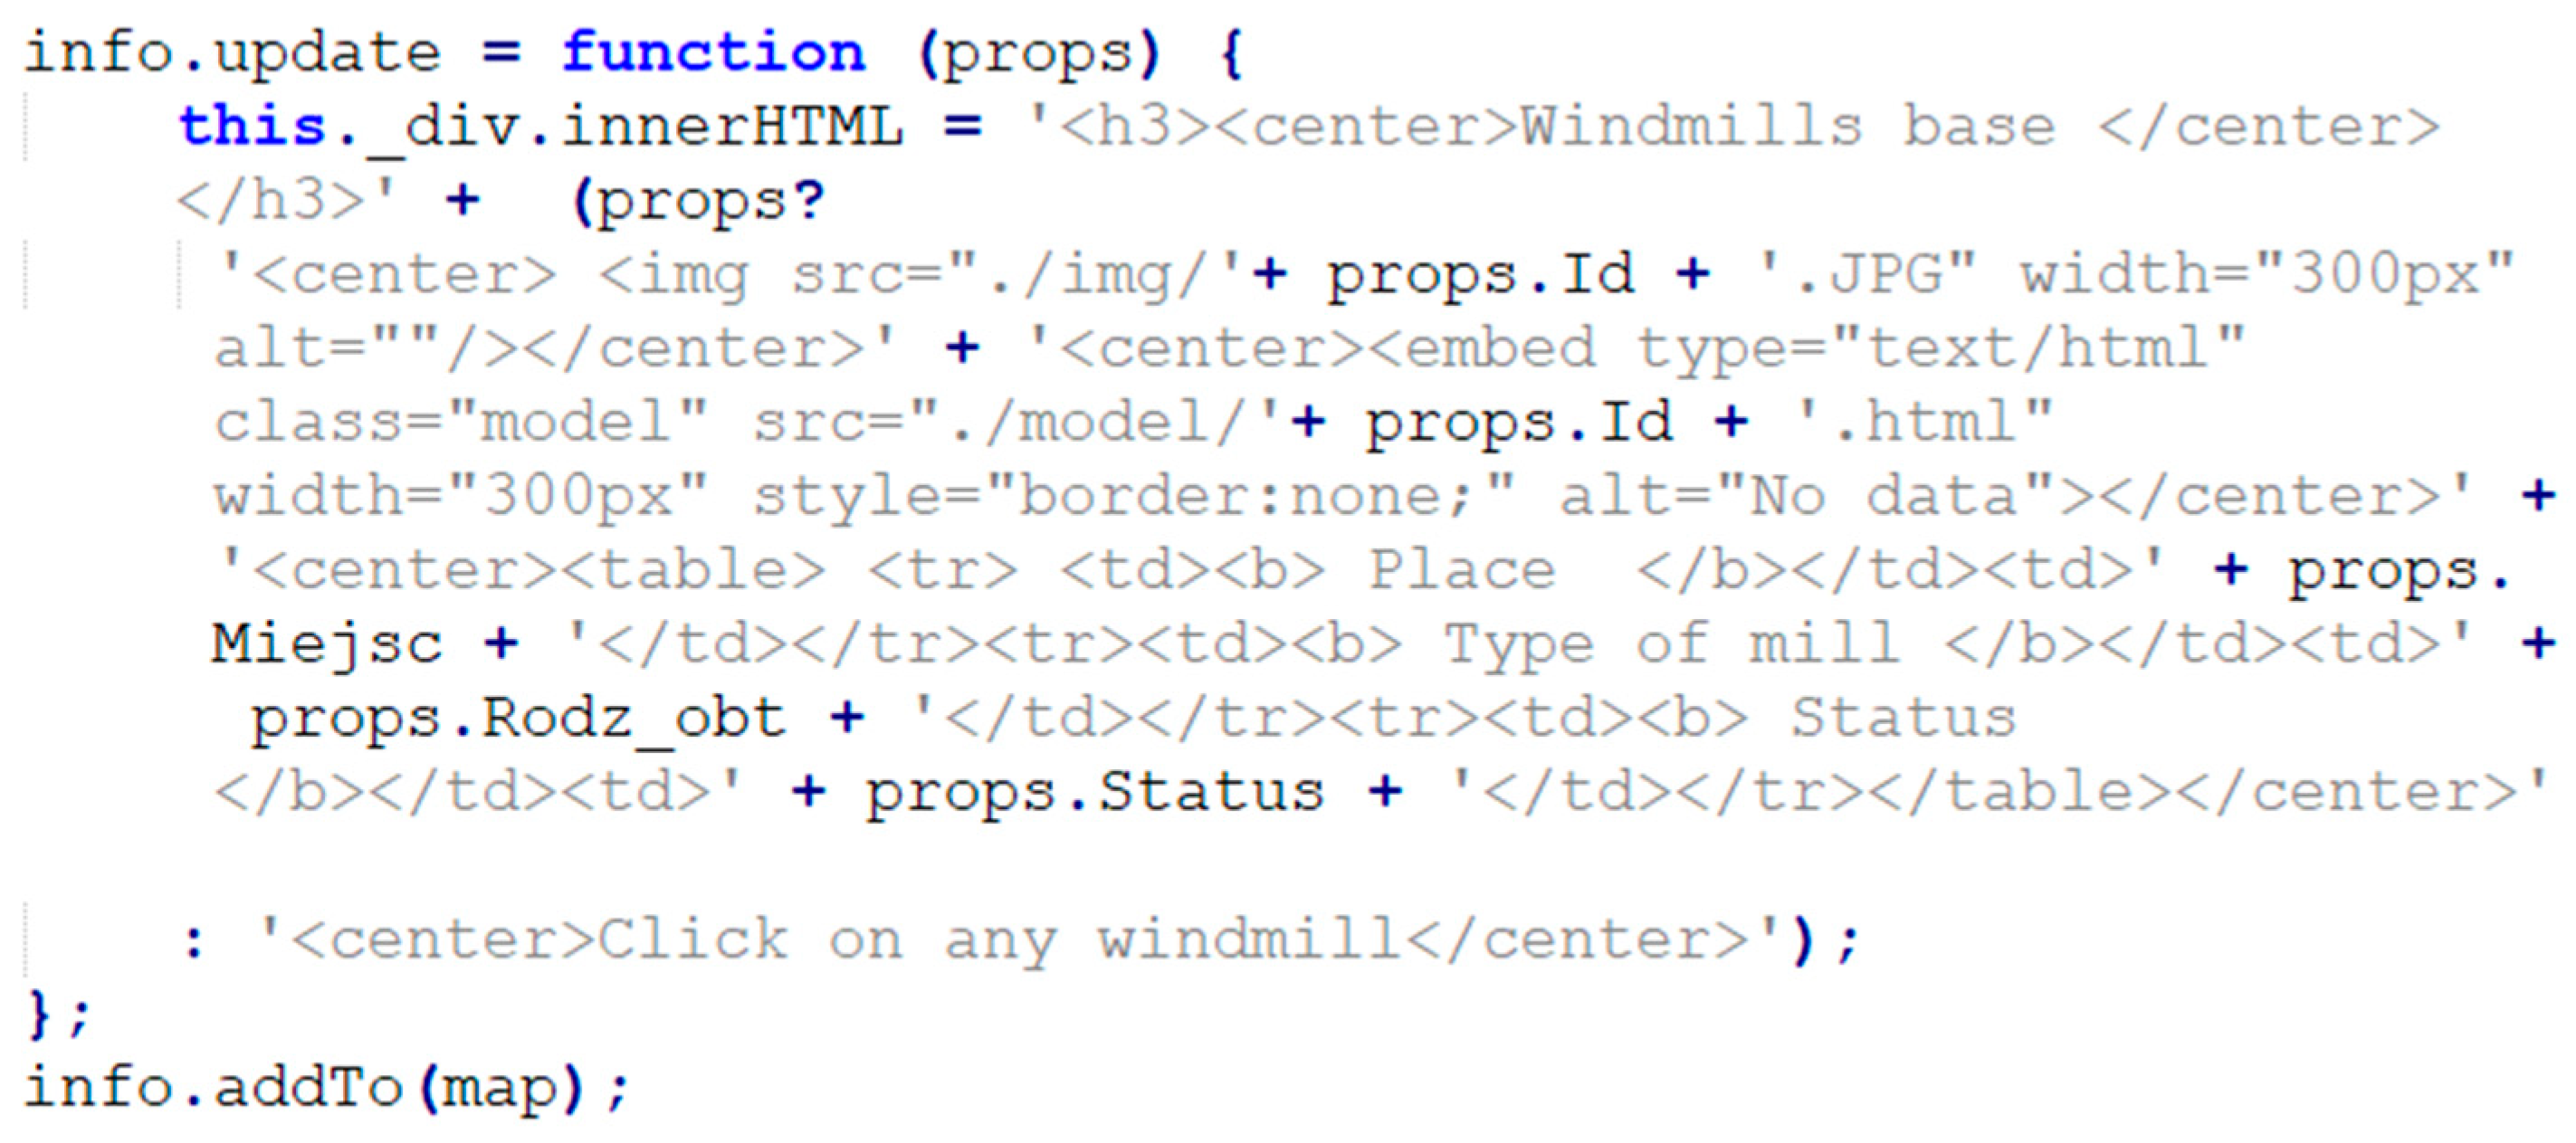
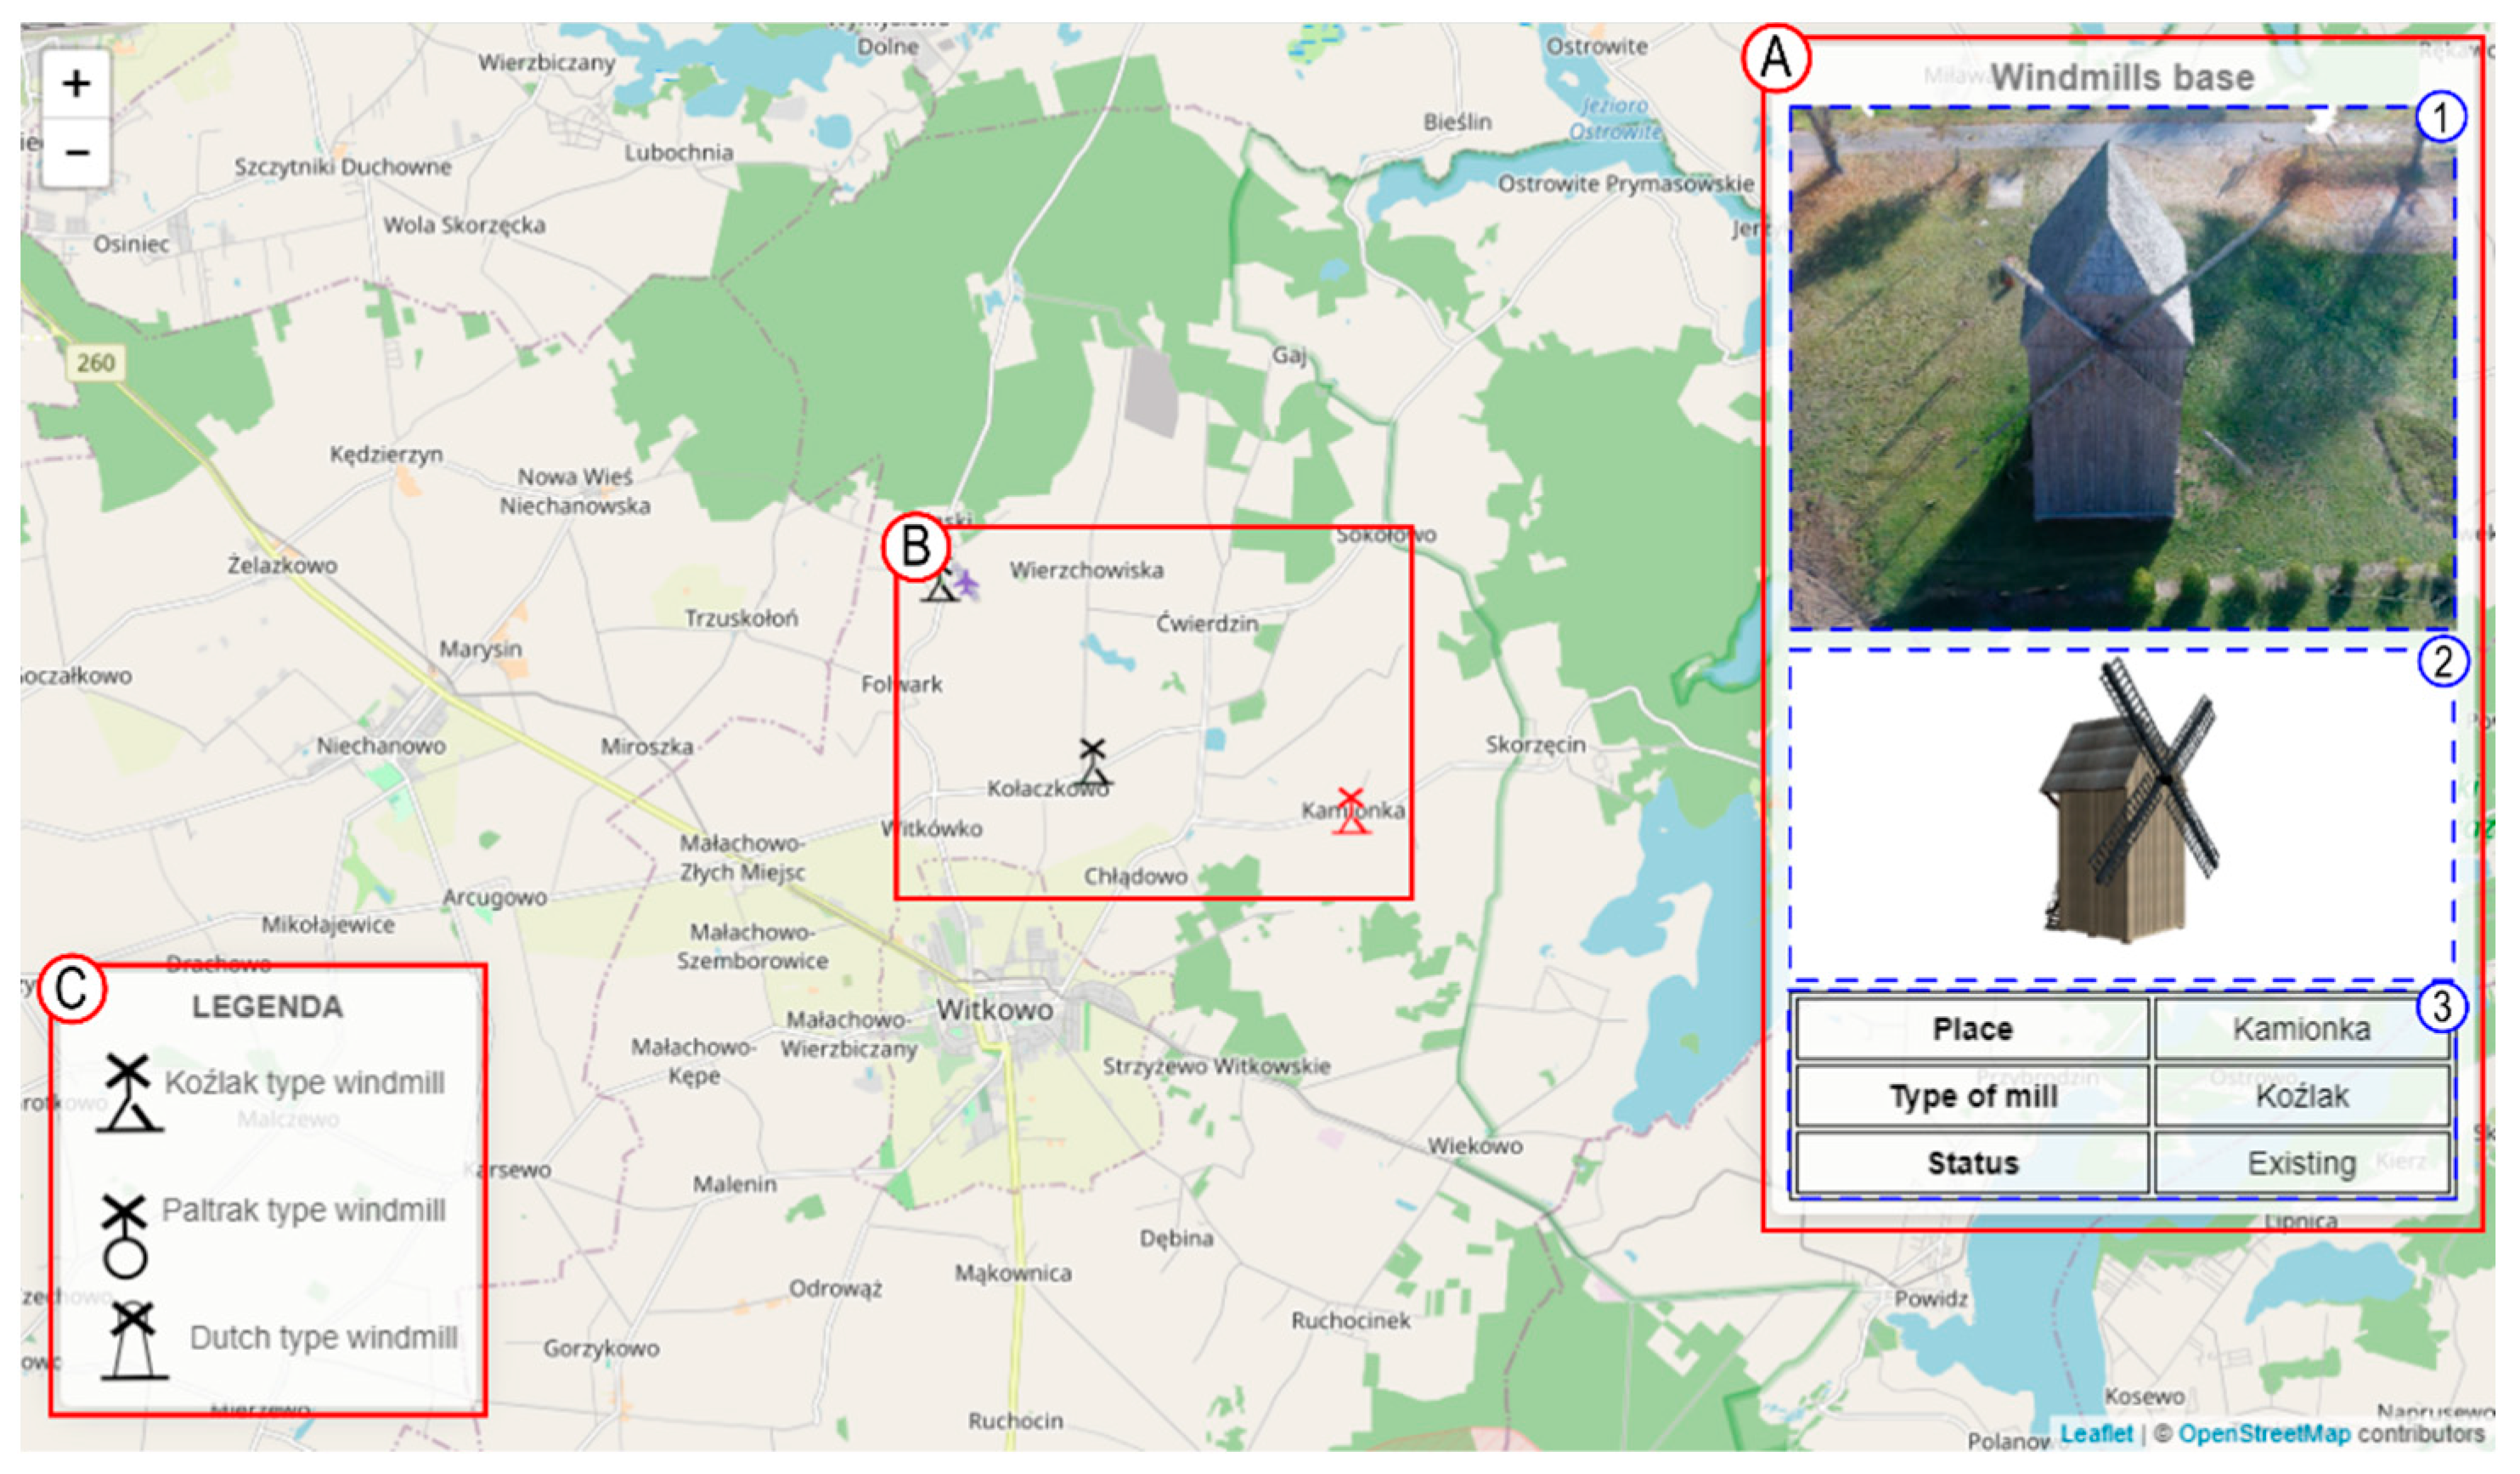
3.2. Visualization of Information about Cultural Heritage Objects—Map

The basic requirement for this article is that the data on cultural heritage objects is available in one of the geo-information file formats, e.g., SHP (and the associated .dbf .shx .prj .cpg files). The database created in this way contains both site data and attribute data. The first and, at the same time, an essential step in these activities is the conversion of the files into the geoJSON standard [33]. This will allow faster and easier integration of the data into an interactive thematic map (one file), and at the same time, it will be possible to reference both geographic (geometry) and attribute (properties) data in a relatively simple way.
The next step is to create a map using the Leaflet.js [48]. To create such a map, you need basic knowledge of HTML and CSS as well as the ability to use existing scripts and plugins in JavaScript in connection with the Leaflet library [49]. An example of creating such a map was described in more detail in an earlier article by Horbiński and Lorek [50] and will therefore not be the subject of this article.
If you already have a map created with the Leaflet.js, you should embed the data from the geoJSON file. We assign the data from the file to any named variable and add it to the map as described below (Figure 1).
In relation to the added layer option, we can declare the appearance of markers (pointToLayer) or the display of information after pressing the marker (onEachFeature).
One of the most important stages of the methodological approach presented is to create a place for information and multimedia. With the following code, you can create a div class = “info” that will be created and updated together with the event HTML DOM in combination with the option onEachFeature. This event will be onclick, i.e., when clicking on any visualized object on the map (Figure 2).
The contents of the information window are shown below. Each time you click for the first time on a point object on the map, the content is updated according to the adopted scheme using the div property innerHTML created earlier. The authors used the conditional (ternary) operator that displays the text ‘Click on any pinwheel’ in the information window before the first click on the object occurs. After clicking on any object on the map, the information window is then updated. Thanks to the data stored in the geoJSON file, it is possible to reference keys, e.g., Id and extract attribute information. In order to automate the loading of photos and 3D models, the file names should be identical to the Id (or another existing key). The tag was used to load the image and the tag for the model. The attribute data were summarized in a table (Figure 3).
Data about objects should be unified with respect to all attribute information. Of course, in the absence of information, the logical operator coalescing (??) can be used, but you must still remember to mark the absence of data in some way, e.g., with null (Figure 4).
The logical coalescence operator (??) displays no data every time props.Id is null or undefined.
The graphic appearance of the window in the style.css file is based only on the specification of padding, font, and color. The height of the window is relative to the amount of information, while the width determines the largest object displayed. In the case of the code above, it is 300 px, which is declared in both the tag that specifies the width of the photo and the tag that specifies the width of the window display for the 3D model. The width of the window will always be larger than the specified size of the elements because of the paddings specified for div class = “info”.

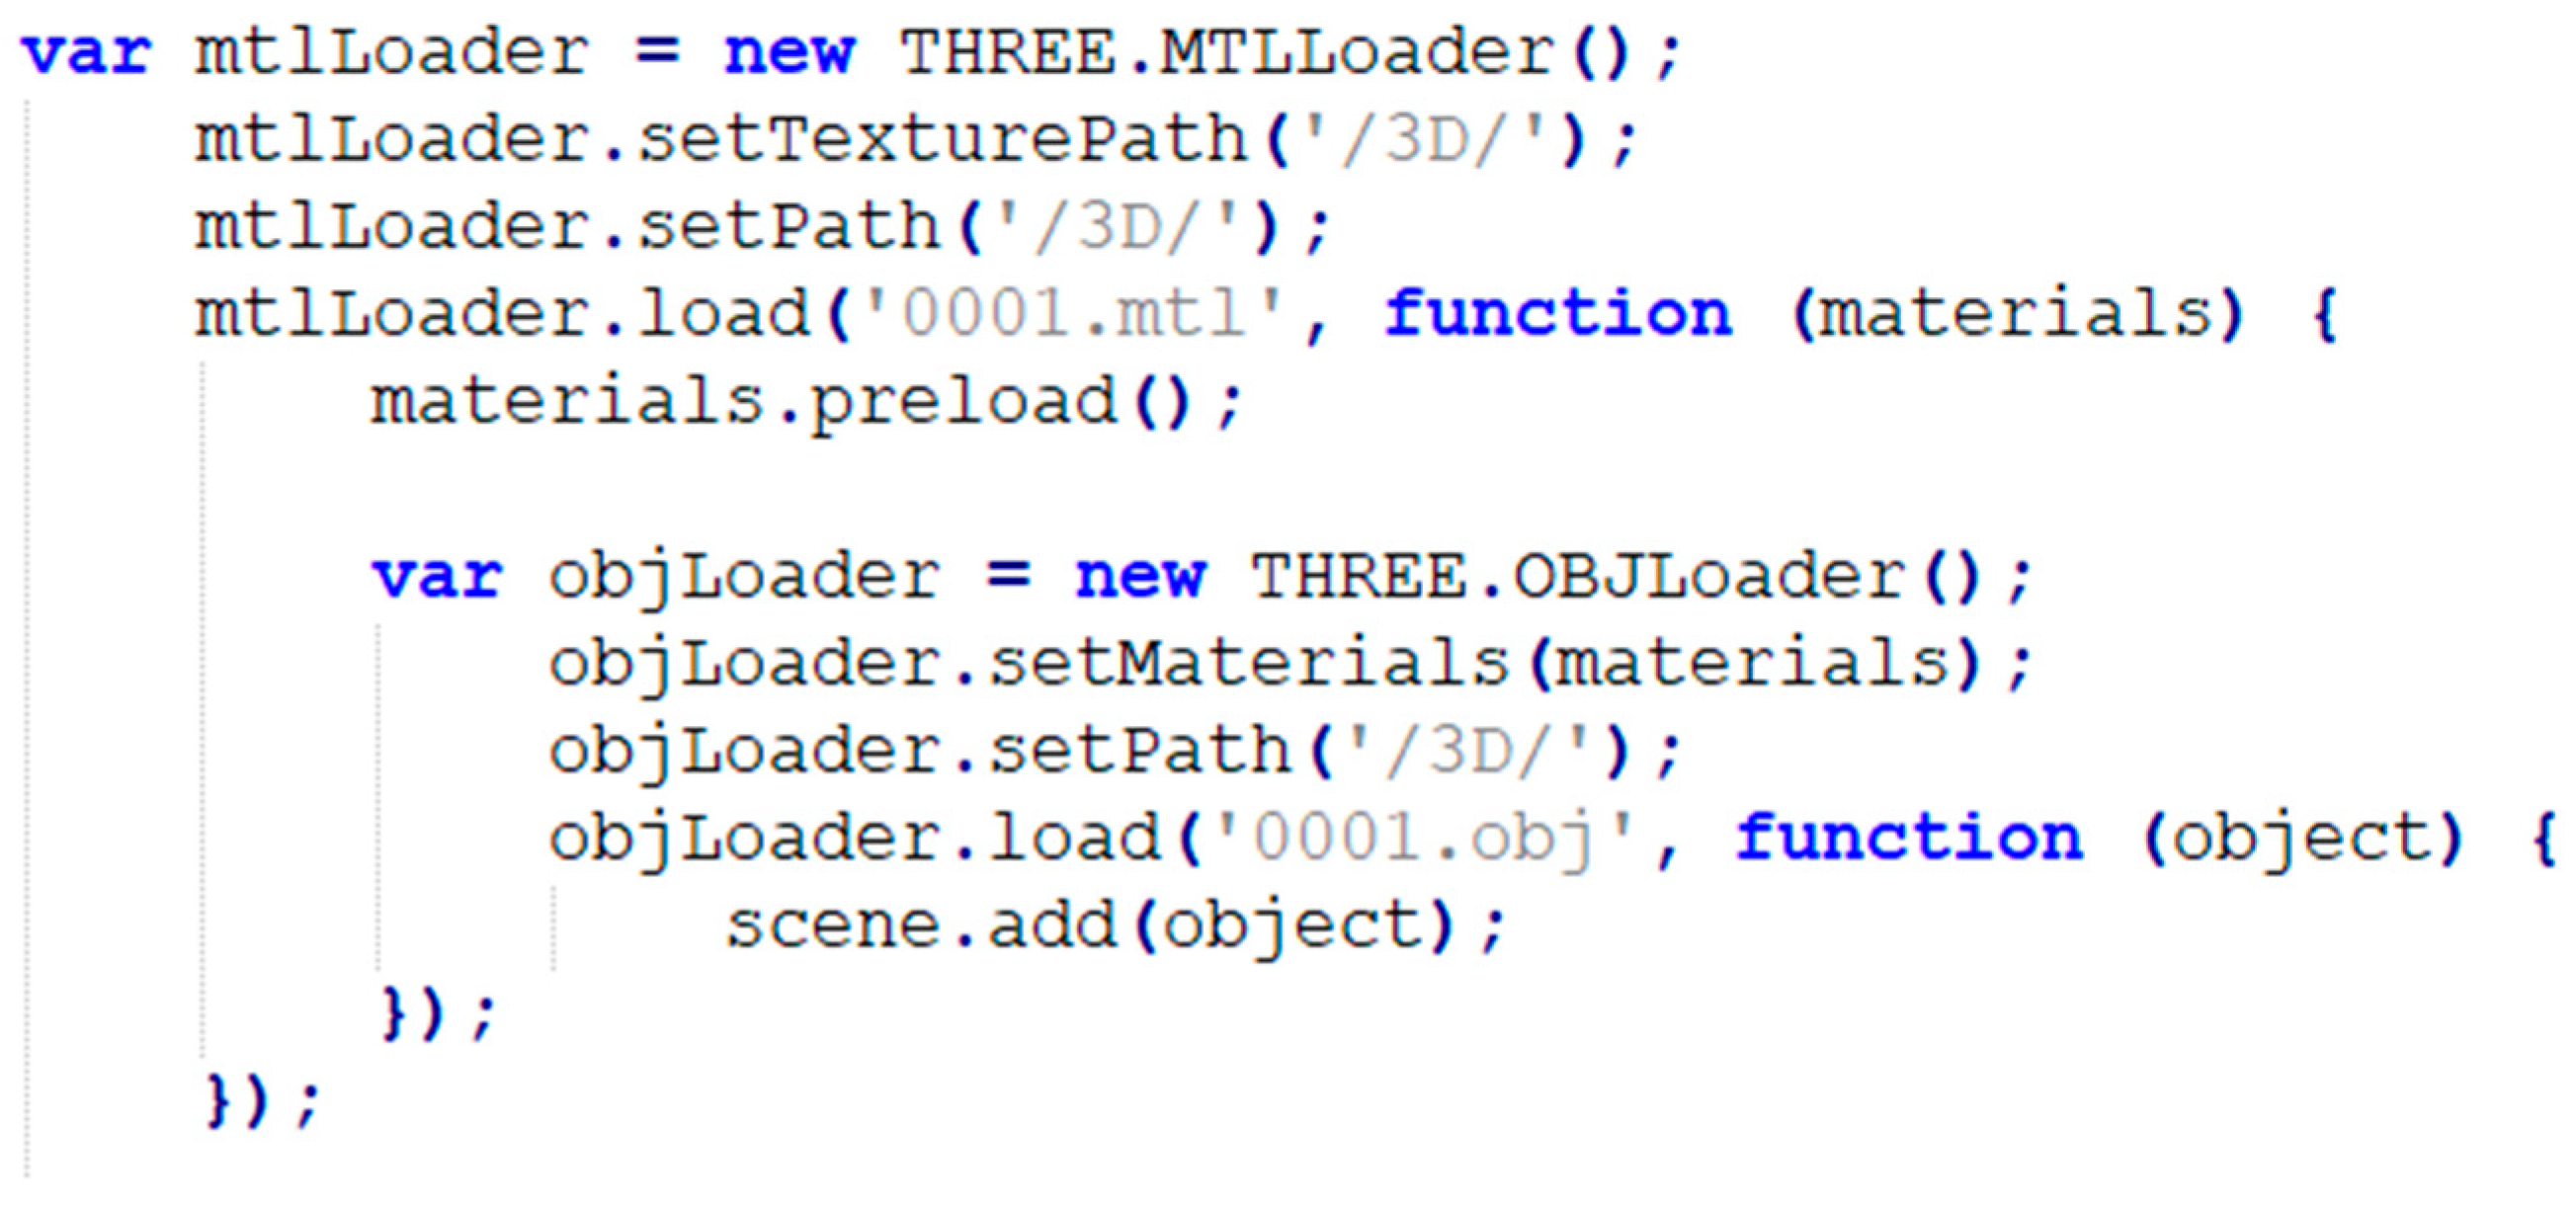
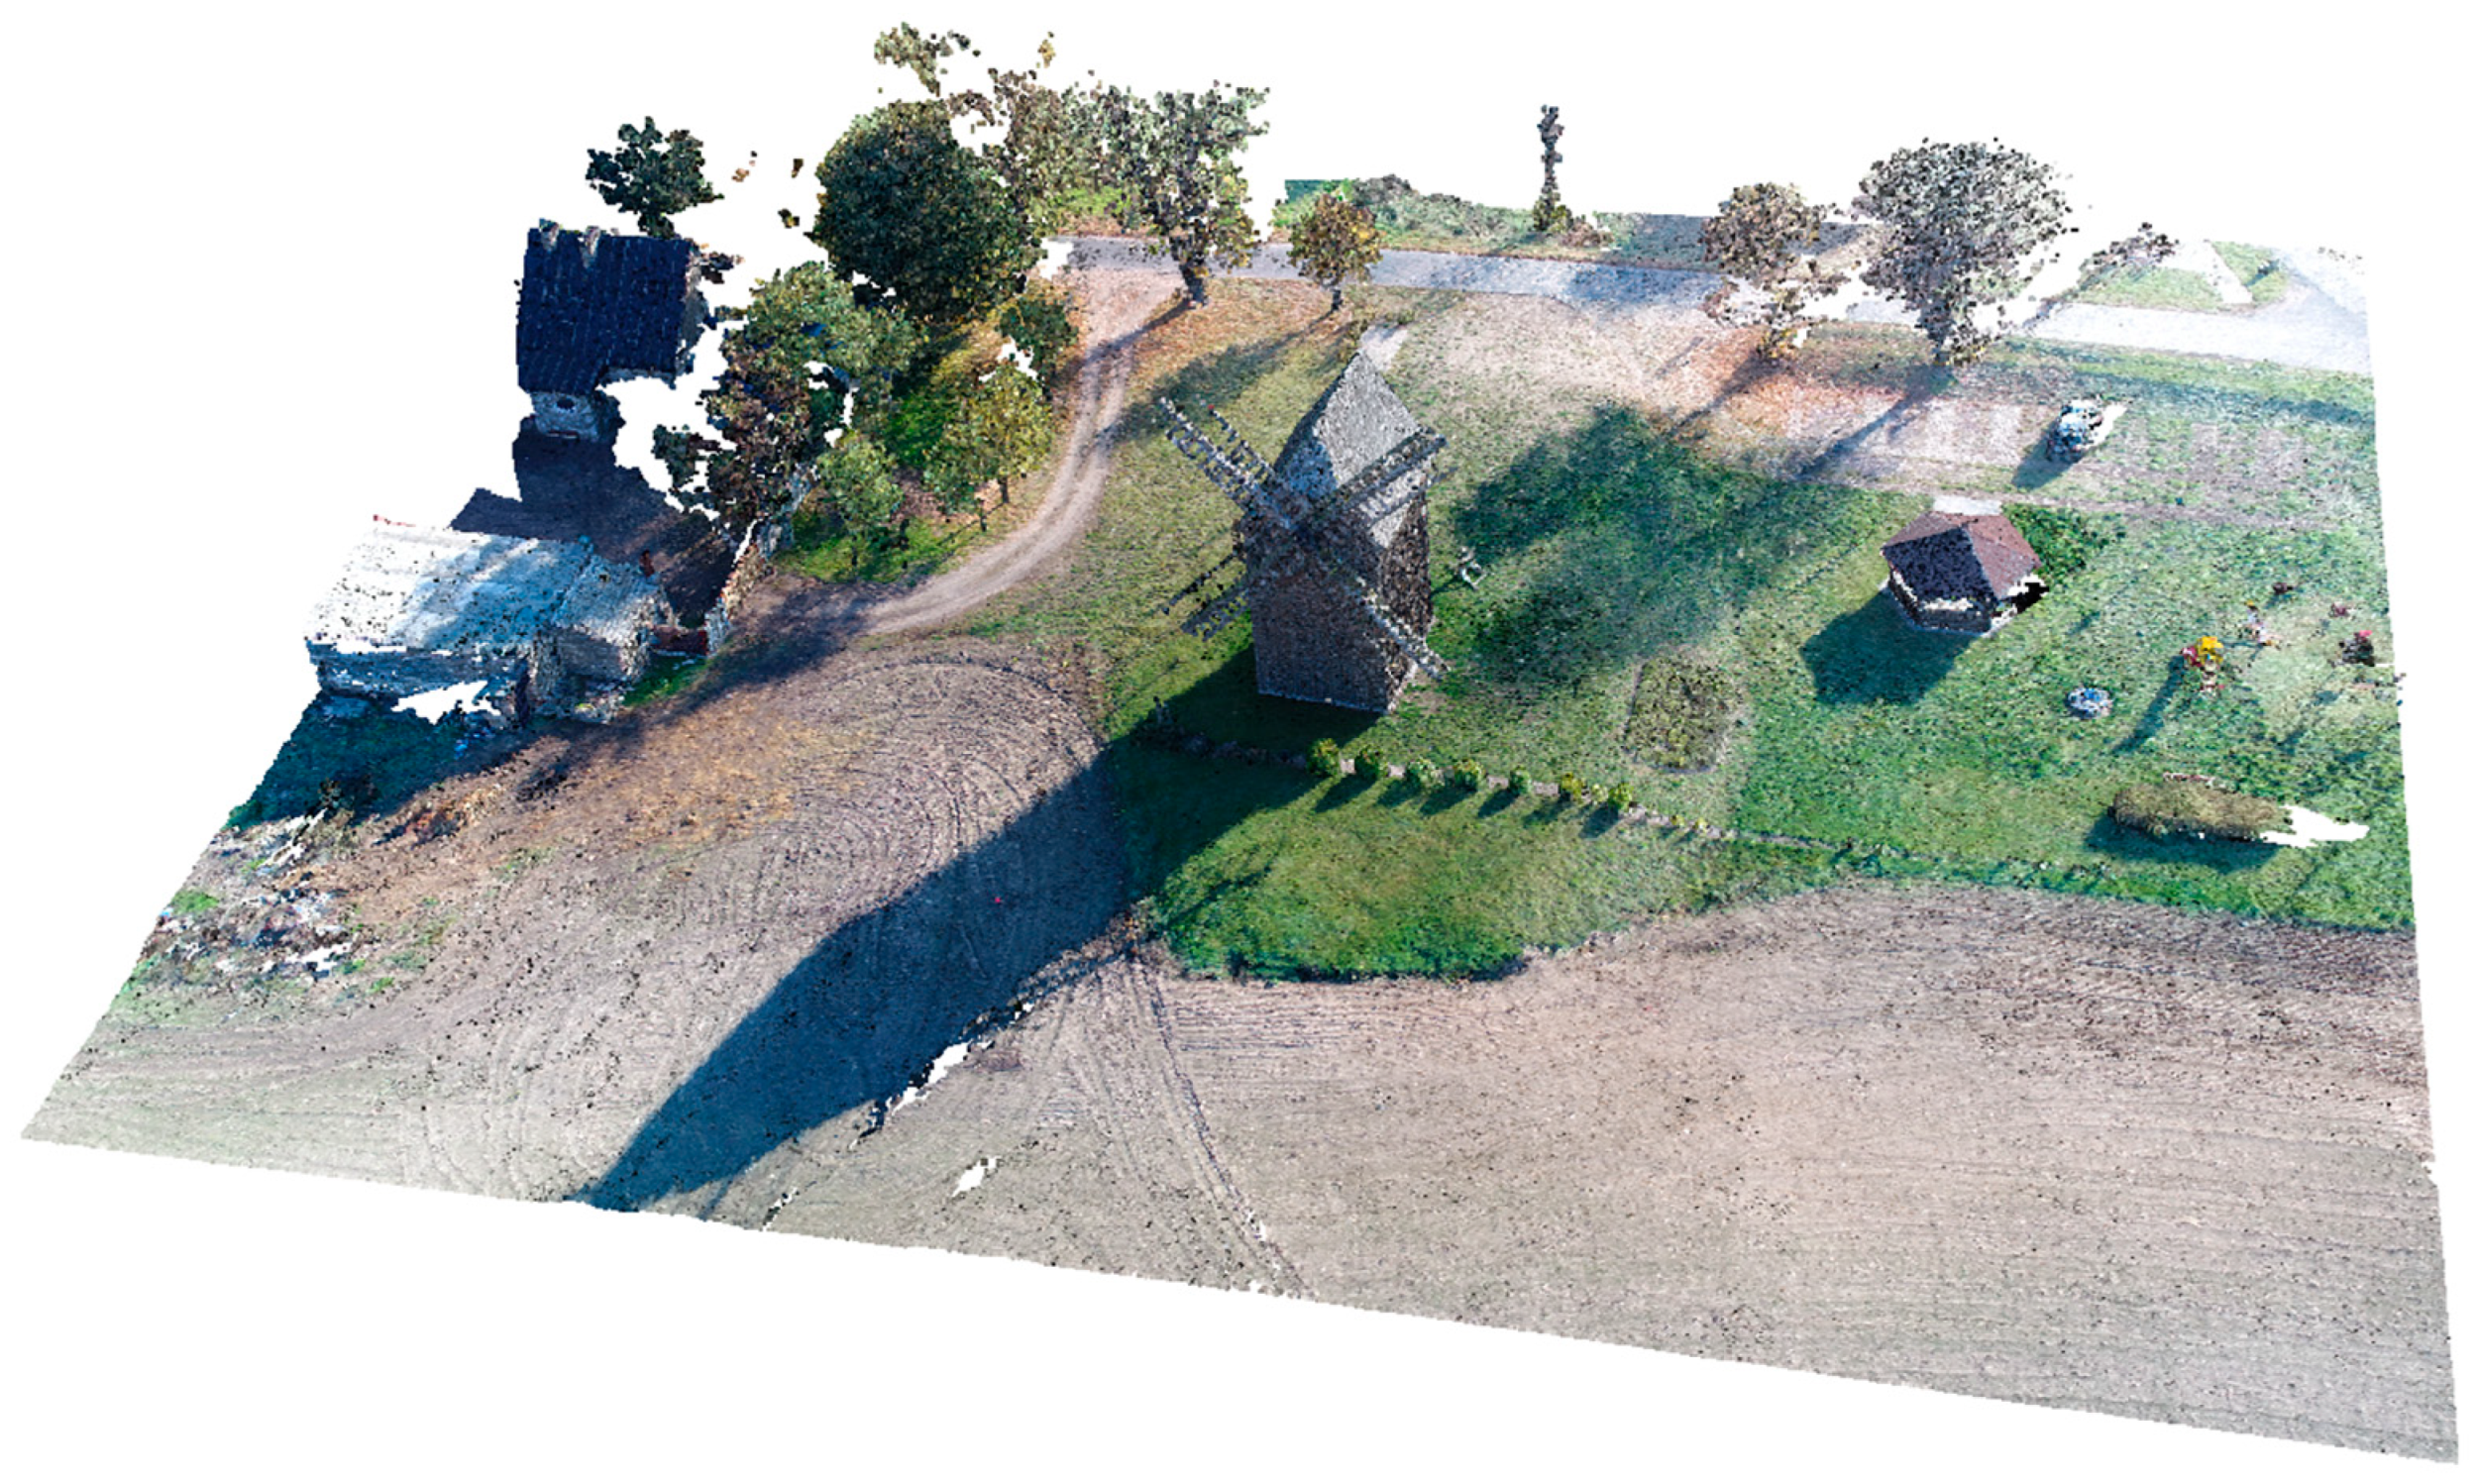
3.3. Visualization of Information about Cultural Heritage Objects—3D Model

As with geo-information data, the authors of this article assume in their methodological approach that the possession of information about the 3D model is mandatory. Data that can be used for this purpose include data obtained by laser scanning and low-level aerial photogrammetry (UAV). This type of data enables very accurate capture of the tested object. Of particular note here is the ability to capture the actual shapes and geometry of the structure being tested. However, it should be emphasized that the methodology for obtaining TLS and UAV data varies depending on the location, size, and geometry of the tested object [21].
The methodology for obtaining data on cultural heritage objects using laser scanning technology or low-level aerial photogrammetry (UAV) has been the subject of many previous articles. With this in mind, the authors of this study will not address the issues of data acquisition of cultural heritage objects but rather the issues of data acquisition, sharing, and presentation.
In order to continue writing the code in a programming language (JavaScript) and to use technological solutions for the presentation of information in web browsers, the authors used the library Three.js when implementing the 3D models. This library is used to create and display animated 3D graphics in a web browser using WebGL [21,51].
When creating a 3D model using the Three.js library, you need to specify four main elements. These are:
  • Container–specifies the target in which the model is displayed. When creating a variable, we must assign it a virtual location, which can be, for example, a <div> tag with the class = scene. We assign it to a variable as follows (Figure 5):
The querySelector() method finds the first matching element for the specified CSS selector. In the style.css file for a given class, you can specify the graphical parameters of where the model should be displayed. An alternative to querySelector() can be the method getElementByClassName().
  • Scene–allows specifying what and where to render from Three.js. Here you place objects, lights, and cameras. The scene is declared in the code as follows (Figure 6).
  • Camera–allows setting the projection in which the model will be seen. Three.js distinguishes between two types of projections, perspective and orthographic. In this methodological approach, the authors chose PerspectiveCamera because it mimics the way the human eye sees. The code implementation looks like this (Figure 7).
There are four options for the PerspectiveCamera constructor. The options specify the camera frustum for fov–vertical field of view, aspect–aspect ratio, near–near plane, and far–far plane. Together these options define the field of view of the camera (threejs.org). In addition, it can also define the position of the camera in relation to the visualized object. The attributes of the set option are the specification of x, y, and z coordinates.
  • Renderer–allows using WebGL to render a scene with a 3D model. The code implementation looks like this (Figure 8).
Rendering the scene is possible thanks to the WebGLRenderer method, which provides many interesting options, such as antialiasing. Setting this method to true can reduce many distortion errors that occur, for example, when rendering a high-resolution image at a lower resolution. In addition, several valuable methods can be set for the scene, e.g., setSize or setPixelRatio. setSize determines the rendering area of the scene, and setPixelRatio sets the pixel ratio of the device to avoid blurring.
An important element of code in the creation of a 3D model is also the implementation of files. This article presents the possibility of implementing .OBJ files and associated .MTL files. The Material Template Library format (MTL), or .MTL file format, is a companion file format to .OBJ that specifies the surface shading (material) properties of objects within one or more .OBJ files [52]. The OBJ file format is a simple data format that represents 3D geometry in a human-readable format as the position of each vertex, the UV position of each texture coordinate vertex, vertex normals, and the faces that make up each polygon, defined as a list of vertices and texture vertices [52].
To read the 3D model, you need to use two plugins, MTLLoader.js and OBJLoader.js. Both plugins are available in the Three.js Library Repository. They allow us to use code fragments that enable the loading of a 3D model with the file extension OBJ (Figure 9).
The 3D model stored in the files obj and mtl is accompanied by the textures used, which can be accessed via the setTexturePath() method. Both files are loaded via the load method. In this way, we have obtained a working 3D model that is displayed in a web browser thanks to WebGL. As the authors have already mentioned, the model is placed in the information window thanks to the tag, but it could just as well be a separate visualization product.

3.4. Documentation of Information about Cultural Heritage Objects

When it comes to visualization, it usually focuses on optimization in order to display the programmed data seamlessly. Unfortunately, in many cases, optimization also involves file conversion. In this process, the authors used, among other things, the conversion of SHP files to geoJSON. This was to combine geometric (geographic) data with attribute data, adapt it to the programming environment used (Leaflet library) and reduce the weight of the files, resulting in faster and easier loading of the information on the map. A similar situation arose from the use of OBJ files not for the point cloud obtained but for the 3D model created on its basis. In both cases, the goal was to load the information as quickly and smoothly as possible.
However, the authors of this article note that it is not only about visualization but also about documenting information about heritage objects as accurately as possible. The ability to keep everything from text documentation to point clouds also encourages the sharing of this data. When creating an interactive thematic map, you should also think about adding the possibility to download data for all visualized objects on the map (geoJSON or SHP files) or individual pieces of information (3D models or photos).
The choice of an appropriate method for obtaining and processing data on heritage objects depends on the purpose of the work. When selecting the methods described in the introduction to this study, a very important aspect is the accuracy of the recording of a given object, its geometry, the size of the area covered, and issues related to the costs associated with taking measurements and processing data, especially the costs of measuring equipment and software.

4. Results

For the design of the interactive thematic map, the basic functions of the Leaflet library were used. In addition, the authors recommend using the Leaflet Cluster Markers plugin for large data sets (https://github.com/Leaflet/Leaflet.markercluster, accessed on 19 April 2023). Such a solution is user-friendly by reducing the number of objects and eliminating the occlusion effect [53].
An example map view is shown in Figure 10. In the right part of the map view, there is a window with information (photo, model, attribute data from above). After pressing on the next object, the information is updated (Figure 10A). The currently activated object is signaled by a change in the color of the icon, and the property setIcon can be used for this purpose (Figure 10B). In addition, a legend has been added to the map layout to distinguish the types of windmills in this case. With the Leaflet Cluster Markers plugin, you can program an interactive legend that depends on the map zoom. To do this, use the event zooming and the option map.getZoom() (Figure 10C).
Section A of Figure 10 shows three information areas (1—photo gallery, 2—3D model, 3—attribute data). A photo gallery can be easily created by creating a button (or <a>) from the first photo for subsequent photos. The authors recommend using the Lightbox.js library. Thanks to this library, you can set up the same data-lightbox (<img>) for many photos, creating a photo gallery in a simple and consistent way. In addition, you can add a description (data-title) for each photo. We are also not limited by file extensions for raster images. In the case of the 3D model (Figure 10B), in addition to loading the model, an animation around the Z-axis was used so that the map user could view the object from all sides. However, you can always create a function that allows the user to freely rotate the model in all three axes. The easiest way to achieve this effect is to use a plugin for the Three.js library, namely OrbitControl.js. The last section of the information window is the attribute data. Here we are limited only by the amount of information we added during vectorization and the selection of the most important in the context of the interactive thematic map. If you need more data for the visualization, you can create a button that expands more information or displays the whole table in another window, depending on your preferences, e.g., alert().
As part of the documentation process, we made a model of one of the historic windmills. To model the structure in 3D, we used photogrammetric data from a low-level aerial platform. In order to create the most accurate 3D model of the windmill, the images were obtained using the Structure-from-Motion (SfM) algorithm [54]. The use of the Structure-from-Motion algorithm allowed for accurate registration of the object from each side, which enabled the most accurate modeling of the windmill structure. The popular DJI Phantom Advanced+ platform, equipped with a camera with a 1” CMOS matrix and a 20 Mpx lens, was chosen to capture the image data. The triangulation of the captured aerial photogrammetric images was based on the adopted network of photogrammetric control points (GCP) [15,55]. The measurement of the coordinates of the photogrammetric control points was carried out using the GNSS RTK technique [56]. The measurement and determination of the coordinates of the photogrammetric control points were completed with the Trimble R10 Model 2 GNSS receiver. For the satellite measurements, the surface corrections provided by the reference stations of the VRSNet system were adopted and taken into account. A total of four photogrammetric control network points were established around the tested structure. Agisoft Metashape Professional software was used to process the acquired photogrammetric data. The methodology used by the authors made it possible to perform the aerotriangulation based on the points of the photogrammetric control network and calculate the RMSE value [57]. The value of the root means the square error of 1.3 cm calculated in the aerotriangulation suggested that the captured images were correctly aligned. As a result of further work on the intimate processing of the photogrammetric data, a point cloud was created in Agisoft Metashape Professional software. The process was carried out using the original sizes of the captured images, and the point cloud obtained consisted of 15,565,803 points. The resulting point cloud served as the basis for developing further visualizations of the tested wind turbine (Figure 11).

5. Discussion

The presented methodological approach has been proposed for windmills as an important element of the cultural heritage of Western Poland (Wielkopolska Greater Poland) [21,46]. The authors are aware that the whole process should be tested and adapted to other cultural heritage objects, but the proposed solution should meet the requirements of each object. The authors use the basic functions of the Leaflet.js and Three.js libraries and extend their capabilities by combining existing solutions that have been developed in recent years. The authors are aware that they are not extending the libraries used by relying mainly on the basic functions, but in developing this methodological approach, they wanted to achieve a reliable and tested result so that it could serve as a basis for further research.
The proposed use of file extensions is not mandatory. An alternative to OBJ (and MTL) files in the visualization of 3D models can be files in glTF format. glTF (GL Transmission Format) is an open format specification for the efficient delivery and loading of 3D content. Assets can be provided in either JSON (.gltf) or binary (.glb) format. External files store textures (.jpg, .png) and additional binary data (.bin) (threejs.org). glTF has been used, e.g., by Smaczyński and Horbiński [21], for the presentation of cultural heritage objects. In their article, the authors used this file extension as output from the Blender program. Unfortunately, this file extension is not available in all programs, e.g., for processing point clouds, the format OBJ is a more universal extension. However, the library Three.js also offers an alternative to point clouds by using the file format PCD (Point Cloud Data).
Another element that should be given special attention is the size of the 3D model or point cloud. For visualization, the size should be optimized as much as possible so that the loading time is as short as possible and does not burden the processor. However, if you have a large server, you can download the most accurate data. When creating an interactive thematic map, keep in mind that the proposed methodological solution was developed for web browsers, which limits the power of the computer or smartphone processor but increases the circle of recipients of this product.
The libraries used by the authors to create an interactive thematic map or 3D model can also be replaced by other available solutions. However, it is worth noting that the Leaflet.js library is constantly being improved [58,59,60] and its support for touch-based interactions [61,62]. It also has a small file size, which is crucial for the optimization process. However, in the context of the Three.js library, the main argument is its use in research, where the presentation of results is an important element of the work [21,50,63].

6. Conclusions and Future Work

Compared to other methods of documenting and visualizing cultural heritage objects, the methodological approach proposed by the authors focuses primarily on providing a wide variety of data. Previous studies focused mainly on a method for obtaining information about the object, and the results were presented in one form [21].
The use of measurement data involves the selection of an appropriate measurement technique. The literature review conducted has shown that currently, the most detailed registration of the test object in terms of measurement accuracy and detail of both geometric and texture registration is possible with the use of laser scanning (TLS) and low-level aerial photogrammetry (UAV). Although these measurement techniques ensure the most accurate registration of cultural heritage objects, their disadvantage is the large number of files they produce, which is associated with difficulties in their implementation in different types of media and their visualization, i.e., on the Internet. Another problem is the availability of these measurement techniques and the costs associated with their use. Undoubtedly, the field measurements and the processing of the measurement data using laser scanning technology and low-altitude photogrammetry are associated with higher costs than the classical measurement methods.
In addition, the authors point out the possibility of increasing the amount of information on the proposed interactive thematic map. Each script is written in such a way that the addition of any further object to the map is automatic, without requiring any intervention in the code. The libraries used, Three.js and Leaflet.js, are systematically updated, which effectively facilitates adaptation in the context of technological progress, reflected, for example, in the improvement of software, the updating of search engines, or the implementation of new W3C standards [50].
It is, therefore, necessary to pay attention to the historical value of many objects through documentation, visualization, and dissemination of information about them. Therefore, in future works, the authors will further develop the proposed methodological approach by increasing the amount of information collected and testing the interactive thematic map by users. Thanks to the basic functions of the Leaflet.js and Three.js libraries, the authors will try to extend the libraries used in further research.

Author Contributions

Conceptualization, Tymoteusz Horbiński; methodology, Tymoteusz Horbiński and Maciej Smaczyński; software, Tymoteusz Horbiński and Maciej Smaczyński; formal analysis, Tymoteusz Horbiński and Maciej Smaczyński; resources, Tymoteusz Horbiński and Maciej Smaczyński; data curation, Tymoteusz Horbiński and Maciej Smaczyński; writing—original draft preparation, Tymoteusz Horbiński and Maciej Smaczyński; writing—review and editing, Tymoteusz Horbiński and Maciej Smaczyński; visualization, Tymoteusz Horbiński and Maciej Smaczyński. All authors have read and agreed to the published version of the manuscript.

Funding

This research received no external funding.

Data Availability Statement

Not applicable.

Conflicts of Interest

The authors declare no conflict of interest.

References

  1. Eker, R.; Elvanoglu, N.; Ucar, Z.; Bilici, E.; Aydın, A. 3D modelling of a historic windmill: Ppk-aided terrestrial photogrammetry vs. smartphone app. Int. Arch. Photogramm. Remote Sens. Spat. Inf. Sci. 2022, 43, 787–792. [Google Scholar] [CrossRef]
  2. Lerma, J.L.; Navarro, S.; Cabrelles, M.; Seguí, A.E.; Haddad, N.; Akasheh, T. Integration of Laser Scanning and Imagery for Photorealistic 3D Architectural Documentation. In Laser Scanning, Theory and Applications; Wang, C.-C., Ed.; InTech: London, UK, 2011. [Google Scholar] [CrossRef] [Green Version]
  3. Zakrzewski, P. Geodesy and photogrammetry in archaeology. Advanced documentation methods used by the Kuwaiti-Polish Archaeological Expedition. In Stories Told Around the Fountain. Papers Offered to Piotr Bieliński on His 70th Birthday; Pieńkowska, A.A., Szeląg, D., Zych, I., Eds.; Wydawnictwo Uniwersytetu Warszawskiego: Warsaw, Poland, 2019; pp. 759–776. [Google Scholar] [CrossRef]
  4. Bedford, J.; Pearson, T.; Thomason, B. Traversing the Past: The Total Station Theodolite in Archaeological Landscape Survey; Heritage England: Swindon, UK, 2016. [Google Scholar]
  5. Bradley, M. Archaeological survey in a digital world. In Digital Archaeology: Bridging Method and Theory; Evans, T.L., Daly, P.T., Eds.; Routledge: London, UK, 2006; pp. 29–42. [Google Scholar]
  6. Blanco-Pons, S.; Carrión-Ruiz, B.; Lerma, J.L.; Villaverde, V. Design and implementation of an augmented reality application for rock art visualization in Cova dels Cavalls (Spain). J. Cult. Herit. 2019, 39, 177–185. [Google Scholar] [CrossRef]
  7. Miřijovský, J.; Langhammer, J. Multitemporal monitoring of the morphodynamics of a mid-mountain stream using UAS photogrammetry. Remote Sens. 2015, 7, 8586–8609. [Google Scholar] [CrossRef] [Green Version]
  8. Wężyk, P. Teledetekcja i fotogrametria obszarów leśnych. In Geomatyka w Lasach Państwowych Część I. Podstawy; Centrum Informacyjne Lasów Państwowych: Warsaw, Poland, 2010; pp. 277–357. [Google Scholar]
  9. Rossi, G.; Tanteri, L.; Tofani, V.; Vannocci, P.; Moretti, S.; Casagli, N. Multitemporal UAV surveys for landslide mapping and characterization. Landslides 2018, 15, 1045–1052. [Google Scholar] [CrossRef] [Green Version]
  10. Smaczyński, M.; Medyńska-Gulij, B. Low aerial imagery–an assessment of georeferencing errors and the potential for use in environmental inventory. Geod. Cartogr. 2017, 66, 89–104. [Google Scholar] [CrossRef]
  11. Eugster, H.; Nebiker, S. Uav-based augmented monitoring—Realtime georeferencing and integration of video imagery with virtual globes. Int. Arch. Photogramm. Remote Sens. Spat. Inf. Sci. 2008, XXXVII, 1229–1236. Available online: https://www.isprs.org/proceedings/XXXVII/congress/1_pdf/209.pdf (accessed on 19 April 2023).
  12. Wang, J.; Garratt, M.; Lambert, A.; Wang, J.J.; Han, S.; Sinclair, D. Integration of Gps/Ins/vision sensors to navigate un-manned aerial vehicles. Int. Arch. Photogramm. Remote Sens. Spat. Inf. Sci. 2008, XXXVII, 963–969. Available online: https://www.isprs.org/proceedings/XXXVII/congress/1_pdf/166.pdf (accessed on 19 April 2023).
  13. Barazzetti, L.; Remondino, F.; Scaioni, M.; Brumana, R. Fully automatic UAV image-based sensor orientation. Int. Arch. Photogramm. Remote Sens. Spat. Inf. Sci. 2010, 38, 6. Available online: https://www.isprs.org/proceedings/XXXVIII/part1/12/12_02_Paper_75.pdf (accessed on 19 April 2023).
  14. Anai, T.; Sasaki, T.; Osaragi, K.; Yamada, M.; Otomo, F.; Otani, H. Automatic exterior orientation procedure for low-cost uav photogrammetry using video image tracking technique and Gps information. Int. Arch. Photogramm. Remote Sens. Spatial Inf. Sci. 2012, XXXIX-B7, 469–474. [Google Scholar] [CrossRef] [Green Version]
  15. Nex, F.; Remondino, F. UAV for 3D mapping applications: A review. Appl. Geomat. 2014, 6, 1–15. [Google Scholar] [CrossRef]
  16. Lemmens, M. Airborne Lidar Sensors. GIM International. 2007. Available online: https://community.esri.com/ccqpr47374/attachments/ccqpr47374/gis-blog/507/1/LiDAR-Sensors.pdf (accessed on 19 April 2023).
  17. Haddad, N.; Akasheh, T. Documentation of Archaeological Sites and Monuments: Ancient Theatres in Jerash. In Proceedings of the CIPA 2005 XX International Symposium, Torino, Italy, 26 September–1 October 2005; Available online: https://www.cipaheritagedocumentation.org/wp-content/uploads/2018/12/Haddad-Akasheh-Documentation-of-archaeological-sites-and-monuments_ancient-theatres-in-Jerash.pdf (accessed on 19 April 2023).
  18. Haddad, N. Towards Creating a Dialogue between the Specialized Technician and non Technician Users of the 3D Laser Scanner. Int. Arch. Photogramm. Remote Sens. Spat. Inf. Sci. 2007, XXXVI, 350–355. Available online: https://www.isprs.org/proceedings/xxxvi/5-c53/papers/FP069.pdf (accessed on 19 April 2023).
  19. Koutsoudis, A.; Vidmar, B.; Ioannakis, G.; Arnaoutoglou, F.; Pavlidis, G.; Chamzas, C. Multiimage 3D reconstruction data evaluation. J. Cult. Herit. 2014, 15, 73–79. [Google Scholar] [CrossRef]
  20. Themistocleous, K. Model reconstruction for 3d vizualization of cultural heritage sites using open data from social media: The case study of Soli, Cyprus. J. Archaeol. Sci. Rep. 2016, 14, 774–781. [Google Scholar] [CrossRef]
  21. Smaczyński, M.; Horbiński, T. Creating a 3D Model of the Existing Historical Topographic Object Based on Low-Level Aerial Imagery. KN J. Cartogr. Geogr. Inf. 2021, 71, 33–43. [Google Scholar] [CrossRef]
  22. Lerma, J.L.; Navarro, S.; Cabrelles, M.; Villaverde, V. Terrestrial laser scanning and close range photogrammetry for 3D archaeological documentation: The Upper Palaeolithic Cave of Parpalló as a case study. J. Archaeol. Sci. 2010, 37, 499–507. [Google Scholar] [CrossRef]
  23. Diara, F. HBIM Open Source: A Review. ISPRS Int. J. Geo-Inf. 2022, 11, 472. [Google Scholar] [CrossRef]
  24. Jordan-Palomar, I.; Tzortzopoulos, P.; García-Valldecabres, J.; Pellicer, E. Protocol to Manage Heritage-Building Interventions Using Heritage Building Information Modelling (HBIM). Sustainability 2018, 10, 908. [Google Scholar] [CrossRef] [Green Version]
  25. Garagnani, S.; Gaucci, A.; Govi, E. ArchaeoBIM: Dallo scavo al Building Information Modeling di una struttura sepolta. Il caso del tempio tuscanico di Uni a Marzabotto. Archeol. Calcol. 2016, 27, 251–270. Available online: http://www.archcalc.cnr.it/indice/PDF27/13_Garagnani_et_al.pdf (accessed on 19 April 2023).
  26. Gonzalez-Vares, I. Conservación de Bienes Culturales [Conservation of Cultural Items]; Manuales Arte Cátedra: Madrid, Spain, 2006; Chapters 10–11. [Google Scholar]
  27. Forster, A.; Kayan, B. Maintenance for historic buildings: A current perspective. Struct. Surv. 2009, 27, 210–229. [Google Scholar] [CrossRef]
  28. Migilinskas, D.V.; Popov, V.; Juocevicius, L. The benefits, obstacles and problems of practical BIM implementation. Procedia Eng. 2013, 57, 767–774. [Google Scholar] [CrossRef] [Green Version]
  29. Kempton, J. Can lean thinking apply to the repair and refurbishment of properties in the registered social landlord sector? Struct. Surv. 2006, 24, 201–211. [Google Scholar] [CrossRef]
  30. Perng, Y.H.; Hsia, Y.P.; Lu, H.J. A Service Quality Improvement Dynamic Decision Support System for Refurbishment Contractors. Total Qual. Manag. Bus. Excell. 2007, 18, 731–749. [Google Scholar] [CrossRef]
  31. Ferwati, M.S.; Al-Hammadi, M.; Marthya, K.L.; El-Menshawy, S.; Althbah, H.A. Multi-Layered Documentation of Heritage Villages: The Case of Tinbak, Qatar. Designs 2021, 5, 38. [Google Scholar] [CrossRef]
  32. Sanchez-Calvillo, A.; Alonso-Guzman, E.M.; Solís-Sánchez, A.; Martinez-Molina, W.; Navarro-Ezquerra, A.; Gonzalez-Sanchez, B.; Arreola-Sanchez, M.; Sandoval-Castro, K. Use of Audiovisual Methods and Documentary Film for the Preservation and Reappraisal of the Vernacular Architectural Heritage of the State of Michoacan, Mexico. Heritage 2023, 6, 2101–2125. [Google Scholar] [CrossRef]
  33. Lorek, D.; Horbiński, T. Interactive Web-Map of the European Freeway Junction A1/A4 Development with the Use of Archival Cartographic Sources. ISPRS Int. J. Geo-Inf. 2020, 9, 438. [Google Scholar] [CrossRef]
  34. Challis, K. Airborne laser altimetry in alluviated landscapes. Archaeol. Prospect. 2006, 13, 103–127. [Google Scholar] [CrossRef]
  35. Crutchley, S. Light detection and ranging (lidar) in the Witham valley, Lincolnshire: An assessment of new remote sensing techniques. Archaeol. Prospect. 2006, 13, 251–257. [Google Scholar] [CrossRef]
  36. Bofinger, J.; Kurz, S.; Schmidt, S. Ancient maps–modern data sets: Different investigative techniques in the landscape of the Early Iron Age princely hill fort Heuneburg, Baden-Württemberg. From Space to Place. BAR Int. Ser. 2006, 1568, 87. [Google Scholar]
  37. Bewley, R.H.; Crutchley, S.P.; Shell, C.A. New light on an ancient landscape: Lidar survey in the Stonehenge World Heritage Site. Antiquity 2005, 79, 636–647. [Google Scholar] [CrossRef]
  38. Devereux, B.J.; Amable, G.S.; Crow, P.; Cliff, A.D. The potential of airborne lidar for detection of archaeological features under woodland canopies. Antiquity 2005, 79, 648–660. [Google Scholar] [CrossRef]
  39. Doneus, M.; Briese, C. Digital terrain modelling for archaeological interpretation within forested areas using fullwaveform laserscanning. In Proceedings of the 7th International Symposium on Virtual Reality, Archaeology and Cultural Heritage VAST, Nicosia, Cyprus, 30 October–4 November 2006; pp. 155–162. [Google Scholar] [CrossRef]
  40. Sittler, B.; Weinacker, H.; Gultlinger, M.; Koupaliantz, L. The potential of Lidar in assessing elements of cultural heritage hidden under forests. In New Developments and Challenges in Remote Sensing; Bochenek, Z., Ed.; Millpress: Rotterdam, The Netherlands, 2006; pp. 539–548. [Google Scholar]
  41. Lütjens, M.; Kersten, T.P.; Dorschel, B.; Tschirschwitz, F. Virtual Reality in Cartography: Immersive 3D Visualization of the Arctic Clyde Inlet (Canada) Using Digital Elevation Models and Bathymetric Data. Multimodal Technol. Interact. 2019, 3, 9. [Google Scholar] [CrossRef] [Green Version]
  42. Walmsley, A.P.; Kersten, T.P. The Imperial Cathedral in Königslutter (Germany) as an Immersive Experience in Virtual Reality with Integrated 360° Panoramic Photography. Appl. Sci. 2020, 10, 1517. [Google Scholar] [CrossRef] [Green Version]
  43. Büyüksalih, G.; Kan, T.; Özkan, G.E.; Meriç, M.; Isın, L.; Kersten, T.P. Preserving the Knowledge of the Past Through Virtual Visits: From 3D Laser Scanning to Virtual Reality Visualisation at the Istanbul Çatalca İnceğiz Caves. PFG 2020, 88, 133–146. [Google Scholar] [CrossRef]
  44. Medyńska-Gulij, B.; Zagata, K. Experts and Gamers on Immersion into Reconstructed Strongholds. ISPRS Int. J. Geo-Inf. 2020, 9, 655. [Google Scholar] [CrossRef]
  45. Carvajal-Ramírez, F.; Martínez-Carridondo, P.; Yero-Paneque, L.; Agüera-Vega, F. Uav photogrammetry and HBIM for the virtual reconstruction of heritage. Int. Arch. Photogramm. Remote Sens. Spat. Inf. Sci. 2019, XLII-2, 271–278. [Google Scholar] [CrossRef] [Green Version]
  46. Smaczyński, M.; Lorek, D.; Zagata, K.; Horbiński, T. Cultural Heritage with the Use of Low-Level Aerial Survey Techniques, Space Modelling and Multimedia Reconstruction of the Topographic Landscape (Example of a Windmill in Western Poland). KN J. Cartogr. Geogr. Inf. 2022, 72, 279–291. [Google Scholar] [CrossRef]
  47. Lorek, D. Przestrzeń Przedindustrialna XIX-Wiecznej Wielkopolski w Ujęciu Kartografi Multimedialnej; Bogucki Wydawnictwo Naukowe: Poznań, Poland, 2021. [Google Scholar]
  48. Leaflet. Available online: https://leafletjs.com/reference.html (accessed on 19 April 2023).
  49. Edler, D.; Vetter, M. The simplicity of modern audiovisual web cartography: An example with the open-source Javascript Library leaflet.js. Kn J. Cartogr. Geogr. Inf. 2019, 69, 51–62. [Google Scholar] [CrossRef] [Green Version]
  50. Horbiński, T.; Lorek, D. The use of Leaflet and GeoJSON files for creating the interactive web map of the preindustrial state of the natural environment. J. Spat. Sci. 2022, 67, 61–77. [Google Scholar] [CrossRef]
  51. Stanton, M.; Hartley, T.; Loizides, F.; Worrallo, A. Dual-Mode User Interfaces for Web Based Interactive 3D Virtual Environments Using Three.js. In Human-Computer Interaction—INTERACT 2017; Bernhaupt, R., Dalvi, G., Joshi, A.K., Balkrishan, D., O’Neill, J., Winckler, M., Eds.; Lecture Notes in Computer Science; Springer: Cham, Switzderland, 2017; Volume 10516. [Google Scholar] [CrossRef] [Green Version]
  52. Available online: html#manual/en/introduction/Creating-a-scene (accessed on 19 April 2023).
  53. Korpi, J.A.; Haybatollahi, M.; Ahonen-Rainio, P. Identification of partially occluded map symbols. Cartogr. Perspect. 2014, 76, 19–32. [Google Scholar] [CrossRef]
  54. Westoby, M.J.; Brasington, J.; Glasser, N.F.; Hambrey, M.J.; Reynolds, J.M. ‘Structure-from-Motion’ photogrammetry: A low-cost, effective tool for geoscience applications. Geomorphology 2012, 179, 300–314. [Google Scholar] [CrossRef] [Green Version]
  55. Padró, J.C.; Muñoz, F.J.; Planas, J.; Pons, X. Comparison of four UAV georeferencing methods for environmental monitoring purposes focusing on the combined use with airborne and satellite remote sensing platforms. Int. J. Appl. Earth Obs. Geoinf. 2019, 75, 130–140. [Google Scholar] [CrossRef]
  56. Clapuyt, F.; Vanacker, V.; Van Oost, K. Reproducibility of UAVbased earth topography reconstructions based on struc- turefrom-motion algorithms. Geomorphology 2016, 260, 4–15. [Google Scholar] [CrossRef]
  57. Herrero-Tejedor, T.R.; Arques Soler, F.; Lopez-Cuervo Medina, S.; der la Cabrera, M.R.O.; Martın Romero, J.L. Documenting a cultural landscape using point-cloud 3d models obtained with geomatic integration techniques. The case of the El Encın atomic garden, Madrid (Spain). PLoS ONE 2020, 15, 0235169. [Google Scholar] [CrossRef]
  58. Derrough, J. Instant Interactive Map Designs with Leaflet JavaScript Library How-To; Packt Publishing: Birmingham, UK, 2013. [Google Scholar]
  59. Farkas, G. Practical GIS; Packt Publishing: Birmingham, UK, 2017. [Google Scholar]
  60. Faustryjak, D.; Majchrowicz, M.; Jackowska-Strumiłło, L. Application of the layered model management system in an interactive map of university campus. Image Process. Commun. 2017, 22, 51–58. [Google Scholar] [CrossRef] [Green Version]
  61. Donohue, R.G.; Sack, C.M.; Roth, R.E. Time Series Proportional Symbol Maps with Leaflet and jQuery. Cartogr. Perspect. 2013, 76, 43–65. [Google Scholar] [CrossRef] [Green Version]
  62. Roth, E.R.; Donohue, R.G.; Sack, C.M.; Wallace, T.R.; Buckingham, T.M.A. A Process for Keeping Pace with Evolving Web Mapping Technologies. Cartogr. Perspect. 2014, 78, 25–52. [Google Scholar] [CrossRef] [Green Version]
  63. Benesha, J.; Lee, J.; James, D.A.; White, B. Are You for Real? Engineering a Virtual Lab for the Sports Sciences Using Wearables and IoT. Proceedings 2020, 49, 110. [Google Scholar] [CrossRef]
Figure 1. Code snippet for implementing a vector layer.
Ijgi 12 00257 g001
Figure 2. Code snippet for creating a div with class = “info”.
Ijgi 12 00257 g002
Figure 3. Code snippet for updating data in the information window.
Ijgi 12 00257 g003
Figure 4. Code snippet for logical operator coalescing.
Ijgi 12 00257 g004
Figure 5. Code snippet for searching for a div with class=“scene”.
Ijgi 12 00257 g005
Figure 6. Code snippet for creating a scene for a 3D model.
Ijgi 12 00257 g006
Figure 7. Code snippet for creating a camera for a scene.
Ijgi 12 00257 g007
Figure 8. Code snippet for rendering a scene.
Ijgi 12 00257 g008
Figure 9. Code snippet for implementing 3D model files.
Ijgi 12 00257 g009
Figure 10. An example view of an interactive thematic map ((A) information field: 1—photo gallery, 2—3D model, 3—attribute data; (B)—visualized data; (C) interactive legend).
Ijgi 12 00257 g010
Figure 11. Created point cloud from photogrammetric raid.
Ijgi 12 00257 g011
Disclaimer/Publisher’s Note: The statements, opinions and data contained in all publications are solely those of the individual author(s) and contributor(s) and not of MDPI and/or the editor(s). MDPI and/or the editor(s) disclaim responsibility for any injury to people or property resulting from any ideas, methods, instructions or products referred to in the content.

