MAAFEU-Net: A Novel Land Use Classification Model Based on Mixed Attention Module and Adjustable Feature Enhancement Layer in Remote Sensing Images

 , , , , and
Abstract
1. Introduction
2. Methods
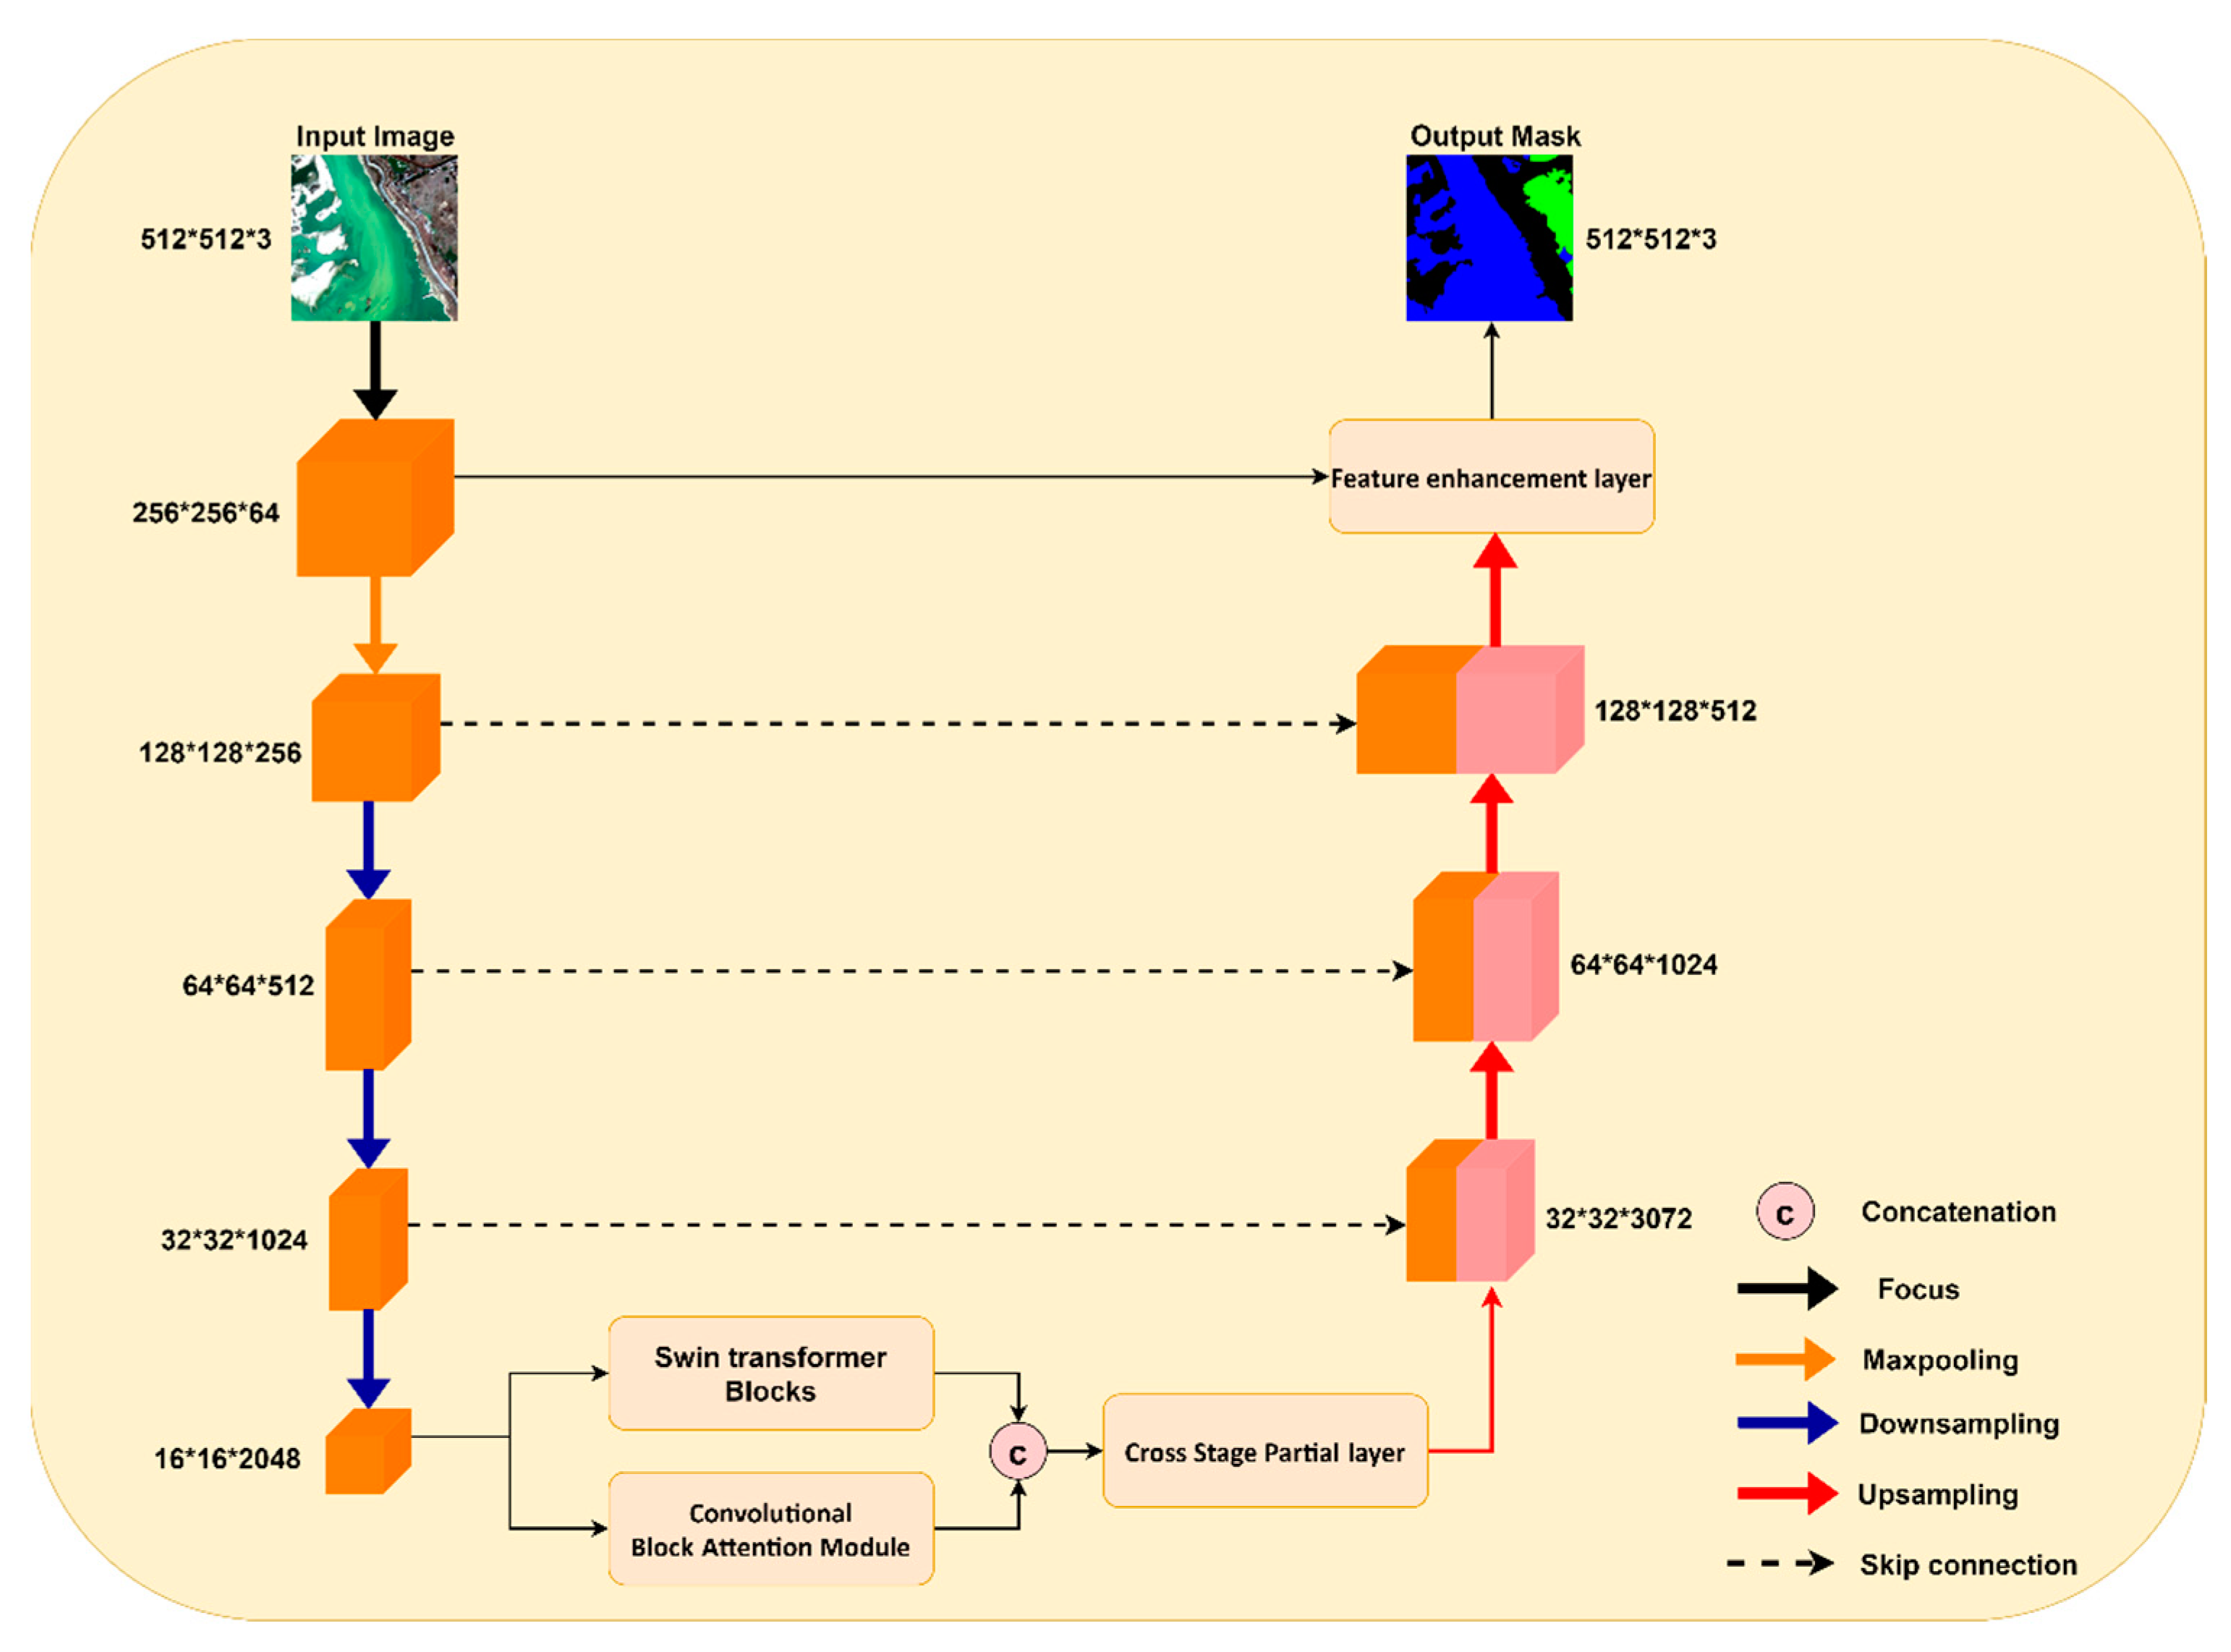
2.1. General Framework of the Model
2.2. Main Components of the Model
2.2.1. Focus
2.2.2. Mixed Attention Module
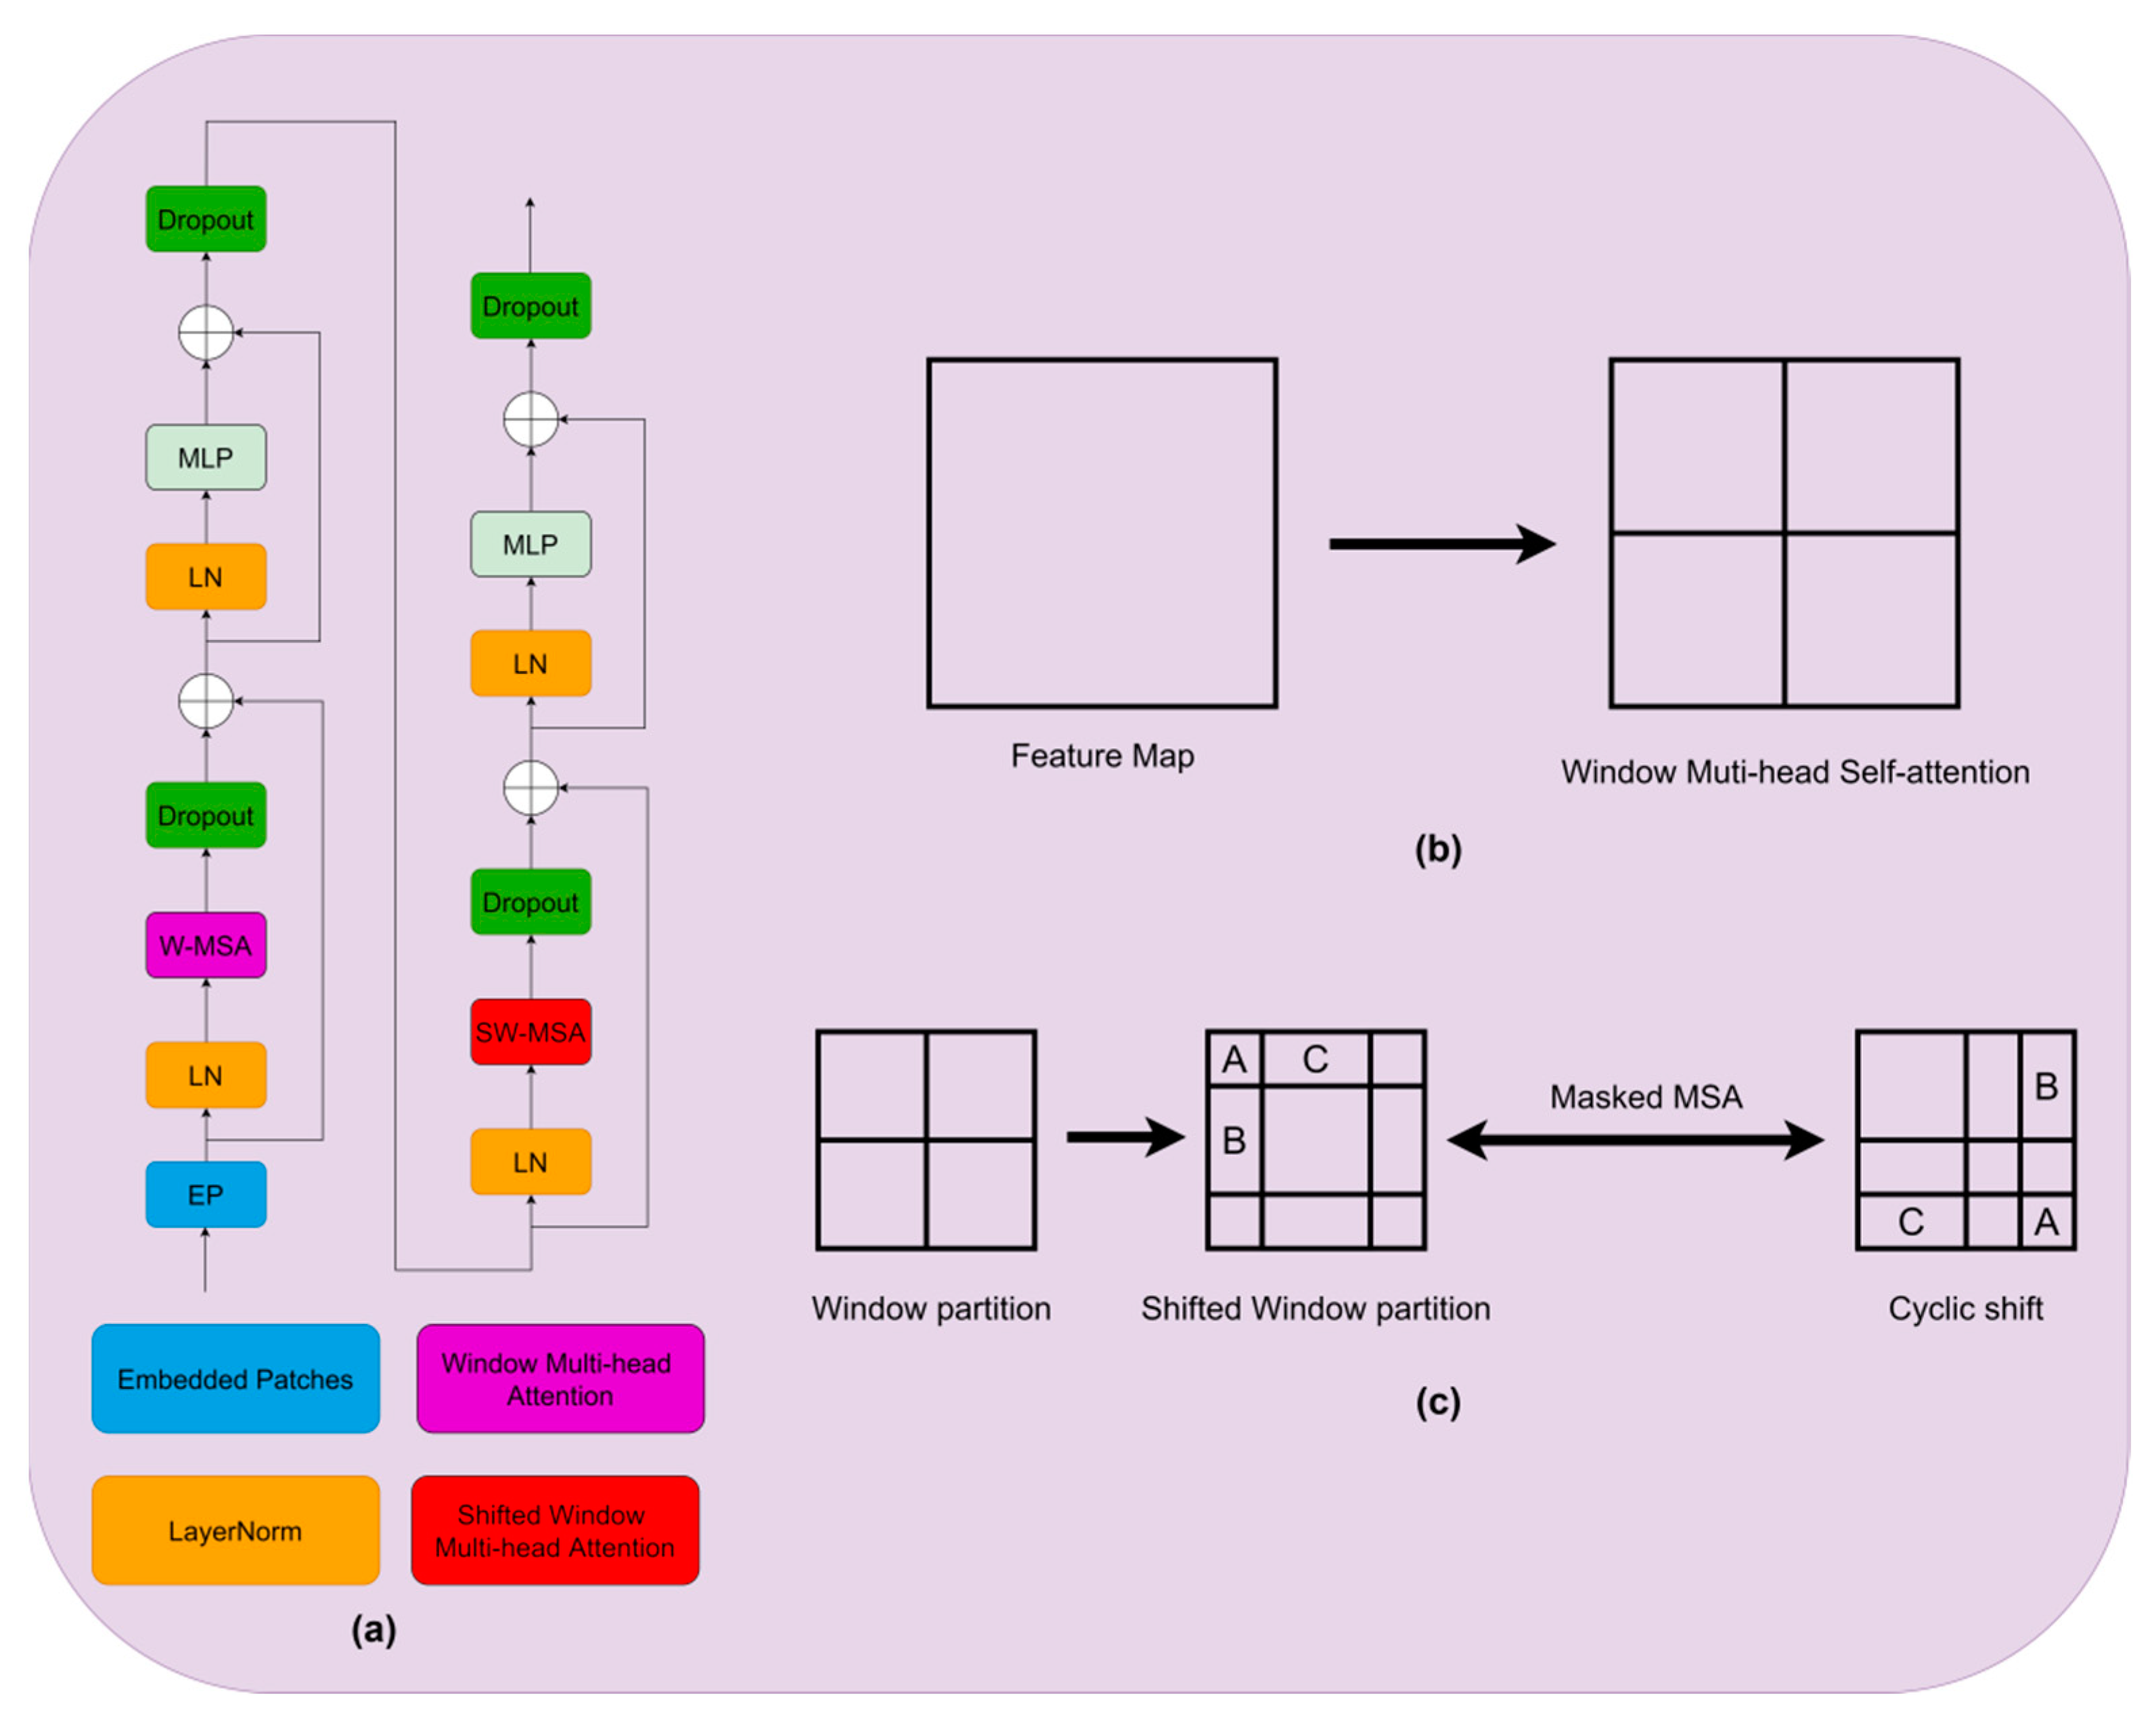
Swin Transformer Blocks
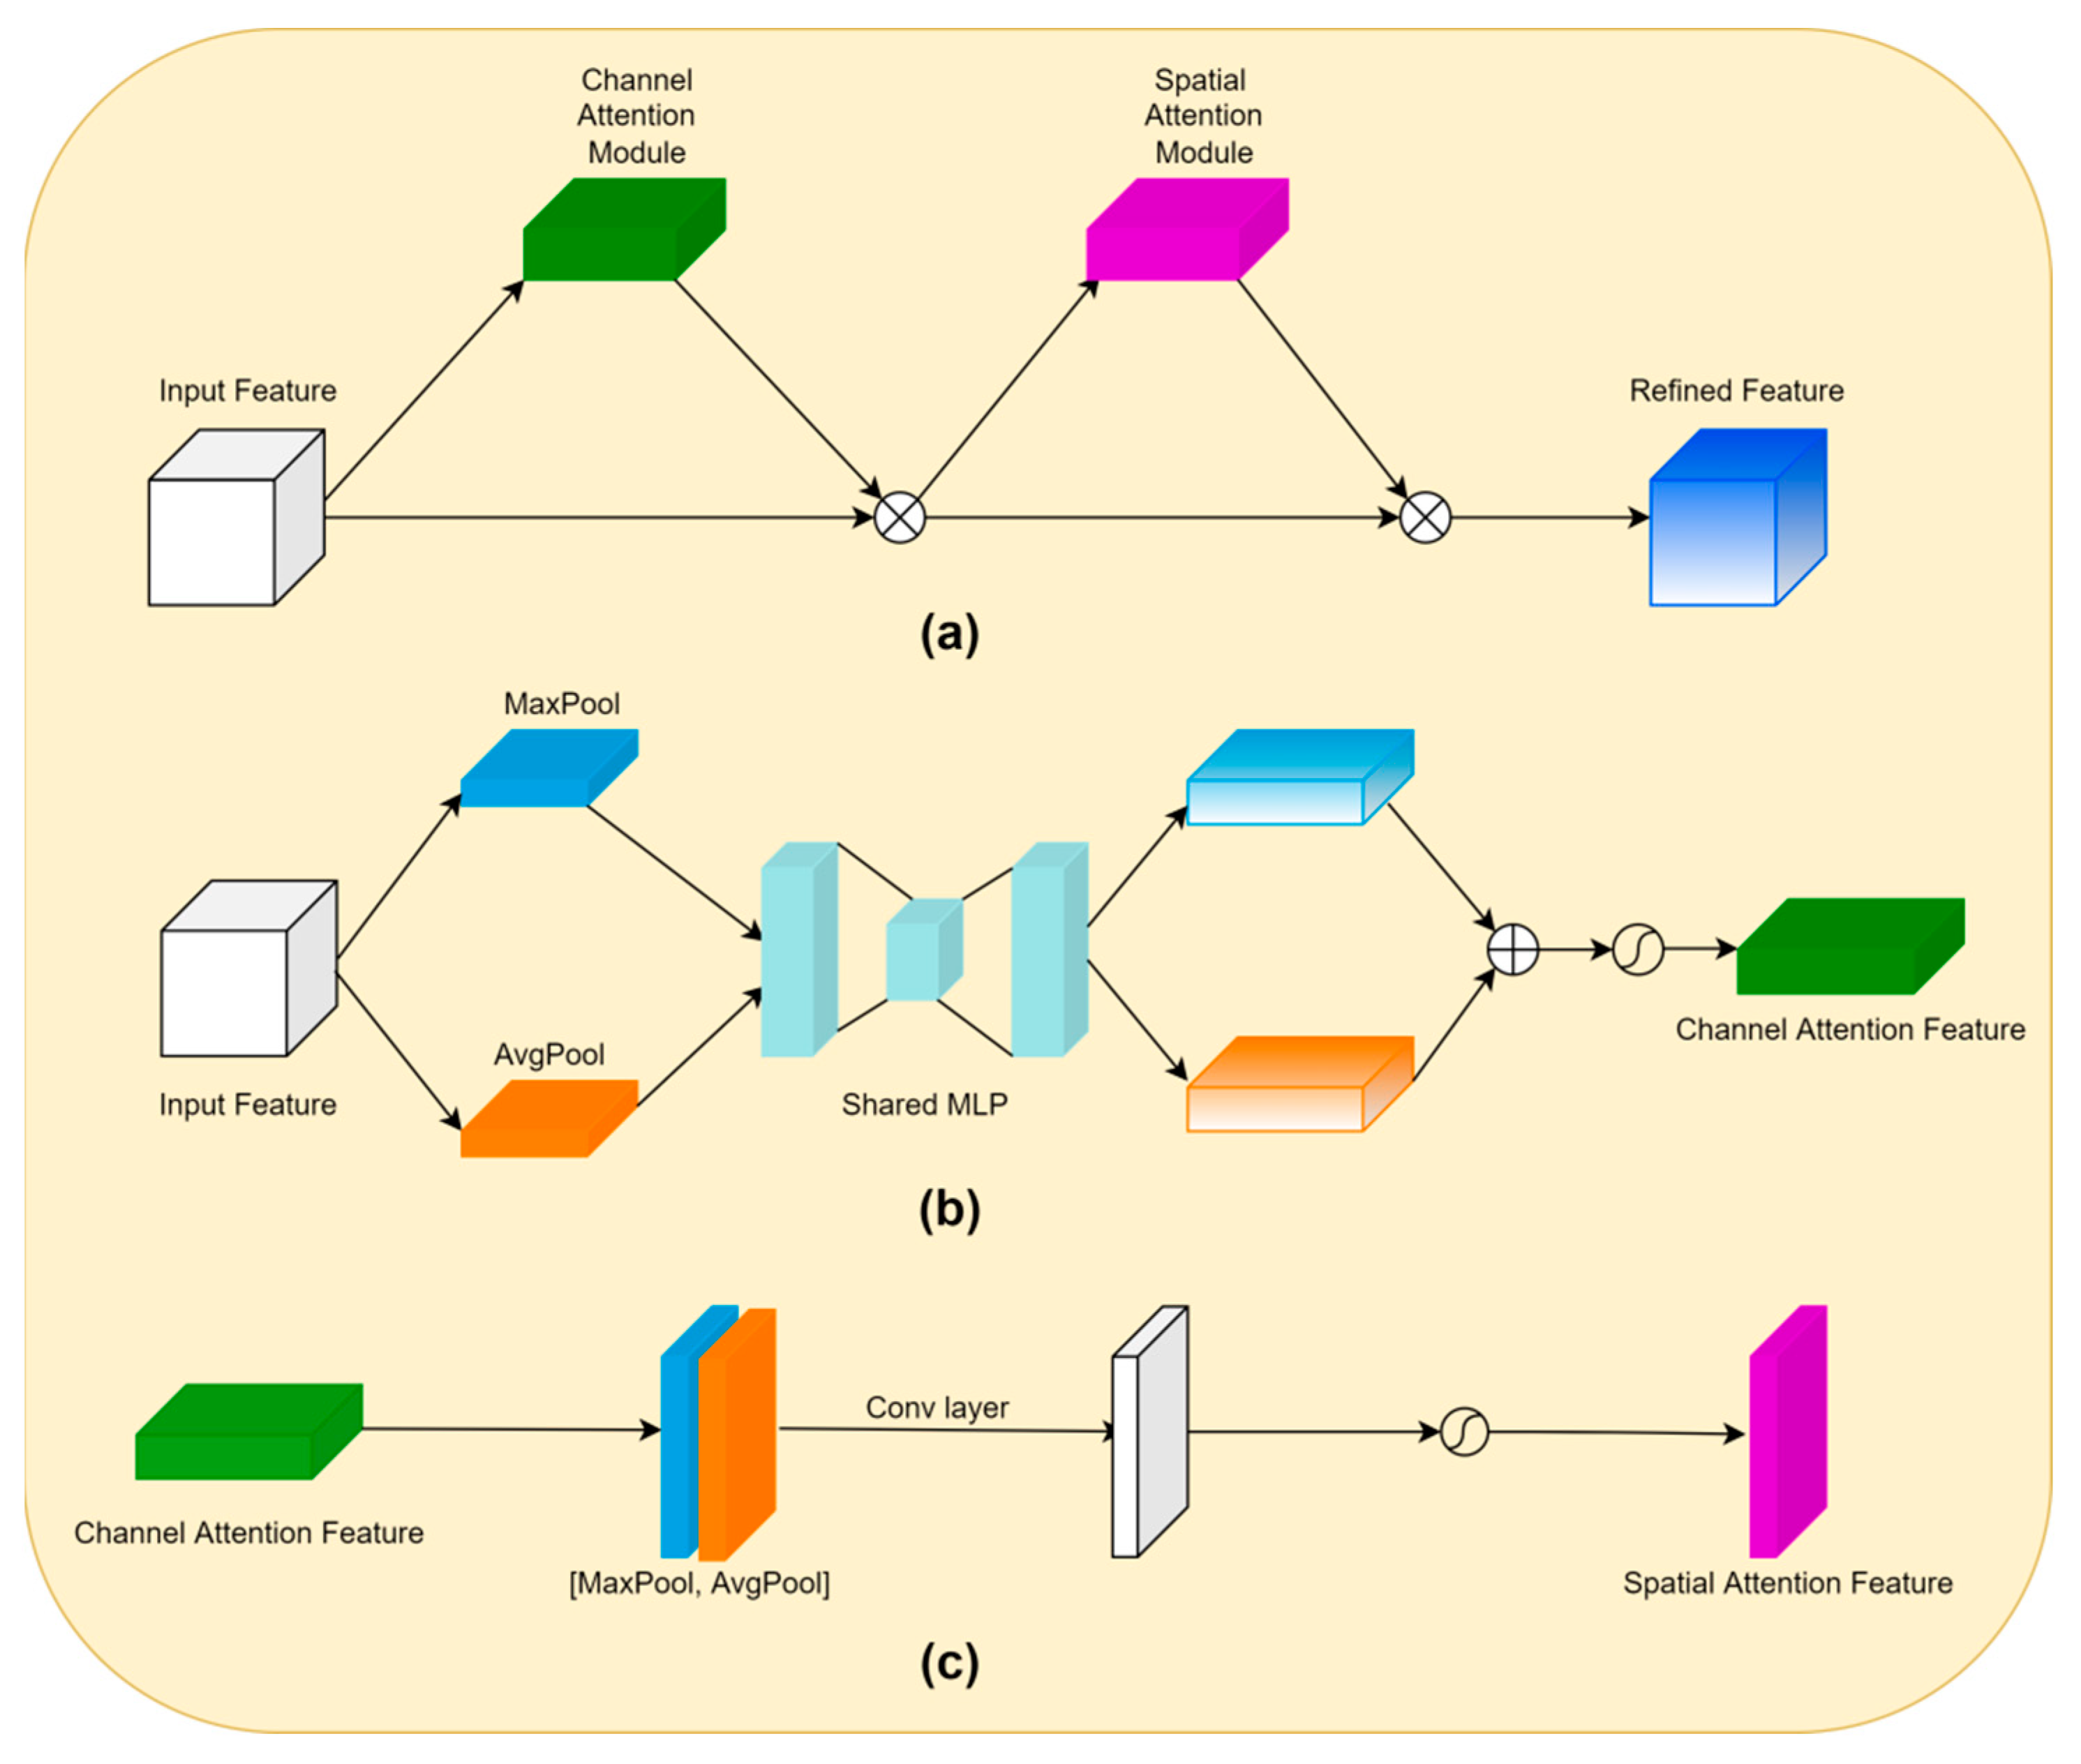
Convolutional Block Attention Module (CBAM)
Cross Stage Partial Layer
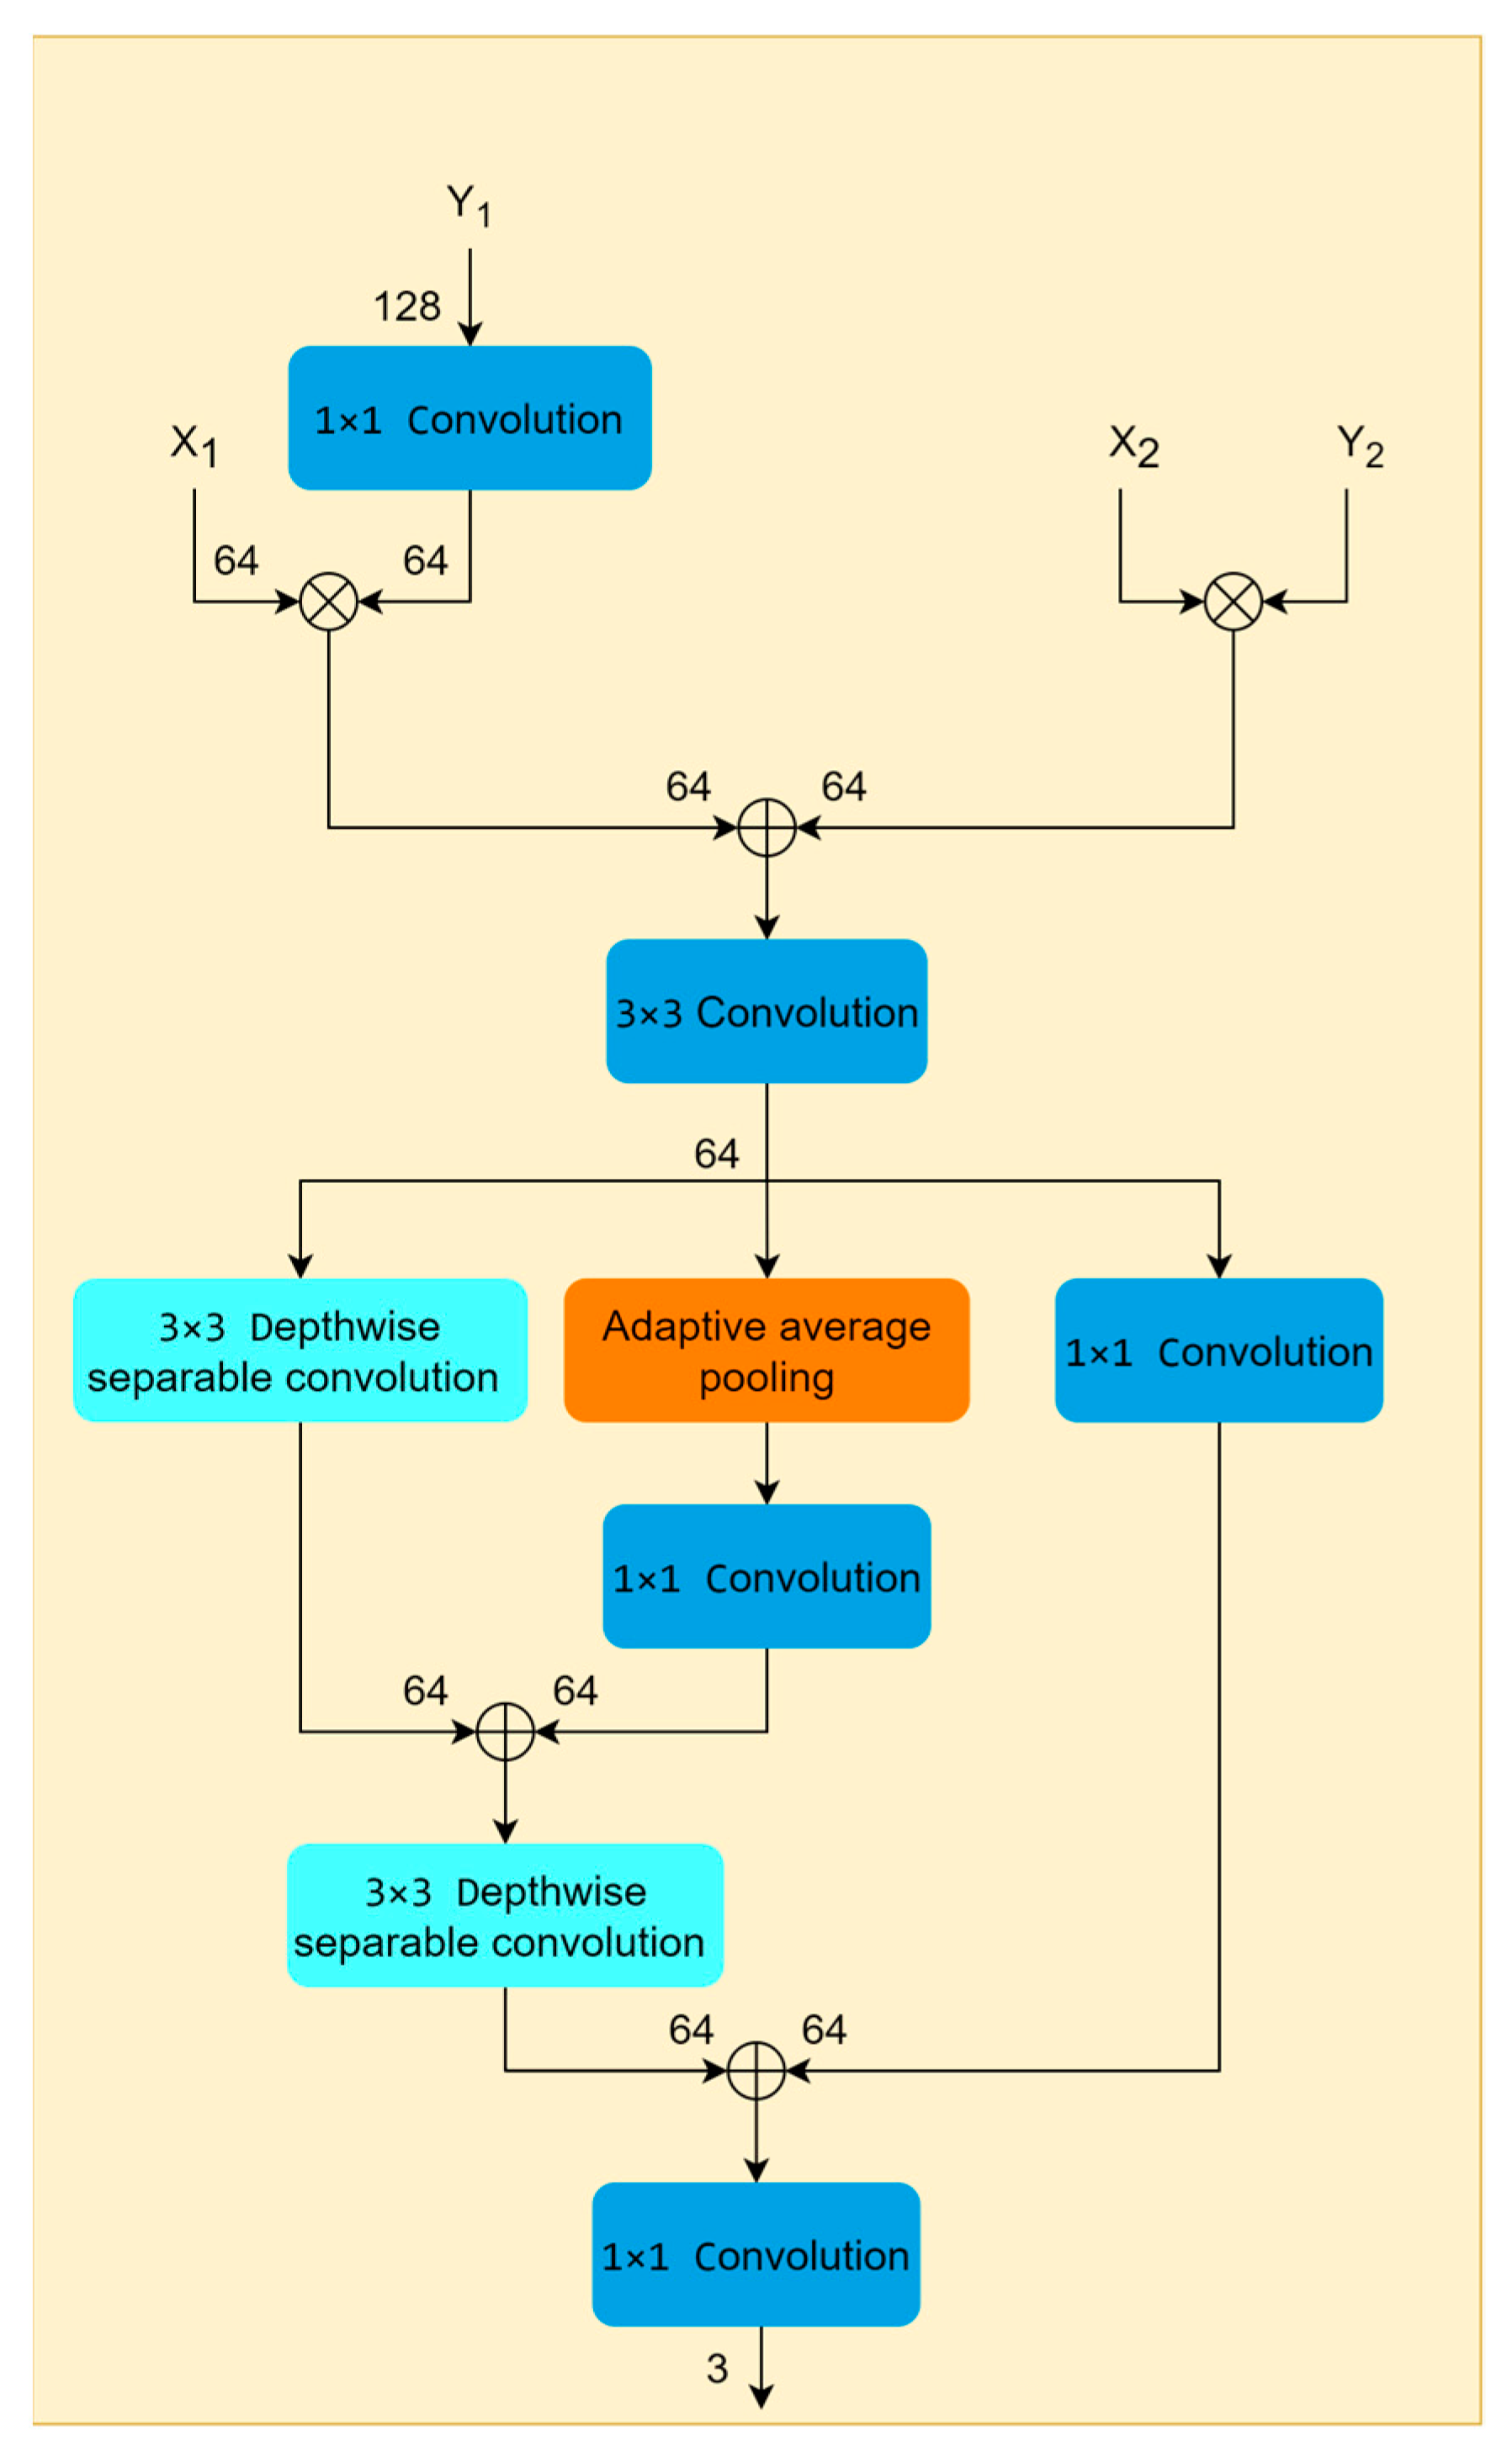
2.2.3. Adjustable Feature Enhancement Layer
3. Dataset Descriptions and Experiment Settings
3.1. Gwadar Dataset
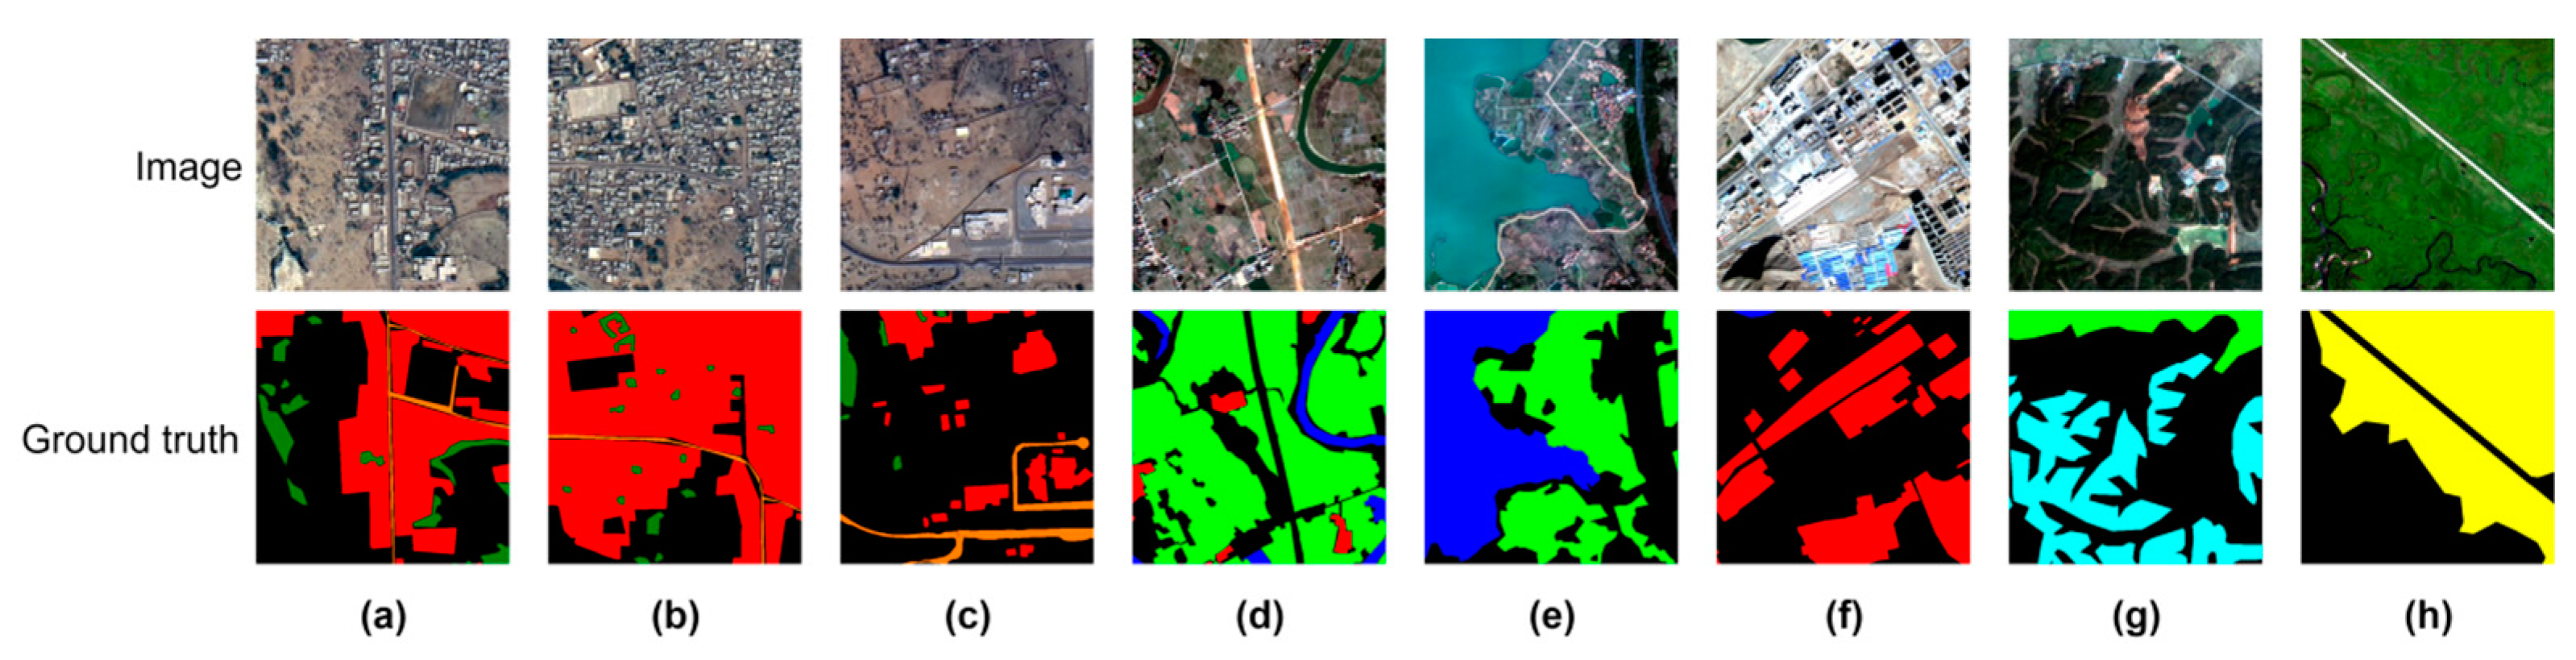
3.2. GID Dataset
3.3. Comparison between Gwadar and GID Datasets Images
3.4. Experiment Settings
3.5. Accuracy Evaluation
4. Experiment Results
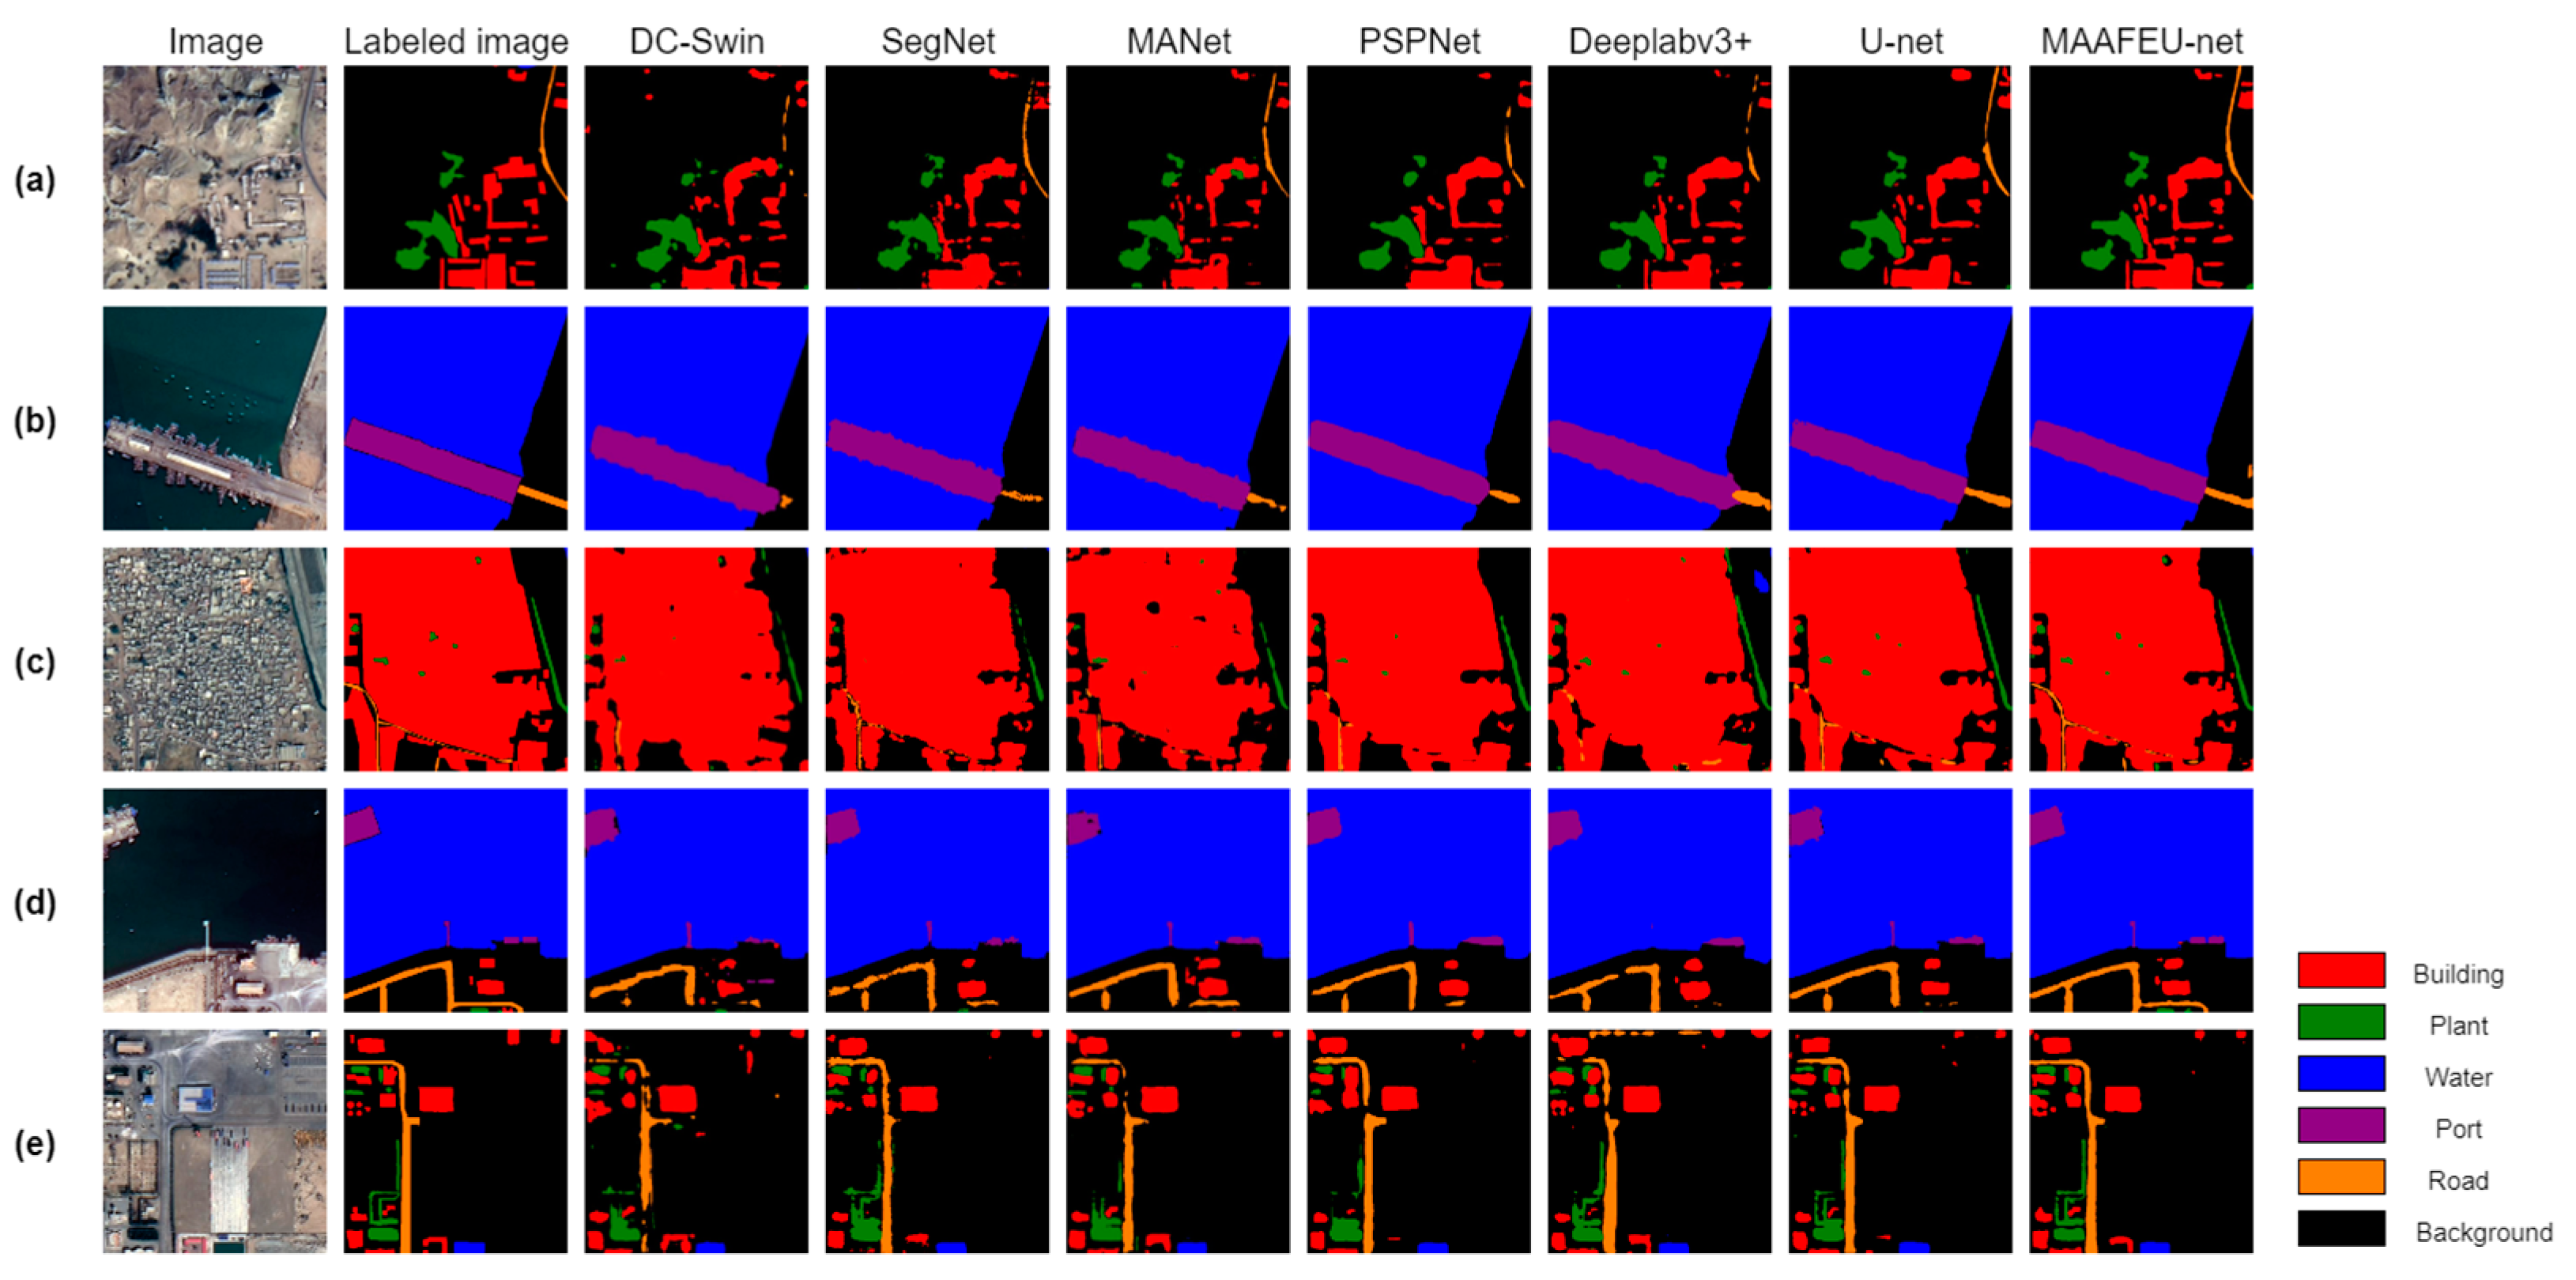
4.1. Results of Gwadar Dataset
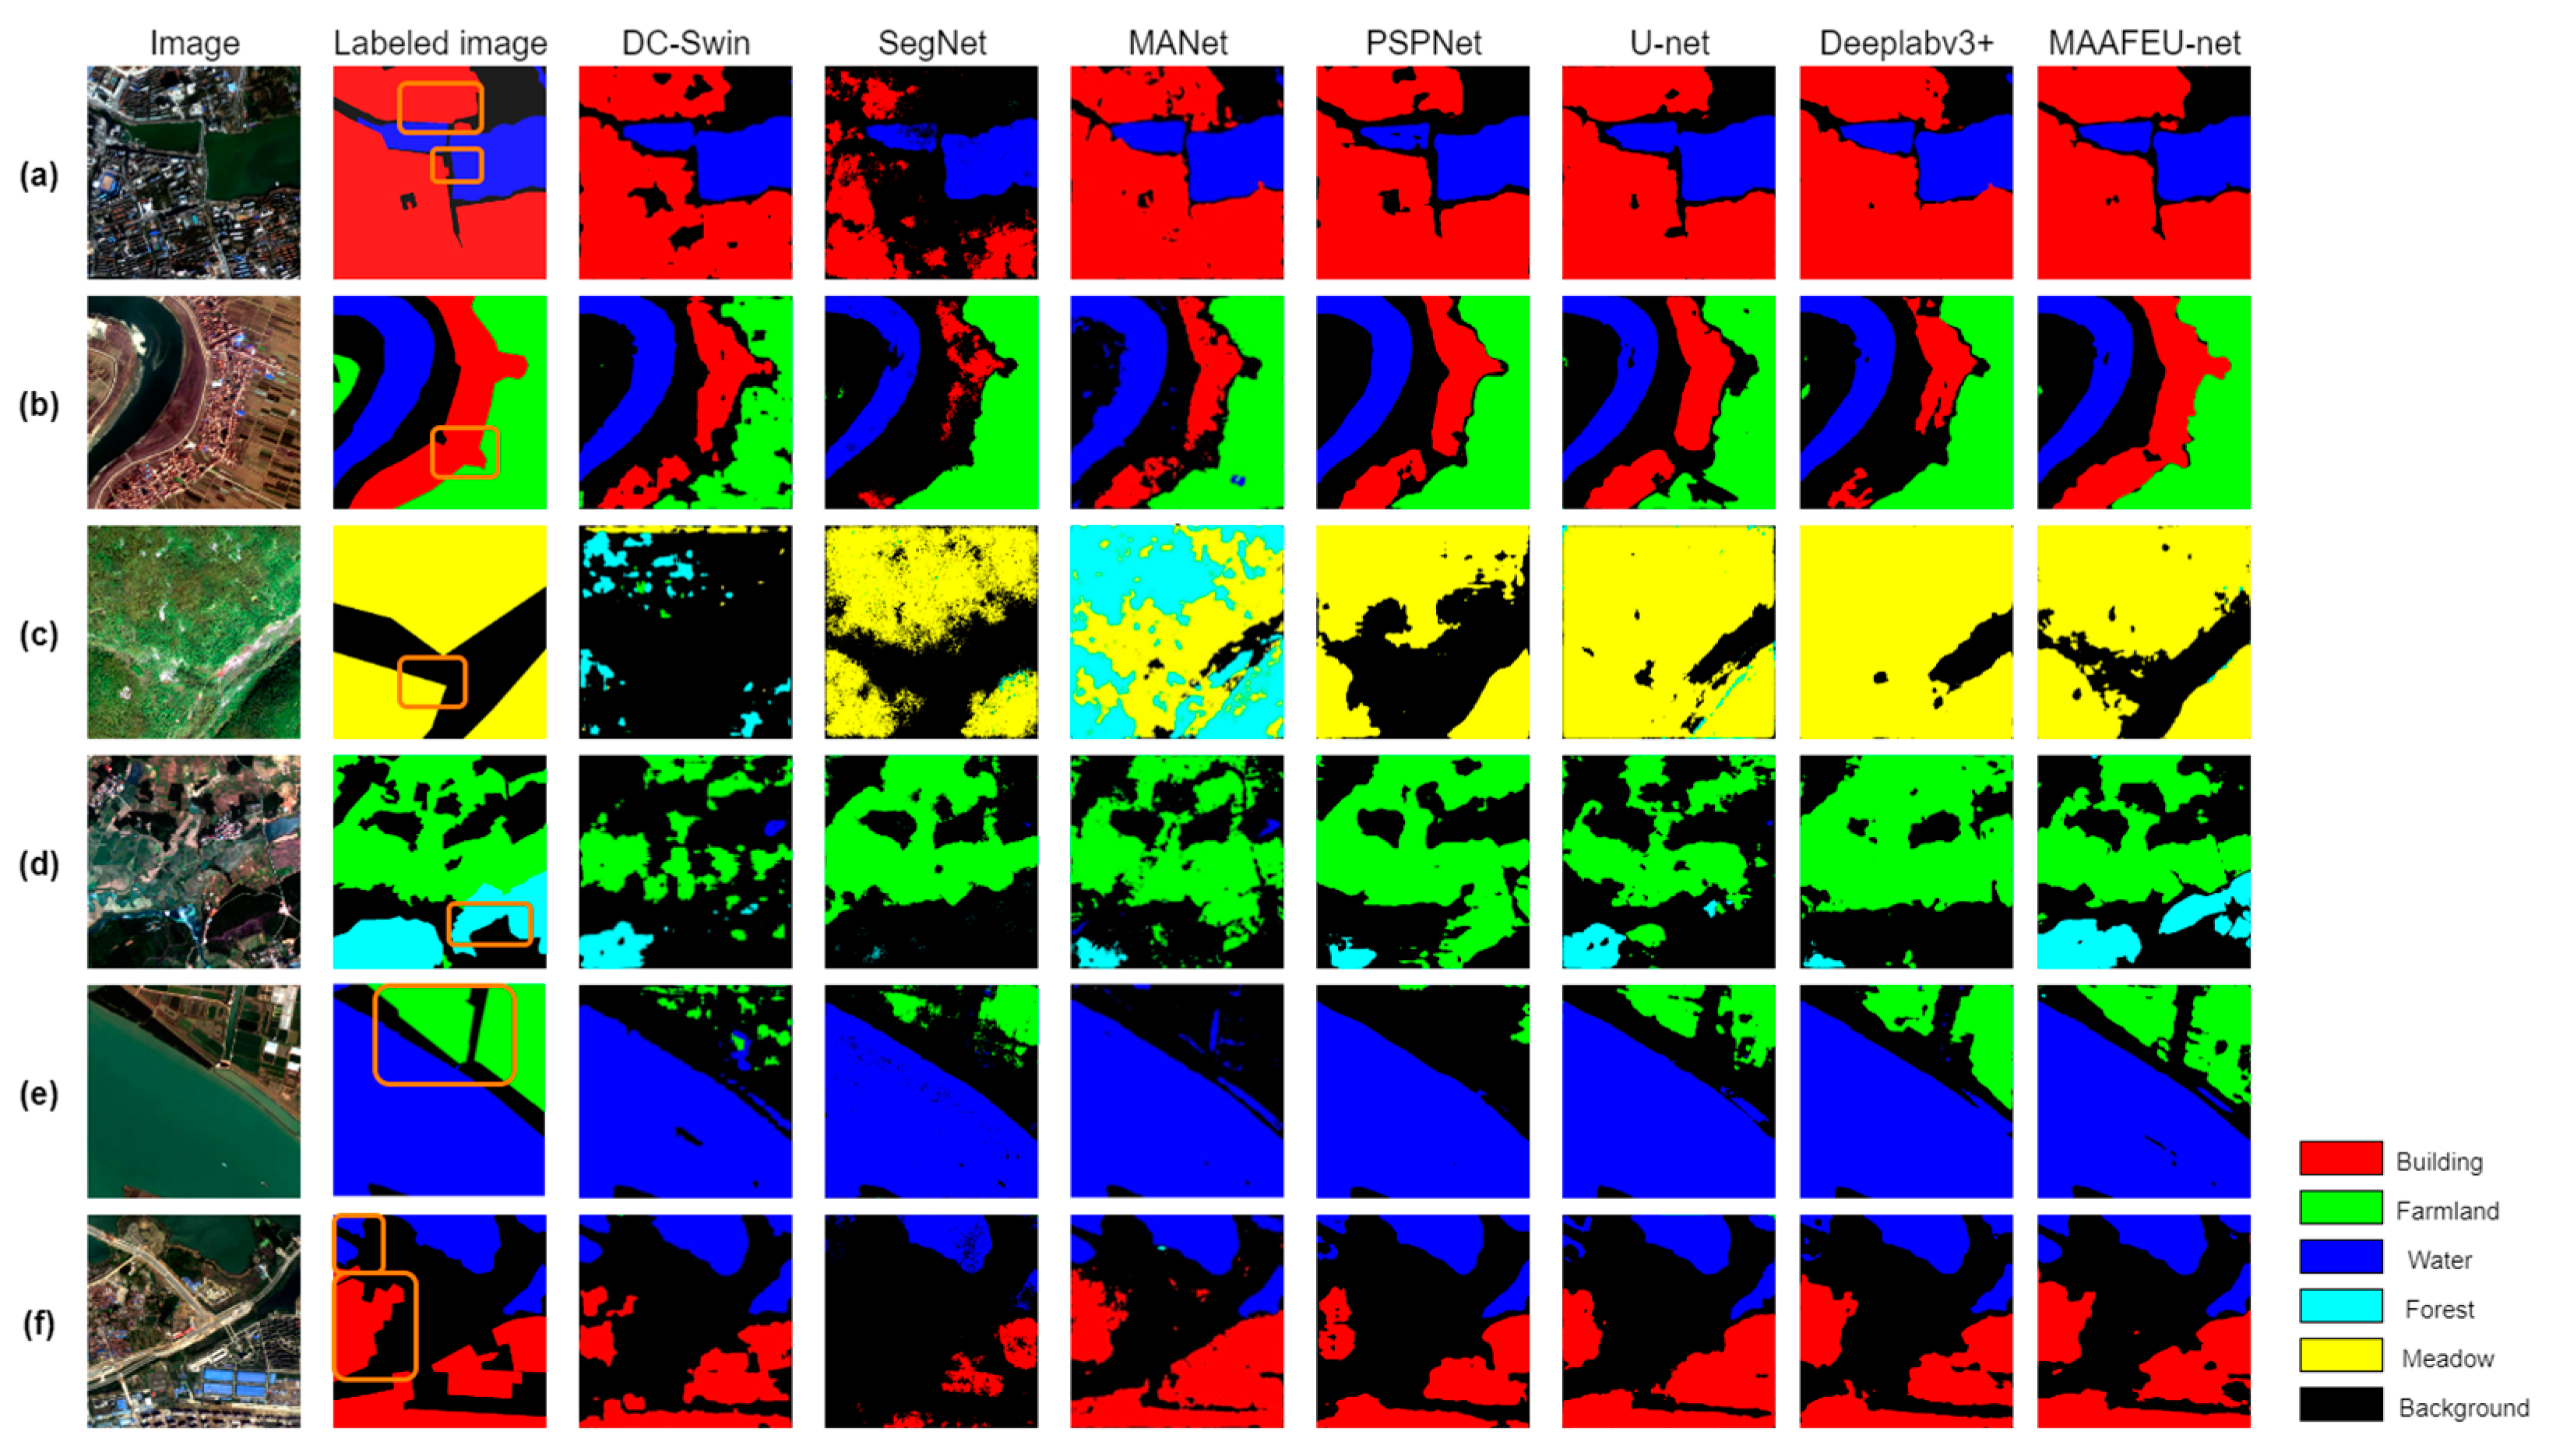
4.2. Results of GID Dataset
4.3. Ablation Experiments
5. Conclusions
Author Contributions
Funding
Data Availability Statement
Acknowledgments
Conflicts of Interest
References
- Liu, X.; He, J.; Yao, Y.; Zhang, J.; Liang, H.; Wang, H.; Hong, Y. Classifying urban land use by integrating remote sensing and social media data. Int. J. Geogr. Inf. Sci. 2017, 31, 1675–1696. [Google Scholar] [CrossRef]
- Hashem, N.; Balakrishnan, P. Change Analysis of Land Use/Land Cover and Modelling Urban Growth in Greater Doha, Qatar. Ann. GIS 2015, 21, 233–247. [Google Scholar] [CrossRef][Green Version]
- Rahman, A.; Kumar, S.; Fazal, S.; Siddiqui, M.A. Assessment of Land Use/Land Cover Change in the North-West District of Delhi Using Remote Sensing and GIS Techniques. J. Indian Soc. Remote Sens. 2012, 40, 689–697. [Google Scholar] [CrossRef]
- Nguyen, K.-A.; Liou, Y.-A. Mapping Global Eco-Environment Vulnerability Due to Human and Nature Disturbances. MethodsX 2019, 6, 862–875. [Google Scholar] [CrossRef]
- Talukdar, S.; Pal, S. Wetland Habitat Vulnerability of Lower Punarbhaba River Basin of the Uplifted Barind Region of Indo-Bangladesh. Geocarto Int. 2020, 35, 857–886. [Google Scholar] [CrossRef]
- Nguyen, A.K.; Liou, Y.-A.; Li, M.-H.; Tran, T.A. Zoning Eco-Environmental Vulnerability for Environmental Management and Protection. Ecol. Indic. 2016, 69, 100–117. [Google Scholar] [CrossRef]
- Dao, P.; Liou, Y.-A. Object-Based Flood Mapping and Affected Rice Field Estimation with Landsat 8 OLI and MODIS Data. Remote. Sens. 2015, 7, 5077–5097. [Google Scholar] [CrossRef][Green Version]
- Liou, Y.-A.; Kar, S.; Chang, L. Use of High-Resolution FORMOSAT-2 Satellite Images for Post-Earthquake Disaster Assessment: A Study Following the 12 May 2008 Wenchuan Earthquake. Int. J. Remote. Sens. 2010, 31, 3355–3368. [Google Scholar] [CrossRef]
- Liou, Y.-A.; Sha, H.-C.; Chen, T.-M.; Wang, T.-S.; Li, Y.-T.; Lai, Y.-C.; Chiang, M.-H. Assessment of Disaster Losses in Rice Paddy Field and Yield after Tsunami Induced by the 2011 Great East Japan Earthquake. J. Mar. Sci. Technol. 2012, 20, 2. [Google Scholar]
- Zhang, Y.; Ge, T.; Tian, W.; Liou, Y.-A. Debris Flow Susceptibility Mapping Using Machine-Learning Techniques in Shigatse Area, China. Remote. Sens. 2019, 11, 2801. [Google Scholar] [CrossRef][Green Version]
- Talukdar, S.; Pal, S. Effects of Damming on the Hydrological Regime of Punarbhaba River Basin Wetlands. Ecol. Eng. 2019, 135, 61–74. [Google Scholar] [CrossRef]
- Langat, P.K.; Kumar, L.; Koech, R.; Ghosh, M.K. Monitoring of Land Use/Land-Cover Dynamics Using Remote Sensing: A Case of Tana River Basin, Kenya. Geocarto Int. 2021, 36, 1470–1488. [Google Scholar] [CrossRef]
- Zomer, R.J.; Trabucco, A.; Ustin, S.L. Building Spectral Libraries for Wetlands Land Cover Classification and Hyperspectral Remote Sensing. J. Environ. Manag. 2009, 90, 2170–2177. [Google Scholar] [CrossRef] [PubMed]
- Talukdar, S.; Singha, P.; Mahato, S.; Shahfahad; Pal, S.; Liou, Y.-A.; Rahman, A. Land-Use Land-Cover Classification by Machine Learning Classifiers for Satellite Observations—A Review. Remote Sens. 2020, 12, 1135. [Google Scholar] [CrossRef][Green Version]
- Abdi, A.M. Land Cover and Land Use Classification Performance of Machine Learning Algorithms in a Boreal Landscape Using Sentinel-2 Data. GIScience Remote Sens. 2020, 57, 1–20. [Google Scholar] [CrossRef][Green Version]
- Wang, J.; Bretz, M.; Dewan, M.A.A.; Delavar, M.A. Machine Learning in Modelling Land-Use and Land Cover-Change (LULCC): Current Status, Challenges and Prospects. Sci. Total Environ. 2022, 822, 153559. [Google Scholar] [CrossRef]
- Zhang, M.; Zhang, C.; Kafy, A.-A.; Tan, S. Simulating the Relationship between Land Use/Cover Change and Urban Thermal Environment Using Machine Learning Algorithms in Wuhan City, China. Land 2021, 11, 14. [Google Scholar] [CrossRef]
- Hao, J.; Lin, Q.; Wu, T.; Chen, J.; Li, W.; Wu, X.; Hu, G.; La, Y. Spatial–Temporal and Driving Factors of Land Use/Cover Change in Mongolia from 1990 to 2021. Remote Sens. 2023, 15, 1813. [Google Scholar] [CrossRef]
- Carlier, J.; Doyle, M.; Finn, J.A.; Ó hUallacháin, D.; Moran, J. A Landscape Classification Map of Ireland and Its Potential Use in National Land Use Monitoring. J. Environ. Manag. 2021, 289, 112498. [Google Scholar] [CrossRef]
- Kaczmarek, I.; Iwaniak, A.; Świetlicka, A.; Piwowarczyk, M.; Nadolny, A. A Machine Learning Approach for Integration of Spatial Development Plans Based on Natural Language Processing. Sustain. Cities Soc. 2022, 76, 103479. [Google Scholar] [CrossRef]
- Zhang, M.; Kafy, A.-A.; Xiao, P.; Han, S.; Zou, S.; Saha, M.; Zhang, C.; Tan, S. Impact of Urban Expansion on Land Surface Temperature and Carbon Emissions Using Machine Learning Algorithms in Wuhan, China. Urban Clim. 2023, 47, 101347. [Google Scholar] [CrossRef]
- Rahnama, M.R. Forecasting land-use changes in Mashhad Metropolitan area using Cellular Automata and Markov chain model for 2016-2030. Sustain. Cities Soc. 2020, 64, 102548. [Google Scholar] [CrossRef]
- Sobhani, P.; Esmaeilzadeh, H.; Mostafavi, H. Simulation and impact assessment of future land use and land cover changes in two protected areas in Tehran, Iran. Sustain. Cities Soc. 2021, 75, 103296. [Google Scholar] [CrossRef]
- Shapiro, L.G.; Stockman, G.C. Computer Vision; Prentice Hall: Upper Saddle River, NJ, USA, 2001; Volume 3. [Google Scholar]
- Liang, X.; Luo, C.; Quan, J.; Xiao, K.; Gao, W. Research on Progress of Image Semantic Segmentation Based on Deep Learning. Comput. Eng. Appl. 2020, 56, 18–28. [Google Scholar]
- Yu, M.T.; Sein, M.M. Automatic Image Captioning System Using Integration of N-Cut and Color-Based Segmentation Method. In Proceedings of the SICE Annual Conference 2011, Tokyo, Japan, 13–18 September 2011; pp. 28–31. [Google Scholar]
- Wang, D.; He, K.; Wang, B.; Liu, X.; Zhou, J. Solitary Pulmonary Nodule Segmentation Based on Pyramid and Improved Grab Cut. Comput. Methods Programs Biomed. 2021, 199, 105910. [Google Scholar] [CrossRef] [PubMed]
- Badrinarayanan, V.; Kendall, A.; Cipolla, R. SegNet: A Deep Convolutional Encoder-Decoder Architecture for Image Segmentation. IEEE Trans. Pattern Anal. Mach. Intell. 2017, 39, 2481–2495. [Google Scholar] [CrossRef] [PubMed]
- Zhao, H.; Shi, J.; Qi, X.; Wang, X.; Jia, J. Pyramid Scene Parsing Network. In Proceedings of the 2017 IEEE Conference on Computer Vision and Pattern Recognition (CVPR), Honolulu, HI, USA, 21–26 July 2017; pp. 6230–6239. [Google Scholar]
- Ronneberger, O.; Fischer, P.; Brox, T. U-Net: Convolutional Networks for Biomedical Image Segmentation. In Medical Image Computing and Computer-Assisted Intervention—MICCAI 2015; Navab, N., Hornegger, J., Wells, W.M., Frangi, A.F., Eds.; Lecture Notes in Computer Science; Springer International Publishing: Cham, Switzerland, 2015; Volume 9351, pp. 234–241. ISBN 978-3-319-24573-7. [Google Scholar]
- Chen, L.-C.; Zhu, Y.; Papandreou, G.; Schroff, F.; Adam, H. Encoder-Decoder with Atrous Separable Convolution for Semantic Image Segmentation. In Computer Vision—ECCV 2018; Ferrari, V., Hebert, M., Sminchisescu, C., Weiss, Y., Eds.; Lecture Notes in Computer Science; Springer International Publishing: Cham, Switzerland, 2018; Volume 11211, pp. 833–851. ISBN 978-3-030-01233-5. [Google Scholar]
- Li, R.; Zheng, S.; Zhang, C.; Duan, C.; Su, J.; Wang, L.; Atkinson, P.M. Multiattention Network for Semantic Segmentation of Fine-Resolution Remote Sensing Images. IEEE Trans. Geosci. Remote Sens. 2022, 60, 1–13. [Google Scholar] [CrossRef]
- Wang, L.; Li, R.; Duan, C.; Zhang, C.; Meng, X.; Fang, S. A Novel Transformer Based Semantic Segmentation Scheme for Fine-Resolution Remote Sensing Images. IEEE Geosci. Remote Sens. Lett. 2022, 19, 1–5. [Google Scholar] [CrossRef]
- Yuan, X.; Chen, Z.; Chen, N.; Gong, J. Land cover classification based on the PSPNet and superpixel segmentation methods with high spatial resolution multispectral remote sensing imagery. J. Appl. Remote. Sens. 2021, 15, 034511. [Google Scholar] [CrossRef]
- Zhan, Z.Q.; Zhang, X.M.; Liu, Y.; Sun, X.; Pang, C.; Zhao, C.B. Vegetation Land Use/Land Cover Extraction From High-Resolution Satellite Images Based on Adaptive Context Inference. IEEE Access 2020, 8, 21036–21051. [Google Scholar] [CrossRef]
- Hu, Y.; He, H.; Weng, L. Hyperspectral and LiDAR Data Land-Use Classification Using Parallel Transformers. In Proceedings of the IGARSS 2022–2022 IEEE International Geoscience and Remote Sensing Symposium, Kuala Lumpur, Malaysia, 17–22 July 2022; pp. 703–706. [Google Scholar]
- Li, Z.; Chen, G.; Zhang, T. A CNN-Transformer Hybrid Approach for Crop Classification Using Multitemporal Multisensor Images. IEEE J. Sel. Top. Appl. Earth Obs. Remote Sens. 2020, 13, 847–858. [Google Scholar] [CrossRef]
- Sun, Y.; Zhang, X.; Xin, Q.; Huang, J. Developing a Multi-Filter Convolutional Neural Network for Semantic Segmentation Using High-Resolution Aerial Imagery and LiDAR Data. ISPRS J. Photogramm. Remote Sens. 2018, 143, 3–14. [Google Scholar] [CrossRef]
- Wang, X.; Zhang, X.; Su, C. Land Use Classification of Remote Sensing Images Based on Multi-Scale Learning and Deep Convolution Neural Network. J. ZheJiang Univ. Sci. Ed. 2020, 47, 715–723. [Google Scholar]
- Shi, J.; Zhang, X.; Liu, X.; Lei, Y. Deep Change Feature Analysis Network for Observing Changes of Land Use or Natural Environment. Sustain. Cities Soc. 2021, 68, 102760. [Google Scholar] [CrossRef]
- He, K.; Zhang, X.; Ren, S.; Sun, J. Deep residual learning for image recognition. In Proceedings of the IEEE Computer Society Conference on Computer Vision and Pattern Recognition (CVPR), Las Vegas, NV, USA, 27–30 June 2015; pp. 770–778. [Google Scholar]
- Liu, Z.; Lin, Y.; Cao, Y.; Hu, H.; Wei, Y.; Zhang, Z.; Lin, S.; Guo, B. Swin Transformer: Hierarchical Vision Transformer Using Shifted Windows. In Proceedings of the 2021 IEEE/CVF International Conference on Computer Vision (ICCV), Montreal, QC, Canada, 10–17 October 2021; pp. 9992–10002. [Google Scholar]
- Woo, S.; Park, J.; Lee, J.-Y.; Kweon, I.S. CBAM: Convolutional Block Attention Module. In Computer Vision—ECCV 2018; Ferrari, V., Hebert, M., Sminchisescu, C., Weiss, Y., Eds.; Lecture Notes in Computer Science; Springer International Publishing: Cham, Switzerland, 2018; Volume 11211, pp. 3–19. ISBN 978-3-030-01233-5. [Google Scholar]
- Ultralytics. Yolov5. Available online: https://github.com/ultralytics/yolov5 (accessed on 23 May 2022).
- Wang, C.-Y.; Mark Liao, H.-Y.; Wu, Y.-H.; Chen, P.-Y.; Hsieh, J.-W.; Yeh, I.-H. CSPNet: A New Backbone That Can Enhance Learning Capability of CNN. In Proceedings of the 2020 IEEE/CVF Conference on Computer Vision and Pattern Recognition Workshops (CVPRW), Seattle, WA, USA, 14–19 June 2020; pp. 1571–1580. [Google Scholar]
- Tong, X.-Y.; Xia, G.-S.; Lu, Q.; Shen, H.; Li, S.; You, S.; Zhang, L. Land-Cover Classification with High-Resolution Remote Sensing Images Using Transferable Deep Models. Remote Sens. Environ. 2020, 237, 111322. [Google Scholar] [CrossRef][Green Version]


| Land-Use Class | Introduction | Original Image | Labeled Image |
|---|---|---|---|
| Building (labeled in red) | Refers to urban residential land and the land for facilities and factories |  |  |
| Plant (labeled in green) | Refers to land for trees, meadows and other crops |  |  |
| Water (labeled in blue) | Refers to land for the sea and pond |  |  |
| Port (labeled in purple) | Refers to land for berthing vessels and cargo handling |  |  |
| Road (labeled in orange) | Refers to land used for transportation |  |  |
| Background (labeled in black) | Refers to land that is difficult to identify or not in the study type |  |  |
| Land-Use Class | Area (m2) | Proportion (%) |
|---|---|---|
| Building | 300,215,284 | 25.34 |
| Plant | 26,752,008 | 2.26 |
| Water | 285,282,488 | 24.08 |
| Port | 3,275,696 | 0.28 |
| Road | 30,865,572 | 2.60 |
| Background | 538,499,832 | 45.44 |
| Total | 1,184,890,880 | 100 |
| Land-Use Class | Original Image | Labeled Image |
|---|---|---|
| Building (labeled in red) |  |  |
| Farmland (labeled in green) |  |  |
| Water (labeled in blue) |  |  |
| Forest (labeled in light blue) |  |  |
| Meadow (labeled in yellow) |  |  |
| Background (labeled in black) |  |  |
| Method | IOU of Different Land Use Types | Overall Accuracy | Average F1 Score | MIoU | |||||
|---|---|---|---|---|---|---|---|---|---|
| Building | Plant | Water | Port | Road | Background | ||||
| DC-Swin | 86.16 | 52.23 | 98.52 | 72.38 | 45.52 | 88.07 | 93.48 | 83.87 | 73.83 |
| SegNet | 88.27 | 58.81 | 98.71 | 76.48 | 59.23 | 89.80 | 94.63 | 87.32 | 78.55 |
| MANet | 88.07 | 57.65 | 98.73 | 79.42 | 57.60 | 90.04 | 94.66 | 87.53 | 78.59 |
| PSPNet | 90.23 | 60.13 | 98.67 | 77.88 | 59.66 | 91.34 | 95.32 | 88.04 | 79.65 |
| Deeplabv3+ | 90.49 | 61.42 | 98.38 | 77.07 | 61.42 | 91.07 | 95.23 | 88.26 | 80.11 |
| U-net | 92.01 | 69.84 | 99.01 | 86.91 | 68.61 | 92.88 | 96.26 | 91.39 | 84.88 |
| MAAFEU-net | 92.71 | 76.37 | 98.94 | 92.00 | 77.32 | 93.65 | 96.78 | 93.69 | 88.50 |
| Method | IOU of Different Land Use Types | Overall Accuracy | Average F1 Score | MIoU | |||||
|---|---|---|---|---|---|---|---|---|---|
| Building | Farmland | Water | Forest | Meadow | Background | ||||
| DC-Swin | 58.24 | 43.79 | 66.88 | 28.70 | 8.85 | 55.83 | 68.46 | 62.63 | 43.71 |
| SegNet | 32.12 | 65.55 | 70.49 | 8.20 | 35.44 | 59.43 | 73.08 | 64.57 | 45.21 |
| MANet | 60.24 | 56.18 | 71.63 | 43.96 | 38.70 | 57.41 | 72.86 | 70.38 | 54.69 |
| PSPNet | 61.86 | 62.13 | 70.49 | 39.29 | 45.19 | 60.47 | 75.69 | 67.84 | 56.99 |
| U-net | 62.40 | 55.42 | 74.19 | 48.55 | 51.61 | 58.79 | 73.91 | 73.80 | 58.49 |
| Deeplabv3+ | 62.58 | 64.39 | 71.99 | 44.75 | 48.50 | 59.71 | 76.10 | 74.22 | 58.65 |
| MAAFEU-net | 66.01 | 66.15 | 74.44 | 54.76 | 49.53 | 59.93 | 77.35 | 76.38 | 61.80 |
| Method | IOU of Different Land Use Types | MIoU | |||||
|---|---|---|---|---|---|---|---|
| Building | Farmland | Water | Forest | Meadow | Background | ||
| U-net (ResNet50) | 55.68 | 61.2 | 60.54 | 33.17 | 29.98 | 58.83 | 49.90 |
| U-net + Focus | 54.52 | 56.49 | 67.75 | 27.29 | 36.94 | 59.35 | 50.39 |
| U-net + Focus + CBAM | 61.13 | 60.56 | 67.62 | 37.33 | 37.71 | 55.83 | 53.36 |
| U-net + Focus + Swin Transformer | 59.16 | 57.61 | 64.75 | 38.13 | 34.35 | 57.14 | 51.85 |
| U-net + Focus + Swin Transformer + CBAM | 55.86 | 60.79 | 66.15 | 45.08 | 41.73 | 60.49 | 55.01 |
| U-net + Focus + MA | 60.36 | 65.37 | 74.14 | 47.24 | 29.47 | 60.74 | 56.22 |
| MAAFEU-net | 66.01 | 66.15 | 74.44 | 54.76 | 49.53 | 59.93 | 61.80 |
Disclaimer/Publisher’s Note: The statements, opinions and data contained in all publications are solely those of the individual author(s) and contributor(s) and not of MDPI and/or the editor(s). MDPI and/or the editor(s) disclaim responsibility for any injury to people or property resulting from any ideas, methods, instructions or products referred to in the content. |
© 2023 by the authors. Licensee MDPI, Basel, Switzerland. This article is an open access article distributed under the terms and conditions of the Creative Commons Attribution (CC BY) license (https://creativecommons.org/licenses/by/4.0/).
Share and Cite
Zhang, Y.; Zhao, H.; Ma, G.; Xie, D.; Geng, S.; Lu, H.; Tian, W.; Lim Kam Sian, K.T.C. MAAFEU-Net: A Novel Land Use Classification Model Based on Mixed Attention Module and Adjustable Feature Enhancement Layer in Remote Sensing Images. ISPRS Int. J. Geo-Inf. 2023, 12, 206. https://doi.org/10.3390/ijgi12050206
Zhang Y, Zhao H, Ma G, Xie D, Geng S, Lu H, Tian W, Lim Kam Sian KTC. MAAFEU-Net: A Novel Land Use Classification Model Based on Mixed Attention Module and Adjustable Feature Enhancement Layer in Remote Sensing Images. ISPRS International Journal of Geo-Information. 2023; 12(5):206. https://doi.org/10.3390/ijgi12050206
Chicago/Turabian StyleZhang, Yonghong, Huajun Zhao, Guangyi Ma, Donglin Xie, Sutong Geng, Huanyu Lu, Wei Tian, and Kenny Thiam Choy Lim Kam Sian. 2023. "MAAFEU-Net: A Novel Land Use Classification Model Based on Mixed Attention Module and Adjustable Feature Enhancement Layer in Remote Sensing Images" ISPRS International Journal of Geo-Information 12, no. 5: 206. https://doi.org/10.3390/ijgi12050206
APA StyleZhang, Y., Zhao, H., Ma, G., Xie, D., Geng, S., Lu, H., Tian, W., & Lim Kam Sian, K. T. C. (2023). MAAFEU-Net: A Novel Land Use Classification Model Based on Mixed Attention Module and Adjustable Feature Enhancement Layer in Remote Sensing Images. ISPRS International Journal of Geo-Information, 12(5), 206. https://doi.org/10.3390/ijgi12050206