1. Introduction
The rapid expansion of large cities worldwide and the rapid growth of private car ownership over the past half century have brought about a series of social problems and environmental challenges, including traffic congestion, energy consumption, and air pollution [
1]. In this context, the concept of public transportation-oriented development has been widely recognized worldwide as an effective way to restrain urban expansion, alleviate urban traffic congestion, reduce urban air pollution, and promote sustainable urban development [
2,
3]. As one of the most popular alternatives to automobiles, urban rail transit has many advantages, including its large capacity, high speed, low cost, punctuality, and safety. It has also developed rapidly in many large cities around the world in the past few decades. Metro ridership is an important feature of the metro system and is closely related to the built environment [
4,
5,
6,
7]. This has drawn more attention to the impact of the built environment on metro ridership, thus providing guidance for planning departments and government managers to formulate sustainable urban development strategies.
Many studies have shown that the built environment around a station can significantly impact metro ridership [
8,
9]. These studies have put forward 5D-based influencing factors (density, diversity, design, destination accessibility, and distance to public transport stops). However, the existing research mostly emphasizes the impact of the origin built environment on the passenger flow of metro stations, and pays less attention to the impact of the built environment at the destination [
10]. Research based on Washington and Wuhan, among other places, shows that the built environment of the destination also has an important impact on residents’ travel, in addition to the origin [
10,
11]. The research also shows that the same built environment element may have different effects at the origin and the destination. Therefore, exploring the impact of the built environment on metro ridership from both the origin and destination can help us to understand the mechanisms of the effect of the built environment on metro ridership. This will help planners and government managers to formulate more efficient land use and optimization measures, as well as related policies.
In addition, the existing research on the relationship between the built environment and metro ridership usually assumes a linear or generalized linear relationship between the two [
2,
10,
12]. However, with the gradual introduction of artificial intelligence and machine learning methods into urban research in recent years, some studies have adopted machine learning methods such as GBDT and GBRT to explore the relationship between the built environment and metro ridership [
2,
13]. The research results show a complex nonlinear relationship between the built environment and metro ridership, i.e., the built environment has a significant impact on metro ridership only within a specific range. For example, a study in Washington found that the population density within the station area can have a positive effect on metro ridership only when there are between 5 and 35 people per acre; when the population density exceeds 35 people per acre, it can no longer have a positive impact on the metro ridership [
4]. In addition, GBDT can also examine the relative importance of the impact of different built environment elements on metro ridership. Research based on Washington shows that the number of cars and bus stops, and the employment density, within the metro station area are the three most important factors affecting the passenger flow of metro stations [
4]. Understanding the effective threshold and relative importance of the impact of the built environment on metro ridership is critical for determining the extent and timing of planning interventions under the condition of limited resources.
To fill the above-mentioned gaps, this study applies the GBDT model to metro card swiping data from Chongqing, China, in November 2019. It attempts to address the following research questions: (1) What are the specific contributions of the built environment of origin and destination to metro ridership? (2) Is there a complex nonlinear relationship between the built environments of origin and destination and metro ridership? (3) Which built environment variables at the origin and destination are most helpful in promoting metro ridership?
The structure of this paper is as follows. First, we review the literature on the relationship between the built environment and metro ridership. Second, we describe the study area, methods, and data. We then apply the preceding model and discuss the results of the empirical model in the next section. Finally, we summarize the policy implications of this paper and suggest future research directions.
2. Literature Review
The built environment has long been recognized as an important factor affecting metro ridership [
8,
9]. It is according to this that the 5D influence factors of density, design, diversity, distance to public transit stations, and destination accessibility have been determined. Specifically, density (including population density and spatial density) is an important factor affecting metro ridership [
5,
14,
15]. The higher the density, the greater the travel demand and the higher the metro ridership. For example, the proportion of the unmarried population around the metro station in Seoul is positively correlated with the metro ridership [
7,
16]. In a study of Shenzhen, it was found that the density of the living population and the employment population density around the metro station also have a significant positive impact on the metro ridership [
2]. In studies of Shenzhen and New York, it was also found that the commercial area around the metro station significantly promotes metro ridership [
17].
Diversity is mainly reflected in the land use mixing degree, as an important means of promoting the region’s vitality [
18,
19]. The higher the land use mixing degree, the more complete the public service facilities in the region, the more attractive the region is, and the more conducive it is to promoting metro ridership. Based on experiences in Washington and Madrid, the land use mixing degree has a significant positive correlation with metro ridership [
4,
20]. However, some studies have found that the impact of land use mix on public transport passengers is not obvious [
21].
Previous research has also addressed the impact of street connectivity, a dimension of urban design, on metro ridership. Many studies have shown that the number of intersections around metro stations, road density, road length, etc., have a positive impact on metro ridership [
22,
23]. However, some studies have also found that intersection density negatively impacts metro ridership, especially for special groups, such as the elderly and the disabled [
14,
24].
Distance to public transport stations is also an important factor affecting metro ridership. Existing research measures the convenience of multimodal transport through the number of public transport stations and parking lots around a metro station [
6,
13,
14]. Studies have shown that the greater the number of public transport stations and parking lots around a metro station, the more conducive it is to multimodal transportation, which in turn has a very positive effect on improving metro ridership [
14,
21,
25].
Destination accessibility can be measured via two aspects. On the one hand, it is primarily measured by the number of public service facilities closely related to the daily lives of residents, such as the number of companies and enterprises, the number of shopping centers, the number of parks and squares, and the number of living service facilities around the metro station [
3,
6,
26]. The higher the number of public service facilities around a metro station, the more able it is to attract residents to use the metro for travel. On the other hand, since the urban center dominates urban employment and business activities, the distance between the metro station and the CBD is often used to measure the regional accessibility of the metro station. Existing research shows that metro stations located in the central business district have much higher passenger traffic than if located elsewhere [
2,
5].
In addition to the built environment of the metro station, the characteristics of the metro station can also affect the passenger flow of the metro station. Previous research has shown that the number of transfer stations, terminals, and metro station entrances and exits can also have a significant impact on metro ridership [
5,
7,
27]. Among them, the transfer station plays a significant role in promoting metro ridership due to its better network accessibility. Terminal stations tend to have a larger service area than non-terminal stations, so they tend to positively impact metro ridership. The higher the number of entrances and exits, the better the connection to the surrounding area, thus increasing the attractiveness of metro travel.
However, the existing research on the built environment on metro ridership mostly considers the origin point, and seldom considers the impact of the destination built environment on metro ridership [
10,
11]. However, some studies have shown that the built environment of the destination also has a significant impact on the travel behavior of residents. For example, a Nanjing-based study has shown that the land use mix and number of bus lines of the origin point have an important impact on metro ridership during the morning rush hour, while the population density of the destination have a more obvious effect on the metro ridership. Similar research conclusions were also found in Wuhan and Washington [
10,
11]. Therefore, the relationship between the built environment and metro ridership can be better explored by simultaneously considering the impact of the built environment of the origin and destination on the metro ridership.
In addition, the existing research on the impact of the built environment of the station area on the passenger flow of rail transit usually assumes a linear or generalized relationship between the two. Ordinary least squares regression (OLS) and geographically weighted regression (GWR) are often used to explore and analyze the relationship between the built environment and metro ridership [
1,
17,
28,
29,
30]. While providing a sound research basis for understanding the relationship between the two, these traditional models can hardly capture the complex nonlinear effects of the built environment on metro ridership. In reality, the impact of the built environment on metro ridership may only work within a certain range [
10,
31,
32]. For example, a study that applied the GBDT model to Washington showed that the land use mixing degree only had a significant effect on metro ridership when it was between 0.5 and 0.6 [
10]. Nanjing-based research also showed that population density can have a significant positive effect on metro ridership only when the population density exceeds 26,000/km
2 [
13]. Similar research conclusions were also found in Shenzhen and Nanjing [
2,
33]. In addition, GBDT can also determine the relative importance of predictor variables. For example, a study in Washington has shown that average car ownership is the most important variable for predicting metro ridership, with a relative importance of 24.13% [
4]. Understanding the effective scope and relative importance of the built environment on metro ridership can provide more nuanced guidance for optimizing the built environment around metro stations.
In summary, in the study of the built environment and metro ridership, (1) the built environment of both origin and destination can significantly impact metro ridership, and there may be significant differences. However, most studies focus on the impact of the built environment of the origin point on the metro ridership, while there is far less research on the impact of the destination built environment on the metro ridership. (2) The impact of the built environment on metro ridership may operate via a complex nonlinear relationship, but the existing research mostly assumes a linear or generalized linear relationship between the two. Understanding the nonlinear effect and relative importance of the built environment for metro ridership will help formulate more reasonable land use optimization policies.
To this end, this study uses data from various sources in Chongqing, China, and applies the GBDT model to fine-tune the nonlinear effects of the origin and destination built environment on station-to-station metro ridership, while controlling the characteristic variables of metro stations.
3. Research Design
3.1. Study Area
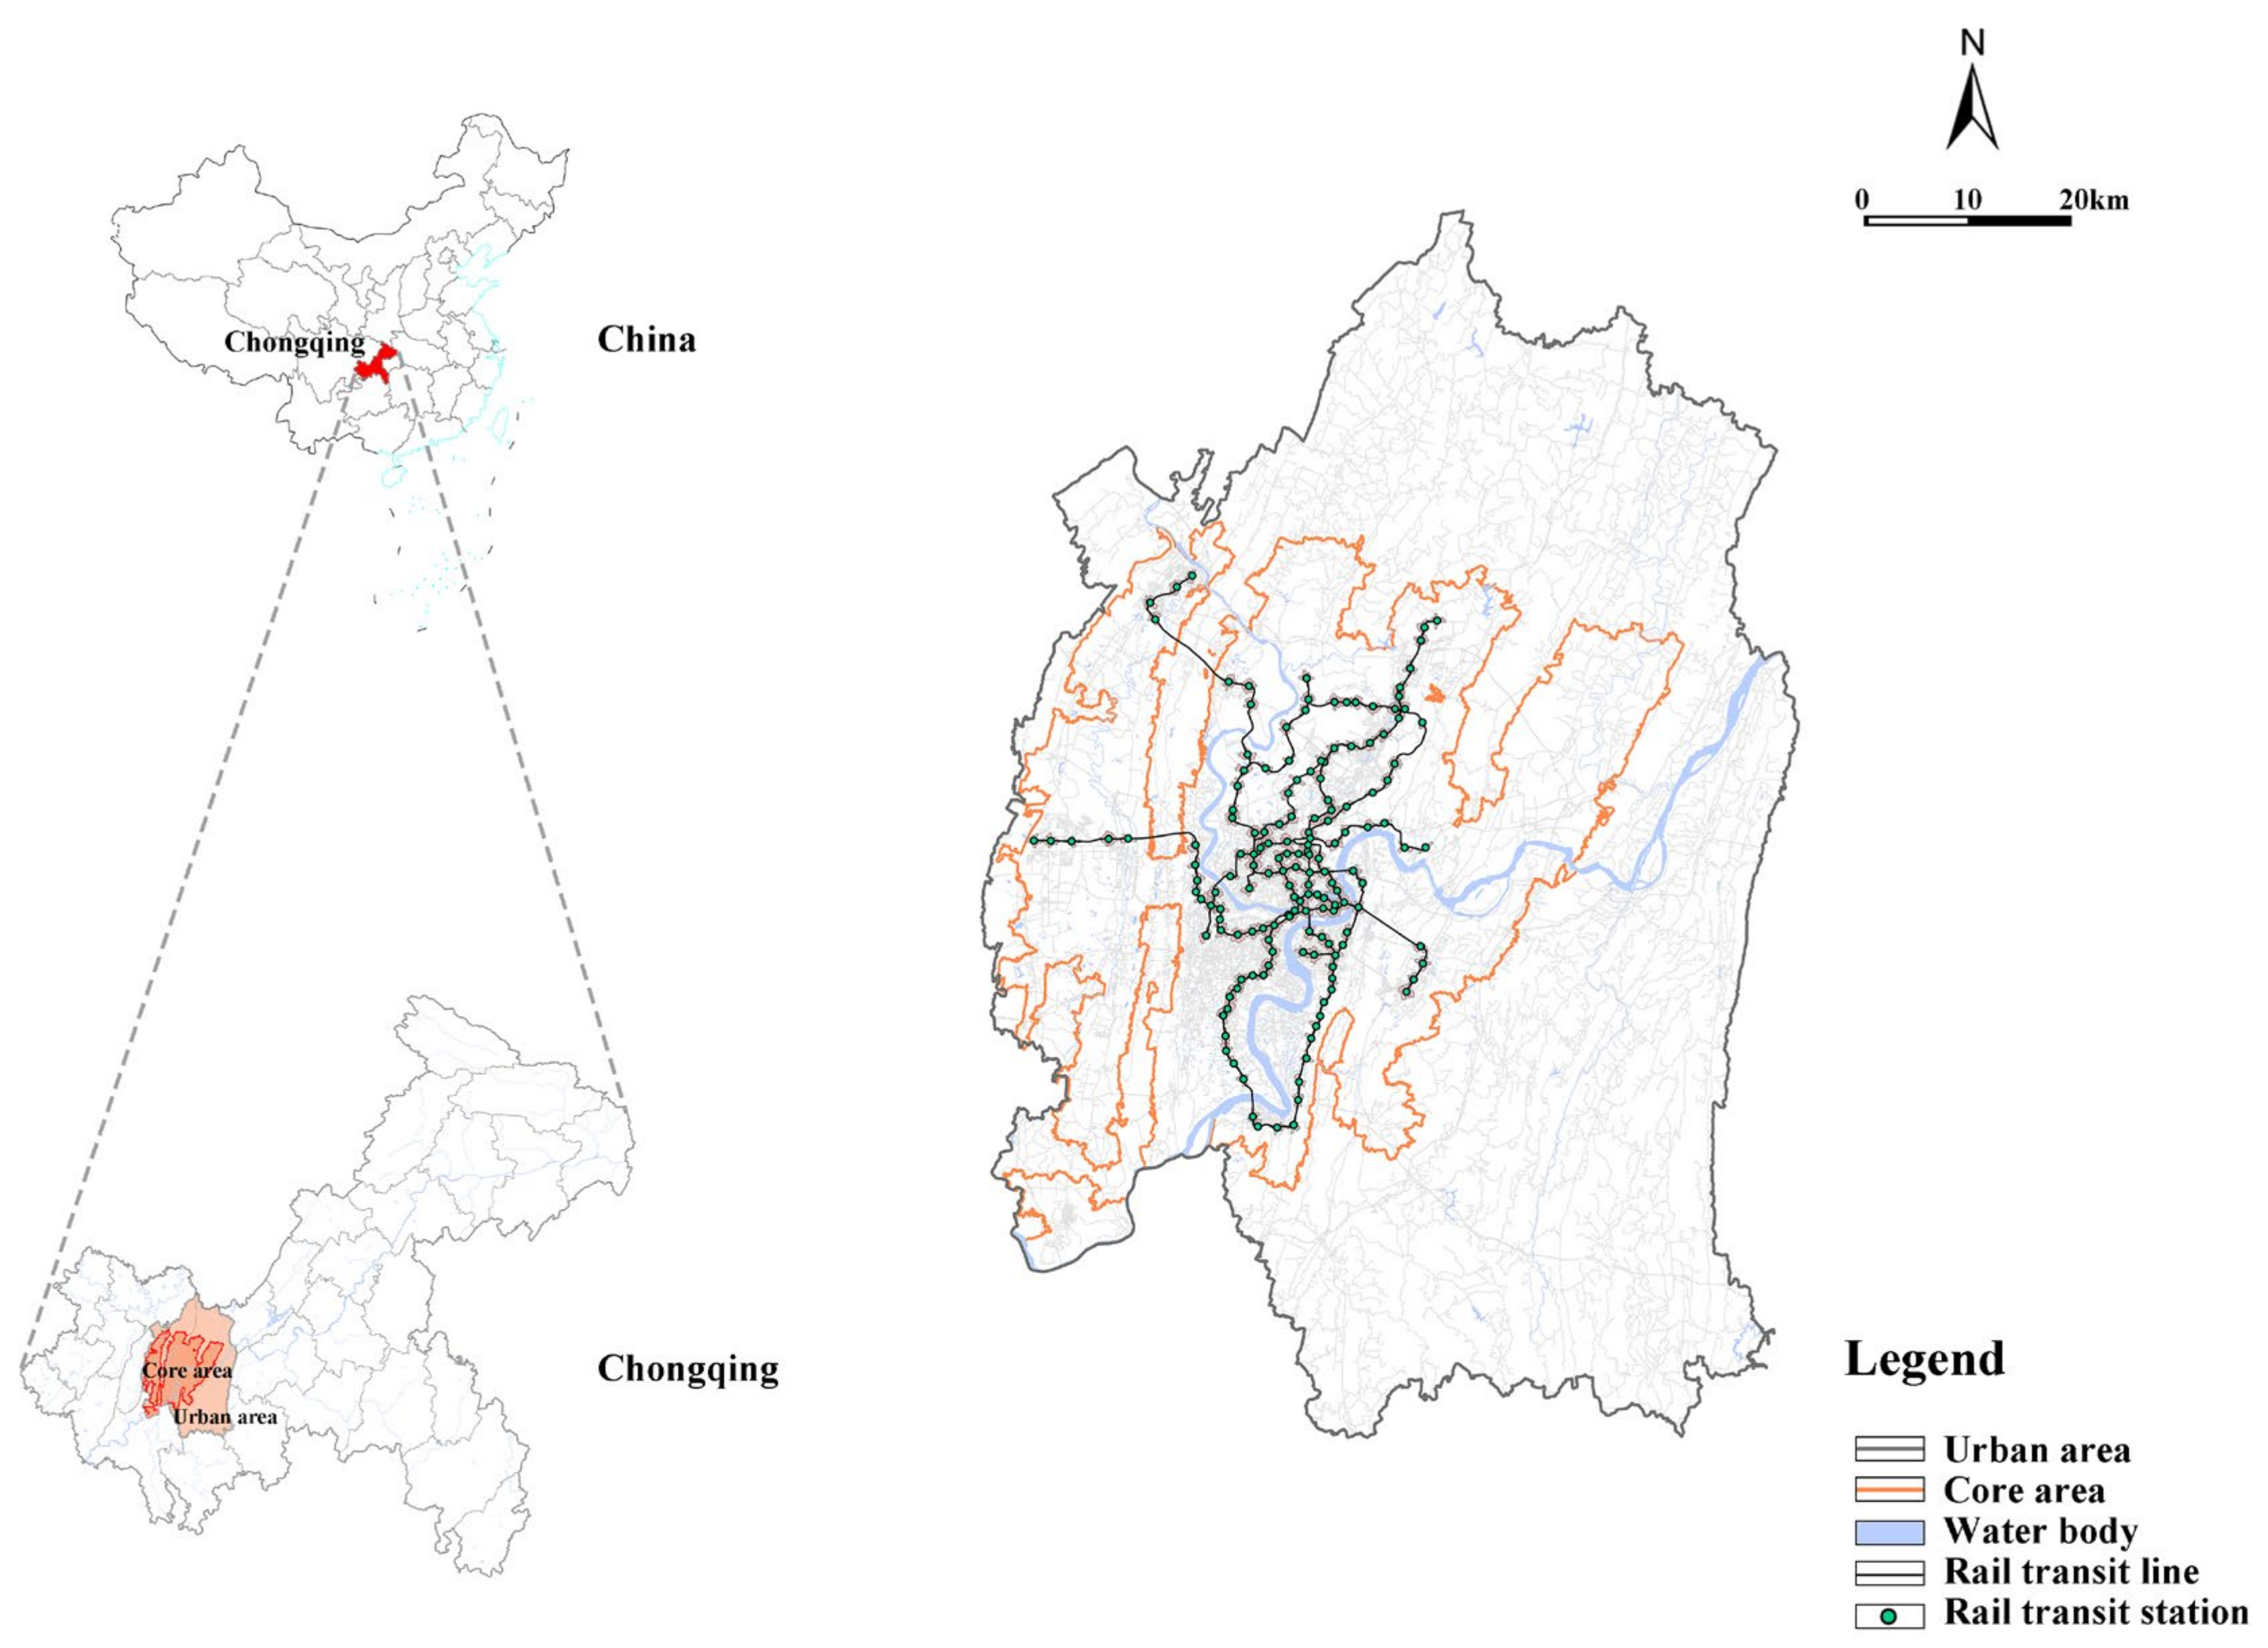
This study focuses on Chongqing, which is one of the four municipalities in China, located in southwestern China. In 2019, the resident population in the central urban area of Chongqing was about 8.75 million, accounting for about 27.4% of the city’s resident population. Chongqing is surrounded by rivers and gorges, mountains and waters, and the central urban area is divided by a geographical pattern of mountains and rivers that form an urban pattern of “four mountains and three valleys, two rivers and four banks”. The urban core area within the inner ring has the highest travel intensity. The travel intensity from the inner ring to the outer ring increases significantly, and the overall travel intensity decreases gradually within the center. The unique landscape pattern of Chongqing causes great challenges to ground transportation, making large-capacity rail transit an important mode of transportation for residents in the city. Since the opening of the first rail transit line in 2005, Chongqing rail transit has achieved a historical transformation of “from scratch, from light rail to metro, from single-track to gridded tracks”, and the construction of a “city on tracks”. By 2019, Chongqing had opened and operated eight metro lines with 170 stations (transfer stations are not counted repeatedly, as shown in
Figure 1). Referring to the existing research [
6,
13,
34,
35,
36], this study sets the area that can be reached by walking for ten minutes along a feasible route from the entrance or exit of a rail transit station as the station’s influence range; the walking speed of normal adults is 1.2 m/s, and the intersection part is processed via a Paysan polygon.
3.2. Data and Variable Settings
The data used in this study include the metro card swiping data of 170 stations in Chongqing taken on 30 September 2019, the mobile phone signaling data in Chongqing in 2019, the point of interest (POI) data in Chongqing in 2019, the vector data of building outlines in Chongqing in 2019, and data on the status quo of land use in Chongqing in 2019. The Chongqing metro card swiping data are provided by the China Railway Changjiang Transport Design Group. They record the cardholder’s card number, entry, and exit station number, and card swiping time. After deleting invalid data, 2,437,875 travel ODs were constructed based on the cardholder’s card number, and these were used for this study. The mobile phone signaling data in Chongqing were obtained from the China Mobile Chongqing Branch and mainly used to calculate the number of permanent residents around the metro station.
To examine the relationship between the built environment and metro ridership, we explored the 5Ds of built environment characteristics at the origin and destination sites [
8,
9]. Density included the number of permanent residents to building floor area ratio. Land use mix was measured by the entropy index, expressed through the density of intersections, which measures the connectivity of streets. Accessibility to destinations included the number of shopping centers, restaurants, amenities, companies, parks and squares, hospitals and educational facilities, and the distance to the city center. The number of bus stops and parking lots within the catchment area were used to measure the distance to public transportation. Metro station characteristics were also measured, including three elements: the quantities of inlets and outlets at metro stations, and whether a metro station was a terminal or transferring station. The descriptive statistics of the built environment within the study area are given in
Table 1.
3.3. Methods
This study uses the GBDT model to better analyze the nonlinear impact of the built environment on metro ridership at the origin and destination ends, and the relative importance of each influencing factor. Referring to the existing research [
32,
37,
38], we assume a set of independent variables (including metro station characteristics and station area built environment characteristics) and use an approximation function of dependent variables (station-to-station metro ridership). GBDT estimates the function according to the accumulation after multiple rounds of base function iteration. The GBDT model can be expressed as:
where
is the number of trees, and the parameters are expressed as the split variables, split positions, and the mean values of leaf nodes in each regression tree, which are estimated by minimizing a specified loss function. The optimization process includes several iterative steps.
First, an initialization function is given below.
Then, with the number of iterations from the
m = 1 round to the M round, we calculate the negative gradient (i.e., residual) of each sample
Then, the residual is taken as the new benchmark value of the sample, and the data are taken as the training data of the next tree to obtain a new regression tree, whose corresponding leaf node area is . Here, is the number of leaf nodes of the regression tree.
Calculation of the best fitting values for leaf areas
:
Updating the strong learner
:
Finally, the operation is ended, and the final learner is obtained.
To suppress the possible overfitting problem encountered in the process of the GBDT operation in this study, we limit the residual learning results of each regression tree by introducing a learning rate factor:
For each tree, the learning rate factor is multiplied to minimize the loss function.
This study uses the “gbm” package in the R platform to establish the GBDT model, and derives the relative importance of the independent variables and the dependence diagram of each variable. Among them, the relative importance of the independent variable can be used to measure the role of the variable relative to other variables in predicting subway passenger flow, and the dependency graph can intuitively reflect the nonlinear correlation between the built environment and subway passenger flow.
4. Results
4.1. Relative Importance of Independent Variables
Table 2 shows the relative importance of the investigated independent variables in predicting station-to-station metro ridership. The total relative importance of all independent variables is 100%. In general, the impact of the built environment attributes of the origin and the characteristic attributes of the metro station is higher than that of the built environment attributes of the destination and the characteristic attributes of the metro station. Specifically, the distance to the city center, the number of companies, the floor area ratio of buildings, and the densities of bus stops and parking lots are the five variables that contribute the most to metro ridership, whether at the origin or the destination. The city center is the center of urban employment and commercial activities, so it has a large metro ridership. As an important destination for residents’ daily travel, the more companies, and enterprises there are around the metro station, the more likely residents are to choose metro travel. The higher the building floor area ratio, the greater the demand for metro travel, which is more conducive to promoting metro ridership. The higher the density of bus stops and parking lots around the metro station, the greater the convenience of multimodal transport, which is more conducive to promoting metro ridership. As for the characteristic attributes of metro stations, the transfer station has better network connectivity, so it plays a greater role in predicting metro ridership.
4.2. Nonlinear Influence of Built Environment of Origin and Destination on Station-to-Station Ridership
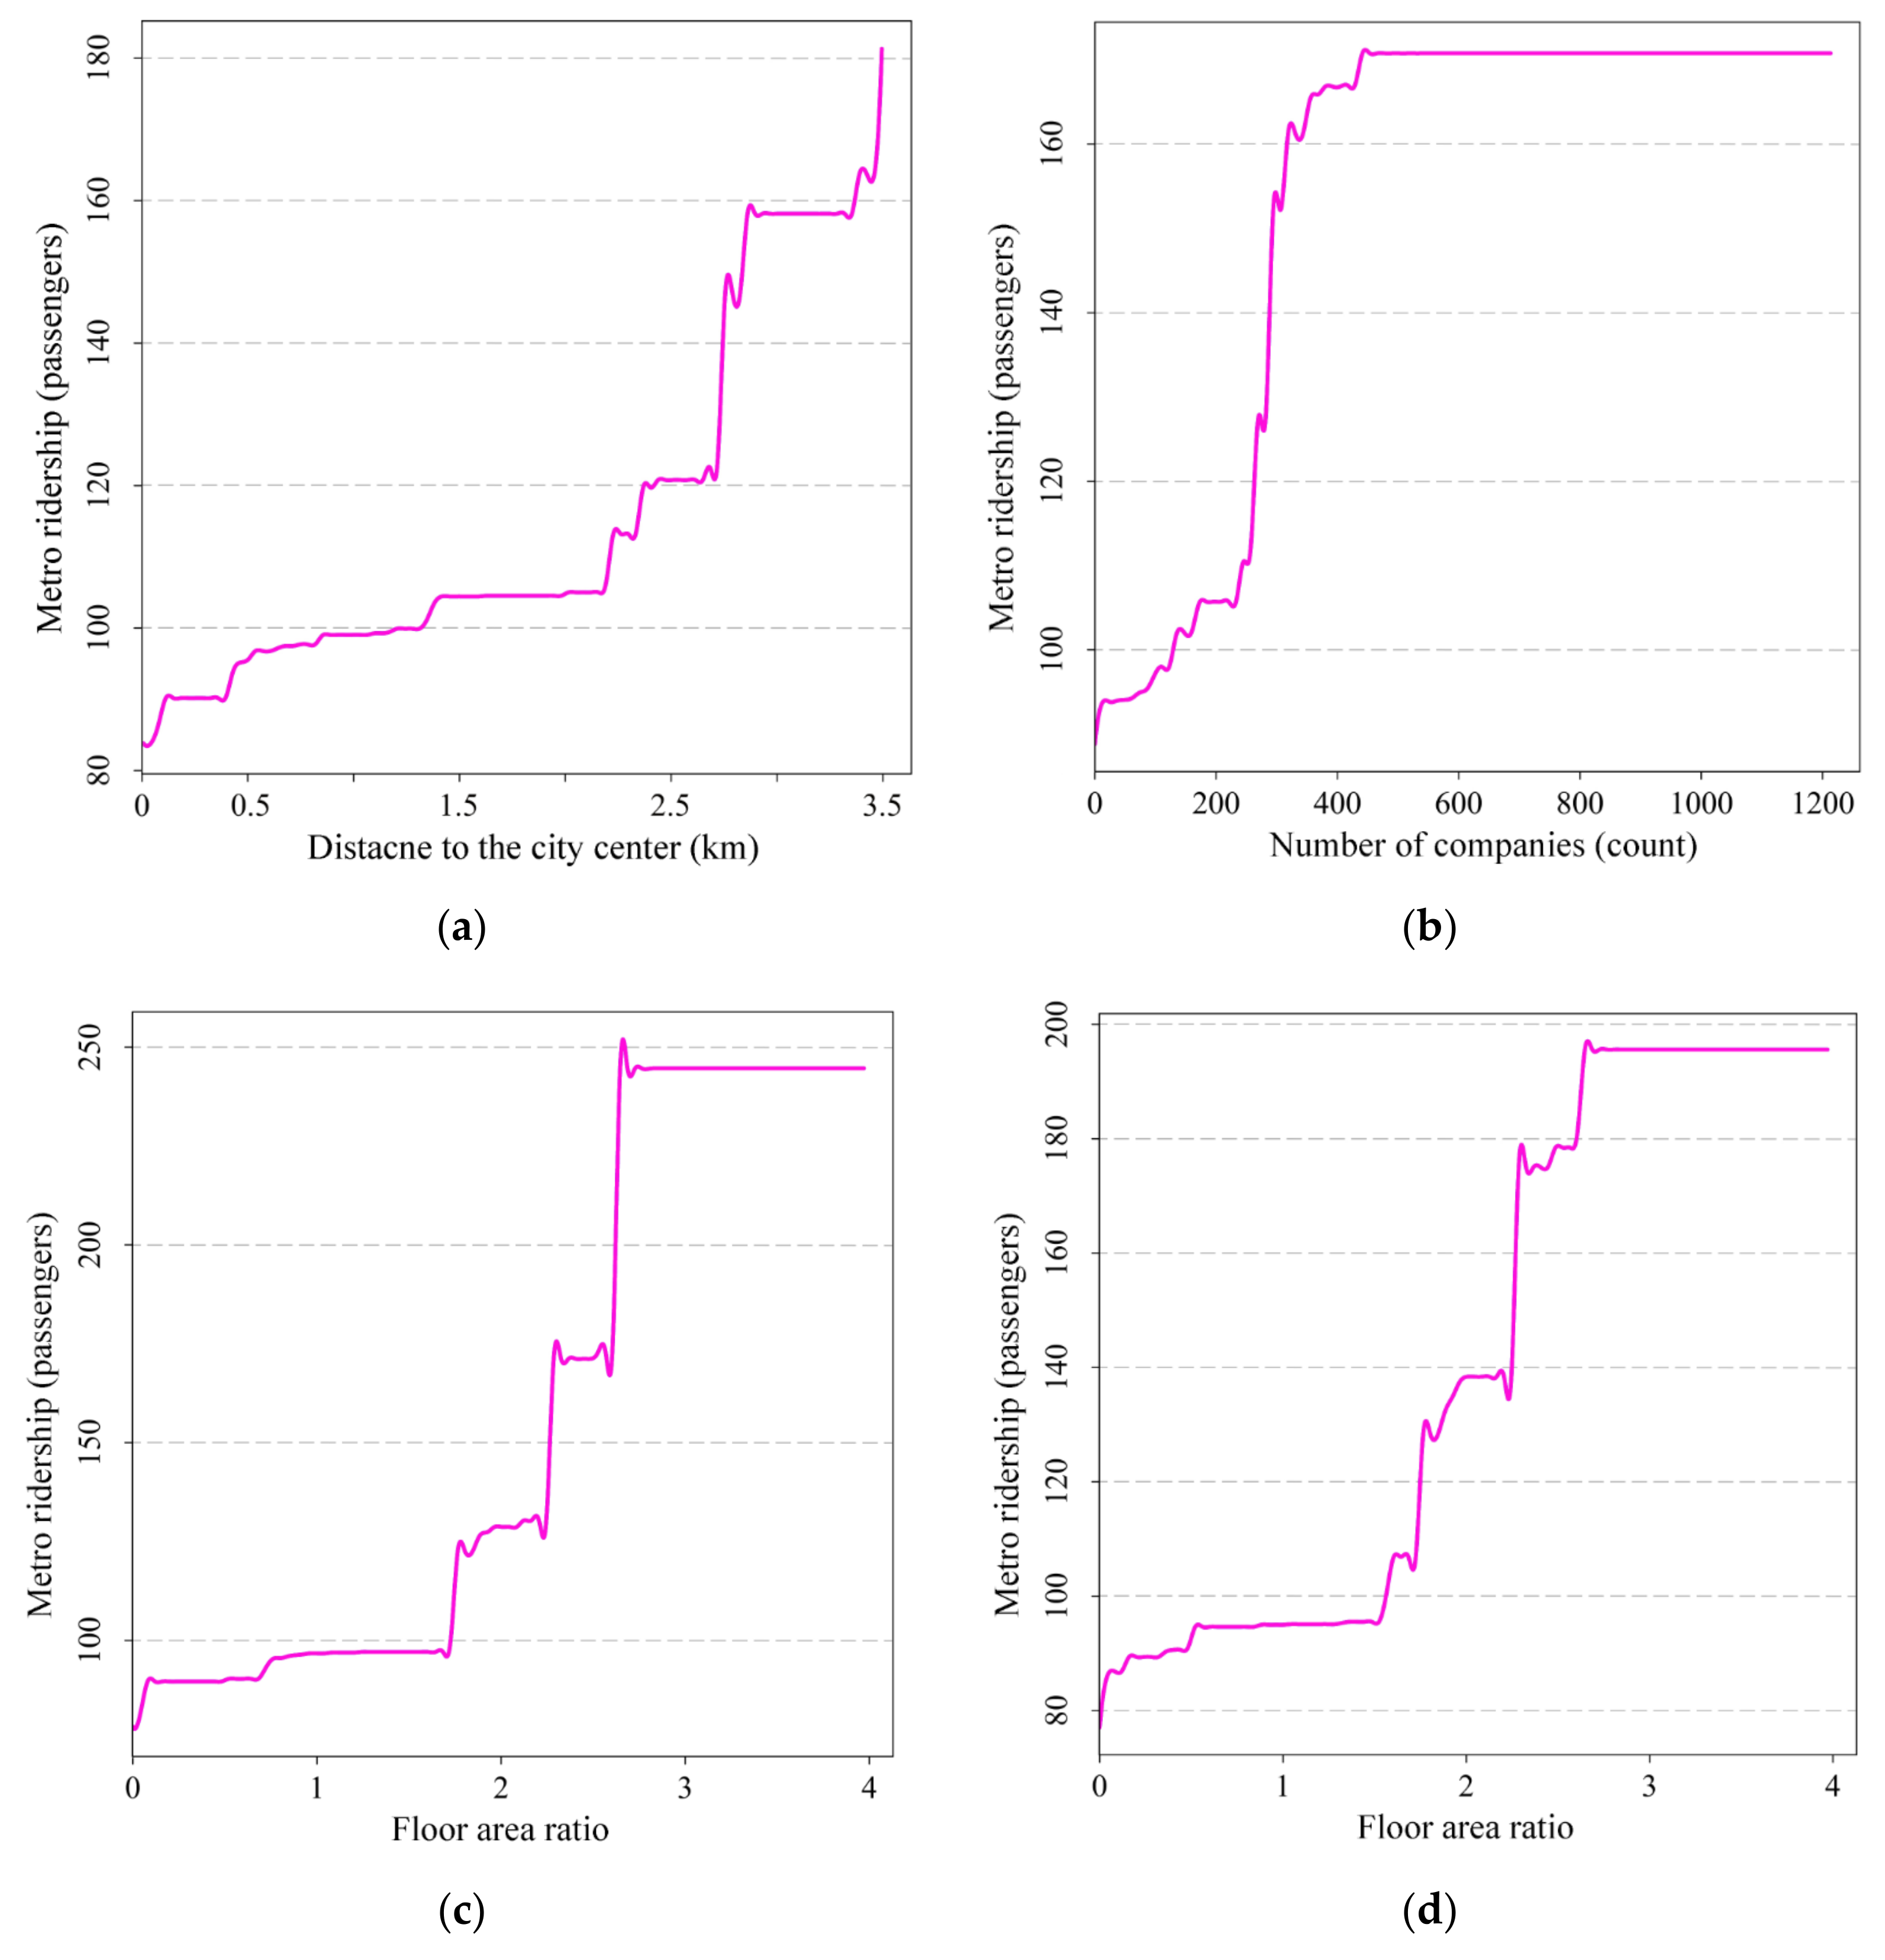
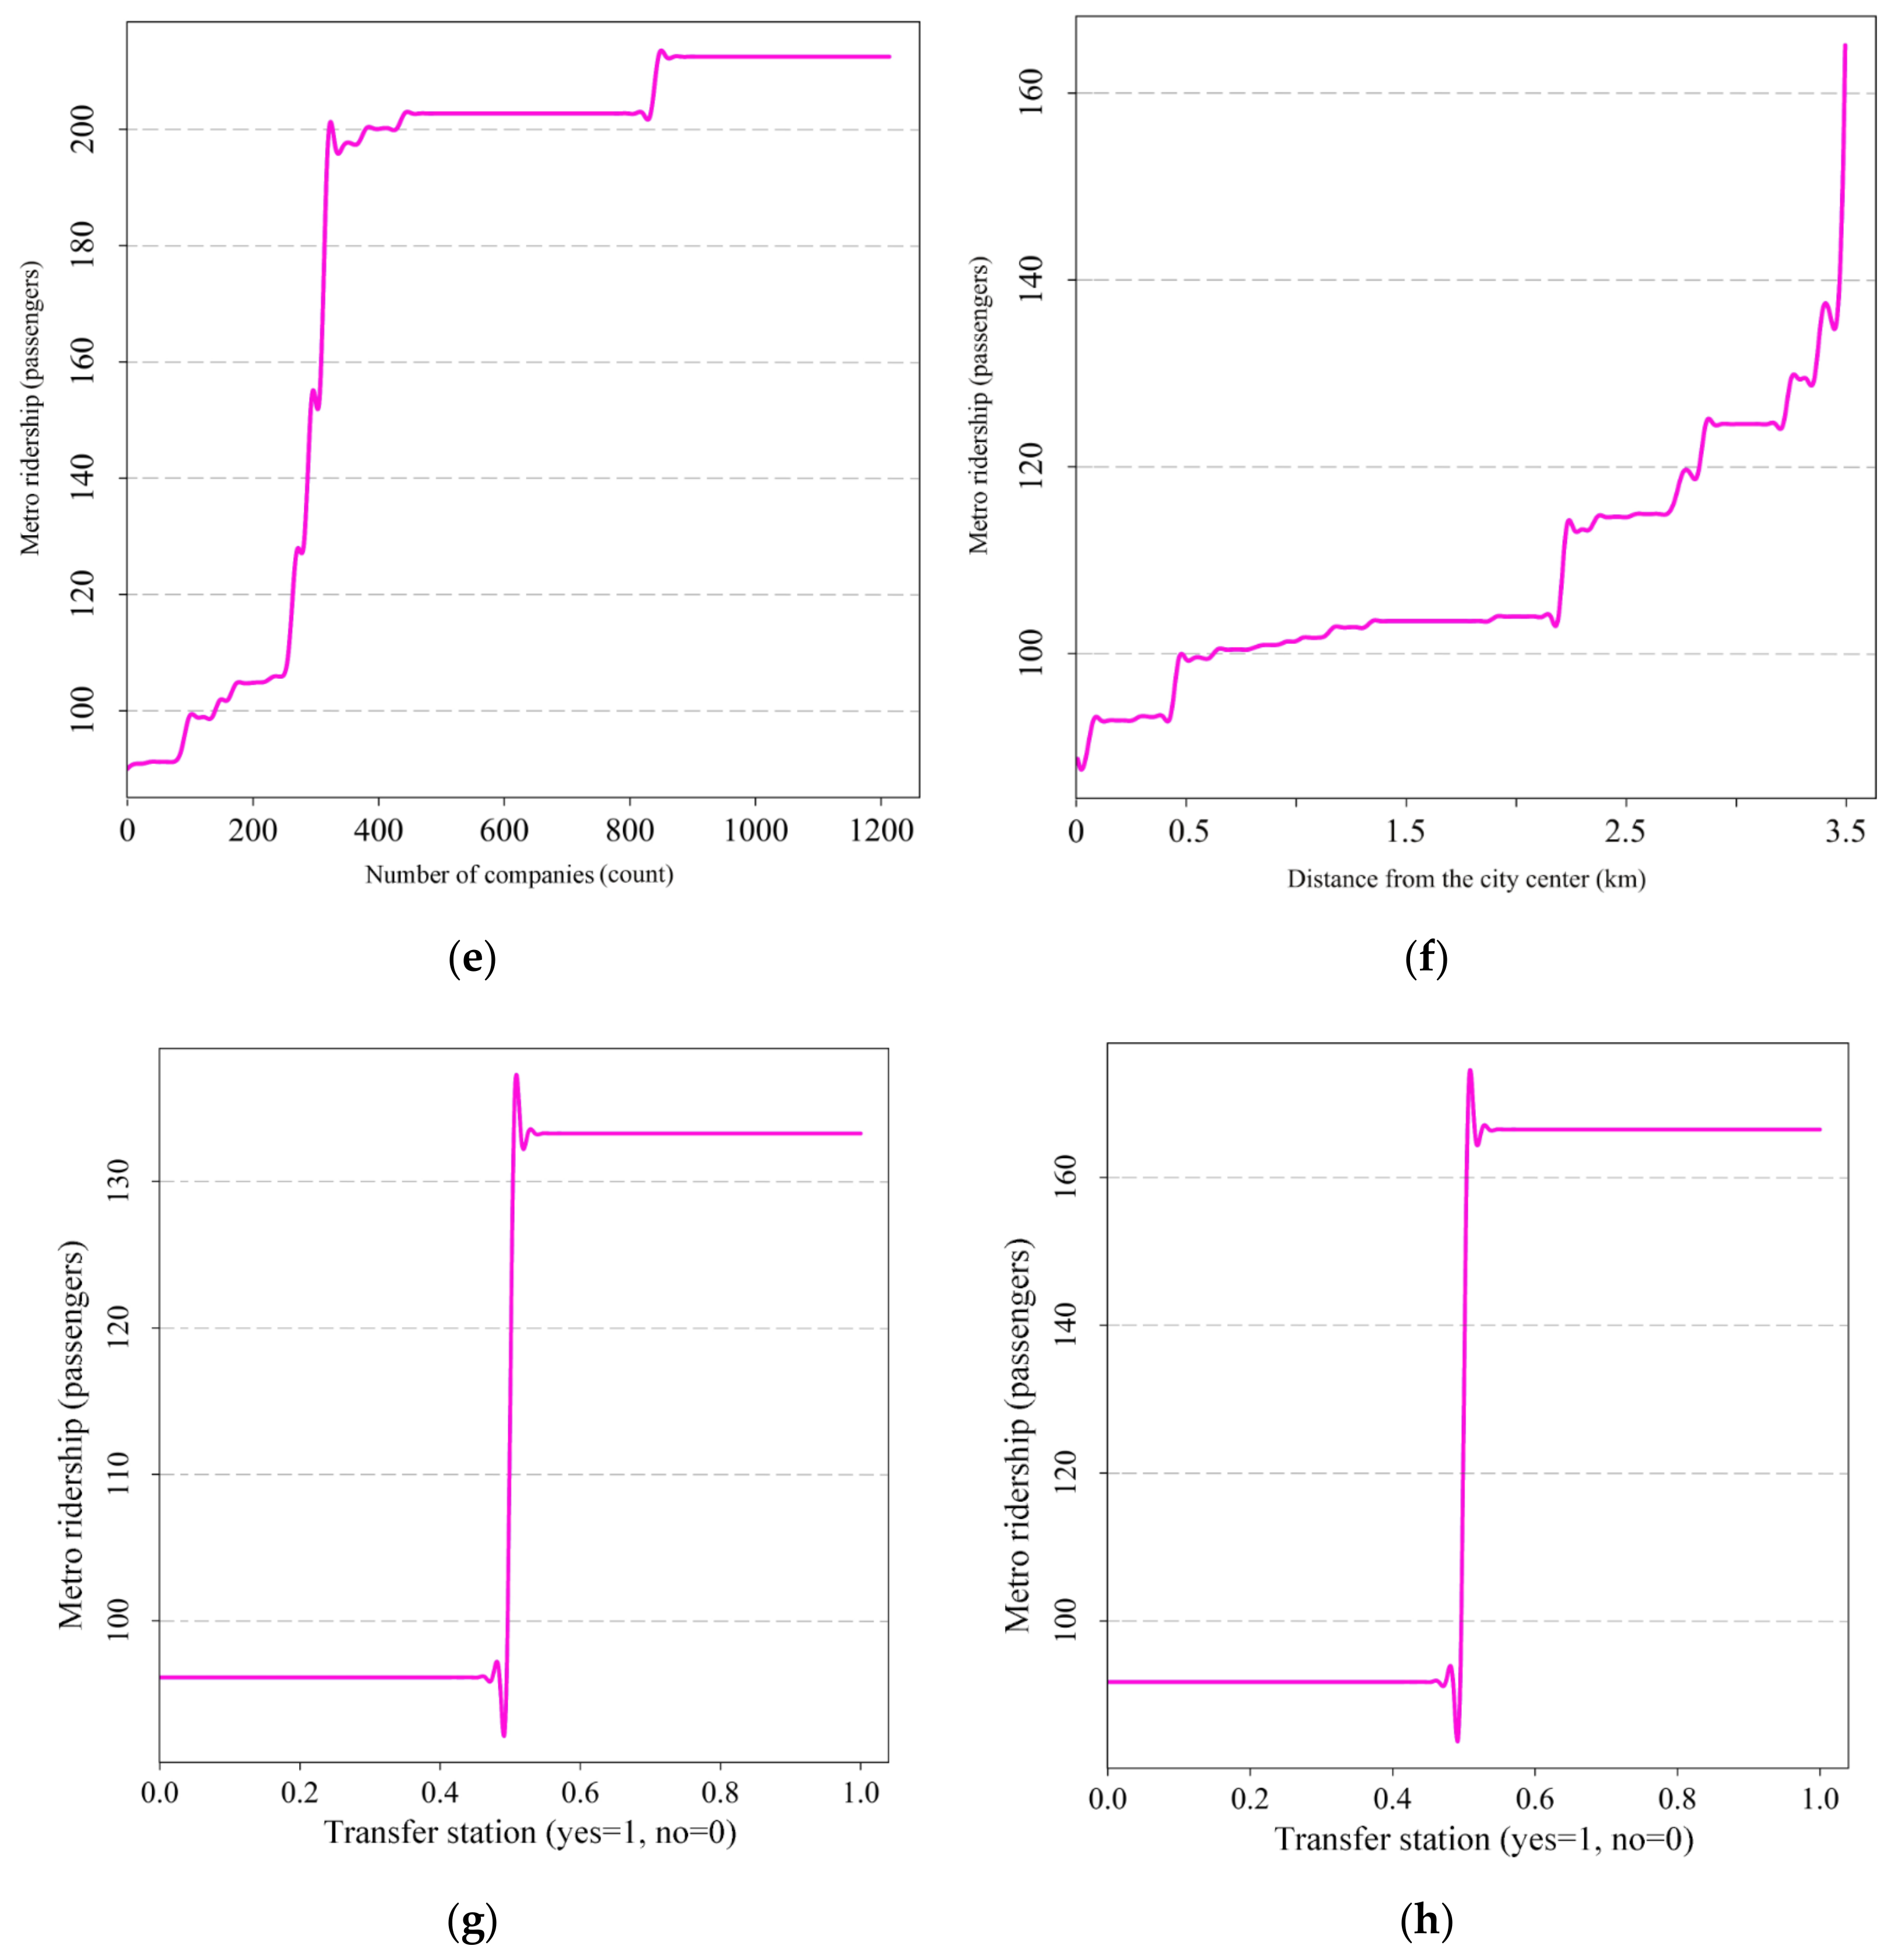
Via the partial dependence diagram derived from the GBDT model, we have visualized the impact of the six most important key built environment variables and transfer stations on metro ridership, as shown in
Figure 2. In general, all variables have complex nonlinear effects on metro ridership, with an obvious effective influence range. The impact trends of the same built environment variable at the origin end and destination end tend to be consistent, but the effective ranges of influence are obviously different.
The distance between the origin place and the city center positively affects the metro ridership. When the distance between the origin place and the city center is 0–2.7 km, the metro ridership gradually increases from 82 people to 120 people. When the distance from the city center further increases to 2.8 km, the metro ridership surges to about 160 people. Subsequently, the metro ridership remains relatively stable. When the distance from the city center exceeds 3.4 km, the metro ridership is again positively affected. When the distance between the destination and the city center is 0–2.3 km, the promotional effect on metro ridership is relatively small. When the distance to the city center is more than 2.3 km, it will play a more obvious positive role in promoting metro ridership. When the distance from the city center reaches about 3.5 km, it will promote the metro ridership at the maximum level.
The number of companies in the origin place also positively impacts metro ridership. When the number of companies around the metro station is 0–250, the metro ridership slowly increases from about 90 to about 115. When the number of companies around the metro station further increases to about 400, the metro ridership rapidly increases to about 170 people. However, when the number of companies around the metro station further increases, it ceases to have a positive impact on the metro ridership. Similarly, when the number of companies in the destination is 0–250, the promotion of metro ridership is small. When the number of companies increases from 250 to 400, the metro ridership rapidly increases from about 105 to about 200. When the number of companies further increases, the positive effect of this number on metro ridership becomes relatively small.
The floor area ratio of the destination also positively impacts the metro ridership. When the floor area ratio is less than 1.8, the promotion effect on metro ridership is relatively small. However, when the floor area ratio increases to 2.8, the metro ridership rapidly increases from about 100 people to about 250 people. When the floor area ratio is greater than 2.8, it will no longer have a positive impact on metro ridership. Similar to the floor area ratio of the destination, when the floor area ratio of the origin place is less than 1.5, the impact on the metro ridership is relatively weak. When the floor area ratio is between 1.5 and 2.7, the metro ridership rapidly increases from about 95 people to about 195 people. When the floor area ratio is greater than 2.7, it no longer plays a positive role in promoting metro ridership.
In terms of the characteristics of metro stations, both the origin and destination transfer stations also show significant positive effects. However, the destination transfer station plays a more significant role in promoting metro use. The passenger flow at the origin transfer station is 30 people higher than that at the non-transfer station, and the flow through the destination transfer station is about 60 people higher than that through the non-transfer station.
5. Discussion
Optimizing the built environment to promote residents’ use of public transport, especially metro travel, is an important way to curb the negative effects of urban sprawl. This also plays an important role in promoting sustainable social development. However, while there is abundant research on the relationship between the built environment and metro ridership, most explore the generalized linear impact of the built environment on metro ridership from the starting end; few explore the nonlinear impact of the built environment on metro ridership from both the starting end and the destination end. This study is based on the GBDT model and is applied to metro card data from Chongqing, China, used to explore the impact of the built environment at the origin and destination ends on the metro ridership. Compared with most previous studies, it focuses on the impact of the built environment at the destination on the metro ridership. In addition, it explores the complex nonlinear relationship between the built environment and metro ridership, as well as the relative importance of the built environment elements in predicting metro ridership. The results of the study have yielded several interesting known and unknown findings, providing some insight that will promote residents’ usage of the metro to travel.
First, the relative contribution of the built environment at the origin end and the characteristic attributes of metro stations to the metro ridership is higher than that at the destination end, which corresponds to most previous research results [
10,
11,
13]. However, our study showed the difference between the starting point and the terminal more precisely; using the same land use optimization strategy, the starting point increased subway passenger flow by 3.48% compared to the terminal. The difference between the contributions of the built environment at the origin and destination ends to the metro ridership also reminds us that prioritizing improving the built environment at the origin end is more conducive to encouraging residents to choose metro travel under the condition of limited resources.
Second, the relative importance of the respective variables provides priorities for land use policies. Previous studies have shown that the distance from the city center and the number of businesses around metro stations are important factors in driving metro ridership [
5], and research further shows that similar trends are emerging at destinations. Therefore, metro network planning prioritizes connecting the urban center, employment center, and main residential areas. As the building floor area ratio also plays a significant positive role, new areas and the surrounding areas of metro stations should mainly be compact and highly dense. In addition, the density of bus stops and parking lots also significantly promotes metro ridership, which corresponds to most previous research conclusions [
15,
18,
27]. The convenience of multimodal transport plays a very positive role in encouraging residents to use public transport. Therefore, in addition to strengthening the transfer within the metro station, strengthening the transfer of public transport and private cars around the metro station will also help to promote metro travel. In terms of the characteristics of metro stations, the metro ridership at transfer stations is significantly higher than that at non-transfer stations, which is consistent with previous studies [
2,
24,
39]. Therefore, it is important to focus on optimizing the built environment around the transfer station, which will play a greater role in promoting metro ridership.
Third, all the independent variables investigated show complex nonlinear correlation and threshold effects on metro ridership, which provides an effective sphere of influence for planning policy interventions. This is consistent with the research findings from Washington, Nanjing, and several other places. In terms of distance from the city center, the impact of the origin end on the metro ridership is concentrated within 0–2.8 km, while the destination end is within 0–2.3 km. In terms of the number of companies, the positive promotion effect of the origin end and the destination end on the metro is the most significant when the number of companies is 250–400. The promotion range of the effect of building floor area ratio on metro ridership is 1.5–2.7 at the starting end and 1.8–2.8 at the destination end. Therefore, when the distance between the origin end and the city center is 2.8 km, the number of companies is 400, the plot ratio is 2.7, and when the distance between the destination end and the city center is 2.3 km, the number of companies is 400, and the plot ratio is 2.8, making the attraction to metro ridership the largest. However, considering that the same metro station is both the starting point and the terminal, when planning policy intervention, a reasonable planning strategy should be formulated according to the dominant attributes of the metro station combined with the effective scope of the planning intervention.
This study has several limitations. First, the characteristics of residents’ socio-economic attributes and travel preferences are also important factors that affect whether residents choose to travel via the metro [
40,
41]. In future research, questionnaires should be used to provide relevant content. Second, Chongqing is a typical city with high-density-oriented development. In the future, research on cities showing medium- and low-density-oriented development should be increased to further verify the universality of the research results. Moreover, similar to most studies, the results of this study are also based on cross-sectional data, which fail to represent the causal relationship between the built environment and metro ridership [
10]. In the future, a longitudinal design could be established through the collection of panel data to obtain more in-depth research results. Fourth, the subway card data obtained in this paper are only one day’s OD travel data, but travel behaviors such as commuting often show high temporal and spatial regularity, as the second trip is often a necessity rather than a choice for residents. Therefore, more granular travel data will be available in the future, with more granular analysis to obtain more accurate conclusions. Finally, the data collected in this study were from before the pandemic, which has had a huge impact on subway travel, and data from before and after the epidemic should be collected for comparative research in the future to more effectively guide post-epidemic subway travel policies.


