Abstract
In recent years, there has been collected evidence suggesting that increased usage of navigation assistance systems has a harmful effect on spatial cognition, including spatial knowledge acquisition. Previously, we proposed a potential remedy called Free Choice Navigation (simulation study). This novel navigation approach aims to provide the user with more freedom while navigating, and simultaneously give fewer navigation instructions. This approach also aims at increasing engagement with the environment and fostering spatial knowledge acquisition. We conducted a human-subject study with 48 participants comparing Free Choice Navigation with the widespread Turn-by-Turn approach on the outskirts of Vienna, Austria. The study showed the viability of our navigation system in real urban environments, providing fewer navigation instructions compared to the Turn-by-Turn approach (relative to the number of traversed junctions). Fewer instructions and forced engagement with the environment, however, did not result in differences concerning spatial knowledge acquisition, but interestingly, Free Choice Navigation users (without a map) could extract spatial configuration information similarly well as Turn-by-Turn users having a map. Moreover, we provide evidence that people are interested in learning more about their environments and are willing to walk longer routes to achieve it.
1. Introduction
Navigation is an everyday task performed by billions of people. It is composed of wayfinding (the cognitive aspect of planning the route towards the destination) and locomotion (e.g., body movement while avoiding obstacles) [1]. Sometimes, this task has to be conducted under time pressure (e.g., going to a meeting or catching a bus). On the other hand, there are situations, such as going for a walk or visiting a city as a tourist, in which the user would have time to pay attention to the environment. In both scenarios, a smartphone device is commonly utilized as a wayfinding assistance system to reach the desired destination. There is increasing empirical evidence suggesting an adverse impact of these systems on spatial cognition. Mitigating this potentially adverse impact is the topic of current research (e.g., [2,3,4,5]).
In a previous work [6], we proposed a navigation approach called Free Choice Navigation (FCN) that, among other things, attempts to mitigate these adverse effects. The core idea of FCN is to provide the user with more freedom while navigating compared to a predefined route, as the user has to make own decisions at several junctions. By this, we expect more engagement with the environment. Free Choice Navigation attempts to balance the number of free choices, given instructions, and the route length. An agent-based simulation study showed promising results regarding the number of free choices and the arrival rate for our navigation approach [6]. At more than 50% of all junctions, agents could freely decide which street segment to take. Depending on the city (Mexico City, Vienna, and Djibouti City), between 90% and 95% of the agents found their destination successfully.
Following up on these promising simulation results, we conducted a real-world study in Vienna, Austria, comparing our navigation approach with the widespread Turn-by-Turn (TBT) approach. This study allows for assessing the impact of FCN on spatial knowledge acquisition (SKA), an aspect that was not part of the simulation study. Furthermore, it allows for validating the simulation results obtained previously. The contribution of our work is sixfold (order reflects importance):
- 1.
- We provide empirical evidence that participants can reach the destination successfully with our novel system approach (FCN);
- 2.
- We show that FCN leads to less navigation instructions (relative to the number of traversed junctions). This gives potentially more time for interaction with the environment;
- 3.
- We provide empirical evidence that FCN in its current form does not impact spatial knowledge acquisition in comparison to TBT;
- 4.
- We show that FCN users have high configuration knowledge, although no map is provided.
- 5.
- We present data demonstrating that people are willing to take longer routes while obtaining more freedom and/or spatial knowledge in return and;
- 6.
- We present the first application of the Route Selection Framework [7] in a real-world study.
We would like to stress that Free Choice Navigation is intended for use in situations with no time pressure. As our approach is rather complex, we provide high-level information about its mechanics (see Section 2.2 and Section 4.3.2). For detailed algorithmic information, we refer to the paper that introduces the technical details [6].
2. Related Work
We will discuss three strands of related work. First, we discuss the widely used TBT approach with its potential negative impacts on spatial cognition. Second, we discuss potential improvements of this approach to remedy these effects. Finally, we discuss other navigation approaches that are not exclusively based on turn instructions, such as beeline navigation or Free Choice Navigation. Where applicable, we report on the influence on spatial knowledge acquisition.
2.1. Turn-by-Turn Navigation and Its Disadvantages
The Turn-By-Turn (TBT) navigation approach is based on instructions given at turning points. It is widely used by pedestrians, cyclists, and car drivers (e.g., Google Maps Navigation), and it comes in many shapes (e.g., [8,9,10,11]) such as annotated paper maps, mobile maps indicating the route or augmented reality (AR) cues placed in the environment. Besides auditory instructions played at turning points (e.g., [10]), there have also been further non-visual approaches, trying to navigate users through the environment without the need to refer to a display for instructions. Giannopoulos et al. [12] introduced GazeNav, a gaze-based navigation approach providing vibrotactile feedback whenever the correct street segment was gazed at. Although this navigation approach is efficient in reaching the destination, there is empirical evidence supporting that the usage of navigation assistance systems, mainly based on the TBT approach, may have an adverse effect on various aspects of spatial cognition.
Hejtmánek and colleagues showed that participants who spend more time with a GPS-like map acquire less accurate spatial knowledge in a virtual environment [13]. Furthermore, participants with less time spent on a GPS-like map walked shorter routes without the help of an assistance system. Ishikawa [14] concluded that users with increased usage of navigation systems tend to travel less efficiently without GPS-based assistance, have lower spatial abilities regarding mental rotation, and show inferior knowledge about the structure of the walked routes. Ruginski and colleagues [15] found a detrimental indirect influence of using GPS-based navigation aids on environmental learning by influencing spatial transformation processes such as mental rotation [16] and perspective-taking [17]. Dahmani and Bohbot, like Ishikawa [14], assessed the frequency of use of GPS-based navigation systems [18]. Their results show that users with more experience have worse spatial memory while navigating without such a device. Furthermore, their findings suggest the decline of spatial memory with extensive use of navigation assistance systems.
Research suggests that these problems originate from the need to divide our attention between the navigation system and the environment. Consequently, this permanent back and forth movement impairs spatial memory [19]. Another influencing factor is the degree of automation the system provides. If the human user does not need to pay attention and only passively follows the instructions, it may not acquire as much spatial knowledge as with a lower automation level [20].
While comparing the TBT approach with a paper map, which provides a holistic overview of the area, researchers have found that users of digital aids learned less about their environment than paper map users (e.g., [21,22]). Therefore, many researchers have proposed modifications to the TBT approach to remedy the above-mentioned adverse effects. One approach is to enhance the turning instructions with additional information about landmarks [23] and, in turn, render them more engaging. Providing more contextual information about the environment is another option [2]. Further improvement suggestions include the enhancement with haptic feedback [24]. Instead of modifying the instructions, the environment may be enriched with virtual global landmarks facilitating the orientation [25]. Besides trying to enhance the TBT navigation approach with further information, there are navigation approaches aiming to reduce the overall number of turn-by-turn instructions (e.g., [26]) or avoiding them.
2.2. Alternative Navigation Approaches
The TBT approach has, per definition, a completely predefined route, as turning actions are imposed on the user. Alternatives to this approach give the user more freedom regarding route selection by not using an entirely predefined route.
One of them is the so-called beeline navigation, which is based on the least-angle strategy [27]. This strategy assumes that users favor options with the least angle with respect to the (believed) destination. Robinson et al. and Dobbelstein et al. implemented this approach by indicating the beeline with vibrotactile feedback [28,29]. Both implementations led participants successfully to the destination while allowing for free movement to explore the experiment area. Savino and colleagues compared TBT with two different variants of beeline navigation for cyclists [30]. One provides only the beeline to the destination, whereas the second provides additional visual cues if the beeline and the shortest path street segment differ. The second approach made participants more confident. For a leisure scenario, participants preferred the beeline approach over TBT.
Another alternative to the traditional TBT approach is the spatial augmentation sound system proposed by Clemenson and colleagues [31]. It acts as an acoustic compass that guides the user towards the destination without explicit instructions. For this reason, audio beacons are employed, which adapt in sound as a function of distance and angle to the user. In a user study, the users of this system pointed more accurately to different destinations than TBT users. This approach was originally developed to help visually impaired individuals. A similar approach was proposed by Albrecht et al. [32].
Haosheng and colleagues proposed Potential Route Area (PRA) navigation [33]. The PRA is the area covered by routes no longer than a threshold leading from the current position to the destination. Similarly to our approach, the already walked route is taken into account, but, in contrast to our approach, the environmental spatial abilities are of no importance for this approach. The user is equipped with a digital map highlighting the PRA and landmarks. The idea of this approach is; as long as the user stays within the highlighted area, the destination should be reached within the predefined distance threshold. The area is updated frequently and no instructions are given. The study showed that users of the PRA system draw better sketch maps in terms of route likeness and survey likeness [34] compared to Google Maps participants. Regarding the pointing accuracy to the start point and the number of drawn points of interest in the sketch map, there was no significant difference between both groups.
The Free Choice Navigation approach was proposed in our previous work [6]. It aims for more freedom of choice and engagement with the environment while trying not to exceed a maximum route length. The core idea is to provide the user with two pieces of information at the beginning; the beeline direction and distance to the destination. No further information is given to the user before the navigation task starts. As the user moves, the accompanying system tries to predict whether the user needs assistance, i.e., any information that facilitates reaching the destination. This prediction is based on the environmental spatial abilities of the user, the complexity of the upcoming junction and the until now traversed route. The system estimates the user’s orientation and spatial confidence based on the user’s environmental spatial abilities. With this information, the system can assess whether the user will take a reasonable street segment, given the already walked distance and the maximum allowed distance. If the probability of taking a street segment resulting in a detour above a certain threshold is high or the user is one street segment away from the destination, then a navigation instruction for the upcoming junction is issued. The given assistance can be of any type: visual (screens), auditory (earphones), haptic (vibration motor), etc. The assistance can also be a TBT instruction but does not have to be one. Potentially, it is an indication of the destination, like in the beeline approach. While there is no need for assistance, the user is confronted with the environment, a situation that is expected to support spatial knowledge acquisition [35]. Furthermore, in this situation, the user has to decide which street segment to take. This work presents the first implementation of this navigation approach in a real-world setting. For more details, we refer to the paper that introduces the technical details [6].
3. Research Questions and Hypotheses
In this section, we will present the research questions and justify our hypotheses regarding the outcome of our study. Several research questions result from our previous findings [6] in which we compared Turn-By-Turn (TBT) and Free Choice Navigation (FCN) approaches through a simulation study. All research questions but one, consider the differences between both navigation approaches. The last research question (RQ5) concerns people’s willingness to take longer routes if knowledge about the environment or decision freedom is gained. The answer to this question will contribute to the discussion of whether navigation systems should focus on other functionalities than efficiently guiding from a to b, e.g., enhancing spatial knowledge acquisition (e.g., [5]). With our study, we attempt to address the following research questions:
- RQ1: Does the FCN approach lead fewer people (%) to their destination than TBT?
- RQ2: Does the FCN approach lead to fewer navigation instructions than TBT?
- RQ3: Does the FCN approach lead to better spatial knowledge acquisition than TBT?
- RQ4: Does the FCN approach yield longer routes or a higher number of route instructions for users with lower spatial abilities than for users with good spatial abilities?
- RQ5: Are people willing to take longer routes if they gain freedom of choice or learn more about the environment?
The hypotheses and rationales behind the conducted statistical tests are found in Table 1. The tested hypotheses are divided into six groups: effectiveness and efficiency (RQ1 and RQ2), spatial knowledge acquisition (RQ3), spatial abilities in FCN (RQ4), user experience (User Experience Questionnaire (UEQ) [36]), workload (NASA Task Load Index (NASA TLX) Raw [37]), and usability (System Usability Scale (SUS) [38]). RQ5 is not specific to any of the two navigation systems and is, therefore, not considered in Table 1. The tests used to approximate spatial knowledge acquisition are described in Section 4.4.2.

Table 1.
An overview of the hypotheses analyzed; column HG refers to the group of hypotheses: Eff2 = effectiveness and efficiency, SKA = spatial knowledge acquisition, SA-FCN = spatial abilities in FCN, UEQ = User Experience Questionnaire, NASA = NASA TLX Raw and SUS = System Usability Scale. Column DV presents the subdimension(s) tested. TBT refers to Turn-by-Turn, FCN to Free Choice Navigation and HIGH and LOW to participants with high and low environmental spatial abilities (median split).
4. Experimental Design
In this section, the experimental design is presented with all its decisions. These include the selection of experiment routes, participants, navigation conditions and the procedure description. The original experimental design was discussed with the Pilot Research Ethics Committee of TU Wien and was improved accordingly. The participants were acquired in two batches. First, friends and acquaintances were asked (snowball sampling). Once this source dried up, more than 2000 emails were sent to PhD students and post-docs of several universities in Vienna. Through these two steps, 50 participants were acquired in total. Two of them were excluded due to language problems (insufficient knowledge of German to understand the experiment task). The participants were not paid, but were offered to participate in a lottery (one prize of EUR 400). Initially, we planned an equal distribution of 26 participants per group, but we had to stop the data collection earlier due to re-emerging COVID-19 restrictions. This resulted in a slightly unequal distribution (FCN = 26, TBT = 22). Assuming = 0.05, effect size = 0.8 (i.e., a large effect), power = 0.8 and equal sample size in both groups, the a priori calculation with the software G*Power resulted in a sample size of 21 participants per group. As we expected data loss, we decided to collect a sample of 26 participants per group.
4.1. Data and Software
As the experiment area, the outskirts of Vienna were selected (district Liesing). The outskirts were selected to assure unfamiliarity with the environment. The data needed to build the graph of the experiment area were extracted from OpenStreetMap (OSM) (https://www.openstreetmap.org, last accessed 20 June 2022). The OpenStreetMap data were not completely up-to-date. In consequence, junctions and street segments were added manually. The updated graph had 865 junctions and 1250 street segments and formed the basis to find all possible routes for the experiment using SageMath 9.1 and its SubgraphSearch function (https://doc.sagemath.org/html/en/reference/graphs/sage/graphs/generic_graph_pyx.html, last accessed 30 January 2022). Several junction characteristics (e.g., regularity) were calculated using the Intersections Framework [39]. The remaining characteristics were implemented in Python 3.6.
4.2. Route Selection
We applied our previously developed route selection framework [7] to find suitable routes within the experiment area. In total, three different routes were chosen to decrease potential biases [40]. First, a route population needs to be defined. To limit the number of potential routes, we considered shortest paths only, composed of 18 junctions (according to OSM data) and between 550 and 750 m long. This allows for routes with a reasonable length from a research economics perspective and a sufficient number of junctions, i.e., potential turning points. There were 23,296 potential routes in the experiment area meeting these criteria. The above-mentioned framework finds representative routes for a given area with specific characteristics. The framework ranks routes according to a score that expresses the deviance from an average route given specific categories. The lower the score, the better a route resembles a hypothetical average route in the experiment area. The following five high-level categories with their features were used to calculate the score value for each route [7]:
- 1.
- Segment-length-related features: (a) average segment length, (b) median segment length, (c) standard deviation of segment lengths, (d) total route length
- 2.
- Cardinality of junctions: (a) average number of options at junctions, (b) number of n-way junctions (e.g., 3-way and 4-way junctions) along the route
- 3.
- Frequency of turn types: number of right, left and non-turns along the route
- 4.
- Regularity of junctions: average angle for n-way-junctions (deviation from a regular n-way junction, for more details see [39])
- 5.
- Point-of-Interest (POI)-related features: (a) average POI number at junctions, (b) standard deviation of POI number at junctions, (c) average POI uniqueness [41] at junctions, (d) standard deviation of POI uniqueness at junctions, (e) POI per meter along segments, (f) standard deviation of POI per meter along segments
The score calculation can be parameterized in order to reflect the relevance of categories for a given study design. The weights for the five high-level categories were not equal, as the study focuses on spatial knowledge acquisition. Therefore, the presence of points of interest was the most important feature (weight = 0.4). Furthermore, the frequency of turn types was important to avoid prevailing no-turns along the route (weight = 0.3). The remaining three high-level categories, segment-length-related features, cardinality of junctions and regularity of junctions were considered equally important with a weight of 0.1. The high-level category related to points of interest needs further explanation, as there is no agreement about what a point of interest is, and many definitions exist (see [42] for an overview).
4.2.1. Points of Interest
For our experiment, we initially considered every OSM object bearing the amenity tag (e.g., bars, restaurants, churches) as a potential point of interest. After a preliminary analysis and several in situ checks, a few values were excluded from this set because they were not perceivable as points of interest (e.g., rubbish tips and benches). The following values for the key amenity were excluded: waste_basket, waste_disposal, recycling, grit_bin and bench. Furthermore, parking-related features were also excluded (“amenity” NOT LIKE ’%parking%’) because parking places are barely noticeable (Google Street View and in situ check) as fences or shrubs often cover them. The same filtering was applied to polygonal POIs transformed into point features by calculating the polygon’s centroid. Moreover, bus stops, downloaded from overpass-turbo (https://overpass-turbo.eu/, last accessed 20 June 2022), were added as points of interest to the data set. Having the POI dataset ready, every POI was snapped to the nearest street segment and to the nearest junction. With this information, the features mentioned above can be calculated. A buffer around junctions or street segments was not used in order to avoid counting POIs more than once and having POIs not assigned to any street segment or junction.
4.2.2. Choosing Final Routes
The flexibility of the framework allows for defining a target route instead of the average one [7]. Given our goals (e.g., having as many POIs as possible), we set certain features of the target route to values different from the average. The number of right, left, and non-turns should be balanced and equal for all three features. Furthermore, the three POI-related features regarding the average (5 a, c and e) were set to the maximum available in the data, as we are interested in having as many POIs as possible. Features regarding the standard deviation (1c, 5 b, d and f) are set to the minimum to have POIs well distributed over street segments/junctions on the route and to avoid very long segments. For all other features, the data mean was used. Based on this target route, the weighted Euclidean distance (aka score) between all 23,296 potential routes and this target route was calculated. The smaller the score, the more similar the routes are. Having calculated the score for every potential route, three routes were selected iteratively:
- 1.
- Choose the route with the lowest Euclidean distance to target route from the remaining route population (Step 1)
- 2.
- Check if the route follows a main road only. If yes, exclude it and go to Step 1)
- 3.
- Check if the route has enough turning points. If not, exclude it and go to Step 1)
- 4.
- Check if the route has enough POIs (Google Street View and in situ checks). If not, exclude it and go to Step 1)
- 5.
- Check if the route starts/ends in a dead-end. If yes, exclude it and go to Step 1)
- 6.
- Check if the route’s start or end point lies in an area accessible only through one street segment, meaning participants will know a part of the route before the actual experiment starts. If yes, exclude it and go to Step 1)
- 7.
- Check if the route crosses parking areas. If yes, exclude it and go to Step 1)
- 8.
- Check if the route leads through allotments gardens. If yes, exclude it and go to Step 1)
- 9.
- Check if the route leads through subways. If yes, exclude it and go to Step 1)
- 10.
- Add the route to the final route list
- 11.
- Generate two buffers (200 m and 800 m) around all routes in the final route list and create the difference polygon between both buffers. The two buffers are employed to avoid crossing routes and to keep the walking distance between two routes reasonable.
- 12.
- Limit the route population to routes within the difference polygon and not intersecting with the smaller buffer
- 13.
- Repeat until three routes are found.
The suitability of the three similar (according to the route selection framework) routes was verified in situ before the experiment. One of the three experiment routes was assigned randomly to each participant. The selected routes are presented in Figure 1.
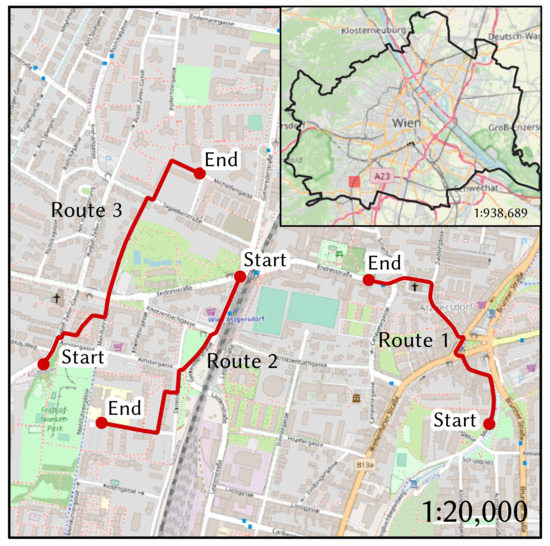
Figure 1.
The three final routes in the experiment area located in Liesing (outskirts of Vienna, Austria). The inset map shows the location of the experiment area within the administrative boundary of Vienna. Background map OpenStreetMap.
4.3. Conditions
In this subsection, we describe the two navigation conditions (between-subject design), namely Turn-by-Turn (TBT) and Free Choice Navigation (FCN). For safety reasons, all participants were accompanied by the experimenter at all times. While walking, the experimenter logged further data with a custom kotlin app on an Android tablet. In both conditions, the participants received audio instructions via a single Bluetooth earbud (to not block environmental sounds such as cars). The experimenter carried the second earbud. A trial ended once the participant reached the destination within 150% length of the shortest path (success), or it was interrupted if this was not possible anymore due to the walked route so far (failure).
4.3.1. Turn-by-Turn and Application Choice
In the Turn-by-Turn (TBT) approach, an instruction is given at every turning point along a predefined route. A very popular application offering TBT navigation, Google Maps, could not be used because the underlying data are not freely available, and it is different from our data basis in the FCN condition (OSM). Therefore, the navigation systems would not be fully comparable. Several smartphone apps offer OSM-based Turn-by-Turn navigation. However, we excluded many due to shortcomings such as no audio instructions (https://maps.me/, last accessed 22 June 2022), aggressive map matching (https://www.sygic.com/gps-navigation, last accessed 22 June 2022), and uncontrollable intermediate navigation instructions (https://osmand.net/, last accessed 22 June 2022. Finally, the app Organic Maps (https://organicmaps.app/, last accessed 22 June 2022) was chosen, which is similar to MapsMe, but offers audio instructions.
In our scenario, these instructions are issued by the application Organic maps via earbuds. To ensure high positional accuracy, a Global Navigation Satellite System (GNSS) receiver manufactured by PPM (model 10xx-38) was attached to the experiment smartphone (OnePlus 5T) held by the participant. The map orientation changed according to the device orientation (see Figure 2a). The task was to follow the indicated route using the application and its audio instructions.
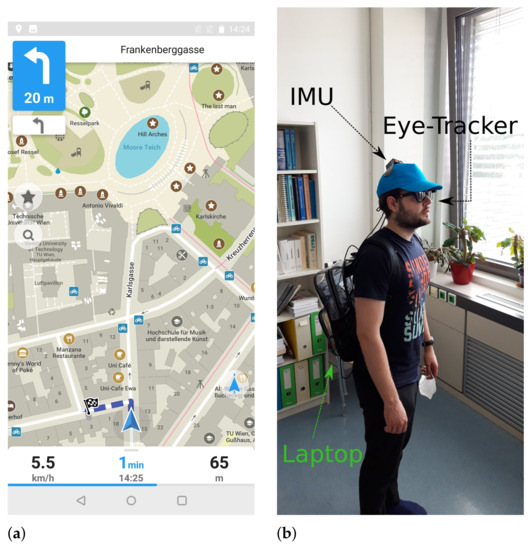
Figure 2.
Experiment setup: (a) Organic Maps interface with a track-up orientation and 2D buildings; (b) Participant with mounted sensors. The laptop powers the IMU (inertial measurement unit) that tracks the participant’s head movements. The eye-tracker is used to verify the map drawings of the participants. The pictures do not show the experiment area (illustration purposes only).
4.3.2. Free Choice Navigation
In this condition, the Free Choice Navigation approach [6] was implemented through a custom Android application operated by the experimenter. This approach aims for more freedom while navigating, simultaneously assisting the wayfinder in difficult situations. In the beginning, the participants received two pieces of information: the direction to the destination, marked by a red arrow on the ground, and the beeline distance to the destination. While the participant was walking, the FCN system decided at every junction whether assistance was needed. This decision was based on environmental spatial abilities (derived from the Santa Barbara Sense of Direction Scale (SBSOD) questionnaire), the walked route so far, and the situation at the next junction (e.g., distance to destination, number of options, possible detours).
The task was to find the unknown destination with the assistance of the Free Choice Navigation system. As one of the aims of FCN is minimizing the information provided to the user, the destination was kept unknown, as there was no graphical interface that would have facilitated the communication of the destination. The experimenter stressed that the destination could not be missed because the system would notify the participant on arrival. Furthermore, the experimenter underlined that the destination is a junction and underlined that it is not a point of interest (e.g., church, supermarket, bus stop). While the FCN approach is not tied to any particular method of conveying route instructions, we selected auditory TBT instructions due to comparability with the TBT condition and widespread use (e.g., “turn left!”). If the system supported the participant with an instruction, it was valid only for the current junction and not for the upcoming ones (e.g., go straight ahead). Additionally, the instruction “turn around” was explained as a 180° turn and a walk back to the previous junction. The participants were asked to follow the issued instructions.
4.4. Procedure
This subsection describes the complete procedure with all its questionnaires and tasks. It consists of an online and an in situ part. The entire experiment, including documents, task descriptions and questionnaires, was conducted in German; however, as there is no official translation of the NASA TLX questionnaire, the original was used, and if needed, an unofficial translation was provided (https://www.keithv.com/software/nasatlx/nasatlx_german.html, last accessed 20 June 2022).
4.4.1. Online Part
The online part started with the experiment description and the informed consent regarding the recorded data. The participants then had to answer questions about demographics (sex and age), usage of navigation aids in unknown environments, spatial strategies (in German Fragebogen Räumliche Strategien [43]), sense of direction (SBSOD) [44] and psychological traits [45]. Furthermore, participants were asked to what degree they would be willing to accept walking longer routes (0–100% longer) for each of the following two reasons: (1) if they would gain more control over the walked route, compared to a predefined route; (2) if they would gain more knowledge about the environment. The completion of the online part took between 15 and 25 min.
4.4.2. In Situ Part
The in situ part took place on the outskirts of Vienna (Austria), in Liesing (see Figure 1). Exclusively persons who visited Liesing no more than once throughout the last year were allowed to participate in order to ensure unfamiliarity. None of the participants was a resident of the experiment area. Before the experiment started, the informed consent was signed, and the assigned condition was explained to the participant. The sensors were then attached to the participant (see Figure 2b). The experimenter explained the task again, and the first trial started if no further questions were left. Once the trial ended (destination reached or not possible anymore to be reached within 150% of the shortest path), the participant filled out three questionnaires regarding the workload (NASA TLX [37]), the usability (System Usability Scale [38]) and the user experience (User Experience Questionnaire [36]). Subsequently, a battery of four tests was used to approximate spatial knowledge acquisition.
First, staying at the destination, the participant was asked to look in the direction of the starting point (judgment of relative direction) and estimate the walked distance. While pointing to the starting point, the experimenter stood 2 m behind the participant and measured the direction with a digital compass app (https://play.google.com/store/apps/details?id=com.vincentlee.compass, last accessed 17 October 2022). The next task was to draw the walked route abstractly (abstract route drawing task). The experimenter stressed that the order and number of turns were important, not metric or absolute information. In this task, participants were also asked to indicate junctions at which they walked straight ahead, i.e., a non-turn. The following two tasks consisted of drawing the walked route and remembered points of interest (POIs) on a map with streets only. The start and end points were also indicated on the map. The experimenter underlined that every remembered detail of the environment could be a POI, e.g., the color or the architectural style of a building, a bus stop or a pedestrian crossing. After the last spatial knowledge acquisition task, the participant conducted an additional task about wayfinders’ orientation. These data were collected in the same study to minimize the number of rides to the experimental area and to reduce time effort considerably. As this additional task always took place after the navigation task with TBT or FCN, it did not influence the study results and is thus irrelevant to this work.
After a short debriefing, participants were allowed to ask questions regarding the experiment and the research questions. If no questions were left, the experiment ended at this point. The completion of the in situ part took between 90 and 120 min.
5. POIs—Data Cleaning
The participants had to draw POIs on a map. In order to analyze them, data cleaning was needed. While we excluded overly generic entries (e.g., “building”), POIs referring to specific details (e.g., “yellow building”) were considered. Points, lines, and polygons were valid shapes for a POI. We additionally excluded entities not located along the route or visible from a distance, which participants likely knew due to their way to the experiment. Furthermore, we considered non-permanent objects [46,47] such as a parked yellow motorbike or temporary placed furniture on the sidewalk as valid POIs for the analysis, since they represent a memorized detail of the environment. To obtain real-world coordinates of the POIs, the paper map with the marked POIs was georeferenced with QGIS 3.14 [48] to match the OSM map. If the drawn POI was not present in the OSM map, the eye tracking video was used to extract the position (potentially missing features in OSM). If the POI was not present on the map and no video was available, then the location derived was based on the experimenter’s memory. If the drawn POI was found neither on the map nor in the video (or experimenter’s memory), it was excluded from the analysis. Polygon-like features were only valid if delineated completely (e.g., park and public swimming pool). To convert valid polygons and lines (e.g., railway lines) into point features, their centroid was used.
6. Analysis and Results
In this section, we present the study results regarding our research questions and hypotheses (see Section 3). If not stated otherwise, the number of participants equals 48 (FCN—26 (10 females), TBT—22 (10 Females)). Given that there are potentially large individual differences [49,50] in spatial abilities, we compare the answers (SBSOD questionnaire) of both groups in order to ensure that any significant difference will not originate from differences in environmental spatial abilities. A Wilcoxon–Mann–Whitney test did not show a significant difference (, ) between the FCN (, ) and the TBT (, ) groups regarding self-reported spatial abilities (scaled to the interval [0;1]). As OSM was used as the underlying data, the walked and drawn routes were snapped to the OSM network before the analysis. We analyzed (Data analysis was conducted using GNU R v4.2.1 and its packages dplyr v1.0.9 [51], stringr v1.4.0 [52], coin v1.4.2 [53], tidyr v1.2.0 [54], Cairo v1.6.0 [55], ggplot2 v3.3.6 [56], stringdist v0.9.8 [57], SimilarityMeasures v1.4 [58], geojsonR v1.1.0 [59], BiDimRegression v2.0.1 [60].) the resulting dataset with respect to six groups of hypotheses (see Table 1). For all statistical tests, we used Wilcoxon–Mann–Whitney tests due to the non-normality of the data (Shapiro–Wilk tests and Q-Q plots). In order to avoid inflation of -errors, we applied corrections to the p-value according to Holm [61] (baseline ).
Besides comparing the two navigation systems, we analyze people’s general willingness to take longer routes. Finally, we scrutinize the impact of environmental spatial abilities (SBSOD, median split) on route length and the number of received instructions in the case of the FCN condition (see Section 3 and Table 1).
6.1. Arrival Rate and Number of Instructions
All participants (22) in the TBT condition reached the destination, whereas, in the FCN condition, 23 out of 26 (88.46%) participants were successful. Next, we compare the relative (normalized by the number of traversed junctions) and the absolute number of received instructions. We consider the relative number of instructions because FCN users should traverse more junctions, given their freedom. With the FCN (, ) approach, participants had significantly fewer (Z = −3.18, ) instructions than the TBT group (, ), relative to the number of traversed junctions. Regarding the absolute number of instructions, there was no significant difference (, —Holm correction) between both groups (TBT: , ; FCN: , ).
6.2. Spatial Knowledge Acquisition
In this subsection, we present the results regarding spatial knowledge acquisition: judgment of relative direction (JRD), walked distance estimation, abstract route drawing, route drawing on a map, and drawing points of interest on a map (see Section 4.4.2 for details on tasks).
6.2.1. Pointing to Start Point and Distance Estimation
For both tasks, we calculated the absolute deviation of the estimation from the true value (i.e., under- and overestimation were considered equally). There was no significant difference (, ) between FCN (, ) and TBT (, ) regarding the JRD task. For the distance estimation task, the sample size is 44 (26 FCN, 18 TBT) because 4 participants in the TBT condition saw the walking distance at the beginning of the navigation task. The rest was not aware of the walking distance. Regarding the estimation of the walked distance, there was no significant difference (, —Holm correction) between both groups (TBT: , ; FCN: , ).
6.2.2. Abstract Route Drawing
Having collected the data, we found that the concept of a junction varies considerably among participants (see potential future work in Section 9). Therefore, we only analyze turns but do not consider drawn junctions at which the route was continued (no turn). First, we compare the number of turns drawn with the actual number of turning points during the trial (absolute value). There was no significant difference (, ) between the FCN (, ) and the TBT (, ) groups regarding the number of drawn turns compared to these actually walked. Second, we compare the sequence of turns (right, left, and turn around) with the walked sequence using the Levenshtein distance, a widespread measure in natural language processing successfully employed to compare route sequences in [62]. One drawing from the FCN condition was excluded, because the turning points were not appropriately marked with letters (R—right, L—left) (). Again, there was no significant difference (, ) regarding the Levenshtein distance between the walked turn sequence and the drawn one between FCN (, ) and TBT (, ).
6.2.3. Route Drawing on Map
A route similarity metric is needed to compare the walked route with the drawn one on a map. As the drawn trajectories do not have a temporal component, we will not consider similarity measures accounting for the temporal data dimension [63]. Toohey and Duckham compared four similarity measures for routes and provided an R package for the calculations [64]. The four compared measures are: Fréchet distance (FD), dynamic time warping (DTW), longest common subsequence (LCSS) and edit distance on real sequence (EDR). We exclude the Fréchet distance because back and forth movements are not allowed in this similarity measure [64], but several participants walked a street segment twice. From the four mentioned measures, Su and colleagues [63] found that DTW and LCSS can handle different types of transformations, whereas EDR and FD do not. According to Tao and colleagues [65], DTW and FD were more in line with their human expectations while conducting a series of tests (e.g., bird routes). As we already mentioned, we excluded FD and, in consequence, compared the walked routes with the drawn routes on a map with DTW. The lower the DTW score, the more similar both trajectories are. There was no significant difference ( 2.67, 0.004—Holm correction) between the FCN ( 572.19, 797.36) and the TBT ( 375.32, 1281.52) groups regarding the DTW score between drawn and actually walked routes.
6.2.4. Points of Interest on Map
Regarding points of interest (POIs) drawn by participants, we analyze the absolute number and the configuration similarity applying bidimensional regression. There was no significant difference (, ) between the FCN (, ) and the TBT (, ) groups regarding the number of drawn POIs on the map. We applied bidimensional regression, proposed by Tobler [66], to assess the configuration similarity between the drawn POIs and their true locations. We use the R package bidimregression [67], which builds on Friedman’s work [68] and offers as well significance tests proposed by Nakaya [69]. To calculate any statistics, at least 4 pairs of coordinates are needed [69], therefore, we consider only participants with at least 4 valid (see Section 5) drawn POIs, i.e., we base our analysis on participants (FCN = 23, TBT = 19). For each valid (at least four valid POIs) participant, the coefficient was calculated. The coefficient expresses the configuration similarity between the drawn POIs and their true locations. A Wilcoxon-Mann–Whitney test did not reveal a significant difference (, ) regarding the configuration similarity between FCN (, ) and TBT (, ).
6.3. Workload and User Experience
In this subsection, we will analyze the differences between FCN and TBT regarding user experience (UEQ), workload (NASA TLX Raw) and usability (SUS) (see Table 1).
6.3.1. SUS
One missing value in the System Usability Scale questionnaire was replaced with the most frequent answer (mode) for the affected question [70]. Between FCN (, ) and TBT (, ) there was no significant difference found (, ). Both navigation systems fall into the second-highest category “A” in the Sauro–Lewis SUS curved grading scale [71].
6.3.2. UEQ
In total, two of the six subdimensions, perspicuity and efficiency, will not be analyzed because questions 21 and 23 were not answered in the FCN condition, as no graphical interface was present. In total, five values were missing, which were replaced by the mode (see, again, [70]). We used the analysis tool [72] provided by the authors to assess the hedonic quality (stimulation and novelty) of both systems. FCN has a very high hedonic quality (excellent stimulation and good novelty), whereas the TBT approach provides a below average hedonic quality (below average stimulation and bad novelty). A series of Wilcoxon–Mann–Whitney tests showed significantly better results for FCN for the subdimensions stimulation and novelty (see Table 2). The subdimensions attractiveness and dependability did not show a significant difference.
Table 2.
Inferential statistics for the User Experience Questionnaire. Significant results are boldfaced. FCN refers to the Free Choice Navigation condition and TBT to the Turn-by-Turn condition. The subdimensions perspicuity and efficiency are left out due to missing data.
6.3.3. NASA TLX Raw
There was no significant difference (, —Holm correction) in reported mental demand between FCN participants () and TBT users (, ). The remaining subdimensions of the NASA TLX questionnaire did not reveal significant results either (see Figure 3 and Table 3). Additionally, no significant difference concerning the overall task load (sum) was found between both wayfinding methods.
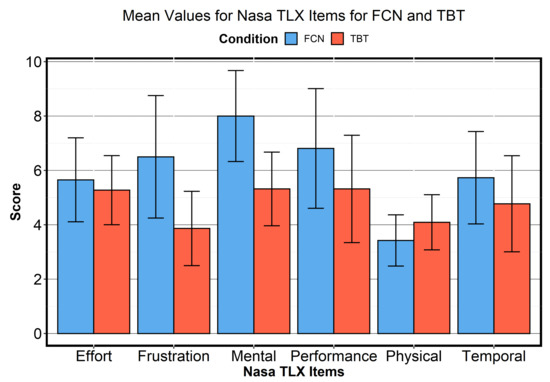
Figure 3.
Mean values for NASA TLX Raw items for FCN (blue) and TBT (brick), error bars represent 95% confidence intervals.
Table 3.
Inferential statistics for the NASA TLX Raw comparison. FCN refers to the Free Choice Navigation condition and TBT to the Turn-by-Turn condition.
6.4. A Wish for Freedom and Learning
In the online part of the study, all potential participants were asked about the increase in route length (in %) they would accept if they (1) gain more control over the route (in contrast to a predefined route) or (2) learn more about the environment. These answers will shed light on whether subjects would value wayfinding assistance not based on shortest-path guidance. As these are general questions, which are condition independent, they were asked before the experiment to avoid potential bias. In total, 81 potential participants finished the online part (48 signed up for and finished the in situ part) and replied to both questions. The answers show an interest in having more freedom while navigating and/or learning about the surrounding environment (see Figure 4). A paired Wilcoxon test showed that participants have a preference for longer routes (, p < ) in order to learn more about the environment (, ) rather than accepting longer routes to gain control over the route (, ).
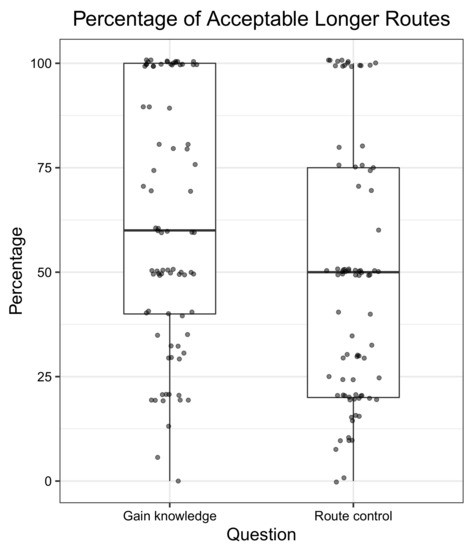
Figure 4.
Boxplots with jittered data points of longer routes (%) participants are willing to take to have more (1) control over the walked route or (2) knowledge about the environment.
6.5. Environmental Spatial Abilities and Performance in FCN
In this subsection, we scrutinize whether self-report environmental spatial abilities (SBSOD) impacted the performance in the FCN condition. As a proxy for the performance, we will consider route length, the absolute number of instructions and the relative number of instructions (normalized by the number of traversed junctions). The arrival rate would be a performance indicator, but there were not enough participants who did not finish the trial successfully. As the three routes have different lengths, the walking distance of each participant is normalized by the shortest path length of the corresponding route. The 23 successful participants in the condition FCN were split into two groups regarding their environmental spatial abilities (median split into groups low and high). No significant difference was found (, ) between participants with low (, , ) and high (, , ) environmental spatial abilities. Additionally, there was no difference found regarding the absolute (, ) nor the relative (, ) number of instructions.
Taken together, our analyses reveal: (1) Participants assigned to the FCN condition received fewer instructions (normalized by the number of traversed junctions) than those using the TBT system; (2) There was no significant difference between both groups in terms of spatial knowledge acquisition; (3) The FCN navigation system was rated higher in terms of stimulation and novelty (UEQ); (4) As a reason for walking longer routes, learning more about the environment is preferred over controlling the exact route.
7. Discussion
The rationale behind FCN is to provide users more freedom to make route decisions while navigating. As the decision-making process about which street segment to take is not fully outsourced to the navigation system (as in TBT), we expected more engagement and interaction with the environment and, consequently, increased spatial knowledge acquisition.
The most important capability of a navigation system is to successfully guide users to their destinations. Regarding the arrival rate (RQ1), the FCN approach (arrival rate 88.46%, 23/26 participants) is less effective than the TBT approach (arrival rate 100%). The superiority of TBT over FCN, regarding the arrival rate, is in line with our previous simulation study [6]. One participant did not interpret the given navigation instruction correctly and took a wrong turn. In the case of two further participants, our system did not give any instruction at a junction because, according to our model [6], the participants were still well oriented, but apparently they were not and took the wrong street segment, i.e., the actual participant’s knowledge about the direction towards the destination (belief vector) and the modeled one did not correspond, and an instruction should have been issued at this junction. Although the modeled belief vector works reasonably well most of the time, it requires further revision and improvement (discussed in Section 9).
On the other hand, FCN succeeded in giving more freedom to the user (RQ2). FCN participants had to make their own decisions at more than 50% of the traversed junctions, which is, again, in line with our previous work [6]. Not only did the users have to make their own decisions at several junctions, they were also provided with fewer instructions relative to the number of traversed junctions. Furthermore, less navigation system use favors more forward and backward glances [73], and, therefore, the environment is potentially observed more attentively. Parush and colleagues concluded that forcing participants to engage with the environment can lead to better spatial knowledge [74]. In consequence, we hypothesized that users would direct this attention to the environment and, in doing so, enhance their spatial knowledge acquisition (RQ3). The collected data do not support this hypothesis. We did not find a significant difference between the two systems for any of the spatial knowledge acquisition tasks. Although there was no significant difference regarding SKA, we want to highlight some tasks. FCN participants estimated the walked distance on average better by ca. 115 m than TBT participants, which suggests the value of FCN for proprioception. TBT users traced their route on a map more accurately than FCN participants. This was expected because a map was always visible during the trial. While we hypothesized that the presence of the map with the route (TBT) would facilitate memorizing the turns, no difference between both conditions was found. Perhaps TBT participants did not often look at the map. This can be answered with the eye-tracking data collected but not yet analyzed (see Section 9). Regarding the number of drawn POIs, we expected no difference as TBT users had a map with POIs, and the FCN users had to actively look around and remain attentive while navigating. TBT participants drew on average 1.7 POIs more (insignificant difference like in [33]) suggesting that forced engagement with the environment might be insufficient grounds to improve landmark memory, which is in contrast to the work by Parush and colleagues [74] suggesting that keeping users attentive may lead to better spatial knowledge. Both groups had a similarly high configuration similarity of the drawn POIs. This was unexpected, as FCN users had no map to see the POIs put into relation. This is of particular interest and suggests that people can compensate for a missing map that provides this type of information. Regarding the JRD task, our data did not reveal any difference between both systems. This is in line with [33], but in contrast to [31], although in both works participants had the freedom to choose their own routes. Therefore, more analysis is needed to understand where this difference potentially originates from.
The missing improvement in spatial knowledge has several potential reasons: (1) The users need more support, e.g., a map display on demand [74], although other results suggest that audio-only instructions can lead to comparable spatial knowledge acquisition such as smartphone or AR-based navigation [8]; (2) The users may also need information between junctions to improve orientation and trust [75]; (3) The user needs more time to familiarize with the FCN navigation approach to have more trust in the system; (4) Making own decisions does not guarantee enhanced spatial knowledge acquisition, although it has the potential to do so [33]; (5) Making own decisions does not mean full engagement with the environment and looking around in all directions [73]. It is also possible that the participants were only attentive around the junctions but not in between.
There was no significant difference regarding the workload (NASA TLX Raw). Contrary to our expectations, FCN participants did not report a significantly higher mental demand than TBT participants. This would be in line with the work of Haosheng and colleagues [33], in which participants also had to make their own decisions at junctions. According to the NASA TLX results, FCN participants did not feel an increased physical demand—despite an average increase in route length of 19%. This suggests that moderately increased walking distances (in the FCN condition on average 19%, compared to the shortest path) can be used for further purposes without increasing the physical demand considerably. This is in line with people’s willingness to take longer routes (see Section 6.4). We also expected that FCN participants would experience increased levels of effort, frustration, and performance (the higher, the greater the sense of failure), but the data did not reveal significant differences with respect to TBT. In order to explain these results, further work with interviews after the trial is needed to obtain more in-depth information about the users’ perception of the system. According to our expectations (see Table 1), the FCN system was rated higher regarding attractiveness, novelty, and stimulation (UEQ). A high score in stimulation shows that our system is motivating. Although we predicted a lower score for dependability in the FCN condition because of the uncertainty if an instruction will be given at the next junction, the dependability of the two navigation systems did not differ. This outcome suggests that, although FCN users did not know the exact mechanism behind the system, they did not feel less secure than TBT users. On the other hand, the dependability of Organic Maps is possibly lower than in the case of Google Maps, to which most users are accustomed to. Regarding the usability (SUS), both systems did not show any difference; however, both systems have potential for improvement as they fall into the second-highest category “A” in the Sauro–Lewis SUS curved grading scale [71] and not into the highest one. Therefore, we conclude that the FCN navigation system demonstrates an acceptable performance regarding user experience and usability.
In our previous work [6], we hypothesized that FCN would be more difficult for users with low environmental spatial abilities (RQ4). The arrival rate would be one indicator, but there was not enough data, i.e., there were not enough participants that did not finish the trial successfully. Another proxy can be the length of the walked route and the number of received instructions. Longer routes would indicate more difficulties in reaching the destination, and an increased number of instructions would indicate more assistance by the system and less independent navigation. As no difference was identified regarding these two features, we cannot conclude that people with low environmental spatial abilities experience more difficulties than those with high environmental spatial abilities while using Free Choice Navigation. This is not in line with our previous simulation results [6] in which agents with lower environmental spatial abilities reached their destination less often. One possible explanation is that our simulation did not model spatial cognition profoundly.
The online survey on the willingness to take longer routes (RQ5) showed that learning about the environment is more desirable than gaining control over the route as a reason for taking longer routes (see Figure 4). As the average answer to the question about learning the environment was 61%, it suggests that people are interested in becoming more familiar with and gaining more knowledge about their environments. This is an argument in favor of works on navigation systems enhancing spatial knowledge acquisition, as long as this aspect is an add-on to an acceptable arrival rate.
Taken together, we have seen the potential of Free Choice Navigation to provide wayfinders more freedom while navigating. This might also increase serendipity effects (e.g., they encounter new features in the environment). Based on informal post-experiment conversations, we have the impression that our approach can be combined with gamification: Several FCN participants expressed that they liked the approach because it felt akin to a scavenger hunt. Similarly, creativity during wayfinding might be stimulated as one participant claimed to have oriented herself based on a specific cloud, albeit the person had no experience in orienteering sports.
8. Limitations
Several limitations apply to our work. The first aspect relates to the point in time at which participants received the instruction to turn around. Having made a decision leading to such a “go back” instruction, users are only informed about this wrong decision at the upcoming junction in the current implementation. An updated implementation could, for example, notify users shortly after the junction at which such a decision was made. This would save walking distance and probably increase the number of successful participants in the FCN condition. We did not implement this improvement in order to keep the results comparable with the simulation study [6]. The modeling of the environmental complexity for a junction influences the FCN navigation approach, as a higher environmental complexity leads, broadly speaking, to more difficulties in taking an appropriate street segment according to our model [6]. Therefore, further modeling approaches (e.g., [76,77]) need to be tested because we believe that a more realistic measure for environmental complexity would improve the FCN approach, as difficult junctions could be identified better and the system would assist the user more accurately. Regarding the analysis of the TBT approach, one limitation is that we did not control which points of interest were visible at which zoom level. This selection, determined by Organic Maps, may have had an impact on the acquisition of spatial knowledge. Having said this, while participants could have changed the zoom level, the majority of participants did not change it at all.
As people were unfamiliar with the concept of FCN and there was no graphical display, their trust in the system was somewhat limited. Therefore, a longitudinal navigation study seems to be a better choice to familiarize users with the FCN approach, potentially increase their trust in the system [78] and meet pedestrian needs [79].
9. Conclusions and Future Work
In this study, we implemented a first prototype of the Free Choice Navigation (FCN) approach and compared it with the widespread Turn-by-Turn (TBT) approach. The study showed that participants can be guided successfully to their destinations and, at the same time, receive fewer navigation instructions in comparison with the TBT approach (relative to the number of traversed junctions). Fewer instructions and forced engagement with the environment, however, did not result in differences with respect to spatial knowledge acquisition, but it is worth mentioning that FCN users (without a map) can extract spatial configuration information as well as TBT users equipped with a map. Moreover, we provided evidence that people are interested in learning more about their environments and are willing to walk longer routes to achieve it. Finally, we present the first real-world use of the route selection framework [7], which can guide researchers having to select one or more routes between several thousand ones. Regarding future work, there are several potential directions to follow.
The FCN approach can be further improved by implementing turn-around instructions to avoid unnecessary detours. The collected data allows for updating several assumptions we made in the initial model [6], making the model more accurate. Notably, the additional task in which participants had to conduct several pointing tasks is valuable for improving the belief vector [6] in our model. In this study, auditory TBT instructions were used. In further studies, other types such as smartphone-based instructions, augmented reality cues [4,80] or vibrotactile feedback [28] could be used to convey useful information at junctions if assistance is needed. The head-mounted augmented reality approach seems to be the most promising one, as the user does not need to look at an additional screen. Furthermore, the destination can be made always visible (beeline approach), as geographic objects can be visualized quite accurately outdoors [81]. If auditory instructions are used again, they can be altered by adding additional information [2,82]. Instead of dividing the environment at junctions, spatial chunking [83] could further decrease the number of instructions issued. Furthermore, the prediction mechanism behind FCN can be combined with the conceptual framework of Jin and colleagues [84] to better model route choice behavior.
Another interesting research question regards the perception of junctions by users, as we observed different notions among participants. Not all junctions identified by the underlying OSM data were perceived as such. Another example is a roundabout, which can be considered one 5-way junction or five 3-way junctions. Therefore, a human-subject experiment will scrutinize the perception of junctions.
Author Contributions
Conceptualization, Bartosz Mazurkiewicz, Markus Kattenbeck and Ioannis Giannopoulos; methodology, Bartosz Mazurkiewicz, Markus Kattenbeck and Ioannis Giannopoulos; software, Bartosz Mazurkiewicz; formal analysis, Bartosz Mazurkiewicz; investigation, Bartosz Mazurkiewicz; data curation, Bartosz Mazurkiewicz; writing—original draft preparation, Bartosz Mazurkiewicz; writing—review and editing, Bartosz Mazurkiewicz, Markus Kattenbeck and Ioannis Giannopoulos; visualization, Bartosz Mazurkiewicz; supervision, Markus Kattenbeck and Ioannis Giannopoulos; project administration, Bartosz Mazurkiewicz, Markus Kattenbeck and Ioannis Giannopoulos. All authors have read and agreed to the published version of the manuscript.
Funding
Open Access Funding by TU Wien.
Institutional Review Board Statement
The original experimental design was discussed with the Pilot Research Ethics Committee of TU Wien (25.06.2021) and was improved accordingly.
Informed Consent Statement
Informed consent was obtained from all subjects involved in the study.
Data Availability Statement
The data presented in this study are available upon request from the corresponding author.
Conflicts of Interest
The authors declare no conflict of interest.
Abbreviations
List of Abbreviations
| AR | Augmented Reality |
| FCN | Free Choice Navigation |
| GNSS | Global Navigation Satellite System |
| GPS | Global Positioning System |
| IMU | Inertial Measurement Unit |
| JRD | Judgment of Relative Direction |
| NASA TLX | NASA Task Load Index |
| OSM | Open Street Map |
| POI | Point of Interest |
| PRA | Potential Route Area |
| Q-Q Plot | Quantile-Quantile Plot |
| QGIS | Quantum Geographic Information System |
| RQ | Research Question |
| SBSOD | Santa Barbara Sense of Direction Scale |
| SKA | Spatial Knowledge Acquisition |
| SUS | System Usability Scale |
| TBT | Turn-by-Turn |
| UEQ | User Experience Questionnaire |
References
- Montello, D.R. Navigation. In The Cambridge Handbook of Visuospatial Thinking; Cambridge University Press: New York, NY, USA, 2005; pp. 257–294. [Google Scholar] [CrossRef]
- Schwering, A.; Krukar, J.; Li, R.; Anacta, V.J.; Fuest, S. Wayfinding Through Orientation. Spat. Cogn. Comput. 2017, 17, 273–303. [Google Scholar] [CrossRef]
- Löwen, H.; Krukar, J.; Schwering, A. Spatial Learning with Orientation Maps: The Influence of Different Environmental Features on Spatial Knowledge Acquisition. ISPRS Int. J. Geo. Inf. 2019, 8, 149. [Google Scholar] [CrossRef]
- Liu, B.; Ding, L.; Meng, L. Spatial knowledge acquisition with virtual semantic landmarks in mixed reality-based indoor navigation. Cartogr. Geogr. Inf. Sci. 2021, 48, 305–319. [Google Scholar] [CrossRef]
- Kapaj, A.; Lin, E.; Lanini-Maggi, S. The Effect of Abstract vs. Realistic 3D Visualization on Landmark and Route Knowledge Acquisition. In Proceedings of the 15th International Conference on Spatial Information Theory (COSIT 2022), Kobe, Japan, 5–9 September 2022; Ishikawa, T., Fabrikant, S.I., Winter, S., Eds.; Schloss Dagstuhl—Leibniz-Zentrum für Informatik: Dagstuhl, Germany, 2022; Volume 240, pp. 15:1–15:8. [Google Scholar] [CrossRef]
- Mazurkiewicz, B.; Kattenbeck, M.; Giannopoulos, I. Navigating Your Way! Increasing the Freedom of Choice During Wayfinding. In Proceedings of the 11th International Conference on Geographic Information Science (GIScience 2021)—Part II, Poznań, Poland, 27–30 September 2021; Janowicz, K., Verstegen, J.A., Eds.; Schloss Dagstuhl—Leibniz-Zentrum für Informatik: Dagstuhl, Germany, 2021; Volume 208, pp. 9:1–9:16. [Google Scholar] [CrossRef]
- Mazurkiewicz, B.; Kattenbeck, M.; Kiefer, P.; Giannopoulos, I. Not Arbitrary, Systematic! Average-Based Route Selection for Navigation Experiments. In Proceedings of the 11th International Conference on Geographic Information Science (GIScience 2021)—Part I, Poznań, Poland, 27–30 September 2021; Janowicz, K., Verstegen, J.A., Eds.; Schloss Dagstuhl–Leibniz-Zentrum für Informatik: Dagstuhl, Germany, 2020; Volume 177, pp. 8:1–8:16. [Google Scholar] [CrossRef]
- Huang, H.; Schmidt, M.; Gartner, G. Spatial Knowledge Acquisition with Mobile Maps, Augmented Reality and Voice in the Context of GPS-based Pedestrian Navigation: Results from a Field Test. Cartogr. Geogr. Inf. Sci. 2012, 39, 107–116. [Google Scholar] [CrossRef]
- Yount, Z.F.; Kass, S.J.; Arruda, J.E. Route learning with augmented reality navigation aids. Transp. Res. Part Traffic Psychol. Behav. 2022, 88, 132–140. [Google Scholar] [CrossRef]
- Xu, Y.; Qin, T.; Wu, Y.; Yu, C.; Dong, W. How do voice-assisted digital maps influence human wayfinding in pedestrian navigation? Cartogr. Geogr. Inf. Sci. 2022, 49, 271–287. [Google Scholar] [CrossRef]
- Rümelin, S.; Rukzio, E.; Hardy, R. NaviRadar: A Novel Tactile Information Display for Pedestrian Navigation. In Proceedings of the 24th Annual ACM Symposium on User Interface Software and Technology, Association for Computing Machinery, New York, NY, USA, 16–19 October 2011; pp. 293–302. [Google Scholar] [CrossRef]
- Giannopoulos, I.; Kiefer, P.; Raubal, M. GazeNav: Gaze-Based Pedestrian Navigation. In Proceedings of the 17th International Conference on Human–Computer Interaction with Mobile Devices and Services, Copenhagen, Denmark, 2–6 September 2019; Association for Computing Machinery: New York, NY, USA, 2015; pp. 337–346. [Google Scholar] [CrossRef]
- Hejtmánek, L.; Oravcová, I.; Motýl, J.; Horáček, J.; Fajnerová, I. Spatial knowledge impairment after GPS guided navigation: Eye-tracking study in a virtual town. Int. J. Hum. Comput. Stud. 2018, 116, 15–24. [Google Scholar] [CrossRef]
- Ishikawa, T. Satellite Navigation and Geospatial Awareness: Long-Term Effects of Using Navigation Tools on Wayfinding and Spatial Orientation. Prof. Geogr. 2019, 71, 197–209. [Google Scholar] [CrossRef]
- Ruginski, I.T.; Creem-Regehr, S.H.; Stefanucci, J.K.; Cashdan, E. GPS use negatively affects environmental learning through spatial transformation abilities. J. Environ. Psychol. 2019, 64, 12–20. [Google Scholar] [CrossRef]
- Vandenberg, S.G.; Kuse, A.R. Mental Rotations, a Group Test of Three-Dimensional Spatial Visualization. Percept. Mot. Ski. 1978, 47, 599–604. [Google Scholar] [CrossRef]
- Kozhevnikov, M.; Hegarty, M. A dissociation between object manipulation spatial ability and spatial orientation ability. Mem. Cogn. 2001, 29, 745–756. [Google Scholar] [CrossRef] [PubMed]
- Dahmani, L.; Bohbot, V.D. Habitual use of GPS negatively impacts spatial memory during self-guided navigation. Sci. Rep. 2020, 10, 6310. [Google Scholar] [CrossRef] [PubMed]
- Gardony, A.L.; Brunyé, T.T.; Taylor, H.A. Navigational Aids and Spatial Memory Impairment: The Role of Divided Attention. Spat. Cogn. Comput. 2015, 15, 246–284. [Google Scholar] [CrossRef]
- Brügger, A.; Richter, K.F.; Fabrikant, S.I. How does navigation system behavior influence human behavior? Cogn. Res. Princ. Implic. 2019, 4, 5. [Google Scholar] [CrossRef]
- Ben-Elia, E. An exploratory real-world wayfinding experiment: A comparison of drivers’ spatial learning with a paper map vs. turn-by-turn audiovisual route guidance. Transp. Res. Interdiscip. Perspect. 2021, 9, 100280. [Google Scholar] [CrossRef]
- Sugimoto, M.; Kusumi, T.; Nagata, N.; Ishikawa, T. Online mobile map effect: How smartphone map use impairs spatial memory. Spat. Cogn. Comput. 2022, 22, 161–183. [Google Scholar] [CrossRef]
- Wunderlich, A.; Gramann, K. Eye movement-related brain potentials during assisted navigation in real-world environments. Eur. J. Neurosci. 2021, 54, 8336–8354. [Google Scholar] [CrossRef]
- Gallo, D.; Shreepriya, S.; Willamowski, J. RunAhead: Exploring Head Scanning Based Navigation for Runners. In Proceedings of the 2020 CHI Conference on Human Factors in Computing Systems, Honolulu, HI, USA, 25–30 April 2020; Association for Computing Machinery: New York, NY, USA, 2020; pp. 1–13. [Google Scholar] [CrossRef]
- Liu, J.; Singh, A.K.; Lin, C.T. Using virtual global landmark to improve incidental spatial learning. Sci. Rep. 2022, 12, 6744. [Google Scholar] [CrossRef]
- Duckham, M.; Kulik, L. “Simplest” Paths: Automated Route Selection for Navigation. In Proceedings of the Spatial Information Theory, Foundations of Geographic Information Science, Ittingen, Switzerland, 24–28 September 2003; Kuhn, W., Worboys, M.F., Timpf, S., Eds.; Springer: Berlin/Heidelberg, Germany, 2003; pp. 169–185. [Google Scholar]
- Hochmair, H.; Frank, A.U. Influence of estimation errors on wayfinding-decisions in unknown street networks—Analyzing the least-angle strategy. Spat. Cogn. Comput. 2000, 2, 283–313. [Google Scholar] [CrossRef]
- Robinson, S.; Jones, M.; Eslambolchilar, P.; Murray-Smith, R.; Lindborg, M. “I Did It My Way”: Moving Away from the Tyranny of Turn-by-Turn Pedestrian Navigation. In Proceedings of the 12th International Conference on Human Computer Interaction with Mobile Devices and Services, Singapore, 11–14 September 2007; Association for Computing Machinery: New York, NY, USA, 2010; pp. 341–344. [Google Scholar] [CrossRef]
- Dobbelstein, D.; Henzler, P.; Rukzio, E. Unconstrained Pedestrian Navigation Based on Vibro-Tactile Feedback around the Wristband of a Smartwatch. In Proceedings of the 2016 CHI Conference Extended Abstracts on Human Factors in Computing Systems, San Jose, CA, USA, 7–12 May 2016; Association for Computing Machinery: New York, NY, USA, 2016; pp. 2439–2445. [Google Scholar] [CrossRef]
- Savino, G.L.; Meyer, L.; Schade, E.E.S.; Tenbrink, T.; Schöning, J. Point Me In the Right Direction: Understanding User Behaviour with As-The-Crow-Flies Navigation. In Proceedings of the 22nd International Conference on Human–Computer Interaction with Mobile Devices and Services, Oldenburg, Germany, 5–8 October 2020; Association for Computing Machinery: New York, NY, USA, 2020; pp. 1–11. [Google Scholar] [CrossRef]
- Clemenson, G.D.; Maselli, A.; Fiannaca, A.J.; Miller, A.; Gonzalez-Franco, M. Rethinking GPS navigation: Creating cognitive maps through auditory clues. Sci. Rep. 2021, 11, 7764. [Google Scholar] [CrossRef]
- Albrecht, R.; Väänänen, R.; Lokki, T. Guided by music: Pedestrian and cyclist navigation with route and beacon guidance. Pers. Ubiquitous Comput. 2016, 20, 121–145. [Google Scholar] [CrossRef]
- Huang, H.; Mathis, T.; Weibel, R. Choose your own route—Supporting pedestrian navigation without restricting the user to a predefined route. Cartogr. Geogr. Inf. Sci. 2022, 49, 95–114. [Google Scholar] [CrossRef]
- Krukar, J.; Münzer, S.; Lörch, L.; Anacta, V.J.; Fuest, S.; Schwering, A. Distinguishing Sketch Map Types: A Flexible Feature-Based Classification. In Proceedings of the Spatial Cognition XI, Tübingen, German, 5–8 September 2018; Creem-Regehr, S., Schöning, J., Klippel, A., Eds.; Springer International Publishing: Cham, Switzerland, 2018; pp. 279–292. [Google Scholar]
- Ishikawa, T.; Fujiwara, H.; Imai, O.; Okabe, A. Wayfinding with a GPS-based mobile navigation system: A comparison with maps and direct experience. J. Environ. Psychol. 2008, 28, 74–82. [Google Scholar] [CrossRef]
- Laugwitz, B.; Held, T.; Schrepp, M. Construction and Evaluation of a User Experience Questionnaire. In Proceedings of the HCI and Usability for Education and Work, Graz, Austria, 20–21 November 2008; Holzinger, A., Ed.; Springer: Berlin/Heidelberg, Germany, 2008; pp. 63–76. [Google Scholar]
- Hart, S.G.; Staveland, L.E. Development of NASA-TLX (Task Load Index): Results of Empirical and Theoretical Research. In Human Mental Workload; Hancock, P.A., Meshkati, N., Eds.; North-Holland: Amsterdam, The Netherlands, 1988; Volume 52, pp. 139–183. Available online: https://www.sciencedirect.com/science/article/abs/pii/S0166411508623869 (accessed on 16 January 2023). [CrossRef]
- Brooke, J. SUS—A Quick and Dirty Usability Scale. Usability Eval. Ind. 1996, 189, 4–7. [Google Scholar]
- Fogliaroni, P.; Bucher, D.; Jankovic, N.; Giannopoulos, I. Intersections of Our World. In Proceedings of the 10th International Conference on Geographic Information Science (GIScience 2018), Melbourne, Australia, 28–31 August 2018; Winter, S., Griffin, A., Sester, M., Eds.; Schloss Dagstuhl–Leibniz-Zentrum fuer Informatik: Dagstuhl, Germany, 2018; Volume 114, pp. 3:1–3:15. [Google Scholar] [CrossRef]
- Mazurkiewicz, B.; Kattenbeck, M.; Giannopoulos, I. Rethinking Route Choices! On the Importance of Route Selection in Wayfinding Experiments. In Proceedings of the 15th International Conference on Spatial Information Theory (COSIT 2022), Kobe, Japan, 5–9 September 2022; Ishikawa, T., Fabrikant, S.I., Winter, S., Eds.; Schloss Dagstuhl—Leibniz-Zentrum für Informatik: Dagstuhl, Germany, 2022; Volume 240, pp. 6:1–6:13. [Google Scholar] [CrossRef]
- Rousell, A.; Zipf, A. Towards a Landmark-Based Pedestrian Navigation Service Using OSM Data. ISPRS Int. J. Geo. Inf. 2017, 6, 64. [Google Scholar] [CrossRef]
- Yesiltepe, D.; Conroy Dalton, R.; Ozbil Torun, A. Landmarks in wayfinding: A review of the existing literature. Cogn. Process. 2021, 22, 369–410. [Google Scholar] [CrossRef]
- Münzer, S.; Hölscher, C. Entwicklung und Validierung eines Fragebogens zu räumlichen Strategien. Diagnostica 2011, 57, 111–125. [Google Scholar] [CrossRef]
- Hegarty, M.; Richardson, A.E.; Montello, D.R.; Lovelace, K.; Subbiah, I. Development of a self-report measure of environmental spatial ability. Intelligence 2002, 30, 425–447. [Google Scholar] [CrossRef]
- Rammstedt, B.; John, O.P. Measuring personality in one minute or less: A 10-item short version of the Big Five Inventory in English and German. J. Res. Personal. 2007, 41, 203–212. [Google Scholar] [CrossRef]
- Auger, S.D.; Mullally, S.L.; Maguire, E.A. Retrosplenial Cortex Codes for Permanent Landmarks. PLoS ONE 2012, 7, e0043620. [Google Scholar] [CrossRef]
- Roy, C.; Wiebusch, D.; Botsch, M.; Ernst, M.O. Did it move? Humans use spatio-temporal landmark permanency efficiently for navigation. J. Exp. Psychol. Gen. 2022. [Google Scholar] [CrossRef] [PubMed]
- QGIS Development Team. QGIS Geographic Information System. QGIS Association, 2022. Available online: https://qgis.org/en/site/getinvolved/faq/index.html (accessed on 16 January 2023).
- Ishikawa, T. Individual differences and skill training in cognitive mapping: How and why people differ. Top. Cogn. Sci. 2022, 15. [Google Scholar] [CrossRef] [PubMed]
- Ishikawa, T. Spatial thinking, cognitive mapping, and spatial awareness. Cogn. Process. 2021, 22, 89–96. [Google Scholar] [CrossRef]
- Wickham, H.; François, R.; Henry, L.; Müller, K. dplyr: A Grammar of Data Manipulation. R Package Version 1.0.9. 2022. Available online: https://CRAN.R-project.org/package=dplyr (accessed on 16 January 2023).
- Wickham, H. stringr: Simple, Consistent Wrappers for Common String Operations. R Package Version 1.4.0. 2019. Available online: https://cran.r-project.org/web/packages/stringr/index.html (accessed on 16 January 2023).
- Hothorn, T.; Hornik, K.; van de Wiel, M.A.; Zeileis, A. Implementing a class of permutation tests: The coin package. J. Stat. Softw. 2008, 28, 1–23. [Google Scholar] [CrossRef]
- Wickham, H.; Henry, L. tidyr: Easily Tidy Data with ‘Spread()’ and ‘Gather()’ Functions. R Package Version 1.2.0. 2022. Available online: https://CRAN.R-project.org/package=tidyr (accessed on 16 January 2023).
- Urbanek, S. Cairo: R Graphics Device Using Cairo Graphics Library for Creating High-Quality Bitmap (PNG, JPEG, TIFF), Vector (PDF, SVG, PostScript) and Display (X11 and Win32) Output. R Package Version 1.6.0. 2019. Available online: https://cran.r-project.org/web/packages/Cairo/index.html (accessed on 16 January 2023).
- Wickham, H. ggplot2: Elegant Graphics for Data Analysis; Springer: New York, NY, USA, 2016. [Google Scholar]
- Van der Loo, M. stringdist: Approximate String Matching, Fuzzy Text Search, and String Distance Functions. R Package Version 0.9.8. 2021. Available online: https://cran.r-project.org/web/packages/stringdist/index.html (accessed on 16 January 2023).
- Toohey, K. SimilarityMeasures: Trajectory Similarity Measures R Package Version 1.4. 2015. Available online: https://cran.r-project.org/web/packages/SimilarityMeasures/index.html (accessed on 16 January 2023).
- Mouselimis, L. geojsonR: A GeoJson Processing Toolkit. R Package Version 1.1.0. 2021. Available online: https://cran.r-project.org/web/packages/geojsonR/index.html (accessed on 16 January 2023).
- Carbon, C.C.; Pastukhov, A. BiDimRegression: Calculates the Bidimensional Regression Between Two 2D Configurations. R Package Version 2.1.0. 2022. Available online: https://cran.r-project.org/web/packages/BiDimRegression/index.html (accessed on 16 January 2023).
- Holm, S. A Simple Sequentially Rejective Multiple Test Procedure. Scand. J. Stat. 1979, 6, 65–70. [Google Scholar]
- Pillac, V.; Gueret, C.; Medaglia, A. Route Consistency Vehicle Routing: A Bi-Objective Approach. In Proceedings of the ROADEF 2012. Available online: https://hal.science/hal-00674440/ (accessed on 16 January 2023).
- Su, H.; Liu, S.; Zheng, B.; Zhou, X.; Zheng, K. A survey of trajectory distance measures and performance evaluation. VLDB J. 2020, 29, 3–32. [Google Scholar] [CrossRef]
- Toohey, K.; Duckham, M. Trajectory Similarity Measures. SIGSPATIAL Spec. 2015, 7, 43–50. [Google Scholar] [CrossRef]
- Tao, Y.; Both, A.; Silveira, R.I.; Buchin, K.; Sijben, S.; Purves, R.S.; Laube, P.; Peng, D.; Toohey, K.; Duckham, M. A comparative analysis of trajectory similarity measures. GISci. Remote Sens. 2021, 58, 643–669. [Google Scholar] [CrossRef]
- Tobler, W.R. Bidimensional Regression. Geogr. Anal. 1994, 26, 187–212. [Google Scholar] [CrossRef]
- Carbon, C.C. BiDimRegression: Bidimensional Regression Modeling Using R. J. Stat. Softw. Code Snippets 2013, 52, 1–11. [Google Scholar] [CrossRef]
- Friedman, A.; Kohler, B. Bidimensional Regression: Assessing the Configural Similarity and Accuracy of Cognitive Maps and Other Two-Dimensional Data Sets. Psychol. Methods 2003, 8, 468–491. [Google Scholar] [CrossRef] [PubMed]
- Nakaya, T. Statistical Inferences in Bidimensional Regression Models. Geogr. Anal. 1997, 29, 169–186. [Google Scholar] [CrossRef]
- Quintero, M.; LeBoulluec, A. Missing data imputation for ordinal data. Int. J. Comput. Appl. 2018, 181, 10–16. [Google Scholar] [CrossRef]
- Sauro, J.; Lewis, J.R. Quantifying the User Experience: Practical Statistics for User Research, 1st ed.; Elsevier/Morgan Kaufmann: Waltham, MA, USA, 2012. [Google Scholar]
- Schrepp, M.; Hinderks, A.; Thomaschewski, J. User Experience Questionnaire; Springer: Berlin/Heidelberg, Germany, 2022. [Google Scholar]
- Brügger, A.; Richter, K.F.; Fabrikant, S.I. Which egocentric direction suffers from visual attention during aided wayfinding? In Proceedings of the Eye Tracking for Spatial Research, Proceedings of the 3rd International Workshop, Switzerland, Zurich, 29–31 August 2012; Kiefer, P., Giannopoulos, I., Göbel, F., Raubal, M., Duchowski, A.T., Eds.; ETH Zurich: Zurich, Switzerland, 2018. [Google Scholar] [CrossRef]
- Parush, A.; Ahuvia, S.; Erev, I. Degradation in Spatial Knowledge Acquisition When Using Automatic Navigation Systems. In Proceedings of the Spatial Information Theory, Scarborough, UK, 2–6 September 2013; Winter, S., Duckham, M., Kulik, L., Kuipers, B., Eds.; Springer: Berlin/Heidelberg, Germany, 2007; pp. 238–254. [Google Scholar]
- May, A.J.; Ross, T.; Bayer, S.H.; Tarkiainen, M.J. Pedestrian navigation aids: Information requirements and design implications. Pers. Ubiquitous Comput. 2003, 7, 331–338. [Google Scholar] [CrossRef]
- Giannopoulos, I.; Kiefer, P.; Raubal, M.; Richter, K.F.; Thrash, T. Wayfinding decision situations: A conceptual model and evaluation. In Proceedings of the International Conference on Geographic Information Science, Montreal, QC, Canada, 27–30 September 2016; Springer: Cham, Switzerland; Heidelberg, Germany; New York, NY, USA; Dordrecht, The Netherlands; London, UK, 2014; pp. 221–234. [Google Scholar]
- Guan, F.; Fang, Z.; Wang, L.; Zhang, X.; Zhong, H.; Huang, H. Modelling people’s perceived scene complexity of real-world environments using street-view panoramas and open geodata. ISPRS J. Photogramm. Remote Sens. 2022, 186, 315–331. [Google Scholar] [CrossRef]
- Trapsilawati, F.; Wijayanto, T.; Jourdy, E.S. Human–computer trust in navigation systems: Google maps vs. Waze. Commun. Sci. Technol. 2019, 4, 38–43. [Google Scholar] [CrossRef]
- Fang, Z.; Li, Q.; Shaw, S.L. What about people in pedestrian navigation? Geo-Spat. Inf. Sci. 2015, 18, 135–150. [Google Scholar] [CrossRef]
- Singh, A.K.; Liu, J.; Tirado Cortes, C.A.; Lin, C.T. Virtual Global Landmark: An Augmented Reality Technique to Improve Spatial Navigation Learning; Association for Computing Machinery: New York, NY, USA, 2021. [Google Scholar] [CrossRef]
- Fogliaroni, P.; Mazurkiewicz, B.; Kattenbeck, M.; Giannopoulos, I. Geographic-Aware Augmented Reality for VGI. Adv. Cartogr. Gisci. ICA 2019, 2, 3. [Google Scholar] [CrossRef]
- Gramann, K.; Hoepner, P.; Karrer–Gauss, K. Modified Navigation Instructions for Spatial Navigation Assistance Systems Lead to Incidental Spatial Learning. Front. Psychol. 2017, 8. [Google Scholar] [CrossRef]
- Klippel, A.; Tappe, H.; Habel, C. Pictorial Representations of Routes: Chunking Route Segments during Comprehension. In Proceedings of the Spatial Cognition III; Freksa, C., Brauer, W., Habel, C., Wender, K.F., Eds.; Springer: Berlin/Heidelberg, Germany, 2003; pp. 11–33. [Google Scholar] [CrossRef]
- Lan, J.; Lu, W.; Sun, P. Effect of the Street Environment on Walking Behavior: A Case Study Using the Route Choice Model in the Chunliu Community of Dalian. Front. Public Health 2022, 10, 874788. [Google Scholar] [CrossRef]


Disclaimer/Publisher’s Note: The statements, opinions and data contained in all publications are solely those of the individual author(s) and contributor(s) and not of MDPI and/or the editor(s). MDPI and/or the editor(s) disclaim responsibility for any injury to people or property resulting from any ideas, methods, instructions or products referred to in the content. |
© 2023 by the authors. Licensee MDPI, Basel, Switzerland. This article is an open access article distributed under the terms and conditions of the Creative Commons Attribution (CC BY) license (https://creativecommons.org/licenses/by/4.0/).