Article

Risk Assessment of Landslide Collapse Disasters along National Highways Based on Information Quantity and Random Forest Coupling Methods: A Case Study of the G331 National Highway

1
School of Jilin Emergency Management, Changchun Institute of Technology, Changchun 130012, China
2
School of Environment, Northeast Normal University, Changchun 130117, China
*
Author to whom correspondence should be addressed.
ISPRS Int. J. Geo-Inf. 2023, 12(12), 493; https://doi.org/10.3390/ijgi12120493
Submission received: 28 June 2023 / Revised: 29 November 2023 / Accepted: 4 December 2023 / Published: 6 December 2023
(This article belongs to the Topic Geotechnics for Hazard Mitigation)

Abstract

:
Based on the data from two field surveys in 2015 and 2022, this paper calculates the weight of values using the entropy weight method and the variation coefficient method, and evaluates risk using the information quantity method. The information quantities of four levels of criteria (hazards, exposure, vulnerability, emergency responses, and capability of recovery) were extracted and inputted into a random forest model. After optimizing the hyperparameters of the random forest using GridSearchCV, the risk assessment was performed again. Finally, the accuracy of the two evaluation results was verified using an ROC curve, and the model with the higher AUC value was selected to create a risk map. Compared with previous studies, this paper considers the factors of emergency responses and recovery capability, which makes the risk assessment more comprehensive. Our findings show that the evaluation results based on the coupling model are more accurate than the evaluation results of the information method, as the coupling model had an AUC value of 0.9329. After considering the indices of emergency responses and capability of recovery, the risk level of the highest-risk area in the study area decreased.

1. Introduction

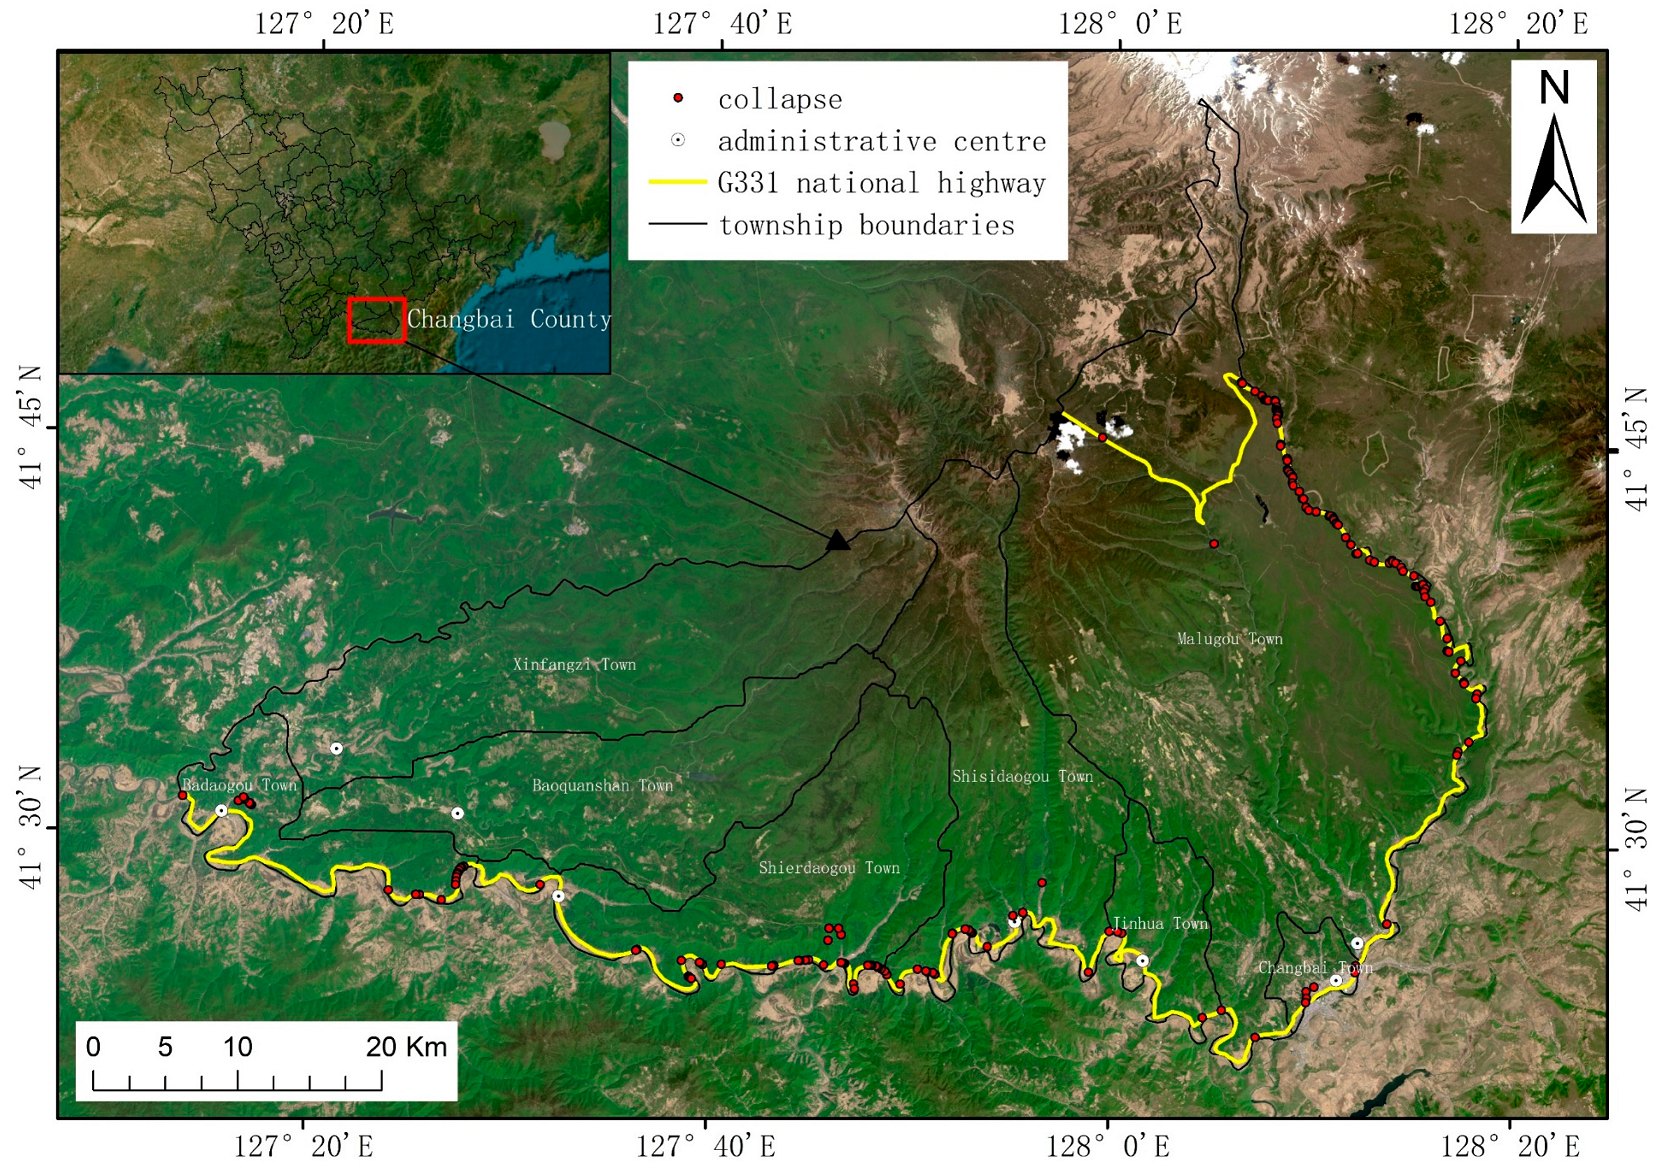
The G331 national highway is located in Changbai Korean Autonomous County, Baishan City, Jilin Province, China (hereinafter referred to as Changbai County). It is close to the border between China and Korea; therefore, it is in an important strategic position and has a profound impact on China’s geopolitical security [1]. The G331 national highway is a tourist route that leads to the Changbai Mountain scenic spot, and this attracts a large number of tourists and vehicles throughout the year. As other roads are far from the border, the special geographical location of the G331 national highway determines that its existence holds significant importance regarding national defense. The existence of this solution has resolved the geographical obstacles hindering the transportation of combat-ready materials by the Chinese army and improved the speed of responses to border emergencies.
The geological disasters along the G331 national highway in Changbai County are frequently influenced by human engineering activities. Among these activities, collapse disasters, also known as landslide disasters, are the most severe [2]. Collapse is a kind of geological phenomenon that the rock and soil mass on the steep slope is separated from the parent rock and accumulated at the foot of the slope under the action of gravity. Roads are an important type of infrastructure for economic development. The destruction of roads caused by collapses or landslides will affect the economic development of Changbai County. It also causes loss of life and property for tourists and residents [3]. The lack of information on the risks associated with collapse disasters and a reliable basis for decision-making hinders work on prevention and control in this study area. Prevention and control work is often carried out blindly and lacks focus, making it impossible to effectively utilize funds for disaster prevention and mitigation. The safety of local people’s lives and property is difficult to guarantee, and meeting the needs of economic development is challenging.
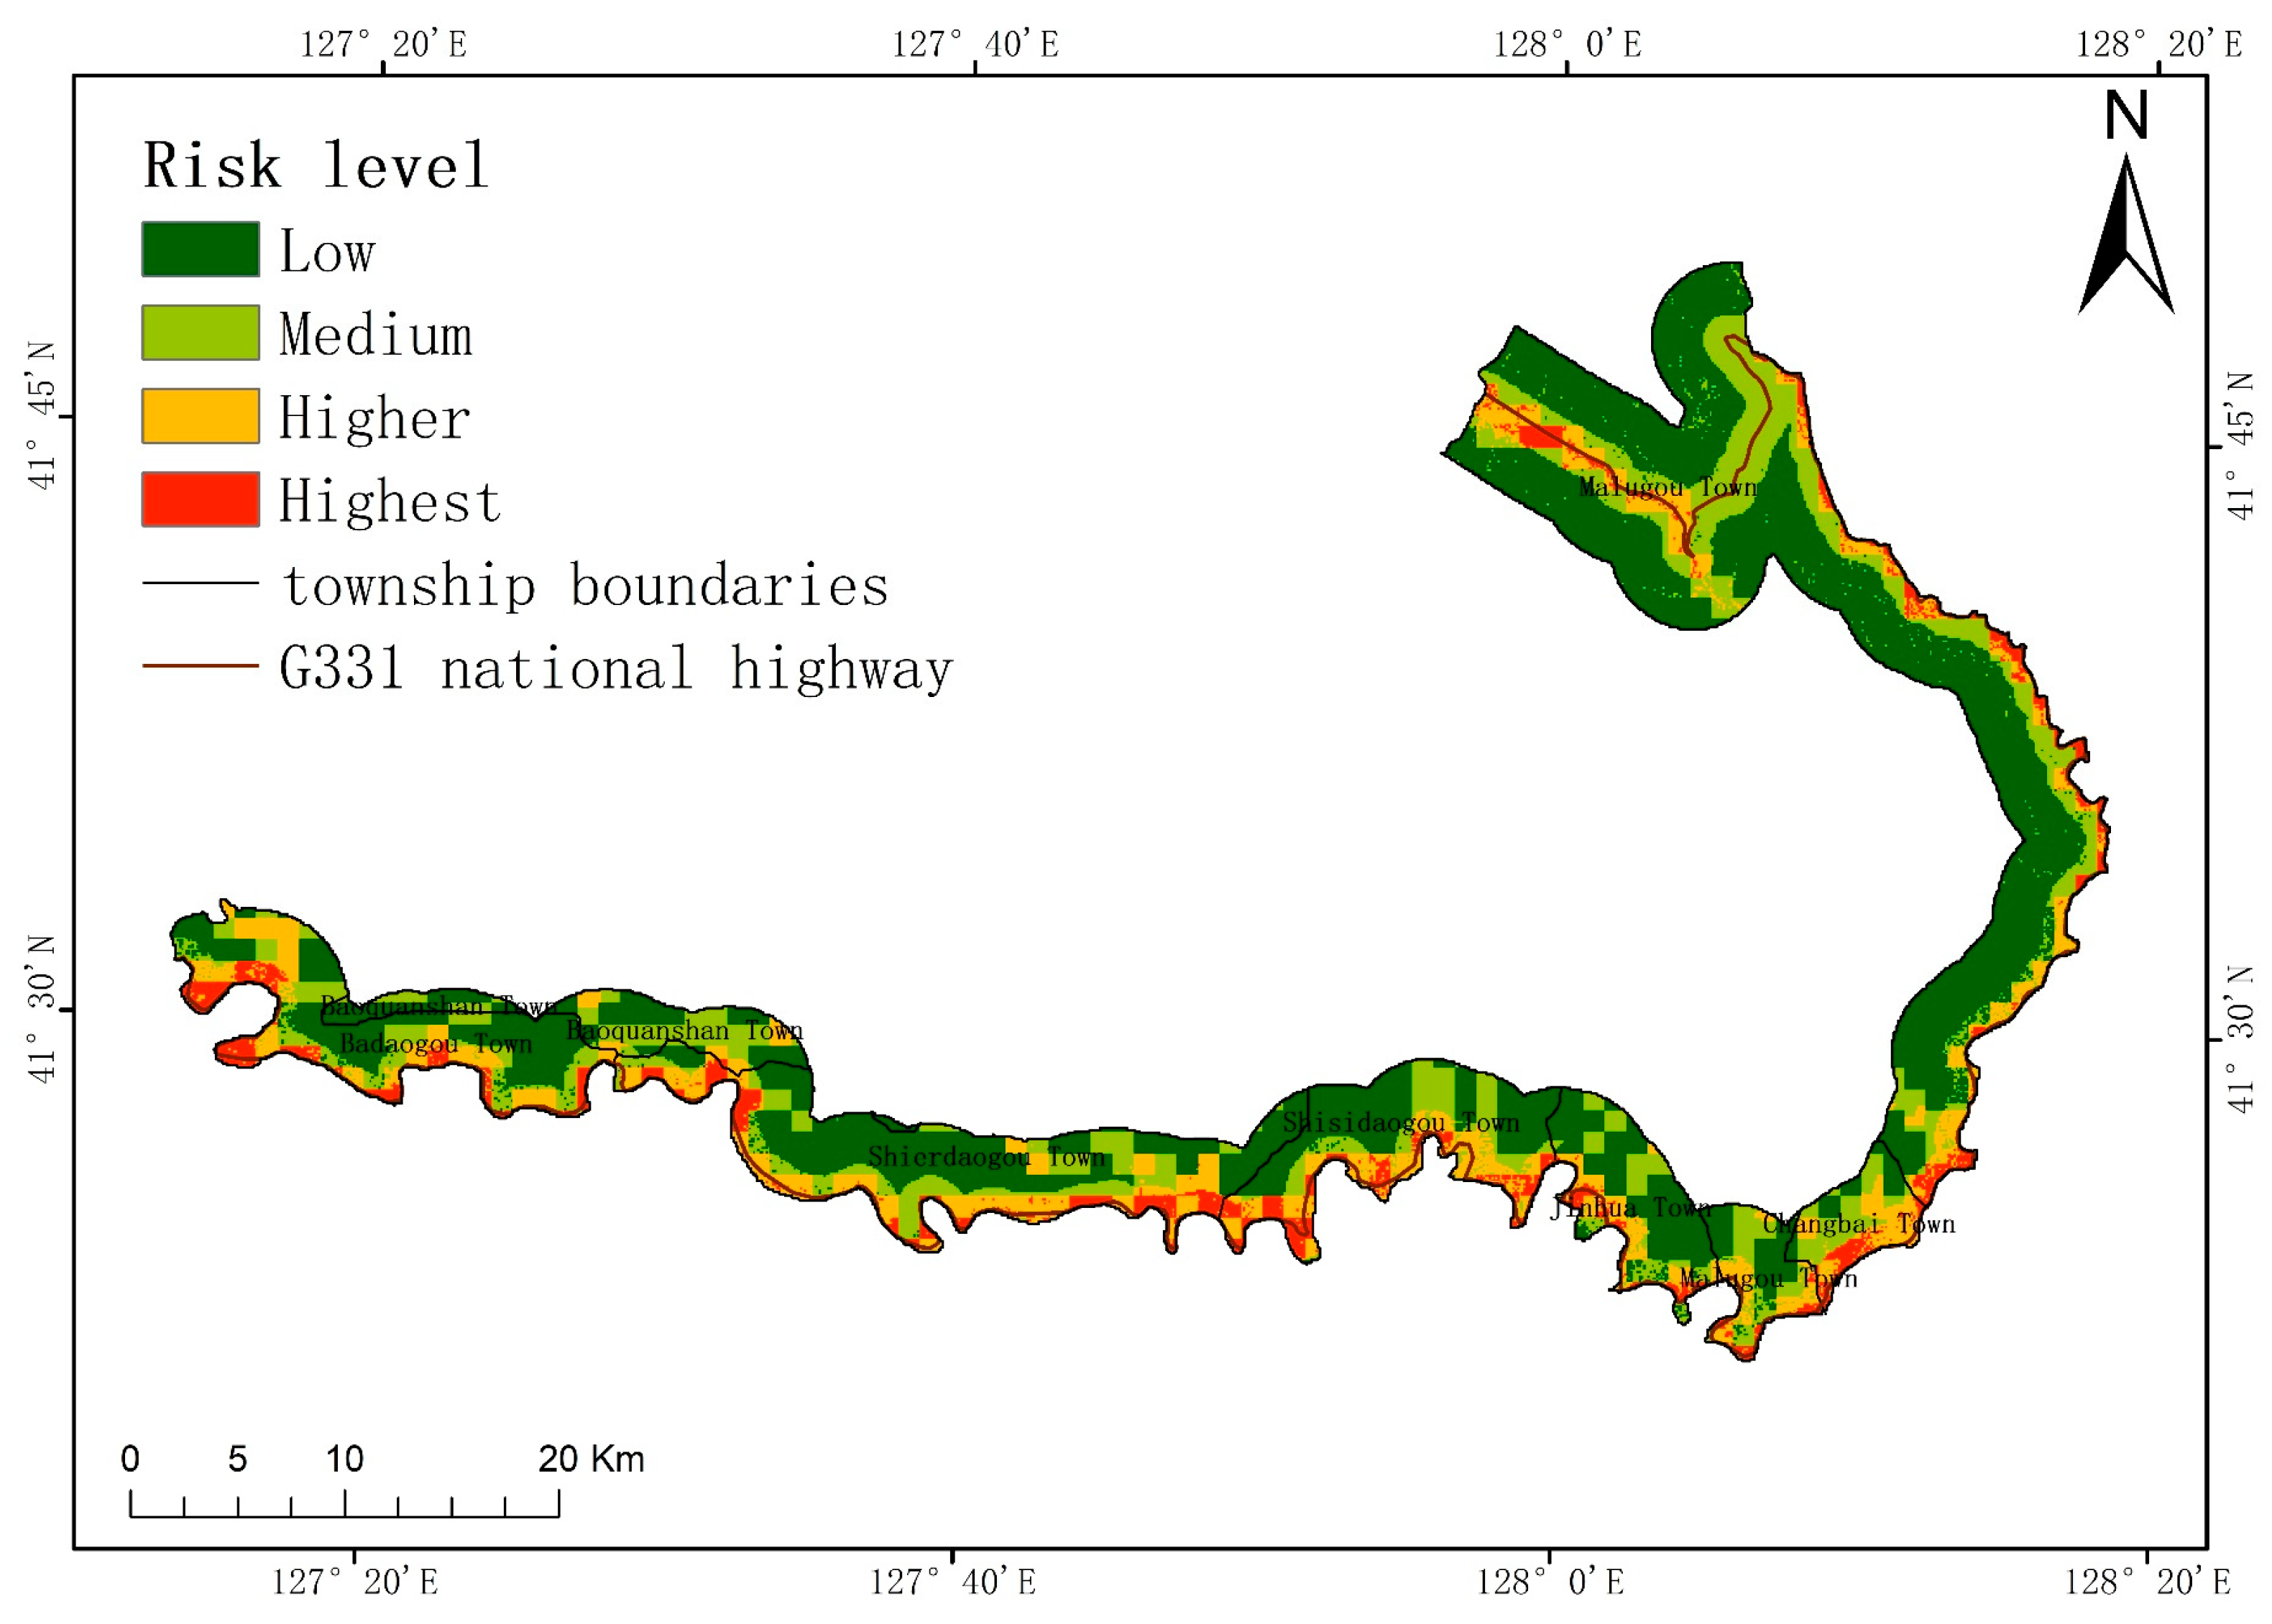
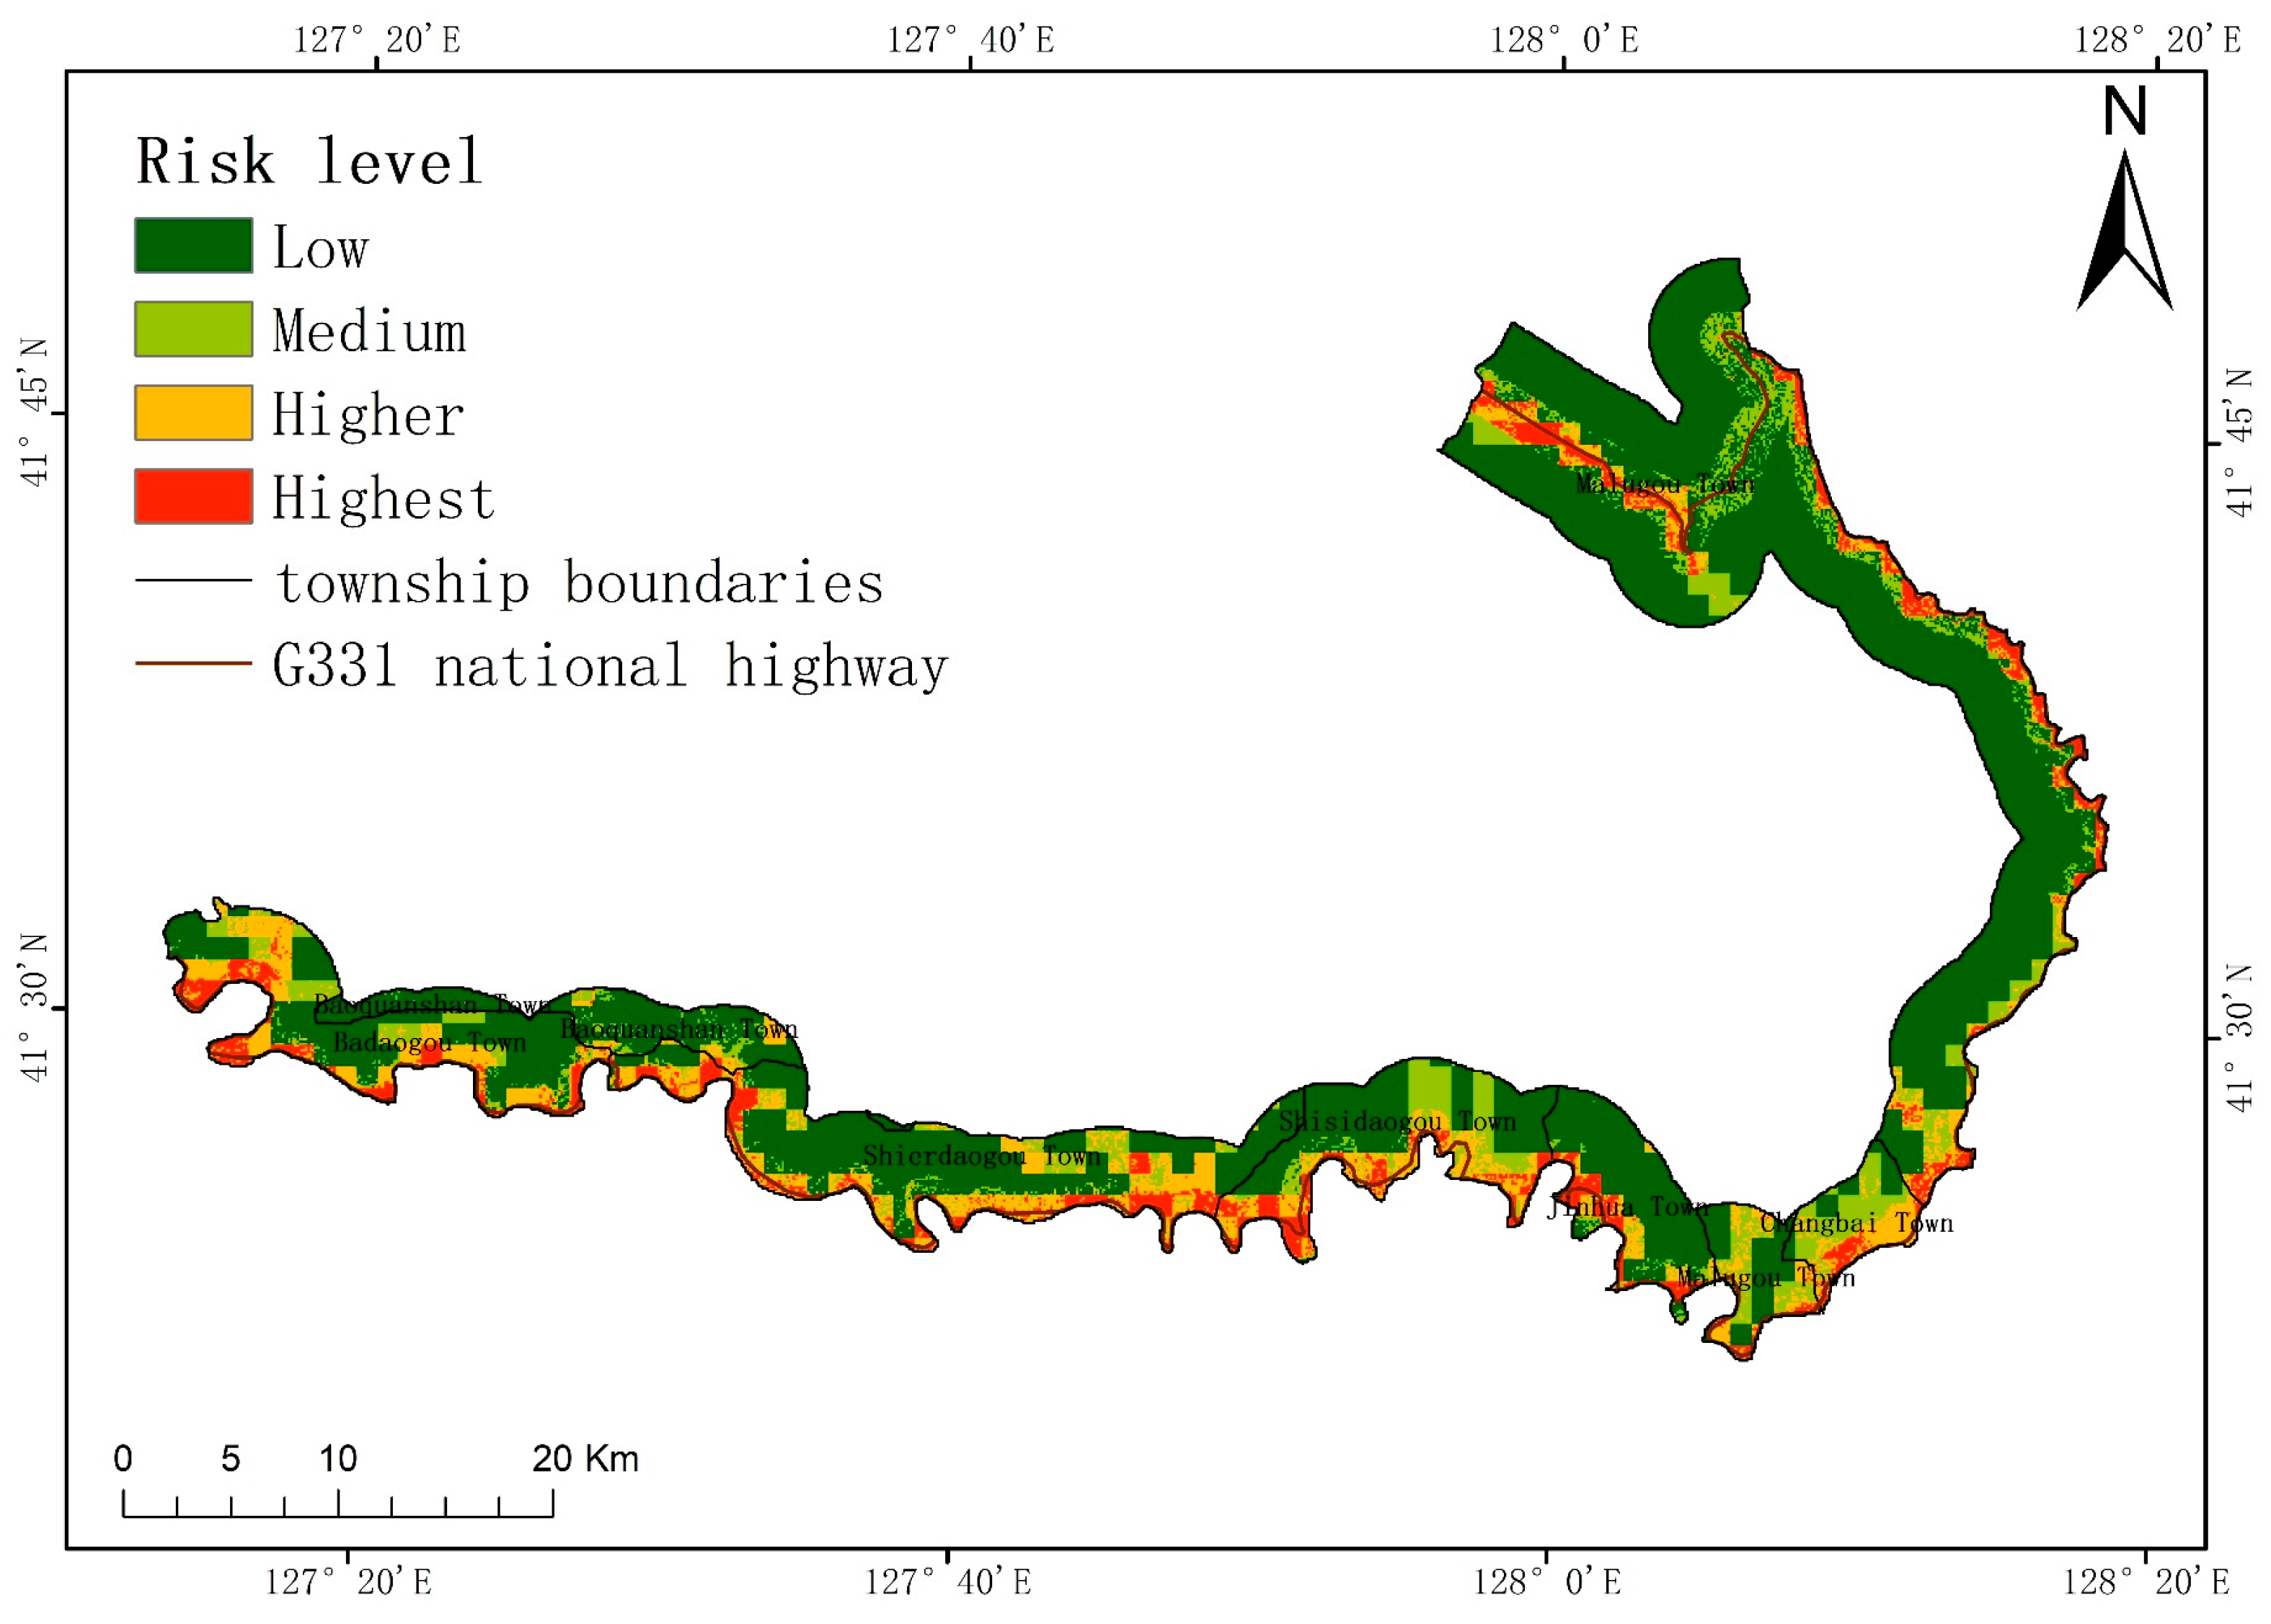
In this paper, a coupling model is used to quantify the risk of collapse in the study area and create a collapse risk map. This provides a reliable foundation for the Changbai County government to develop a plan for preventing collapse disasters and implement an early warning system for such disasters. While minimizing economic investment in disaster prevention and mitigation, it can also achieve a better protection effect and reduce economic losses. The study area currently faces the problem of blind and non-targeted prevention and control strategies for its collapse disasters. Improving these strategies can enable defense work to proceed smoothly and effectively, and protect the safety of people’s lives and property in order to meet the economic development needs of Changbai County.
Existing collapse risk research methods mainly include qualitative methods and quantitative methods [4]. The qualitative research method involves experts selecting the influencing factors of geological disasters based on their experience and evaluating the impact of these factors on the occurrence of geological disasters. This research method is often considered more subjective [5]. For example, the analytic hierarchy process [6], expert evaluation method [7], and fuzzy set integration method [8] are common qualitative research methods. The quantitative research method establishes a mathematical relationship between geological disasters and indicators using specific data, resulting in findings with a relatively high accuracy [9]. However, this research method is easily affected by the challenges of data collection, and the efficiency of data collection will impact the research progress [10]. Common quantitative research methods include the information quantity method [11], the logistic regression method [12], the frequency ratio method [13], the weight of evidence method [14], and so on. The information quantity method can identify the optimal combination of influencing factors that contribute significantly to the occurrence of collapse disasters in order to achieve an effective risk assessment of collapse disasters on roads [15,16,17]. With the rise of artificial intelligence, an increasing number of scholars have started utilizing machine learning models [18]. The most commonly used models are artificial neural networks [19], support vector machines [20], and random forest models [21]. Machine learning algorithms can be applied regardless of the dimension or type of data, making them widely applicable [22]. The random forest method combines the results of multiple classification trees. It effectively avoids the discontinuity of the predicted value in decision trees and reduces sensitivity to the training dataset so that the predicted value is smoother, thus preventing model overfitting and improving its stability [23,24,25].
Previous studies lack a uniform standard for assessing collapse disaster risks, and various scholars have different interpretations of the concept of a risk and what it entails. Gao [26] believes that a risk in this context refers to the potential loss of life, property, and economic activities resulting from geological disasters occurring in a specific area and at a specific time. Xiong [27] believes that the risk of geological disasters is a combination of geological and social attributes and is determined by sensitivity and vulnerability. Sui [28] believes that landslide risk is a measure used to describe the potential for slope damage to some extent; their research content includes hazard analyses, vulnerability analyses of the people affected by hazards, and risk zoning. Chang [
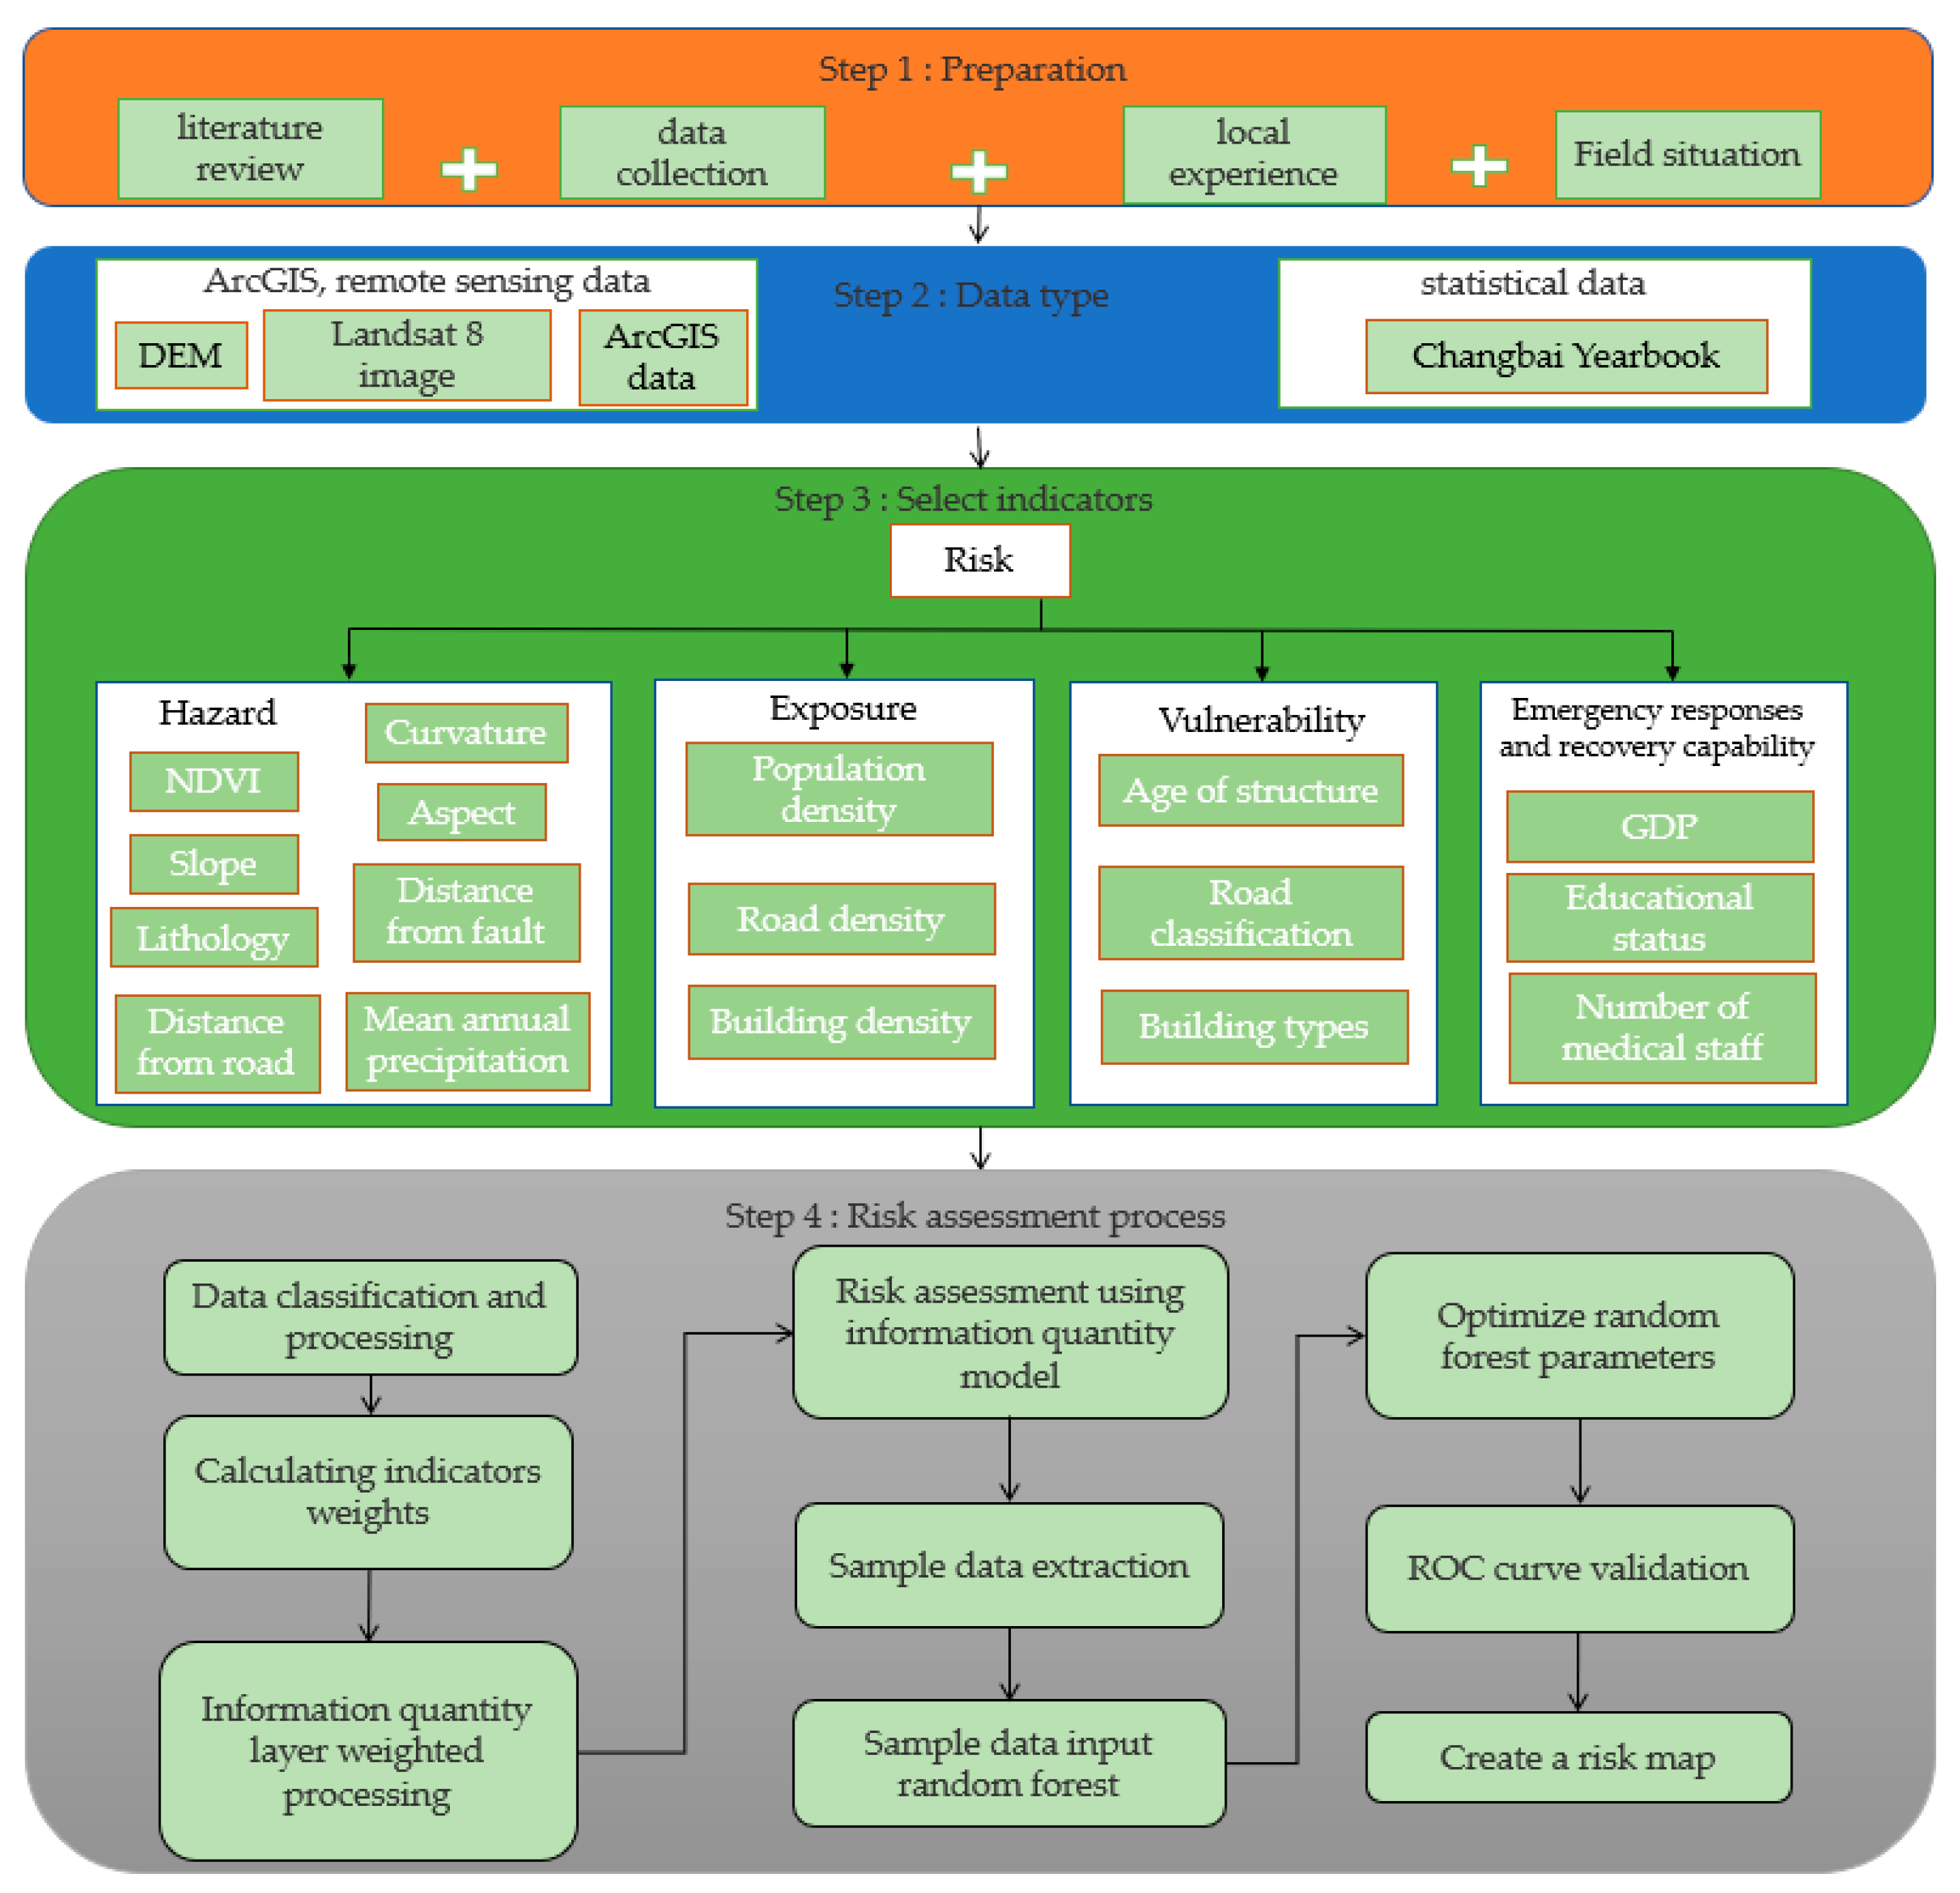
29] considered that risk is the product of hazards, vulnerability, and exposure, which can be expressed as a multiplication of these three factors. On the basis of hazards, vulnerability, and exposure, this study also considers emergency responses and recovery capabilities to ensure that the evaluation results are more scientific and standardized. In this paper, the research area is the G331 national highway in Changbai County. The information quantity method, random forest method, variation coefficient method, entropy weight method, and other methods are primarily employed to create a collapse risk map along the G331 national highway. This map will assist future decision-makers and establishes a theoretical foundation for disaster prevention in the studied area.

2. Study Area and Data Sources

2.1. Study Area

The G331 national highway is an extremely important border road that connects China’s northeast, China’s northwest, and Inner Mongolia. It provides important assistance for the economy and trade of these three regions. The total length of this road is 9301 km. In this paper, the G331 national highway in Changbai County is studied (Figure 1), and the collapse of its back slope is identified by analyzing the elevation contours of the surrounding region. A buffer zone of 3.5 km is set on both sides of the G331 national highway. Our study area excludes the collapse of the back slope, and the remaining area in the buffer zone that belongs to the DPRK is also excluded from the study area of this paper. Changbai County is located in the southeastern part of Jilin Province in China, at the southern foot of Changbai Mountain, on the right bank of the upper reaches of the Yalu River. To the west is Linjiang, to the north is Fusong County, and to the southeast it is bounded by the Yalu River, with the Republic of Korea on the other side of the river. Its geographical coordinates are 127°12′20″ E–128°18′10″ E, 41°21′41″ N–41°58′02″ N. It is 82.9 km long from east to west and 30 km wide from north to south, with a total area of 2497.6 km2. The surrounding region has a northern temperate continental humid monsoon climate. This climate is characterized by long, cold winters, short, rainy summers, and four distinct seasons.

2.2. Data Sources

In this paper, when consulting a large number of documents and considering the formation mechanism of collapse disasters and the related local conditions, eight indicators were used to assess the hazard. These indicators include the slope, aspect, curvature, NDVI, distance from the fault, lithology, mean annual precipitation, and distance from the road. For assessing exposure and vulnerability, factors such as data collectability, population density, road density, and building density were chosen as indicators. The age of the structure, highway classification, and building types were selected to indicate vulnerability. Through the official website of the Changbai County Government, one can fill out a form to apply for the provision of data and information on emergency responses and recovery capabilities, including GDP, educational status, and the number of medical staff. Table 1 shows the data source. Figure 2 depicts the workflow of the study.

3. Establishing an Evaluation Index System

In ArcGIS, after processing all of the collected data into a raster format, the raster data are resampled to a size of 30 m × 30 m for further use.

3.1. Hazard

The hazard level refers to the probability of a collapse disaster. Usually, the higher the hazard, the greater the risk. The slope measurement is a crucial factor that influences the stability of slopes, as collapses frequently happen on steeper slopes. These areas are more prone to collapse [30]. The aspect index reflects the light conditions and solar radiation of the slope. A sunny slope is more prone to collapse [31]. The curvature reflects the shape of the slope. The stability of a convex slope is low, and these are more prone to collapse [32]. The NDVI (Normalized Difference Vegetation Index) is used to characterize the soil and water conservation of regional geological disasters under varying vegetation conditions. Usually, an area with a smaller NDVI value is prone to collapse. The NDVI is measured according to Landsat 8 satellite data, which is produced via ENVI and imported into the ArcGIS platform [33]. The mean annual precipitation reflects the meteorological conditions of the study area. Areas with a higher mean annual precipitation often experience better vegetation development, which is not conducive to the occurrence of collapse [34]. The lithology and distance from the fault reflect how rock brittleness and geological conditions influence the occurrence and development of geological disasters in this area. The lithology is divided into three categories: soft rock, hard rock, and very hard rock. The hard rock area is more prone to collapse. The fault line data are analyzed in ArcGIS. The index data for the distance from the fault are calculated using the Euclidean distance tool. The closer an area is to the fault, the more susceptible it is to collapse [35]. The distance from the road reflects the impact of human engineering activities on a collapse. The closer an area is to the road, the more prone it is to collapse [36].
The spatial distribution of the hazard indicators is shown in Figure 3.

3.2. Exposure

The exposure refers to the affected area exposed to the disaster. The greater the exposure, the higher the risk. The higher the population density, the greater the loss in a collapse disaster, and thus the greater the exposure [37]. Road infrastructure plays a crucial role in the economic development of urban areas. However, it is also susceptible to collapse disasters. This is the main part of our risk assessment along the studied road. The higher the road density, the greater the exposure [38]. In this paper, the road density per square kilometer is calculated and then resampled to a 30 m grid data. On the basis of collecting point of interest (POI) data of Changbai County, ArcGIS was used to create a building density map of the study area. The grid size was 1 km, and the grid data needed to be resampled to 30 m for this study.
The spatial distribution of the exposure indicators is shown in Figure 4.

3.3. Vulnerability

Vulnerability refers to the extent of potential loss when the exposed area is affected by a disaster. The greater the vulnerability, the higher the risk. The percentage of people under the age of 14 and over the age of 60 was calculated for each township, and an age structure map was created using ArcGIS. People under the age of 14 and over the age of 60 are less capable of avoiding disasters compared to adults. As a result, they are more susceptible to injuries in collapse disasters and have a higher level of vulnerability. According to overall statistics on rural roads, it has been observed that the lower the road grade and technical standard, the more susceptible rural roads are to damage during disasters, compared to high-grade roads [39]. We measured the percentage of detached houses and bungalows in each township that are not surrounded by any other buildings. Based on the collection of POI data in Changbai County, this paper utilizes remote sensing images of the area to classify its buildings and create a map of building types in ArcGIS. Compared to multi-storey buildings, large hospitals, and shopping malls, houses and bungalows that stand alone and are not surrounded by other buildings are more prone to damage in collapse disasters [38].
The spatial distribution of the vulnerability indicators is shown in Figure 5.

3.4. Emergency Responses and Recovery Capability

The emergency responses and recovery capability indices reflect the ability of a region to respond to disasters and recover from them afterwards. Usually, the higher the emergency response capability and recovery capability, the smaller the risk. The GDP value reflects the ability of a region to recover after a disaster. A region with a higher GDP can recover faster after being affected by a disaster. A higher level of emergency responses and recovery capability can also be correlated with higher levels of education [40], as education can improve disaster awareness and knowledge. People can better cope with disasters when they are prepared for them; therefore, well-educated individuals have greater disaster response capabilities. This paper calculates the average number of years of education completed among each township’s population to assess the town’s educational status. The higher the educational status, the higher the level of emergency responses and recovery capability [38]. Moreover, hospitals’ rescue capabilities provide an important role in responding to disasters and post-disaster recovery. In areas with a higher number of medical staff, the ability to respond to disasters and recover from them is stronger, hence such areas have a higher level of emergency responses and recovery capability [40].
The spatial distribution of the emergency responses and recovery capability indicators is shown in Figure 6.

4. Research Methods

4.1. Risk Assessment Model Construction

The risk of a collapse disaster is calculated according to a combination of the hazard, exposure, and vulnerability factors. In this paper, the entropy weight method was used to calculate the weights of each criterion layer, while the variation coefficient method is used to calculate the weights of each index layer. The risk index model for a collapse disaster is established as follows [40]:
R i s k = H ω H × E ω E × V ω V × ( 1 R ) ω R
Y = i = 1 n μ i × I ( x i )
where Risk refers to the risk index of a collapse disaster; H, E, V, and R correspond to the hazard, exposure, vulnerability, and emergency responses and recovery capability indices of collapse disasters, respectively; ω H e  ω E , ω V , and ω R   represent the weight value of each factor; xi is the selected evaluation index; e represents the weight of the ith index; I(xi) represents the information quantity provided by the indicator layer xi on the occurrence of collapse; and Y represents the H, E, V, and R criterion layers.

4.2. Entropy Weight Method

The entropy weight method was used to quantify the level of uncertainty of environ-mental factors [41]. The principle of this method is to calculate the weight of each index based on the information provided by the collected data. Because this calculation process does not take into account the influence of the factors, its objectivity is strong [42]. In this paper, the entropy weight method was used to calculate the weights of each criterion layer. First, the probability density was calculated based on a frequency ratio analysis, as shown in Equation (3), where Pij is the FR value of each environmental factor, Sj represents the number of categories, and i and j represent the serial number and category of the environmental factors, respectively.
P i j = P i j j = 1 S j P i j
Secondly, the probability density Pij was substituted into Equation (4) to obtain the entropy value Hj for each parameter. The calculation formula for the information coefficient Ij is as follows in Equation (5).
H j = j = 1 S j P i j log 2 P i j
I j = log 2 S j H j log 2 S j , I = (0,1)
Finally, the final weight value ωj of each parameter was calculated by coupling the information coefficient Ij with the probability of collapse.

4.3. Variation Coefficient Method

The variation coefficient method was used to calculate the degree of change for each index based on statistical methods. It directly utilizes the information contained in each index to calculate the weight of the index, making it an objective weighting method [43]. This paper utilizes the variation coefficient method to calculate each indicator layer’s weight.
Firstly, the mean value of each index was calculated. Ai represents the mean value of the ith index, and rij represents the jth value of the ith index, as shown in Equation (6):
e = 1 n j = 1 n r i j
We calculated the coefficient of variation of each index as follows, where Si represents the standard deviation of the ith index, and Vi represents the coefficient of variation of the ith index:
S i = 1 n j = 1 n ( r i j A i ) 2
V i = S i A i
Finally, the weight of each index was obtained as follows, where e represents the weight of the ith index:
μ i = e

4.4. Information Quantity Method

After qualitatively classifying each evaluation index based on these data, the information quantity method can objectively reflect the relationship between each evaluation index and a collapse, avoiding the uncertainty caused by human subjective opinions [44]. In this study, the variation coefficient method was used to calculate the weight of each indicator layer in terms of evaluation index weight. The entropy weight method was used to calculate the weight of each criterion layer. Additionally, the information quantity of each index was weighted and superimposed to obtain the total information quantity.
The calculation formula for information quantity is shown in Equation (10):
I ( x i ) = ln P ( x i H ) P ( x i )
In this formula: xi is the selected evaluation index, I (xi) is the information quantity provided by xi at the collapse, P (xi|H) is the probability of xi under the condition of collapse distribution, and P (xi) is the probability of xi in the study area.
The above formula is a theoretical model, and is used in practical applications as follows (11):
I ( x i ) = ln N i / N S i / S
where S is the number of grids, N is the number of grids with collapses, Si is the number of grids with evaluation index xi, and Ni is the number of grids with collapses distributed in evaluation index xi.

4.5. Random Forest

A random forest is an algorithm proposed by Leo Breiman in 2001. It is an algorithm that integrates multiple decision trees through an ensemble learning technique known as ‘bagging’ [45]. The concept of bagging [46] involves feeding the samples into multiple weak classifiers and then aggregating the classification results through voting to create a strong classifier. Random forests synthesize the results of all classification trees and regression trees, effectively avoiding the discontinuity of the predicted value in decision trees and their sensitivity to the training dataset. This makes the predicted value smoother, prevents the model from overfitting, and improves its stability [47].
The bootstrap sampling method is used to randomly extract N training samples from the dataset. These N training samples form a training set, and the training set for each tree is unique. When the node is split, the decision tree will select M feature factors from M features and use the best features among these M feature factors for node splitting. Each decision tree will then vote independently. Finally, the voting results from all decision trees are integrated, and the category with the highest number of votes is determined as the final output.

4.6. GridSearchCV

In machine learning models, there are certain hyperparameters that require manual selection. If these hyperparameters are not selected properly, a machine learning model may suffer from overfitting or underfitting [48]. When running the GridSearchCV, the selection interval and step length are specified in advance. The search will select hyperparameters based on this specified interval and step length. These hyperparameters will be incorporated into the model for training and, ultimately, identify the optimal performance hyperparameters [49]. This research utilized GridSearchCV to fine-tune the random forest model and select the optimal set of hyperparameters in order to enhance the accuracy of the model.

5. Research Results

5.1. Information Quantity Method

The weight of each criterion layer was calculated using the entropy weight method, while the weight of each index layer was calculated using the variation coefficient method. These calculation results are shown in Table 2. Simultaneously, the collapse disaster data from 2015 were used to calculate each evaluation index using the information quantity method. The corresponding information quantity values for each evaluation index are shown in Table 3.
After calculating the value of each criterion layer using Formula (2), according to these values, hazard maps, exposure maps, and vulnerability maps were drawn in ArcGIS (Figure 7). Because the formation of the collapses in this area is mainly influenced by human engineering activities, the hazard level increases as one moves closer to the road (Figure 3h). The risk level in the town of Malugou is high, mainly due to the presence of hard rocks in this area and a low NDVI. The rocks in the towns of Badaogou and Shierdaogou are also hard, but the reason for their lower risk levels is that the NDVI values in these areas are higher (Figure 3d,g). The town of Changbai serves as the administrative center of Changbai County. It has the highest level of exposure, primarily due to the relatively large population density and building density of this town (Figure 4a,c). Other areas’ higher levels of exposure are primarily attributed to the construction of rural roads for traffic purposes. In Malugou Town, there is a large proportion of houses and bungalows that stand alone and are not surrounded by other buildings (Figure 5c). In the areas around Shisidaogou and Changbai, the percentage of low-grade highways is higher (Figure 5b), so the towns of Malugou, Shisidaogou, and Changbai have the highest vulnerability levels. The region with the highest emergency response and recovery capability also has a higher GDP level (Figure 6a). The educational status and the number of medical staff in the town of Changbai are at the highest level, so the emergency responses and recovery capability in Changbai is also at a higher level (Figure 6b,c). The emergency responses and recovery capability levels are low in other areas.
After calculating the value of each target layer using Formula (1), the accuracy of this value was verified via an ROC curve using collapse data surveyed in 2022. In the ArcGIS system, a 100 m × 100 m grid is generated, and the grid points are generated simultaneously. The total amount of information quantity finally calculated is based on the values extracted from the grid points, taking into account whether there is a collapse in the grid. The sample data are then formed through spatial connection. The same number of non-collapse samples and collapse samples were randomly extracted and inputted into SPSS 26.0 software. Finally, the AUC value was observed at 0.776; the ROC curve is shown in Figure 8. Table 4 contains the curve’s parameters.

5.2. Random Forest

The AUC value for the random forest method is higher. A risk map was generated using a random forest algorithm, and the information quantity value of each criterion layer in the research area was extracted and assigned to the point. The collapse data surveyed in 2022 were selected, and an equal number of non-collapse instances were randomly selected in the study area to form the sample data. Using Python, the sample data were allocated in a ratio of 7:3 and inputted into the random forest. A total of 70% of the data was used for training the model, while the remaining 30% was used for testing the model. The model was tested using the ROC curve. Its AUC value is 0.9213 (Figure 9a). Subsequently, the GridSearchCV function from the Sklearn package was utilized to optimize the hyperparameters of the random forest model. The search range, step size, and optimized values from the GridSearchCV function are shown in Table 5. First, it optimized the n_estimators. The AUC value for this model is 0.9327 (Figure 9b). Finally, it optimized the min_samples_split and min_samples_leaf. The AUC value for this model is 0.9329 (Figure 9c).

5.3. Risk Map

Based on the 100 m × 100 m grid, the necessary data for predictions are extracted. The optimized random forest model is then selected to predict the entire research area, and the prediction probabilities are derived. In ArcGIS, the derived table is linked to the original grid attribute table, and the natural breakpoint method is used to reclassify the probability value into four categories. This process generates a risk map for the entire research area (Figure 10).
Table 6 presents the statistics concerning collapse distribution in each risk area based on the collapse data from 2015. The collapses are more evenly distributed in the areas with the higher and highest risk levels, accounting for 86.62%. When the highest-risk area comprises only 8.57% of the total area, the number of collapses reaches 70.06%. The collapses are highly concentrated in the higher-risk area and the highest-risk area, indicating that the collapse risk assessment aligns with the actual field situation.
With the recent improvements on the economic level of Changbai County, the scale of various living, production, and engineering construction activities among residents has expanded unprecedentedly. Human activities have become a significant driving force be-hind changes in the geological environment and the occurrence of geological disasters in the surveyed area. The lack of foresight and disregard for scientific principles in human engineering activities has become the primary cause of geological disasters in this study area. This is due to a lack of coordination between engineering construction and the geo-logical environment. The human activities involved in the construction of the G331 national highway have resulted in frequent collapse disasters along the highway. Our risk map indicates that the highest-risk areas are predominantly situated on both sides of the G331 national highway. All townships exhibit a relatively high risk in proximity to both sides of the G331 national highway, whereas the risk is comparatively low in areas located far from the G331 national highway. However, the towns of Changbai, Badaogou, and Shierdaogou deviate slightly from this pattern. Changbai is the center of the county. From the population density map and building density map (Figure 4a,c), it can be observed that the majority of the buildings and population of this county are concentrated in this area. As a result, there are more medium-risk areas in this town compared to other towns. The slope along the G331 national highway through the town is gentle, and the lithology is soft (Figure 3a,g). Therefore, the risk along the G331 national highway in this town is higher still. Compared to other towns, the risk in the Badaogou Town and the north of Shierdaogou Townis higher. This is primarily due to the presence of rural roads that connect the villages in this region, as indicated by the road density map (Figure 4b). The increase in the amount of rural roads to hazard-affected areas leads to an increased risk in the northern parts of the two towns.
Figure 11 is a risk map that does not consider emergency responses and recovery capability. Table 7 similarly shows the area statistics for each risk level. It can be seen that the distribution of risk levels between these two is similar. However, after considering the emergency responses and recovery capability, a small number of low-risk areas were converted into medium-risk areas. The emergency response and recovery capability of these regions were at a low level. Also, a few of the highest-risk areas in the towns of Badaogou and Changbai were upgraded to higher-risk areas. The emergency responses and recovery capability of these transformed regions were at a high level (Figure 7d). On the whole, the areas with higher risk levels and the areas with the highest risk levels decreased. The proportion of higher-risk areas decreased by 2.65%, and the proportion of the highest-risk areas decreased by 2.01%.

6. Discussion

6.1. Comparison with Other Evaluation Methods

There are three main methods for assessing collapse risk. The first uses mathematical statistics. After collecting and processing data, this method establishes a probability model, analyzes the data using this model, calculates the probability distribution and risk value, and finally categorizes the risk level based on the risk value. Such methods have specific requirements regarding the data’s quality and sources. The second method is the scene simulation method [50,51]. After collecting data, this method establishes a three-dimensional model and simulates the scene of a collapse using simulation technology. Such methods typically require corresponding software, which can often be costly and will result in increased research expenses. And, due to data processing and model accuracy, the simulation results may not meet expectations. Such methods are frequently employed in small-scale risk assessments. The third category is the index system method [52,53]. This method selects indicators by referring to the research of other scholars and then establishes an index system. It calculates and evaluates each layer of indicators, and then integrate them according to specific methods or standards to determine various levels of risk. This method has a certain level of subjectivity in selecting indices and calculating weights, which can impact the evaluation results.
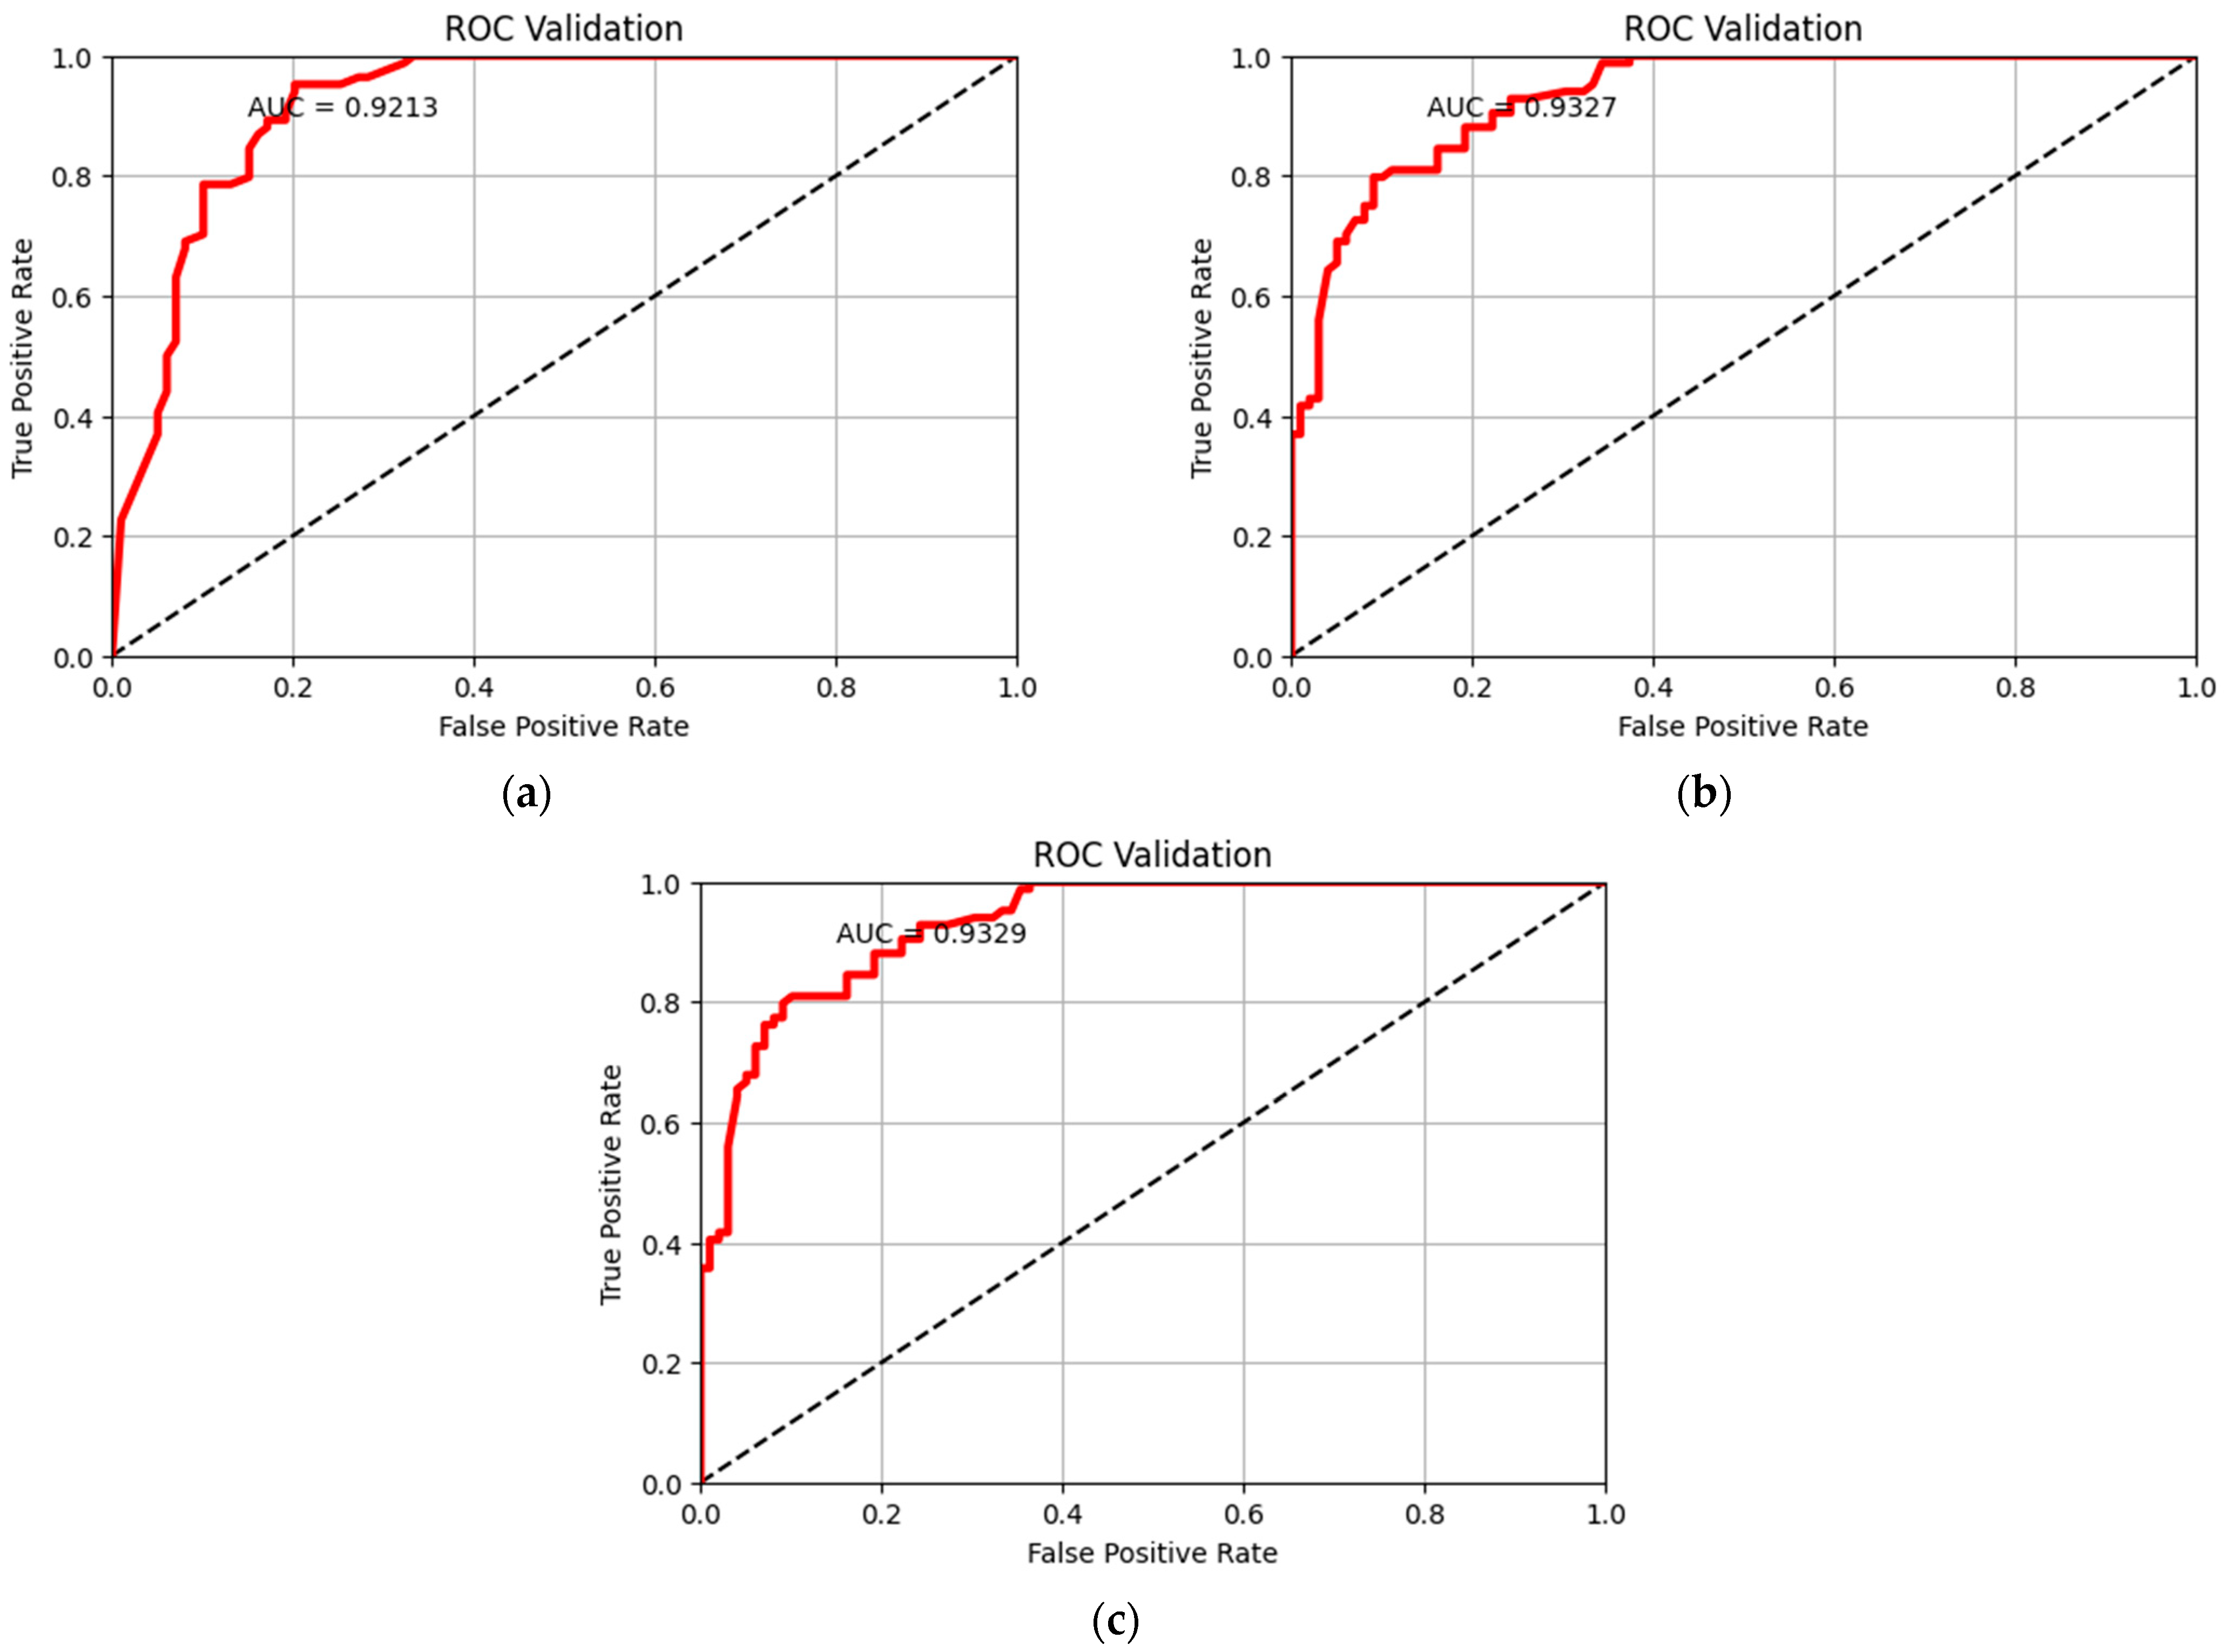
Based on the index system method, this study integrates remote sensing data, statis-tical data, and raster data to minimize the subjectivity in selecting indices. The subjectivity of the weight calculation was reduced via qualitative weight calculation method. Finally, a random forest model was optimized using GridSearchCV for our risk assessment. By using the autonomous learning and self-adjusting characteristics of machine learning, the possible subjectivity in this research was further weakened. After minimizing the subjectivity, a risk map was obtained.

6.2. Comparison with Others’ Studies

In previous studies, assessments of collapse risks have utilized various research methods, which vary depending on the research objectives and geographical locations. When conducting research on regional objects such as highways, railways, or historical relics, the index system and mathematical statistics methods are usually employed. When studying individual collapses, the scene simulation method is usually chosen. However, when selecting the index system method, various scholars have enhanced their approaches from different perspectives. In order to examine the relationship between landslides and the surrounding environment, Zhao utilized the spatial case-based reasoning method to assess the risk of landslides in Lushan County [39]. In order to eliminate the error of subjective weighting, Gao utilized a weight-based generalized objective function to evaluate vulnerability. This was combined with a Gaussian process classification model to assess hazard levels, and subsequently conduct a risk assessment [26]. Chang utilized the empirical model developed by Wischmeier to compute the intensity of rainfall for a hazard assessment. This approach allowed their study to examine the influence of rainfall on landslides. Subsequently, their risk assessment was conducted by considering three key factors: hazard, exposure, and vulnerability [29]. Sui studied a specific landslide at Shiyantan in Mayang County. They determined the threshold of landslide risk level in China using the ALARP method and discussed the acceptable range of risks to life and economic risk [30]. Karma Tempa evaluated the assets of the AH-48 highway using a system independently developed by Bhutan. He then assessed the risk of the AH-48 highway from three perspectives: asset value, threat value, and vulnerability value [54]. Zheng incorporated railway management into the evaluation system and assessed the risk of the Chengdu–Kunming railway using the analytic hierarchy process and triangular fuzzy number method [55]. In this study, the index system method was selected to collect remote sensing data, statistical data, and raster data. On the basis of hazard, exposure and vulnerability, emergency responses and recovery capability were also considered. The entropy weight method and the variation coefficient method were combined to eliminate subjective errors in our weight calculation process. Additionally, our random forest model’s hyperparameters were adjusted using GridSearchCV to generate a risk map. The model eliminated subjective errors from two aspects: multi-source data and combined weights. This optimized machine learning model was used to generate the risk map, resulting in more accurate evaluation results. In this study, the more commonly used natural breakpoint method was selected as the threshold. In future research, the risk level threshold should be determined using a more scientific method, as the risk map will consequently be more accurate. Or, by utilizing a deep learning model, the results could be made more accurate.

6.3. The Social Impact of Our Research Results

The research results reported here are beneficial for developing geological disaster prevention plans and implementing geological disaster warning projects in the study area. When formulating plans for geological disaster prevention and control, different measures can be developed based on different levels of risk. In areas with higher elevation, collapses are often more likely to occur, and there are often more disaster-exposed people in these regions. Greater manpower and material resources are needed when formulating prevention and control measures. In urban planning, it is important to avoid constructing buildings in areas with the higher and highest risk levels. This is to prevent reductions in the vegetation coverage and to minimize the probability of collapses. At the same time, this can also reduce the loss of economic assets and personal safety when collapses occur in these regions. When conducting emergency evacuations, it is important to ensure that the layout of emergency material warehouses and emergency corridors in higher and highest risk areas is more rational. When a collapse occurs, emergency materials can reach the affected areas more quickly, and the evacuation of affected people will be expedited. Shelters should also be constructed in areas with a low level of risk. These results are also applicable in other countries. However, it is necessary to consider the local natural environment and human factors when selecting data indicators; the corresponding local data should be selected.

6.4. Limitations

The study area is located on the Chinese border. When collecting data, it was necessary to aggregate statistics into larger units in order to accurately represent the variations in values. Some of the data grid units provided by the relevant departments are large. As a result, it was not possible to fully cover the entire research area.
Collecting data on vulnerability, emergency responses and recovery capability indicators was too difficult. This led to the selection of township-level units for producing data maps of criterion layers. This further affected the accuracy of our vulnerability and emergency responses and recovery capability maps. If these indicators used smaller statistical units, for example, statistical units within a community, the quality of evaluation would be improved.
The random forest program runs automatically. Once it starts running, there are too few parts that can be debugged manually. This model is more suitable for solving classification problems. Its effectiveness in solving regression problems is not as high as that in solving classification problems.

7. Conclusions

In order to quantify the risks along the G331 national highway, this paper presents an inventory of data on collapses in Changbai County in 2015 and 2022. Seventeen risk assessment indices for road collapse disasters have been selected, establishing a spatial database with multi-source data. A risk map of collapse disasters along the road was created by combining weight calculations with the random forest algorithm and the information quantity method.
(1)
The evaluation results obtained from the coupling model are more accurate compared to those obtained from the information quantity method, with an AUC value of 0.9329.
(2)
According to the results of the risk assessment, the highest and higher risk areas are mainly concentrated within a 1 km radius of the G331 national highway. The towns of Badaogou, Shierdaogou, and the northern part of Malugou town are at a higher risk. The risk levels are lower in other regions.
(3)
After considering the emergency response and recovery capability index, the risk levels in the higher- and highest-risk areas of the study area decreased. The proportion of higher risk areas decreased by 2.65%, and the proportion of the highest risk areas decreased by 2.01%.
In the future, additional research can be conducted using more comprehensive data. More detailed data on the natural environment and disaster-causing factor data should be collected to cover the study area located at the country’s edge. Regarding the vulnerability data and the emergency responses and recovery capability index, statistics should be collected with smaller units to refine these two sections of the map. This will result in a more refined final risk map.

Author Contributions

Investigation, Zengkai Pan; Data curation, Zuoquan Nie, Yanan Chen and Zengkai Pan; Writing—original draft, Zuoquan Nie; Writing—review & editing, Qiuling Lang, Yichen Zhang and Jiquan Zhang; Visualization, Zuoquan Nie; Supervision, Qiuling Lang, Yichen Zhang and Jiquan Zhang; Funding acquisition, Qiuling Lang. All authors have read and agreed to the published version of the manuscript.

Funding

This research received no external funding.

Data Availability Statement

Data are contained within the article.

Conflicts of Interest

The authors declare no conflict of interest.

References

  1. Nie, Z.; Lang, Q.; Zhang, Y. Hazard assessment of collapse along national highways based on information quantity model and geodetector. J. Catastrophology 2023, 38, 193–199. [Google Scholar]
  2. Qian, L.; Zang, S. Differentiation Rule and Driving Mechanisms of Collapse Disasters in Changbai County. Sustainability 2022, 14, 2074. [Google Scholar] [CrossRef]
  3. Li, Y.; Sheng, Y.; Chai, B.; Zhang, W.; Zhang, T.; Wang, J. Collapse susceptibility assessment using a support vector machine compared with back-propagation and radial basis function neural networks. Geomat. Nat. Hazards Risk 2020, 11, 510–534. [Google Scholar] [CrossRef]
  4. Zhao, H.; Yao, L.; Mei, G.; Liu, T.; Ning, Y. A fuzzy comprehensive evaluation method based on AHP and entropy for a landslide susceptibility map. Entropy 2017, 19, 396. [Google Scholar] [CrossRef]
  5. Panchal, S.; Shrivastava, A.K. Landslide hazard assessment using analytic hierarchy process (AHP): A case study of National Highway 5 in India. Ain Shams Eng. J. 2022, 13, 101626. [Google Scholar] [CrossRef]
  6. Skilodimou, H.D.; Bathrellos, G.D.; Chousianitis, K.; Youssef, A.M.; Pradhan, B. Multi-hazard assessment modeling via multi-criteria analysis and GIS: A case study. Environ. Earth. Sci. 2019, 78, 47. [Google Scholar] [CrossRef]
  7. Raghuvanshi, T.K.; Ibrahim, J.; Ayalew, D. Slope stability susceptibility evaluation parameter (SSEP) rating scheme—An approach for landslide hazard zonation. J. Afr. Earth Sci. 2014, 99, 595–612. [Google Scholar] [CrossRef]
  8. Meten, M.; Bhandary, N.P.; Yatabe, R. Application of GIS-based fuzzy logic and rock engineering system (RES) approaches for landslide susceptibility mapping in Selelkula area of the Lower Jema River Gorge, Central Ethiopia. Environ. Earth Sci. 2015, 74, 3395–3416. [Google Scholar] [CrossRef]
  9. Akgun, A.; Erkan, O. Landslide susceptibility mapping by geographical information system-based multivariate statistical and deterministic models: In an artificial reservoir area at Northern Turkey. Arab. J. Geo. Sci. 2016, 9, 165. [Google Scholar] [CrossRef]
  10. Seong, Y.; Choi, C.-K.; Jung, Y. Assessment of Uncertainty in Grid-Based Rainfall-Runoff Model Based on Formal and Informal Likelihood Measures. Water 2022, 14, 2210. [Google Scholar] [CrossRef]
  11. Alsabhan, A.H.; Singh, K.; Sharma, A.; Alam, S.; Pandey, D.D.; Rahman, S.A.S.; Khursheed, A.; Munshi, F.M. Landslide susceptibility assessment in the Himalayan range based along Kasauli—Parwanoo road corridor using weight of evidence, information value, and frequency ratio. J. King Saud Univ. Sci. 2022, 34, 101759. [Google Scholar] [CrossRef]
  12. Park, S.; Choi, C.; Kim, B.; Kim, J. Landslide susceptibility mapping using frequency ratio, analytic hierarchy process, logistic regression, and artificial neural network methods at the Inje area, Korea. Environ. Earth. Sci. 2013, 68, 1443–1464. [Google Scholar] [CrossRef]
  13. Gu, F.; Chen, J.; Sun, X.; Li, Y.; Zhang, Y.; Wang, Q. Comparison of Machine Learning and Traditional Statistical Methods in Debris Flow Susceptibility Assessment: A Case Study of Changping District, Beijing. Water 2023, 15, 705. [Google Scholar] [CrossRef]
  14. Batar, A.K.; Watanabe, T. Landslide Susceptibility Mapping and Assessment Using Geospatial Platforms and Weights of Evidence (WoE) Method in the Indian Himalayan Region: Recent Developments, Gaps, and Future Directions. ISPRS Int. J. Geo.-Inf. 2021, 10, 114. [Google Scholar] [CrossRef]
  15. Lin, J.; Chen, W.; Qi, X.; Hou, H. Risk assessment and its influencing factors analysis of geological hazards in typical mountain environment. J. Clean. Prod. 2021, 309, 127077. [Google Scholar] [CrossRef]
  16. Wang, J.; Zhu, S.; Luo, X.; Chen, G.; Xu, Z.; Liu, X.; Li, Y. Refined micro-scale geological disaster susceptibility evaluation based on UAV tilt photography data and weighted certainty factor method in Mountainous Area. Ecotoxicol. Environ. Saf. 2020, 189, 110005. [Google Scholar] [CrossRef] [PubMed]
  17. Lin, J.; Lin, M.; Chen, W.; Zhang, A.; Qi, X.; Hou, H. Ecological risks of geological disasters and the patterns of the urban agglomeration in the Fujian Delta region. Ecol. Indic. 2021, 125, 107475. [Google Scholar] [CrossRef]
  18. Sun, D.; Shi, S.; Wen, H.; Xu, J.; Zhou, X.; Wu, J. A hybrid optimization method of factor screening predicated on GeoDetector and Random Forest for Landslide Susceptibility Mapping. Geomorphology 2021, 379, 107623. [Google Scholar] [CrossRef]
  19. Su, Q.; Zhang, J.; Zhao, S.; Wang, L.; Liu, J.; Guo, J. Comparative Assessment of Three Nonlinear Approaches for Landslide Susceptibility Mapping in a Coal Mine Area. ISPRS Int. J. Geo.-Inf. 2017, 6, 228. [Google Scholar] [CrossRef]
  20. Xu, S.; Zhang, M.; Ma, Y.; Liu, J.; Wang, Y.; Ma, X.; Chen, J. Multiclassification Method of Landslide Risk Assessment in Consideration of Disaster Levels: A Case Study of Xianyang City, Shaanxi Province. ISPRS Int. J. Geo.-Inf. 2021, 10, 646. [Google Scholar] [CrossRef]
  21. Nurwatik, N.; Ummah, M.H.; Cahyono, A.B.; Darminto, M.R.; Hong, J.-H. A Comparison Study of Landslide Susceptibility Spatial Modeling Using Machine Learning. ISPRS Int. J. Geo.-Inf. 2022, 11, 602. [Google Scholar] [CrossRef]
  22. Đurić, U.; Marjanović, M.; Radić, Z.; Abolmasov, B. Machine learning based landslide assessment of the Belgrade metropolitan area: Pixel resolution effects and a cross-scaling concept. Eng. Geol. 2019, 256, 23–38. [Google Scholar] [CrossRef]
  23. Kohestani, V.R.; Hassanlourad, M.; Ardakani, A. Evaluation of liquefaction potential based on CPT data using random forest. Nat. Hazards 2015, 79, 1079–1089. [Google Scholar] [CrossRef]
  24. Wang, X.; Zhang, C.; Wang, C.; Liu, G.; Wang, H. GIS-based for prediction and prevention of environmental geological disaster susceptibility: From a perspective of sustainable development. Ecotoxicol. Environ. Saf. 2021, 226, 112881. [Google Scholar] [CrossRef] [PubMed]
  25. Izquierdo-Horna, L.; Zevallos, J.; Yepez, Y. An integrated approach to seismic risk assessment using random forest and hierarchical analysis: Pisco, Peru. Heliyon 2022, 8, e10926. [Google Scholar] [CrossRef] [PubMed]
  26. Gao, Z.; Ding, M.; Huang, T.; Liu, X.; Hao, Z.; Hu, X.; Chuanjie, X. Landslide risk assessment of high-mountain settlements using Gaussian process classification combined with improved weight-based generalized objective function. Int. J. Disaster Risk Reduct. 2022, 67, 102662. [Google Scholar] [CrossRef]
  27. Xiong, J.; Sun, M.; Zhang, H.; Cheng, W.; Yang, Y.; Sun, M.; Cao, Y.; Wang, J. Application of the Levenburg–Marquardt back propagation neural network approach for landslide risk assessments. Nat. Hazards Earth Syst. Sci. 2019, 9, 629–653. [Google Scholar] [CrossRef]
  28. Sui, H.; Hu, R.; Gao, W. Risk assessment of individual landslide based on the risk acceptable model: A case study of the Shiyantan landslide in Mayang County, China. Hum. Ecol. Risk Assess. Int. J. 2020, 26, 2500–2519. [Google Scholar] [CrossRef]
  29. Chang, M.; Cui, P.; Dou, X.; Su, F. Quantitative risk assessment of landslides over the China-Pakistan economic corridor. Int. J. Disaster Risk Reduct. 2021, 63, 102441. [Google Scholar] [CrossRef]
  30. Wu, Z.; Hu, M. Neotectonics, active tectonics and earthquake geology: Terminology, applications and advances. J. Geodyn. 2019, 127, 1–15. [Google Scholar] [CrossRef]
  31. Ma, J.; Wang, X.; Yuan, G. Evaluation of Geological Hazard Susceptibility Based on the Regional Division Information Value Method. ISPRS Int. J. Geo.-Inf. 2023, 12, 17. [Google Scholar] [CrossRef]
  32. Ohlmacher, G.C. Plan curvature and landslide probability in regions dominated by earth flows and earth slides. Eng. Geol. 2007, 91, 117–134. [Google Scholar] [CrossRef]
  33. Mind’Je, R.; Li, L.; Amanambu, A.C.; Nahayo, L.; Nsengiyumva, J.B.; Gasirabo, A.; Mindje, M. Flood susceptibility modeling and hazard perception in Rwanda. Int. J. Disaster Risk Reduct. 2019, 38, 101211. [Google Scholar] [CrossRef]
  34. Liu, K.; Wang, M.; Cao, Y.; Zhu, W.; Yang, G. Susceptibility of existing and planned Chinese railway system subjected to rainfall-induced multi-hazards. Transp. Res. Part A Policy Pract. 2018, 117, 214–226. [Google Scholar] [CrossRef]
  35. Hadji, R.; Limani, Y.; Baghem, M.; Demdoum, A. Geologic, topographic and climatic controls in landslide hazard assessment using GIS modeling: A case study of Souk Ahras region, NE Algeria. Quat. Int. 2013, 302, 224–237. [Google Scholar] [CrossRef]
  36. Siddique, T.; Pradhan, S.P.; Vishal, V.; Mondal, M.E.A.; Singh, T.N. Stability assessment of Himalayan road cut slopes along National Highway 58. India Env. Earth. Sci. 2017, 76, 759. [Google Scholar] [CrossRef]
  37. Alam, R.; Quayyum, Z.; Moulds, S.; Radia, M.A.; Butler, A. Dhaka City Water logging Hazards: Area Identification and Vulnerability Assessment through GIS-Remote Sensing Techniques. Res. Sq. 2021, 1, 27. [Google Scholar] [CrossRef]
  38. Duan, C.; Zhang, J.; Chen, Y.; Lang, Q.; Zhang, Y.; Wu, C.; Zhang, Z. Comprehensive Risk Assessment of Urban Waterlogging Disaster Based on MCDA-GIS Integration: The Case Study of Changchun, China. Remote Sens. 2022, 14, 3101. [Google Scholar] [CrossRef]
  39. Zhao, Z.; Chen, J.; Xu, K. A spatial case-based reasoning method for regional landslide risk assessment. Int. J. Appl. Earth Obs. Geoinf. 2021, 102, 102381. [Google Scholar] [CrossRef]
  40. Zhang, Y.; Lang, Q.; Chen, Y. Provincial geological disaster risk zoning method based on natural disaster risk assessmet framework: A case sthdy in Jilin Province. Chin. J. Geol. Hazard Control 2020, 31, 104–110. [Google Scholar] [CrossRef]
  41. Zhan, J.; Norio, O.; Toda, Y. Integrative Natural Disaster Risk Management: Comprehensive Integration Model and China’s Strategic Choice. J. Nat. Disasters 2006, 1, 29–37. [Google Scholar]
  42. Azareh, A.; Rahmati, O.; Rafiei-Sardooi, E.; Sankey, J.B.; Lee, S. Modelling gully-erosion susceptibility in a semi-arid region, iran: Investigation of applicability of certainty factor and maximum entropy models. Sci. Total Env. 2019, 655, 684–696. [Google Scholar] [CrossRef] [PubMed]
  43. Alamanis, N.; Dakoulas, P. Impact of Soil Properties’ Spatial Correlation Lengths and Inclination on Permanent Slope Displacements Due to Earthquake Excitation. Appl. Sci. 2023, 13, 9868. [Google Scholar] [CrossRef]
  44. Yang, X.; Dai, X.; Li, W.; Lu, H.; Liu, C. Socio-Ecological Vulnerability in Aba Prefecture, Western Sichuan Plateau: Evaluation, Driving Forces and Scenario Simulation. ISPRS Int. J. Geo.-Inf. 2022, 11, 524. [Google Scholar] [CrossRef]
  45. Ba, Q.; Chen, Y.; Deng, S.; Wu, Q.; Yang, J. An Improved Information Value Model Based on Gray Clustering for Landslide Susceptibility Mapping. ISPRS Int. J. Geo.-Inf. 2017, 6, 18. [Google Scholar] [CrossRef]
  46. Breiman, L. Random Forests. Mach. Learn. 2001, 45, 5–32. [Google Scholar] [CrossRef]
  47. Miao, F.; Ruan, Q.; Wu, Y.; Qian, Z.; Kong, Z.; Qin, Z. Landslide Dynamic Susceptibility Mapping Base on Machine Learning and the PS-InSAR Coupling Model. Remote Sens. 2023, 15, 5427. [Google Scholar] [CrossRef]
  48. Yeon, Y.-K.; Han, J.-G.; Ryu, K.H. Landslide susceptibility mapping in injae, korea, using a decision tree. Eng. Geol. 2010, 116, 274–283. [Google Scholar] [CrossRef]
  49. Ahamad, G.N.; Shafiullah; Fatima, H.; Imdadullah; Zakariya, S.M. Influence of Optimal Hyperparameters on the Performance of Machine Learning Algorithms for Predicting Heart Disease. Processes 2023, 11, 734. [Google Scholar] [CrossRef]
  50. Du, Y.; Lu, Y.; Xie, M. A new attempt for early warning of unstable rocks based on vibration parameters. Bull. Eng. Geol. Env. 2020, 79, 4363–4368. [Google Scholar] [CrossRef]
  51. Du, Y.; Xie, M.; Jia, J. Stepped settlement: A possible mechanism for translational landslides. CATENA 2020, 187, 104365. [Google Scholar] [CrossRef]
  52. Gargani, J. Influence of Relative Sea-Level Rise, Meteoric Water Infiltration and Rock Weathering on Giant Volcanic Landslides. Geosciences 2023, 13, 113. [Google Scholar] [CrossRef]
  53. Mercurio, C.; Calderón-Cucunuba, L.P.; Argueta-Platero, A.A. Predicting Earthquake-Induced Landslides by Using a Stochastic Modeling Approach: A Case Study of the 2001 El Salvador Coseismic Landslides. ISPRS Int. J. Geo.-Inf. 2023, 12, 178. [Google Scholar] [CrossRef]
  54. Li, W.; Fan, X.; Huang, F.; Chen, W.; Hong, H.; Huang, J.; Guo, Z. Uncertainties Analysis of Collapse Susceptibility Prediction Based on Remote Sensing and GIS: Influences of Different Data-Based Models and Connections between Collapses and Environmental Factors. Remote Sens. 2020, 12, 4134. [Google Scholar] [CrossRef]
  55. Tempa, K.; Chettri, N.; Aryal, K.R.; Gautam, D. Geohazard vulnerability and condition assessment of the Asian highway AH-48 in Bhutan. Geomat. Nat. Hazards Risk 2021, 12, 2904–2930. [Google Scholar] [CrossRef]
Figure 1. Geographical location of the study area.
Ijgi 12 00493 g001
Figure 2. Workflow of the study.
Ijgi 12 00493 g002
Figure 3. Spatial distribution of the hazard indicators. ((a) Slope, (b) aspect, (c) curvature, (d) NDVI, (e) mean annual precipitation, (f) distance from fault, (g) lithology, (h) distance from road).
Ijgi 12 00493 g003aIjgi 12 00493 g003b
Figure 4. Spatial distribution of the exposure indices. ((a) Population density, (b) road density, (c) building density).
Ijgi 12 00493 g004
Figure 5. Spatial distribution of the vulnerability indices. ((a) Age of the structure, (b) road classification, (c) building types).
Ijgi 12 00493 g005
Figure 6. Spatial distribution of the emergency responses and recovery capability indices. ((a) GDP, (b) educational status, (c) number of medical staff).
Ijgi 12 00493 g006
Figure 7. Drawing of each criterion layer. ((a) Hazard map, (b) exposure map, (c) vulnerability map, (d) emergency responses and recovery capability map).
Ijgi 12 00493 g007aIjgi 12 00493 g007b
Figure 8. ROC curve for the information quantity method.
Ijgi 12 00493 g008
Figure 9. ROC curve for the random forest model. ((a) Initial model, (b) optimizing n_estimators, (c) final model).
Ijgi 12 00493 g009
Figure 10. Risk map.
Ijgi 12 00493 g010
Figure 11. Risk map excluding emergency responses and recovery capability.
Ijgi 12 00493 g011
Table 1. Data source.
Target LayerCriterion LayerIndicator LayerData Sources
RiskHazardDEMhttps://www.gscloud.cn (accessed on 24 May 2022)
Slope, aspect, curvatureExtracted via DEM
Mean annual precipitationwww.resdc.cn (accessed on 7 June 2022)
NDVIUsing Landset8 satellite data produced via ENVI
Lithologyhttp://dc.ngac.org.cn/Home (accessed on 19 June 2022)
Distance from faulthttp://dc.ngac.org.cn/Home (accessed on 19 June 2022)
Distance from roadChangbai County Transportation Bureau
ExposurePopulation densityChangbai Yearbook
Road densityChangbai County Transportation Bureau
Building densityhttp://www.guihuayun.com/ (accessed on 24 May 2022)
VulnerabilityAge of structureChangbai Yearbook
Road classificationChangbai County Transportation Bureau
Building typeshttp://www.guihuayun.com/ (accessed on 24 May 2022)
Emergency responses and recovery capabilityGDPwww.resdc.cn (accessed on 7 June 2022)
Educational statusChangbai County government official website (http://changbai.gov.cn/wzsy/) (accessed on 21 August 2022)
Number of medical staff
Table 2. Weights of the indicator layers.
Target LayerCriterion LayerCriterion Layer WeightsIndicator LayerIndicator Layer Weights
RiskHazard0.2330Slope (degree)0.0665
Aspect0.1151
Curvature0.1155
NDVI0.1521
Mean annual precipitation (mm)0.1016
Distance from fault (m)0.1377
Lithology0.1664
Distance from road (m)0.1450
Exposure0.1221Population density (p/km2)0.3526
Road density (km/km2)0.2079
Building density0.4395
Vulnerability0.2729Age of structure0.4145
Road classification0.3422
Building types0.2433
Emergency responses and recovery capability0.3720GDP0.5461
Educational status0.2417
Number of medical staff0.2123
Table 3. Information quantities of the indicators.
Criterion LayerCategoryInformation QuantityIndicator LayerCategoryInformation Quantity
HazardLow−3.3451Slope (degree)0–6.4314−1.8233
6.4314–11.6324−1.5189
11.6324–17.4423−0.6277
17.4423–23.8533−0.1079
23.8533–30.84000.3197
30.8400–39.07211.0671
39.0721–70.29632.0259
Medium−2.7958AspectFlat0.0000
North0.2573
Northeast0.6518
East0.3086
Southeast0.1941
South−0.0200
Southwest−0.2762
West−2.0180
Northwest−1.0921
CurvatureConcave0.1300
Flat0.0000
Convex−0.0408
Higher−1.5567NDVI0–0.4335−0.2555
0.4335–0.58590.8270
0.5859–0.71480.5974
0.7148–0.8320−0.0809
0.8320–1−0.7986
Mean annual precipitation (mm)706–817−0.4274
817–942−0.0260
942–10550.6101
1055–1151−0.0005
1151–12980.4425
Highest1.2415Distance from fault (m)0–9857.54−0.5391
9857.54–22,568.580.2497
22,568.58–34,241.990.2229
34,241.99–47,990.670.1358
47,990.67–66,408.71−0.7098
LithologyVery hard rock0.1582
Hard rock−0.2534
Soft rock−1.5518
Distance from road (m)0–1036.190.9099
1036.19–2235.75−2.6964
2235.75–3500−2.9131
ExposureLow−1.9625Population density (p/km2)0.1858–342.7732−0.0185
342.7732–1536.27570.4348
1536.2757–3718.45410.2052
Medium0.3414Road density (km/km2)0–0.5101−2.1271
0.5101–1.73440.3777
1.7344–3.36671.5542
Higher1.45983.3667–5.40721.0978
5.4072–26.01601.8249
Highest1.3088Building densityLow−0.0134
Moderate−0.2681
High1.1611
VulnerabilityLow−0.9880Age of structureLowest0.3363
Lower0.1452
Moderate−0.3172
Higher0.0856
Highest−0.9880
Medium−0.3172Road classificationLowest0.0687
Lower0.0917
Moderate−0.1332
Higher0.2076Higher0.2410
Highest0.0000
Highest0.0768Building typesLow0.1961
Moderate−0.2068
High0.0367
Emergency responses and recovery capabilityLow−1.4252GDPLowest0.1511
Lower−0.3131
Medium−0.9220Moderate−0.9223
Higher−1.4275
Highest0.0000
Higher−0.4696Educational statusLow−0.0397
Moderate0.0166
High0.3363
Highest0.1704Number of medical staffLow−0.0197
Moderate0.0251
High0.3363
Table 4. Area under the curve.
AreaStd. ErrorAsymptotic Sig.Asymptotic 95% Confidence Interval
Lower BoundUpper Bound
0.7760.0200.7360.815
Table 5. Hyperparameter optimization results.
HyperparametersSearch Range and Step SizeOptimal Value of the Hyperparameters
n_estimators(25, 500, 25)75
min_samples_split(1, 250, 1)84
min_samples_leaf(1, 110, 2)25
Table 6. Collapse distribution.
Risk LevelNumber of GridsProportionNumber of CollapsesProportion
Low risk400,32551.25%10.64%
Medium risk190,43224.38%2012.74%
Higher risk123,45215.80%2616.56%
Highest risk66,9748.57%11070.06%
Table 7. Area statistics without considering emergency responses and recovery capability.
Risk LevelNumber of GridsProportion
Low risk483,87461.92%
Medium risk111,99414.33%
Higher risk102,81413.16%
Highest risk82,74010.59%
Disclaimer/Publisher’s Note: The statements, opinions and data contained in all publications are solely those of the individual author(s) and contributor(s) and not of MDPI and/or the editor(s). MDPI and/or the editor(s) disclaim responsibility for any injury to people or property resulting from any ideas, methods, instructions or products referred to in the content.

