Article

Vertical vs. Horizontal Fractal Dimensions of Roads in Relation to Relief Characteristics

by
Klemen Prah
1,* and
Ashton M. Shortridge
2
1
Faculty of Logistics, University of Maribor, 2000 Maribor, Slovenia
2
Department of Geography, Environment, and Spatial Sciences, Michigan State University, East Lansing, MI 48824, USA
*
Author to whom correspondence should be addressed.
ISPRS Int. J. Geo-Inf. 2023, 12(12), 487; https://doi.org/10.3390/ijgi12120487
Submission received: 7 September 2023 / Revised: 15 November 2023 / Accepted: 23 November 2023 / Published: 30 November 2023

Abstract

:
This paper investigated the surface length of roads from both horizontal and vertical perspectives using the theory of fractal dimension of surfaces and curves. Three progressive experiments were conducted. The first demonstrated the magnitude of the differences between the planar road length and the DTM-derived surface road length and assessed its correlation with the DTM-calculated road slope. The second investigated the road distance complexity through the fractal dimension in both planar and vertical dimensions. The third related the vertical with the horizontal fractal dimension of roads across a range of distinct physiographic regions. The study contributed theoretically by linking the planimetric complexity to vertical complexity, with clear applications for advanced transportation studies and network analyses. The core methodology used geographic information systems (GIS) to integrate a high resolution (1 × 1 m) digital terrain model (DTM) with a road network layer. A novel concept, the vertical fractal dimension of roads was introduced. Both the vertical and horizontal fractal dimensions of the roads were calculated using the box-counting methodology. We conducted an investigation into the relationship between the two fractal dimensions using fourteen study areas within four distinct physiographic regions across Slovenia. We found that the average slope of a three-dimensional (3D) road was directly related to the length difference between 3D and two-dimensional (2D) roads. The calculated values for the vertical fractal dimension in the study areas were only slightly above 1, while the maximum horizontal fractal dimension of 1.1837 reflected the more sinuous properties of the road in plan. Variations in the vertical and horizontal fractal dimensions of the roads varied between the different physiographic regions.

1. Introduction

Roads as built features exemplify the geographic interaction between people and their environments. Nearly every human lives along a road. Roads connect and convey people and channel their commerce. The geographical position of any road is the consequence of intentional activity through time. Its endpoints are, or were, shaped by local and regional economic, cultural, and political factors, while deviations of its route from a straight line are due to balancing directness with construction and traversal costs [1]. Further, the relative importance of those factors and costs has varied substantially over time and space, so that the geographic position of a modern road is a legacy of past conditions and actions, as is the fitness of a road network for the efficient movement of people and goods across a region [2].
Modeling efficient network movement is a key application domain in geographic information systems for transportation (GIS-T) [3,4]. Such models are used for traversing networks, determining optimal routes, facility coverage areas, and many other applications [5]. In these models, the analysis relies on the link distance measurements that are calculated from geographic network data. Mismatches between the data-derived link distances and real-world link distances propagate into the analysis, leading to uncertainty about all manner of real-world transportation system characteristics. There are many potential sources of error in the distances calculated from road network data. One of particular interest in this paper arose from the use of a two-dimensional plane as the representative basis of the network. While 3D network data development methods have been proposed e.g., [6,7], most network data products are strictly planimetric, and analysts interested in measuring 3D link distances must integrate the vertical dimension themselves. Several studies have explored approaches to achieve this, and these approaches are summarized in Table 1. While the earlier work focused on the methods for incorporating a third dimension into network models, more recent studies generally concentrated on particular transportation applications. The approaches in all these studies depended on the accurate measurements of 3D distances along network links.
The fundamental line length estimation problem has attracted much interest, including empirical and theoretical developments [12]. Richardson [13] studied the relationship between the geographic length and scale and found a tendency for the sampling interval to be related to the length estimate by a power law. Mandelbrot [14,15] provided a framework for Richardson’s results by introducing the concept of fractal dimension, which can be defined as an index to characterize fractal patterns or sets by quantifying their complexity as the ratio of the change in detail to the change in scale [16]. In the geographical sense, the fractal dimension characterizes the complexity of the curves and surfaces [17]. Since it is meaningless to talk about the length of such curves, we can measure their dimension or length complexity, the value of which for a one-dimensional process varies between one (smooth and straight) and two (very complex and space filling).
The fractal theory indicates that the observed length complexity of linear features depends on the scale at which these features are measured, i.e., the length complexity will be greater at a finer scale. The fractal dimension at fine scales may, therefore, provide more sophisticated estimates for road distance complexity and, consequently, more realistic transport network analysis results.
The fractal dimension has been used in many studies as an index to describe the complexity of curves and surfaces [17], such as in the study of coastlines and islands [18], topography [19,20], urban structures [21,22,23], and point pattern analysis [24]. It has been used for many network studies as well. The fractal dimension also has applications in the analysis of transportation networks, as summarized in Table 2. Many studies use the box-counting method to analyze the fractal properties of transportation networks. Other studies used alternative fractal dimension methods to analyze the fractal properties of transport networks. For example, Bai et al. [25] used methods based on the Hausdorff dimension and covering depth, while Mo et al. [26] adapted the Hausdorff method and Wang et al. [27] used length dimensions and branch dimensions.

1.1. Motivation

All these studies relating the fractal dimension theory to transport networks (Table 2) treated the network as planar—a graph that can be drawn on a two-dimensional plane such that no edges cross each other [33]—and without considering the vertical component. Indeed, we did not find any papers relating the fractal dimension in the horizontal and vertical dimensions to the network analysis. Since real-world road networks are embedded in three dimensions, important relationships with the vertical fractal dimension may have been missed, including the relationship of the road distance to the elevation change, the relative contributions of the horizontal and vertical fractal dimensions to distance, and the role of spatial scale on the vertical fractal dimension.
The context presented above suggests two research issues. First, the existing planimetric network data models and products may benefit by incorporating the third dimension for measuring the link distance in order to improve the network models and reduce uncertainty about the real-world transport system characteristics. Second, concepts for the vertical fractal dimension and formal methods for its measurement must be developed, along with assessments for the relationships between the horizontal and vertical fractal dimensions, topography, and road network properties. Addressing these issues would contribute to a more realistic characterization of transport routes, which could contribute to a better assessment and prediction of the travel characteristics, fuel consumption, emissions, and hazards. In addition, it could provide a stronger theoretical basis for the digital representation of road networks.
Therefore, we pursued the following three goals in this study.
  • First, to explicitly demonstrate the magnitude of the length difference between the planar road length and the surface road length derived from a DTM, in correlation with the road slope calculated from the DTM.
  • Second, to study road distance complexity using the fractal dimension in the planar and vertical dimensions.
  • Third, to investigate the vertical and horizontal fractal dimensions of roads in different geographical regions with distinct topographic characteristics.

1.2. Research Originality and Contributions

This research paper provides novel and meaningful contributions, mainly in three fields. First, it introduced and implemented a new concept, the vertical fractal dimension of roads, which characterized the vertical complexity of the road distance and was calculated based on the DTM-derived vertical road profile at different spatial scales. A new vector-based approach for performing box counting to measure the vertical fractal dimension of roads was developed. Second, it characterized the relationship between the difference in the 2D and 3D road length and slope. Third, it identified relationships between road complexity and the terrain characteristics. Using fine-resolution road and topographic data, both derived in a consistent manner region-wide, we identified some basic regularities in the relationship between the vertical and horizontal fractal dimensions and terrain in a range of physiographic regions. Geographically, we focused on Slovenia due to its great topographic diversity and ready data availability. Despite its small size, Slovenia is very diverse physiographically and is, therefore, suitable for such research. The country provided an excellent case study for evaluating our three objectives.

1.3. Organization of the Paper

The rest of the paper is organized as follows. Section 2 presents the data and the core methods. Section 3 comprises the three experiments that pursued the three main research goals of the study. The experiments are presented in three separate subsections. Section 4 compares this research work with other existing studies and discusses the results and limitations of this work. Section 5 provides conclusions and directions for future research.

2. Data and Core Method

This study used two datasets covering Slovenia, the first of which was the road dataset [34]. It was constructed by a commercial provider through a multi-step process in which centerline digitization was used to represent the road object as a single line. The centerline of the road indicated the middle of the roadbed. In the centerline digitization specification used for this data product, any point along the link could not deviate more than 3 m perpendicular to the centerline of the road relative to its endpoints. In addition, the links conformed to the accuracy requirements of +/−5 m for the absolute position and +/−1 m for the relative position. However, the documentation noted that the accuracy varied by country and source. Unfortunately for the Slovenian region, the accuracy only reached the specified level for highways; other road types were not so accurate.
The second dataset was the lidar-derived national digital terrain model (DTM) with a 1-m horizontal resolution [35]. It was made as part of the Laser Scanning of Slovenia project with an average density for the last lidar returns of five points per square meter. The data product, a 1 m × 1 m DTM grid, was built from raw unclassified lidar data. The grid was based on the iterative approximation of the approximated surface to the actual terrain. In this process, the points were first divided into a grid of cells of equal size, and then the height of each cell was determined by its lowest contained point. In the next step, this point was treated as the control point of the interpolation function to build the DTM. Thin plate spline interpolation was used for the DTM interpolation [36,37].
This study benefits from the high resolution of the DTM, which enabled the use of very fine-resolution grids for box counting, which is explained in more detail in Experiment 2. This allowed for the clear identification of relief details and their effects on road variation.
This research was organized into three general, progressive stages that corresponded with the paper’s three goals (Figure 1). At the first stage, we demonstrated the magnitude of the length difference between the planimetric road length and the DTM-derived surface road length in correlation with the DTM-calculated road slope. The core method of integrating the road network with DTM heights to calculate the 3D surface length of the road, presented later in this section, is explained and demonstrated in Experiment 1, so both the core method and Experiment 1 were intertwined during the first stage, as shown in Figure 1. For a geographic scale experiment in this stage, we chose the topographically rugged area of Gornji Grad. During the second progressive stage of the research, we evaluated the road distance complexity using the fractal dimension in both the planar and vertical dimensions. During the third progressive stage of the research, we conducted a survey in a wide range of physiographic regions to develop the relationship between the vertical and horizontal fractal dimensions of the roads with respect to the topographic features. The details of the methods used in each stage are presented in the section of the experiments. All the analyses were performed in Esri’s ArcGIS ArcMap 10.8.1 and its 3D Analyst extension [38]. The newer ArcGIS Pro application also contained all the necessary tools to perform these analyses.
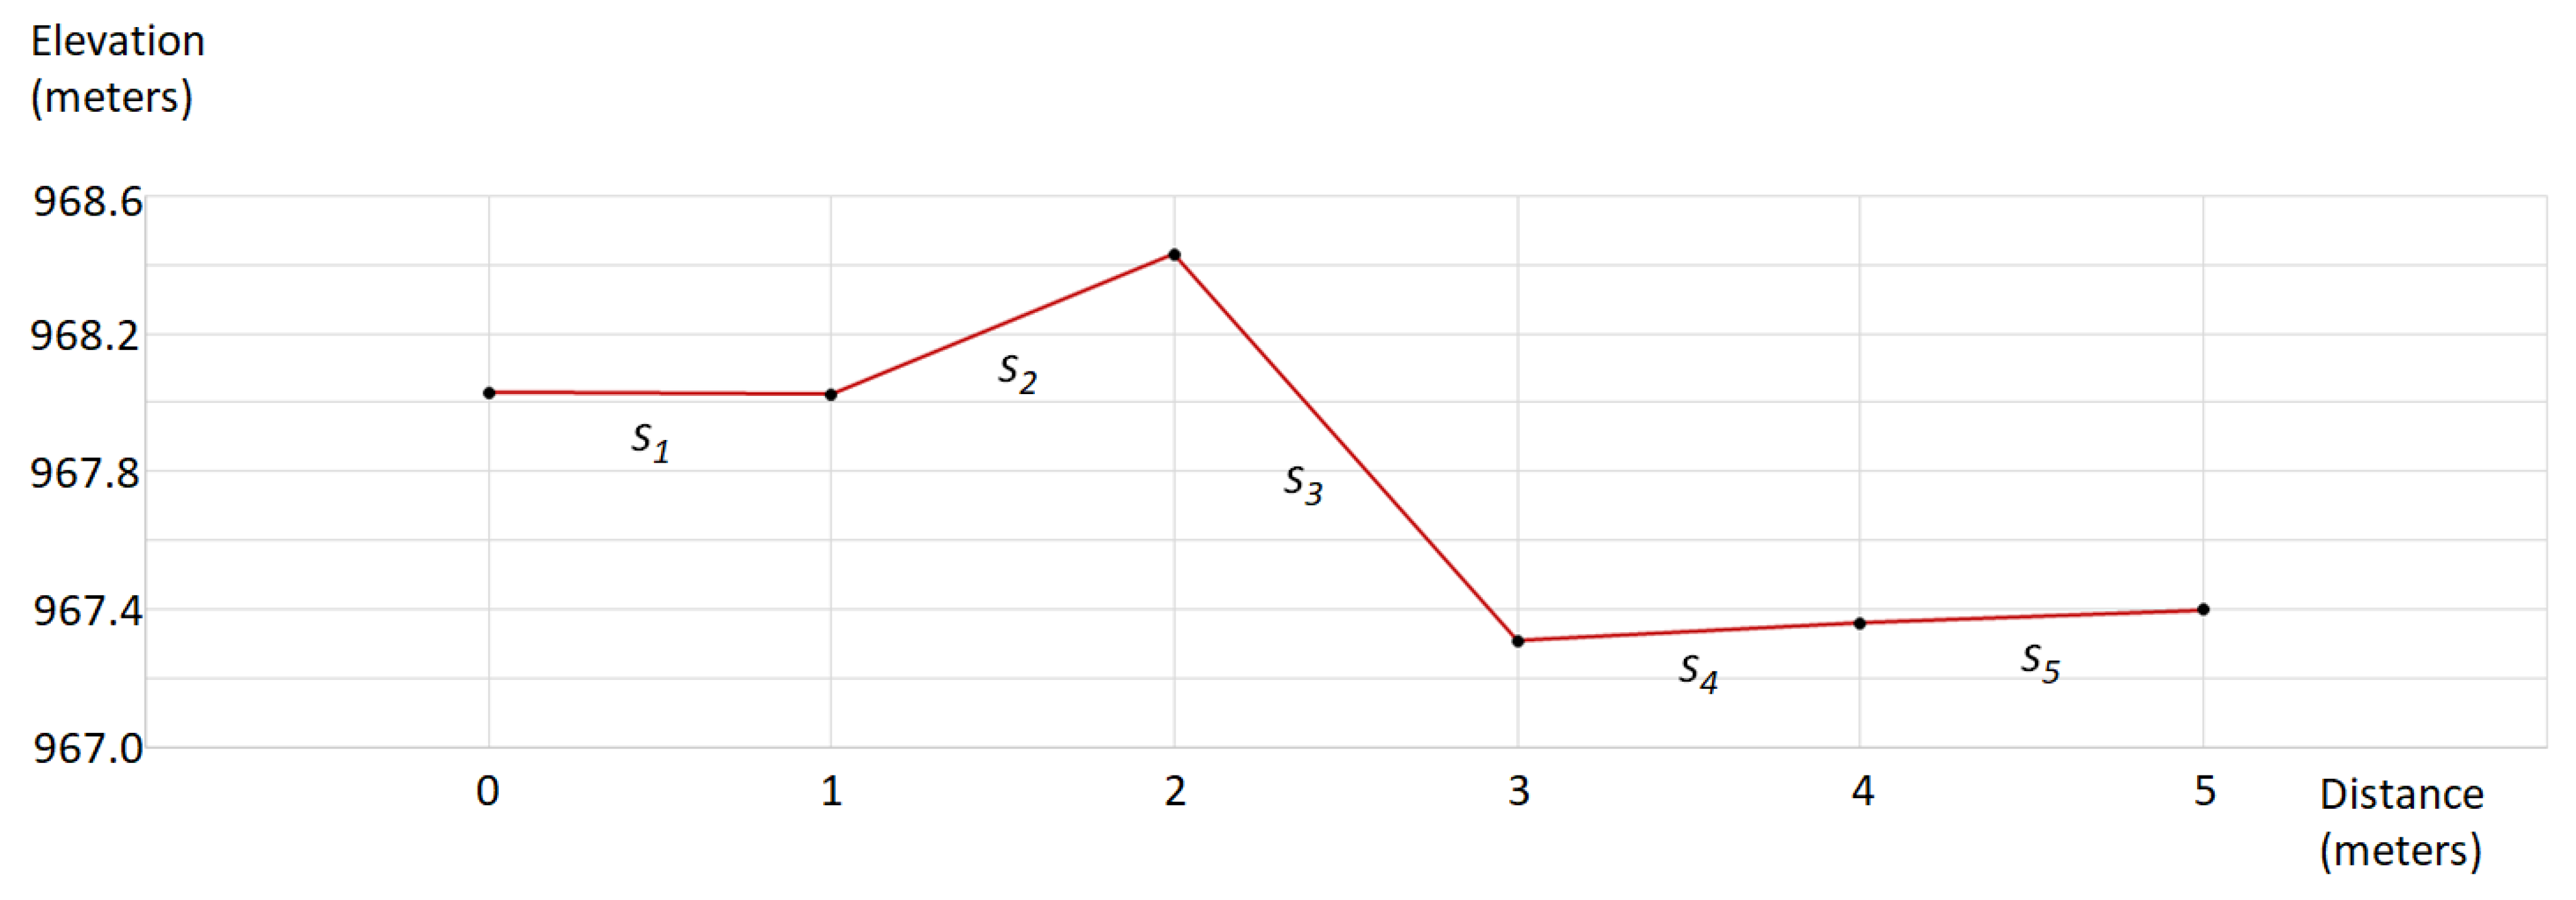
The road network dataset had to be integrated with the DTM to calculate the surface road length. To do this, the vector road lines were broken into 5-m planar sections. These were in turn divided into 1-m planar segments. This one-meter sample distance was chosen to match the raster cell size. The elevations of the start and endpoints of each segment were estimated using bilinear interpolation from the DTM with a one-meter resolution. The three-dimensional surface lengths were calculated for the segments, and these were summed to provide the surface road length of a 5-m road section, while the average slope was calculated by weighting the slope of each segment by its 3D length. Both the 3D surface length and slope were calculated using the Add Surface Information tool within 3D Analyst [38]. This methodology is illustrated in Figure 2 and Table 3, where an example of a five-meter road section [34] was overlain on the one-meter DTM surface and its elevations were interpolated. The vertical profile shown in Figure 2 highlights how the section was divided into five segments (s1-5), each with its own surface length and slope values. The surface length of the whole segment was 5.58 m, and the average slope was 20.32 degrees.
An alternative approach, which ignored the implications of the fractal dimension, extracted only the start and endpoints of each five-meter section and calculated its surface length and slope using trigonometry. Applying this approach to the example shown in Figure 2 resulted in a surface length of 5.05 m and a slope of 7.18 degrees, which was much lower than the values calculated using our methodology. This comparison highlights the importance of scale in calculating the surface length.

3. Experiments

In the following section, we present the three aforementioned experiments. The first experiment demonstrates the magnitude of the length difference between the planar road length and 3D surface road length, in correlation with the road slope. The second experiment investigates the road distance complexity using the fractal dimension in the planar and vertical dimensions. The novel methodology of vertical dimension box counting is demonstrated. The third experiment investigates and evaluates the relationship between the vertical and plan fractal dimensions in a wide range of topographic conditions.

3.1. Experiment 1: Length Difference between the Planar and Surface Road Lengths, and Their Relationship with the Slope

The entire road network of the topographically rugged municipality of Gornji Grad in Slovenia was evaluated in order to determine the length difference between the planar road length and the DTM-derived surface road length, and the relationship with the slope of the roads calculated by the DTM. The municipality is situated in the Alpine macro-region and submacro-region of the Alpine high mountains [39]. Gornji Grad is located on the flanks of large mountains and is characterized by three relief units: a small basin, a karst and forested plateau that reaches approximately 1130 m above the bottom of the basin, and forested mountains that are slightly higher than the karstic plateau. The mean slope in the municipality was 23.9 degrees, calculated from a one-meter cell size raster covering the entire region. The diverse topography of this municipality made it particularly suitable for this experiment.
The road network was split into 63,261 five-meter road sections, the surface length was calculated according to the previously laid out methodology, and for each section, the difference between the surface length and planar length was calculated. A polynomial regression analysis was performed to identify the relationship between the length difference and the average slope for all the road sections.
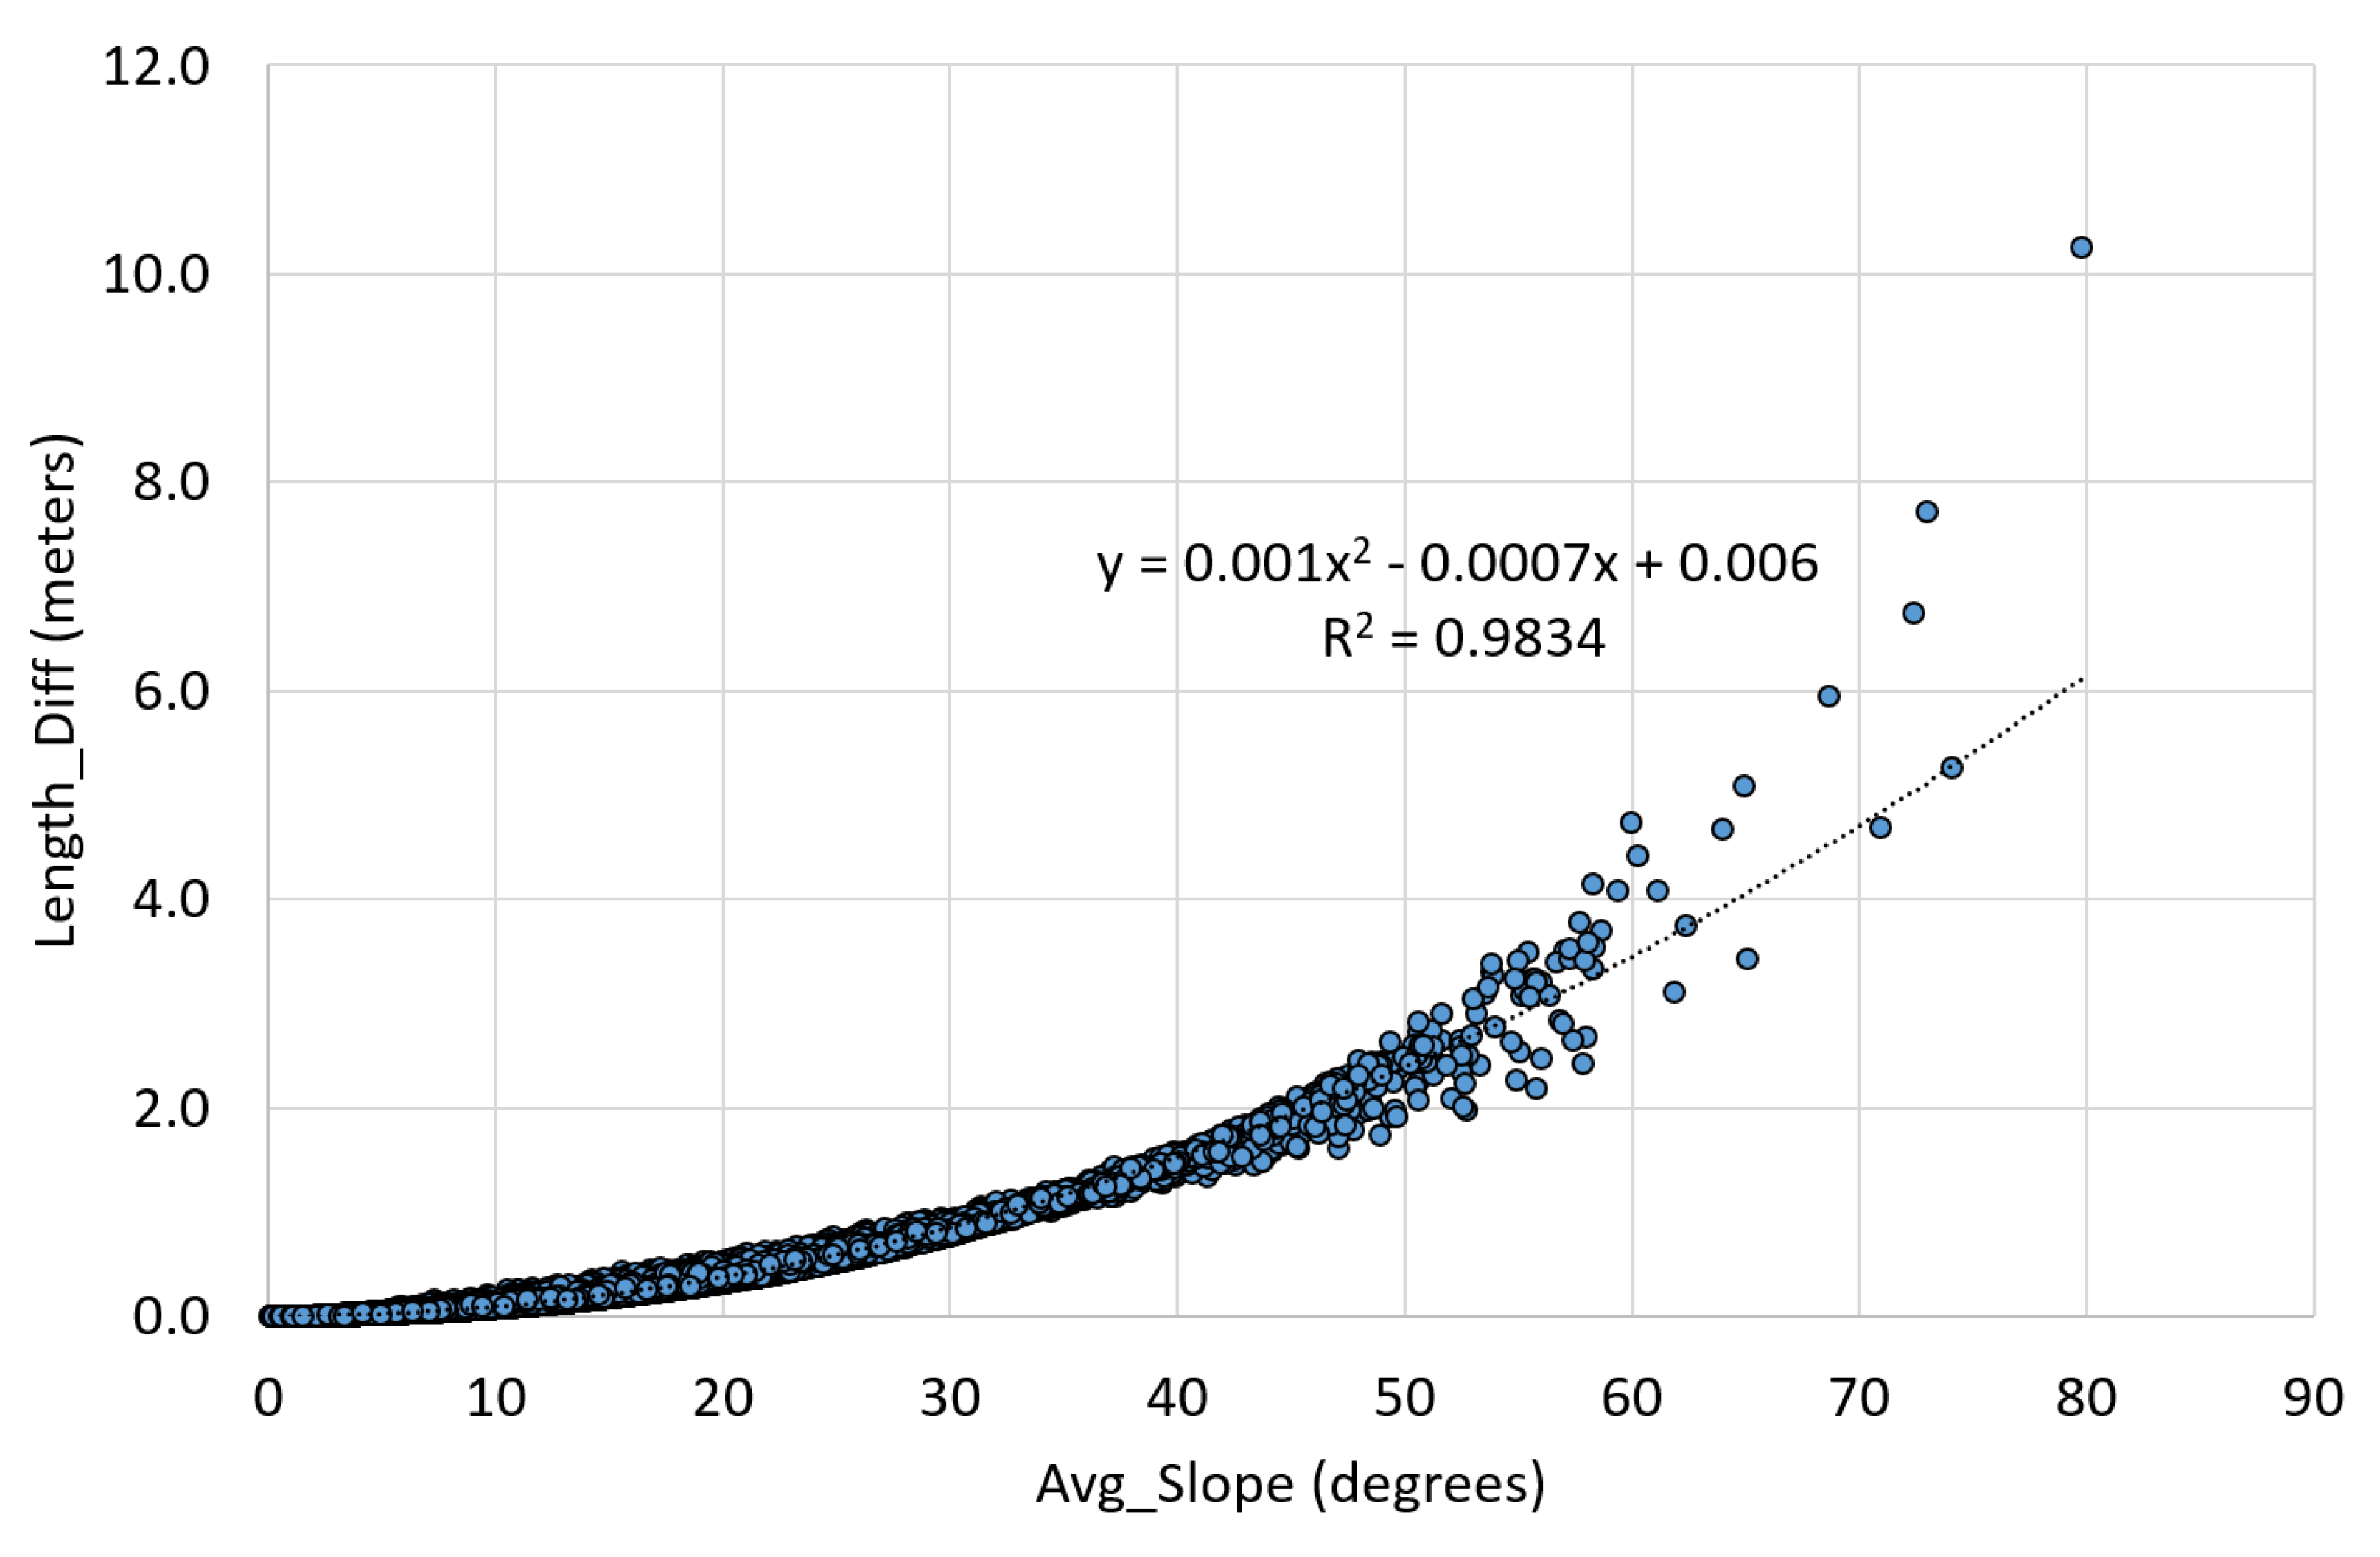
The length differences of the road sections increased with their average slope (Figure 3). The polynomial regression analysis with an R2 of 0.983 confirmed a strong and increasingly positive relationship between the variables. It could be noticed how the length difference, with quite sharp upper and lower bounds, arced upward very smoothly, approximately to an average slope of 45 degrees. Above this slope, however, the model arced more intensely and the observations varied more widely. In general, the variance in the length difference for the road sections with a similar average slope increased with the increasing average slope. The interquartile range was only 0.01 for the sections with average slopes less than five degrees and increased by approx. 0.05 for each average slope class up to 45 degrees. For the higher classes, the growth in the interquartile range was greater.
Experiment 1 confirmed a strong, non-linear relationship between the slope and surface road length across a wide range of gradients. The differences in the planar and surface length became substantial—in the order of 20 percent—at slopes of 30 degrees or greater. Furthermore, this finding sets the stage for further experiments that directly investigate the role of the fractal dimension in road distance complexity.

3.2. Experiment 2: Road Distance Complexity Using the Fractal Dimension

For the second experiment, we developed and described a method for calculating the fractal dimension in the vertical dimension using GIS tools. As pointed out in the introduction, the vertical fractal dimension of roads presents the vertical complexity of the road distance and is calculated based on the vertical road profile derived from the DTM. The concept required analysis at various scales.
  • The ArcGIS Interpolate Shape tool [38] was used to convert a 2D road line into a 3D road line by interpolating the Z-values from a raster surface of a one-meter cell size. Similar to the previous experiment, the interpolation method was bilinear, and the sample distance was equal to the size of the raster cell.
  • A vertical profile of the road section was created using the tool Create Profile Graph [38], where the horizontal axis (distance) and vertical axis (elevation) had the same scale, 1:1, in meters. The profile was exported as a table. This table was re-imported as X–Y data into ArcGIS ArcMap, resulting in a planar vector representation of the road section profile. This meant that the x-axis was the distance along the road section, while the y-axis was the elevation of the section.
  • Box counting, a common approach for calculating the fractal dimension [40,41], was applied to the profile as follows. A sequence of M square vector meshes was created, each covering a profile. The initial mesh had a square side length of ƞ1, while each subsequent mesh had a finer side length ƞi. For each mesh, the number of squares Ni that included part of the profile was counted.
The relation between ƞi and the fractal dimension D is as follows.
log(N(ƞi)) = aD log(ƞi)
Given the M measures, the values for a and D could be estimated by fitting a regression model between the independent variable log(ƞi) and the dependent variable log(N(ƞi)), where i = 1, …, M. D was given by the absolute value of the regression line slope and was a parameter of particular importance in this study. In order to obtain reliable results and a realistic estimate of D [42], we used a large range of square side lengths, where each subsequent value was twice the previous one: 1, 2, 4, 8, 16, 32, 64, 128, 256, 512, 1024, 2048, 4096, and 8192. The maximum square side length from the presented set of values was determined for each study site individually, namely with the first occurrence of a single-row or single-column mesh in the output. The minimum square side length was one meter, unless the size and the shape of the line caused the output grid file to be too large. In this case, the minimum square side length was two meters.
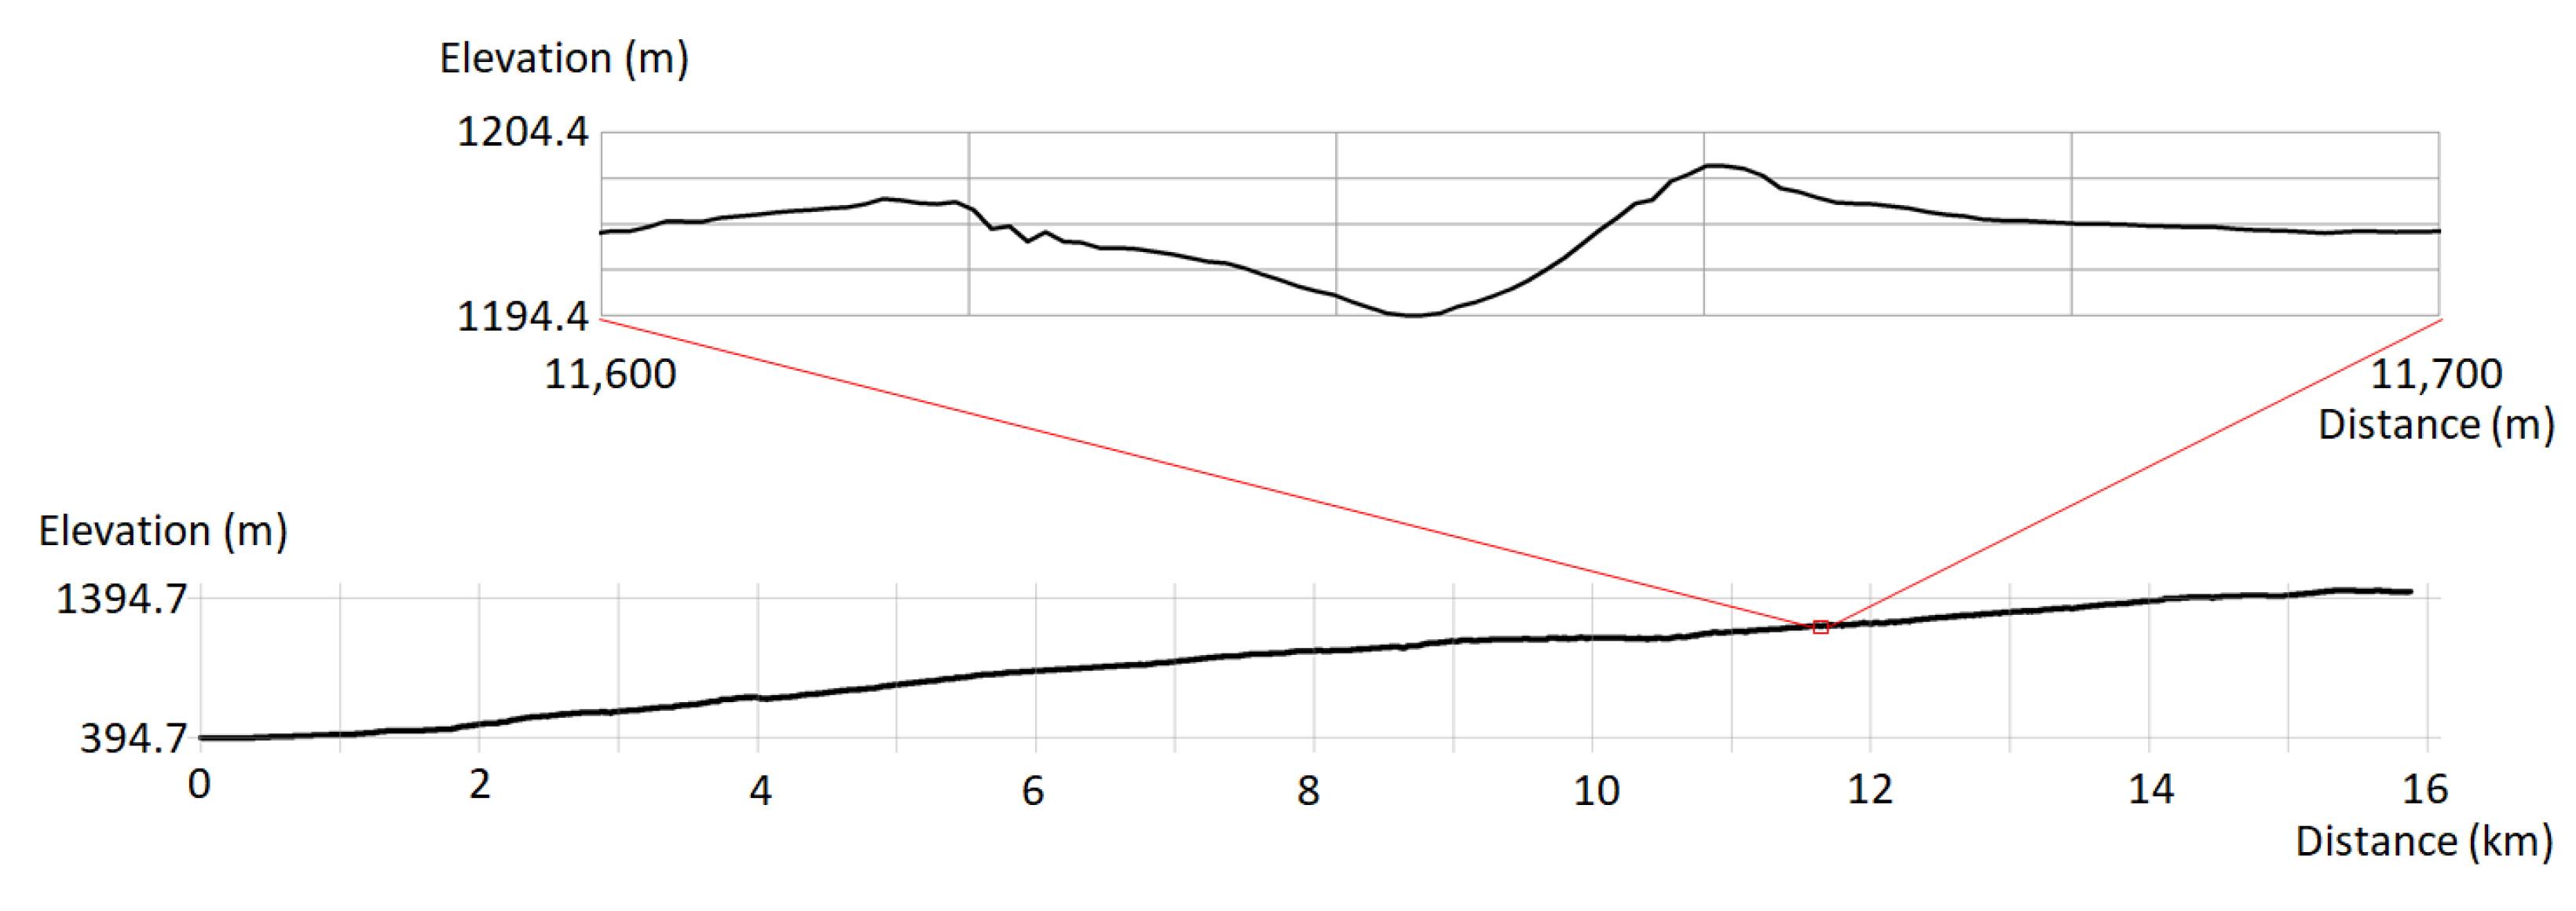
In this experiment, we again focused on the municipality of Gornji Grad, due to its variable terrain. We selected a road section running from the lowest elevation of the road in the region at 395 m to the highest elevation of the road at 1444 m. Its planar length was 15.88 km. Using the procedure described above, we calculated the vertical fractal dimension D1 for this road section. Eleven mesh side lengths ranging from 2 to 2048 m were developed for the regression model. Figure 4 illustrates the vertical profile of this road section together with a hundred-meter (planar length) detail of this profile. On a small scale, the road appeared to maintain a consistent rate of rise almost throughout the profile. However, it was apparent from the inset that the small scale concealed significant vertical variation along the entire profile.
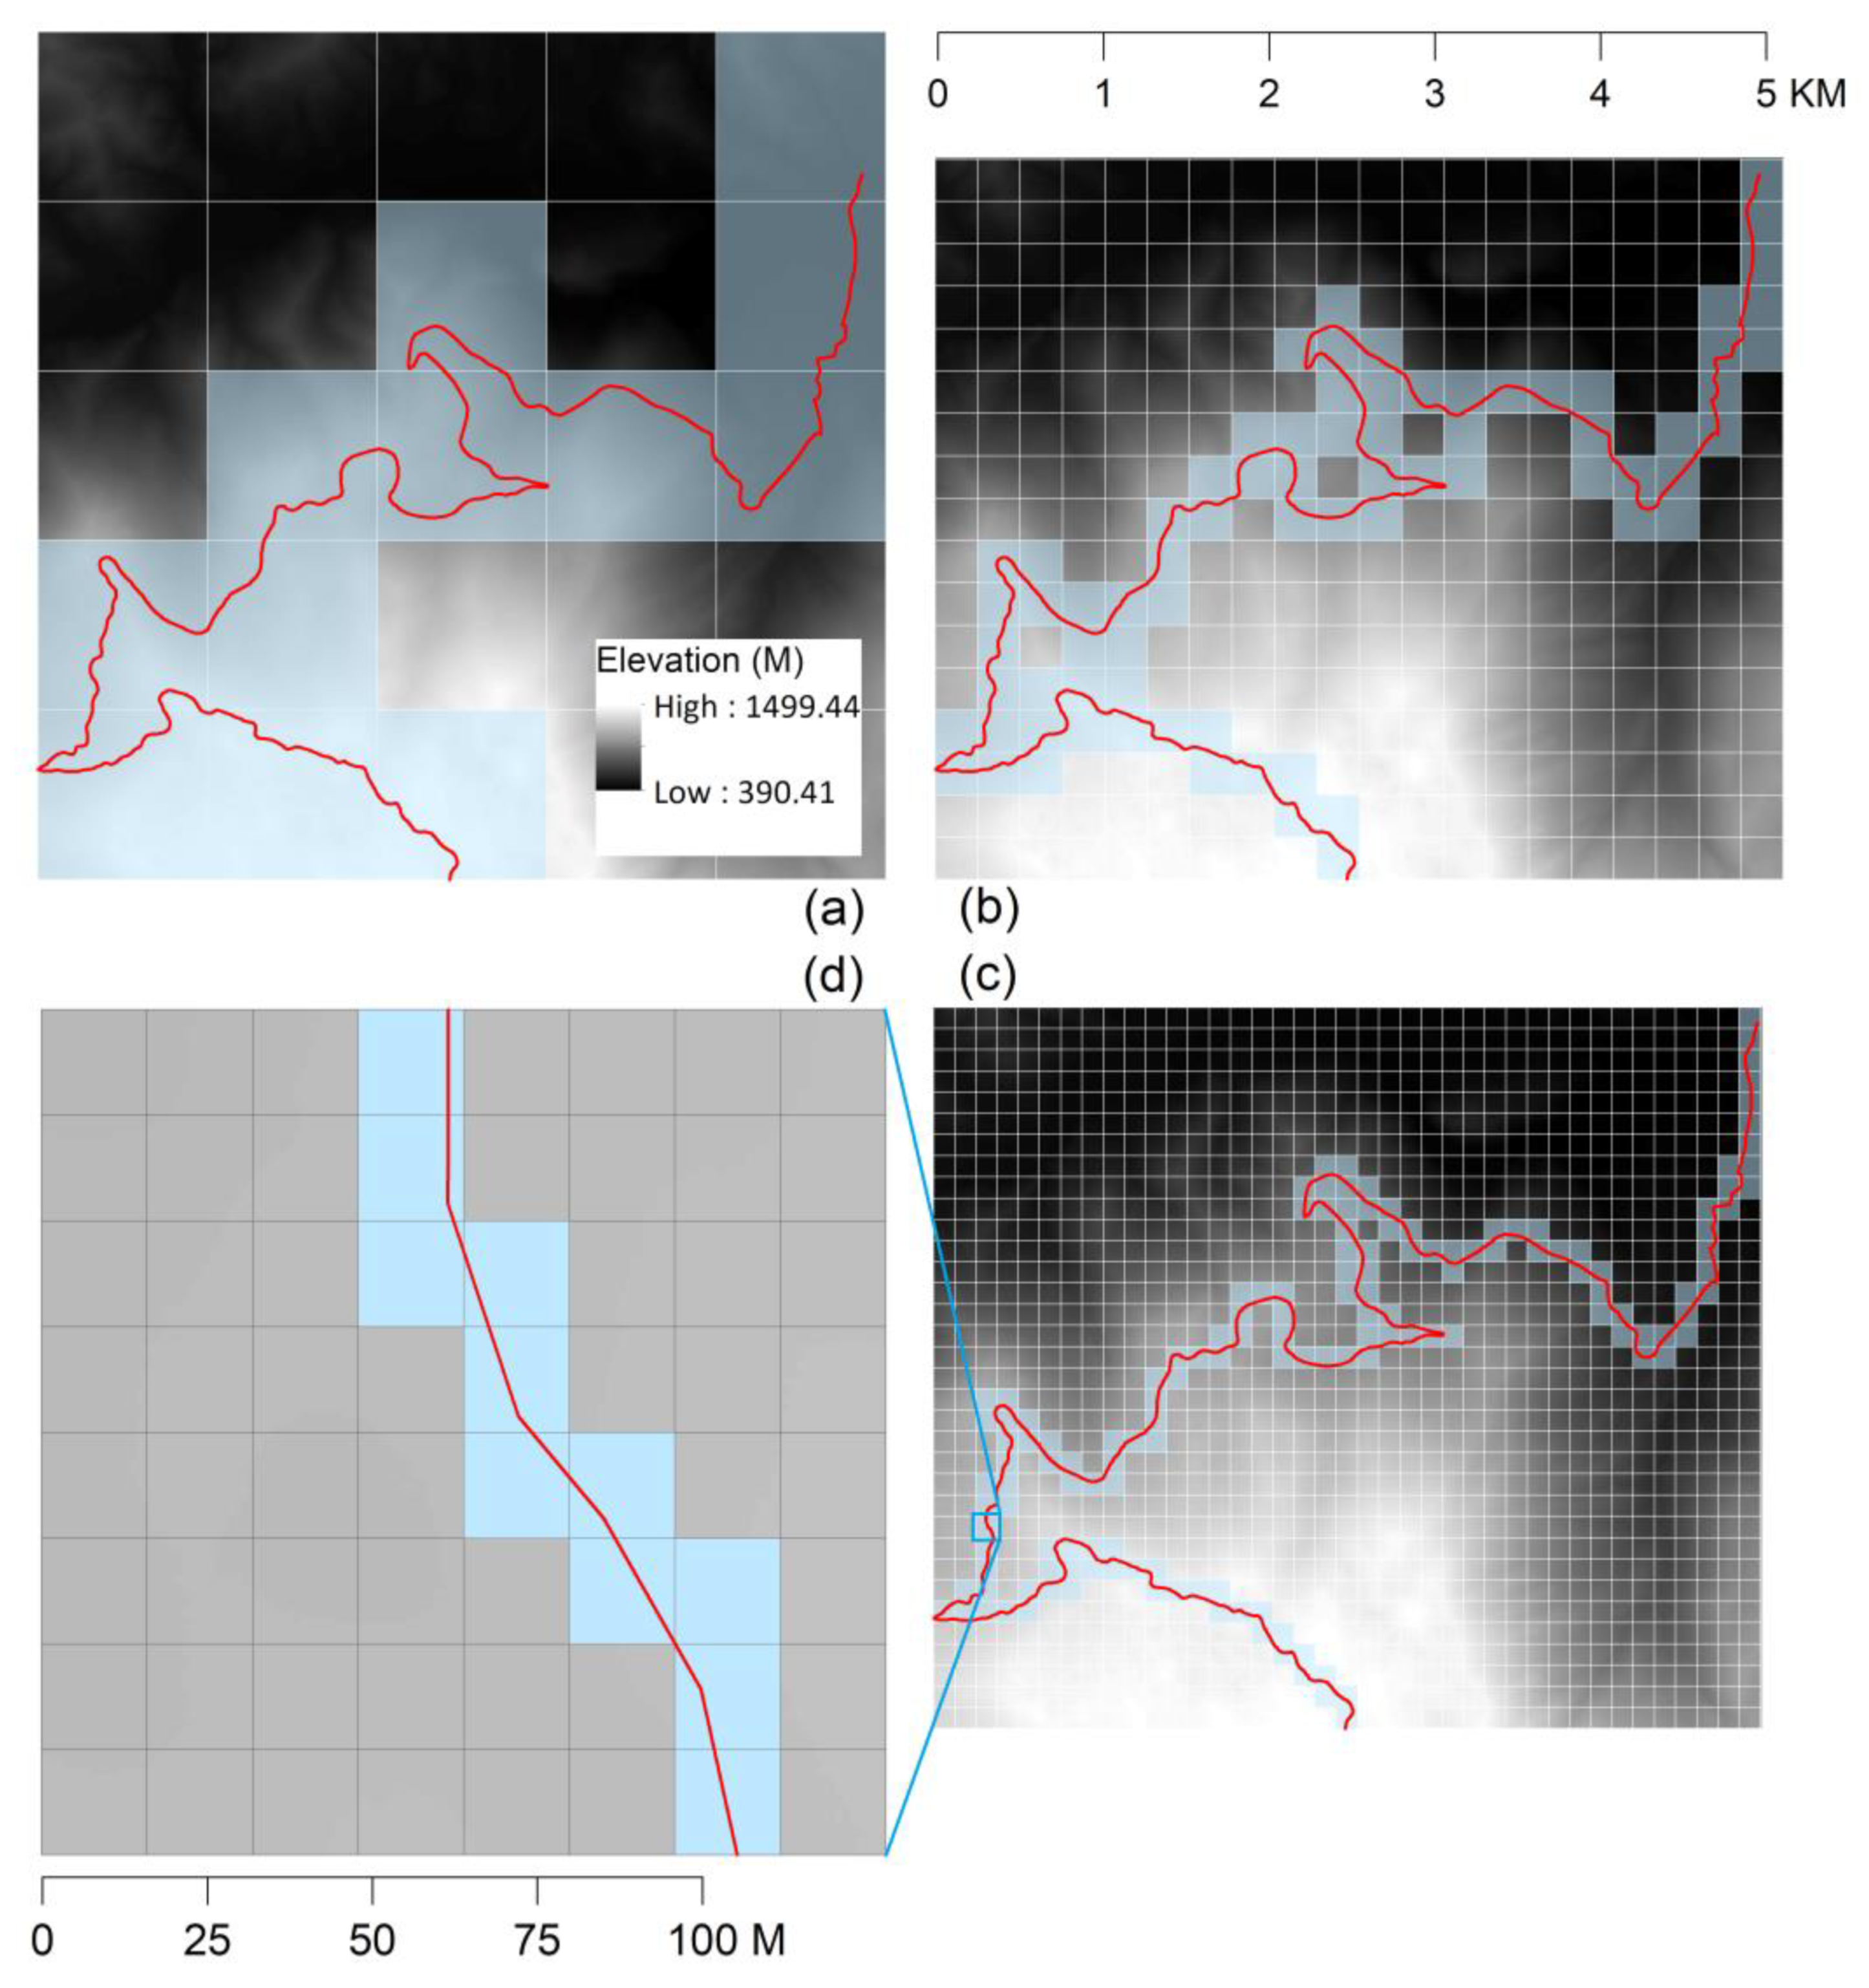
We used a similar procedure to calculate the horizontal fractal dimension of the road (D2), as we suspected that a relationship between D2 and D1 depended on the surface characteristics. The horizontal fractal dimension referred to the distance complexity in the 2D projection of the road. Ten mesh side lengths ranging from 16 to 8192 m were developed for the regression model. Figure 5 illustrates the horizontal variation of this road section from a top-down map view for four distinct mesh sizes, illustrating how the squares overlying the road were identified. It was also visually apparent that this road section was substantially more variable when viewed as top-down than as a vertical profile. The road climbed from the lowest point in the valley in the northeast to the highest point on the ridge in the south. In doing so, it adapted to the surface, so that the path was longer and sinuous.
We introduced certain differences regarding the minimum and maximum square side lengths in the box-counting procedure between the vertical and horizontal fractal dimensions. Unlike the vertical fractal dimension, where it made sense—due to the very fine DTM model—to persist down to the smallest square side length of one or two meters, it did not make sense in the horizontal fractal dimension. Namely, the roads were necessarily smooth features when viewed as top-down at a fine resolution. In addition, the road network dataset used in this study had shortcomings in its accuracy, as indicated in the data section. Figure 5d shows that the shortest straight segment of the local road measured approximately 20 m. For this reason, we used the square side length of 16 m as the minimum value in the box-counting procedure of the road in planar.
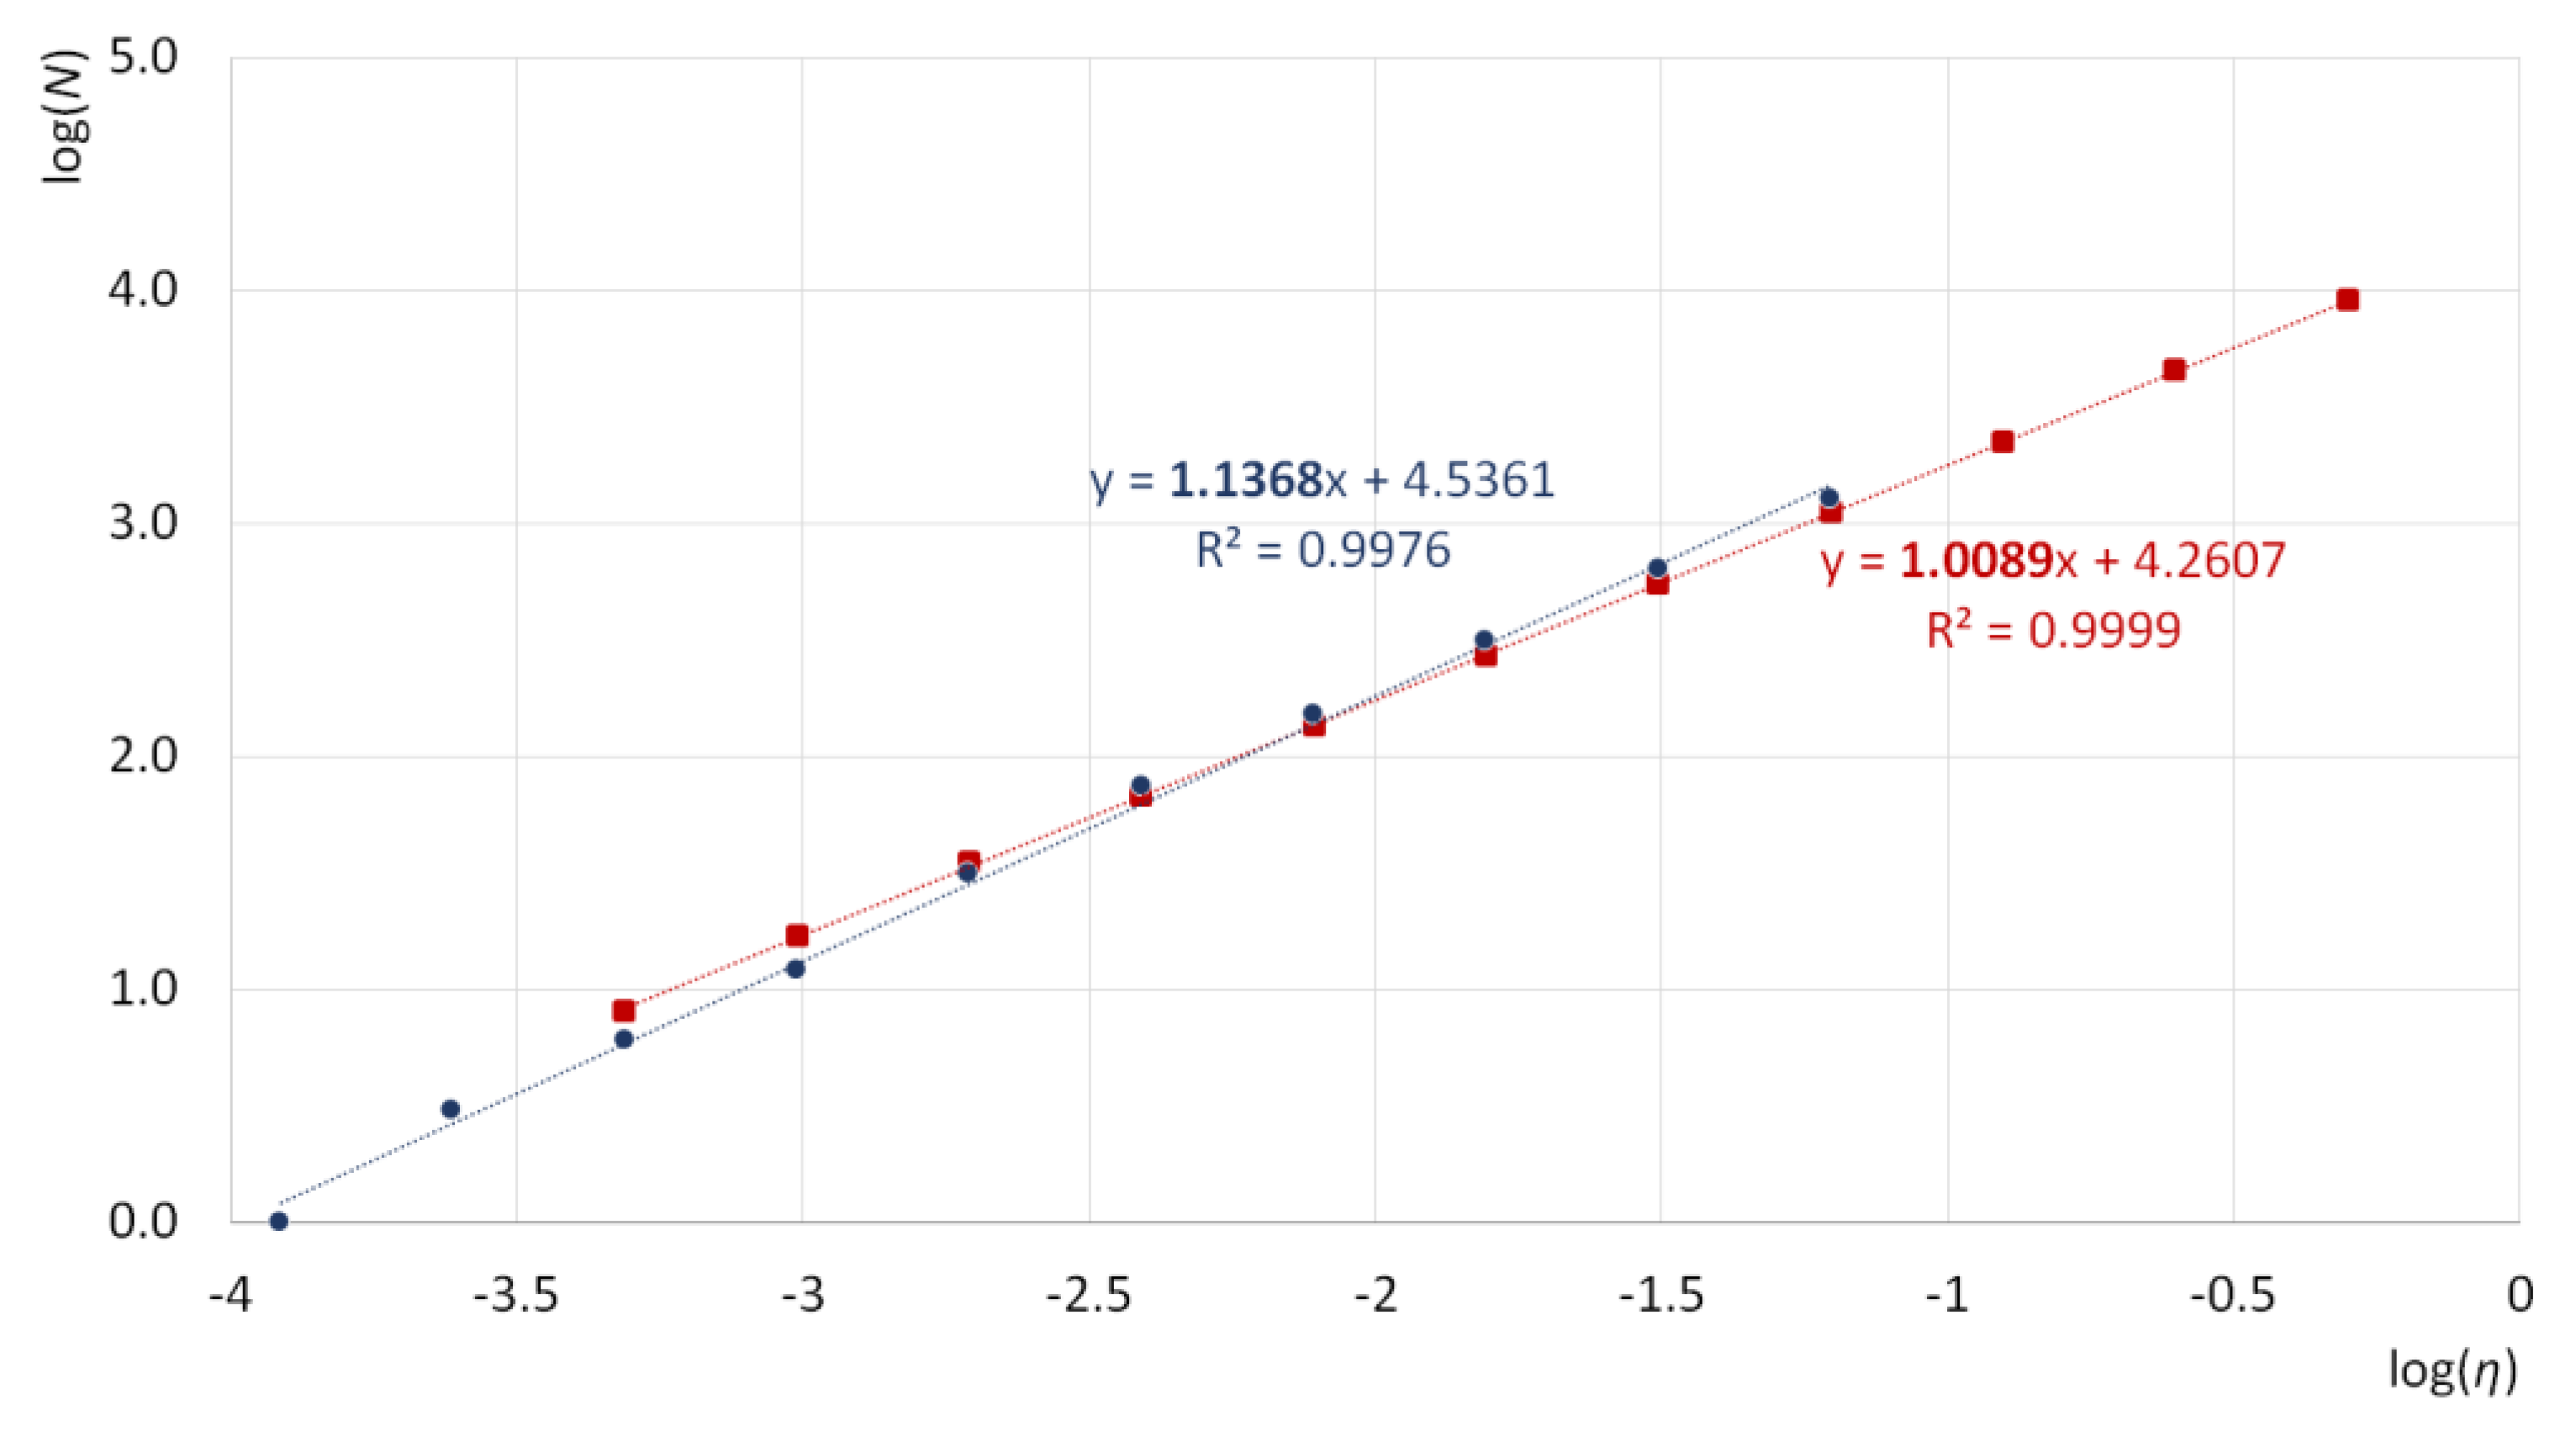
By fitting a regression line to all the paired log(ƞ):log(N) values across the different mesh sizes, D1 and D2 were calculated (Figure 6). Both regressions provided an excellent fit with R2 values greater than 0.997. The vertical fractal dimension D1 was 1.0089. Since this value was only slightly above 1, the road profile visually and in length somewhat resembled a straight line (Figure 4). The horizontal fractal dimension of this road, also shown in Figure 6, was 1.1368. As shown in Figure 5, the road appeared more sinuous in planar than in profile, leading to a larger horizontal fractal dimension.
Figure 6 shows how the eight middle cell side lengths ranging from 16 m (log(ƞ) = −1.2) to 2048 m (log(ƞ) = −3.3) were common to the box-counting procedure in the vertical and the horizontal calculation of the fractal dimension. The results only for the log(ƞ) of the longest cell size length values (8192 m and 4096 m) are shown in the lower left corner, which were only meaningful in the calculation of the horizontal fractal dimension. The results for only the log(ƞ) of the shortest cell size length values (8 m, 4 m, and 2 m)) are shown in the upper right corner, which were meaningful in the calculation of the vertical fractal dimension.

3.3. Experiment 3: Vertical vs. Horizontal Fractal Dimension of Roads

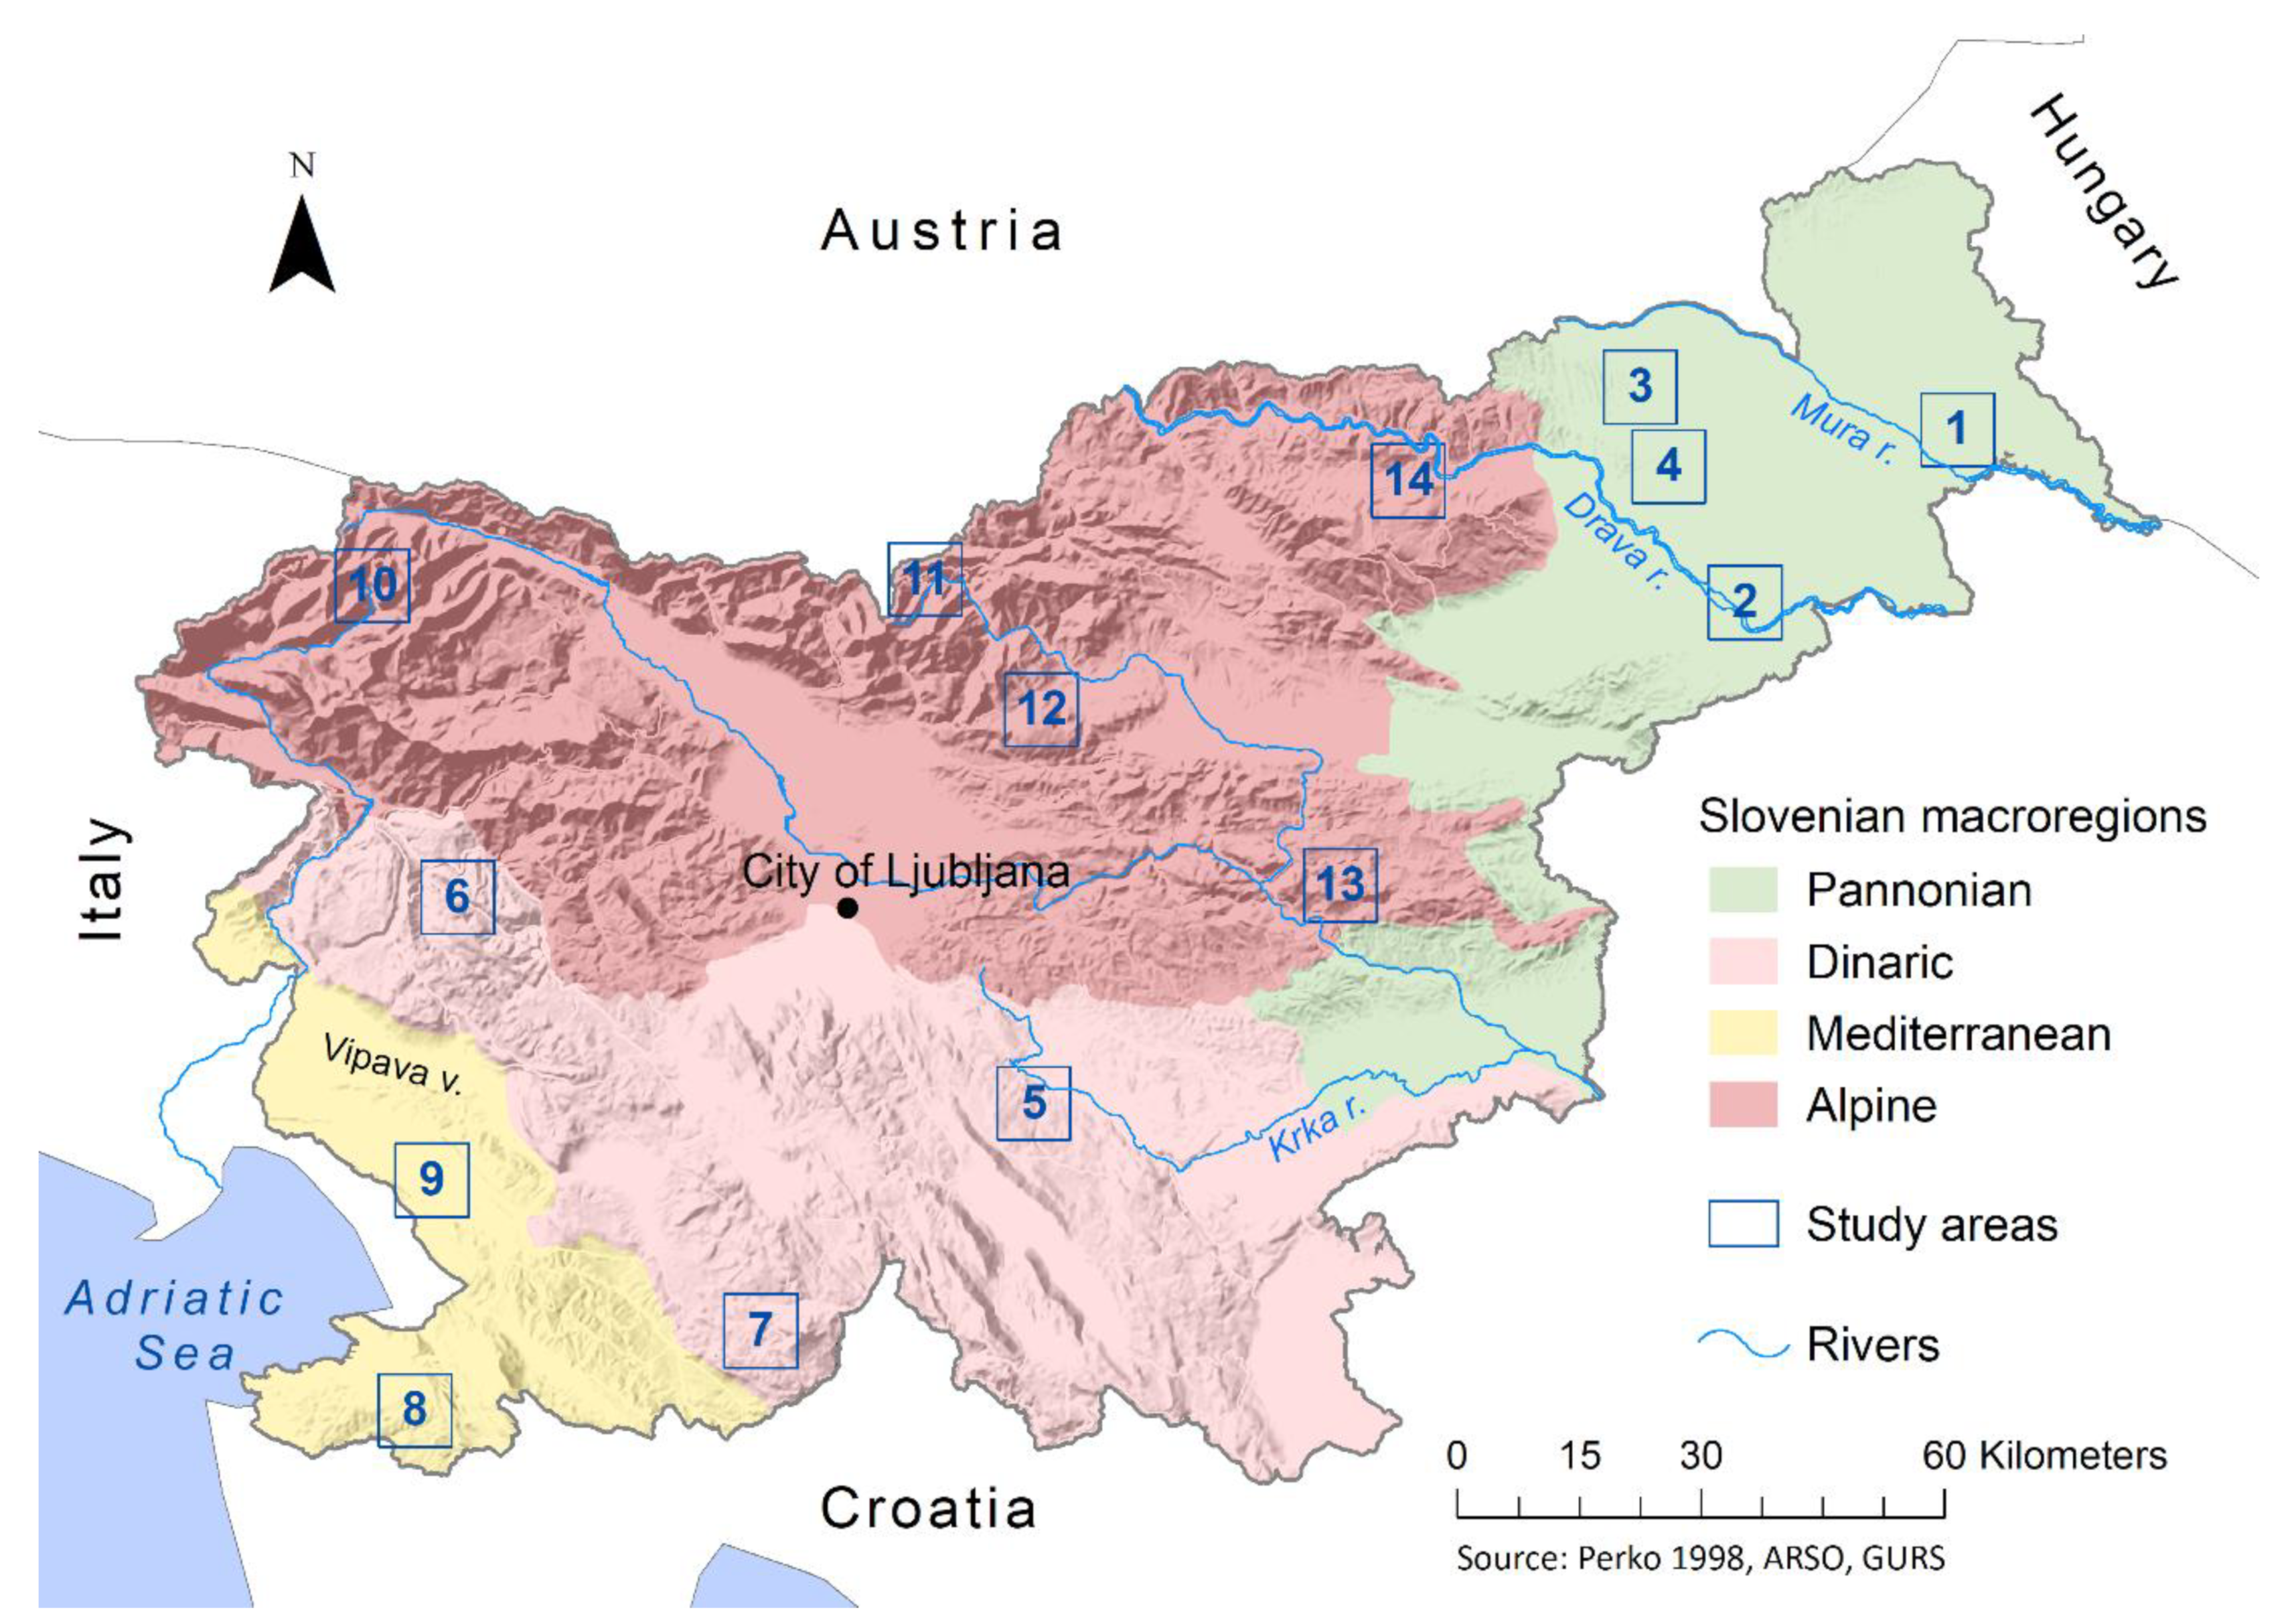
This experiment expanded on the second one to characterize the relationship between the vertical and horizontal fractal dimensions of the roads more fully in a wide range of topographic domains. Fourteen study areas (Figure 7) were selected from all four Slovenian physiographic macro-regions [39]: Pannonian, Dinaric, Mediterranean, and Alpine. Further, the study areas were drawn from four main Slovenian relief units [43]: plains, low hills, high hills (hereafter “hills”), and mountains.
The Pannonian macro-region (Figure 7), a densely populated and intensively cultivated area, is divided into plains and low hills. Two study areas were selected from the plains, one along the Mura River (site 1) and another along the Drava River (site 2). Two low hilly areas, both between the Drava and Mura rivers (sites 3 and 4), were also selected from this region. Towards the southwest, the Pannonian macro-region transitions to the Dinaric macro-region. Three plateau-like study areas were selected there. The first was a low hilly site that was divided into two parts by the Krka River valley (site 5). The next two areas were in hills, the first of which was more dissected (site 6), while the second occupied a high plateau (site 7).
The Mediterranean macro-region was divided into flysch low hills and karst plateaus. This region’s first site (site 8) was dissected by a dense network of streams and rivers, while the second area (site 9) stretched above the Vipava valley. The Alpine macro-region was located in northern Slovenia. Two study areas were selected from the high mountains (10 and 11), which were dissected by deep, glacially shaped valleys. On the margins of the high mountains, the next area (site 12) distinctly featured karstic and forested plateaus, namely Gornji Grad, known from the previous two experiments. The last two study areas were Alpine hills and were located in the eastern part of the Alpine macro-region (sites 13 and 14).
A road section was selected that fit within each nine-by-nine km site. Preference was given to the higher order road categories, i.e., larger roads while excluding motorways or highways. This was because the latter took less account of relief features and were routed more directly through tunnels and over viaducts. The intention was to select roads representative of these distinct regions that were not subject to substantial landscape engineering. Once the road sections were selected, their vertical and horizontal fractal dimensions were calculated using the procedures laid out in Experiment 2.
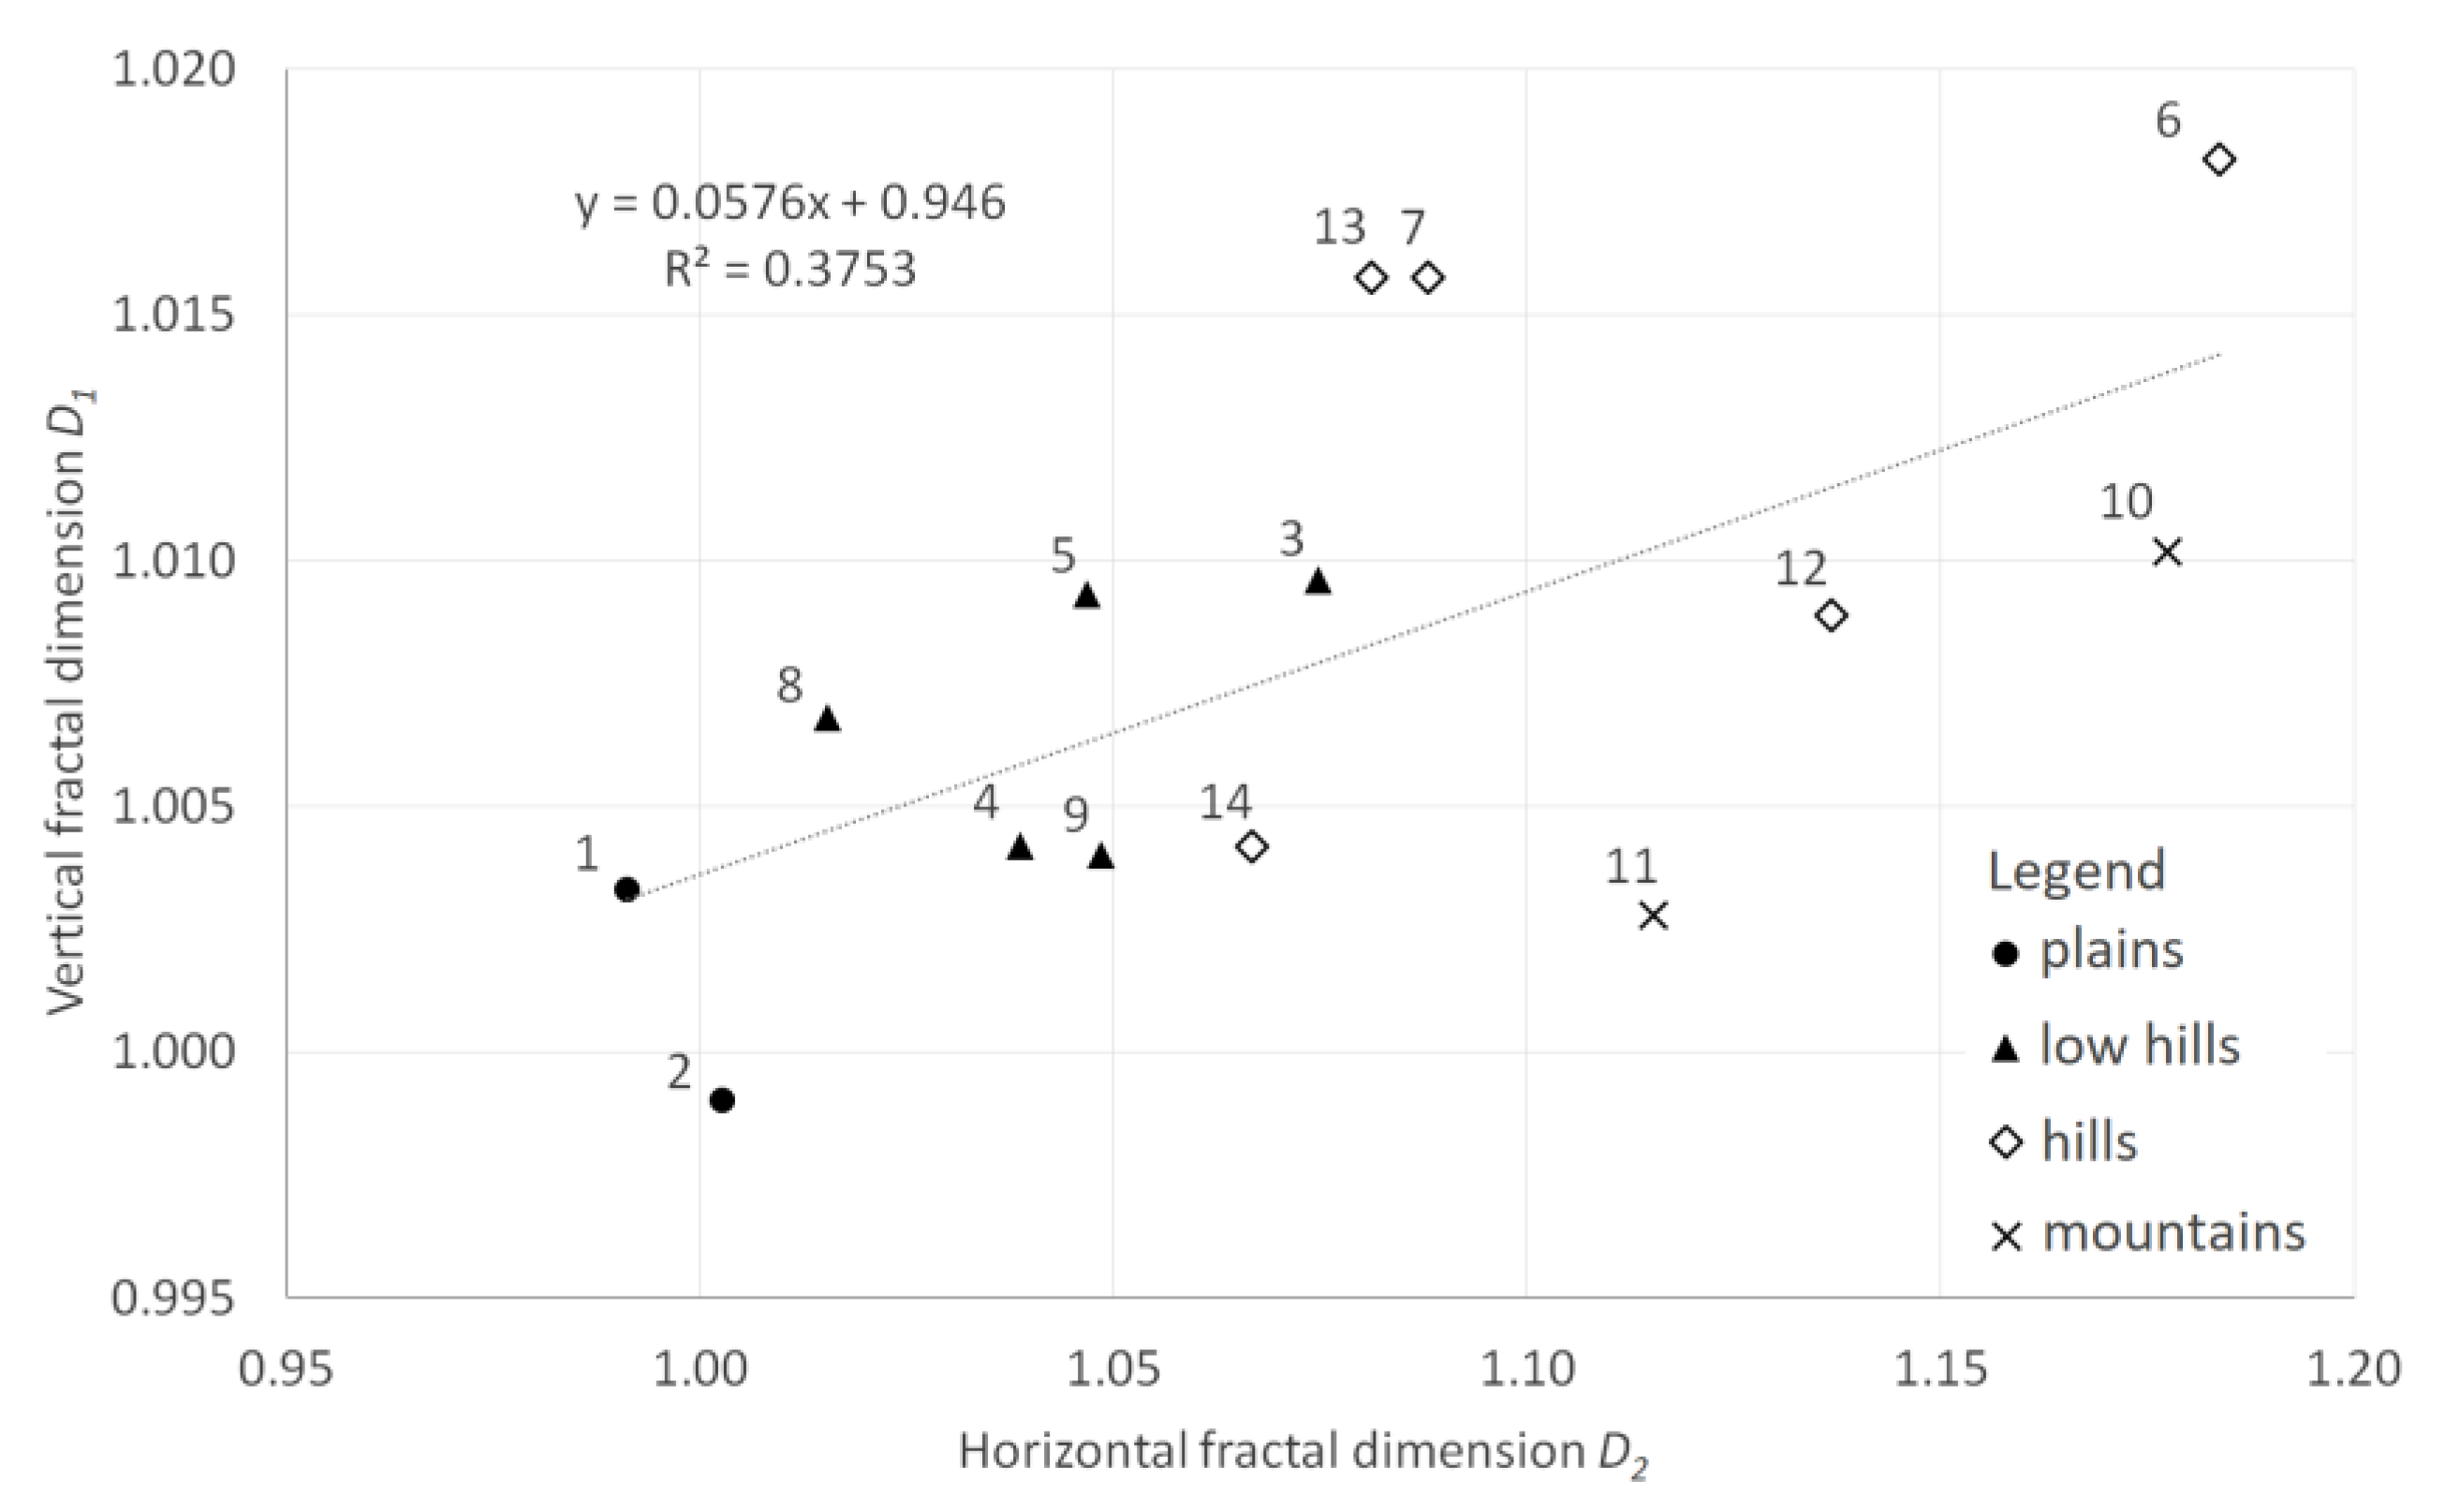
The results for all fourteen study areas are presented in Table 4 and in Figure 8, where the horizontal axis depicts the horizontal fractal dimension D2 and the vertical axis the vertical fractal dimension D1. Three important characteristics of this relationship were apparent. First, the D2 values were generally larger in magnitude than D1, suggesting that the magnitude of D1 was limited along the roads. Second, the scatterplot of the observations showed a positive correlation between D1 and D2. The sites with a low vertical fractal dimension also tended to have a lower horizontal fractal dimension. A linear regression analysis was applied to quantify the strength of this relationship between the vertical and horizontal fractal dimensions. The model’s slope was positive, while the R2 was 0.38 (Figure 8).
Third, the magnitudes of both fractal dimensions were strongly affected by the topography of the study sites. The lower left portion featured road sections in plains, while the sites in low hills had somewhat higher values in both dimensions. The vertical fractal dimensions for the low hills sites ranged from 1.0040 (site 9) to 1.0096 (site 3), while their horizontal fractal dimensions ranged from 1.0155 (site 8) to 1.0748 (site 3). The five hilly study sites were arranged from the more central part of the graph to its upper right, with the widest variation in both fractal dimensions of all the topographic classes (for D1, 1.0042 at site 14 to 1.0182 at site 6; for D2, 1.0667 at site 14 to 1.1837 at site 6). In comparison to the hilly sites, the road sections in the two mountainous sites had relatively low vertical fractal dimensions (1.0028 and 1.0102). The mountainous study site 11 had a vertical fractal dimension smaller than all the hilly and low hilly study sites and even one study site in the plains (site 1). The horizontal fractal dimension of the mountainous study sites ranged from 1.152 to 1.174. Evidently, mountainous terrain presented physical constraints that resulted in roads trading higher horizontal fractal dimensions for lower vertical fractal dimensions, a tradeoff that was not required in non-mountainous relief units.
The sites falling in the same relief unit category were relatively concentrated, as shown in Figure 8, which occupied distinct portions of the data space. Taken together, the vertical and horizontal fractal dimensions, therefore, appeared to capture the manner in which topography affected the path by which the roads traversed the landscape.

4. Discussion

The comparison of our work to the prior studies presented in Table 2, which applied the fractal dimension in the transportation network analysis, found both commonalities and differences across a range of topics (Table 5). Six of these studies used GIS as the software environment to perform at least a portion of the research. In addition to our research, half of the existing studies used the box-counting method. Other fractal dimension methods have also been applied, as listed in Table 5. Two studies compared five different methods for calculating the fractal dimension.
Our study was the only one to cover non-urban roads, while other studies strictly focused on the urban transportation network. Three studies analyzed urban road networks, and one dealt with the urban surface public transportation network.
Surprisingly, in addition to our research, four other studies applied the proprietary software ArcGIS, since there are many other proprietary and open-source GIS software available. One study also used the ArcGIS Network Analyst extension. Only two studies highlighted the use of the computer program BENOIT, which is specialized for calculating the fractal dimension and for which it is necessary to prepare the transportation network layer as a raster image.
Our fractal dimension calculation was vector-based, and was the only study that used a DTM, as it was the only one dealing with the vertical dimension. Other research used variants of the vector and raster transportation network models, with transformations being necessary in some cases. Only two studies used OpenStreetMap vector data, which we believe may represent a more up-to-date and accurate database. Only one study compared the fractal dimensions between two time periods at ten years apart.
Experiment 1 demonstrated that the average slope of a 3D road section was directly related to the length difference between the 3D and 2D for that section. In this experiment, the length difference arced upward very smoothly to a slope of about 45 degrees. Higher up, the relationship varied more widely, perhaps in part due to the smaller number of road sections with such steep gradients. Even in the sections with moderate average slopes, the length differences varied by half a meter (10% of the total planar length) or more. These findings indicated that the use of plan models in regions with high gradients systematically underestimated the actual road distance, with errors propagating to any subsequent analysis using those distances. If analysts want to characterize roads in such environments as realistically as possible, their 3D lengths must be taken into account. The high quality of the regression model suggests that the slope of a road section may be used to accurately estimate its 3D length.
A limitation of this work was the positional error in the road network data. This error propagated into the slope information obtained along the network. We obtained a number of road slope values that we assumed were exaggerated or unreasonable. We mainly were concerned with values above 20 degrees, although we believe that some of them were also possible, since Gornji Grad is a very hilly and topographically diverse region. However, in a number of places that we manually checked, the road line was offset horizontally by up to 13 m from the road surface presented in the DTM. Instead of following the actual road alignment, the vector road line crossed steeper terrain near the actual road alignment. As a result, the slope of the road line was too high and did not correspond to the slope at the actual position of the road.
Experiment 2 investigated the fractal dimension directly. We believe this was the first study to separately calculate the vertical fractal dimension and contrast it to the horizontal fractal dimension. Furthermore, the use of the vector-based method outlined in this experiment made the results in the vertical direction readily comparable to those of the horizontal. In both cases, the use of box counts at different scales resulted in pronounced linear relationships, making the regression-based estimation of the fractal dimension reliable. The vertical fractal dimension was very close to 1 in this single case study, while the horizontal fractal dimension was higher, closer to 1.1. This was understandable from a visual assessment of the entire vertical profile of the road section shown in Figure 4, which appeared almost like a straight line. The vertical variability in this road profile only became apparent at the larger spatial scale in the inset of this figure. In contrast, the horizontal variation of the section was visibly larger, as shown in Figure 5. Nevertheless, the horizontal fractal dimension of this road was still small compared to Koch’s snowflake, with a fractal dimension of 1.2618 [16], indicating that the road was relatively smooth compared to the much more complex snowflake. In this study, we were able to show that roads are smooth features when viewed at high resolution, which was not the case for a snowflake or a coastline.
We note here that our results were, to some extent, due to the spatial scale of our road measurements. A more detailed data scale, either in the planar or for the vertical, could theoretically return a higher variability. However, it was important to consider the limits of fine-scale variability related to the passage of vehicles along a road, namely (1) substantial vertical changes at scales finer than the circumference of automobile wheels (about two meters); (2) a vertical variation greater than a vehicle’s ground clearance at scales finer than the vehicle’s length; and (3) planar sinuosity greater than a vehicle’s turn radius. These limits on scale variation, with respect to vehicles, meant that roads below the 3–5 m scale must be relatively smooth. Large-scale, one-meter DTMs such those used in this study, therefore, appeared to be sufficient to reliably estimate the fractal dimension at spatial scales relevant to transportation applications.
A related finding of this work was that the spatial scale of analysis was different for the horizontal and vertical fractal dimensions of the roads. The advantage of using a DTM with a high resolution 1 × 1 m was fully expressed only in the vertical dimension. This was not the case with the horizontal fractal dimension, since the roads were planimetrically smooth features at resolutions below a few meters; a smoothness which was further compounded by the generalization of our road data. The box-counting calculation with a square side length of less than 16 m was, therefore, not meaningful on this road dataset. A reasonable minimum square side length would be much higher for expressways and highways due to the higher speeds and smoothness these road categories require.
Experiment 3 extended the analysis by investigating the variation of the vertical and horizontal fractal dimensions across the different geographical regions and relief types. In general, the positions of the study sites shown in Figure 8 were arranged along the diagonal from the lower left to the upper right corner, reflecting a sequence of plains, low hills, hills, and mountains. In terms of the horizontal fractal dimension, the mountain sites were most similar to the hill sites, but generally had a lower vertical fractal dimension. We speculate below why this might be.
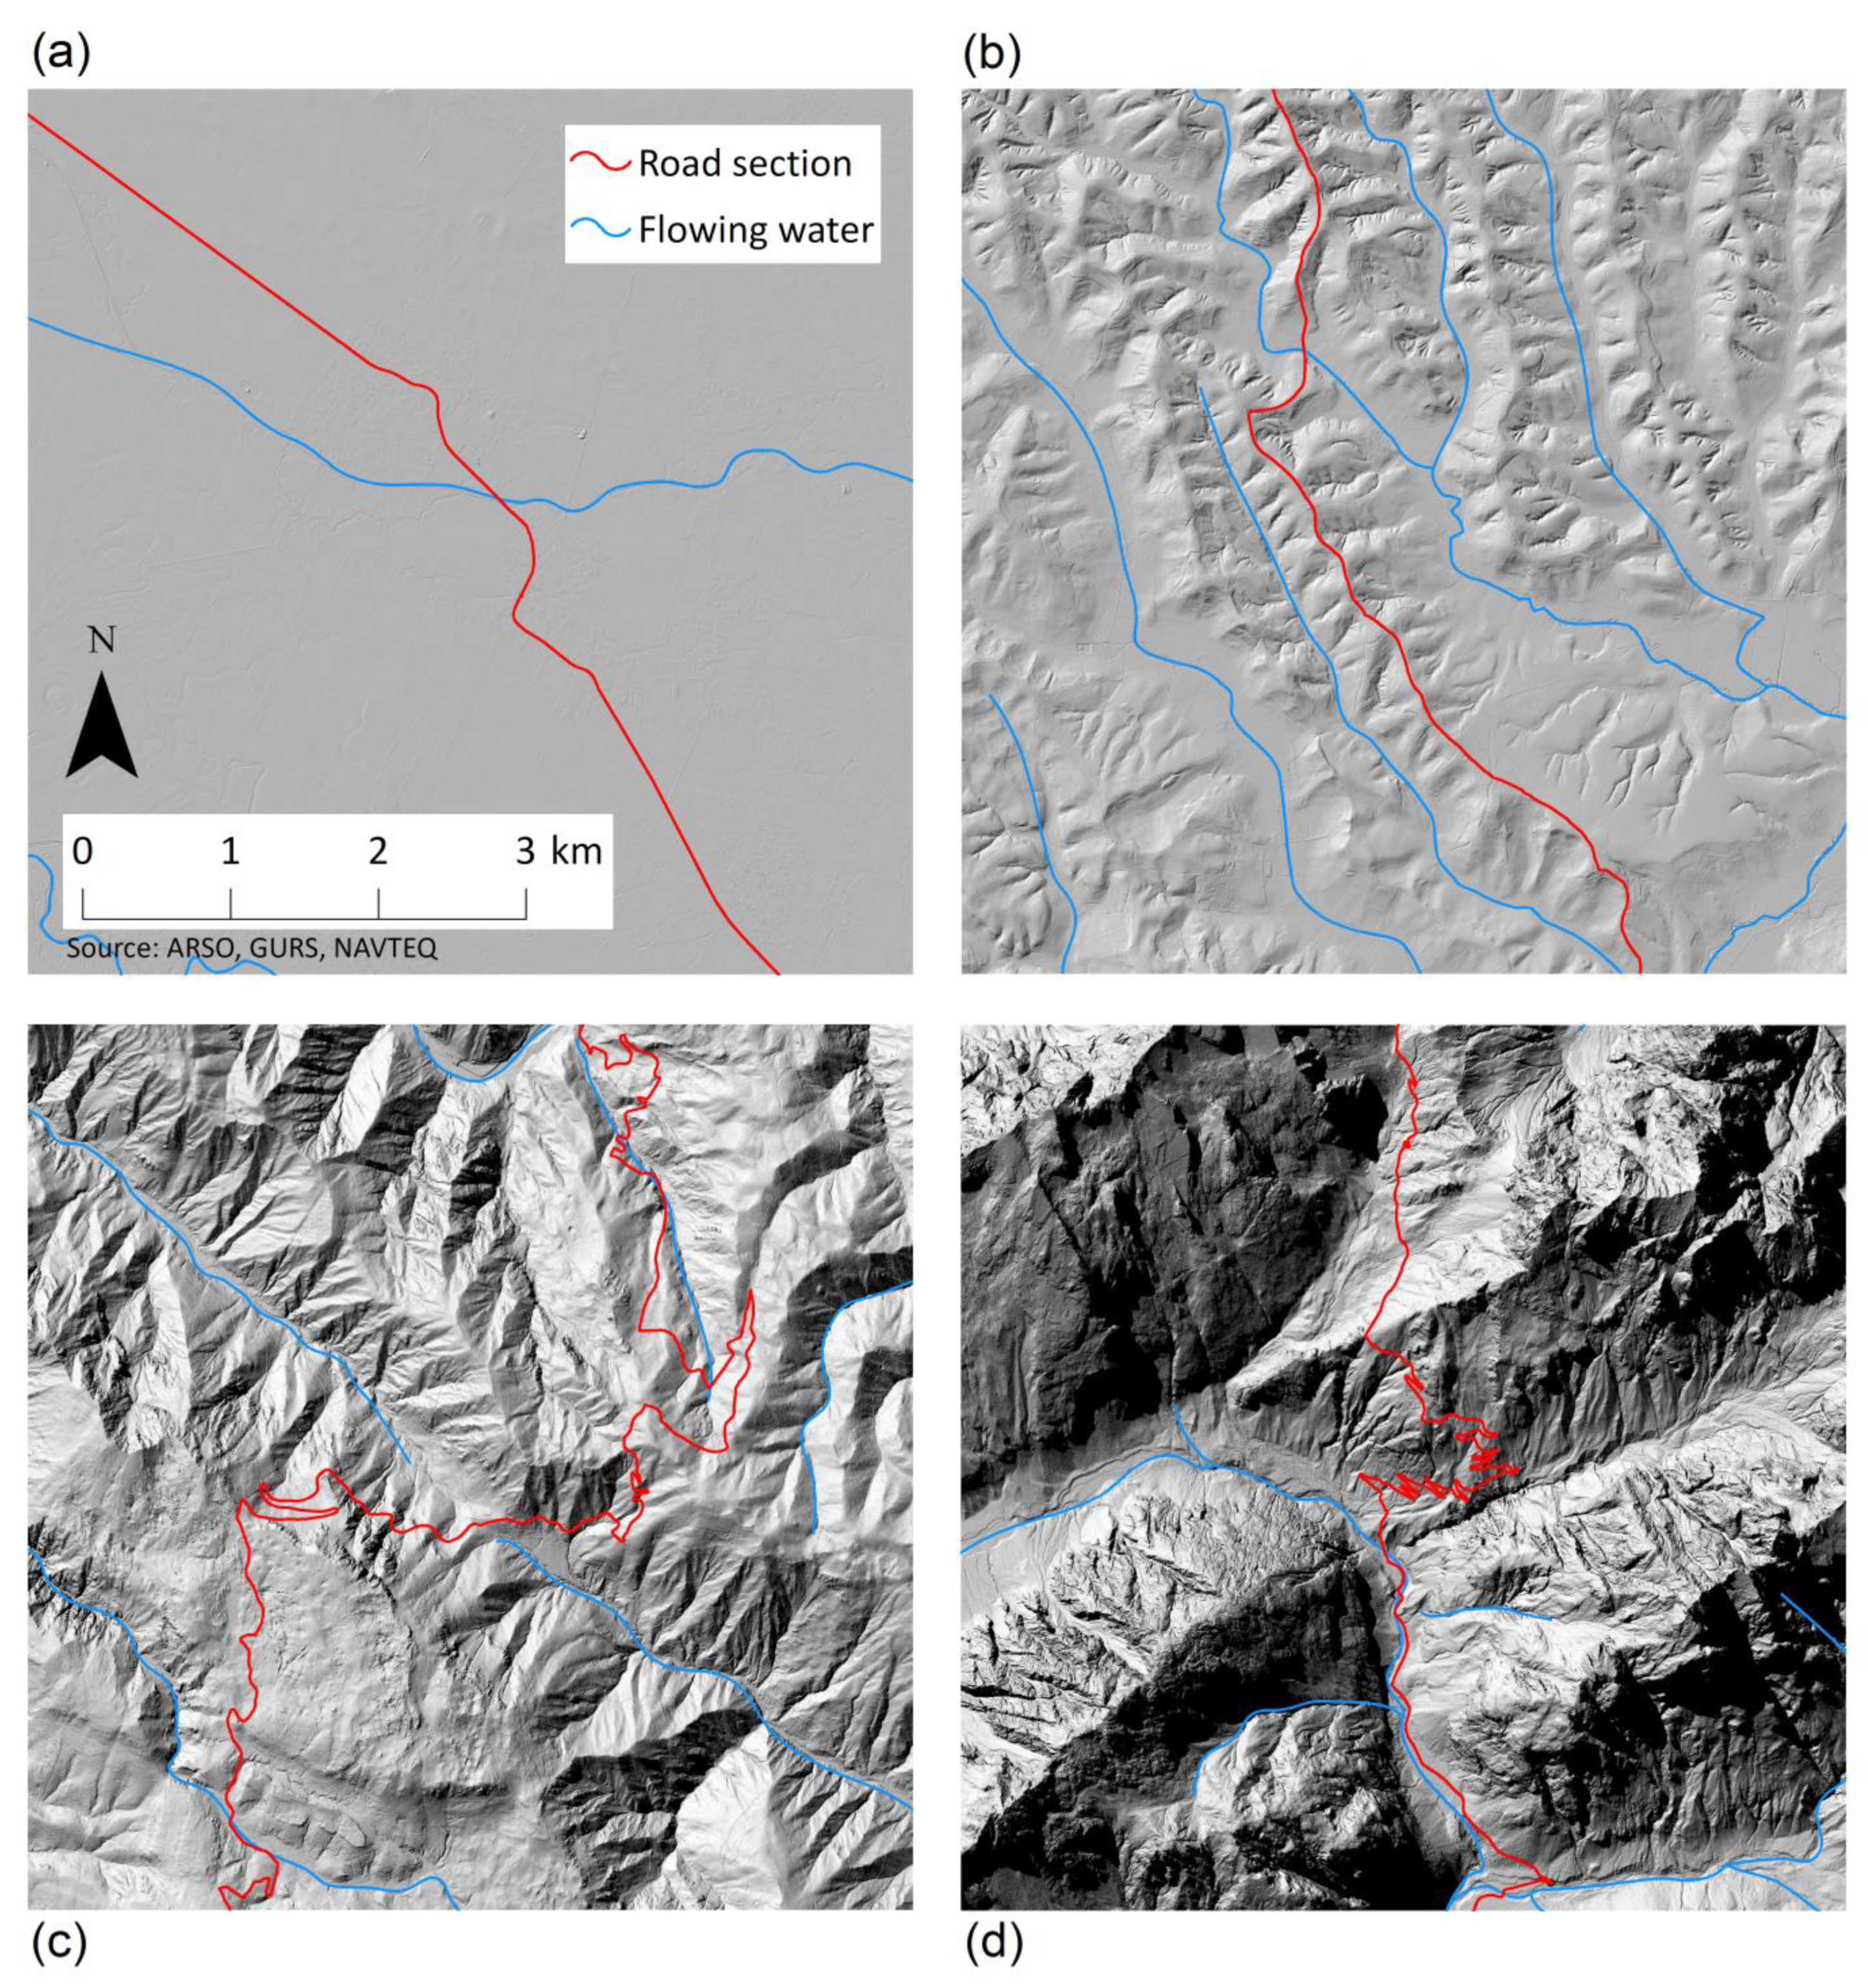
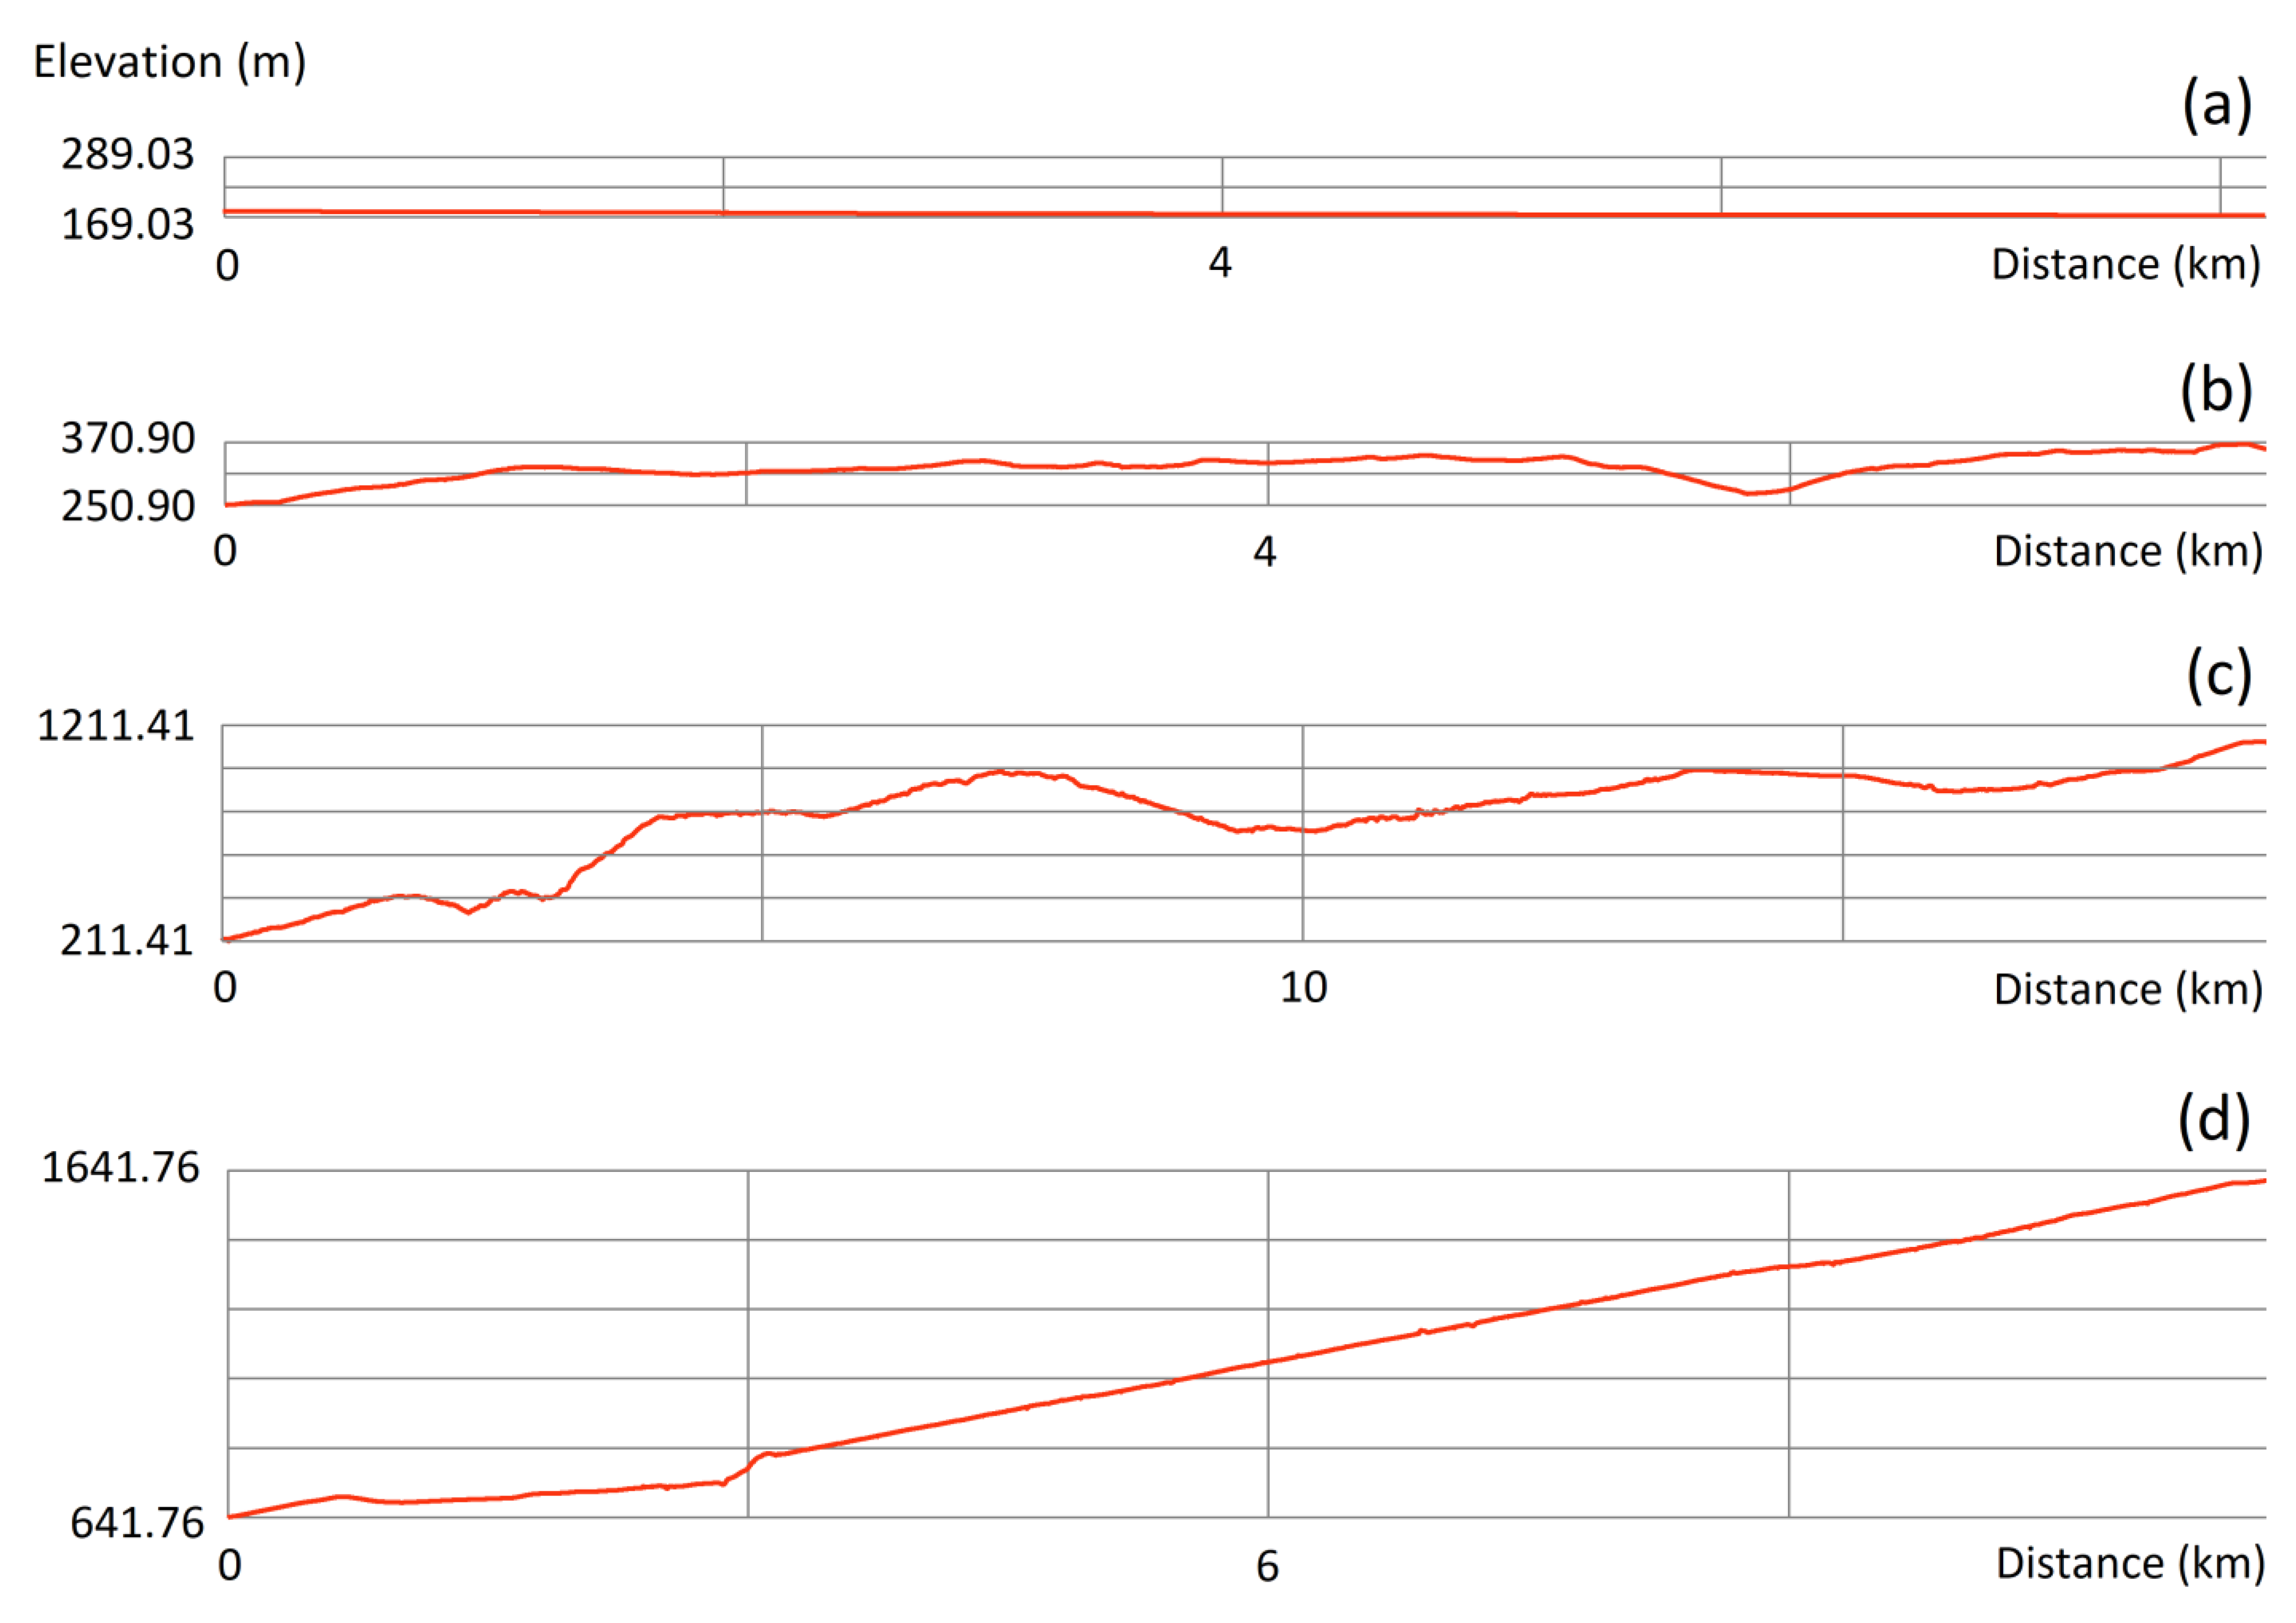
Figure 9 shows a top-down view on 6-by-6 km excerpts of the four study areas (plain, low hills, hills, and mountainous terrain) presented in Figure 7 and their road sections overlaid on a shaded relief from the DTM used in the study. The differences in the surface variations are visually apparent. Site 1 on the plain (Figure 9a and Figure 7) looked nearly flat. Geologically, its former valleys were filled with gravel and sand by the Mura River at the end of the past glacial period. It is a traditional agricultural landscape dominated by regularly shaped fields. As a result, the road was not very winding, and its deviations were more due to the two clustered settlements it serves than to topographic obstacles. The vertical profile of the same road section was a straight horizontal line (Figure 10a).
In the case of site 3, a low hills site (Figure 9b and Figure 10b), the terrain consisted of low ridges running from the northwest to southeast separated by straight-running valleys. The settlements in this agricultural landscape were dispersed, and the homes were arranged in long rows along the ridges. The studied road ran along one ridge and crossed a small valley in the upper part of the site (Figure 9b). In this planar view, the road adapted to the topography and was more winding than that on the plains. This resulted in a higher value for the horizontal fractal dimension. Due to the characteristics of the terrain, the vertical profile was visually rougher than the plains site (Figure 10b). On the right side of this graph, we can see a noticeable depression that represents the crossing of the valley.
The hilly terrain of site 6 looked quite different from the previous two (Figure 9c). Its location was at the transition between the Alpine and the Dinaric regions, and the area represents a landscape of undulating plateaus, into which rivers and streams have cut deep valleys and ravines. Individual rounded peaks rise above river valleys and plateaus. There was little flat terrain except on the higher plateaus. The landscape was sparsely populated [44]. The selected road looked very winding from the top-down view (Figure 9c) as it crossed this terrain. The lower left road crossed a relatively flat plateau, then in the middle descended into and crossed a valley that ran along a tectonic fault in a northwest to southeast direction. The vertical profile of the road was the roughest of all four cases (Figure 10c). On the left, the course of the road across the flat plateau was clearly visible. It then crossed the valley in the center and rose to the right. Due to the pronounced variation of both the horizontal and vertical profiles, the relatively high values for both fractal dimensions were not surprising.
The mountain area of site 10 (Figure 9d) was characterized by exceptional picturesqueness and landscape diversity. The surface was relatively young, as evidenced by deeply incised valleys. Above them rose narrow mountain ranges and ridges with pointed peaks. The slopes were steep and the valley sides acted like walls. Settlements were sparse and uneven, and an important economic activity is tourism [44]. The road generally ran along the bottom of the alpine valley in the lower half of the site (Figure 9d). In the central part, it began to climb intensively towards the high pass. First, it climbed in a serpentine manner along the southern slope of the mountain, then crossed the ridge and, with a few switchbacks, climbed up the gentler opposite slope towards the pass. The serpentine part of the road was the most variable part of any road in this illustration (Figure 9), and indeed this road almost had the highest horizontal fractal dimension (Table 4 and Figure 8). The vertical profile of the road could be divided into two main parts (Figure 10d). The left side slopes more gently but generally rose slightly as the road ran along the valley floor. The right side climbed steadily at an almost constant rate, even in the serpentine area. Compared to the hilly vertical profile (Figure 10c), the mountainous one was less rough, resulting in a lower vertical fractal dimension. It was apparent that road builders in mountainous areas with major vertical obstacles may trade directness in the planar for reductions in the gradient. The fractal consequence of this was a larger horizontal fractal dimension and a relatively smaller vertical fractal dimension compared to that seen on roads in the hills.
Several additional limitations and future directions of this study are worth noting. First, we strongly recommend using the most accurate possible road dataset. The positional error in the road data can affect various calculations, such as the elevation difference and slope along the road, horizontal road distance, and indirectly, the length difference between planar and surface road lengths.
Second, although there are only four macro-regions in Slovenia, there are many submacro-regions and mesoregions, which differ significantly from each other in terms of their geological and topographical character. Experiment 3, therefore, by using 14 study areas, i.e., two to five study areas for each macro-region, comprehensively evaluated the diversity of the influences of the Slovenian landscape on its roads, but only to a certain extent. Since the preparation and analysis of the data for each study area was time consuming, an important next step would be the automation of the important phases of the analysis, such as the selection of the individual sites, the selection of a road section within a site, and the calculation of both fractal dimensions.
Third, we encountered a limitation with the ArcGIS ArcMap software, which allowed for a maximum size of 2 GB for the fishnet output file. For large areas, this cap limited the reduction in the cell sides to the desired small sizes. Fourth, it would be interesting to consider both fractal dimensions of the roads in relation to more specific relief features, such as the relief coefficient or surface undulation [45]. Fifth, it would be interesting to consider the entire road network within each study area instead of one typical road section. This would, of course, require additional computer resources and time.
Finally, the estimates of the fractal dimension of the roads, both vertical and horizontal, were quite sensitive for several reasons. (1) Especially in the case of the vertical dimension, the roads may have had small degrees of curvature. (2) The size of the study area and the resulting road coverage affected the estimates. (3) The chosen square side lengths for the box-counting process were known to affect these estimates as well. This concern prompted us to define a clear, uniform, and sophisticated methodology that could account for topographic diversity.
We conclude this section by considering a few potential applications for the vertical fractal dimension of roads. First, the method is clearly useful for improving the estimates of the actual travel distances, as widely used planimetric techniques are not capable of detecting vertical distances, resulting in a persistent underestimation of route distances. Length underestimation is likely higher on high local relief non-vehicle routes, such as trails, and in other contexts like terrain profiles, where the vertical fractal dimension may also be useful. Second, the vertical fractal dimension provides insight into the tradeoffs involved in road placement, slope, and roadbed engineering in different types of terrain. Finally, its relationship to the slope and curvature deserves more study, as it may be a useful new terrain “derivative” for a range of landscape analyses.

5. Conclusions

In this article, we addressed a series of questions about road length and its relationship to the horizontal and vertical components. We conceptualized the road length complexity in an innovative way, in connection with fractal theory. We introduced the term vertical fractal dimension of roads and developed a new vector-based approach for performing box counting to measure the vertical fractal dimension of roads.
The important relationships with the vertical fractal dimension may have been missed in former studies, including the relationship of the road distance to elevation change, the relative contributions of the horizontal and vertical fractal dimensions to distance, and the role of spatial scale on the vertical fractal dimension. Therefore, concepts for the vertical fractal dimension and formal methods to measure it had to be developed, along with assessments for the relationships between both the horizontal and fractal dimensions, topography, and road network properties.
We expect the horizontal fractal behavior of roads to persist down to approximately 16 m for minor roads. With 16 m length sides, we generally met the scale at which vehicles interface with them. For coastlines, which were one of the first objects of fractal analysis e.g., [14], “the closer you look the more you see” applies to finer and finer detail until the definition of coastline breaks down. However, this was not the case for roads, which are necessarily smooth features when viewed at a fine resolution. We expect the fractal behavior of roads to persist to some limiting fine scale, which depends on the category of the road. This finest scale might be the shortest on local roads, where the shortest straight road sections in our road dataset were no longer than about 13 m. On major roads, where individual straight road sections can reach up to approx. 120 m long, we would observe a fractal behavior ending at these length scales. Fractal persistence at fine scales would be the lowest on highways, where rather long smooth road sections can reach a maximum length of approx. 1500 m. Nevertheless, future research would be very valuable to investigate the fractal behavior of roads of different categories, e.g., local roads and main roads, both in the horizontal and vertical dimensions. In our experience, future work should use the most up-to-date and accurate road database, for example OpenStreetMap.
A study of the relationship between the vertical and horizontal fractal dimensions of roads was conducted according to the type of relief. The use of topographic regions in this study suggested that the results could be expected to apply to similar topographic regions elsewhere. However, certain caveats presented above are necessary.
In any case, this work and its results represent a useful contribution, both theoretically for the separation of the planar and vertical fractal dimensions and its calculation, as well as for its practical value in the field of transport modeling and planning. These methods can allow analysts to better estimate road distance and complexity, and to link road undulations to fuel consumption, tire wear, and emissions. The implications for more efficient and environmentally sustainable transport systems should be of interest to planners, policy makers, and the public.

Author Contributions

Conceptualization, Ashton M. Shortridge and Klemen Prah; methodology, Klemen Prah and Ashton M. Shortridge; validation, Klemen Prah and Ashton M. Shortridge; formal analysis, Klemen Prah; investigation, Klemen Prah and Ashton M. Shortridge; resources, Klemen Prah and Ashton M. Shortridge; data curation, Klemen Prah; writing—original draft preparation, Klemen Prah and Ashton M. Shortridge; writing—review and editing, Klemen Prah and Ashton M. Shortridge; visualization, Klemen Prah. All authors have read and agreed to the published version of the manuscript.

Funding

This research received no external funding.

Data Availability Statement

The data presented in this study are available upon request from the corresponding authors. The data are not publicly available due to privacy.

Acknowledgments

The research was possible due to the cooperation between the Faculty of Logistics of the University of Maribor and the Department of Geography, Environment and Spatial Sciences of Michigan State University. The establishment of cooperation dates back to 2018 and began between the Maribor Faculty of Logistics and MSU RS&GIS.

Conflicts of Interest

The authors declare no conflict of interest.

References

  1. Statzner, B.; Bonada, N.; Resh, V.H. Why Roads and Rivers Can Be Straight or Winding: How Physical and Sociohistorical Factors Produce Contemporary Regional Landscape Patterns. Freshw. Sci. 2016, 35, 1088–1102. [Google Scholar] [CrossRef]
  2. Belloc, H. The Road; The British Reinforced Concrete Engineering Co., Ltd.: Manchester, UK, 1923. [Google Scholar]
  3. Hosseini, S.; Baziyad, H.; Norouzi, R.; Jabbedari Khiabani, S.; Gidófalvi, G.; Albadvi, A.; Alimohammadi, A.; Seyedabrishami, S. Mapping the Intellectual Structure of GIS-T Field (2008–2019): A Dynamic Co-Word Analysis. Scientometrics 2021, 126, 2667–2688. [Google Scholar] [CrossRef]
  4. Miller, H.J.; Shaw, S.-L. Geographic Information Systems for Transportation: Principles and Applications; Spatial Information Systems; Oxford University Press: Oxford, NY, USA, 2001. [Google Scholar]
  5. de Smith, M.J. GIS, Distance, Paths and Anisotropy. In Advanced Spatial Analysis: The CASA Book of GIS; Longley, P.A., Batty, M., Eds.; ESRI Press: Redlands, CA, USA, 2003; pp. 309–326. [Google Scholar]
  6. Zhang, Q.; Giovannini, L.; Simantov, M.; Vries, J.; Vuong, M.; Griffiths, S.; Mercer, B.; Li, X. Extraction of 3D Road Geometry from Airborne IFSAR Data. In Proceedings of the ISPRS Technical Commission III Symposium: Photogrammetry Computer Vision and Image Analysis, Saint Mandé, France, 1–3 September 2010; International Society for Photogrammetry and Remote Sensing: Bethesda, MD, USA, 2010; Volume 38, pp. 24–28. [Google Scholar]
  7. Kaul, M.; Yang, B.; Jensen, C.S. Building Accurate 3D Spatial Networks to Enable Next Generation Intelligent Transportation Systems. In Proceedings of the 2013 IEEE 14th International Conference on Mobile Data Management, Milan, Italy, 3–6 June 2013; Volume 1, pp. 137–146. [Google Scholar]
  8. Dubuc, S. GIS-Based Accessibility Analysis for Network Optimal Location Model. An Application for Bio-Energy Projects of the Mineral Industry in the UK. Cybergeo Eur. J. Geogr. 2007. [Google Scholar] [CrossRef]
  9. Tavares, G.; Zsigraiova, Z.; Semiao, V.; Carvalho, M.G. Optimisation of MSW Collection Routes for Minimum Fuel Consumption Using 3D GIS Modelling. Waste Manag. 2009, 29, 1176–1185. [Google Scholar] [CrossRef]
  10. Prah, K.; Kramberger, T.; Dragan, D. Primerjava 2D in 3D GIS Modela Pri Načrtovanju Šolskih Prevozov. Dela 2018, 49, 61–74. [Google Scholar] [CrossRef]
  11. Schröder, M.; Cabral, P. Eco-Friendly 3D-Routing: A GIS Based 3D-Routing-Model to Estimate and Reduce CO2-Emissions of Distribution Transports. Comput. Environ. Urban Syst. 2019, 73, 40–55. [Google Scholar] [CrossRef]
  12. Goodchild, M.F. Fractals and the Accuracy of Geographical Measures. Math. Geol. 1980, 12, 85–98. [Google Scholar] [CrossRef]
  13. Richardson, L.F. The Problem of Contiguity: An Appendix to Statistics of Deadly Quarrels. Gen. Syst. Yearb. 1961, 6, 139–187. [Google Scholar]
  14. Mandelbrot, B. How Long Is the Coast of Britain? Statistical Self-Similarity and Fractional Dimension. Science 1967, 156, 636–638. [Google Scholar] [CrossRef]
  15. Mandelbrot, B.B. Fractals: Form, Chance and Dimension, 1st ed.; W.H.Freeman & Company: San Francisco, CA, USA, 1977; ISBN 978-0-7167-0473-7. [Google Scholar]
  16. Mandelbrot, B.B. The Fractal Geometry of Nature; W.H. Freeman and Company: San Francisco, CA, USA, 1982; ISBN 978-0-7167-1186-5. [Google Scholar]
  17. Lam, N.S.N.; De Cola, L. (Eds.) Fractals in Geography; PTR Prentice Hall: Englewood Cliffs, NJ, USA, 1993; ISBN 0-13-105867-3. [Google Scholar]
  18. Goodchild, M.F. The Fractional Brownian Process as a Terrain Simulation Model. Simulation 1982, 13, 1133–1137. [Google Scholar]
  19. Mark, D.M.; Aronson, P.B. Scale-Dependent Fractal Dimensions of Topographic Surfaces: An Empirical Investigation, with Applications in Geomorphology and Computer Mapping. Math. Geol. 1984, 16, 671–683. [Google Scholar] [CrossRef]
  20. Clarke, K.; Schweizer, D. Measuring the Fractal Dimension of Natural Surfaces Using a Robust Fractal Estimator. Cartogr. Geogr. Inf. Sci. 1991, 18, 37–47. [Google Scholar] [CrossRef]
  21. Batty, M.; Longley, P.A. The Fractal Simulation of Urban Structure. Environ. Plan. A Econ. Space 1986, 18, 1143–1179. [Google Scholar] [CrossRef]
  22. Afrianto, F. Fractal Dimensions Analysis of Urban Agglomeration at Road Intersections in Metropolitan Malang Raya. IOP Conf. Ser. Earth Environ. Sci. 2023, 1186, 012010. [Google Scholar] [CrossRef]
  23. Liu, S.; Chen, Y. A Three-Dimensional Box-Counting Method to Study the Fractal Characteristics of Urban Areas in Shenyang, Northeast China. Buildings 2022, 12, 299. [Google Scholar] [CrossRef]
  24. De Cola, L. Fractal Analysis of Multiscale Spatial Autocorrelation among Point Data. Environ. Plan. A Econ. Space 1991, 23, 545–556. [Google Scholar] [CrossRef]
  25. Bai, C.; Cai, X.; Zhang, C.; Sun, Y. Fractal Characteristics of the Road Network in Jiangsu Province. In Proceedings of the 6th Advanced Forum on Transportation of China (AFTC 2010), Beijing, China, 16 October 2010; pp. 241–244. [Google Scholar]
  26. Mo, Y.; Liu, J.; Lv, S. GIS-Based Analysis of Fractal Features of the Urban Road Network. In Proceedings of the 2015 6th IEEE International Conference on Software Engineering and Service Science (ICSESS), Beijing, China, 23–25 September 2015. [Google Scholar] [CrossRef]
  27. Wang, H.; Luo, S.; Luo, T. Fractal Characteristics of Urban Surface Transit and Road Networks: Case Study of Strasbourg, France. Adv. Mech. Eng. 2017, 9, 1687814017692289. [Google Scholar] [CrossRef]
  28. Lu, Y.; Tang, J. Fractal Dimension of a Transportation Network and Its Relationship with Urban Growth: A Study of the Dallas-Fort Worth Area. Environ. Plan. B Plan. Des. 2004, 31, 895–911. [Google Scholar] [CrossRef]
  29. Lu, Z.; Zhang, H.; Southworth, F.; Crittenden, J. Fractal Dimensions of Metropolitan Area Road Networks and the Impacts on the Urban Built Environment. Ecol. Indic. 2016, 70, 285–296. [Google Scholar] [CrossRef]
  30. Abid, R.I.; Tortum, A.; Atalay, A. Fractal Dimensions of Road Networks in Amman Metropolitan Districts. Alex. Eng. J. 2021, 60, 4203–4212. [Google Scholar] [CrossRef]
  31. Daniel, C.B.; Mathew, S.; Saravanan, S. Spatial Interdependence of Fractal Dimension and Topological Parameters of Road Network: A Geographically Weighted Regression Approach. Spat. Inf. Res. 2021, 29, 737–747. [Google Scholar] [CrossRef]
  32. Deng, H.; Wen, W.; Zhang, W. Analysis of Road Networks Features of Urban Municipal District Based on Fractal Dimension. ISPRS Int. J. Geo-Inf. 2023, 12, 188. [Google Scholar] [CrossRef]
  33. Clark, J.; Holton, D.A. A First Look at Graph Theory; World Scientific Publishing Company: Singapore, 1991; ISBN 978-981-310-355-9. [Google Scholar]
  34. NAVTEQ. NAVTEQ’s NAVSTREETS Street Data; Distributed by GISDATA, Ljubljana, Slovenia; NAVTEQ: Chicago, IL, USA, 2008. [Google Scholar]
  35. Ministry of the Environment of the Republic of Slovenia. Laser Scanning of Slovenia; Distributed by Slovenian Environment Agency, Ljubljana, Slovenia; Geodetic Institute of Slovenia: Ljubljana, Slovenia, 2015.
  36. Mongus, D.; Zalik, B. Parameter-Free Ground Filtering of LiDAR Data for Automatic DTM Generation. ISPRS J. Photogramm. Remote Sens. 2012, 67, 1–12. [Google Scholar] [CrossRef]
  37. Mongus, D.; Triglav Čekada, M.; Žalik, B. The analysis of an automatic method for digital terrain model generation from lidar data on Slovenian test cases. Geod. Vestn. 2013, 57, 045–259. [Google Scholar] [CrossRef]
  38. ArcGIS ArcMap, version 2020. Esri: Redlands, CA, USA, 2020.
  39. Perko, D. (Ed.) The regionalization of Slovenia; Regionalizacija Slovenije. Geogr. Zb.—Acta Geogr. 1998, 38, 11–57. [Google Scholar]
  40. Gonzato, G. A Practical Implementation of the Box Counting Algorithm. Comput. Geosci. 1998, 24, 95–100. [Google Scholar] [CrossRef]
  41. Grassberger, P. On Efficient Box Counting Algorithms. Int. J. Mod. Phys. C 1993, 04, 515–523. [Google Scholar] [CrossRef]
  42. Gonzato, G.; Mulargia, F.; Ciccotti, M. Measuring the Fractal Dimensions of Ideal and Actual Objects: Implications for Application in Geology and Geophysics. Geophys. J. Int. 2000, 142, 108–116. [Google Scholar] [CrossRef]
  43. Perko, D.; Hrvatin, M.; Ciglič, R. A Methodology for Natural Landscape Typification of Slovenia. Acta Geogr. Slov. 2015, 55, 235–270. [Google Scholar] [CrossRef]
  44. Perko, D.; Orožen Adamič, M. (Eds.) Slovenija: Pokrajine in Ljudje; Mladinska Knjiga: Ljubljana, Slovenia, 2001; ISBN 978-86-11-15033-8. [Google Scholar]
  45. Perko, D. Analiza Površja Slovenije s Stometrskim Digitalnim Modelom Reliefa; Geografija Slovenije; Založba ZRC: Ljubljana, Slovenia, 2001; ISBN 978-961-6182-94-2. [Google Scholar]
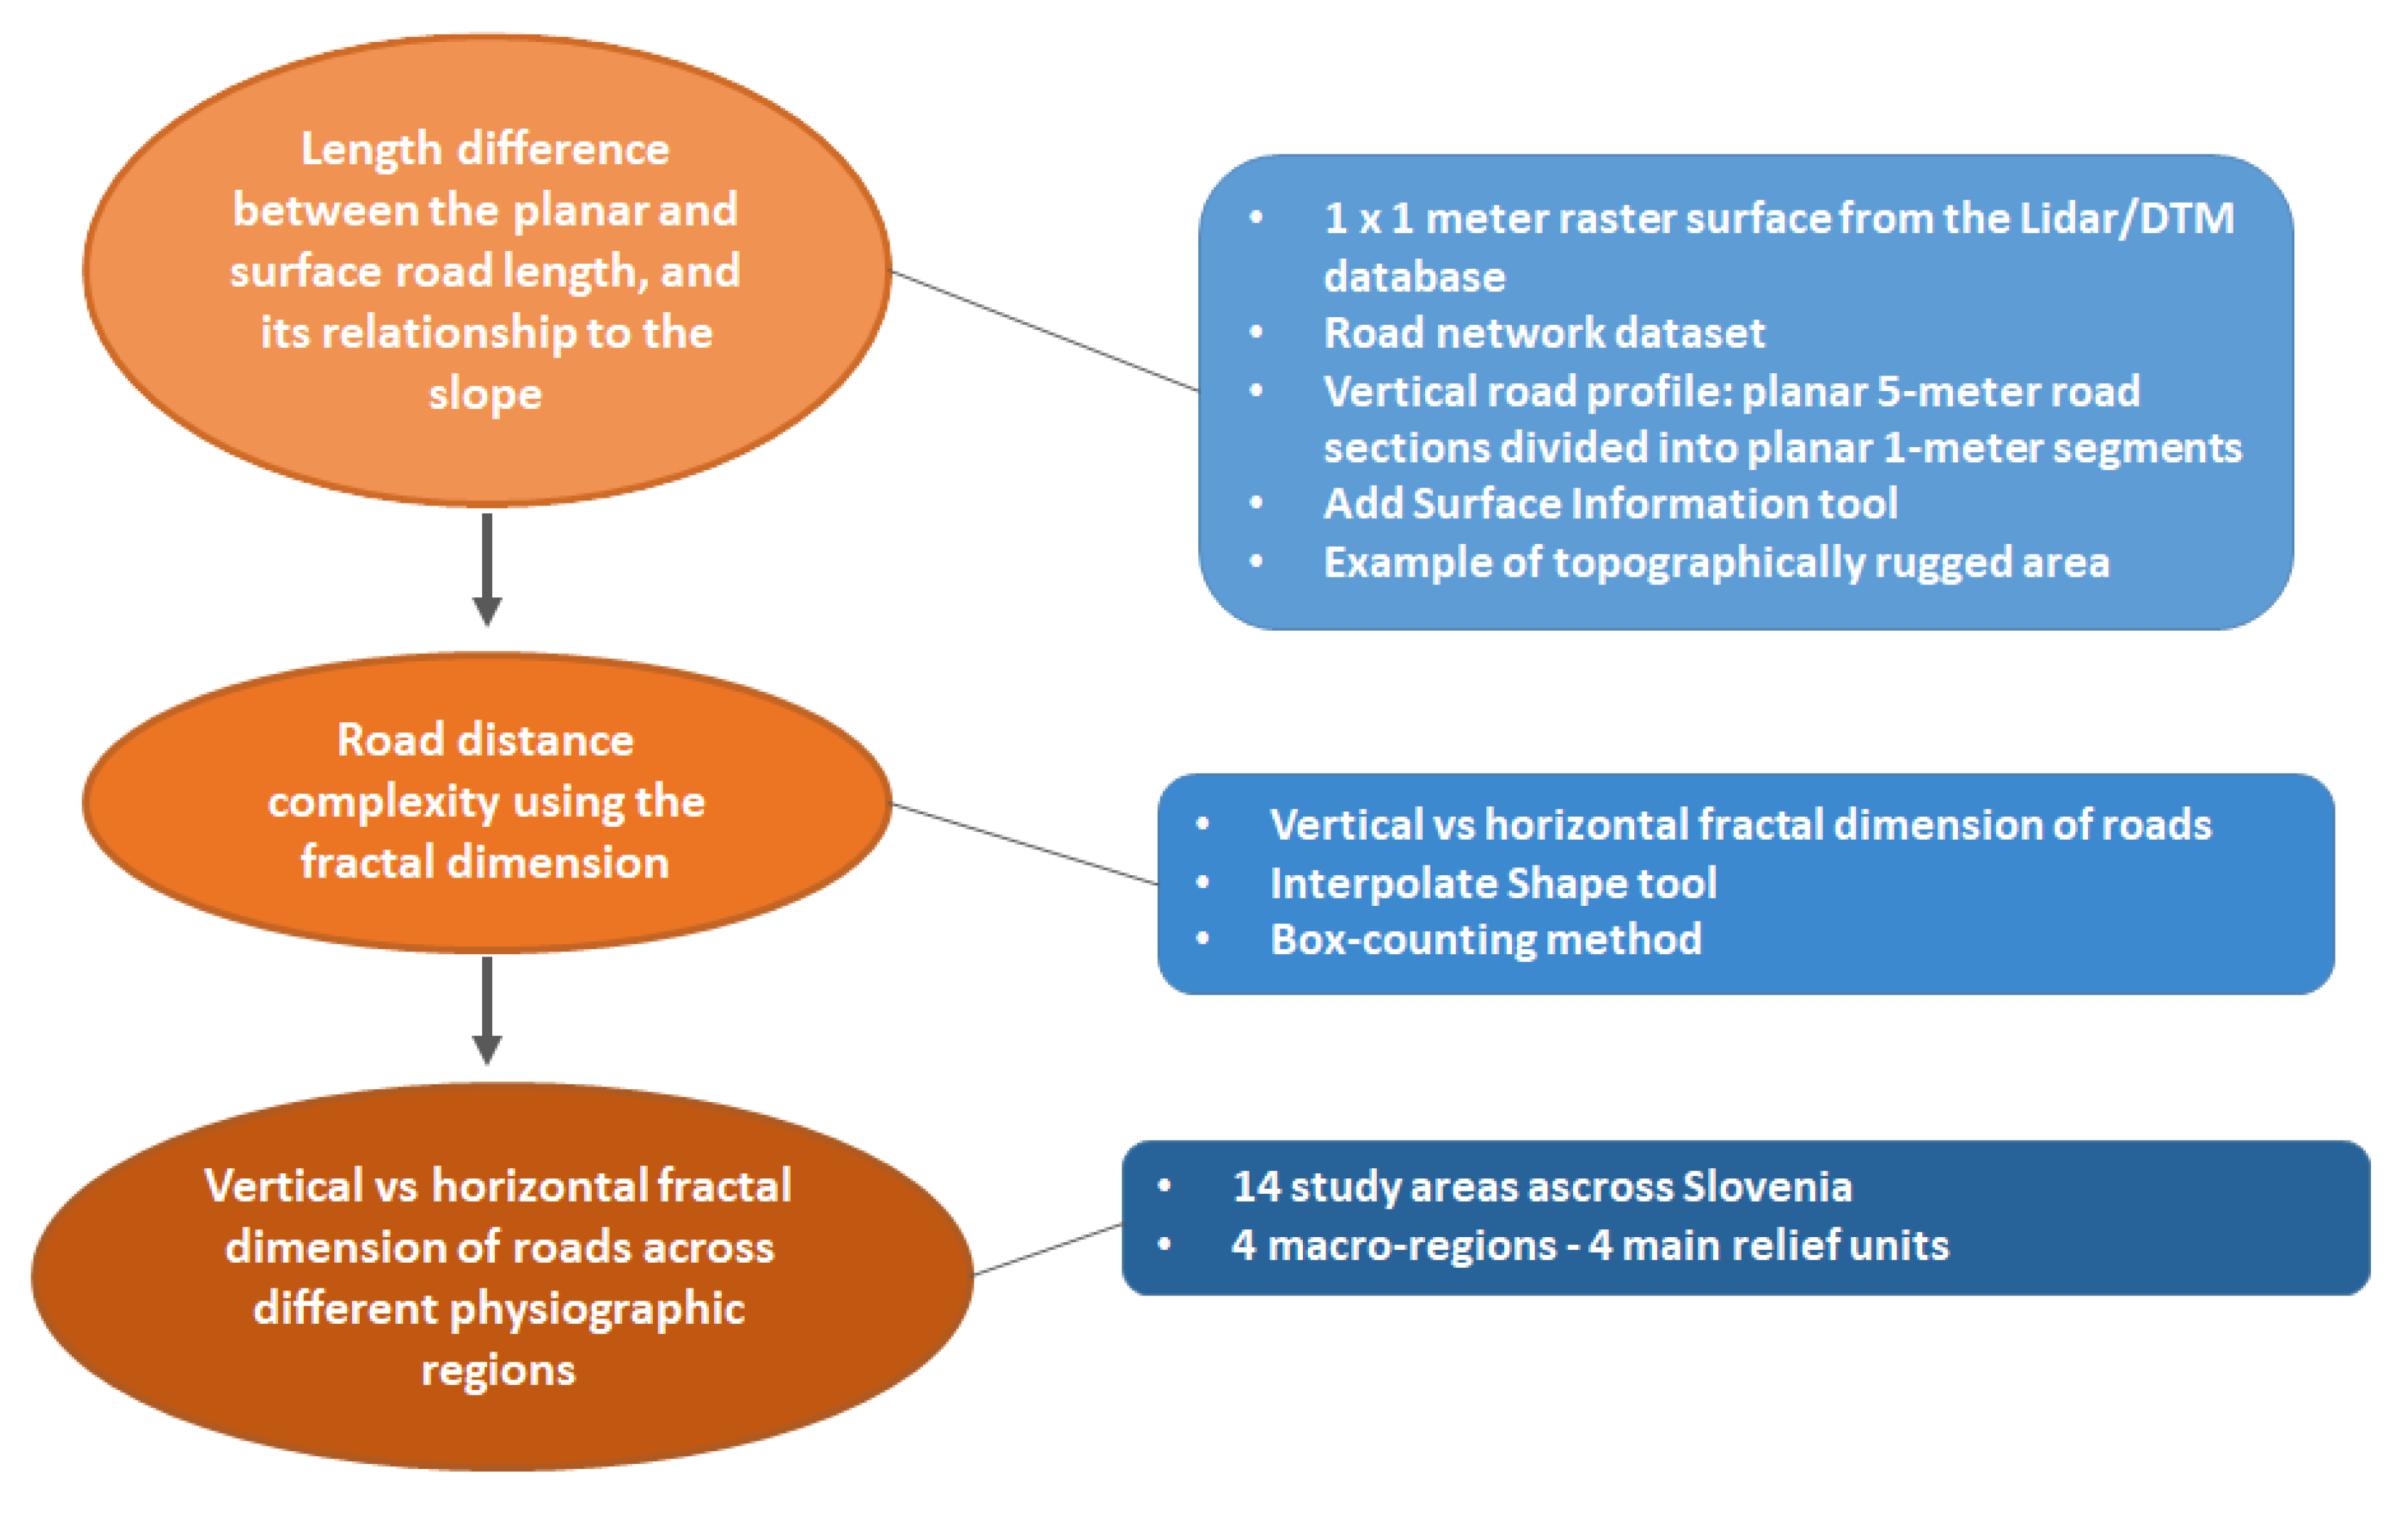
Figure 1. The research design was organized into three general, progressive stages (orange ellipses) and associated analysis details (blue rectangles).
Ijgi 12 00487 g001
Figure 2. Vertical profile of a five-meter road section overlain on a one-meter cell size raster DTM processed using ArcGIS, according to the bilinear interpolation method, to obtain the Z, slope, and surface length information.
Ijgi 12 00487 g002
Figure 3. Relationship between the length difference and average slope of the five-meter road sections in the municipality of Gornji Grad in Slovenia.
Ijgi 12 00487 g003
Figure 4. Vertical profile of the sample road section. A one-hundred-meter-long detail of the road illustrated its vertical roughness.
Ijgi 12 00487 g004
Figure 5. Procedure of box counting to obtain D2, the horizontal fractal dimension of a road in the Gornji Grad region. Ten different square side lengths were calculated, of which four are presented to illustrate the approach: (a) 1024 m, (b) 256 m, (c) 128 m, and (d) 16 m. The last example (d) presents in detail a 128-by-128 m area. In all the examples, the squares that intersect with the road are colored light blue. An elevation map provides context.
Ijgi 12 00487 g005
Figure 6. Vertical and horizontal fractal dimensions for the Gornji Grad road section. The red square features represent the vertical profile, while the round dark blue features represent the horizontal profile. The dots indicate the paired log(ƞ):log(N) values that were empirically derived at different mesh side lengths. The regression model lines are depicted for each set of points, and each regression equation with parameter estimates and R2 are reported. The vertical and horizontal fractal dimensions are given by the absolute value of the line slope in bold.
Ijgi 12 00487 g006
Figure 7. Fourteen study areas, represented by numbered dark blue squares, spanning all four Slovenian macro-regions, including plains, low hills, high hills, and mountains. Source: Perko 1998, ARSO, GURS.
Ijgi 12 00487 g007
Figure 8. Vertical and horizontal fractal dimensions of the road sections for all fourteen study sites (site numbers). The linear regression line and expression quantified the strength of the relationship between these dimensions.
Ijgi 12 00487 g008
Figure 9. 6-by-6 km excerpts from selected study sites with roads (red lines): (a) plain (site 1); (b) low hills (site 3); (c) hills (site 6); and (d) mountains (site 10). The shaded relief was generated from the DTM used in the study. The streams and rivers (blue lines) provide context. Source: ARSO, GURS, NAVTEQ.
Ijgi 12 00487 g009
Figure 10. Vertical profiles of the road sections presented in Figure 9: (a) plains of study area 1; (b) low hills of study area 3; (c) hills of study area 6; and (d) mountains of study area 10. In each case, the lowest grid line represents the lowest elevation of the road section (also labeled on the axis). For better representation, the ratio between the horizontal and vertical axes was 1:2.
Ijgi 12 00487 g010
Table 1. Selected research that incorporate the topographical variations of space to model efficient network movement.
Author(s)Approach
de Smith, 2003 [5]Algorithm for path finding that takes into account topographic obstacles to find a route between two points in a two-dimensional continuous space with topographic variations.
Dubuc, 2007 [8]Approach to estimate and incorporate the impact of slope on travel time and on transport cost calculations.
Tavares et al., 2009 [9]GIS 3D route modeling for waste collection using fuel consumption as a core criterion and considering local road gradients.
Zhang et al., 2010 [6] Semi-automated approach for 2D road extraction from orthorectified radar imagery and automated elevation assignment from road segments based on an interferometric synthetic aperture radar (IFSAR)-derived digital elevation model (DEM).
Kaul et al., 2013 [7]A filtering and lifting framework that augments a 2D spatial network model with the elevation information extracted from massive aerial laser scan data to produce an accurate 3D model.
Prah et al., 2018 [10]Comparison of 2D and 3D GIS models for school vehicle routing with the travel distance and travel time as core criteria.
Schröder and Cabral, 2019 [11]GIS 3D route modeling to illustrate the effects of road inclination on fuel consumption and carbon dioxide (CO2) emissions, and to optimize routes in the domain of road freight transportation.
Table 2. Existing studies that apply the fractal dimension in transportation network analysis.
Author(s)Application
Lu and Tang, 2004 [28]Study of the relationship between the mass size of cities in the Dallas-Fort Worth, U.S. area and the complexity of their road systems using a modified box-counting method.
Bai et al., 2010 [25]Research on the spatial structures and patterns of road networks in northern and southern Jiangsu Province, China. The methods of the Hausdorff dimension and the covering depth were used.
Mo et al., 2015 [26]Analysis of Shenzhen, China’s municipal road network based on the fractal theory and GIS. The Hausdorff method was used to calculate the road network coverage index, leading to suggestions for road network optimization.
Lu at al., 2016 [29]Research on the fractal dimensions of major road networks in large U.S. metro areas and the associations of these values on the urban built environment.
Wang et al., 2017 [27]Study of the fractal characteristics of urban surface transit and road networks in Strasbourg, using length dimension and branch dimension methods.
Abid et al., 2021 [30]Calculation of five types of fractal dimensions for road networks in 22 districts in the Greater Amman metropolitan area. Each calculated fractal dimension was regressed to the district’s area urban form parameters.
Daniel at al., 2021 [31]Study of the topological parameters of the road network in Tiruchirappalli, India based on the graph theory. Relationships between the fractal dimension and other topological parameters were explored using geographically weighted regression.
Deng et al., 2023 [32]Analysis of the road network features in nine urban municipal districts in Harbin, China based on five fractal dimension methods, including box counting. Each fractal dimension result was linearly regressed with district pattern indicators.
Table 3. Partial results of the surface properties for a five-meter road section to obtain the surface length and average slope information for the whole section.
SegmentSlope (Degrees)Surface Length (Meters)Weighted Slope (Degrees)
s10.291.000.29
s222.051.0823.81
s348.241.5072.36
s42.861.002.86
s52.301.002.30
Table 4. Properties of each study site: site #, relief unit, elevation range of the road section, average slope of the road section, and horizontal and vertical D and R2.
Site #Relief UnitElevation Range of the Road Section (Meters)Average Slope of the Road Section (Degrees)Vertical Fractal Dimension of the Road SectionHorizontal Fractal Dimension of the Road Section
D1R2D2R2
1Plains11.020.581.00331.00000.99130.9995
2Plains17.191.250.99900.99991.00270.9999
3Low hills140.303.771.00961.00001.07480.9979
4Low hills149.543.681.00421.00001.03870.9997
5Low hills446.144.611.00931.00001.04680.9993
6Hills922.9112.981.01820.99991.18370.9978
7Hills178.827.621.01581.00001.08800.9978
8Low hills319.263.231.00681.00001.01550.9992
9Low hills93.932.141.00401.00001.04860.9974
10Mountains970.557.381.01021.00001.17740.9986
11Mountains694.845.511.00281.00001.11520.9977
12Hills1063.399.081.00890.99991.13680.9976
13Hills598.389.601.01580.99991.08120.9994
14Hills1038.718.391.00421.00001.06670.9991
Table 5. Comparison of our research with the existing studies presented in Table 2, which applied the fractal dimension in the transportation network analysis.
Our ResearchExisting Research from Table 2
Applying GISGISGIS [25,26,29,30,31,32]
Fractal dimension methodNovel concept of the vertical fractal dimension of roads (vector-based approach for box-counting method implemented in ArcGIS software)
-
Box counting [28,30,31,32]
-
Hausdorff dimension [25,26]
-
Covering depth [25]
-
Length dimension [27]
-
Branch dimension [27]
-
Geometric fractal dimension [29]
-
Structural fractal dimension [29]
-
Comparison between five fractal dimensions (box counting, perimeter area, information, mass, and ruler dimension) [30,32]
Definition of networkNon-urban roads
-
Urban transportation network [27,28,29,30]
-
Urban road network [27,30,32]
-
Urban surface transit network (public transportation) [27]
SoftwareArcGIS software with the Add Surface Information tool and Interpolate Shape tool
-
ArcGIS software [25,26,29,31]
-
ArcGIS Network Analyst extension [31]
-
BENOIT software [30,32]
Spatial data coverage
-
Vector data layers (NAVTEQ streets, physiographic regions)
-
1 × 1 m digital terrain model to derive 3D surface road length
-
Vector data layers [25,26,30,32]
-
OpenStreetMap vector data [30,32]
-
Road network vectorized from raster image [31]
-
Road network rasterized from shapefile [30,31]
Time situationCurrentTen-year span [25]
Disclaimer/Publisher’s Note: The statements, opinions and data contained in all publications are solely those of the individual author(s) and contributor(s) and not of MDPI and/or the editor(s). MDPI and/or the editor(s) disclaim responsibility for any injury to people or property resulting from any ideas, methods, instructions or products referred to in the content.