Article

Modeling the Impact of Investment and National Planning Policies on Future Land Use Development: A Case Study for Myanmar

1
Center of Digital Mountain and Remote Sensing Application, Institute of Mountain Hazards and Environment, Chinese Academy of Sciences, Chengdu 610041, China
2
University of Chinese Academy of Sciences, Beijing 100049, China
3
Wanglang Mountain Remote Sensing Observation and Research Station of Sichuan Province, Mianyang 621000, China
*
Author to whom correspondence should be addressed.
ISPRS Int. J. Geo-Inf. 2023, 12(1), 22; https://doi.org/10.3390/ijgi12010022
Submission received: 18 September 2022 / Revised: 9 December 2022 / Accepted: 5 January 2023 / Published: 13 January 2023

Abstract

:
Land use change (LUC) can be affected by investment growth and planning policies under the context of regional economic cooperation and development. Previous studies on land use simulation mostly emphasized the effects of local socioeconomic factors and planning constraint areas that prevent land conversions. However, investment and national planning policies that trigger regional LUC were often ignored. This study aims to couple the economic theory-based Computable General Equilibrium of Land Use Change (CGELUC) model and the cellular automata-based Future Land Use Simulation (FLUS) model to incorporate macroscopic impacts of investment into land use simulation, while proposing an updated mechanism that integrates into the FLUS model to consider the local impacts of planning policies. Taking Myanmar as a case, the method was applied to project the land use patterns (LUPs) during 2017–2050 under three scenarios: baseline, fast, and harmonious development. Specifically, the simulated land use structure (LUS) in 2018 acquired by the CGELUC model was verified by the existing data, and the future LUSs under different scenarios were projected later. Simultaneously, the consistencies between the results simulated by the FLUS model and land use maps in 2013, 2015, and 2017 were represented by the kappa coefficient. The updated mechanism was applied to update the Probability-of-Occurrence (PoO) surfaces based on the planning railway networks and special economic zone. Lastly, the LUPs under different scenarios were projected based on the future LUSs and updated PoO surfaces. Results reveal that the validation accuracy reaches 96.87% for the simulated LUS, and satisfactory accuracies of the simulated LUPs are obtained (kappa coefficients > 0.83). The updated mechanism increases the mean PoO values of built-up land in areas affected by planning policies (increasing by 0.01 to 0.21), indicating the importance of the planning policies in simulation. The cultivated land and built-up land increase with investment increasing under all three scenarios. The harmonious development scenario, showing the least forest encroachment and the highest diversity of LUP, is the optimal approach to achieve land sustainability. This study highlights the impacts of investment and planning policies on future LUCs of Myanmar, and a dynamic simulation process is expected to minimize the uncertainties of the input data and model in the future work.

1. Introduction

Land use pattern is found to be a pivotal geospatial characteristic, which has a significant influence on the processes of regional environmental change, planning, and sustainable development [1,2,3]. Within the last few decades, large-scale regional cooperation and interconnectivity have been generated via many existing and planning policies (e.g., infrastructures and Special Economic Zone (SEZ)) together with more foreign investment, resulting in the formation of diverse and sophisticated land use patterns at different scales [4,5,6]. Therefore, investment and planning policies are critical drivers for the simulation of future land use dynamic, which is significant for achieving efficient regional land management.
Currently, future land use structure simulation often adopts two types of models: (1) historical data extrapolation models that emphasize the land use structure of the target year by considering the historical trend of land use change (LUC), such as the Markov model [7], and (2) influence factor relational models that predict the future land use structure based on the relational function of various driving variables in the natural–socio-economic system, such as the System Dynamics (SD) model [8]. These methods have the advantage of application simply by using historical land use data and related driving factors, while they often neglect the impacts of investments on land development [3,9]. The Computable General Equilibrium (CGE) model, an econometric model, characterizes a quantitative mathematical relationship between industrial production, consumption, and the capital flow inside and outside a region, which has been applied to calculate the impacts of investments on the local eco-environment [10,11]. Subsequently, the Computable General Equilibrium of Land Use Change (CGELUC) model was established on the basis of the theory of the CGE model and replenished the mathematical relationship between land and industrial development, describing a more accurate and complete land–socio-economic system involving investment and technical progress [10]. This model has been used to project land use structure by considering the impacts of macroeconomic policies in regional areas, with acceptable accuracy higher than 80% [3,12], showing the strong potential to simulate regional land use structure under the impacts of the increasing investment.
To assign the projected land use structure to target land units, a variety of land use allocation models based on Cellular Automata (CA) have been constructed by considering the initial states, neighborhood effects, and transition rules of land use [13,14,15]. The Future Land Use Simulation (FLUS) model is one of the most widely used CA-based models, which has the advantage of simulating complex competitions and interactions among different land use types [14]. This model has been extensively utilized to simulate complex systems at different spatial scales and purposes, such as urban growth boundaries delineation in the Pearl River Delta region [16], coastal wetland dynamic simulation in the Greater Bay area [17], and land use development simulation in Hokkaido [18]. According to Liu et al. [14], the FLUS model could obtain a higher accuracy in simulating regional LUC than the traditional CA models, with the kappa coefficients increased by more than 0.04. These mentioned studies using the FLUS model have obtained receivable results, indicating the good feasibility of these methods in simulating regional land use development.
Although the FLUS model shows satisfactory effectiveness in regional LUC simulations, a complex spatial pattern of land use may be generated due to the effects of various factors [19,20]. Therefore, in addition to natural and socio-economic driving factors, other important factors, especially planning policies, should also be considered to calculate the simulated result, which is closer to the real world. At present, most research only considers planning constraints that prevent LUC in target cells or facilitate land use conversion to a specified location, such as protected areas and basic farmland areas [21,22]. In addition, other planning policies, such as planning transport networks and SEZs, also have strong potential influences on LUC. Specifically, the planning transport networks will shape the spatial patterns of agricultural land and urban land and offer an opportunity to best utilize transport networks as an integrated part of future land use patterns [6,23]. An SEZ will encourage the generation of new urban land in a delineated area [24]. These mentioned planning policies have received considerable attention in urban growth modeling [16,23,25], whereas they were often ignored in regional LUC simulation [23,25]. The accurate prediction of land use development is the prerequisite for decision-making. Therefore, the effects of the planning policies should be considered in regional LUC simulation.
In 2015, the Belt and Road Initiative (BRI) was designed by China, aiming at interconnecting China with other participating countries in a sustainable way [26]. The BRI is beneficial to promote regional economic cooperation, boost trade growth, and increase employment opportunities [27]. Many studies have inferred that massive LUC might be triggered by the ongoing infrastructure projects and investment [28,29,30]. Myanmar is a developing country that actively integrates into BRI. It is widely regarded as an important concentration district of forests, covering 65% of Myanmar’s total land area in 2000 [31]. However, owing to the growth of food demands and economic development, massive forests have been gradually encroached by artificial land (e.g., farmland and built-up land) [32,33], resulting in the degradation of natural resources and loss of biodiversity [34,35]. In recent years, to further alleviate poverty and promote reform, Myanmar has actively cooperated with other countries, such as China, India, Thailand, and Japan [36], and many new policies have been proposed to improve infrastructure (e.g., railway and SEZ) [37,38] and attract foreign investment [39]. These situations may bring about great opportunities for Myanmar’s economic development, but they arouse enormous LUCs and ecological challenges.
In this paper, Myanmar is selected as a case to study the LUC projection under the effects of investment and planning policies. The aims of this study are: (1) to project future land use structure of Myanmar during 2017–2050 under multiple scenarios by triggering the CGELUC model with the investment, (2) to propose an updated mechanism integrated into the FLUS model to project future land use patterns under the influences of planning policies, and (3) to analyze future land use distribution of Myanmar considering the goal of land development sustainability.

2. Study Area and Data Sources

2.1. Study Area

Myanmar (9°–29° N, 92°–102° E), an important part of the Bangladesh–China–India–Myanmar Economic Corridor in BRI, covers an area of 676,552 km2, exhibiting an elevation of 0–5881 m. It is a coastal country located in the western part of the Indo-Chinese peninsula, which is bordered by India and Bangladesh to the west, by China to the north and northeast, and by Laos and Thailand to the southeast (Figure 1). Due to the combination of tropical monsoon climate and complex topography, Myanmar exhibits warm temperatures for the whole year and extremely uneven rainfall distribution. The major land use types in Myanmar include forests, grassland, cultivated land, wetland, waters, and built-up land [32]. In the past few decades, Myanmar has undergone a tremendous land use transition, especially from forests to cultivated land and built-up land, due to excessive anthropogenic activities, including logging, infrastructure development, and agriculture expansion [35]. In 2014, Myanmar‘s natural forests accounted for only 38% of the entire region [32]. Consequently, the eco-environment in Myanmar became worse [34,35]. In recent years, Myanmar has sought to promote economic development by attracting investment. In the meantime, it has planned to set up three SEZs (Kyaukpyu, Dawei, and Thilawa), construct two international railways that link China, India, and Thailand, and upgrade existing railways (Figure 1). These mentioned policies may lead to further LUCs.

2.2. Data Collection and Processing

The data used in this work include land use data, socio-economic data, natural characteristic data, and planning data. Details of these data and their deriving sources are presented in Table 1. As for the land use data, the land use types were merged into seven categories, including cultivated land, forests, grassland, wetland, waters, built-up land, and unused land. The land use data of 2017 were used to supply the values of several accounts in the Myanmar’s Social Accounting Matrix (SAM), which presented the accounts for transactions in a single-entry matrix format [40]. Before that, this SAM, including 42 industrial sectors, needed to be merged into 3 industrial sectors (i.e., agricultural, industrial, and service industry). The annual mean precipitation and temperature in Myanmar were acquired by interpolating the weather stations into raster with 250 m spatial resolution based on the thin-plate spline method [41]. The 1km future climate surfaces under the three Representative Concentration Pathways (i.e., RCP2.6, RCP4.5, and RCP8.5) adopted by the International Panel on Climate Change (IPCC) for its fifth Assessment Report (AR5) were downloaded from the CCAFS-Climate data portal [42].
A total of sixteen driving factors were generated based on the corresponding data. The Euclidean distances of the vector data were calculated to represent the proximities to railways, railway stations, roads, towns, provincial capitals, and rivers. The updated proximities to railways and railway stations were represented by the Euclidean distances of both the historical and planning railways and railway stations, respectively. Proximity to the disturbed area was described by the Euclidean distance of LUC areas from 2000 to 2017. The protected area needs to be converted to a raster with values of 0 and 1, acting as a restriction factor for the FLUS model. In this study, all the spatial data were resampled to a uniform spatial resolution of 250 m, and these driving factors need to be normalized to [0, 1]. These prepared data were used to simulate and project LUC in Myanmar.

3. Methodology

The method proposed in this work aims to project the changes in land use structures and spatial patterns in Myanmar by considering the influences of investments and national planning policies (i.e., planning traffic networks and SEZ), which involves several techniques (Figure 2). The first step focuses on projecting future land use structures through the CGELUC model considering the investments. Subsequently, the FLUS model that integrated with an updated mechanism is employed to allocate these land use structures to spatial units. Particularly, the updated mechanism is proposed to incorporate the impacts of national planning policies.

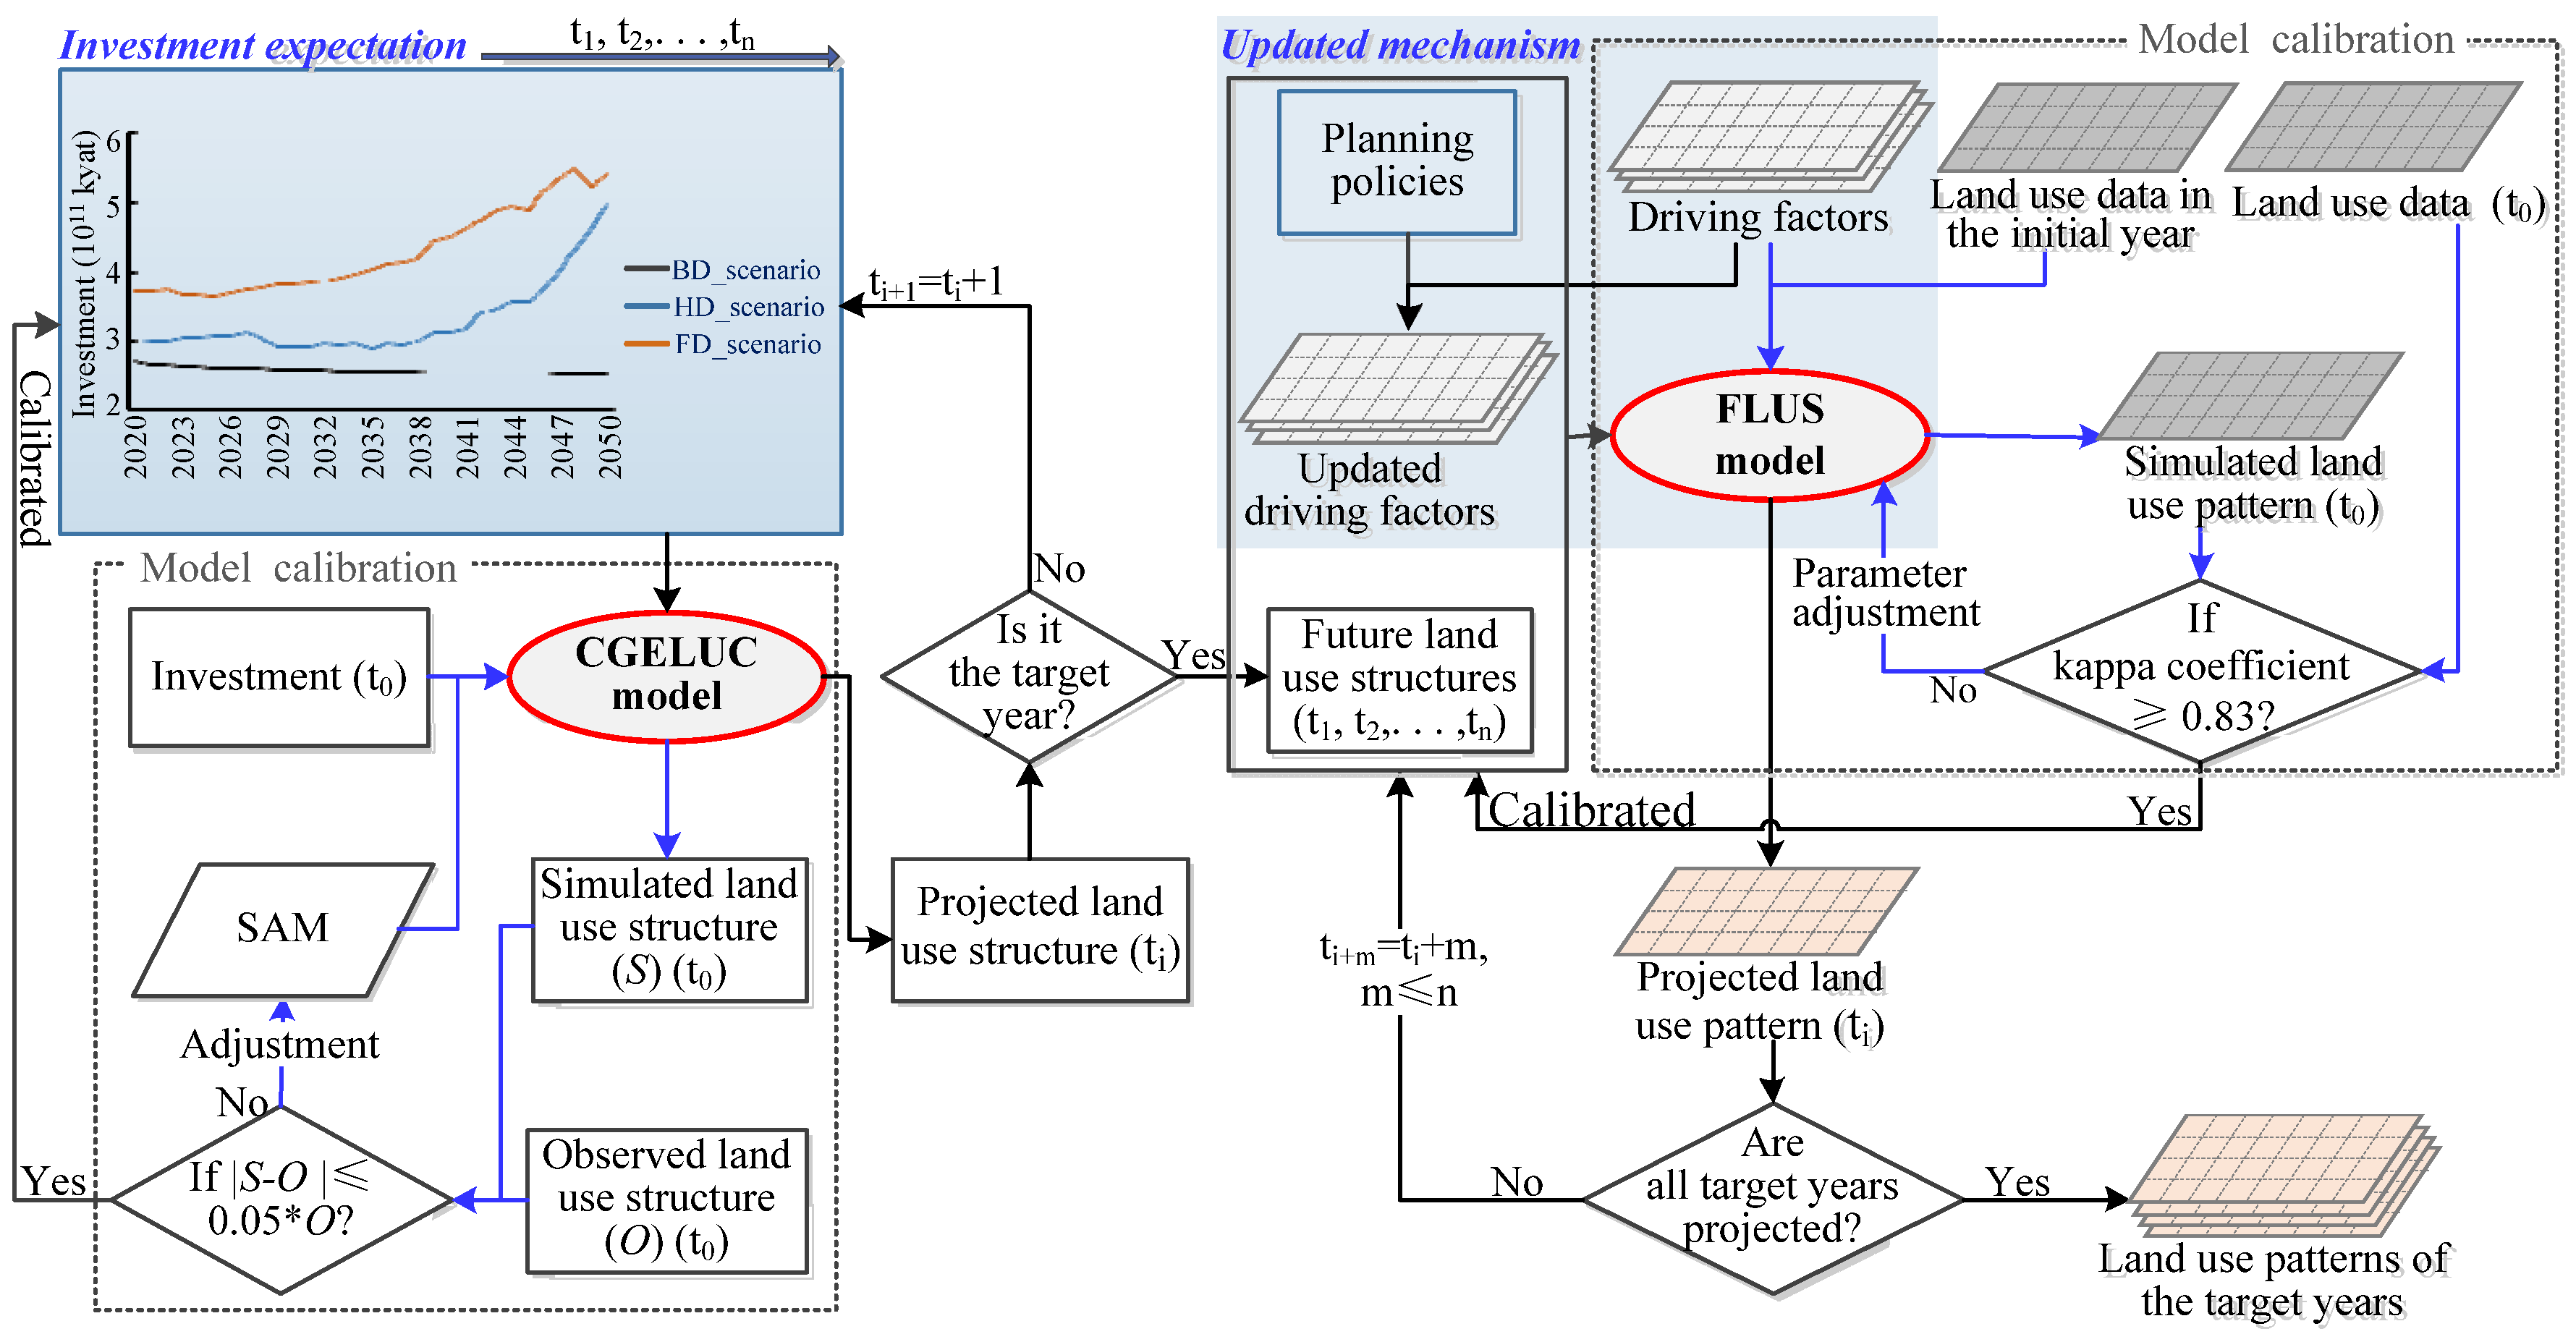
3.1. Simulating the Land Use Structure by Considering the Impacts of Investment

The CGELUC model uses the CGE theoretical framework to quantitatively assess the utility of land use policies at the macro level. Changes in land use structure could be captured through this model by considering the relationships between land use and the whole socio-economic system [14,37]. The CGELUC model comprises nine modules (details seen in Deng [10]), which can be grouped into two parts. The first part, the quantitative analysis module, is applied to simulate changes in land use types without direct economic value (e.g., water area, wetland, and forests). The other part, including the remaining eight modules, is used to project changes of land use types with direct economic value (e.g., built-up land and farmland). The exogenous variables, such as investment and technical progress, are set based on the macro policies to trigger the operation of the model, and the corresponding quantity of each land use type is computed under the designed scenarios.

3.2. Characterizing the Land Use Allocation by Considering the Impacts of Planning Policies

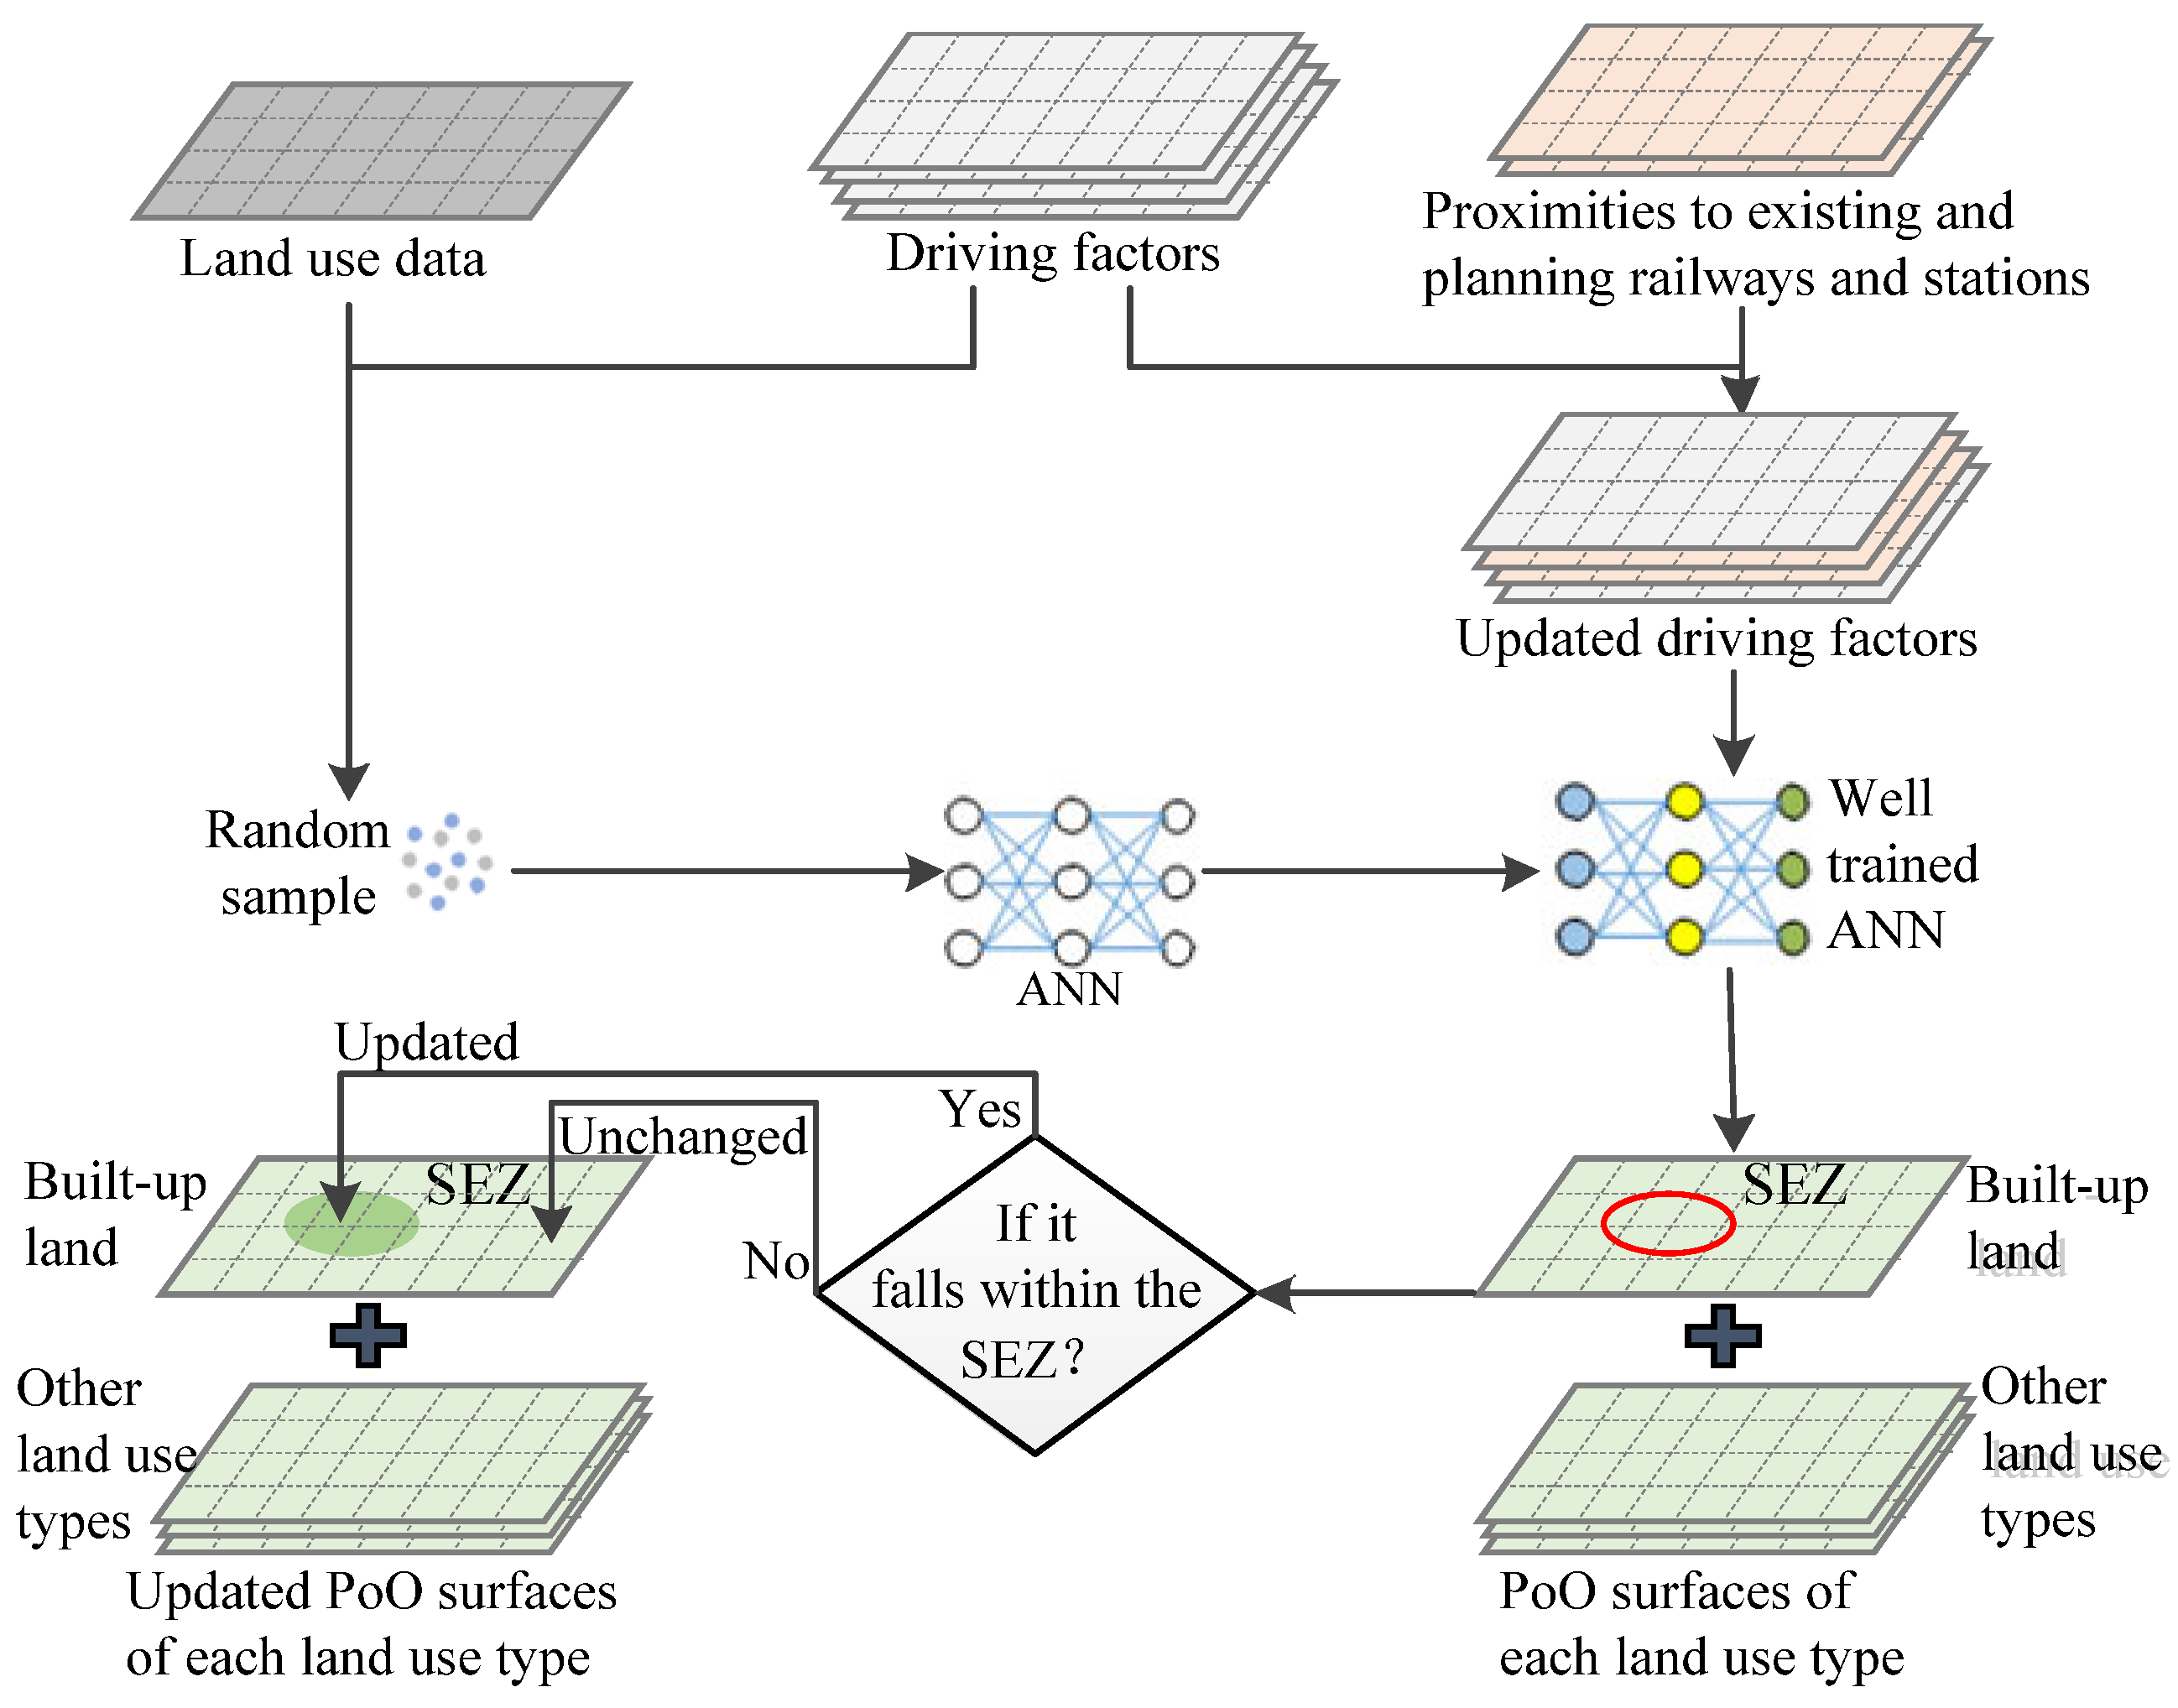
3.2.1. Description of the FLUS Model

The CA-based FLUS model is an integration of the SD model and the CA model, which is often used to determine the future land use patterns [19]. In our work, the CGELUC model is suggested to replace the SD model for investigating the effects of investment on future land use structures. In the FLUS model, an Artificial Neural Network (ANN) model is trained based on the historical land use map and driving factors, which is later applied to obtain the Probability-of-Occurrence (PoO) surface of each land use type. These PoO surfaces are the inputs of the CA module in the FLUS model to form future land use pattern. As for the CA module, a self-adaptive inertia coefficient of each land use type is employed to regulate the combined probability of each land use type. The primary function of the designed roulette selection involved in CA module is to delineate the competition among land use types in each cell, and it shows the advantage of reflecting the uncertainty and randomness of land use dynamics. The details of the FLUS model were described by Liu et al. [14].

3.2.2. The Updated Mechanism Considering the Impacts of Planning Policies

Planning railways, railway stations, and SEZs were considered as the specific planning policies in this study. The PoO surfaces acquired by the ANN model can guide the certain placement for the assignment of each land use type, so their variations have direct impacts on the simulated result. These planning policies show the potential to alter the distribution of the historical PoO surfaces, directing the changes in land use to locations with more possibility. To delineate their impacts on these PoO surfaces, this study proposed an updated mechanism on the basis of the ANN model. The specific procedure of this updated mechanism is shown in Figure 3.
Two critical steps are included in this updated mechanism. First, an ANN is trained based on the random sample extracted from the historical land use map and driving factors. The new driving factors, exhibiting the combined information of the historical and planning railway networks, are used to replace the corresponding historical ones. Subsequently, the PoO surface of each land use type will be generated based on the well-trained ANN and updated driving factors. Second, the rule shown as Equation (1) is used to update the PoO values of built-up land in the SEZ, while maintaining these values within [0, 1], to describe the potential effects of the SEZ.
U P p , u r b a n = { H P p , u r b a n + 1 P mean ,   if   H P p , u r b a n P mean 0 1                ,   if   H P p , u r b a n P mean > 0
where HPp,urban and UPp,urban denote the historical and updated PoO values of built-up land on grid cell p, and Pmean indicates the mean PoO value of built-up land in the SEZ, with the exception of historical built-up land cells. This rule is applied to nonbuilt-up land cells in the SEZ. The distribution of the updated PoO values in the SEZ is similar to that of the historical PoO values. Specifically, the first step of the updated mechanism focuses on the impacts of the planning railway networks on the projecting process of the ANN model. The second step aims to improve the chance of urban land generation in the SEZ, even if there is no historical built-up land within its neighborhood.

3.3. Land Use Simulation Setting and Scenario Design

3.3.1. Setting of Model Implementation

The model implementation comprises model calibration and validation and scenario simulation. In this study, the SAM was applied to construct the CGELUC model. The land use data in 2018 was used to calibrate and validate the CGELUC model. If the difference between the simulated and observed land use structures is less than or equal to 5% of the observed value, the calibration of the CGELUC model is completed. Subsequently, the parameters of the designed scenarios were set to trigger this model and calculate the land use structures under different scenarios. It is found that the land use distribution and change show association with terrain factors (e.g., elevation and slope), socio-economic factors (e.g., distribution of population and Gross Domestic Product (GDP)), locational factors (e.g., proximity to main roads), and other factors [9,24]. Given the related research and characteristics of Myanmar’s LUC [3,30,32,35,57], sixteen driving factors were selected to calibrate the ANN model for calculating the PoO surface of each land use type. In this study, about 5% of the total cells in Myanmar were randomly extracted from the historical driving factors and land use map, which were identified as the training samples to train the ANN model in a self-adaptive way. In the CA module of the FLUS model, a 3 × 3 Moore neighborhood was set for LUC simulation. This study calibrated the FLUS model over a period of 2000–2017. When the kappa coefficient of the simulated land use pattern exceeds 0.83, it indicates that the FLUS model has been calibrated. Subsequently, the well-trained model was adopted to investigate the succession of future land use patterns.
In the scenario simulation, the new PoO surfaces need to be created based on the updated mechanism for future land use projection. The historical climate drivers were replaced by the future climate data under the scenarios of RCP2.6, RCP4.5, and RCP8.5, which were on behalf of the future climate status of the designed Baseline Development scenario (BD_scenario), Harmonious Development scenario (HD_scenario), and Fast Development scenario (FD_scenario), respectively. In the meantime, the updated locational factors (i.e., proximities to railways and railway stations) were used to replace the corresponding historical factors. For lack of the scope of the planning SEZs, the buffer zones of 5 km around the sites of the SEZs were selected to execute the second step of the designed updated mechanism.

3.3.2. Scenario Design

Myanmar hopes to attain export-oriented growth by attracting domestic and overseas investments [39]. The intensive investment can improve the production capabilities and technology, which contribute to boosting production growth in the long run. The long-term land use structure prospects are closely linked with any of the development strategies described in the 20-year National Comprehensive Development Plan [58] and Myanmar Sustainable Development Plan [36]. The mentioned development factors could be represented by the enhancement of Total Factor Productivity (TFP). Moreover, population growth and climate change should also be considered for their impact on LUC. Given the previous studies related to the effects of socio-economic factors and climate change in Myanmar [59,60,61,62,63,64], three scenarios were designed to project the land use dynamics from 2017 to 2050 by considering regional climate change together with socio-economic development. These scenarios were designed based on the assumption of Myanmar’s willingness for economic development. In the BD_scenario, the future land use pattern in Myanmar was simulated by considering the development mode in recent years without the effects of planning policies. The HD_scenario was constructed based on the assumption that Myanmar would attach importance to economic development together with ecological protection. In this scenario, the planning policies and protected areas were both taken into consideration. The FD_scenario assumed that Myanmar would introduce a massive investment, and rapid economic development might occur at the expense of ecological resources. This scenario only considered the planning policies to direct LUC. The generation of the scenario parameters was described in Section S1. As shown in Table 2, the three scenarios are featured by a variety of alternative future conditions regarding human interference, economic development, technical progress, and climate condition.

3.4. Accuracy Assessment

In this study, the overall accuracy and kappa coefficient were adopted to measure the accuracies of the simulated land use patterns in 2013, 2015, and 2017. Moreover, the agreement between the observed and simulated land use structures under the BD_scenario in 2018 was also measured for accuracy assessment. The accuracy of the simulated land use structure was calculated by the method of Jin et al. [3], which is expressed as:
E r r o r = | F A | / A
where F indicates the area of the projected LUC between the incipient year and the end year, and A refers to the area of observed LUC between the incipient year and the end year.

4. Results and Analysis

4.1. Validation of Model Simulations

4.1.1. Accuracy of the Simulated Land Use Structure

The accuracy of the simulated land use structure under the BD_scenario in 2018 is presented in Table 3. The accuracy of the whole area reaches 96.87%, and high predictive accuracies are observed for cultivated land and forests, with values of 97.53% and 96.92%, respectively. Among the investigated land use types, the accuracies of wetland and unused land are comparatively low, but still reach 78.14% and 73.09%, respectively. The actual changes of wetland and unused land are marginal compared with other land use types, which may be the reason for the low accuracy. In short, the results exhibit high overall and local predictive accuracies. The calibrated CGELUC model is appropriate for projecting future land use structure.

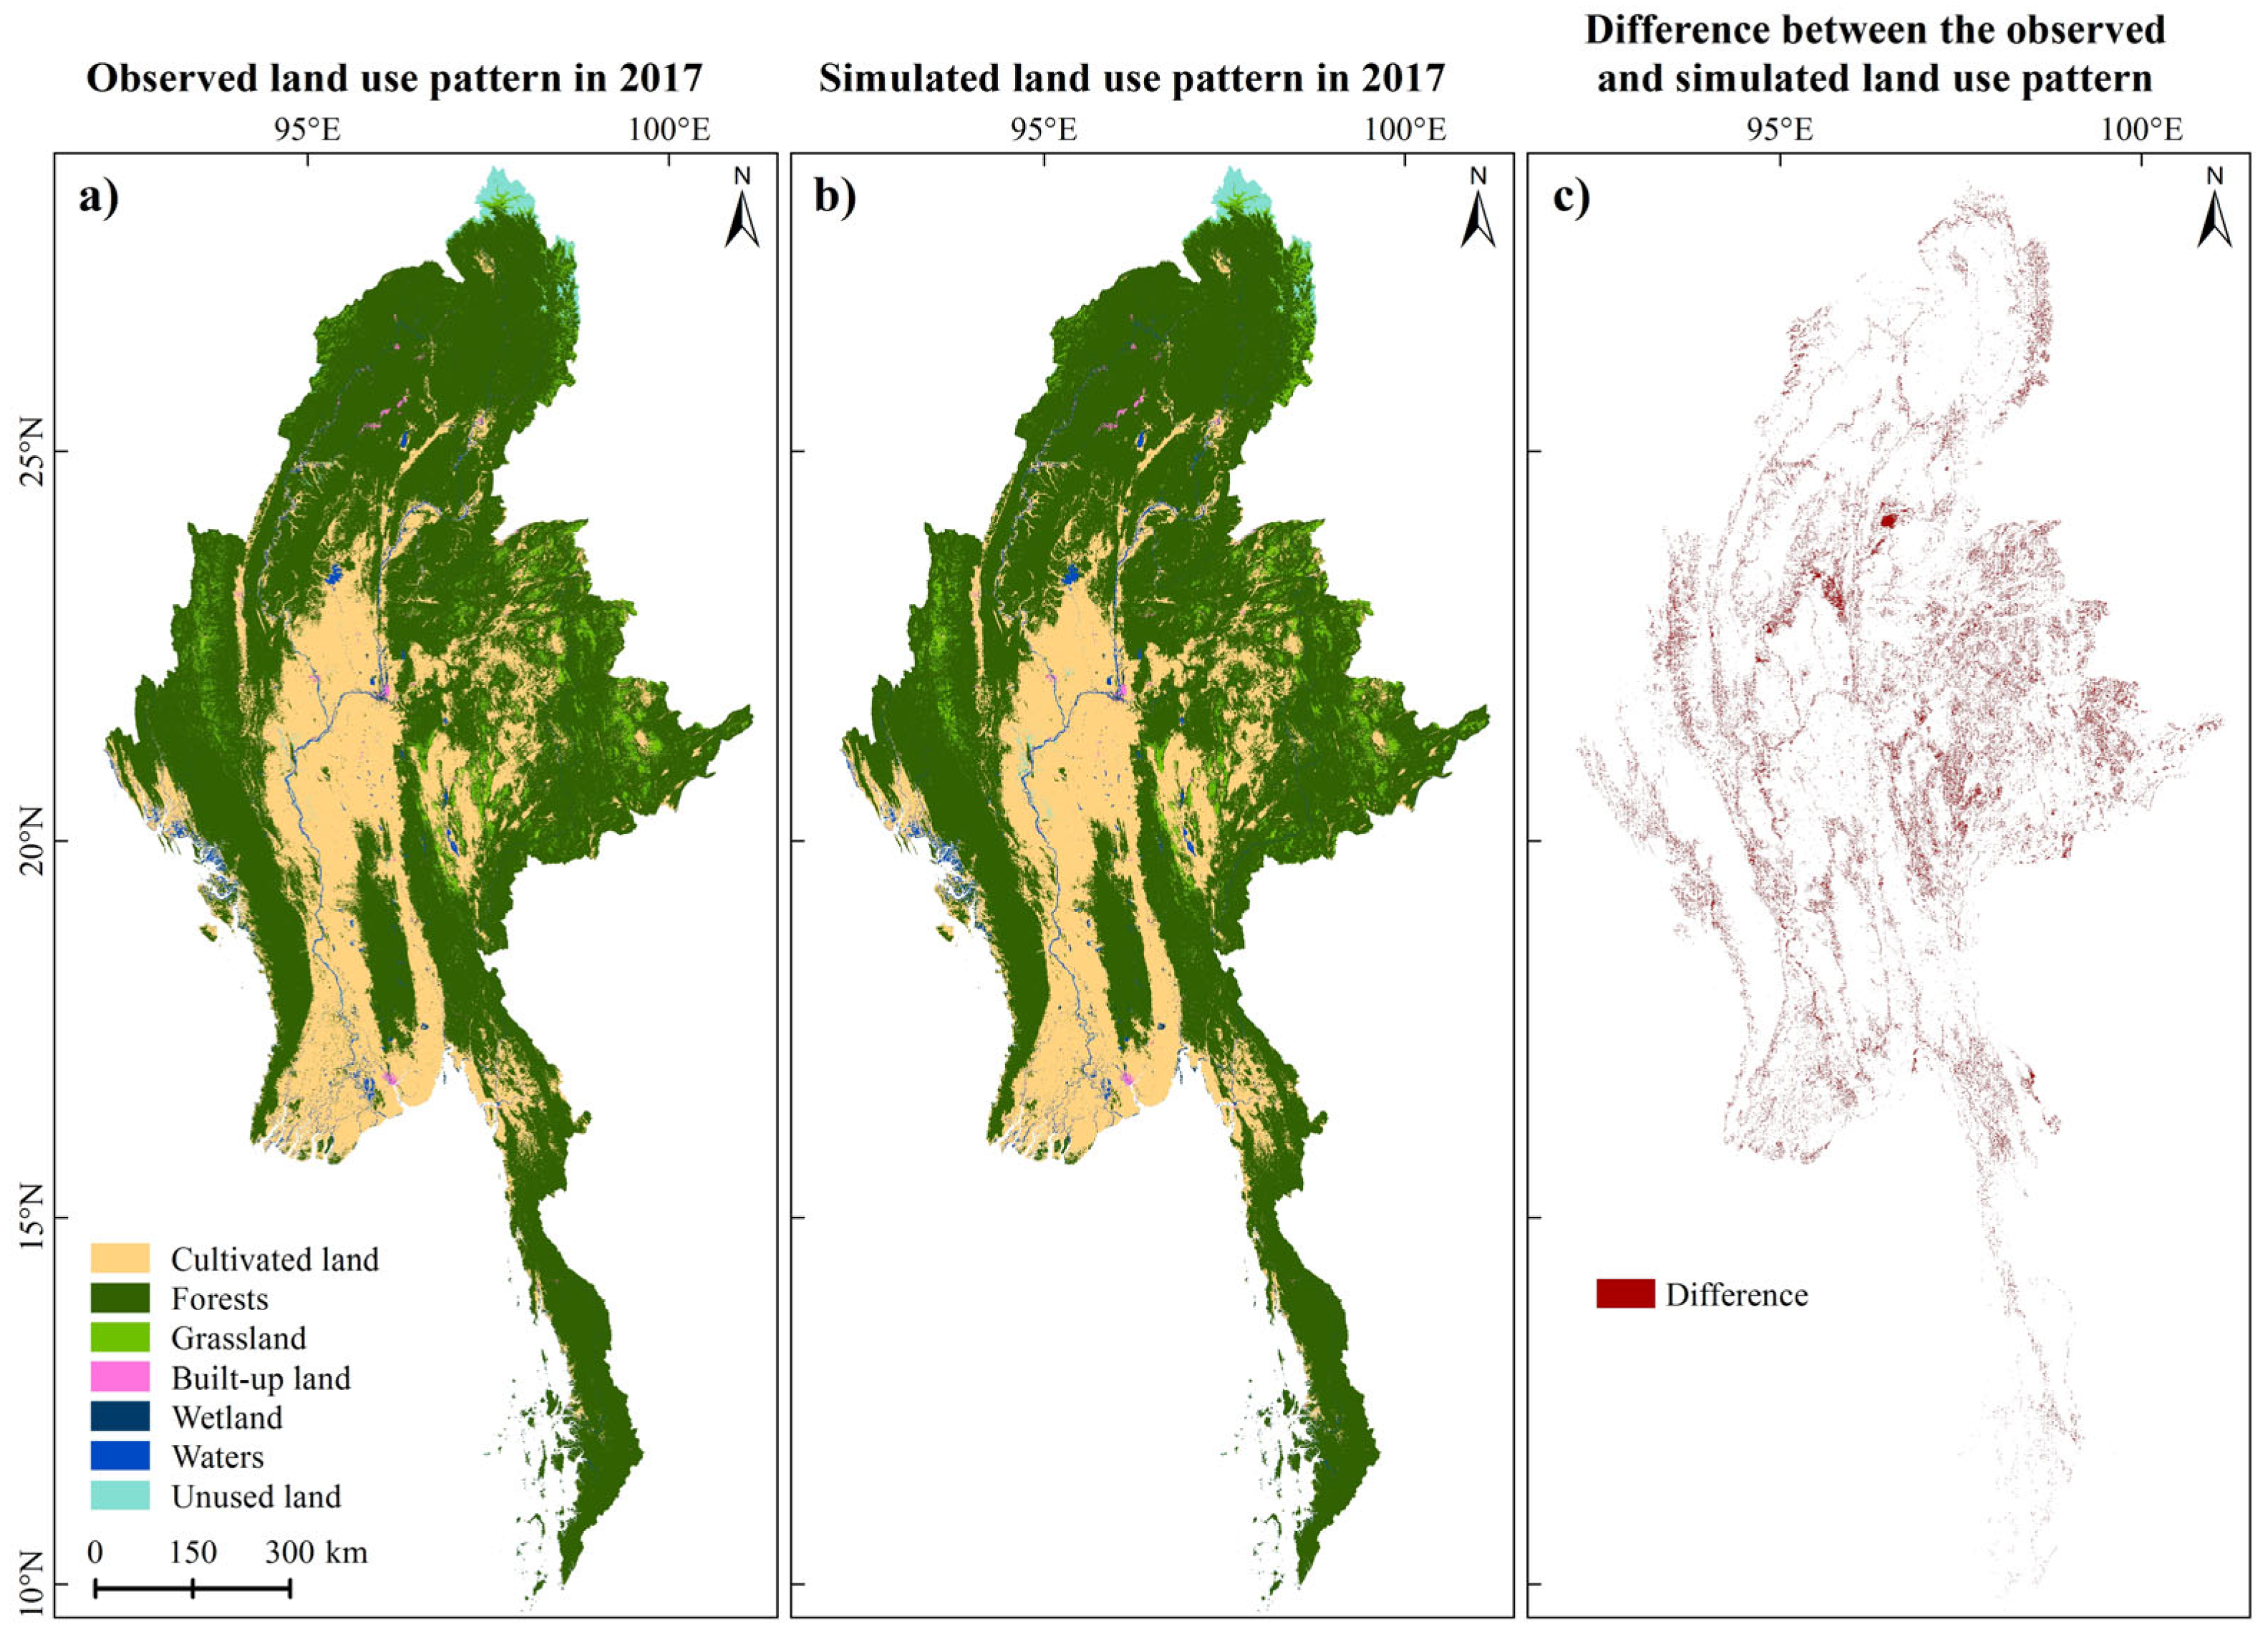
4.1.2. Accuracies of the Simulated Land Use Patterns

The difference between the observed and simulated land use patterns in 2017 is shown in Figure 4, reflecting the simulation errors. It is mainly distributed in northern and eastern Myanmar. The quantitative accuracies of the simulated land use patterns in 2013, 2015, and 2017 are presented in Table 4 and Table S1. The kappa coefficients and overall accuracies for all land use types in these years are high, with values of 0.84 and 92.3% in 2013, 0.83 and 91.99% in 2015, and 0.84 and 92.29% in 2017. In terms of the kappa coefficient of each land use type, the values of forests, cultivated land, and unused land are higher than 0.82 in the three years, and the values of grassland and wetland are relatively low, at 0.51 to 0.63. Given the complex natural conditions and considerable local differences in Myanmar, these accuracies are quite receivable for further land use projections.

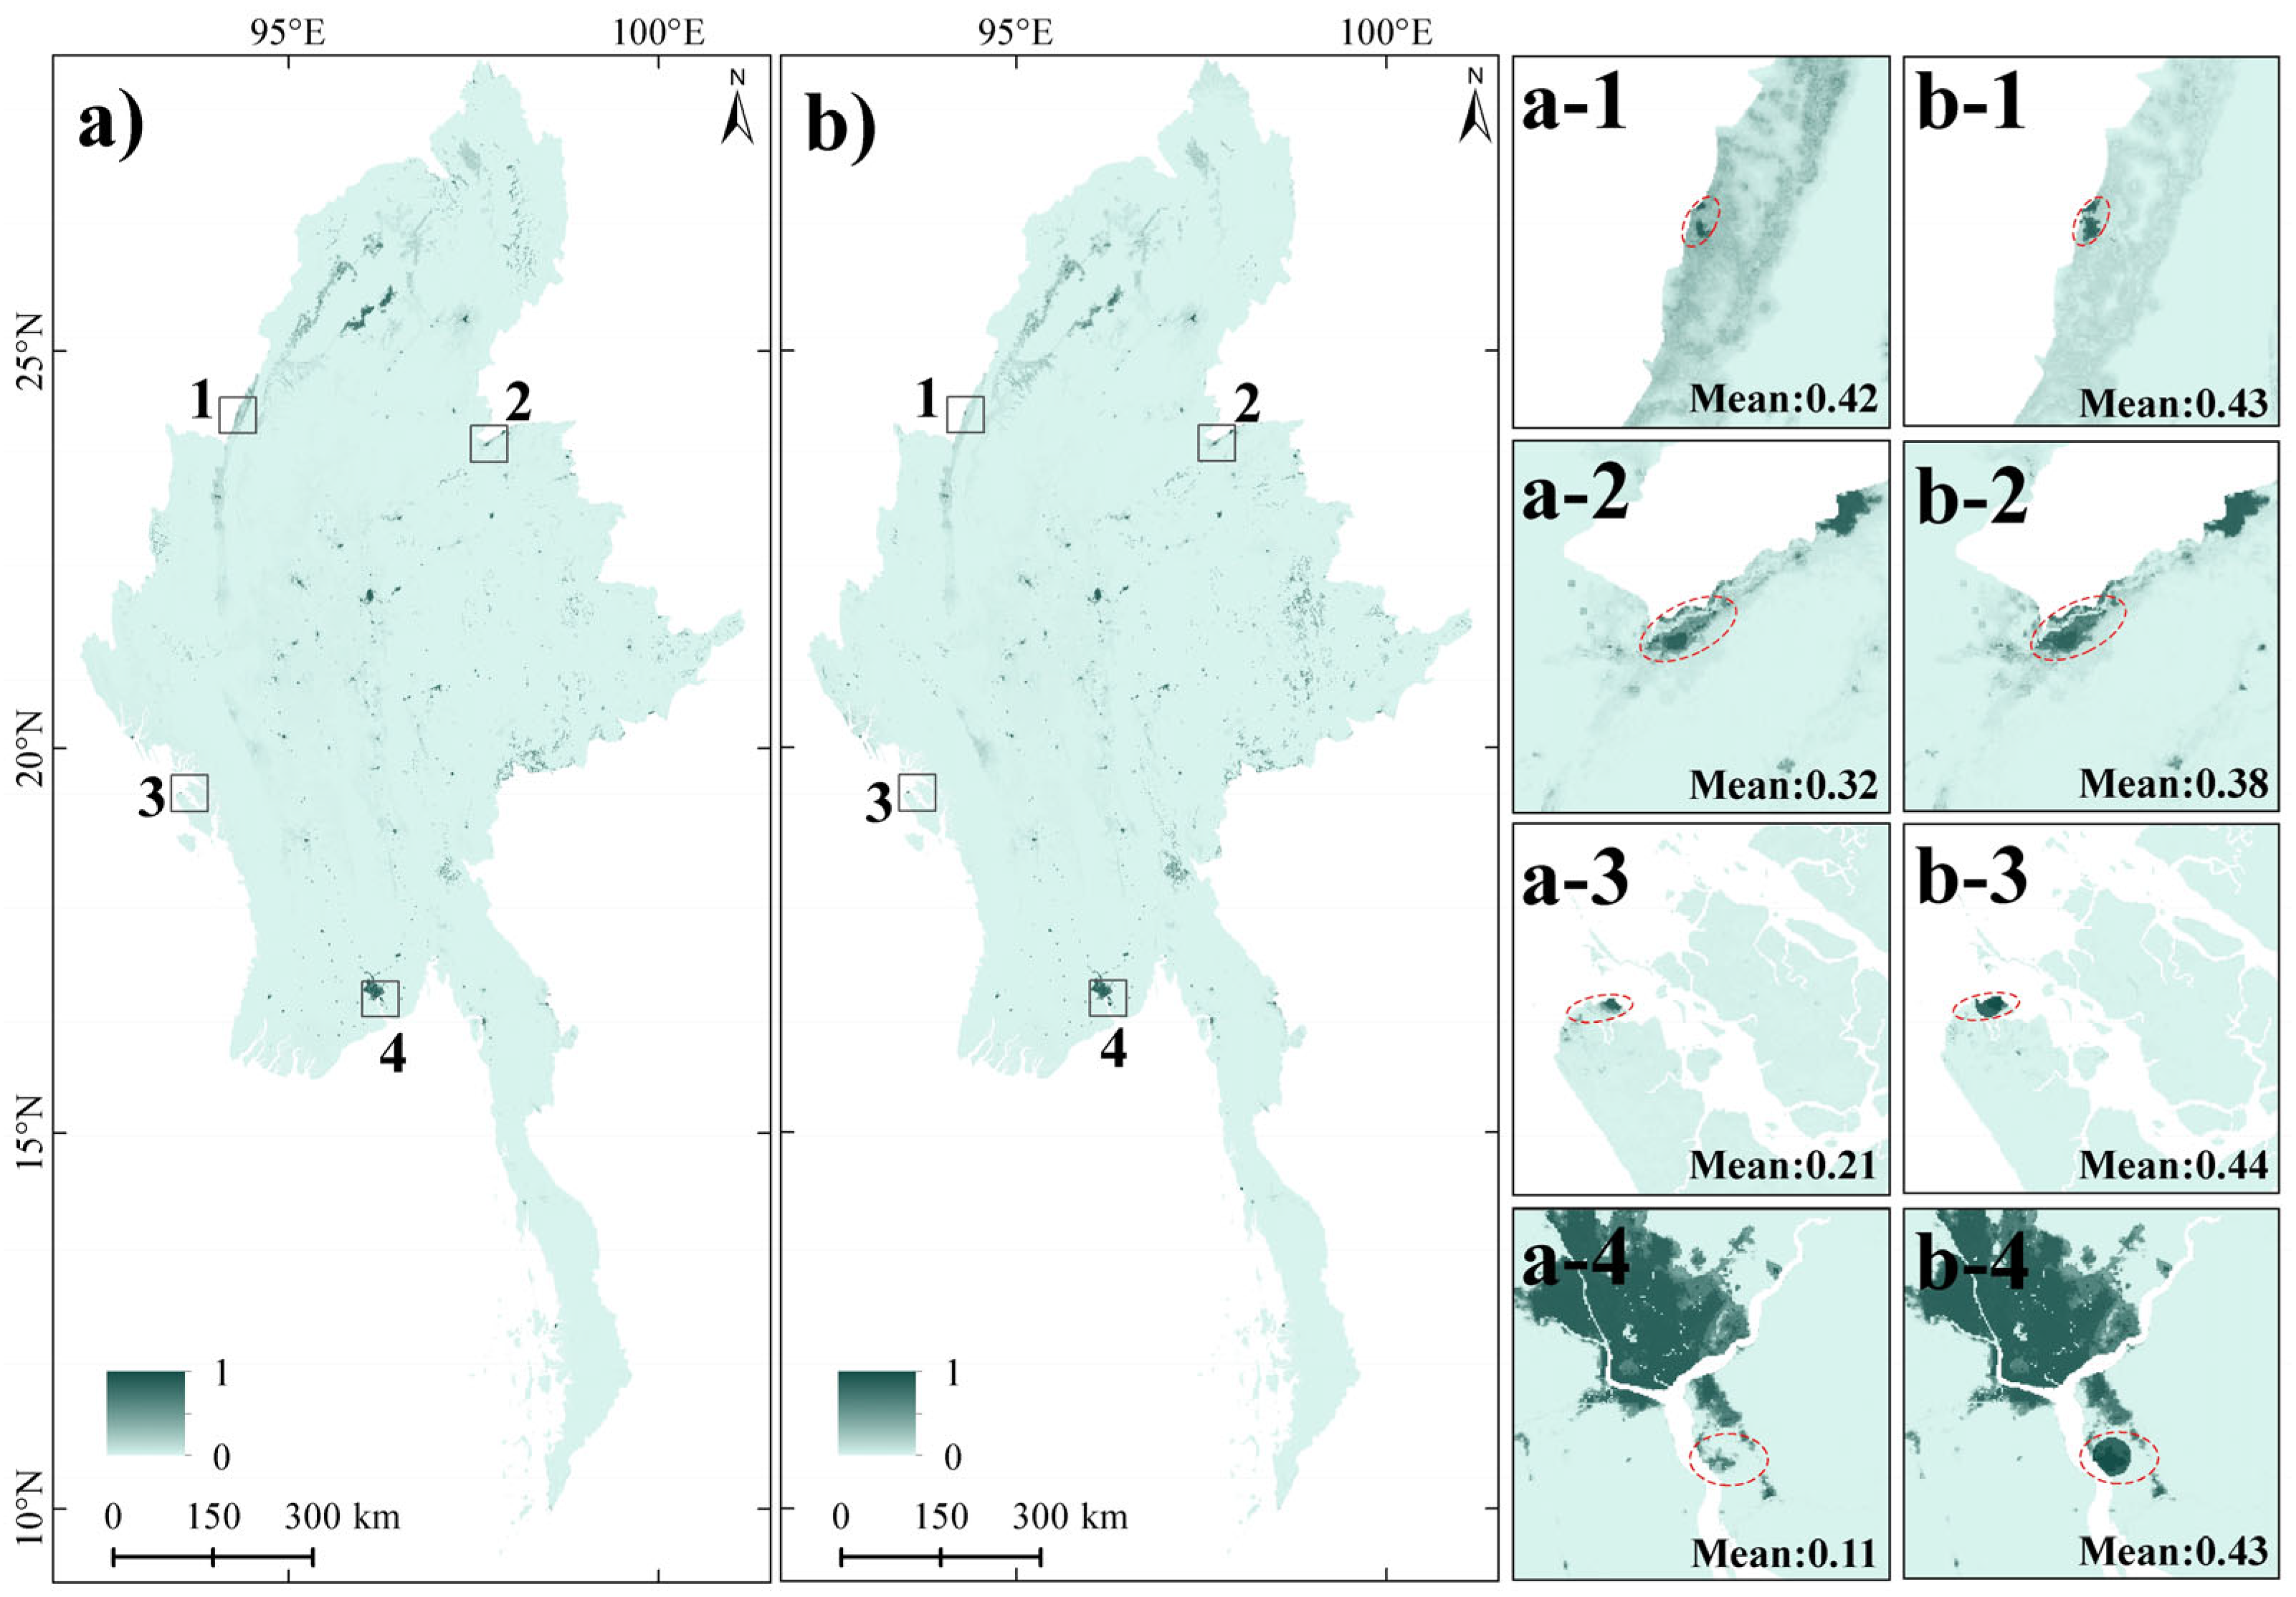
4.2. Performance of the Proposed Updated Mechanism for Planning Policies

The performance of the updated mechanism was checked by two ways: (1) analyzing the changes in historical and updated PoO surfaces of built-up land and (2) comparing the projected LUCs in SEZs under the three scenarios. As shown in Figure 5, the PoO values of built-up land show a growth trend under the effects of planning policies. Specifically, the mean PoO values of built-up land with the influences of the planning railways and stations (Figure 5b-1,b-2) increase by 0.01 and 0.06 compared with the historical values (Figure 5a-1,a-2), respectively. The high PoO values are gradually concentrated around the historical built-up land. Due to no historical built-up land within the neighborhoods of the three new SEZs in Myanmar, the PoO values of built-up land in the SEZs are very low, with the mean PoO values of 0.21 around the Kyaukpyu SEZ (Figure 5a-3) and 0.11 around the Thilawa SEZ (Figure 5a-4). Negligible growth of PoO values is witnessed around these SEZs by only considering the influences of the planning railway network. After using the second step of the proposed updated mechanism, significant changes in the PoO values of built-up land are exhibited in Figure 5b-3,b-4, with the mean PoO values of 0.44 around the Kyaukpyu SEZ (Figure 5b-2) and 0.43 around the Thilawa SEZ (Figure 5b-3).

4.3. Projected Land Use Structures from 2017 to 2050 in Myanmar

The cultivated land, grassland, and built-up land gradually expand at the expense of the forests from 2017 to 2050 under the three scenarios (Figure 6). The reductions of forests in the HD_scenario are obviously less than those in the BD_scenario and FD_scenario. The largest increase of cultivated land is found under the BD_scenario for the high dependence on agriculture. From 2017 to 2050, the scales of the occupied grassland under the FD_scenario, HD_scenario, and BD_scenario increase by 27,048.05 km2, 22,290.69 km2, and 26,584.11 km2, respectively. In the FD_scenario, the built-up land exhibits a fast growth to more than 5000 km2 by 2050, nearly tripling the amount in 2017. The smallest increment of built-up land is witnessed from 2017 to 2050 under the BD_scenario (2222.69 km2), indicating a decrease in the competitive advantage of built-up land. The wetland increases slightly under the HD_scenario, but it remains decreased under the other two scenarios. The unused land tends to decrease in the three scenarios, exhibiting the largest reduction in the HD_scenario. In summary, the demands of built-up land and cultivated land increase continually under all scenarios. Meanwhile, the wetland and forests are shrinking, suggesting that the eco-environment in Myanmar will worsen.

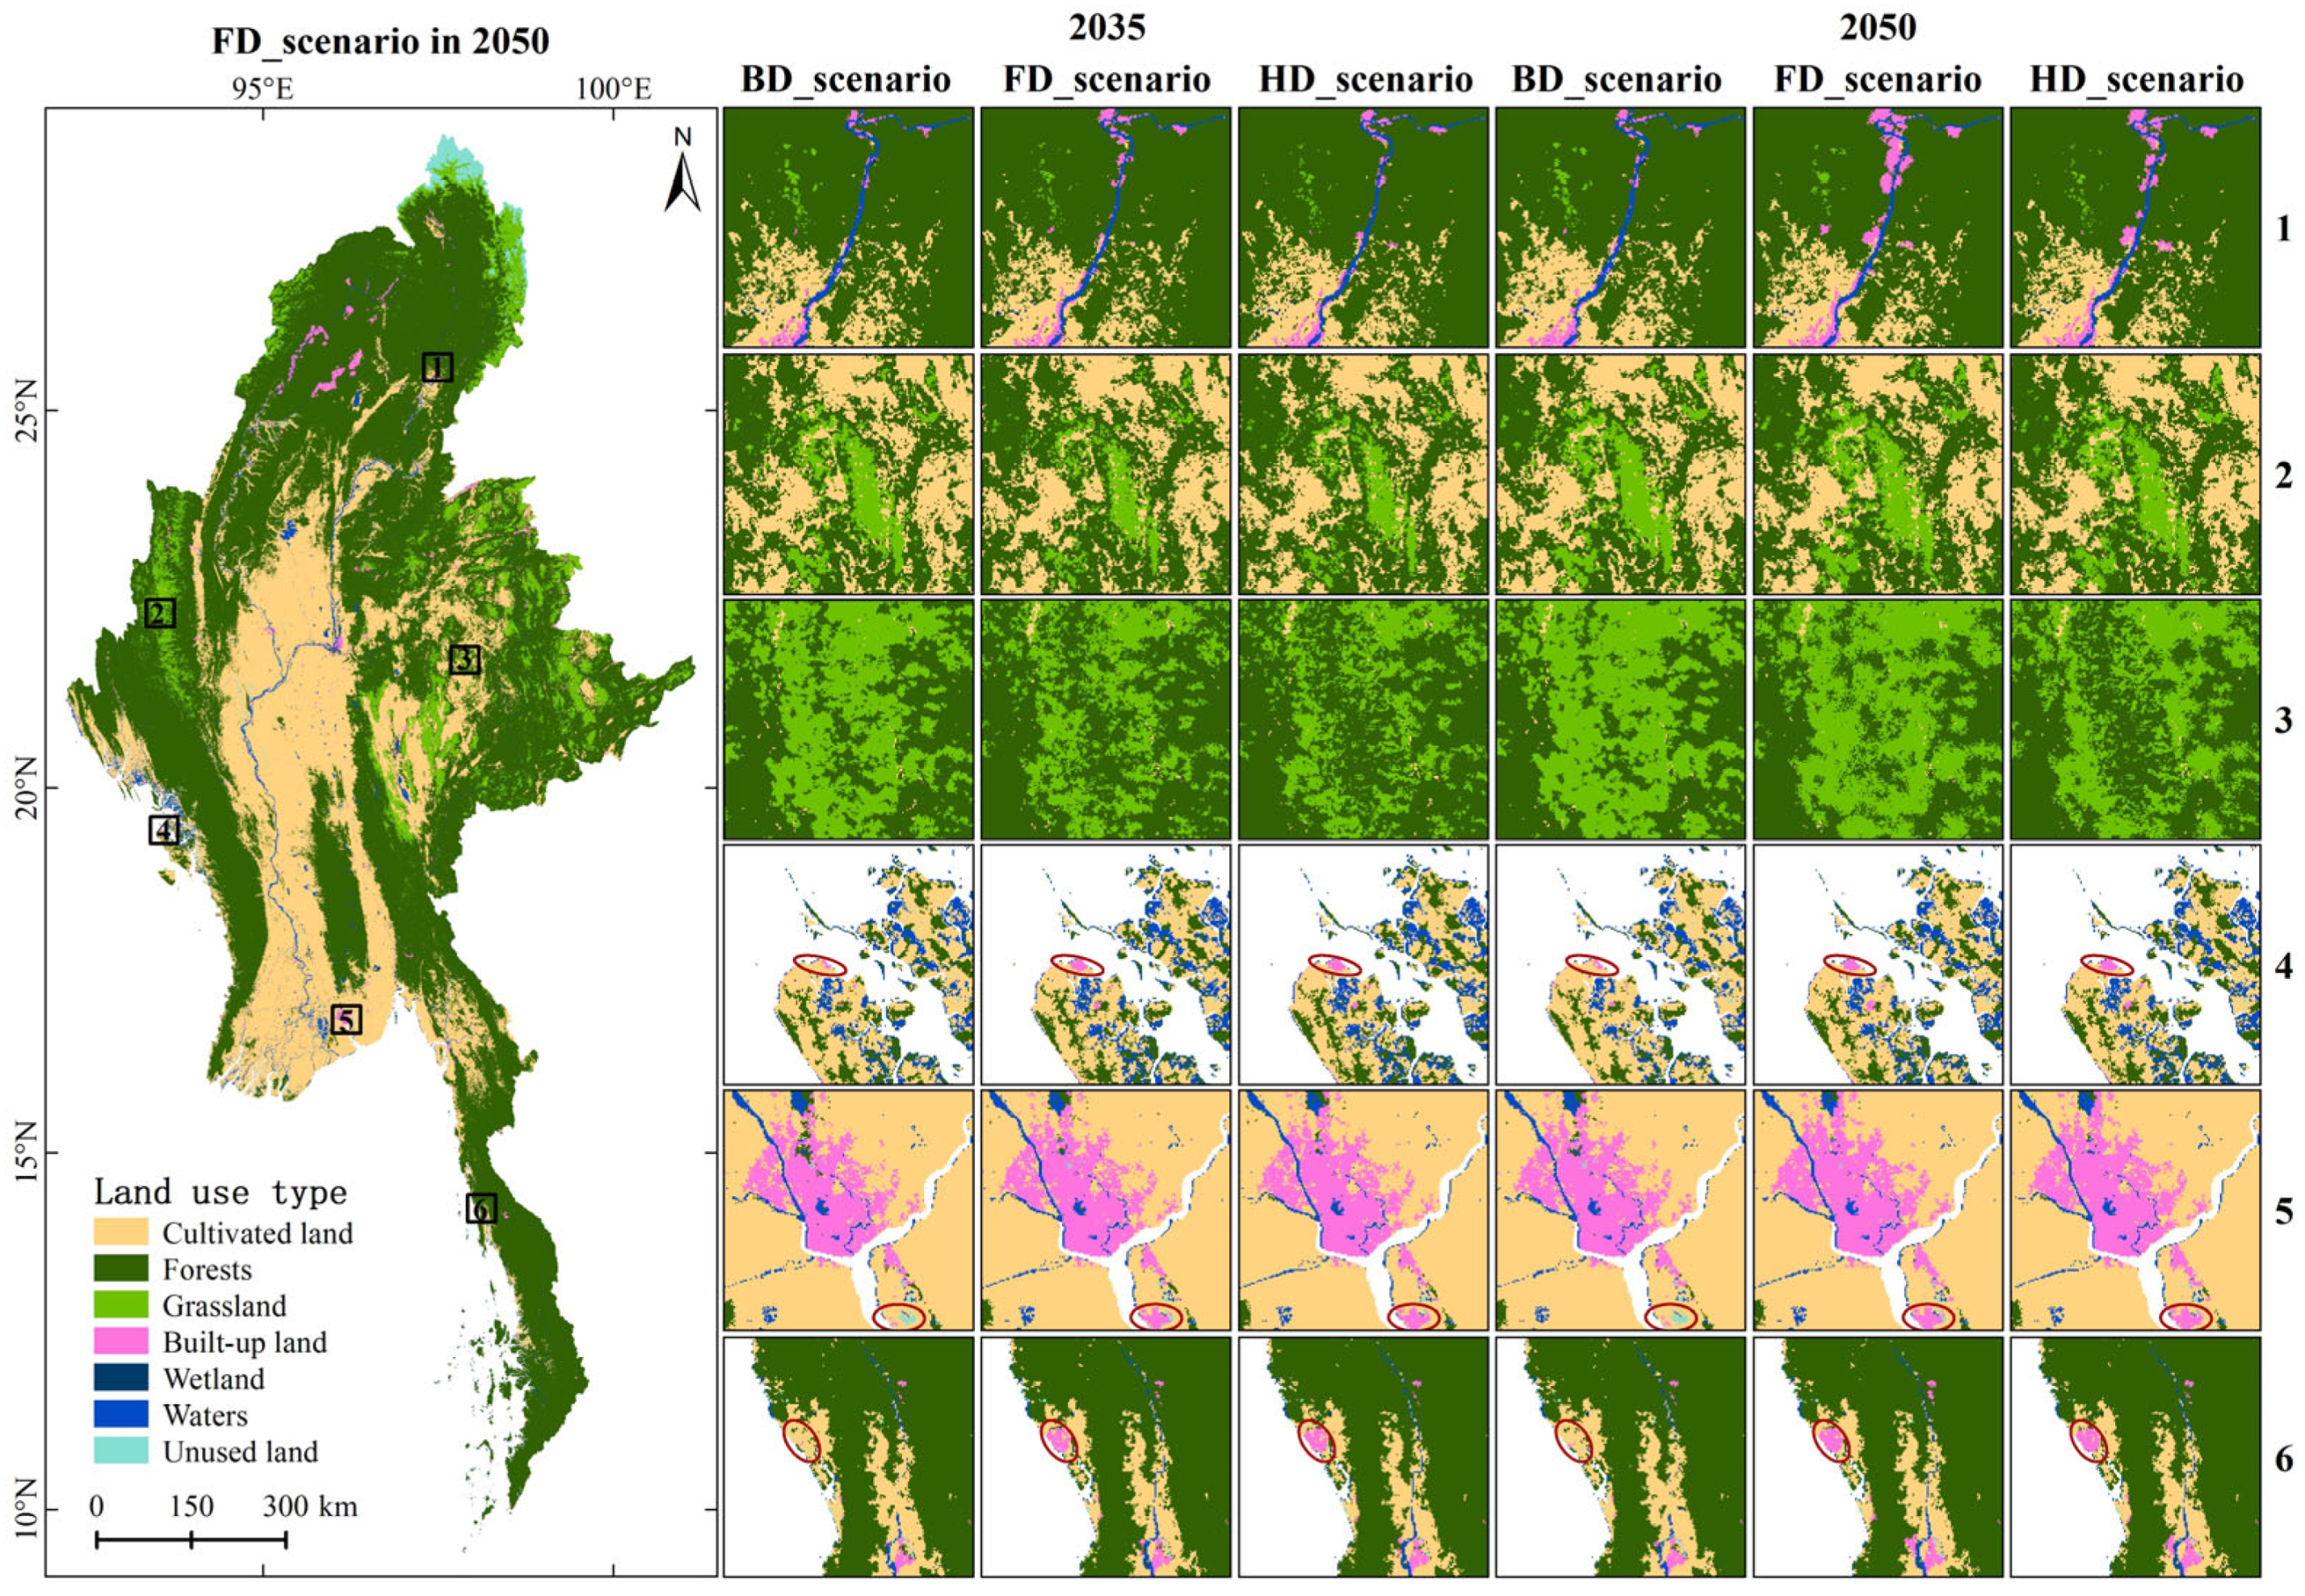
4.4. Simulated Spatial Pattern Dynamics in Myanmar

The succession of land use patterns in Myanmar shows overall consistency and local differences in all scenarios (Figure 7). The global spatial patterns of the projected results in the three scenarios are in accordance with those in 2017 (see Figure S1). The cultivated land is mainly distributed in flat areas, such as central and southern Myanmar. In addition, some cultivated land areas are distributed in mountainous areas of eastern Myanmar. The forest area is mainly concentrated in mountainous areas of Myanmar. The built-up land exhibits a characteristic of local agglomeration in metropolis (i.e., Mandalay and Yangon) and mining areas. The local characteristics of land use development under the three scenarios in 2035 and 2050 are different. Compared with the HD_scenario, the land use patterns in the BD_scenario and FD_scenario exhibit several characteristics. First, the cultivated land and grassland invade more forests and wetland, especially in mountainous areas of eastern Myanmar. Second, built-up land increasingly occupies more cultivated land and forests around the urban areas and mining areas, respectively. Third, forest area maintains less diversity in land use patterns in the intersection of forests, cultivated land, and grassland. Few and dispersed changes in wetland, waters, and unused land are observed, exhibiting an unapparent spatial characteristic.
According to the partial enlargements of zones 4–6 demonstrated in Figure 7, the simulated results of the three SEZs show different development trajectory. Without considering the impacts of the planning SEZs, the new built-up land will be only generated at the edge of the original built-up land, but still be absent in these SEZs. This phenomenon can be effectively addressed by considering the effects of the planning SEZs in the simulation. As depicted in Figure 7, new built-up land cannot be generated within the planning SEZs in 2035 and 2050 under the BD_scenario. However, under the scenarios considering the planning SEZs, new built-up land is found in the three SEZs, and it expands with time from 2017 to 2050. Therefore, planning policies are critical factors in tracking the land development trajectory and projecting future development patterns, especially the patterns of urban expansion, such as enclave-growth and leap-growth in an SEZ.

5. Discussion

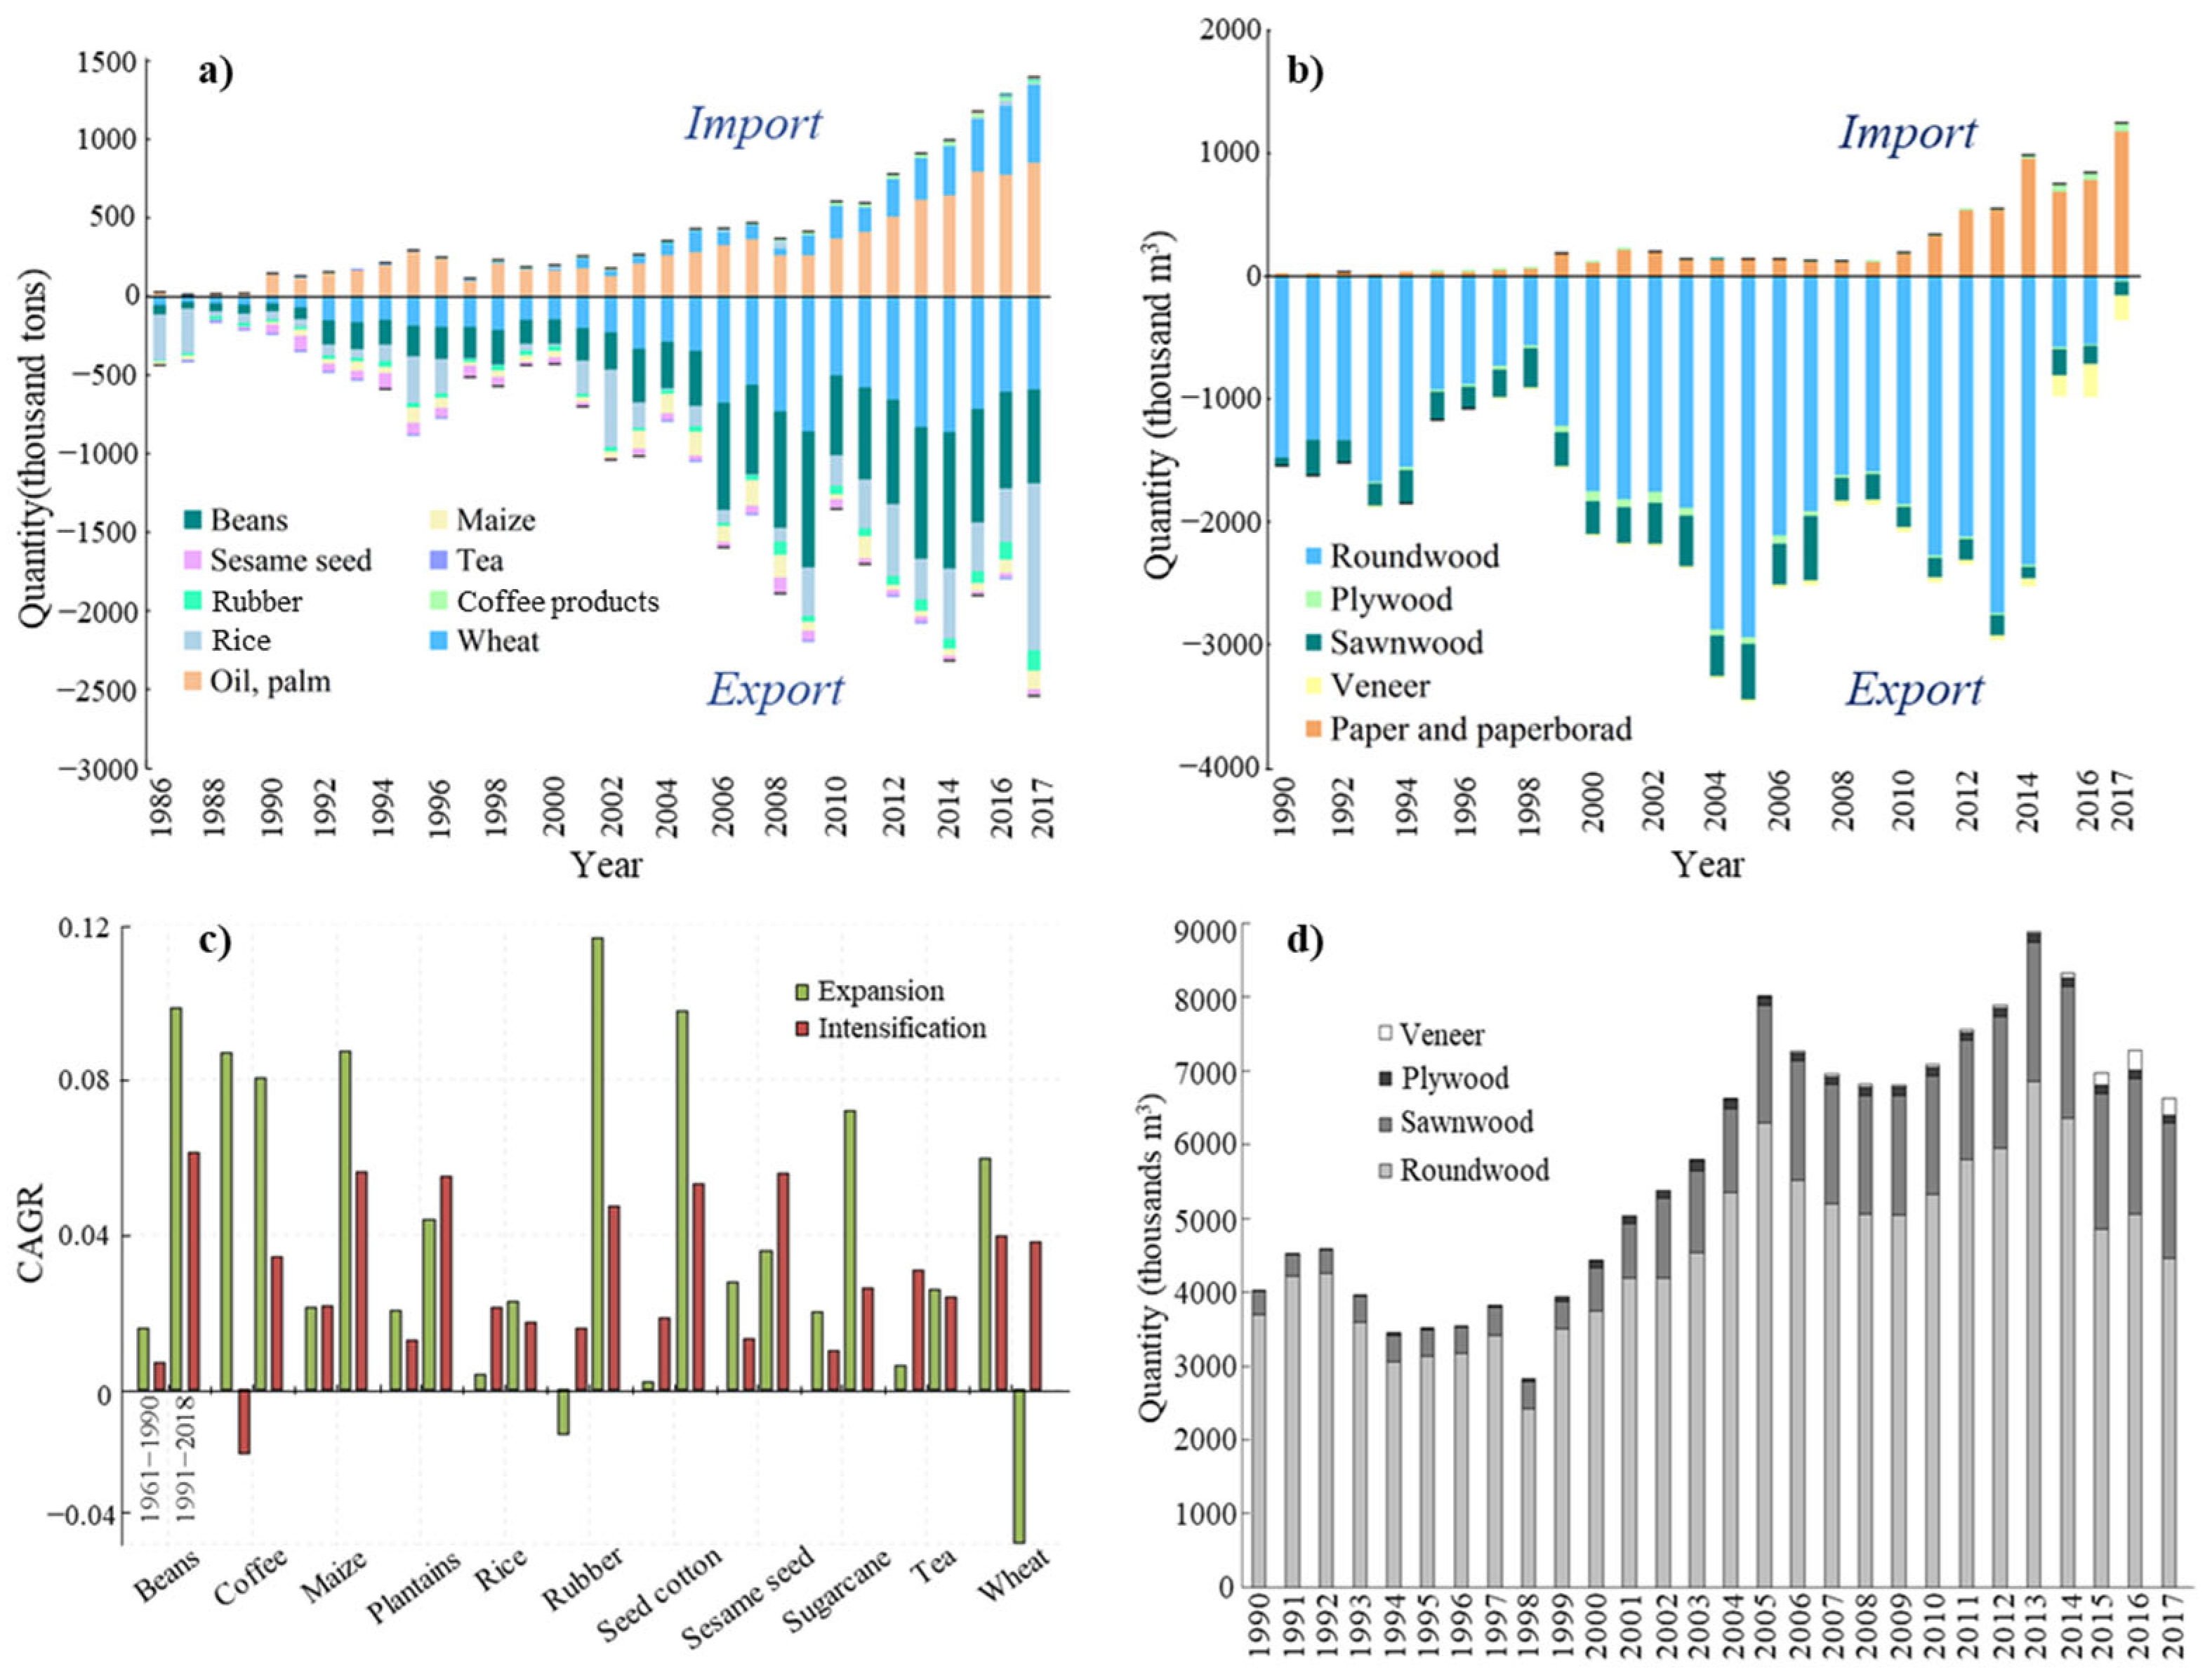
5.1. Policy-Level Drivers of Land Use Change in Myanmar

Myanmar is a country that relies largely on agriculture, taking up nearly 43% of its GDP [65]. To cope with population growth and promote economic development, numerous agriculture policies were adopted to support agricultural development [66]. In 1988, Myanmar ended its long political and economic isolation [32]. Subsequently, a sharp growth in the export volume of agricultural and forest products was witnessed (Figure 8a,b). Meanwhile, a phase of slight expansion and intensification (over 1961–1990) was typically followed by significant expansion (over 1991–2018 for beans, maize, rubber, seed cotton, and sugarcane) (Figure 8c), indicating the displacement of land in Myanmar. Before the export ban on raw logs was proposed in 2014 [35], the volume of the four main forest products produced increased annually (Figure 8d). A series of forest policies were issued to promote sustainability after the 1990s, which turned out to have little effect due to Myanmar’s strong aspiration for economic development [67]. Therefore, Myanmar’s nature forests have been tremendously converted to other land use types. According to this information, there is a significant conflict between economic development and forest protection, which is manifested by the trade-off and synergy between land use types.
Myanmar’s recent economic policies and reforms have focused on introducing foreign capital and upgrading infrastructures, which may bring about profound changes in many sectors [32]. In this context, this country actively cooperates with other countries (e.g., China, India, Thailand, and Japan) in various fields, such as energy, transportation, and SEZs [68,69]. Three SEZs and two international railways that link China, India, and Thailand have been planned [37,38]. According to the National Transport Master Plan, Myanmar intends to develop a rail network that can meet their demand by upgrading existing railways or constructing new railways [37]. In 2017, the ‘herringbone’ China–Myanmar economic corridor was proposed, indicating a more cohesive cooperation between China and Myanmar [70]. All the related information suggests Myanmar’s strong aspiration for economic development, which may further lead to a heavy conflict between economic development and forest protection.
Given the potential effects of investment and planning policies, this work adopted a coupling model to project future LUCs under different scenarios. The CGELUC model based on economic theory was applied to simulate the macro effects of investment on local land use structure. This model was triggered by the increasing investment and improving technical progress considering Myanmar’s macro policies. The result illustrates that the overall predictive accuracy of the simulated land use structure is acceptable. The effectiveness of this model has also been verified by Jin et al. [3]. The planning policies are the important factors for shaping the spatial patterns of land development, especially in urban areas [6,23]. This study proposed an updated mechanism to consider the impact of planning policies, including planning railways, railway stations, and SEZs. The result shows that the mean PoO values of the built-up land in the four specific zones (Figure 5) increase by 0.01, 0.06, 0.21, and 0.11, respectively. The proposed updated mechanism is similar to the work of Liang et al. [25], which has been proven to be an effective method for simulating the urban expansion pattern. Based on the proposed updated mechanism, the PoO values of the built-up land in the SEZs will rise and remain within [0, 1]. The updated PoO values in the SEZs maintain a similar distribution tendency with the historical values. The projected land use patterns in Yangon are similar to Sritarapipat et al. [71], indicating the credibility of the results. This updated mechanism can also be embedded in other land use allocation models, providing a base for further regional research on this topic.

5.2. Land Use Patterns under Different Scenarios

According to the land use patterns between 2017 and 2050, forests show a decreasing tendency under all scenarios. It is mainly encroached by cultivated land, built-up land, and grassland. Meanwhile, the expansion of cultivated land is mainly distributed in the mountainous area, which is an important habitat [72]. These trends are consistent with the characteristics of the historical LUC in Myanmar [32]. Two reasons can explain this distribution characteristic in future land use patterns: (1) the model is constructed based on the historical land use maps and driving factors, and (2) LUCs show strong directivity under the impact of human expectations [3]. According to Lim et al. [35], the decrease of forest land was mainly caused by agriculture expansion, infrastructure development, and economic investment, which are the same as the future possible drivers. This can explain the similar trends of LUC under different scenarios. As for the built-up land, it largely sprawls around the edges of the historic urban land under the BD_scenario. Due to the implementation of the updated mechanism, new built-up land is generated in the three SEZs under the HD_scenario and FD_Scenario, also suggesting the effectiveness of the updated mechanism.
By comparing the three LUC scenarios, the HD_scenario is the most optimal solution for Myanmar’s land sustainable development. Under the HD_scenario, the expansion of cultivated land, grassland, and built-up land are well-regulated, the shrink of forest area decreases greatly, and the land use pattern shows higher diversity. Specifically, the encroachment of cultivated land on forests in the mountainous areas can be effectively relieved, and the forest area is more inclined to convert to grassland. Meanwhile, urban sprawl will be encouraged in a controllable way, and a sustainable land development can be witnessed. These findings reveal that the strict implementation of the ecological protection policies is conducive to promoting harmonious development in Myanmar.

5.3. Uncertainties and Future Work

In this study, the SAM of Myanmar in 2017 was applied to establish the CGELUC model. The latest land use map of 2018 in this suit of data was used to verify the simulated result of the CGELUC model. This will bring uncertainty to our result due to the unknown effectiveness for long-time projection, even with a high accuracy obtained. The calibration of the FLUS model in this study is a static process only considering the relationship of historical land use data and driving factors at a certain stage, while their relationship actually varies with time. This may lead to uncertainty for future land use projection. Input data is the basis of model calibration and projection. Uncertainties in the input data will propagate through the model, later affecting the simulated result. The interactions among nature, society, economy, and land can generate a dynamic and complex system, and the simulation accuracy of the result is fatally influenced by the changed random variables, such as changes in global climate [2], national development strategies [25], domestic and international trade environments [73], and the willingness of residents [74]. Therefore, it is difficult to conceptualize a model to represent the ever-changing real world. In this study, a simple nature–socio-economic–land system was conceptualized based on the main structural and systemic characteristics of Myanmar, which may cause model uncertainties. The parameters of the scenario storylines are assumed based on previous research in our study, which may show high uncertainty for the unstable socio-economic system. The research of Verburg et al. [75] demonstrated that uncertainties in important parameters exhibited a comparatively high level of aggregation, translating into spatially various uncertainties in model outputs.
An elusive change in the relationship between land use and driving factors can be found with consideration of the uncertainties in this study. Therefore, a dynamic simulation system is expected to minimize the uncertainties of the long-term operation of the model in future work. The directionality of the predictive results is close to reality, which can provide a reference for land management. The results reveal that the HD_scenario is the optimal mode of development considering the goal of forest protection. It is noteworthy that the forest area under all three scenarios will be shrinking, which may lead to the degradation of ecosystem services. Many research works have reported that ecosystem services show close association with the land use structures and patterns [76,77,78]. Maintaining ecosystem services is bound to have significant implications for human and economic development [79,80]. Hence, the land use patterns need to be simulated and optimized to explore land ecological suitability. Furthermore, LUC is a critical indicator for research on ecological degradation by considering the influences of regional development. Further study on ecological risk assessment under various scenarios is needed to provide reasonable suggestions.

6. Conclusions

Given the macro policies implemented by Myanmar, the increasing investment and TFP were set to trigger the CGELUC model, aiming at projecting Myanmar’s future land use structures from 2017 to 2050 under three designed scenarios: BD_scenario, FD_scenario, and HD_scenario. Subsequently, the land use patterns in 2035 and 2050 under the three scenarios were simulated based on the FLUS model and the projected land use structures. Specifically, the impacts of planning policies were reflected by an updated mechanism, which was embedded in the FLUS model. The results show that the coupling model of the CGELUC and FLUS exhibits excellent performance in simulating land development, obtaining receivable predictive accuracies for the simulated land use structure and pattern. After using the updated mechanism, the PoO values of built-up land around historic urban areas and SEZs increase significantly (increasing from 0.01 to 0.21), and new built-up land emerges in the SEZs even if there is no historical built-up land around them. Affected by the growth of investment, the cultivated land and built-up land show an expansion tendency, and the forest area decreases annually. Land use distributions in 2035 and 2050 under all scenarios exhibit overall consistency and local differences, which are in accordance with those in 2017. The cultivated land and grassland show a tendency to encroach forest area in Myanmar’s mountainous areas under the three scenarios, and these changes are the least under the HD_scenario. Therefore, the HD_scenario is considered as the optimal path for achieving land development sustainability. The proposed method can simulate the effects of investment and planning policies on LUC, and the findings of this study could serve as the analytical basis for the sustainable land development in Myanmar.

Supplementary Materials

The following supporting information can be downloaded at: https://www.mdpi.com/article/10.3390/ijgi12010022/s1, Figure S1: Simulated spatial patterns of land use under different scenarios in 2035 and 2050; Table S1: Confusion matrices and user/prouder accuracies of the simulated land use patterns in 2013, 2015, and 2017; Section S1: Description of the scenario design. References [36,39,58,59,60,61,62,63,64] are cited in the supplementary materials.

Author Contributions

Yuan Jin conceived the experiments, performed the experiments, and wrote the paper; Ainong Li conceived and supervised the experiments, and reviewed the manuscript; Jinhu Bian, Xi Nan and Guangbin Lei reviewed the manuscript. All authors have read and agreed to the published version of the manuscript.

Funding

This research was supported jointly by the Strategic Priority Research Program of the Chinese Academy of Sciences (CAS) (XDA19030303), the National Natural Science Foundation project of China (42090015), and the National Key Research and Development Program of China (Grant No. 2020YFA0608702).

Data Availability Statement

These land use data are downloaded from SERVIR MEKONG (at: https://rlcms-servir.adpc.net/en/landcover/). The STRM DEM data are provided by NASA (http://gdex.cr.usgs.gov/gdex/). The soil property data are downloaded from zenodo (https://zenodo.org/). The climate records are acquired from the 2018 Myanmar Statistical Yearbook (http://mmsis.gov.mm/sub_menu/statistics/fileDb.jsp?code_code=001). The future climate data are downloaded from the CCAFS-Climate data portal (http://ccafs-climate.org). The protected areas are acquired from the Protected Planet (https://protectedplanet.net/). The Social Accounting Matrix of Myanmar in 2017 is downloaded from https://www.wider.unu.edu/publication/2017-social-accounting-matrix-myanmar. The population density map is downloaded from the Worldpop (https://www.worldpop.org/). The GDP map is obtained from datadryad (https://datadryad.org/stash/dataset/doi:10.5061/dryad.dk1j0). The planning railways and stations are listed in the Economic Research Institute for ASEAN and East Asia (https://map.eria.org/). The planning SEZs are recorded in Lancang-Mekong Economic Zones (https://lmezs.com/lancang-mekong/myanmar/special-economic-zones/?type=Special+Economic+Zone).

Acknowledgments

The authors would like to thank the reviewers and editors for their valuable comments and suggestions.

Conflicts of Interest

The authors declare no conflict of interest.

References

  1. Wang, C.; Wang, Y.; Wang, R.; Zheng, P. Modeling and evaluating land-use/land-cover change for urban planning and sustainability: A case study of Dongying city, China. J. Clean. Prod. 2018, 172, 1529–1534. [Google Scholar] [CrossRef]
  2. Roger, A.; Pielke, S. Land Use and Climate Change. Science 2005, 310, 1625–1626. [Google Scholar]
  3. Jin, G.; Chen, K.; Wang, P.; Guo, B.S.; Dong, Y.; Yang, J. Trade-offs in land-use competition and sustainable land development in the North China Plain. Technol. Forecast. Soc. Change 2019, 141, 36–46. [Google Scholar] [CrossRef]
  4. Lambin, E.F.; Meyfroidt, P. Global land use change, economic globalization, and the looming land scarcity. Proc. Natl. Acad. Sci. USA 2011, 108, 3465–3472. [Google Scholar] [CrossRef] [Green Version]
  5. Verburg, P.H.; Schulp, C.J.E.; Witte, N.; Veldkamp, A. Downscaling of land use change scenarios to assess the dynamics of European landscapes. Agric. Ecosyst. Environ. 2006, 114, 39–56. [Google Scholar] [CrossRef]
  6. Zhang, G.; Zheng, D.; Wu, H.; Wang, J.; Li, S. Assessing the role of high-speed rail in shaping the spatial patterns of urban and rural development: A case of the Middle Reaches of the Yangtze River, China. Sci. Total Environ. 2020, 704, 135399. [Google Scholar] [CrossRef]
  7. Muller, M.R.; Middleton, J. A Markov model of land-use change dynamics in the Niagara Region, Ontario, Canada. Landsc. Ecol. 1994, 9, 151–157. [Google Scholar]
  8. Luo, G.; Yin, C.Y.; Chen, X.; Xu, W.; Lu, L. Combining system dynamic model and CLUE-S model to improve land use scenario analyses at regional scale: A case study of Sangong watershed in Xinjiang, China. Ecol. Complex. 2010, 7, 198–207. [Google Scholar] [CrossRef]
  9. Zheng, X.Q.; Zhao, L.; Xiang, W.N.; Li, N.; Lv, L.N.; Yang, X. A coupled model for simulating spatio-temporal dynamics of land-use change: A case study in Changqing, Jinan, China. Landsc. Urban Plan. 2012, 106, 51–61. [Google Scholar] [CrossRef]
  10. Deng, X.Z. Modeling the Dynamics and Consequences of Land System Change; Higher Education Press: Beijing, China, 2010. [Google Scholar]
  11. Verburg, P.H.; Eickhout, B.; van Meijl, H. A multi-scale, multi-model approach for analyzing the future dynamics of European land use. Ann. Reg. Sci. 2008, 42, 57–77. [Google Scholar] [CrossRef] [Green Version]
  12. Deng, X.Z.; Yin, F.; Lin, Y.Z.; Jin, Q.; Qu, R.J. Equilibrium analyses on structural changes of land uses in Jiangxi Province. J. Food Agric. Environ. 2012, 10, 846–852. [Google Scholar]
  13. Verburg, P.H.; Soepboer, W.; Veldkamp, A.; Limpiada, R.; Espaldon, V.; Mastura, S.S. Modeling the spatial dynamics of regional land use: The CLUE-S model. Environ. Manag. 2002, 30, 391–405. [Google Scholar] [CrossRef]
  14. Liu, X.P.; Liang, X.; Li, X.; Xu, X.C.; Ou, J.P.; Chen, Y.M.; Li, S.Y.; Wang, S.J.; Pei, F.S. A future land use simulation model (FLUS) for simulating multiple land use scenarios by coupling human and natural effects. Landsc. Urban Plan. 2017, 168, 94–116. [Google Scholar] [CrossRef]
  15. Wang, Q.; Guan, Q.; Lin, J.; Luo, H.; Tan, Z.; Ma, Y. Simulating land use/land cover change in an arid region with the coupling models. Ecol. Indic. 2021, 122, 107231. [Google Scholar] [CrossRef]
  16. Liang, X.; Liu, X.; Li, X.; Chen, Y.; Tian, H.; Yao, Y. Delineating multi-scenario urban growth boundaries with a CA-based FLUS model and morphological method. Landsc. Urban Plan. 2018, 177, 47–63. [Google Scholar] [CrossRef]
  17. Guo, H.; Cai, Y.; Yang, Z.; Zhu, Z.; Ouyang, Y. Dynamic simulation of coastal wetlands for Guangdong-Hong Kong-Macao Greater Bay area based on multi-temporal Landsat images and FLUS model. Ecol. Indic. 2021, 125, 107559. [Google Scholar] [CrossRef]
  18. Chen, Z.; Huang, M.; Zhu, D.; Altan, O. Integrating Remote Sensing and a Markov-FLUS Model to Simulate Future Land Use Changes in Hokkaido, Japan. Remote Sens. 2021, 13, 2621. [Google Scholar] [CrossRef]
  19. Li, X.; Liu, X. An extended cellular automaton using case-based reasoning for simulating urban development in a large complex region. Int. J. Geogr. Inf. Sci. 2006, 20, 1109–1136. [Google Scholar] [CrossRef]
  20. Viana, C.M.; Santos, M.; Freire, D.; Abrantes, P.; Rocha, J. Evaluation of the factors explaining the use of agricultural land: A machine learning and model-agnostic approach. Ecol. Indic. 2021, 131, 108200. [Google Scholar] [CrossRef]
  21. Brady, M.; Sahrbacher, C.; Kellermann, K.; Happe, K. An agent-based approach to modeling impacts of agricultural policy on land use, biodiversity and ecosystem services. Landsc. Ecol. 2012, 27, 1363–1381. [Google Scholar] [CrossRef]
  22. Cheng, Q.; Jiang, P.; Cai, L.; Shan, J.; Zhang, Y.; Wang, L.; Li, M.; Li, F.; Zhu, A.; Chen, D. Delineation of a permanent basic farmland protection area around a city centre: Case study of Changzhou city, China. Land Use Policy 2017, 60, 73–89. [Google Scholar]
  23. Zhao, L.; Shen, L. The impacts of rail transit on future urban land use development: A case study in Wuhan, China. Transp. Policy 2019, 81, 396–405. [Google Scholar] [CrossRef]
  24. Liang, X.; Liu, X.; Chen, G.; Leng, J.; Wen, Y.; Chen, G. Coupling fuzzy clustering and cellular automata based on local maxima of development potential to model urban emergence and expansion in economic development zones. Int. J. Geogr. Inf. Sci. 2020, 34, 1930–1952. [Google Scholar] [CrossRef]
  25. Liang, X.; Liu, X.P.; Li, D.; Zhao, H.; Chen, G.Z. Urban growth simulation by incorporating planning policies into a CA-based future land-use simulation model. Int. J. Geogr. Inf. Sci. 2018, 32, 2294–2316. [Google Scholar] [CrossRef]
  26. Lewis, D.J.; Yang, X.H.; Moise, D.; Roddy, S.J. Dynamic synergies between China’s Belt and Road Initiative and the UN’s Sustainable Development Goals. J. Int. Bus. Policy 2021, 4, 58–79. [Google Scholar] [CrossRef]
  27. Malaysia Says It Stands to Reap Benefits from Belt and Road Initiative. Available online: https://eng.yidaiyilu.gov.cn/qwyw/rdxw/32071.htm (accessed on 30 October 2017).
  28. Lechner, A.M.; Chan, F.K.S.; Campos-Arceiz, A. Biodiversity conservation should be a core value of China’s Belt and Road Initiative. Nat. Ecol. Evol. 2018, 2, 408–409. [Google Scholar] [CrossRef]
  29. Ng, L.S.; Campos-Arceiz, A.; Sloan, S.; Hughes, A.C.; Tiang, D.C.F.; Li, B.V.; Lechner, A.M. The scale of biodiversity impacts of the Belt and Road Initiative in Southeast Asia. Biol. Conserv. 2020, 248, 108691. [Google Scholar] [CrossRef]
  30. Rimal, B.; Zhang, L.; Keshtkar, H.; Wang, N.; Lin, Y. Monitoring and Modeling of Spatiotemporal Urban Expansion and Land-Use/Land-Cover Change Using Integrated Markov Chain Cellular Automata Model. ISPRS Int. J. Geo-Inf. 2017, 6, 288. [Google Scholar] [CrossRef] [Green Version]
  31. Leimgruber, P.; Kelly, D.S.; Steininger, M.K.; Brunner, J.; Müller, T.; Songer, M. Forest cover change patterns in Myanmar (Burma) 1990–2000. Environ. Conserv. 2005, 32, 356–364. [Google Scholar] [CrossRef] [Green Version]
  32. Bhagwat, T.; Hess, A.; Horning, N.; Khaing, T.; Thein, Z.M.; Aung, K.M.; Aung, K.H.; Phyo, P.; Tun, Y.L.; Oo, A.H.; et al. Losing a jewel-Rapid declines in Myanmar’s intact forests from 2002–2014. PLoS ONE 2017, 12, e0176364. [Google Scholar] [CrossRef] [Green Version]
  33. Vadrevu, K.; Heinimann, A.; Gutman, G.; Justice, C. Remote sensing of land use/cover changes in South and Southeast Asian Countries. Int. J. Digit. Earth 2019, 12, 1099–1102. [Google Scholar] [CrossRef]
  34. Jin, Y.; Li, A.N.; Bian, J.H.; Nan, X.; Lei, G.B.; Muhammad, K. Spatiotemporal analysis of ecological vulnerability along Bangladesh-China-India-Myanmar economic corridor through a grid level prototype model. Ecol. Indic. 2021, 120, 106933. [Google Scholar] [CrossRef]
  35. Lim, C.L.; Prescott, G.W.; DeAlban, J.D.T.; Ziegler, A.D.; Webb, E.L. Untangling the proximate causes and underlying drivers of deforestation and forest degradation in Myanmar. Conserv. Biol. 2017, 31, 1362–1372. [Google Scholar] [CrossRef] [PubMed] [Green Version]
  36. Ministry of Planning and Finance. Myanmar Sustainable Development Plan (2018–2030). 2018. Available online: http://www.themimu.info/sites/themimu.info/files/documents/Core_Doc_Myanmar_Sustainable_Development_Plan_2018_-_2030_Aug2018.pdf (accessed on 20 August 2021).
  37. Ministry of Rail Transportation Myanmar Railways. Developing a Myanma’s Rail Network that Meet Demand. 2015. Available online: https://www.unescap.org/sites/default/files/Myanmar-TAR-WGM-4.pdf (accessed on 1 September 2021).
  38. Ministry of Rail Transportation Myanmar Railways. Rail Infrastructure Development Plan and Planning for International Railway Connectivity in Myanmar. 2019. Available online: https://www.unescap.org/sites/default/files/Item5_Myanmar_0.pdf (accessed on 5 September 2021).
  39. Myanmar Investment Commission. Myanmar Investment Promotion Plan. 2018. Available online: https://www.dica.gov.mm/sites/dica.gov.mm/files/news-files/mipp_english_version_with_cover_pages.pdf (accessed on 23 August 2021).
  40. Keuning, S.J.; de Ruuter, W.A. Guidelines to the Construction of a Social Accounting Matrix. Rev. Income Wealth 1988, 34, 71–100. [Google Scholar] [CrossRef]
  41. Keller, W.; Borkowski, A. Thin plate spline interpolation. J. Geod. 2019, 93, 1251–1269. [Google Scholar] [CrossRef]
  42. Navarro-Racines, C.; Tarapues, J.; Thornton, P.; Jarvis, A.; Ramirez-Villegas, J. High-resolution and bias-corrected CMIP5 projections for climate change impact assessments. Sci. Data 2020, 7, 7. [Google Scholar] [CrossRef] [Green Version]
  43. Saah, D.S.; Towashiraporn, P.; Aekakkararungroj, A.; Phongsapan, K.; Triepke, J.; Maus, P.; Tenneson, K.; Cutter, P.G.; Ganz, D.; Anderson, E. Mekong Land Cover Dasboard: Regional Land Cover Mointoring Systems. In AGU Fall Meeting Abstracts; American Geophysical Union: San Francisco, CA, USA, 2016; p. IN51B-1837. [Google Scholar]
  44. van Seventer, D.; Tarp, F.; San, N.N.; Htwe, S.T.N. A 2017 Social Accounting Matrix for Myanmar. In WIDER Working Paper 2020/66; UNU-WIDER: Helsinki, Sweden, 2020. [Google Scholar]
  45. Lloyd, C.T.; Chamberlain, H.; Kerr, D.; Yetman, G.; Pistolesi, L.; Stevens, F.R.; Gaughan, A.E.; Nieves, J.J.; Hornby, G.; MacManus, K.; et al. Global spatio-temporally harmonised datasets for producing high-resolution gridded population distribution datasets. Big Earth Data 2019, 3, 108–139. [Google Scholar] [CrossRef] [Green Version]
  46. Kummu, M.; Taka, M.; Guillaume, J.H.A. Data from: Gridded global datasets for Gross Domestic Product and Human Development Index over 1990–2015. Dryad 2020. [Google Scholar] [CrossRef]
  47. List of Railway Stations in Myanmar. Available online: https://en.wikipedia.org/wiki/List_of_railway_stations_in_Myanmar (accessed on 12 March 2022).
  48. MIMU. Myanmar Information Management Unit Geospatial Datasets. 2022. Available online: https://www.themimu.info/gis-resources-agency-maps (accessed on 26 March 2022).
  49. UNEP-WCMC. Protected Planet: The World Database on Protected Areas (WDPA); Cambridge University: Cambridge, UK, 2018. [Google Scholar]
  50. van Zyl, J.J. The Shuttle Radar Topography Mission (SRTM): A breakthrough in remote sensing of topography. Acta Astronaut. 2001, 48, 559–565. [Google Scholar] [CrossRef]
  51. Hengl, T.; Wheeler, I. Soil organic carbon content in x 5 g/kg at 6 standard depths (0, 10, 30, 60, 100 and 200 cm) at 250 m resolution, Version v0.2. Zenodo 2018. [Google Scholar] [CrossRef]
  52. Hengl, T. Soil pH in H2O at 6 standard depths (0, 10, 30, 60, 100 and 200 cm) at 250 m resolution, Version v0.2. Zenodo 2018. [Google Scholar] [CrossRef]
  53. Hengl, T. Clay content in % (kg/kg) at 6 standard depths (0, 10, 30, 60, 100 and 200 cm) at 250 m resolution, Version v0.2. Zenodo 2018. [Google Scholar] [CrossRef]
  54. CSO. Myanmar Statistical Yearbook; Central Statistical Organization: Yangon, Myanmar, 2018.
  55. Hapsari, T.S.; Amelia, R. Summary of ERIA Research Projects 2019–2020. 2021. Available online: https://think-asia.org/bitstream/handle/11540/13502/2020-July-Summary-Of-ERIA-Research-Projects-2019-2020-Interactive.pdf?sequence=1 (accessed on 17 May 2021).
  56. Lancang-Mekong Economic Zones. Available online: https://lmezs.com/lancang-mekong/myanmar/special-economic-zones/?type=Special+Economic+Zone (accessed on 15 March 2020).
  57. Xie, X.; Li, A.; Tian, J.; Wu, C.; Jin, H. A fine spatial resolution estimation scheme for large-scale gross primary productivity (GPP) in mountain ecosystems by integrating an eco-hydrological model with the combination of linear and non-linear downscaling processes. J. Hydrol. 2023, 616, 128833. [Google Scholar] [CrossRef]
  58. Myanmar Drafts New Five-Year Plan to Boost Economy. Available online: https://investvine.com/myanmar-drafts-new-five-year-plan-to-boost-economy/#:~:text=Myanmar%E2%80%99s%2020-year%20National%20Comprehensive%20Development%20Plan%20was%20framed,2030-31%20and%20its%20per%20capita%20GDP%20to%20%243%2C000.html (accessed on 17 December 2015).
  59. Saitama University. Long-Term Projection of Myanmar Economy by Macro Econometric Model. 2015. Available online: https://mpra.ub.uni-muenchen.de/64412/ (accessed on 23 May 2020).
  60. Myanmar Total Investment, % of GDP. Available online: https://data.nasdaq.com/data/ODA/MMR_NID_NGDP-myanmar-total-investment-of-gdp (accessed on 23 March 2020).
  61. Asian Productivity Organization. APO Productivity Databook 2014. 2014. Available online: https://www.apo-tokyo.org/publications/apo-productivity-databook-2014/ (accessed on 15 May 2021).
  62. Asian Productivity Organization. APO Productivity Databook 2020. 2020. Available online: https://www.apo-tokyo.org/publications/2020-apo-productivity-databook/ (accessed on 15 May 2021).
  63. Department of Population Ministry of Labour, Immigration and Population. Thematic Report on Population Projections for the Union of Myanmar, States/Regions, Rural and Urban Areas, 2014–2050. 2017. Available online: https://myanmar.unfpa.org/en/census (accessed on 23 August 2021).
  64. Ministry of Natural Resources and Environmental Conservation. Myanmar Climate Change Strategy (2018–2030). 2019. Available online: https://myanmar.un.org/sites/default/files/2019-11/MyanmarClimateChangeStrategy_2019.pdf (accessed on 17 May 2021).
  65. Haggblade, S.; Boughton, D.; Cho, K.M.; Denning, G.; Kloeppinger-Todd, R.; Oo, Z.; Sandar, T.M.; Than, T.M.; Wai, N.E.M.A.; Wilson, S.; et al. Strategic Choices Shaping Agricultural Performance and Food Security in Myanmar. J. Int. Aff. 2014, 67, 55–71. [Google Scholar]
  66. Tun, T.; Kennedy, A.; Nischan, U. Promoting Agricultural Growth in Myanmar: A Reviw of Policies and An Assessment of Knowledge Gaps. 2015. Available online: https://ageconsearch.umn.edu/record/259018/ (accessed on 11 October 2021).
  67. Linn, K.M.; Liang, W.C. Analysis of Forest Policy in Myanmar. Int. J. Sci. 2015, 4, 16–28. [Google Scholar]
  68. Deepak, B.R. Bangladesh, China, India, Myanmar Economic Corridor (BCIM-EC): Security Dilemma Rider to Regional Economic Integration. In China’s Global Rebalancing and the New Silk Road; Deepak, B.R., Ed.; Springer: Singapore, 2018; pp. 51–68. [Google Scholar]
  69. Than, M. Myanmar’s Cross-Border Economic Relations and Cooperation with the People’s Republic of China and Thailand in the Greater Mekong Subregion. J. GMS Dev. Stud. 2005, 2, 37–54. [Google Scholar]
  70. Tang, W.; Liu, M.; Liao, Y. Myanmar: Review of 2017 and Prospect of 2018. Crossroads Southeast Asian Stud. 2018, 1, 47–53. [Google Scholar]
  71. Sritarapipat, T.; Takeuchi, W. Land Cover Change Simulations in Yangon Under Several Scenarios of Flood and Earthquake Vulnerabilities with Master Plan. J. Disaster Res. 2018, 13, 50–61. [Google Scholar] [CrossRef]
  72. Goswami, U.C.; Basistha, S.K.; Bora, D.; Shyamkumar, K.; Saikia, B.; Changsan, K. Fish diversity of North East India, inclusive of the Himalayan and IndoBurma biodiversity hotspots zones: A checklist on their taxonomic status, economic importance, geographical distribution, present status and prevailing threats. Int. J. Biodivers. Conserv. 2012, 4, 592–613. [Google Scholar]
  73. Li, L.; Liu, J.; Long, H.; de Jong, W.; Youn, Y.-C. Economic globalization, trade and forest transition-the case of nine Asian countries. For. Policy Econ. 2017, 76, 7–13. [Google Scholar] [CrossRef]
  74. Rambonilaza, M.; Dachary-Bernard, J. Land-use planning and public preferences: What can we learn from choice experiment method? Landsc. Urban Plan. 2007, 83, 318–326. [Google Scholar] [CrossRef] [Green Version]
  75. Verburg, P.H.; Tabeau, A.; Hatna, E. Assessing spatial uncertainties of land allocation using a scenario approach and sensitivity analysis: A study for land use in Europe. J. Environ. Manag. 2013, 127, S132–S144. [Google Scholar] [CrossRef] [PubMed]
  76. Rao, Y.; Zhou, M.; Ou, G.; Dai, D.; Zhang, L.; Zhang, Z.; Nie, X.; Yang, C. Integrating ecosystem services value for sustainable land-use management in semi-arid region. J. Clean. Prod. 2018, 186, 662–672. [Google Scholar] [CrossRef]
  77. Lawler, J.J.; Lewis, D.J.; Nelson, E.; Plantinga, A.J.; Polasky, S.; Withey, J.C.; Helmers, D.P.; Martinuzzi, S.; Pennington, D.; Radeloff, V.C. Projected land-use change impacts on ecosystem services in the United States. Proc. Natl. Acad. Sci. USA 2014, 111, 7492–7497. [Google Scholar] [CrossRef] [Green Version]
  78. Mendoza-González, G.; Martínez, M.L.; Lithgow, D.; Pérez-Maqueo, O.; Simonin, P. Land use change and its effects on the value of ecosystem services along the coast of the Gulf of Mexico. Ecol. Econ. 2012, 82, 23–32. [Google Scholar] [CrossRef]
  79. Pejchar, L.; Mooney, H.A. Invasive species, ecosystem services and human well-being. Trends Ecol. Evol. 2009, 24, 497–504. [Google Scholar] [CrossRef]
  80. Tallis, H.; Kareiva, P.; Marvier, M.; Chang, A. An Ecosystem Services Framework to Support Both Practical Conservation and Economic Development. Proc. Natl. Acad. Sci. USA 2008, 105, 9457–9464. [Google Scholar] [CrossRef]
Figure 1. The study area showing land use distribution, existing railways and railway stations, planning railways, railway stations, and SEZs in Myanmar.
Ijgi 12 00022 g001
Figure 2. Schematic framework of the proposed coupling model of CGELUC and FLUS. The blue arrows describe the flows of model calibration for the CGELUC and FLUS models, and the black arrows demonstrate the flow of land use projection.
Ijgi 12 00022 g002
Figure 3. Framework of the proposed updated mechanism.
Ijgi 12 00022 g003
Figure 4. Distributions of the (a) observed and (b) simulated land use patterns in 2017 and the (c) difference between them.
Ijgi 12 00022 g004
Figure 5. PoO surfaces of built-up land (a) without and (b) with the impacts of planning policies for future simulation. Mean denotes the mean value of the PoO surface in the red frame.
Ijgi 12 00022 g005
Figure 6. Projection of the land use structures under different scenarios in Myanmar from 2017 to 2050.
Ijgi 12 00022 g006
Figure 7. Local characteristics of the simulated land use patterns in the three designed scenarios in 2035 and 2050.
Ijgi 12 00022 g007
Figure 8. Production and trade of agricultural and forest products in Myanmar. (a) Import and export of agricultural products between 1986 and 2017, (b) import and export of forest products between 1990 and 2017, (c) compound annual growth rate of expansion and intensification for the main crops in Myanmar during the periods of 1961–1990 and 1991–2018, (d) volume of the main four forest products annually produced in Myanmar between 1990 and 2017. These historical data are acquired from the Food and Agriculture Organization (http://faostat.fao.org/ (accessed on 25 June 2021)).
Ijgi 12 00022 g008
Table 1. Main information of the input data in this work.
CategoryDataDriving FactorResolutionYearReference of the Data Source
Land useLand use mapProximity to disturbed area30 m2000/2013/2015
/2017/2018
[43]
Socio-economic dataSocial Accounting Matrix__2017[44]
Population densityPopulation density100 m2017[45]
Gross Domestic Product (GDP)GDP1 km2015[46]
Railway stationsProximity to railway stations__[47]
Road networkProximity to main roads__[48]
Railway networkProximity to railways_
Provincial capital sitesProximity to provincial capitals_
Town sitesProximity to towns_
Protected area__2017[49]
Natural characteristic dataDEMDEM30 m_[50]
SlopeSlope30 m
Soil organic carbon stockSoil organic carbon stock250 m2015[51]
Soil pHSoil pH250 m2015[52]
Soil clay contentSoil clay content250 m2015[53]
Annual mean precipitationAnnual mean precipitation_2008–2017[54]
Annual mean temperatureAnnual mean temperature_
Future temperature and precipitation_1 km2030/2050[42]
RiversProximity to rivers__[48]
Planning dataPlanning railway stations___[55]
Planning railways___
Economic development zones___[56]
Table 2. Values of different parameters under various scenarios in Myanmar.
ParameterBD_ScenarioHD_ScenarioFD_Scenario
Investment ratio relative to GDP25%33%40%
Growth rate of TFP06%6%
Growth of populationLowMediumHigh
Growth of temperature0.040.0650.085
Growth rate of rainfall0.12%0.37%0.5%
Table 3. Accuracy of the simulated land use structure in Myanmar in 2018.
Land Use TypeActual Land Use Quantity (km2)Projected Land Use Quantity (km2)Actual Land Use Change Quantity (km2)Projected Land Use Change Quantity (km2)Error (%)
Cultivated land208,378.06208,332.811831.811786.562.47
Forests515,361.94515,224.5−4457.81−4595.253.08
Grassland23,938.8824,177.812102.062341.011.37
Built-up land2031.692023.0694.5685.949.12
Wetland1845.691843.19−11.44−14.5621.86
Waters12,290.0612,250.88418.75379.569.36
Unused land6480.066474.1322.0616.1326.91
Total770,326.38770,326.388938.59218.383.13
Table 4. Accuracies of the simulated land use patterns of Myanmar in 2013, 2015, and 2017.
Land Use Type201320152017
Kappa
Coefficient
Overall
Accuracy
(%)
Kappa
Coefficient
Overall
Accuracy
(%)
Kappa
Coefficient
Overall
Accuracy
(%)
Total0.8492.300.8391.990.8492.29
Cultivated land0.870.870.87
Forests0.850.840.84
Grassland0.530.510.56
Built-up land0.740.740.75
Wetland0.620.610.63
Waters0.700.700.73
Unused land0.830.820.83
Disclaimer/Publisher’s Note: The statements, opinions and data contained in all publications are solely those of the individual author(s) and contributor(s) and not of MDPI and/or the editor(s). MDPI and/or the editor(s) disclaim responsibility for any injury to people or property resulting from any ideas, methods, instructions or products referred to in the content.

