
Assessment of Morphometric Parameters as the Basis for Hydrological Inferences in Water Resource Management: A Case Study from the Sinú River Basin in Colombia


 , , , and
Abstract
:1. Introduction
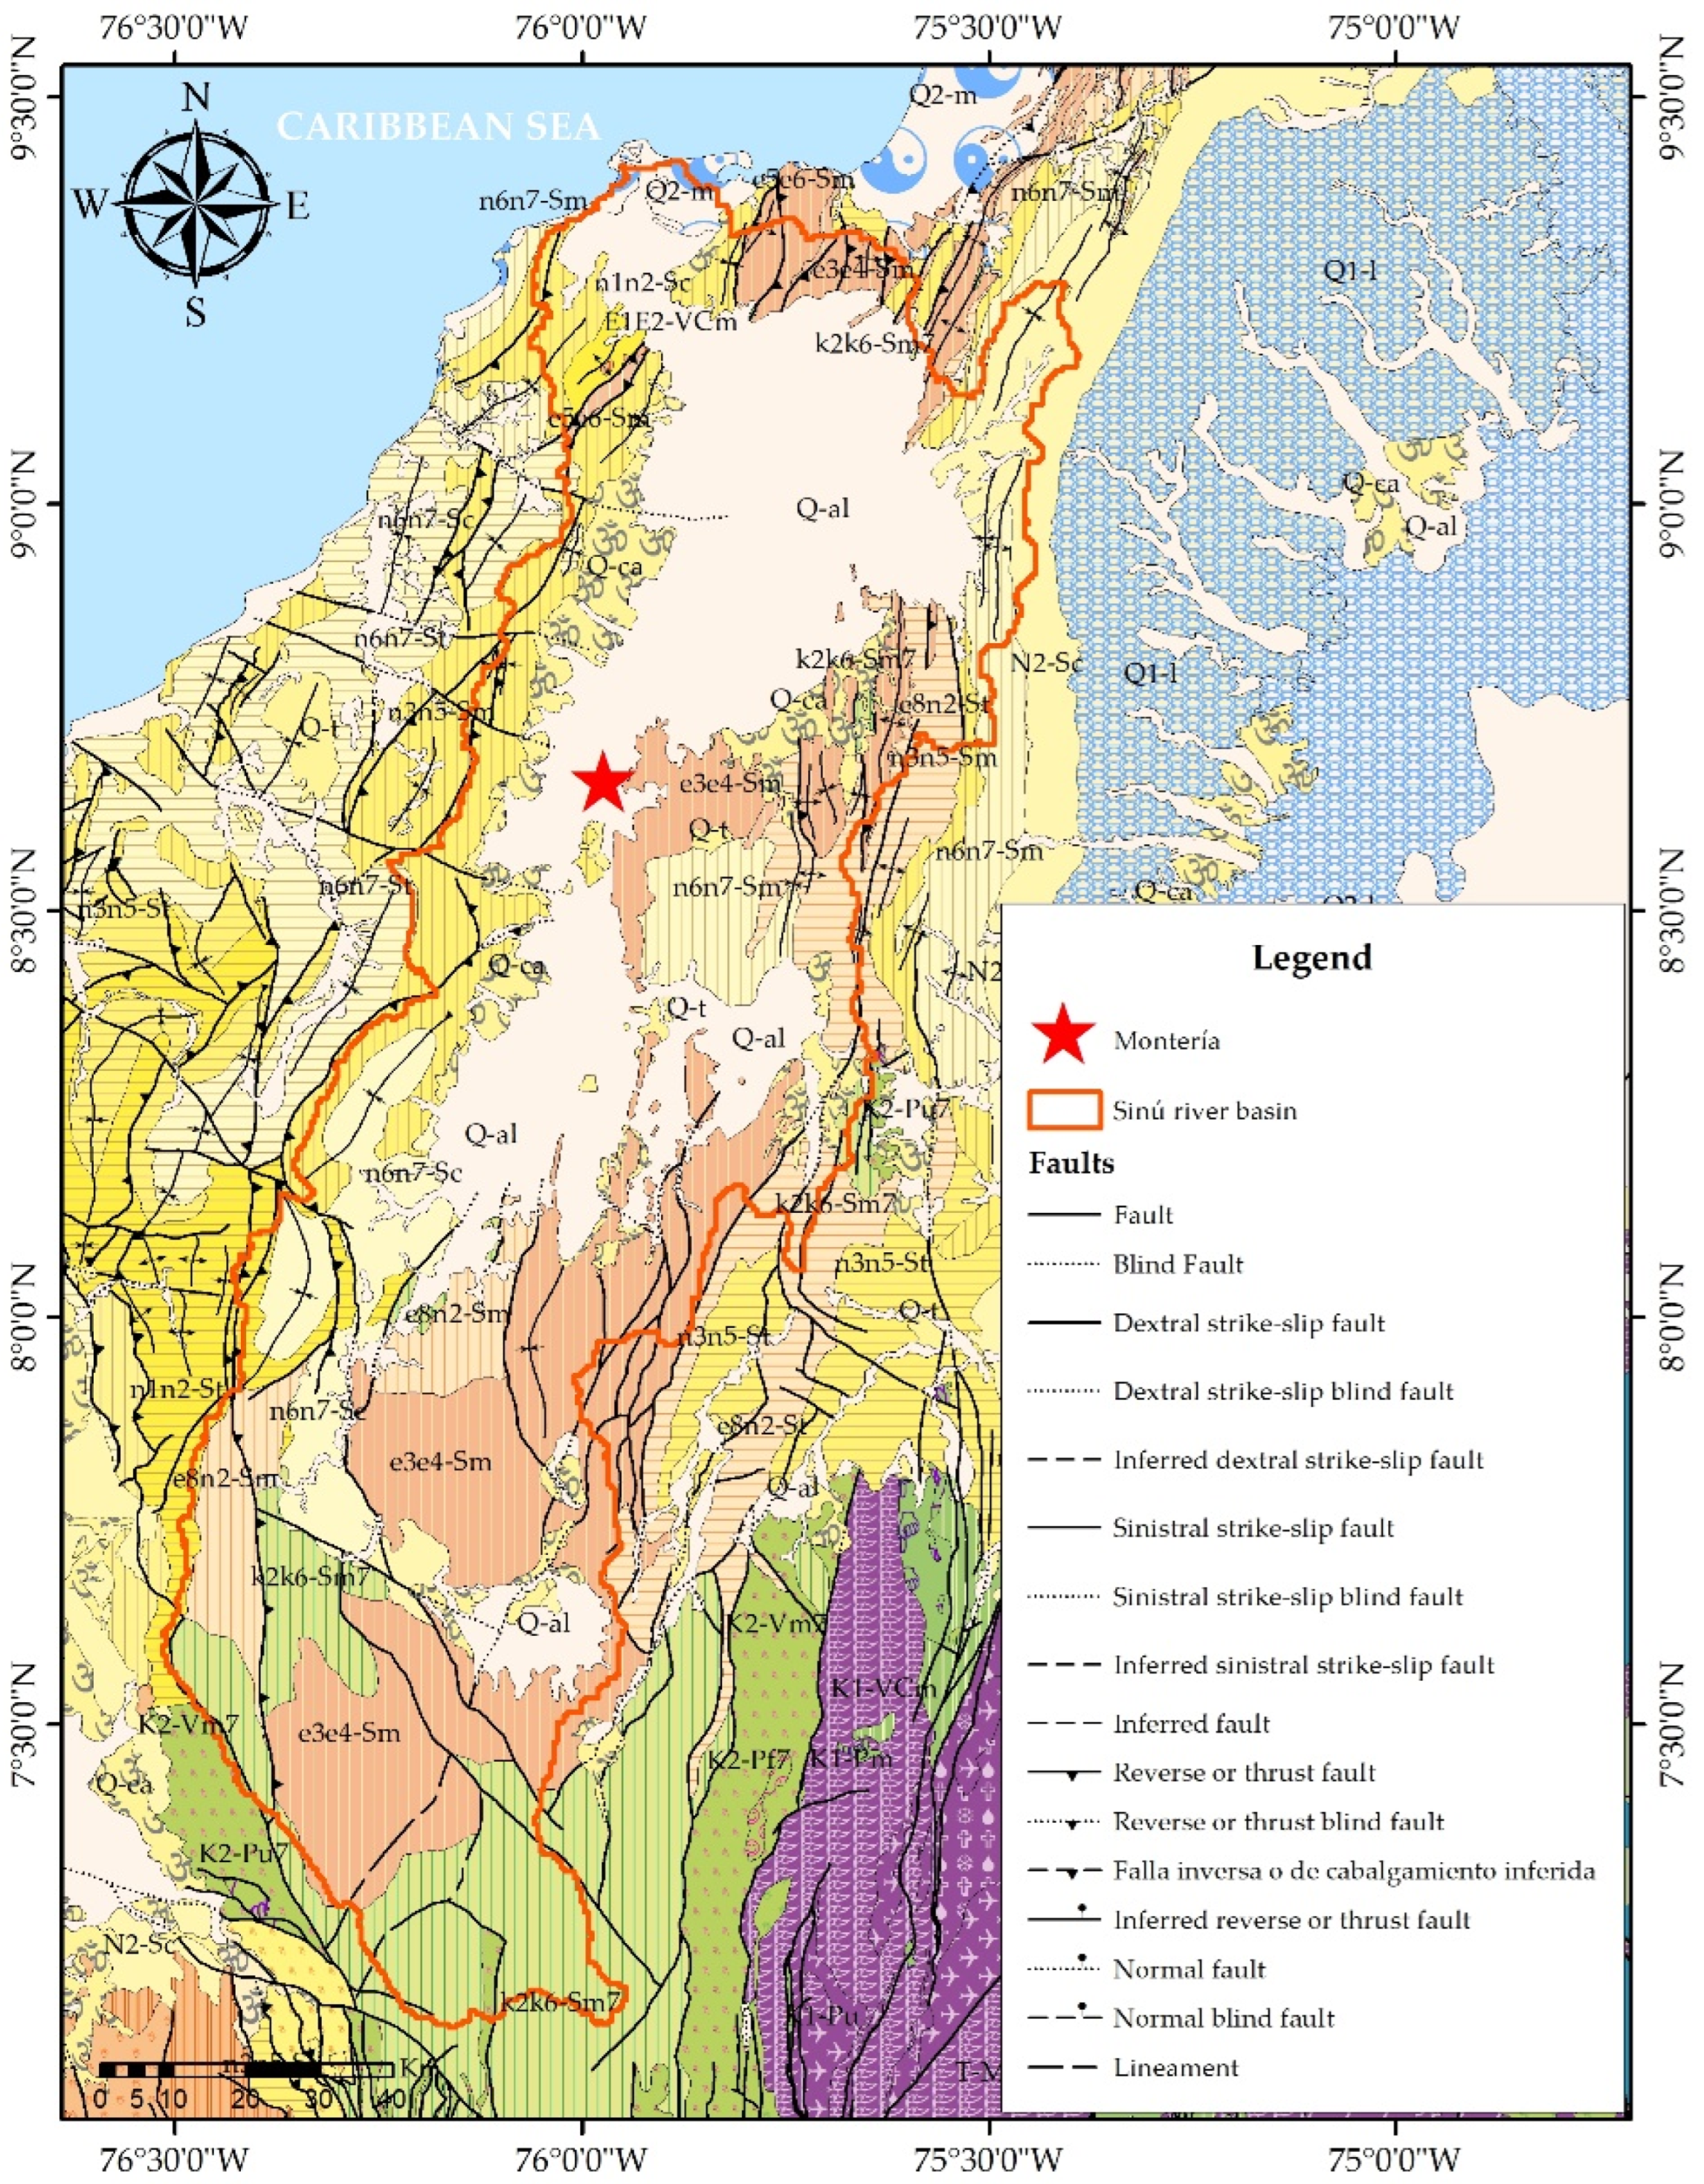
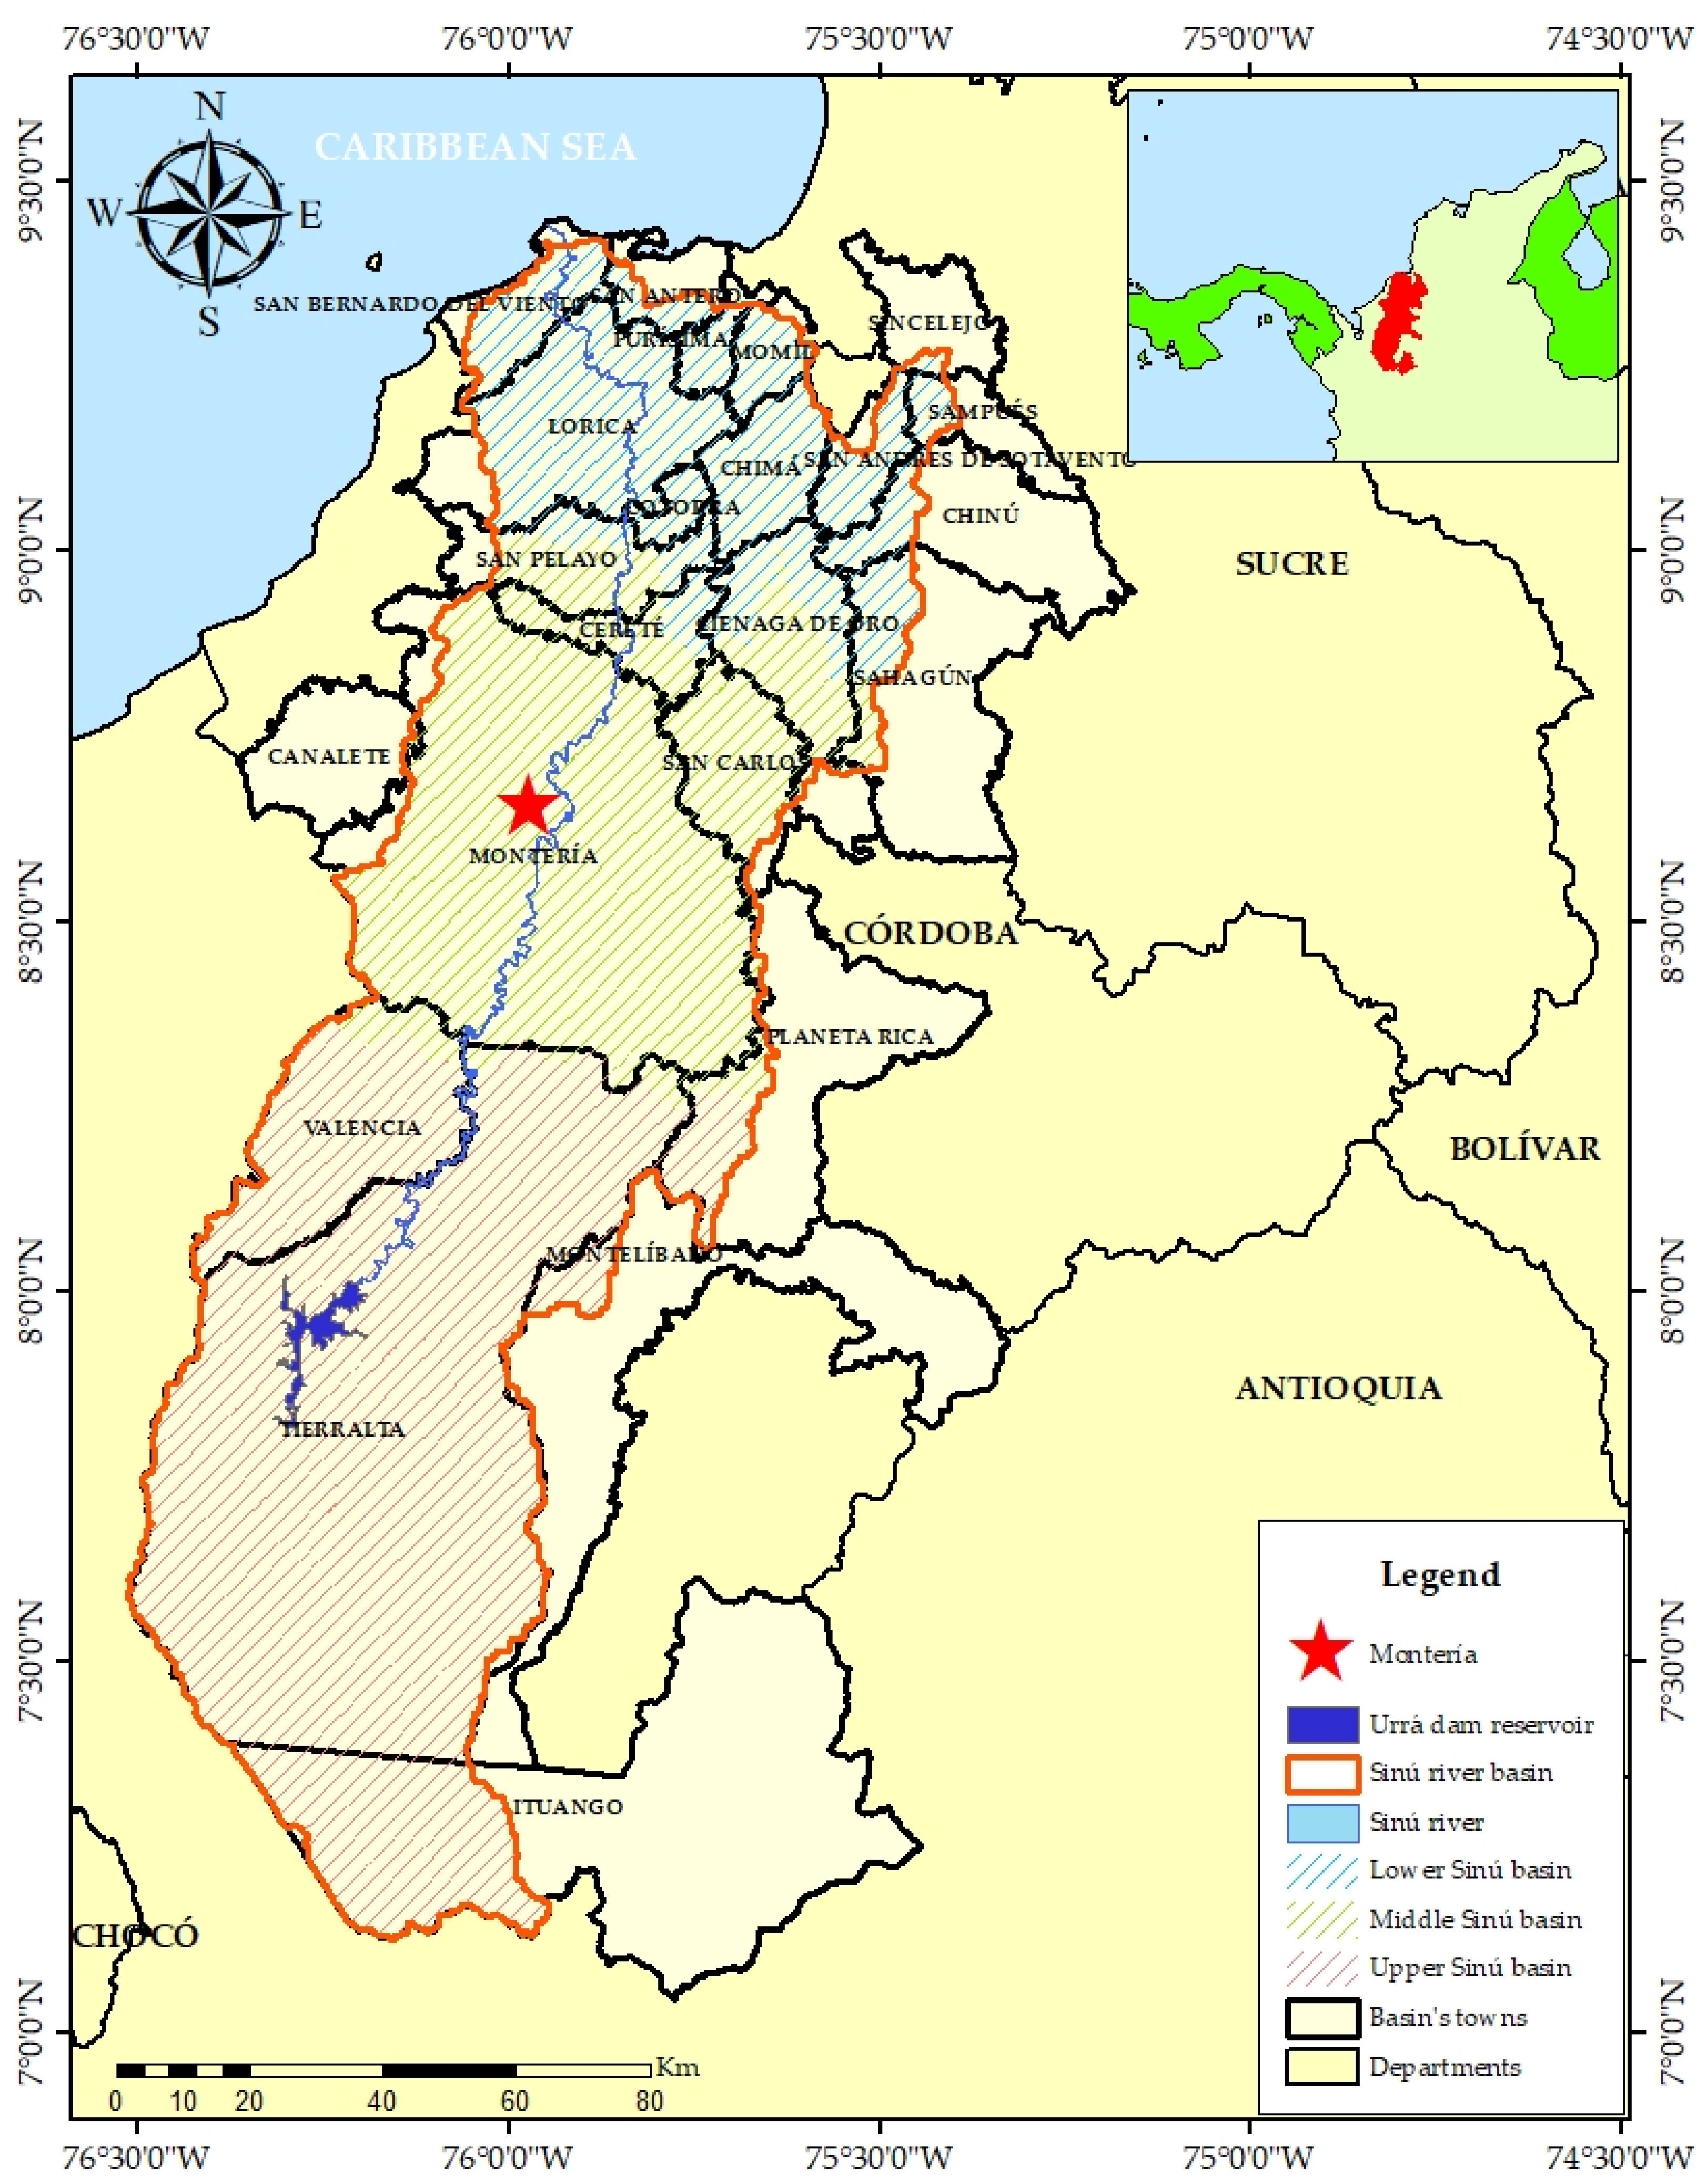
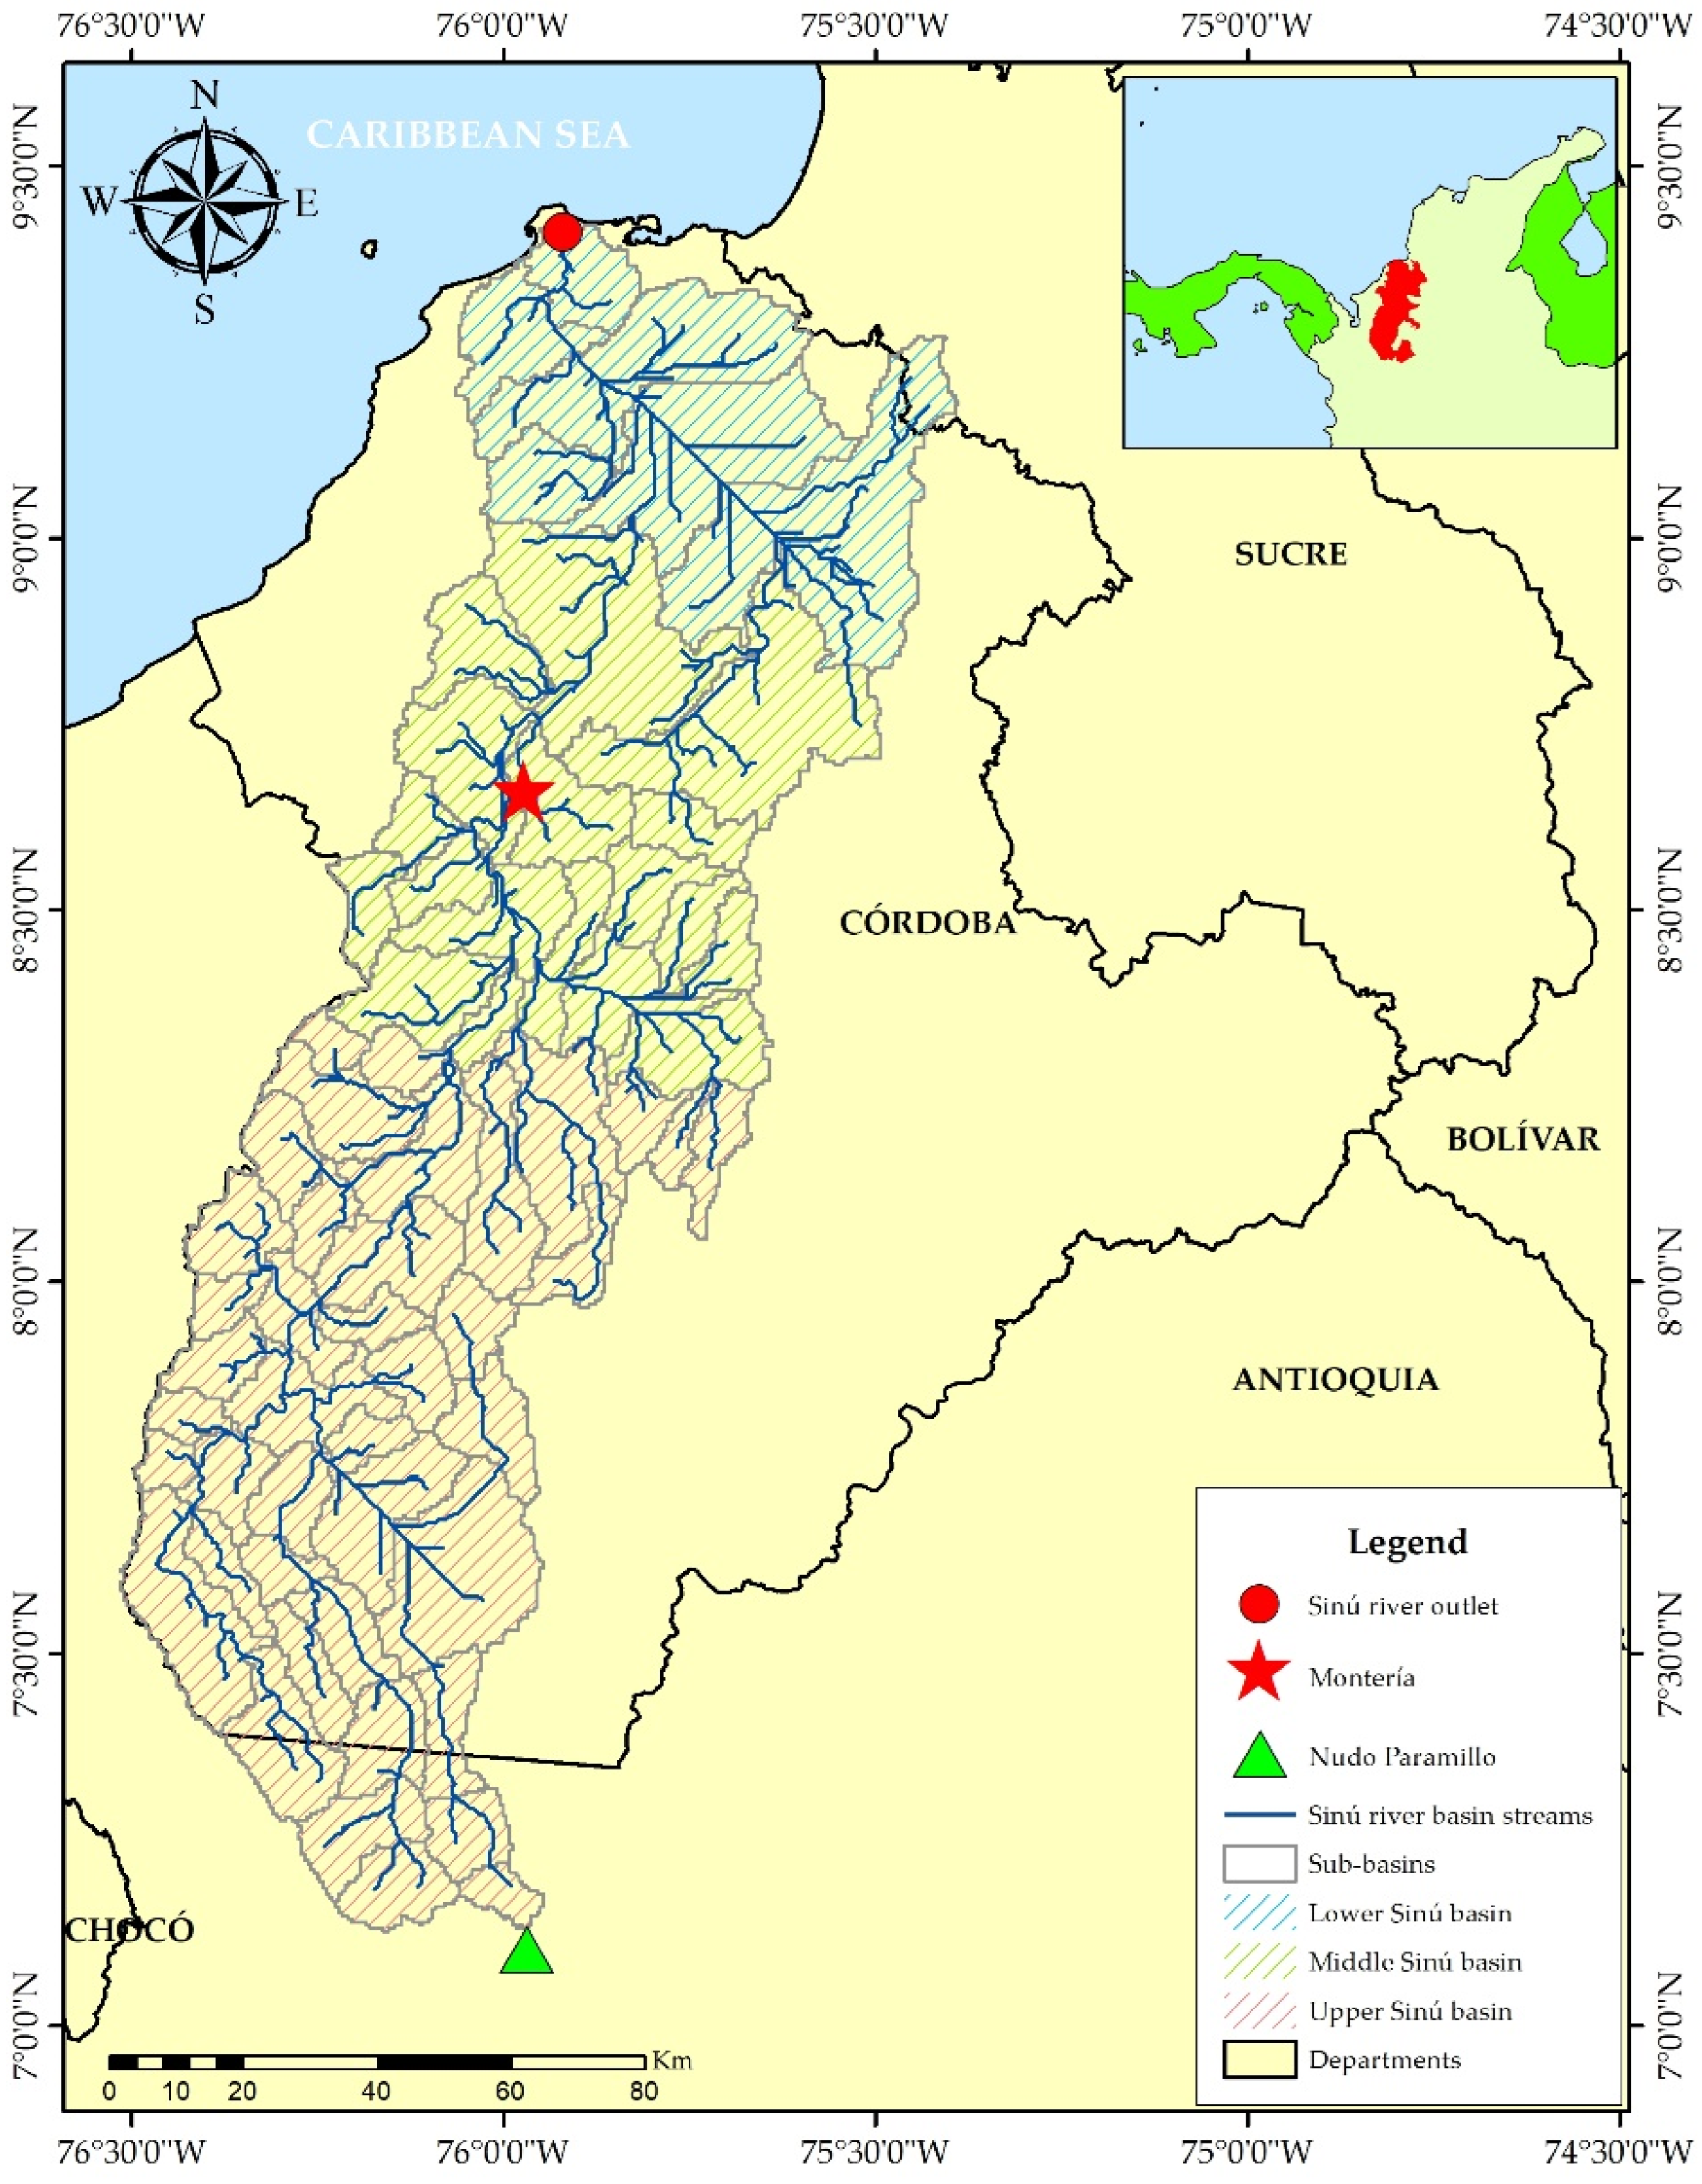
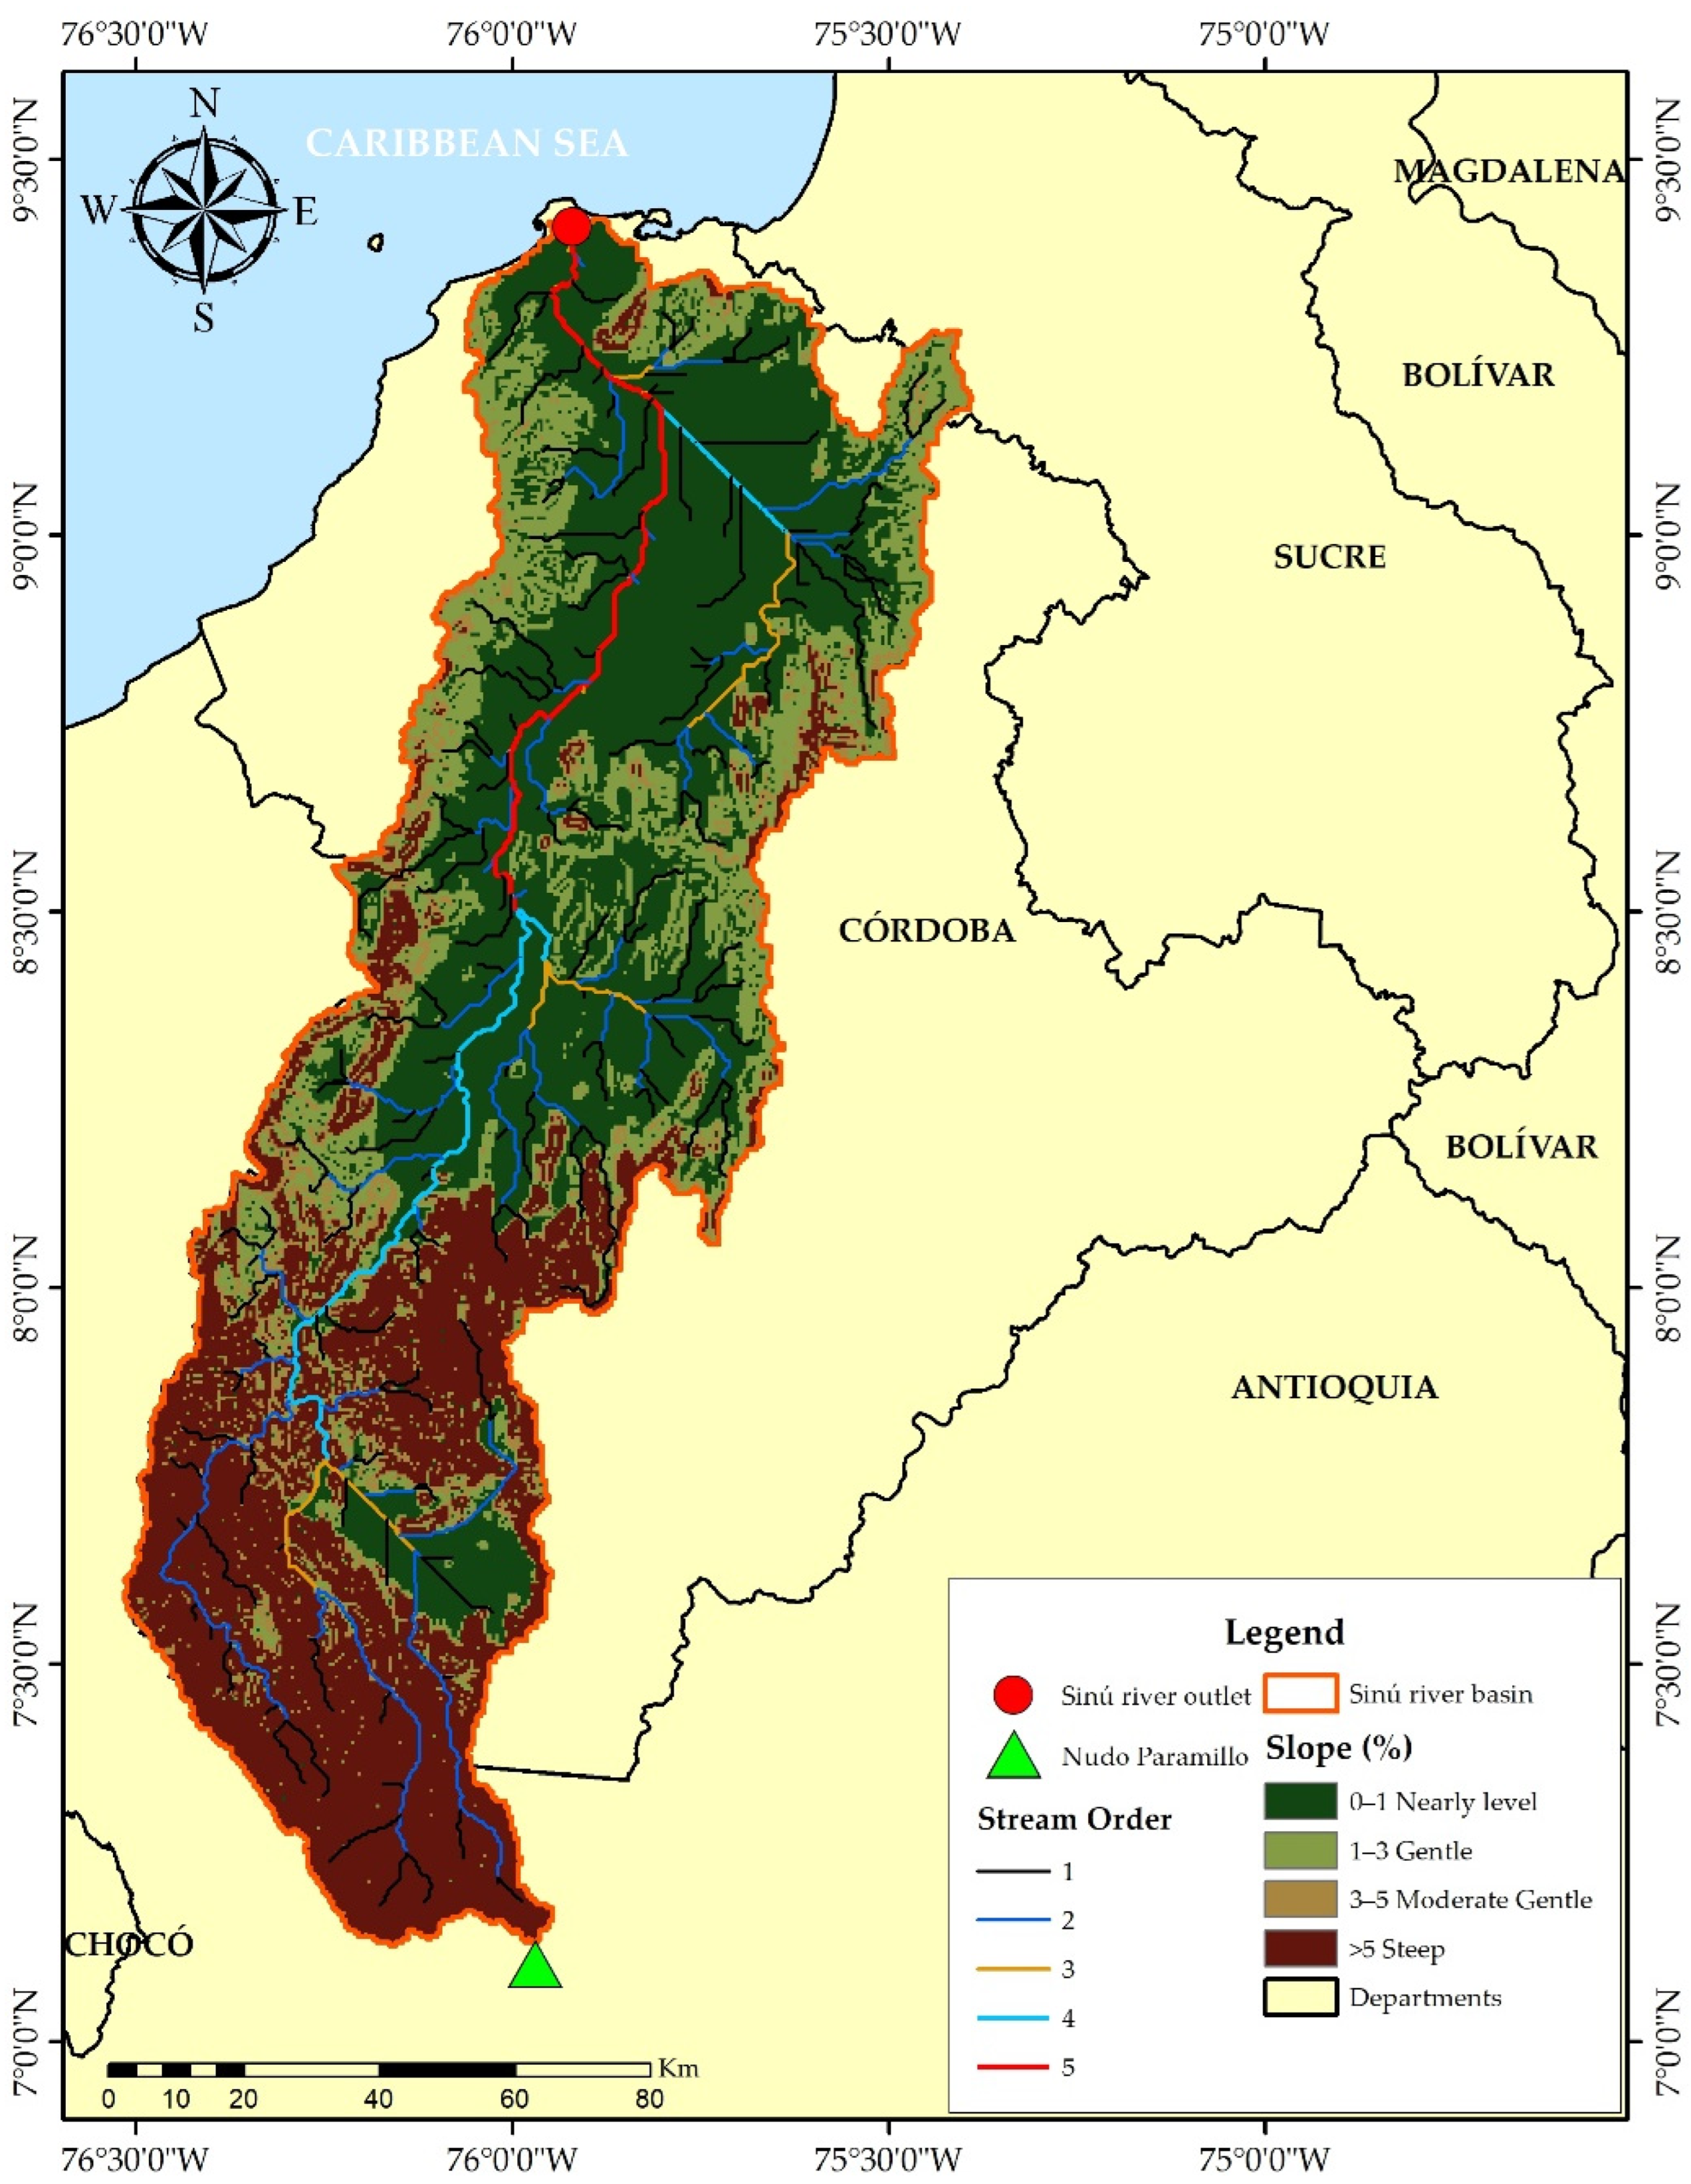
2. Area of Study
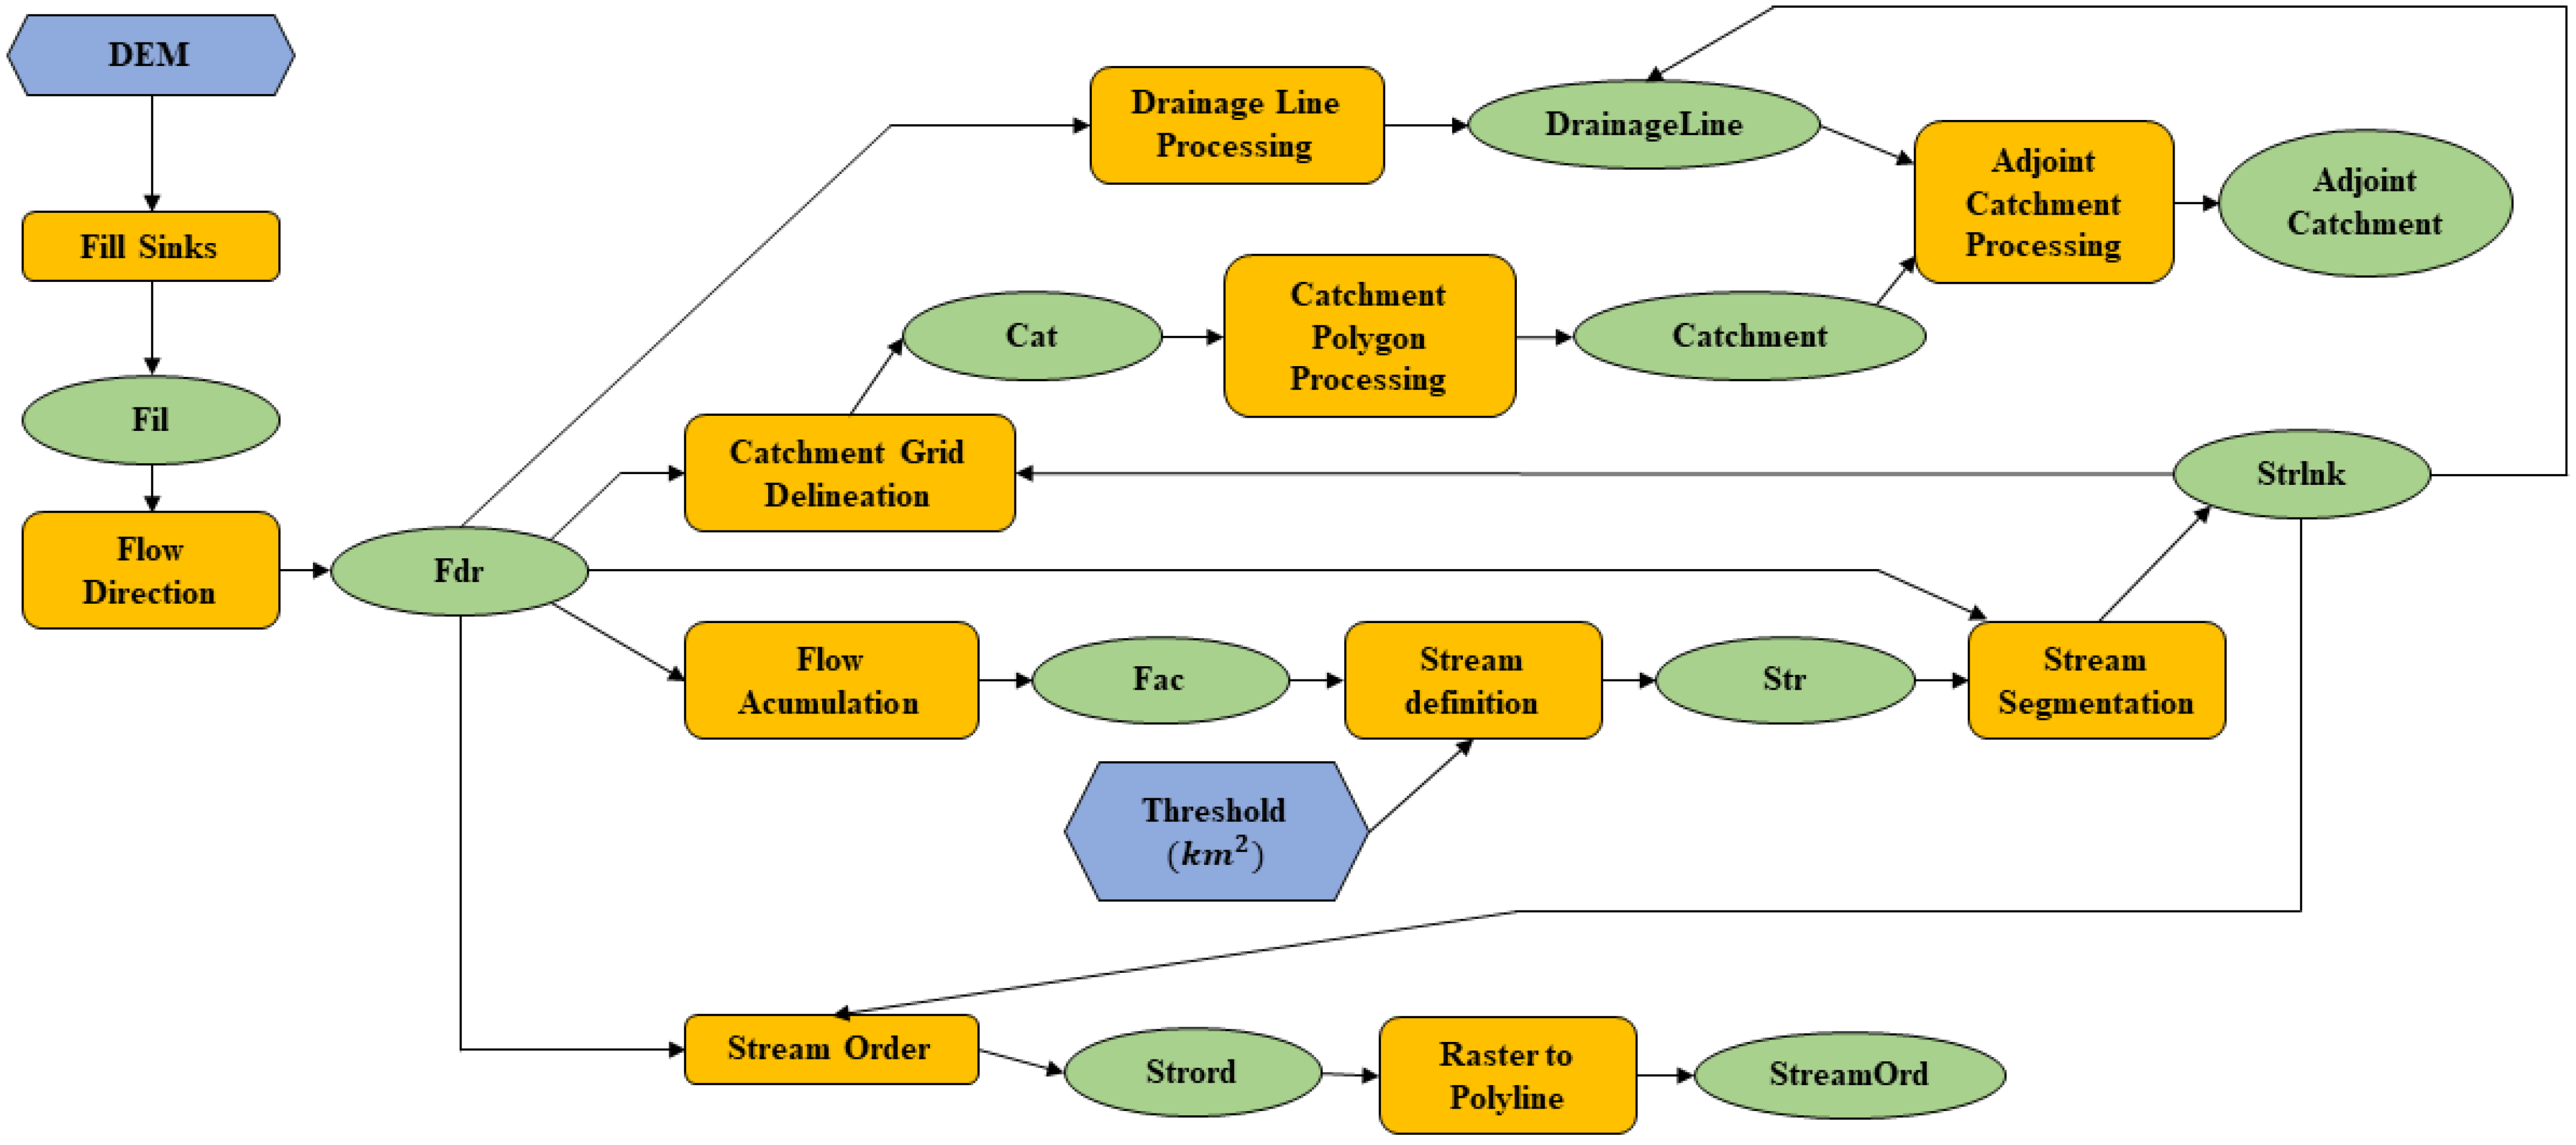
3. Materials and Methods
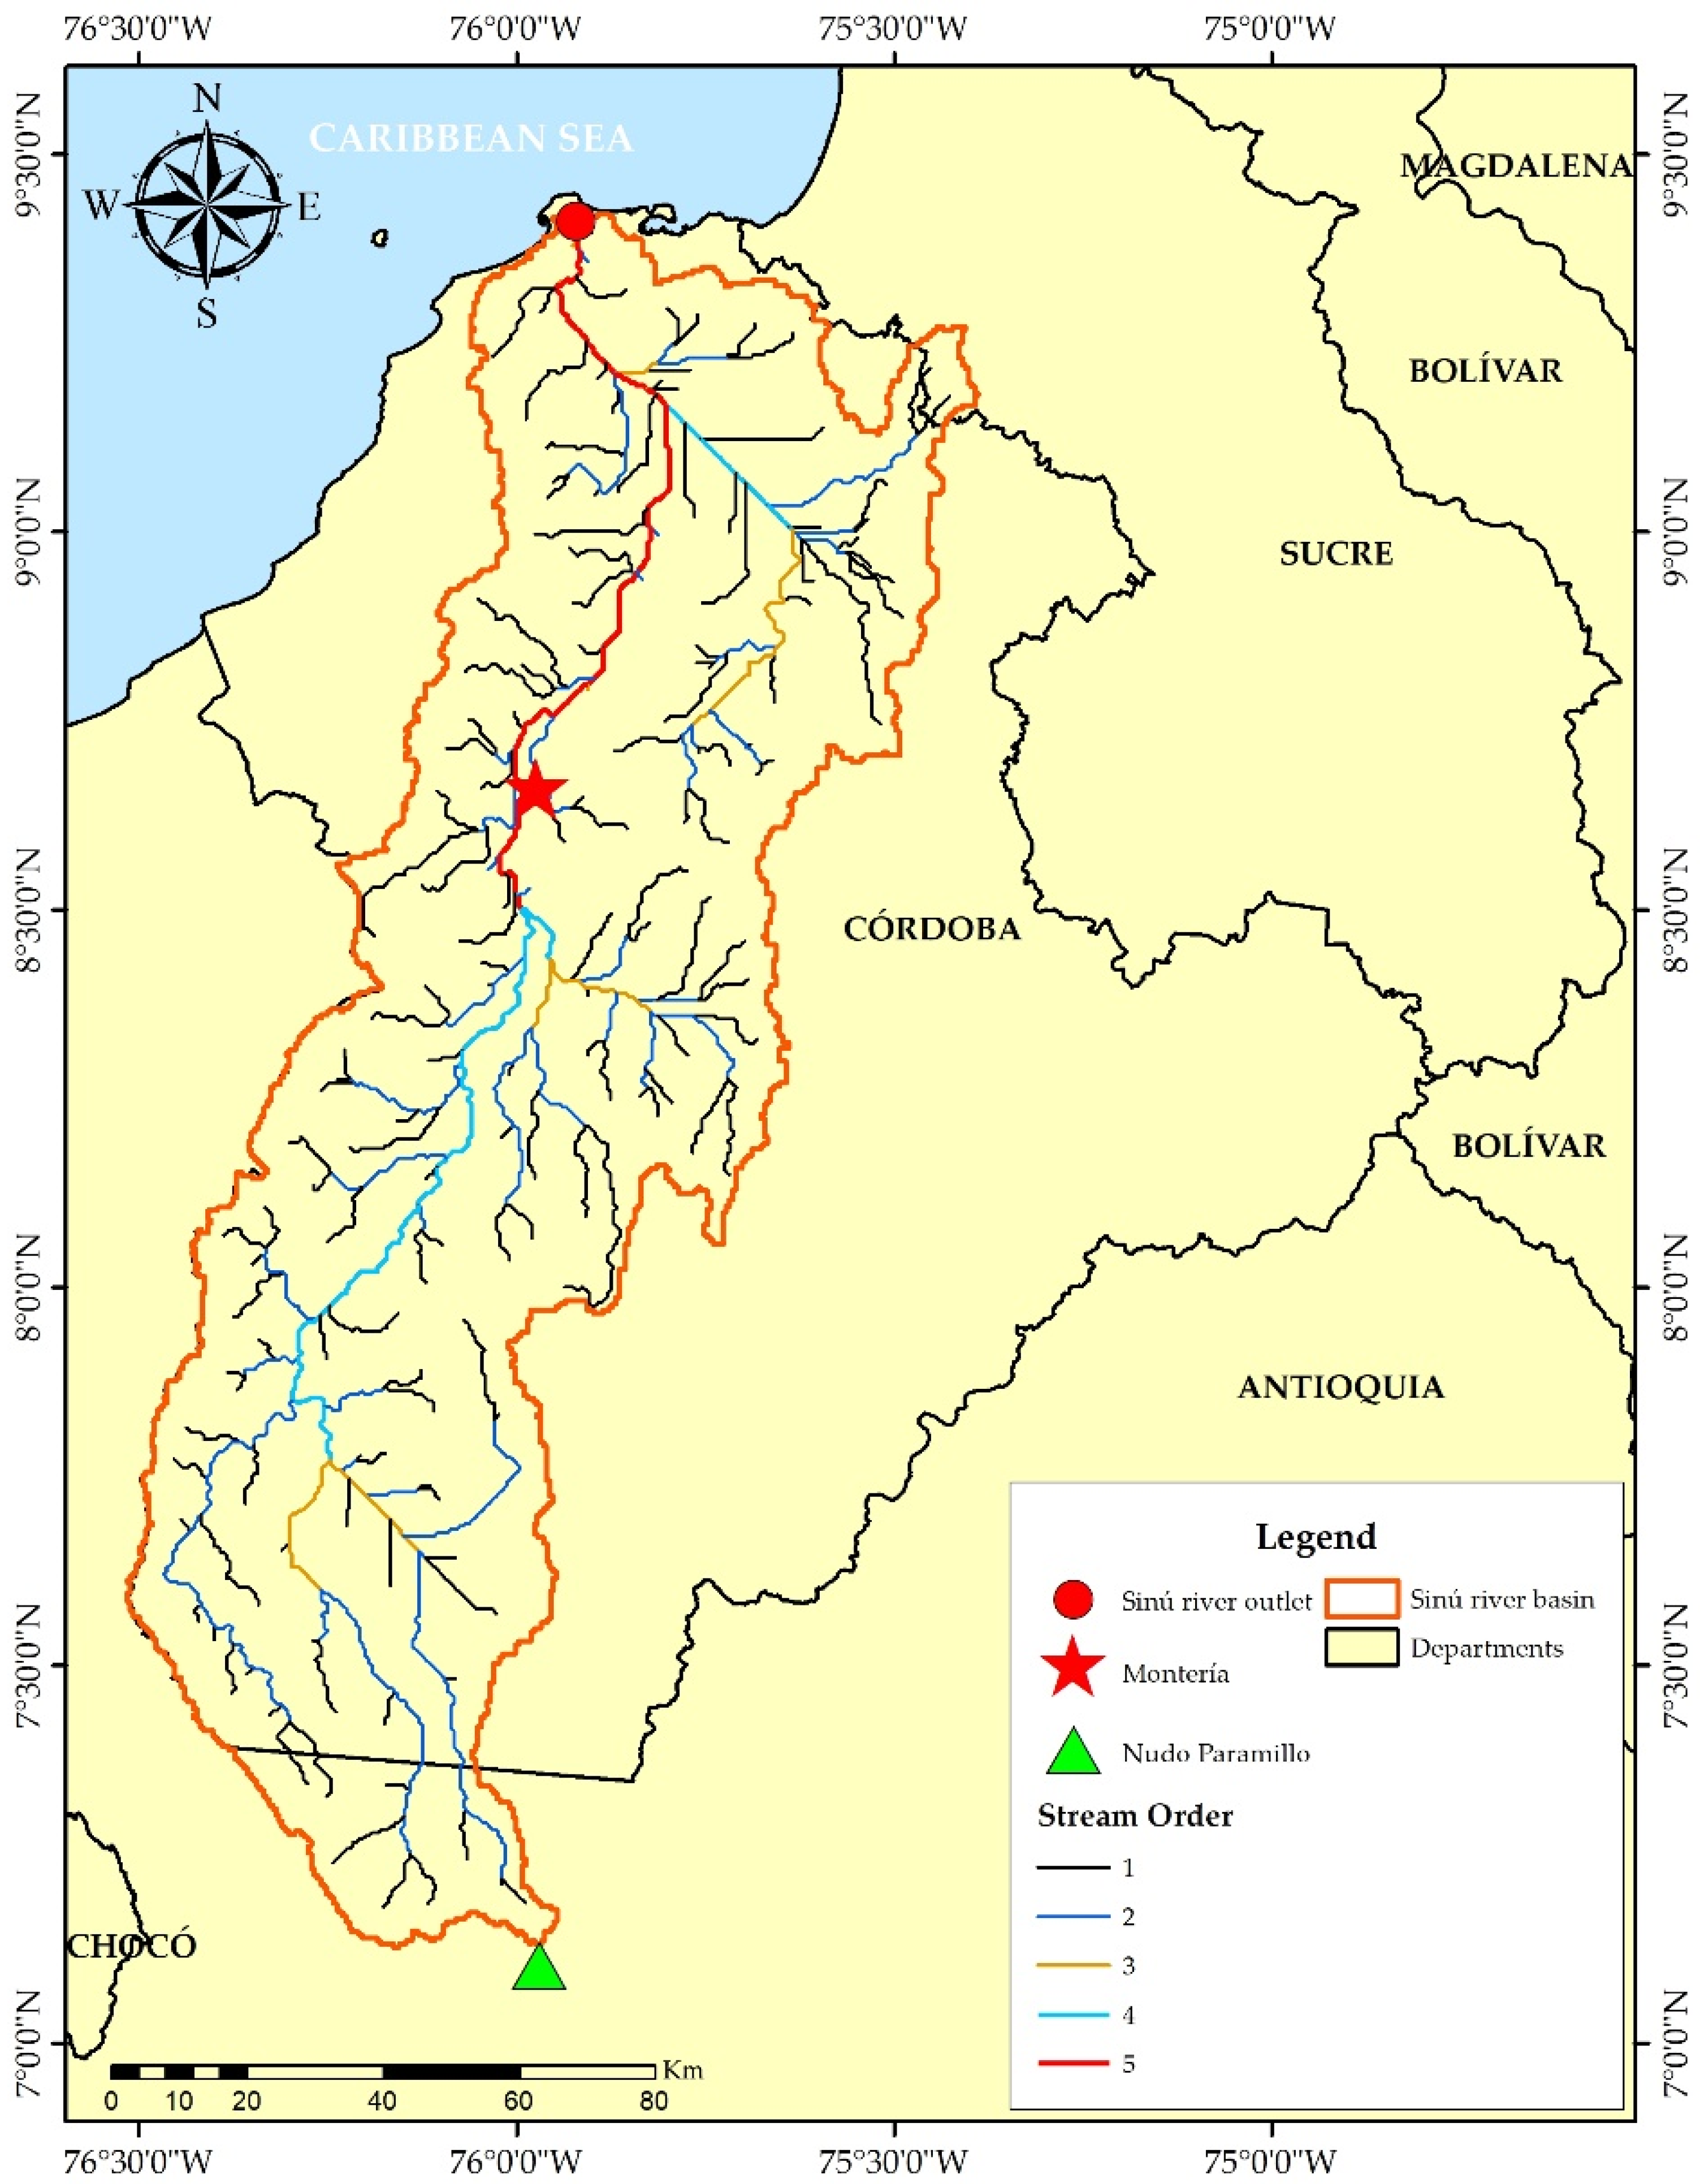
3.1. Stream Order
3.2. Number of Channels of Order
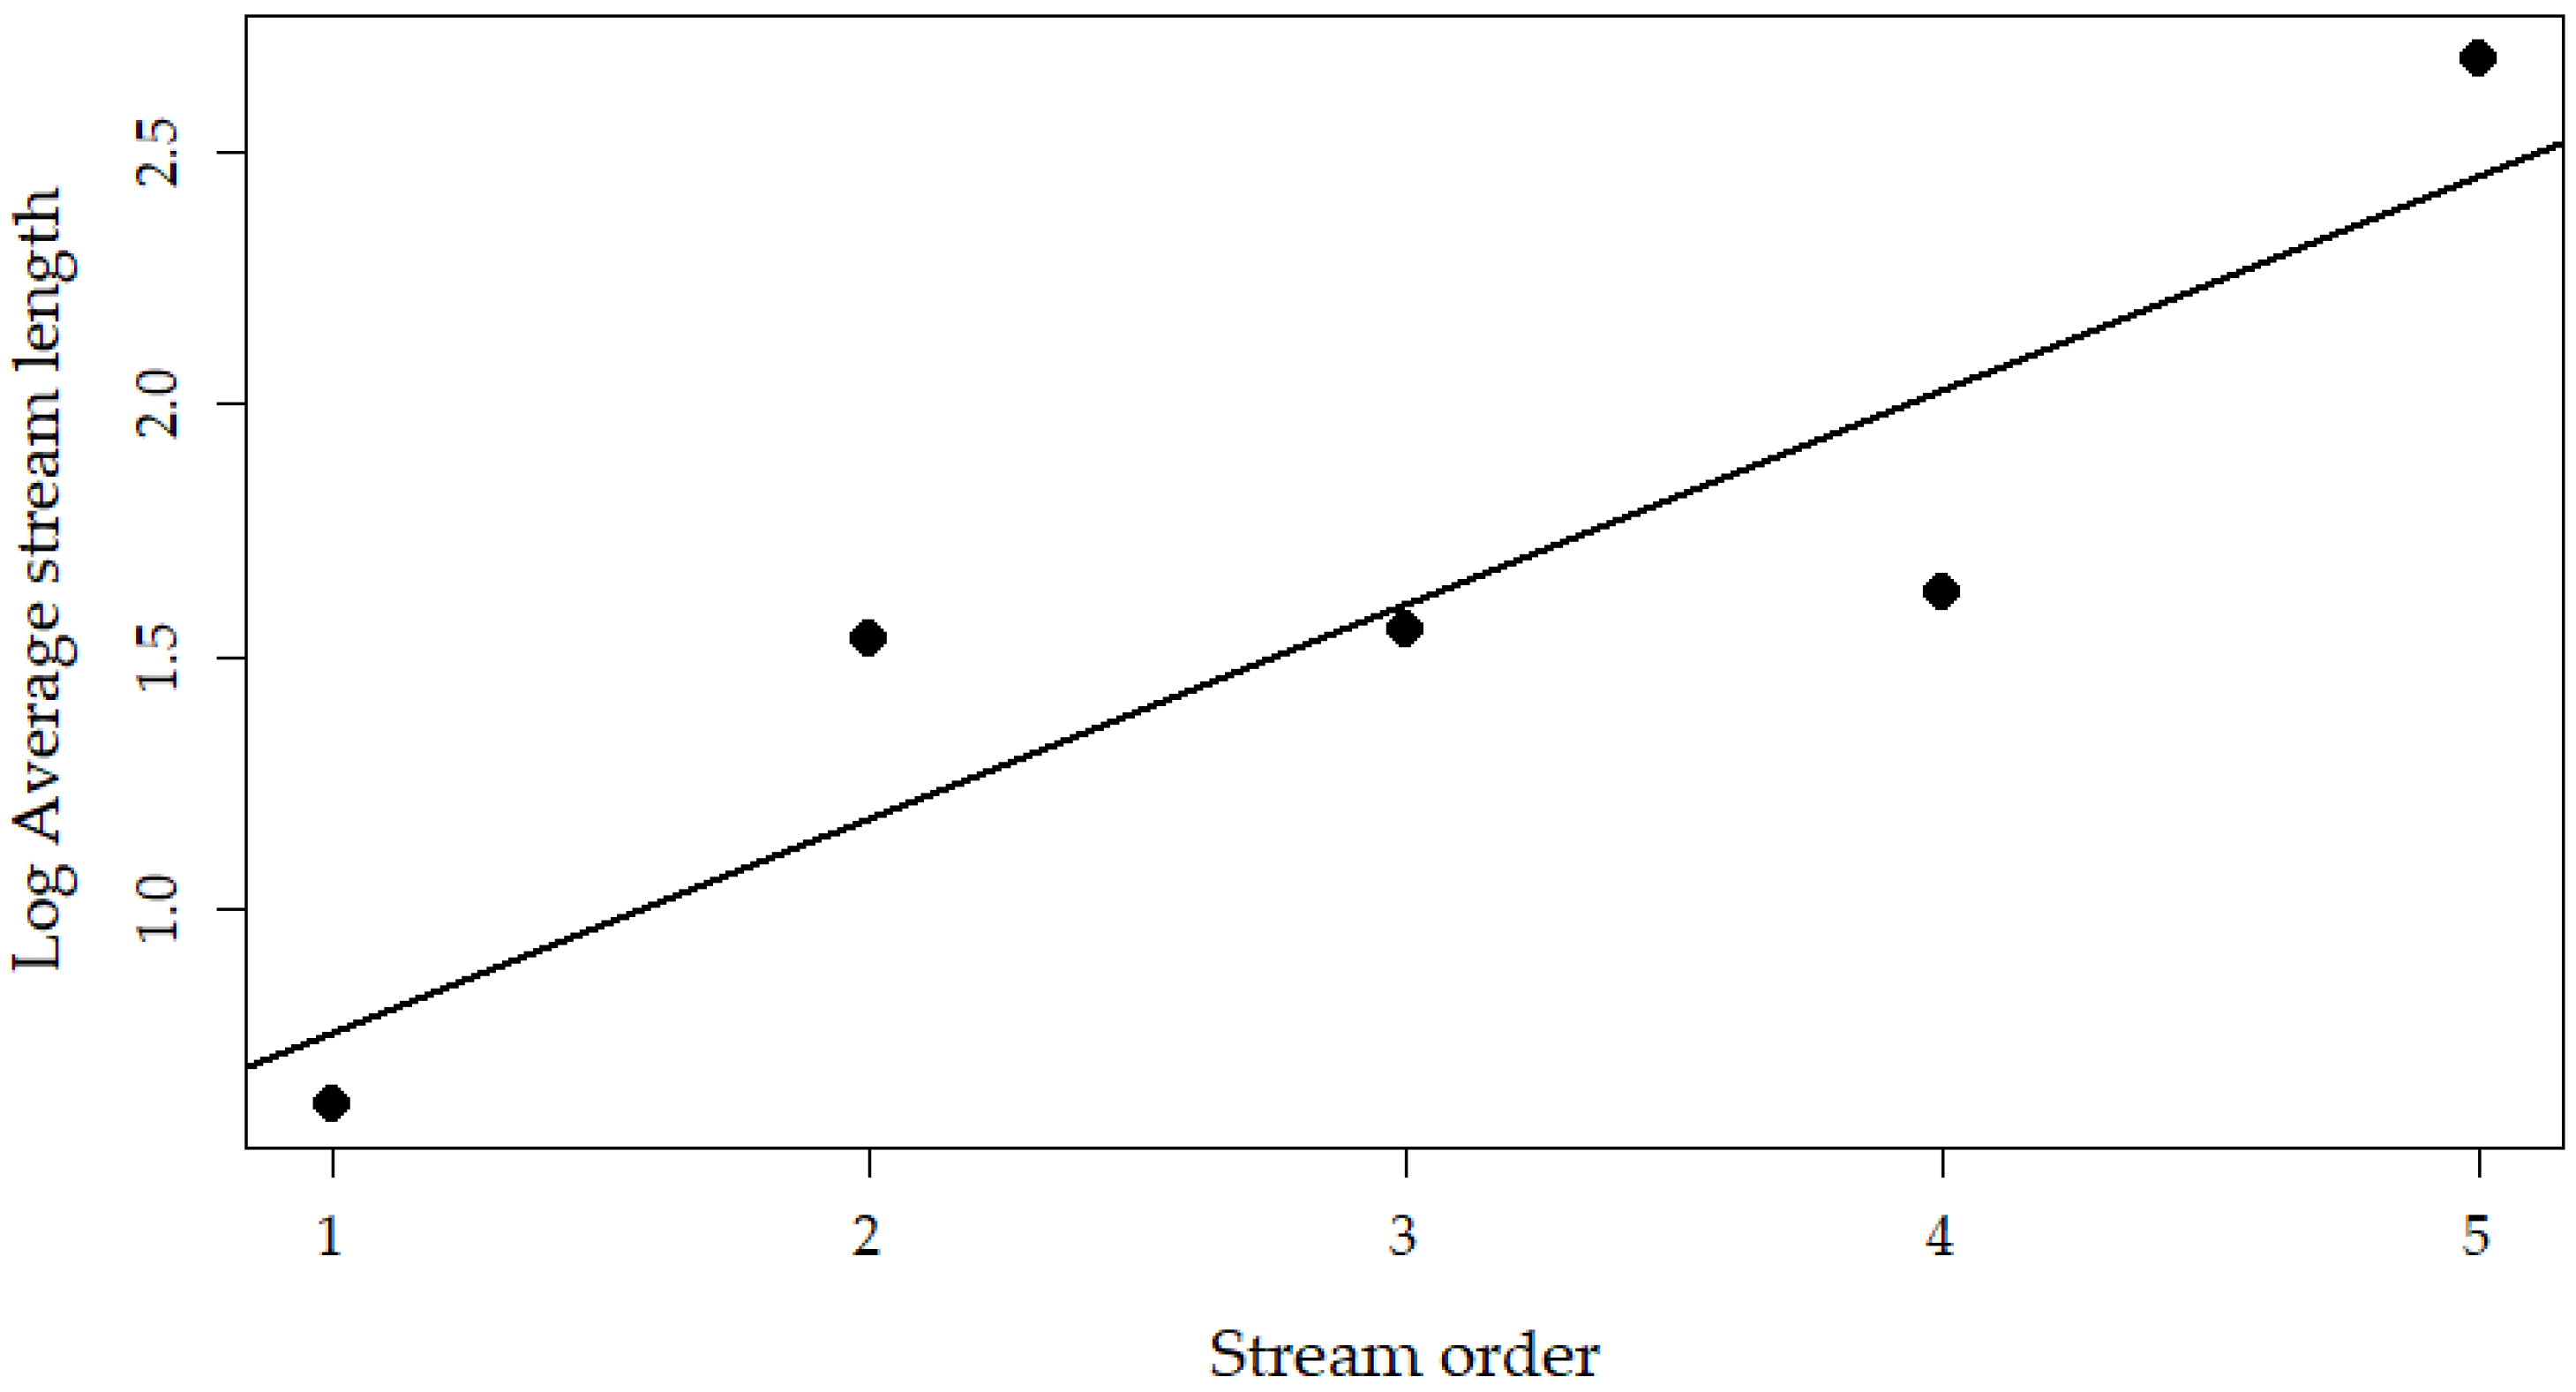
3.3. Length of Channels of Order
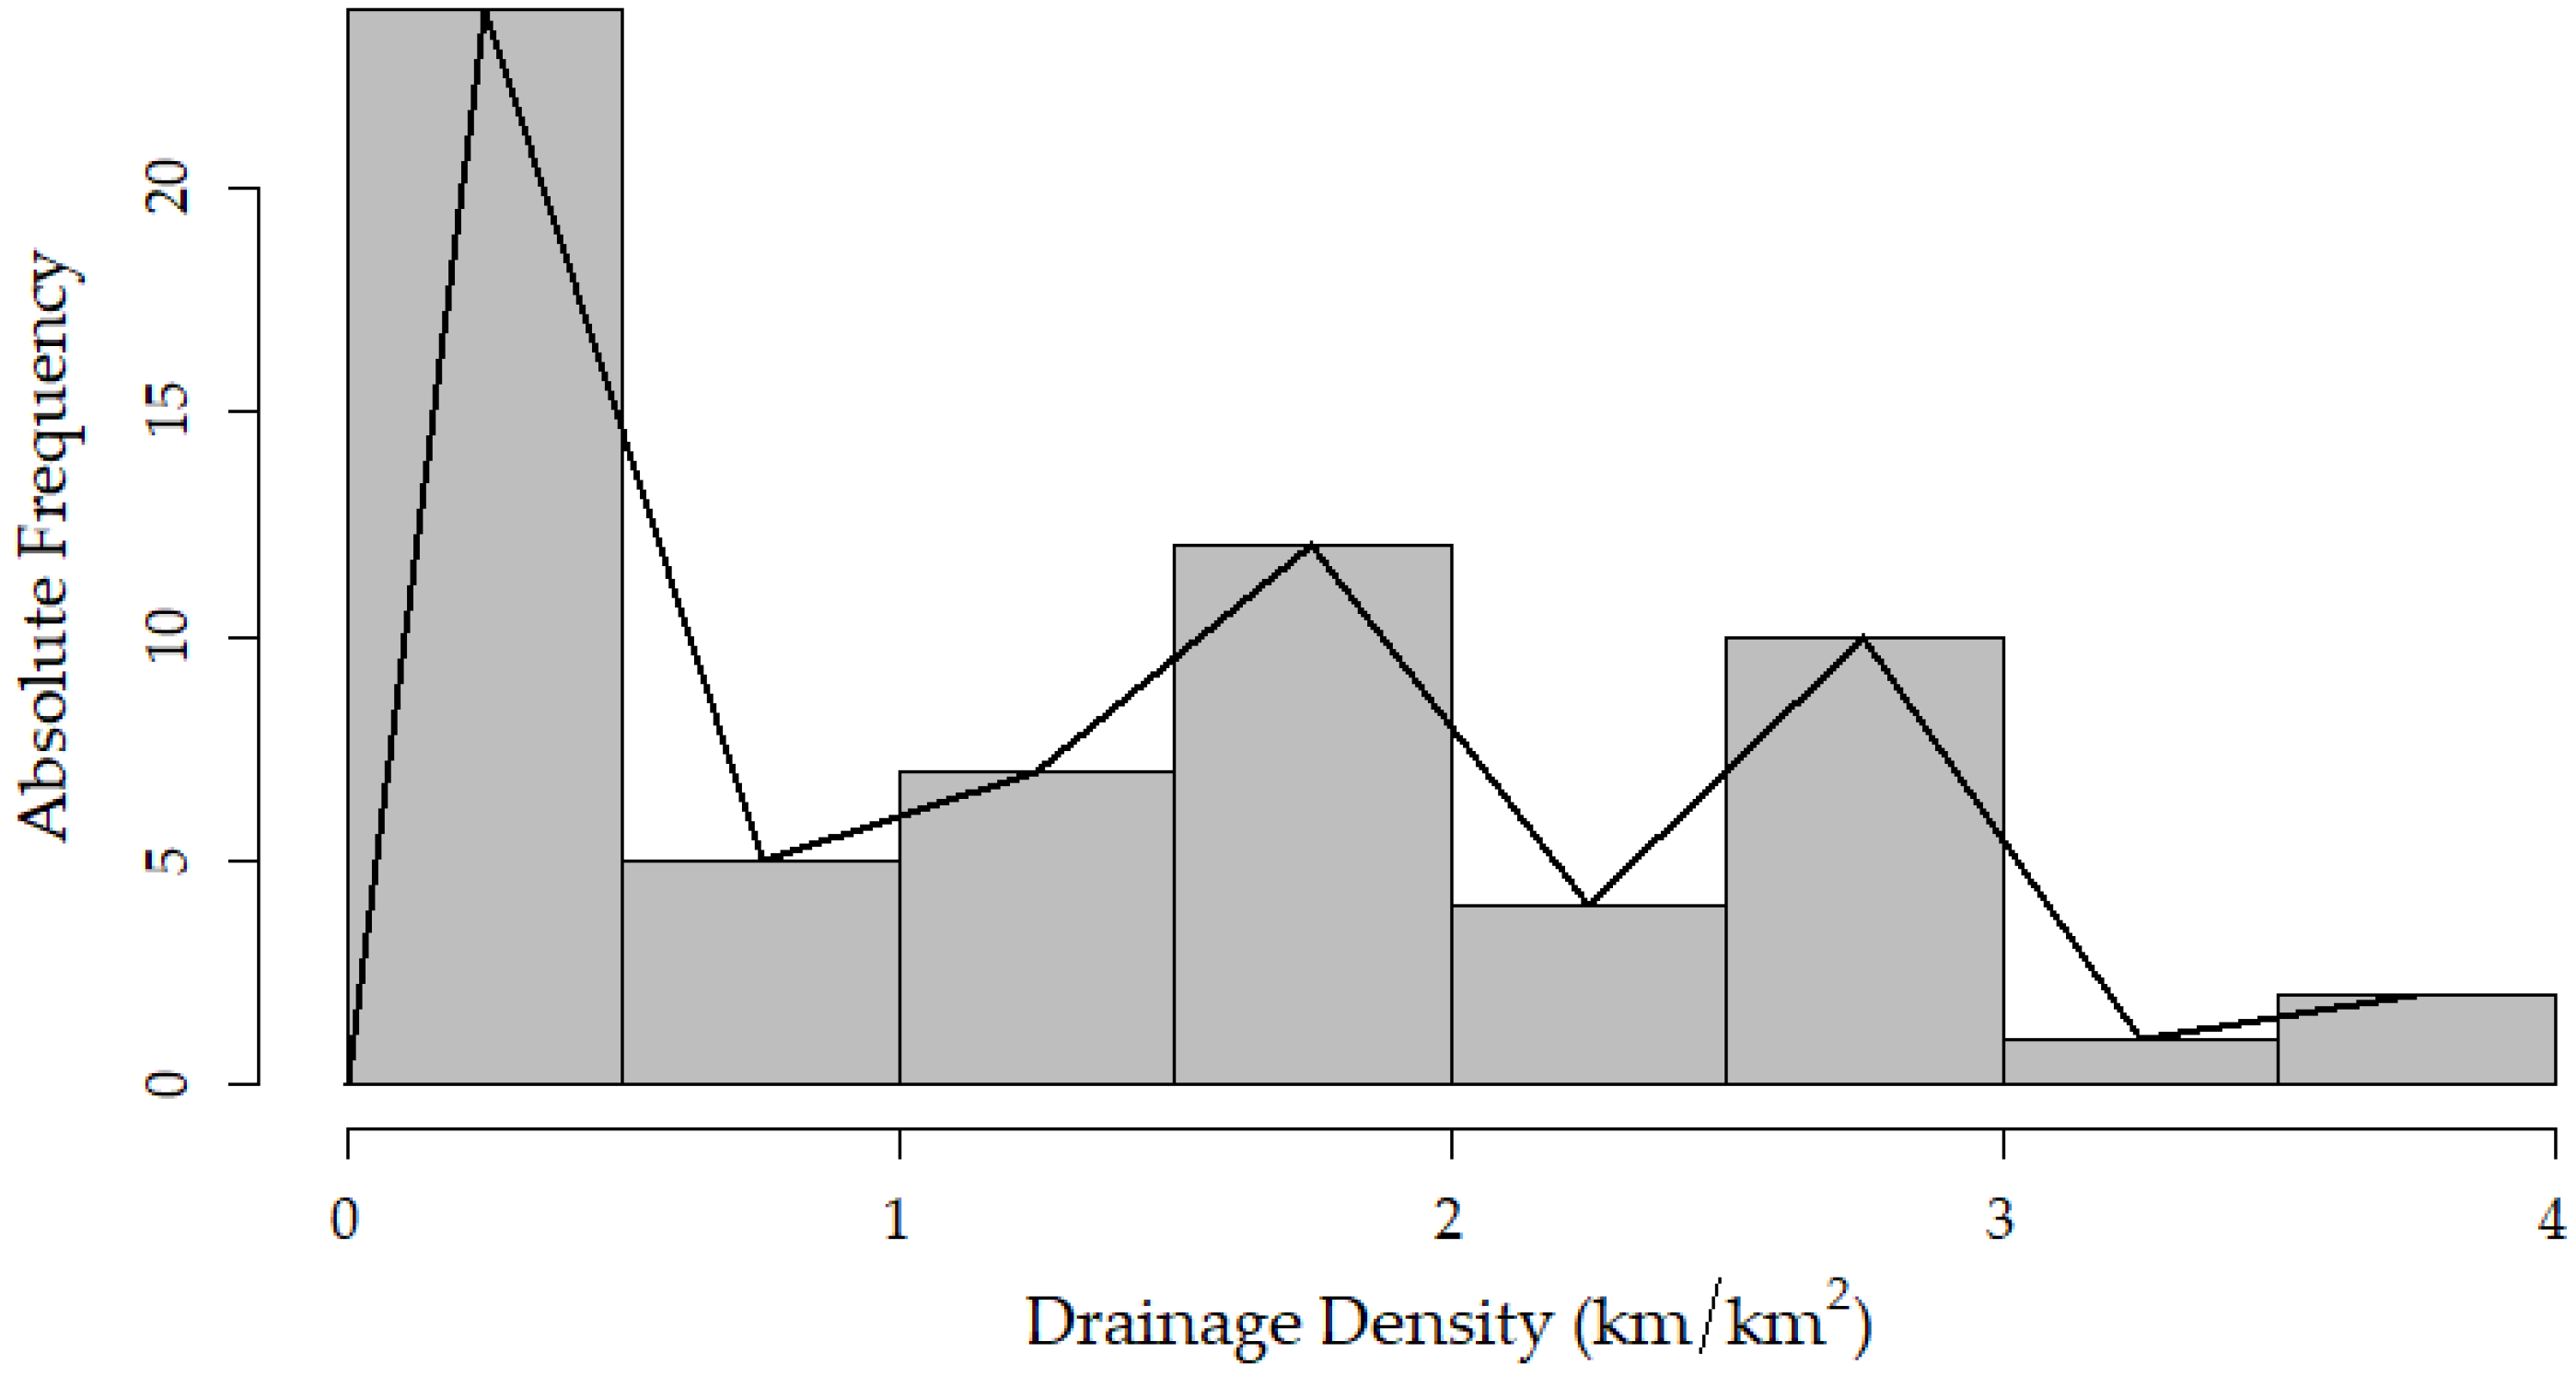
3.4. Drainage Density
3.5. Overland Flow Length
3.6. Constant of Channel Maintenance
3.7. Stream Frequency
3.8. Sinuosity of Currents
3.9. Bifurcation Ratio
3.10. Length Ratio
3.11. Form Factor
3.12. Circular Ratio
3.13. Elongation Ratio
3.14. Compactness Coefficient
3.15. Mean Slope of the Basin
3.16. Relief Factor
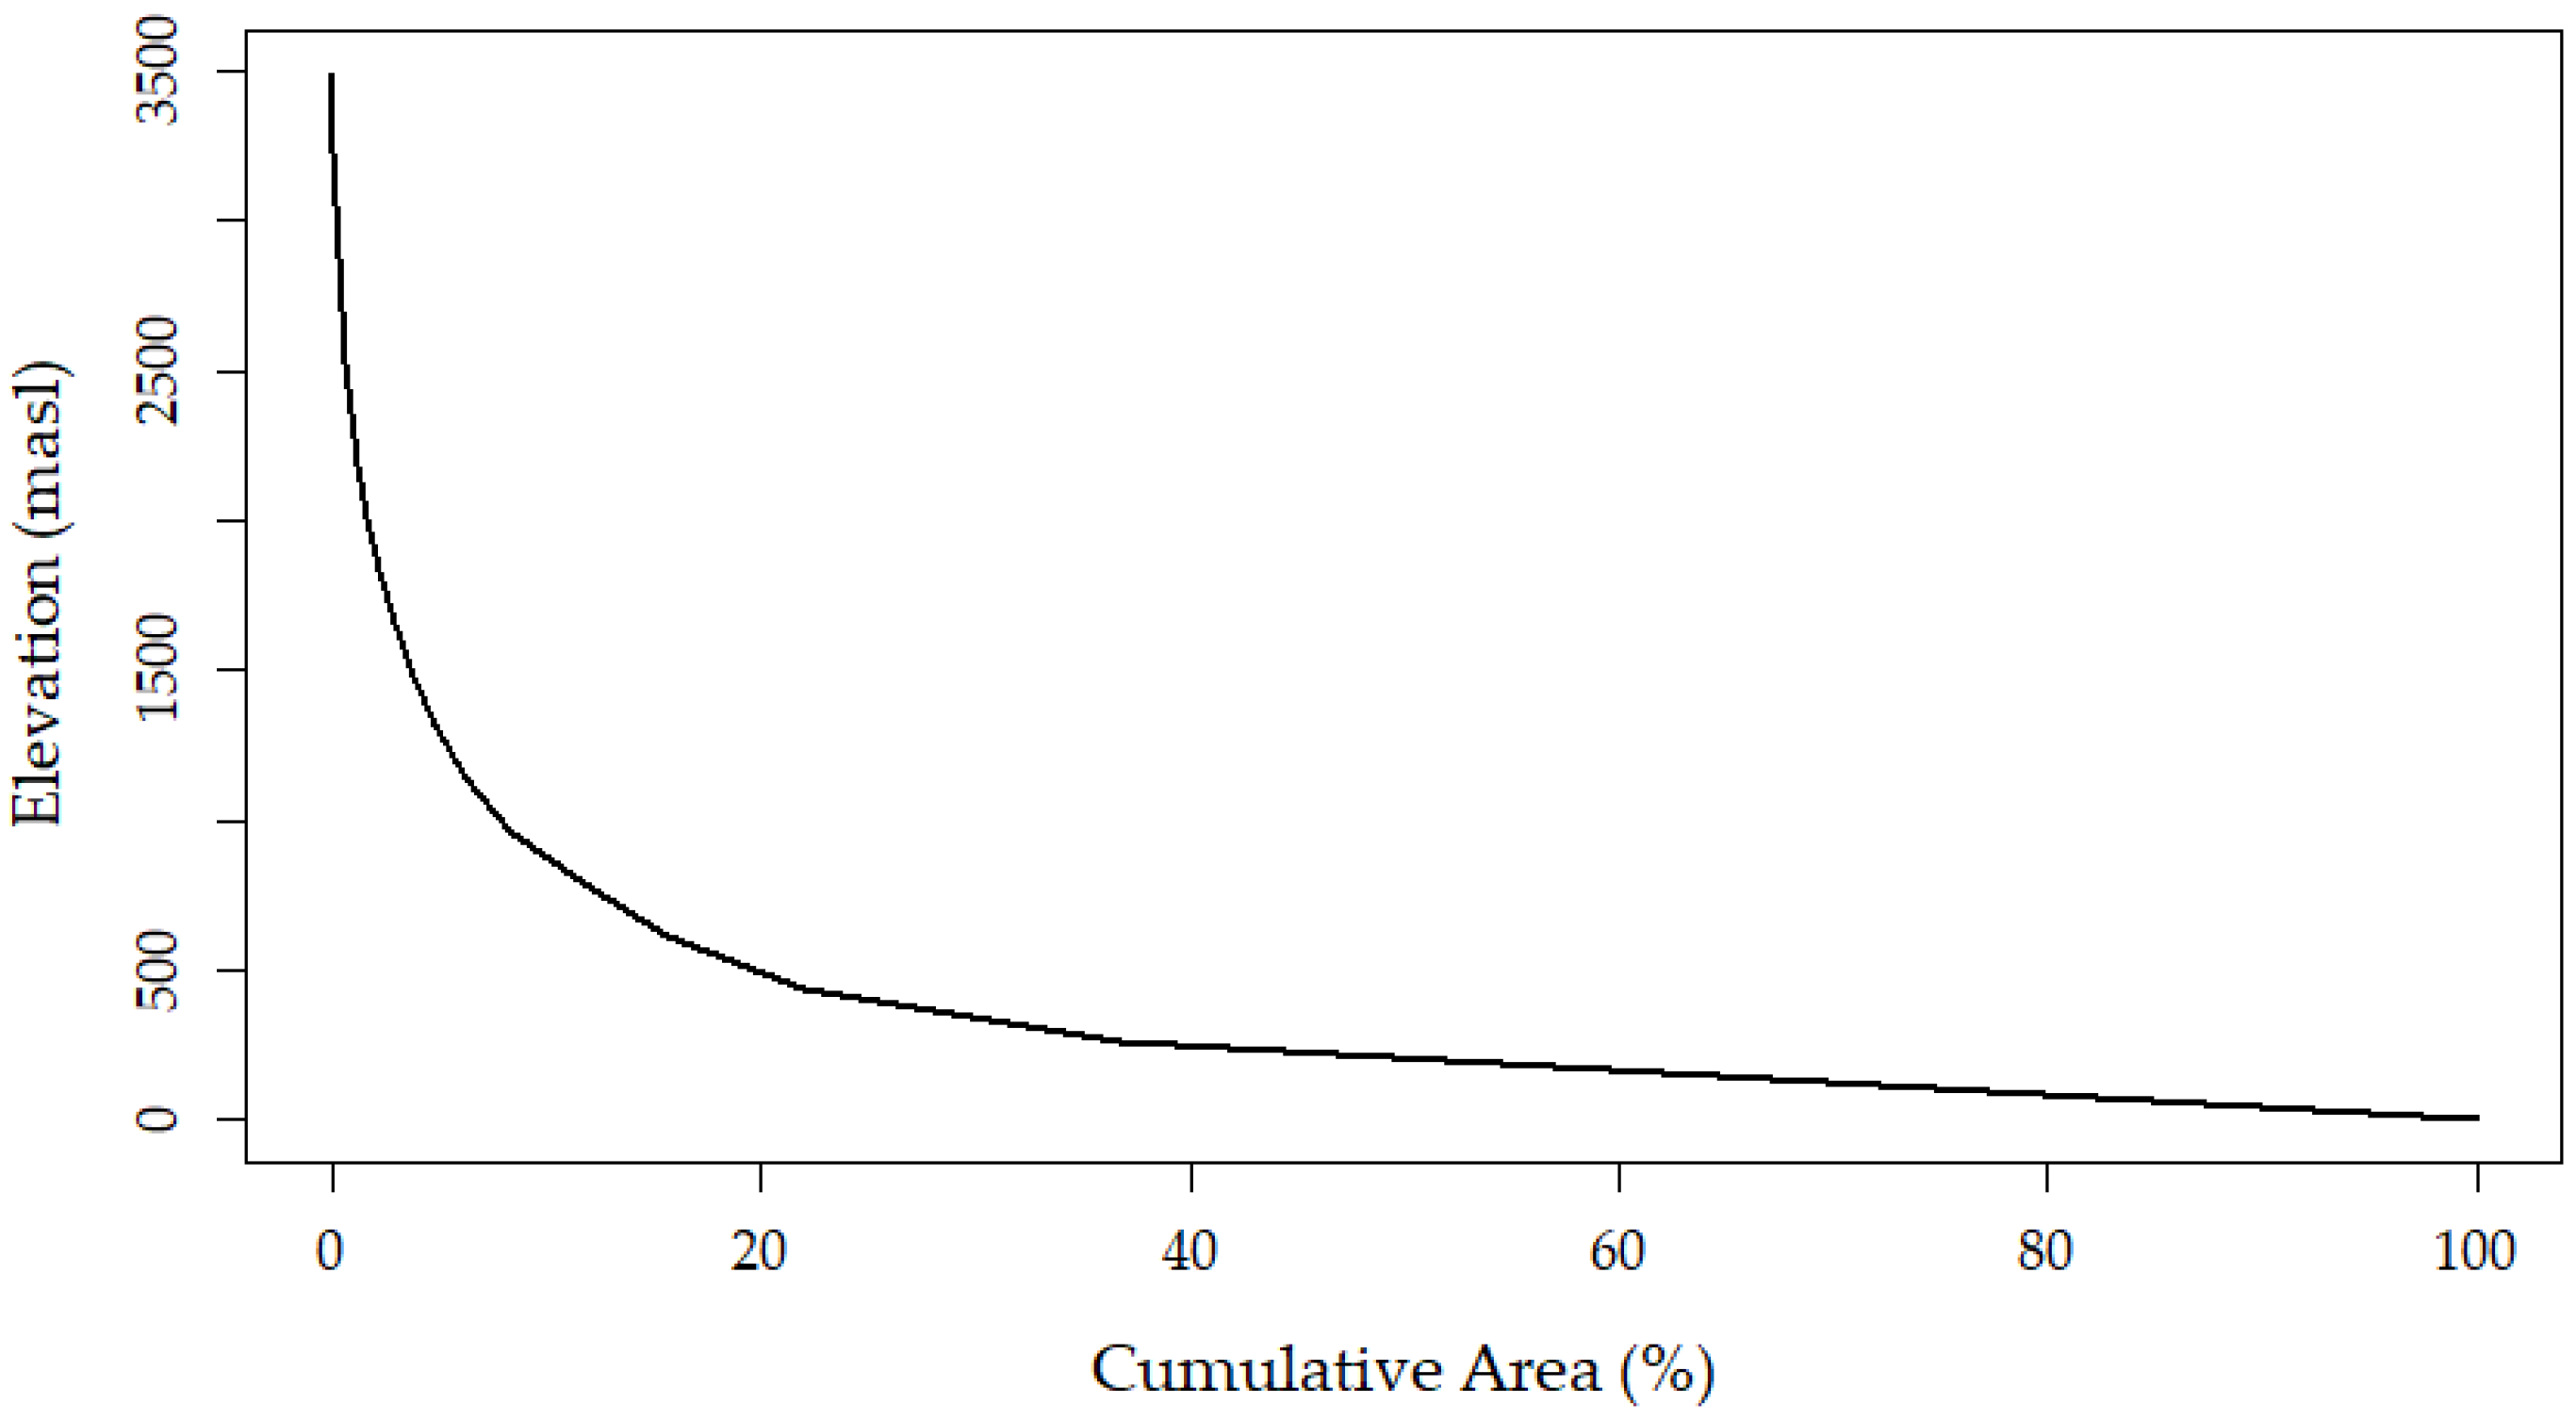
3.17. Hypsometric Curve of the Basin
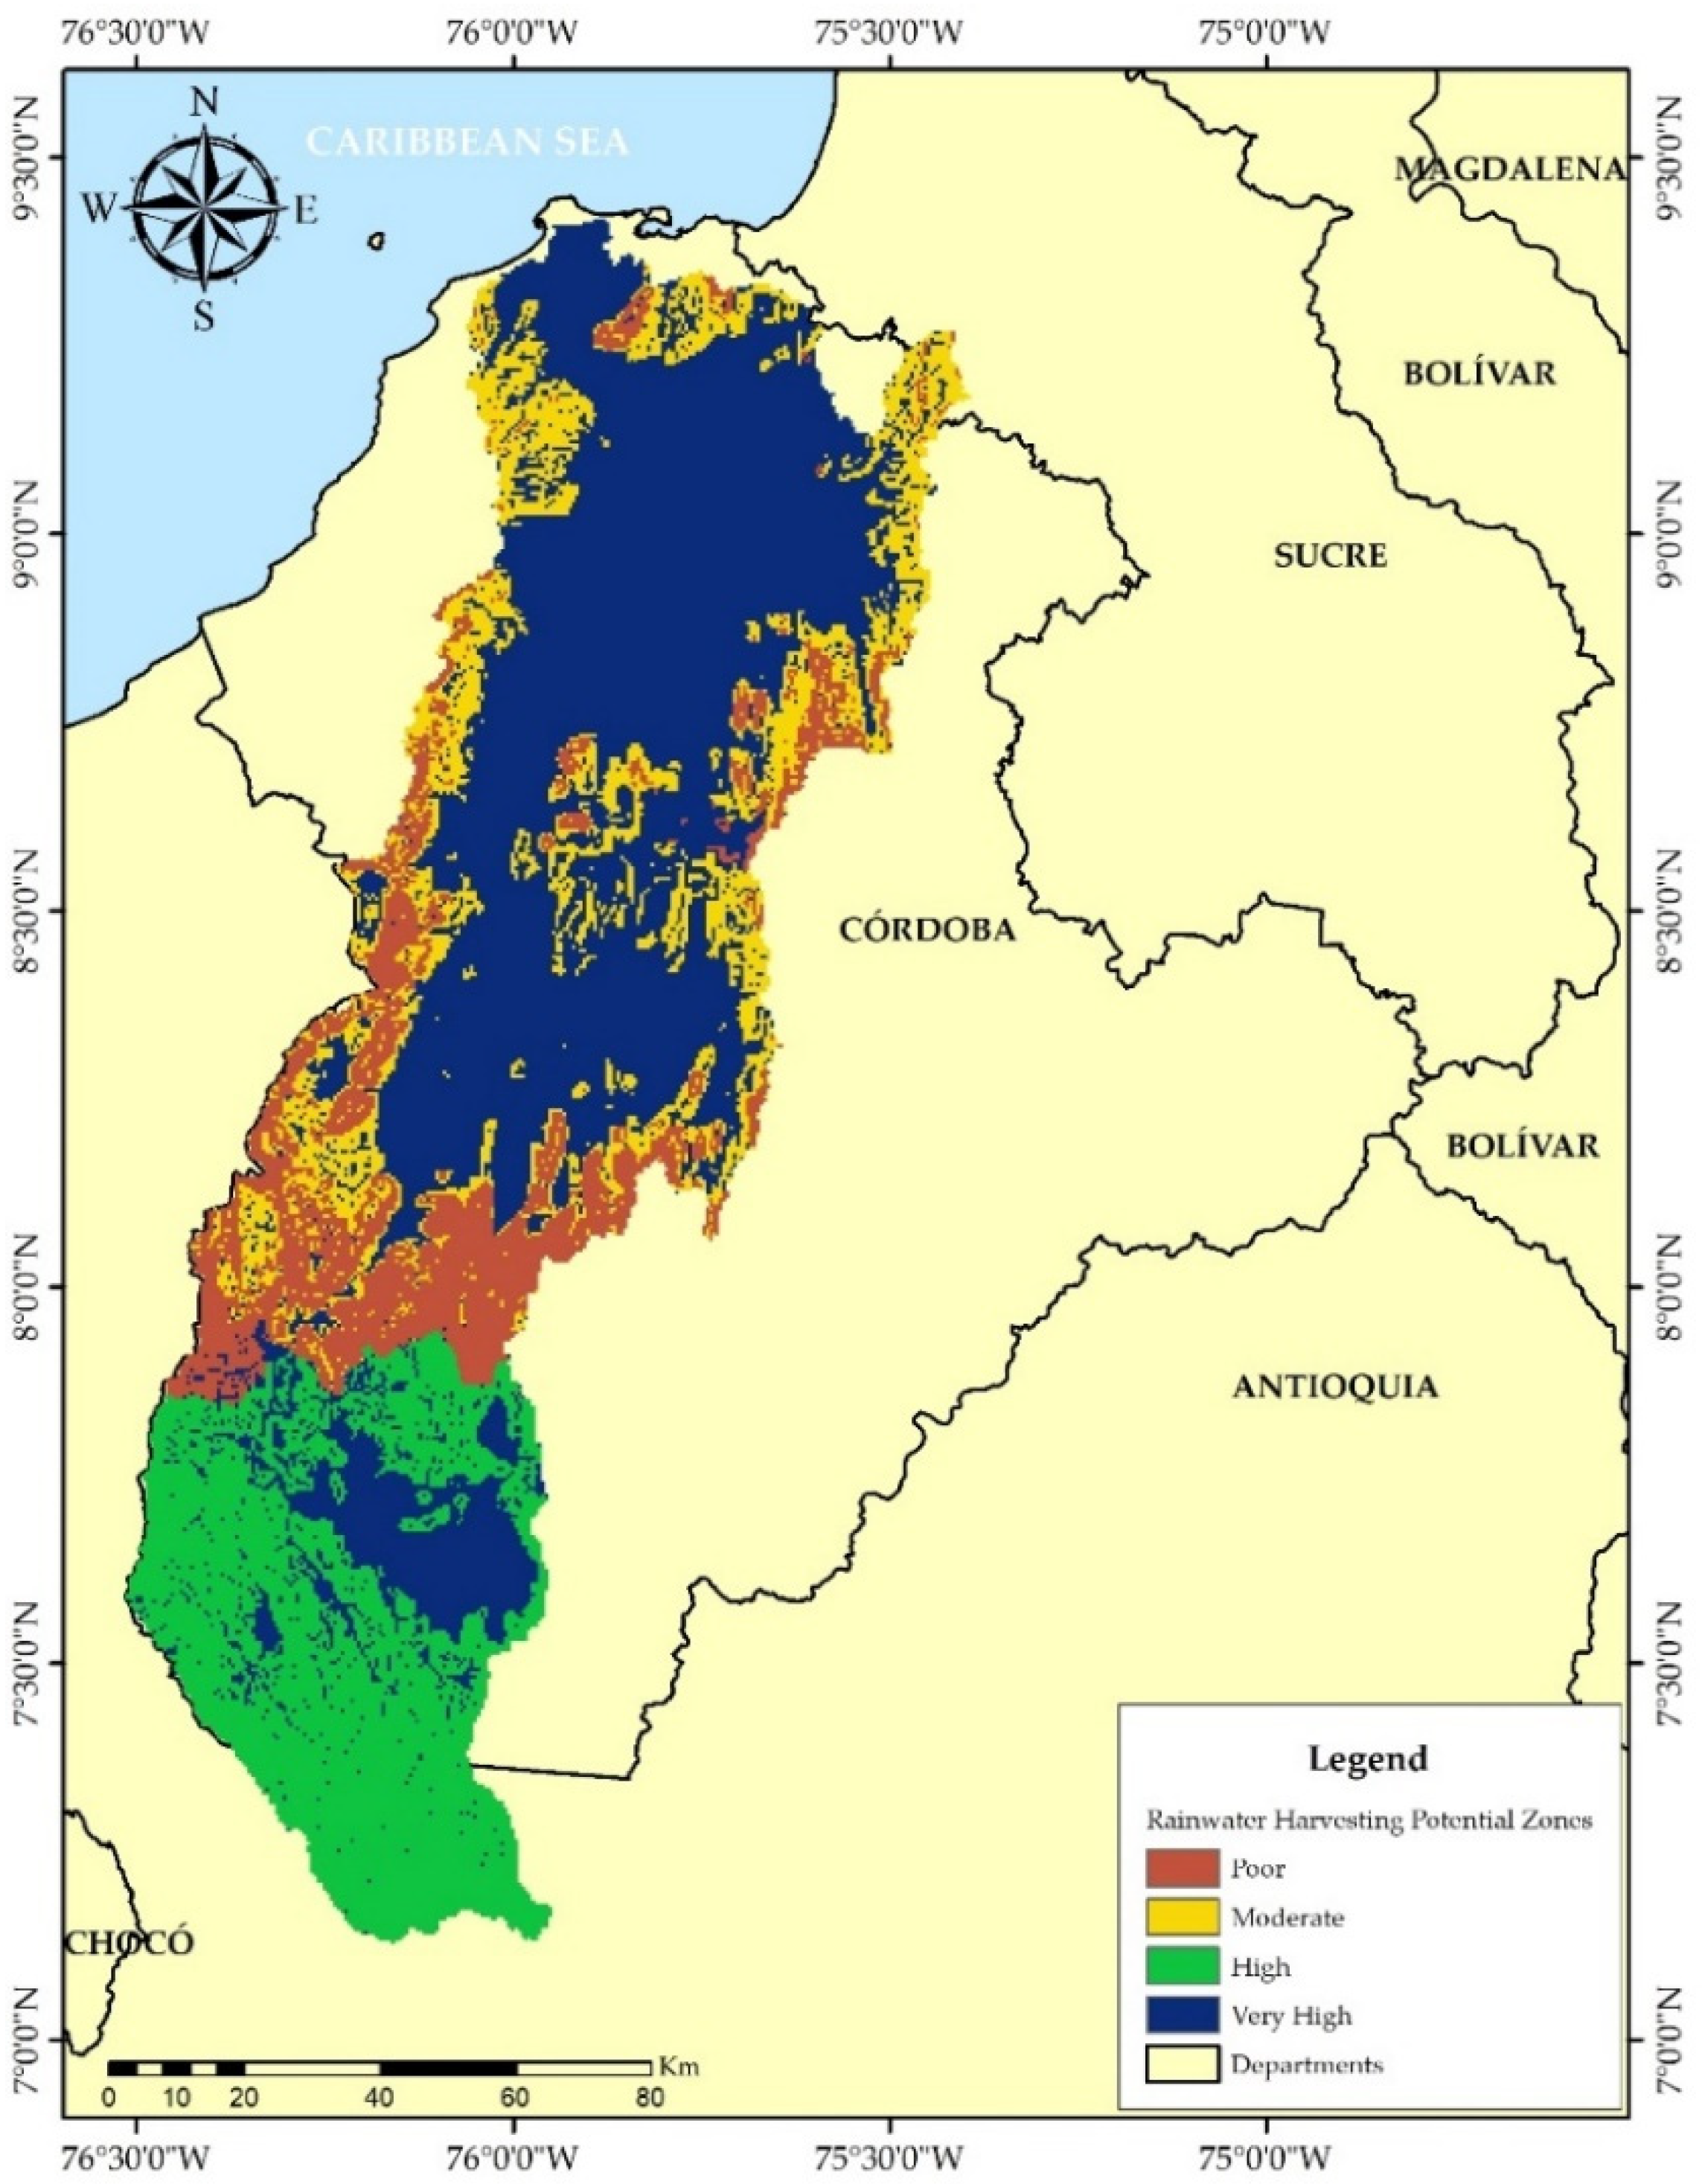
3.18. Rainwater Harvesting Potential Index (RWHPI)
4. Results
4.1. Drainage Network
4.2. Basin Geometry
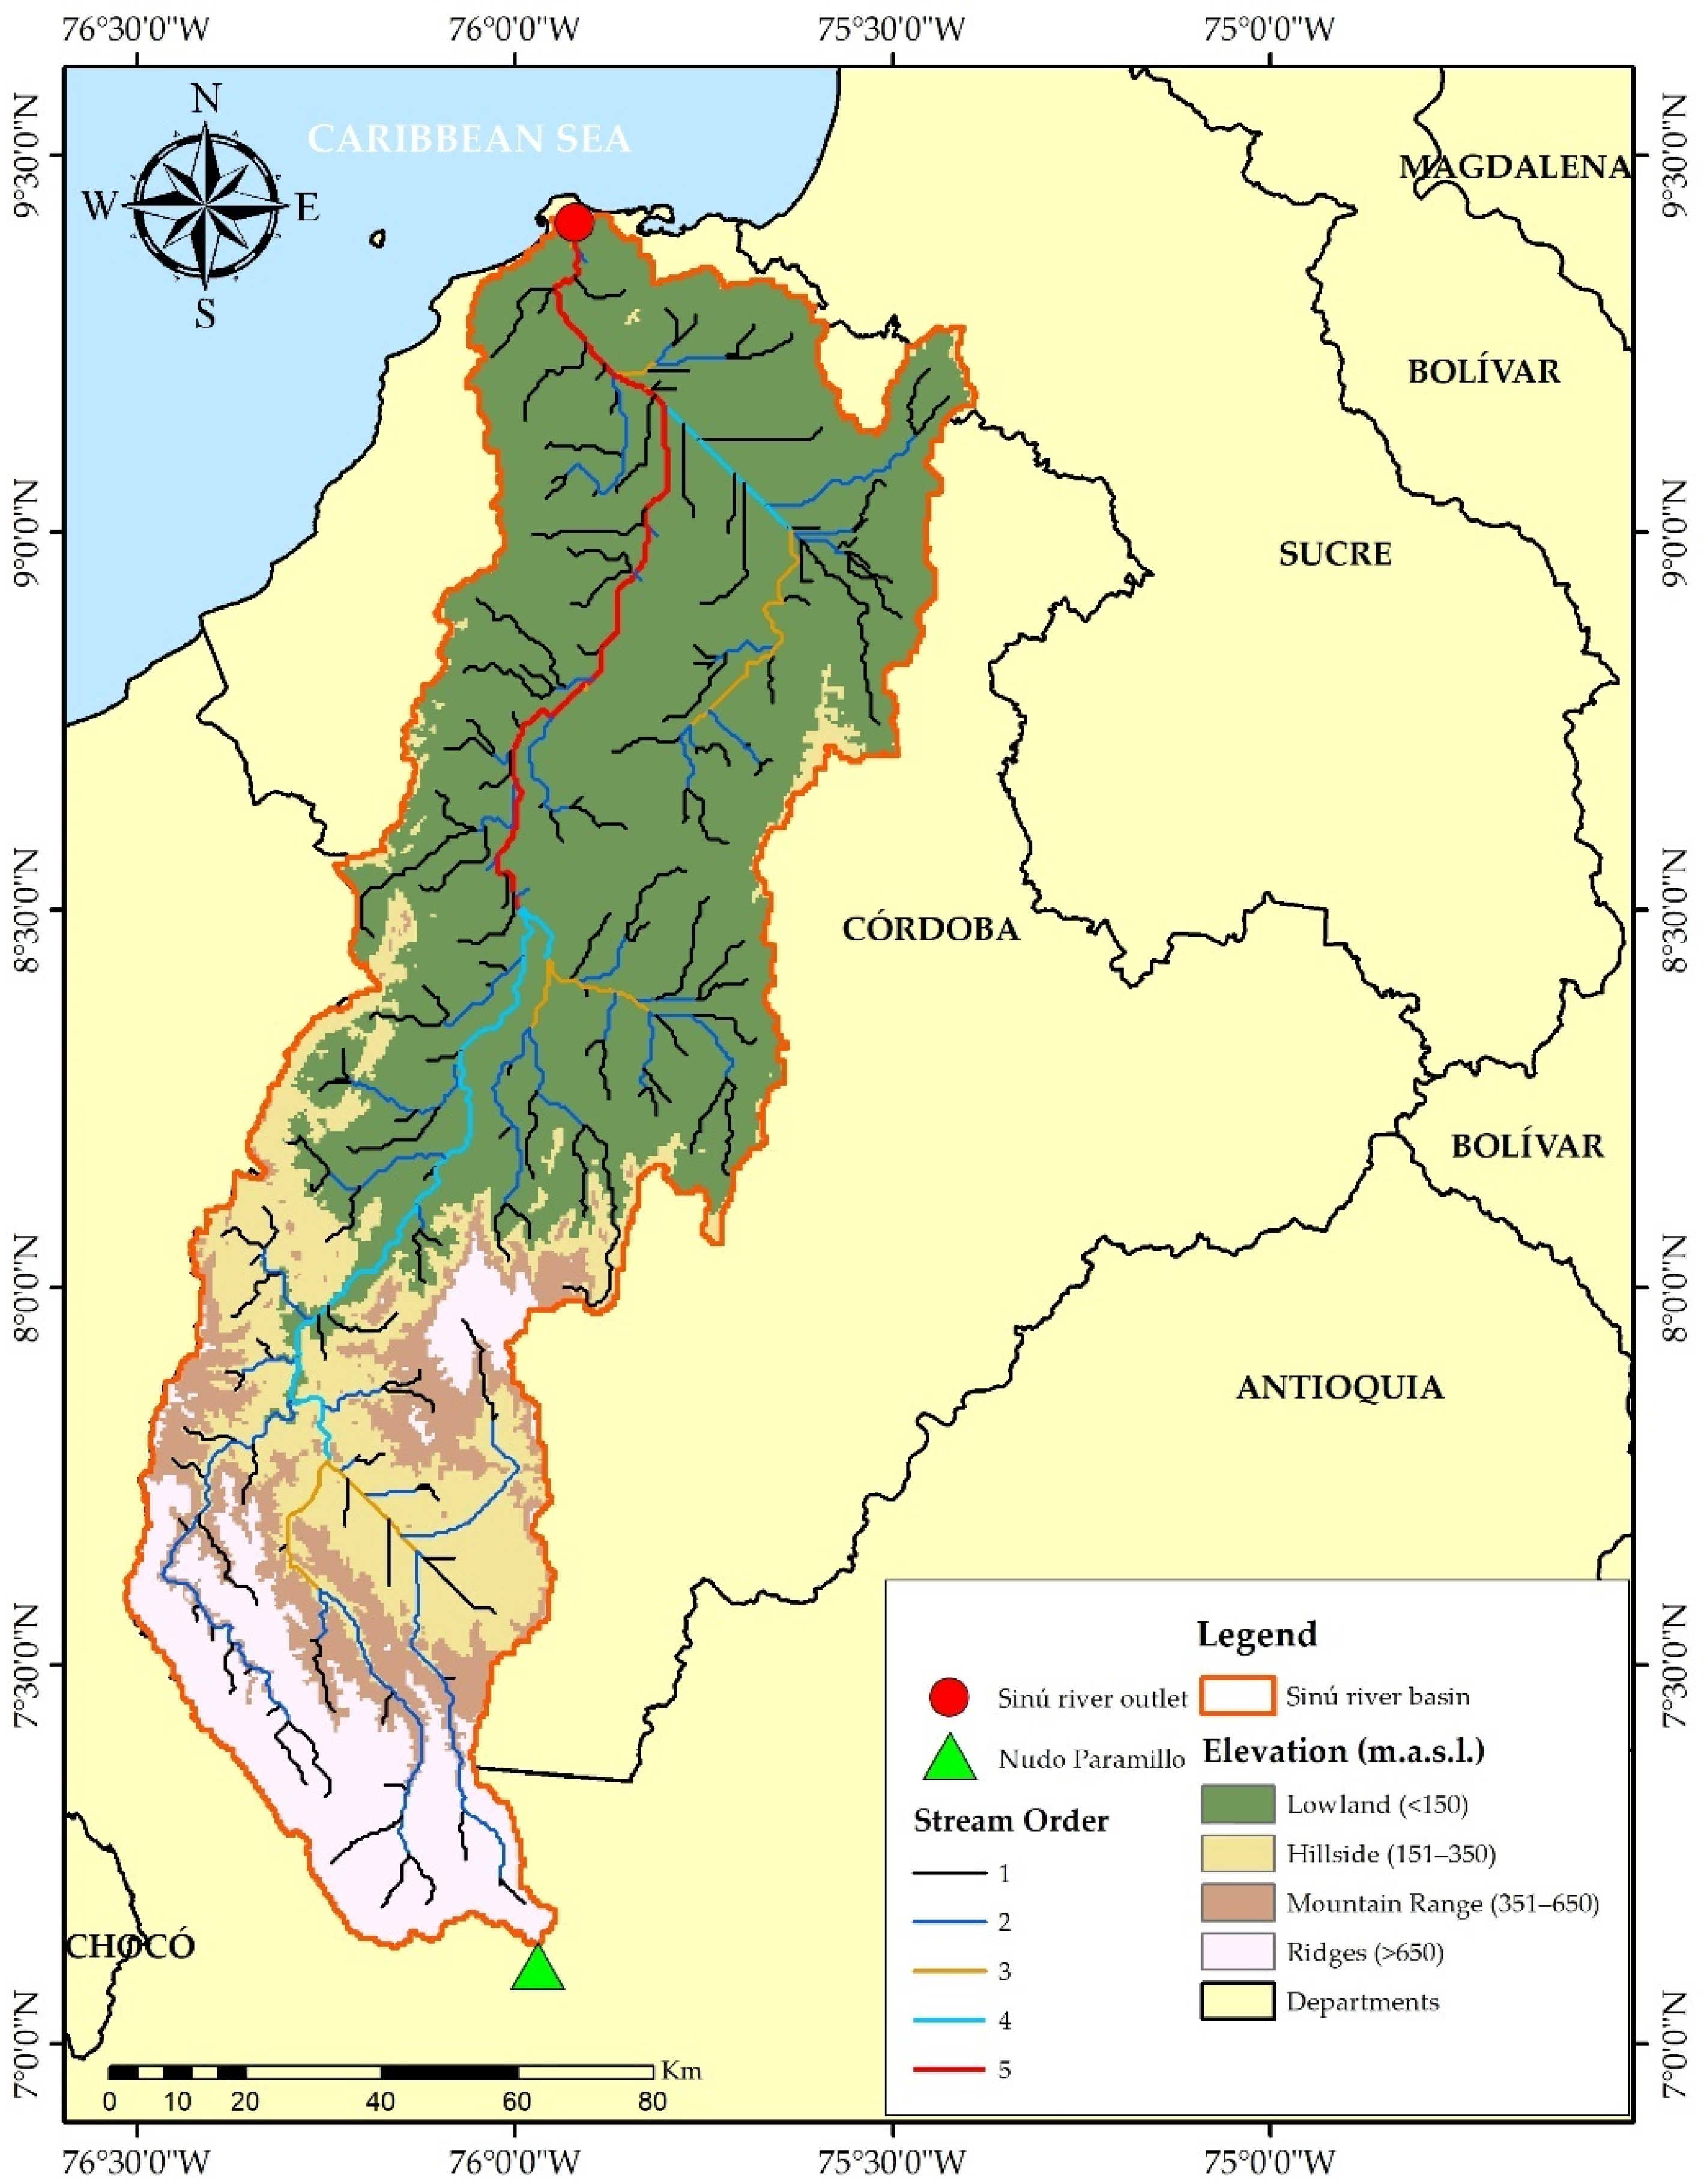
4.3. Basin Relief
4.4. Rainwater Harvesting Potential Index (RWHPI)
5. Discussion
5.1. Drainage Network
5.2. Basin Geometry
5.3. Basin Relief
5.4. Rainwater Harvesting Potential Zones
6. Conclusions
Author Contributions
Funding
Institutional Review Board Statement
Informed Consent Statement
Data Availability Statement
Conflicts of Interest
References
- Iqbal, M.; Sajjad, H.; Bhat, F.A. Morphometric Analysis of Shaliganga Sub Catchment, Kashmir Valley, India Using Geographical Information System. Int. J. Eng. Trends Technol. 2013, 4, 10–21. [Google Scholar]
- Sujatha, E.R.; Selvakumar, R.; Rajasimman, B. Watershed Prioritization of Palar Sub-Watershed Based on the Morphometric and Land Use Analysis. J. Mt. Sci. 2014, 11, 906–916. [Google Scholar] [CrossRef]
- Chitra, C.; Alaguraja, P.; Ganeshkumari, K.; Yuvaraj, D.; Manivel, M. Watershed Characteristics of Kundah Sub Basin Using Remote Sensing and GIS Techniques. Int. J. Geomat. Geosci. 2011, 2, 311–335. [Google Scholar]
- Horton, R.E. Erosional Development of Streams and Their Drainage Basins, Hydrophyrical Approach to Quantitative Morphology. Bull. Geol. Soc. Am. 1945, 40, 275–370. [Google Scholar] [CrossRef] [Green Version]
- Nneka, C.; Philip, A.; Nnadozie, O.P.; Ayogu, O. Morphometric Analysis and the Validity of Hortonian Postulations in Anambra Drainage Basin, Nigeria. Spat. Inf. Res. 2019, 27, 505–520. [Google Scholar] [CrossRef]
- Rai, P.K.; Mishra, V.N.; Mohan, K. A Study of Morphometric Evaluation of the Son Basin, India Using Geospatial Approach. Remote Sens. Appl. Soc. Environ. 2017, 7, 9–20. [Google Scholar] [CrossRef]
- Ameri, A.A.; Pourghasemi, H.R.; Cerda, A. Erodibility Prioritization of Sub-Watersheds Using Morphometric Parameters Analysis and Its Mapping: A Comparison among TOPSIS, VIKOR, SAW, and CF Multi-Criteria Decision Making Models. Sci. Total Environ. 2018, 613–614, 1385–1400. [Google Scholar] [CrossRef]
- Rai, P.K.; Singh, P.; Mishra, V.N.; Singh, A.; Sajan, B.; Shahi, A.P. Geospatial Approach for Quantitative Drainage Morphometric Analysis of Varuna River Basin, India. J. Landsc. Ecol. 2019, 12, 1–25. [Google Scholar] [CrossRef] [Green Version]
- Adnan, M.S.G.; Dewan, A.; Zannat, K.E.; Abdullah, A.Y.M. The Use of Watershed Geomorphic Data in Flash Flood Susceptibility Zoning: A Case Study of the Karnaphuli and Sangu River Basins of Bangladesh. Nat. Hazards 2019, 99, 425–428. [Google Scholar] [CrossRef]
- Gajbhiye, S.; Mishra, S.K.; Pandey, A. Prioritizing Erosion-Prone Area through Morphometric Analysis: An RS and GIS Perspective. Appl. Water Sci. 2014, 4, 51–61. [Google Scholar] [CrossRef] [Green Version]
- Malik, A.; Kumar, A.; Kandpal, H. Morphometric Analysis and Prioritization of Sub-Watersheds in a Hilly Watershed Using Weighted Sum Approach. Arab. J. Geosci. 2019, 12, 118. [Google Scholar] [CrossRef]
- Nitheshnirmal, S.; Thilagaraj, P.; Rahaman, S.A.; Jegankumar, R. Erosion Risk Assessment through Morphometric Indices for Prioritisation of Arjuna Watershed Using ALOS-PALSAR DEM. Model. Earth Syst. Environ. 2019, 5, 907–924. [Google Scholar] [CrossRef]
- Rahmati, O.; Samadi, M.; Shahabi, H.; Azareh, A.; Rafiei-Sardooi, E.; Alilou, H.; Melesse, A.M.; Pradhan, B.; Chapi, K.; Shirzadi, A. Geoscience Frontiers SWPT: An Automated GIS-Based Tool for Prioritization of Sub-Watersheds Based on Morphometric and Topo-Hydrological Factors. Geosci. Front. 2019, 10, 2167–2175. [Google Scholar] [CrossRef]
- Singh, L.K.; Jha, M.K.; Chowdary, V.M. Multi-Criteria Analysis and GIS Modeling for Identifying Prospective Water Harvesting and Artificial Recharge Sites for Sustainable Water Supply. J. Clean. Prod. 2017, 142, 1436–1456. [Google Scholar] [CrossRef]
- Ezzeldin, M.; Konstantinovich, S.E.; Igorevich, G.I. Determining the Suitability of Rainwater Harvesting for the Achievement of Sustainable Development Goals in Wadi Watir, Egypt Using GIS Techniques. J. Environ. Manag. 2022, 313, 114990. [Google Scholar] [CrossRef]
- Jena, S.K.; Tiwari, K.N. Modeling Synthetic Unit Hydrograph Parameters with Geomorphologic Parameters of Watersheds. J. Hydrol. 2006, 319, 1–14. [Google Scholar] [CrossRef]
- Viramontes-Olivas, O.A.; Escoboza-García, L.F.; Pinedo-Álvarez, C.; Pinedo-Álvarez, A.; Reyes-Gómez, V.M.; Román-Calleros, J.A.; Pérez-Márquez, A. Morfometria de La Cuenca Del Río San Pedro, Conchos, Chihuahua. Tecnociencia 2007, I, 21–31. [Google Scholar]
- Escalante, C.A.; Reyes, L. Tecnicas Estadisticas En Hidrología; Facultad de Ingeniería, Universidad Autónoma de México: Mexico City, Mexico, 2002. [Google Scholar]
- Horton, R.E. Drainage-Basin Characteristics. Eos Trans. Am. Geophys. Union 1932, 13, 350–361. [Google Scholar] [CrossRef]
- Schumm, S. Evolution of Drainage Systems and Slopes in Badland at Peth Amboy, New Jersey. Geol. Soc. Am. Bull. 1956, 67, 597–646. [Google Scholar] [CrossRef]
- Strahler, A.N. Quantitative Classification of Watershed Geomorphology. Trans. Am. Geophys. Union 1957, 38, 913–920. [Google Scholar] [CrossRef] [Green Version]
- Shreve, R.L. Statistical Law of Stream Numbers. J. Geol. 1966, 74, 17–37. [Google Scholar] [CrossRef]
- Rai, P.K.; Chaubey, P.K.; Mohan, K.; Singh, P. Geoinformatics for Assessing the Inferences of Quantitative Drainage Morphometry of the Narmada Basin in India. Appl. Geomat. 2017, 9, 167–189. [Google Scholar] [CrossRef]
- Alqahtani, F.; Qaddah, A.A. GIS Digital Mapping of Flood Hazard in Jeddah-Makkah Region from Morphometric Analysis. Arab. J. Geosci. 2019, 12, 199. [Google Scholar] [CrossRef]
- Mangan, P.; Haq, M.A.; Baral, P. Morphometric Analysis of Watershed Using Remote Sensing and GIS—A Case Study of Nanganji River Basin in Tamil Nadu, India. Arab. J. Geosci. 2019, 12, 202. [Google Scholar] [CrossRef]
- Panda, B.; Venkatesh, M.; Kumar, B. A GIS-Based Approach in Drainage and Morphometric Analysis of Ken River Basin and Sub-Basins, Central India. J. Geol. Soc. India 2019, 93, 75–84. [Google Scholar] [CrossRef]
- Prakash, K.; Rawat, D.; Singh, S.; Chaubey, K.; Kanhaiya, S.; Mohanty, T. Morphometric Analysis Using SRTM and GIS in Synergy with Depiction: A Case Study of the Karmanasa River Basin, North Central India. Appl. Water Sci. 2019, 9, 1–10. [Google Scholar] [CrossRef] [Green Version]
- Shivhare, V.; Gupta, C.; Mallick, J.; Singh, C.K. Geospatial Modelling for Sub-Watershed Prioritization in Western Himalayan Basin Using Morphometric Parameters. Nat. Hazards 2022, 110, 545–561. [Google Scholar] [CrossRef]
- Shrivatra, J.R.; Manjare, B.S.; Paunikar, S.K. A GIS-Based Assessment in Drainage Morphometry of WRJ-1 Watershed in Hard Rock Terrain of Narkhed Taluka, Maharashtra, Central India. Remote Sens. Appl. Soc. Environ. 2021, 22, 100467. [Google Scholar] [CrossRef]
- Corporación Autónoma Regional de los Valles del Sinú y San Jorge (CVS). Fases de Prospección y Formulación Del Plan de Ordenamiento y Manejo Integral de La Cuenca Hidrográfica Del Río Sinú (POMCA-RS); CVS: Montería, Colombia, 2006. [Google Scholar]
- Valbuena, D.L. Geomorfología y Condiciones Hidráulicas Del Sistema Fluvial Del Río Sinú. Integración Multiescalar. 1945–1999–2016; Universidad Nacional de Colombia: Bogotá, Colombia, 2017. [Google Scholar]
- Instituto Geográfico Agustín Codazzi (Ed.) Estudio General de Suelos y Zonificación de Tierras, Departamento de Córdoba, 1st ed.; Imprenta Nacional de Colombia: Bogotá, Colombia, 2009. [Google Scholar]
- Remane, J. Explanatory Note to the International Stratigraphic Chart; International Union of Geological Sciences: Trondheim, Norway, 2000. [Google Scholar]
- Gómez, J.; Nivia, Á.; Montes, N.E.; Almanza, M.F.; Alcárcel, F.A.; Madrid, C.A. Notas Explicativas: Mapa Geológico de Colombia. In Compilando la Geología de Colombia: Una Visión a 2015; Gómez, J., Almanza, M.F., Eds.; Servicio Geológico Colombiano: Bogotá, Colombia, 2015; Volume 33, pp. 9–33. [Google Scholar]
- BID; CEPAL; DNP. Valoración de Daños y Pérdidas. Ola Invernal En Colombia 2010–2011; Misión BID—Cepal: Bogotá, Colombia, 2012; 240p. [Google Scholar]
- IDEAM. Estudio Nacional Del Agua 2018; Instituto de Hidrología, Meteorología y Estudios Ambientales: Bogotá, Colombia, 2019; ISBN 9789585489127. [Google Scholar]
- CVS. Puntos Críticos Cuenca Sinú; CVS: Montería, Colombia, 2019. [Google Scholar]
- Felicísimo, A.M. Modelos Digitales Del Terreno. Introducción y Aplicaciones En Las Ciencias Ambientales; Pentalfa Ediciones: Oviedo, Spain, 1994. [Google Scholar]
- U.S. Geological Survey (USGS). HydroSHEDS 15 Arc-Second DEMs for South America. Available online: http://hydrosheds.cr.usgs.gov (accessed on 28 May 2018).
- Rineer, J.; Bruhn, M.; Miralles-Wilhelm, F. Nota Técnica Base de Datos de Hidrología Analítica Para América Latina y El Caribe; Banco Interamericano de Desarrollo (BID): Washington, DC, USA, 2014. [Google Scholar]
- Jenson, K.; Domingue, O. Extracting Topographic Structure from Digital Elevation Data for Geographic Information System Analysis. Photogramm. Eng. Remote Sens. 1988, 54, 1593–1600. [Google Scholar]
- Mueller, J.E. An Introduction to the Hydraulic and Topographic Sinuosity Indexes. Ann. Assoc. Am. Geogr. 1968, 58, 371–385. [Google Scholar] [CrossRef]
- Martínez-Acosta, L.; López-Lambraño, A.A.; López-Ramos, A. Design Criteria for Planning the Agricultural Rainwater Harvesting Systems: A Review. Appl. Sci. 2019, 9, 5298. [Google Scholar] [CrossRef] [Green Version]
- Instituto Geográfico Agustín Codazzi Datos Abiertos Cartografía y Geografía-Cartografía Base Escala 1:25,000. Available online: https://geoportal.igac.gov.co/contenido/datos-abiertos-cartografia-y-geografia (accessed on 27 May 2018).
- Miller, V.C. A Quantitative Geomorphologic Study of Drainage Basin Characteristics in the Clinch Mountain Area, Virginia and Tennessee; Technical report; Columbia University: New York, NY, USA, 1953. [Google Scholar]
- Magesh, N.S.; Jitheshlal, K.V.; Chandrasekar, N.; Jini, K.V. GIS Based Morphometric Evaluation of Chimmini and Mupily Watersheds, Parts of Western Ghats, Thrissur District, Kerala, India. Earth Sci. Inform. 2012, 5, 111–121. [Google Scholar] [CrossRef]
- Bhagwat, T.N.; Shetty, A.; Hegde, V.S. Spatial Variation in Drainage Characteristics and Geomorphic Instantaneous Unit Hydrograph (GIUH); Implications for Watershed Management-A Case Study of the Varada River Basin, Northern Karnataka. Catena 2011, 87, 52–59. [Google Scholar] [CrossRef]
- Pareta, K.; Pareta, U. Quantitative Morphometric Analysis of a Watershed of Yamuna Basin, India Using ASTER (DEM) Data and GIS. Int. J. Geomat. Geosci. 2011, 2, 248–269. [Google Scholar]
- Chopra, R.; Dhiman, R.D.; Sharma, P.K. Morphometric Analysis of Sub-Watersheds in Gurdaspur District, Punjab Using Remote Sensing and GIS Techniques. J. Indian Soc. Remote Sens. 2005, 33, 531–539. [Google Scholar] [CrossRef]
- Sreedevi, P.D.; Subrahmanyam, K.; Ahmed, S. The Significance of Morphometric Analysis for Obtaining Groundwater Potential Zones in a Structurally Controlled Terrain. Environ. Geol. 2005, 47, 412–420. [Google Scholar] [CrossRef]
- Hajam, R.A.; Hamid, A.; Bhat, S. Application of Morphometric Analysis for Geo-Hydrological Studies Using Geo-Spatial Technology—A Case Study of Vishav Drainage Basin. J. Waste Water Treat. Anal. 2013, 4, 12. [Google Scholar] [CrossRef] [Green Version]
- Ahmed, A.A.; Fawzi, A. Meandering and Bank Erosion of the River Nile and Its Environmental Impact on the Area between Sohag and El-Minia, Egypt. Arab. J. Geosci. 2011, 4, 1–11. [Google Scholar] [CrossRef]
- Londoño Arango, C. Cuencas Hidrográficas: Bases Conceptuales, Caracterización, Administración; Universidad del Tolima: Ibagué, Colombia, 2001. [Google Scholar]
- Richardson, J.C.; Hodgson, D.M.; Wilson, A.; Carrivick, J.L.; Lang, A. Testing the Applicability of Morphometric Characterisation in Discordant Catchments to Ancient Landscapes: A Case Study from Southern Africa. Geomorphology 2016, 261, 162–176. [Google Scholar] [CrossRef]
- Ahmed, S.A.; Chandrashekarappa, K.N.; Raj, S.K.; Nischitha, V.; Kavitha, G. Evaluation of Morphometric Parameters Derived from ASTER and SRTM DEM—A Study on Bandihole Sub-Watershed Basin in Karnataka. J. Indian Soc. Remote Sens. 2010, 38, 227–238. [Google Scholar] [CrossRef]
- Gayen, S.; Bhunia, G.S.; Shit, P.K. Morphometric Analysis of Kangshabati-Darkeswar Interfluves Area in West Bengal, India Using ASTER DEM and GIS Techniques. J. Geol. Geosci. 2013, 2, 1–10. [Google Scholar] [CrossRef] [Green Version]
- Abboud, I.A.; Nofal, R.A. Morphometric Analysis of Wadi Khumal Basin, Western Coast of Saudi Arabia, Using Remote Sensing and GIS Techniques. J. Afr. Earth Sci. 2017, 126, 58–74. [Google Scholar] [CrossRef]
- Ozdemir, H.; Bird, D. Evaluation of Morphometric Parameters of Drainage Networks Derived from Topographic Maps and DEM in Point of Floods. Environ. Geol. 2009, 56, 1405–1415. [Google Scholar] [CrossRef]
- Singh, P.; Thakur, J.K.; Singh, U.C. Morphometric Analysis of Morar River Basin, Madhya Pradesh, India, Using Remote Sensing and GIS Techniques. Environ. Earth Sci. 2013, 68, 1967–1977. [Google Scholar] [CrossRef]
- Magesh, N.S.; Jitheshlal, K.V.; Chandrasekar, N.; Jini, K.V. Geographical Information System-Based Morphometric Analysis of Bharathapuzha River Basin, Kerala, India. Appl. Water Sci. 2013, 3, 467–477. [Google Scholar] [CrossRef] [Green Version]
- Arulbalaji, P.; Gurugnanam, B. Geospatial Tool-Based Morphometric Analysis Using SRTM Data in Sarabanga Watershed, Cauvery River, Salem District, Tamil Nadu, India. Appl. Water Sci. 2017, 7, 3875–3883. [Google Scholar] [CrossRef] [Green Version]
- Bali, R.; Agarwal, K.K.; Ali, S.N.; Rastogi, S.K.; Krishna, K. Drainage Morphometry of Himalayan Glacio-Fluvial Basin, India: Hydrologic and Neotectonic Implications. Environ. Earth Sci. 2012, 66, 1163–1174. [Google Scholar] [CrossRef]
- Servicio Geológico Colombiano; Universidad Nacional de Colombia. Memoria Técnica Explicativa Del Mapa Geomorfológico Analítico Aplicado a La Zonificación de Amenaza Por Movimientos En Masa Escala 1:100.000 Plancha 89bis–Río Salaquí, Departamento de Chocó; Universidad Nacional de Colombia: Bogotá, Colombia, 2015. [Google Scholar]
- Javed, A.; Yousuf, M.; Rizwan, K. Prioritization of Sub-Watersheds Based on Morphometric and Land Use Analysis Using Remote Sensing and GIS Techniques. J. Indian Soc. Remote Sens. 2009, 37, 261–274. [Google Scholar] [CrossRef]
- Patel, D.P.; Gajjar, C.A.; Srivastava, P.K. Prioritization of Malesari Mini-Watersheds through Morphometric Analysis: A Remote Sensing and GIS Perspective. Environ. Earth Sci. 2013, 69, 2643–2656. [Google Scholar] [CrossRef]
- Nanda, A.M.; Ahmed, P.; Kanth, T.A.; Hajam, R.A. Morphometric Analysis of Sandran Drainage Basin (J & K) Using Geo—Spatial Technology. Earth Sci. India 2014, 7, 55–66. [Google Scholar]
- Bajabaa, S.; Masoud, M.; Al-Amri, N. Flash Flood Hazard Mapping Based on Quantitative Hydrology, Geomorphology and GIS Techniques (Case Study of Wadi Al Lith, Saudi Arabia). Arab. J. Geosci. 2014, 7, 2469–2481. [Google Scholar] [CrossRef]
- Reddy, G.P.O.; Maji, A.K.; Gajbhiye, K.S. Drainage Morphometry and Its Influence on Landform Characteristics in a Basaltic Terrain, Central India—A Remote Sensing and GIS Approach. Int. J. Appl. Earth Obs. Geoinf. 2004, 6, 1–16. [Google Scholar] [CrossRef]
- Thomas, J.; Joseph, S.; Thrivikramji, K.P.; Abe, G.; Kannan, N. Morphometrical Analysis of Two Tropical Mountain River Basins of Contrasting Environmental Settings, the Southern Western Ghats, India. Environ. Earth Sci. 2012, 66, 2353–2366. [Google Scholar] [CrossRef]
- Strahler, A.N. Hypsometric (Area-Altitude) Analysis of Erosional Topography. Geol. Soc. Am. Bull. 1952, 63, 1117–1142. [Google Scholar] [CrossRef]


| Morphometric Parameter | Formula/Definition | Reference |
|---|---|---|
| Drainage network | ||
| Stream order | Hierarchical rank. | [4,21] |
| Stream length | Main channel length of the stream (km) | [4] |
| Stream length | Total stream length (km)/GIS software analysis | [4] |
| Number of streams | Total stream number of a given order/GIS software analysis | [4] |
| Stream axial length | Shortest distance between the beginning and the outlet of a stream (km)/GIS software analysis | [42] |
| Drainage density | [4] | |
| Length of overland flow | [4] | |
| Constant of channel maintenance | [20] | |
| Stream frequency | [4] | |
| Average stream length | [4] | |
| Sinuosity | [42] | |
| Bifurcation ratio | [4] | |
| Mean bifurcation ratio | [20] | |
| Stream length ratio | [4] | |
| Basin geometry | ||
| Basin area | Plan area of the watershed | [4] |
| Basin perimeter | GIS software analysis (km) | [4] |
| Basin length | Maximum basin length (km)/GIS software analysis. | [19] |
| Form factor | [19] | |
| Circularity ratio | [45] | |
| Elongation ratio | [20] | |
| Compactness coefficient | [19] | |
| Basin relief | ||
| Minimum basin height | GIS software analysis (masl). | [20] |
| Maximum basin height | GIS software analysis (masl). | [20] |
| Mean basin slope | GIS software analysis (%). | [20] |
| Basin relief | [20] | |
| Relief ratio | [20] | |
| Order | Stream Number | Number of Sub-Basins | Sub Sub-Basins (km2) | Total Streams Length (km) | Average Stream Length (km) | Stream Length Ratio | Bifurcation Ratio |
|---|---|---|---|---|---|---|---|
| 1 | 166 | 22 | 4290.49 | 680.47 | 4.10 | ||
| 8.30 | 7.22 | ||||||
| 2 | 23 | 21 | 4952.43 | 782.76 | 34.03 | ||
| 1.05 | 3.83 | ||||||
| 3 | 6 | 8 | 1183.88 | 214.21 | 35.7 | ||
| 1.19 | 2.00 | ||||||
| 4 | 3 | 6 | 832.1 | 127.39 | 42.46 | ||
| 11.41 | 3 | ||||||
| 5 | 1 | 8 | 2712.76 | 484.66 | 484.66 | ||
| 199 | 65 | 13,971.7 | 2289.50 | 5.50 | 7.60 |
| Morphometric Parameter | Results |
|---|---|
| Drainage network | |
| Stream order | 5.00 |
| Stream length in km | 243.80 |
| Stream length | - |
| Number of streams | - |
| Stream axial length in km | 184.90 |
| Drainage density km/km2 | 1.59 |
| Length of overland flow in km | 0.31 |
| Constant of channel maintenance in km/km2 | 0.63 |
| Stream frequency in channels/km2 | 1.82 |
| Average stream length in km | - |
| Sinuosity | 1.32 |
| Bifurcation ratio | - |
| Mean bifurcation ratio | 2.88 |
| Stream length ratio | - |
| Morphometric Parameter | Results |
|---|---|
| Basin geometry | |
| Basin area in km2 | 13,971.70 |
| Basin perimeter in km | 1025.90 |
| Basin length in km | 252.40 |
| Form factor | 0.22 |
| Circularity ratio | 0.17 |
| Elongation ratio | 0.53 |
| Compactness coefficient | 2.43 |
| Morphometric Parameter | Results |
|---|---|
| Basin relief | |
| Minimum basin height in masl | 3493 |
| Maximum basin height in masl | 0.00 |
| Mean basin slope in percentage | 5.50 |
| Basin relief | 3493 |
| Relief ratio | 13.83 |
Publisher’s Note: MDPI stays neutral with regard to jurisdictional claims in published maps and institutional affiliations. |
© 2022 by the authors. Licensee MDPI, Basel, Switzerland. This article is an open access article distributed under the terms and conditions of the Creative Commons Attribution (CC BY) license (https://creativecommons.org/licenses/by/4.0/).
Share and Cite
López-Ramos, A.; Medrano-Barboza, J.P.; Martínez-Acosta, L.; Acuña, G.J.; Remolina López, J.F.; López-Lambraño, A.A. Assessment of Morphometric Parameters as the Basis for Hydrological Inferences in Water Resource Management: A Case Study from the Sinú River Basin in Colombia. ISPRS Int. J. Geo-Inf. 2022, 11, 459. https://doi.org/10.3390/ijgi11090459
López-Ramos A, Medrano-Barboza JP, Martínez-Acosta L, Acuña GJ, Remolina López JF, López-Lambraño AA. Assessment of Morphometric Parameters as the Basis for Hydrological Inferences in Water Resource Management: A Case Study from the Sinú River Basin in Colombia. ISPRS International Journal of Geo-Information. 2022; 11(9):459. https://doi.org/10.3390/ijgi11090459
Chicago/Turabian StyleLópez-Ramos, Alvaro, Juan Pablo Medrano-Barboza, Luisa Martínez-Acosta, Guillermo J. Acuña, John Freddy Remolina López, and Alvaro Alberto López-Lambraño. 2022. "Assessment of Morphometric Parameters as the Basis for Hydrological Inferences in Water Resource Management: A Case Study from the Sinú River Basin in Colombia" ISPRS International Journal of Geo-Information 11, no. 9: 459. https://doi.org/10.3390/ijgi11090459
APA StyleLópez-Ramos, A., Medrano-Barboza, J. P., Martínez-Acosta, L., Acuña, G. J., Remolina López, J. F., & López-Lambraño, A. A. (2022). Assessment of Morphometric Parameters as the Basis for Hydrological Inferences in Water Resource Management: A Case Study from the Sinú River Basin in Colombia. ISPRS International Journal of Geo-Information, 11(9), 459. https://doi.org/10.3390/ijgi11090459