1. Introduction
The infrastructure of the spatial data or geospatial data infrastructure (termed SDI) is an effort that aims to create a framework in which all stakeholders can collaborate and communicate on data sharing leveraging technology to achieve their urbanisation, political and administrative objectives. SDI typically comprises the fundamental elements of dataset, policy, development, access network, and individuals [
1]. Geospatial sharing is the electronic and digital data transfer procedure involving the data generator and data consumer [
2,
3]. A data generator creates data based on a pattern rather than reading data from a file, database, or any other data source [
3].
Even though SDI implementations at different eras and locations have typically similar functionality, SDI also encounters similar conditions and impediments to interaction and information sharing. Technical restrictions relating to the implementation of national standards, data interoperability, metadata, and non-technical constraints (social component) relating to political will and the incentive of data holders to share data provide the greatest obstacles to data sharing [
4]. Erik De Man, (2008) analyses the actor–network theory that is used to comprehend the infrastructural interactions between technical and non-technical networked actor SDI actors [
5]. Relevant actors inside the perspective of national and local SDI are the central government and regional government of a country.
This research aims to determine factors that influence spatial data sharing practices and quantify the contribution levels of human resources, organisational aspects, technology, and spatial data to data sharing practices at the local SDI in Malaysia. The study includes 15 participants who were interviewed in-depth to obtain their responses and a sample of 83 respondents to study from the government sector Plan Malaysia and Telekom Malaysia Berhad TMOne. Using a more objective methodology, the determining variables and contribution level of each of these components can be analysed and enhanced.
The structure of our study is as follows:
Section 2 is the background of the study; the methodology is given in
Section 3;
Section 4 contains the result and discussion; and in
Section 5, there is a conclusion.
2. Background of Study
Several documents have examined the sharing of spatial data and discussed the effects of legal systems and organisations on data sharing and the power distribution and data control between organisations, while other individuals discussed the different ways that sharing occurs in formal and informal legal systems [
6].
Various and complex aspects of local governments have been considered in the assessment of their effects on SDI, including organisations, politics, power, systems, standards, funding, individual characteristics and communications. According to some documents, the latest generation of SDI is geared towards fulfilling the real needs of local governments, with the actual activities of local governments having a major influence on data sharing [
7]. In developing an SDI that should meet the requirements of all stakeholders working with spatial information, the principles defined in the geospatial information can serve as a model for other countries [
8].
JawatanKuasa Pemetaan dan Data Spatial Negara (JPDSN), formerly known as the National Mapping & Spatial Data Committee [
9] and Malaysia Geospatial Data Infrastructure (MyGDI) [
10], is a national programme started by the government to provide and facilitate the geospatial information sharing infrastructure, to spread awareness on the accessibility of geospatial data and to increase accessibility to geospatial information between many relevant stakeholders. The official cartography agency of Malaysia is the agency of spatial planning (Jabatan Ukur dan Pemetaan Malaysia (JUPEM)). Its Kuala Lumpur headquarters coordinate all allowed cadastral, geodetic, topographic map, and topographical photogrammetry activities throughout Malaysia. Within JUPEM, the National Mapping Directorate is in charge of geographical mapping (Direktorat Pemetaan Negara) [
11].
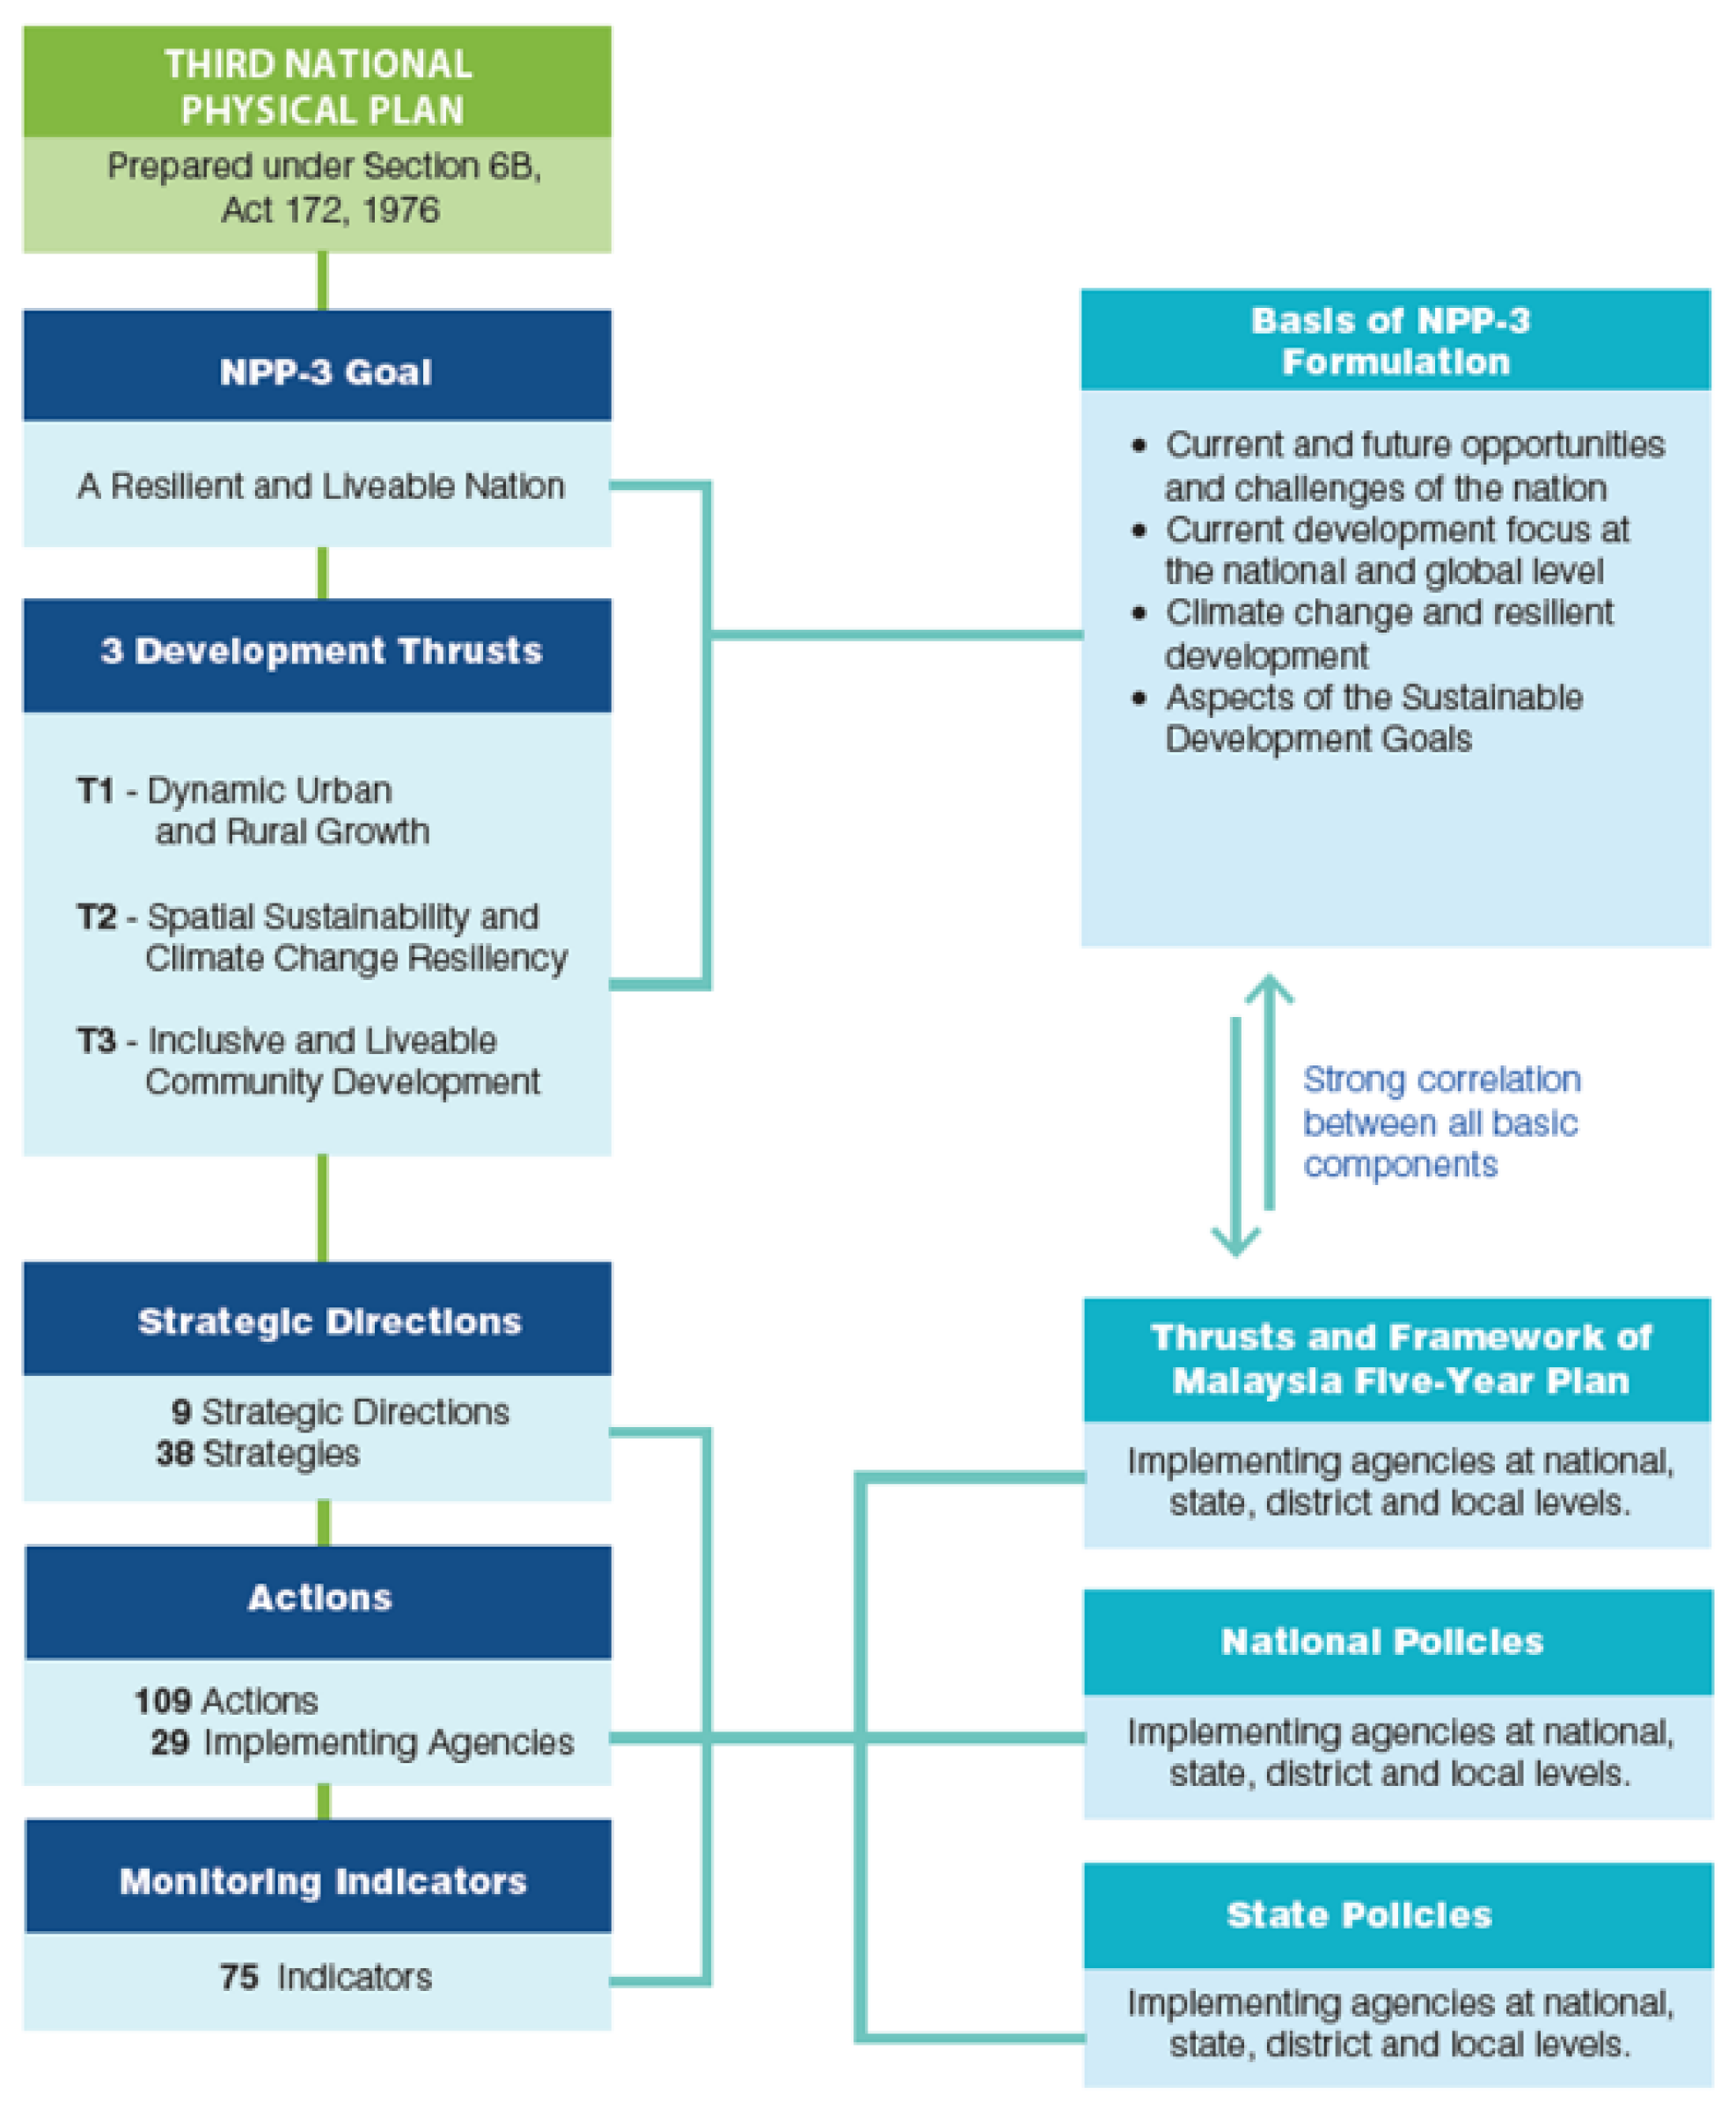
The National Physical Plan (NPP) measures and policies are developed by the government organisation of the Department of Town and Country under Section 6B of Act 172. The first NPP was proposed by the government in 2005 and spans the period from 2006 to 2020. It outlines the basic purpose and broad structure of Peninsular Malaysia’s land use and physical development. The modified NPP (NPP-2) was authorised in August 2010 to create a suitable, equitable, and long-term national spatial framework to guide the country’s overall development towards industrialisation and high-income status by 2020 [
12]. In addition, the main objective formulation is geared towards coming up with solutions for perception issues relating to climate change, sustainable urban framework, biodiversity, nutrition security, and environmental sustainability, and to support the National Key Economic Areas by having to overcome all difficulties, such as reducing crime, education, and limited households, while trying to emphasise inclusive development through the physical relationship between urban and rural areas [
13]. The NPP-3 is designed to achieve the nation’s objective of being robust and habitable. This lengthy aim has accounted for national adaptability concerns, including population growth and immigration, income disparity, environmental degradation, the depletion of natural resources, and air degradation [
14]. These difficulties are expected to persist for an extended time.
Considering this, MyGDI is an initiative by the government to develop an SDI to enhance awareness about data availability and improve access to geospatial information by facilitating data sharing among participating agencies [
15]. The Department of Federal Town and Country Planning (JPBD) identified several functions for the land use information unit, such as implementing GIS auditing to support and maintain continuous development of the SDI [
15], and preparing and coordinating the National Physical Plan (NPP) [
16]. Governance must be effective, thorough, and inclusive for the NPP-3 to be implemented. The participation and cooperation of all governmental and non-governmental governance levels shall facilitate the implementation of an integrated approach following the national objectives. The NPP-3 emphasises three governance strategies: strategic governing, organisational governance and operations support governance.
Figure 1, shows the framework of the 3rd National Physical Plan structure [
14]. On 22 October, the National Physical Planning Council approved the NPP-4, in alignment with the 12th Malaysia Plan (12MP), which consists of three core development thrusts, 11 strategic directions, and 39 implementation actions. The document was approved at the 39th meeting of the National Physical Planning Council [
17].
Multiple ministries and agencies handling the same subject data have resulted in the inefficient usage and administration of national funds at different levels of ministries, institutes, provinces, districts, and cities to facilitate information management. To avoid redundant managers with this data, the government establishes the policies, and programmes are then translated into the State Structure Plan; these plans outline the state’s land development and utilisation policies [
13]. Data sharing may be a possible option for the performance of this activity to acquire the necessary data. With sharing data, information management efforts to achieve effective governance become more efficient, effective, and professional.
The government of Malaysia is among the early investors of SDI, having created the spatial data infrastructure from the national to the local level [
18]. The Malaysian Centre for Geospatial Data Infrastructure (MaCGDI) is recognised as the head of the Malaysian National SDI in terms of geospatial data. Since 1994/1995, NSDI Malaysia has undertaken the endeavour to build a national land information system. Since 1994, it has been recognised as the turning point in Malaysia’s national SDI awakening, indicating tremendous growth. The MaCGDI (Malaysian Centre for Geospatial Data Infrastructure) was established in 2002 to facilitate the coordination of SDI growth and upgrading.
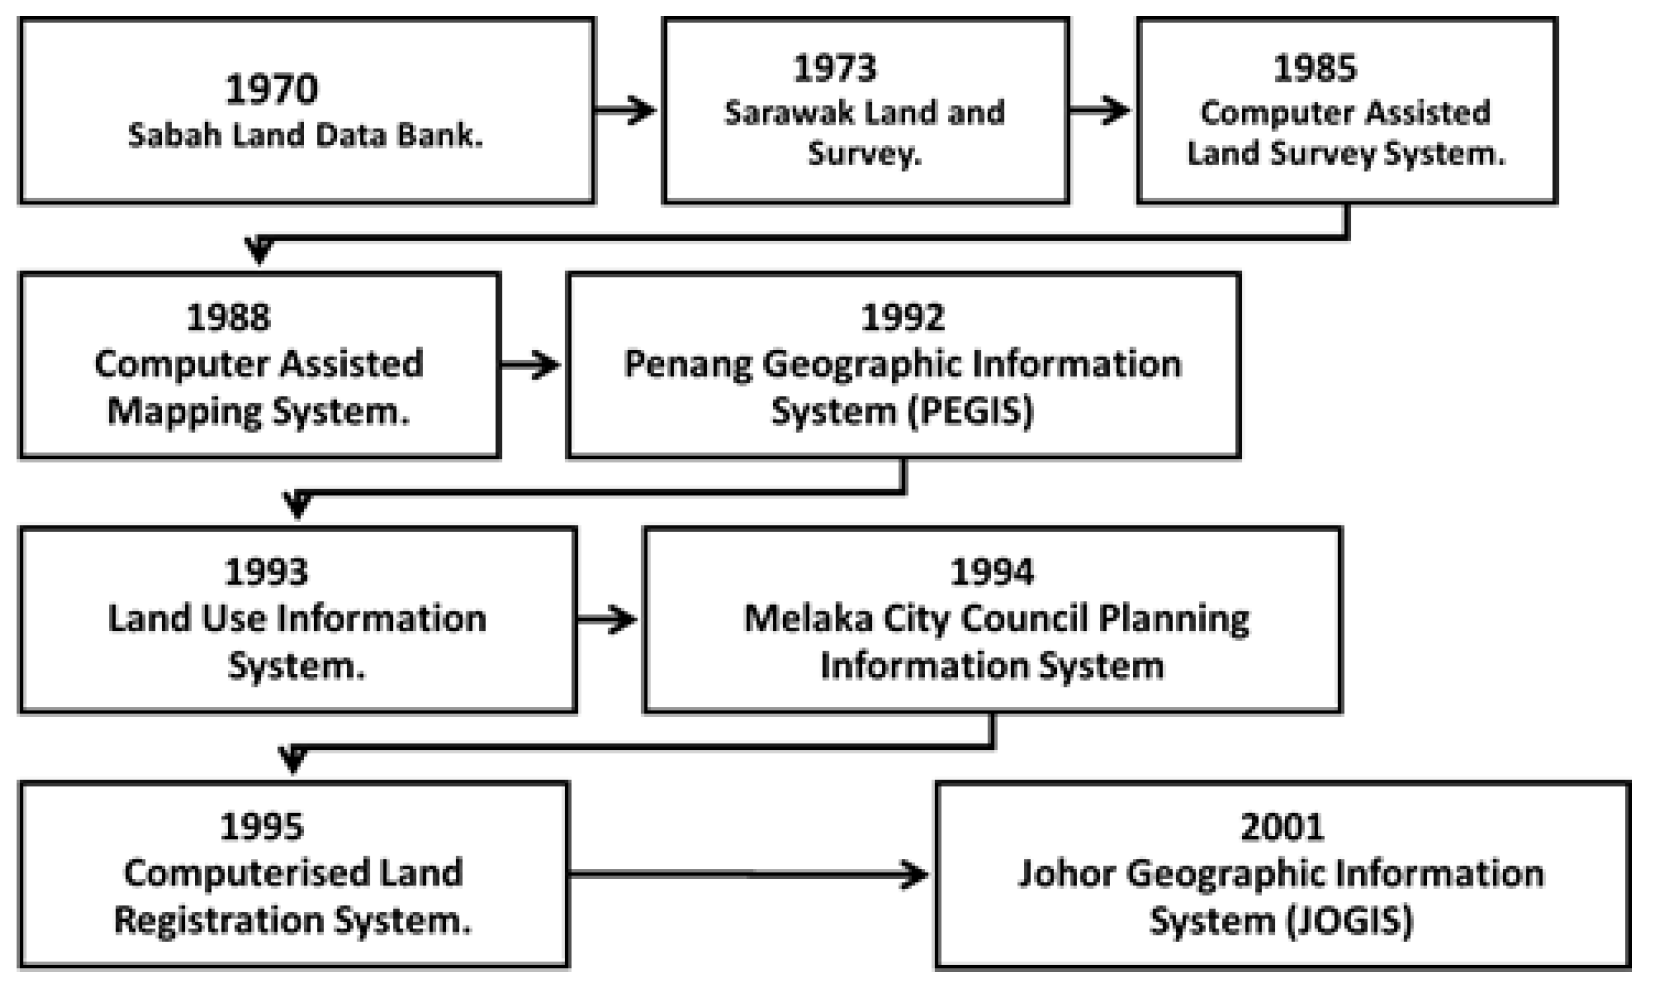
Since the early 1970s, Malaysia has grasped the need for geospatial information to aid in the development and planning of land resources. In the mid-1980s, the Department of Survey and Mapping (DSMM) project to construct the digital cadastral database (DCDB) and national topographic database laid the foundation for the creation of a geographic information system (GIS) in the country.
The evolution of various digitised systems in Malaysia before the 21st century is depicted in
Figure 2: computer environments, technologies, independent and integrated, including distributed systems that incorporated spatial data and a moderate amount of GIS data.
MyGDI is a government initiative to establish an SDI to increase data availability awareness and enhance access to geospatial information by simplifying data sharing across participating organisations. MyGDI, as the national spatial data infrastructure (NSDI) for Malaysia, is a geospatial data infrastructure consisting of technologies, regulations, standards, and processes for land-related institutions to generate and share geospatial information collaboratively
Figure 3.
In the current era of information technology, the information society requires governance that embraces openness and provides the widest possible access to information to meet public requirements. The government has constructed a geo-portal as a medium for the engagement, integration, and exchange of spatial data managed and controlled by NSDI to facilitate access to this information. In terms of the history of NSDI, Malaysia started the initiative to establish a national land information system in 1994/1995.
With the Development Administration Circular No. 1 of 1997, the SDI approach was conceived in 1997 under the National Infrastructure for Land Information System/NaLIS cover. As the demand increased, the Malaysian Centre for Geospatial Data Infrastructure (MaCGDI) was established in 2002 to strengthen the coordination of SDI modernisation and development.
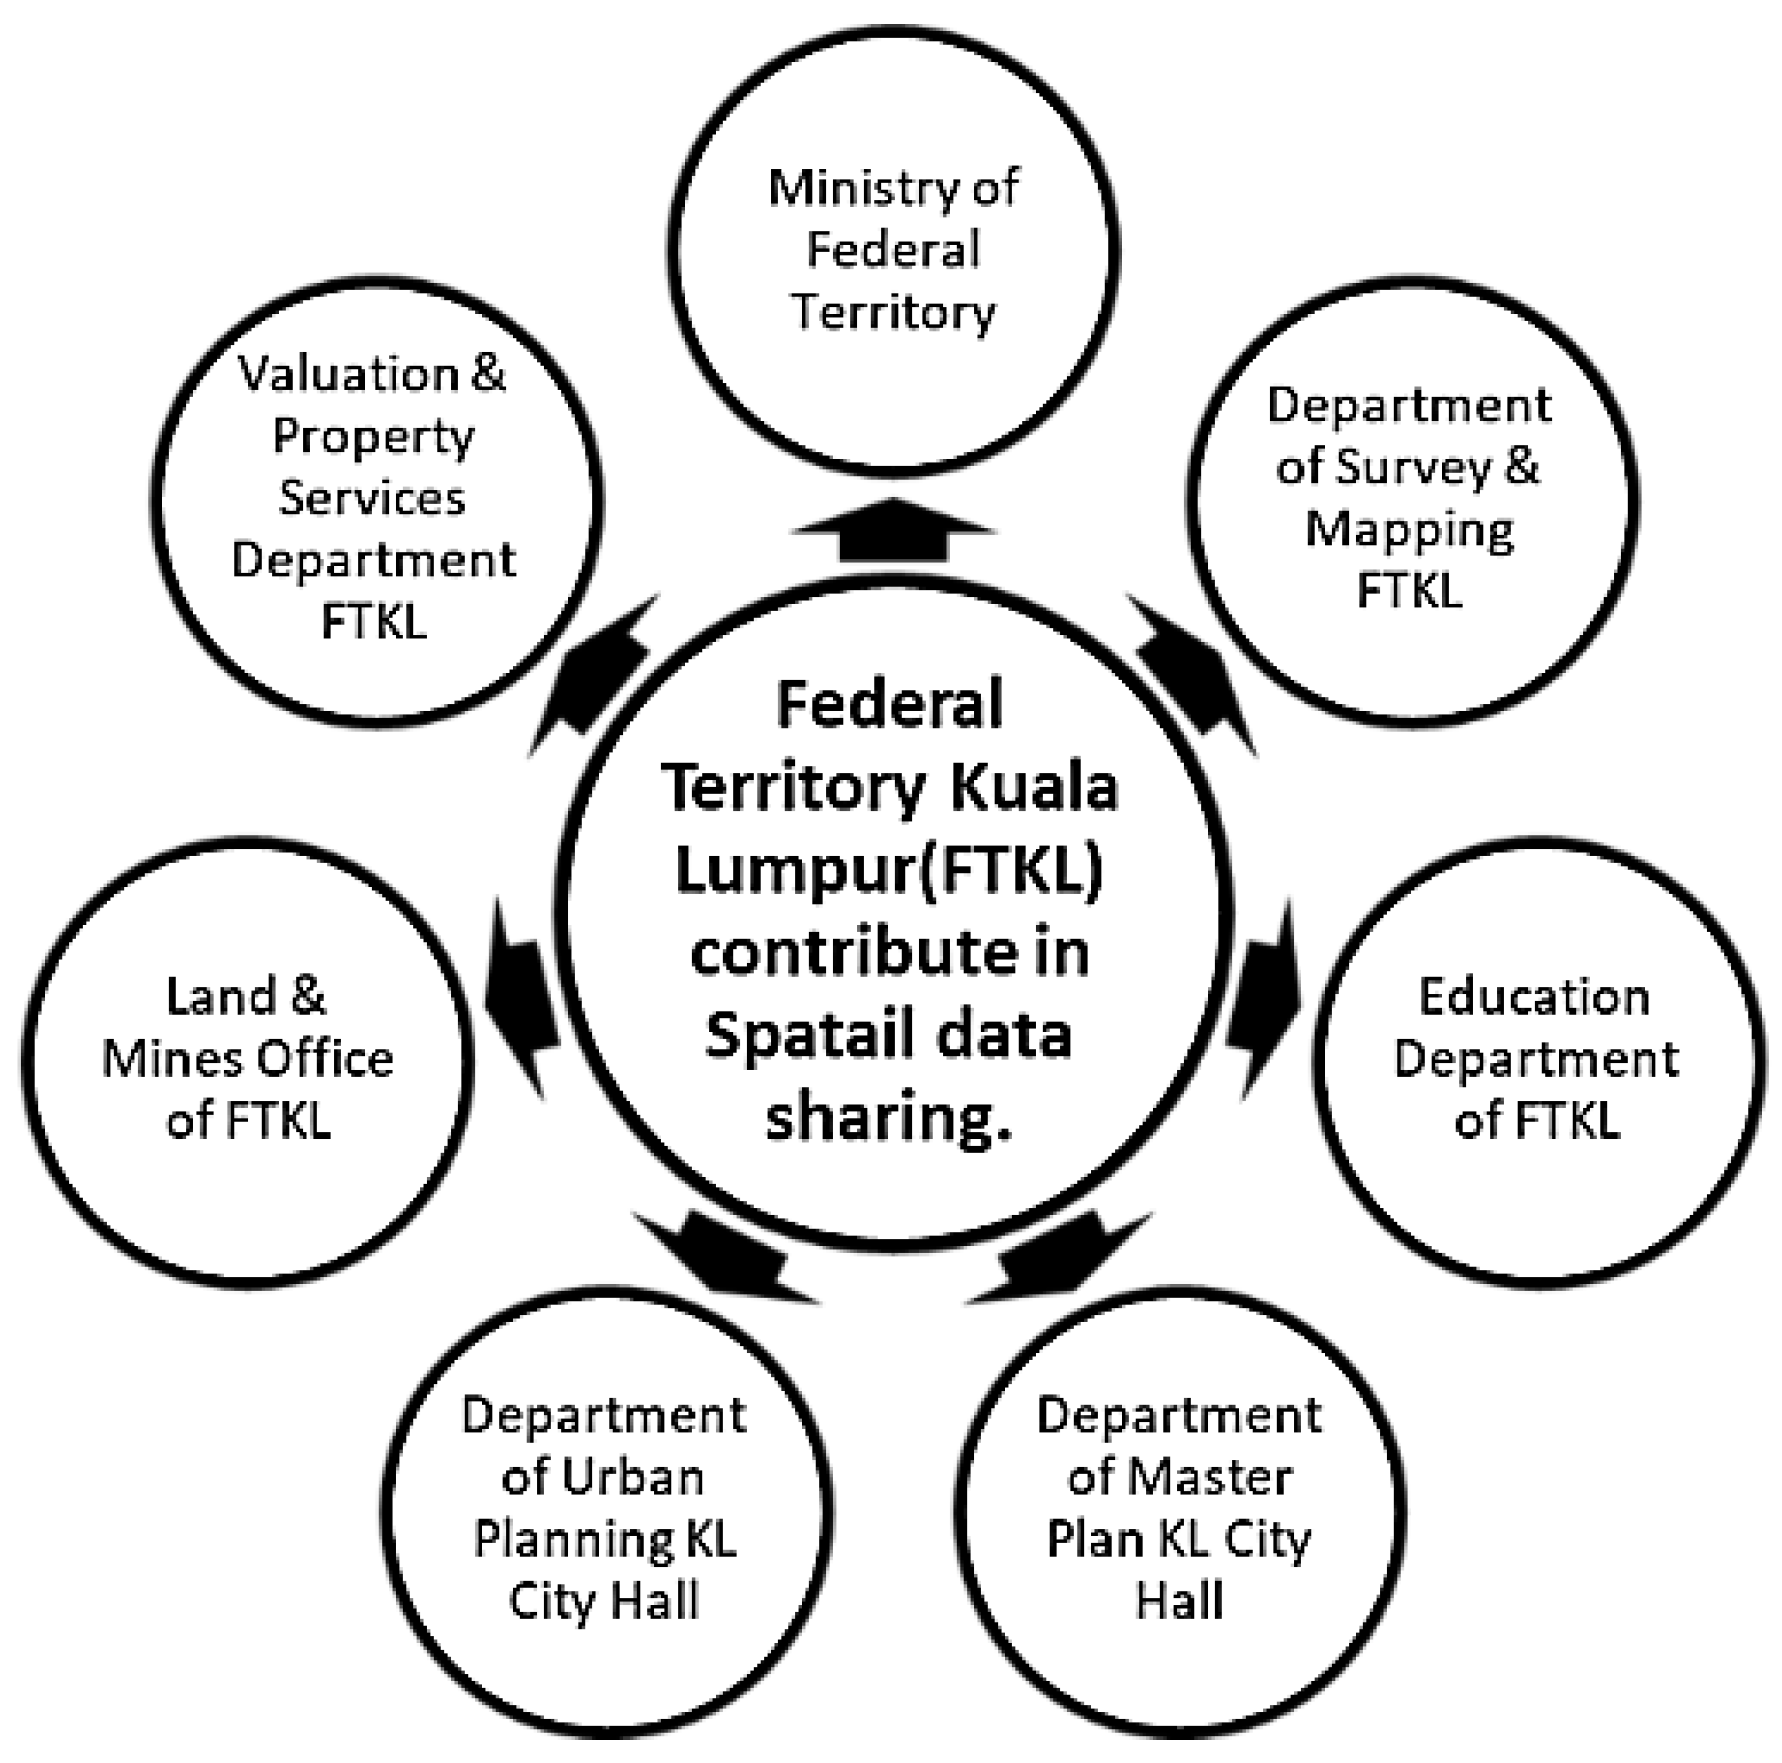
Kuala Lumpur, officially the Federal Territory of Kuala Lumpur and colloquially referred to as KL, is a federal territory and the capital city of Malaysia. Seven various government agencies contributed to the spatial data sharing and infrastructure implementation [
15] in Federal Territory Kuala Lumpur (FTKL), as shown in
Figure 4.
The local government has the authority to promote local SDI as a national programme, to enhance and expand the local government’s share of the national acceleration of access to spatial information. The local SDI can promote the sharing of data at the local and state level as well as at the state level for the provision of excellent government services. A variety of environmental and urbanisation challenges, including spatial planning, forest fires, land use and territorial boundaries, will be more easily controlled if accurate and up-to-date spatial data are readily available.
The employment of correct and current spatial data is also concerned with the management of spatial results to solve prospective border area conflicts. This was demonstrated by Rosni et al. and Tarmidi et al. (2016) [
19,
20]. In addition to border regions, reliable and current huge geographical data are necessary for spatial and population data. The significance of these spatial data is also reflected in the urban village, subdistrict, district, and city ratings at the provincial and national levels.
In reality, spatial data exist across numerous agencies, work units, and institutions. Due to the dispersion of this spatial data, data sharing between agencies is required to combine data in a single data centre that is easily accessible to data users. It is anticipated that custodian data would yield accessible and shared information. Information on custodians identifies the departments responsible for storing and protecting computerised information. It is necessary to configure the data management settings to prevent the duplicate handling of some spatial data by some custodial data. With one data custodian handling one spatial data, spatial data management and use for decision making would be more effective and efficient.
A recent evaluation of local government preparation for data sharing reveals difficulties; see
Table 1. Based on these difficulties, this research will concentrate on the organisational, technical, human resource, and spatial data aspects concerning the spatial data sharing practice in Malaysia’s local SDI.
3. Methodology
Various government agencies that contributed to the SDI implementation in Malaysia are the Federal Government with 14 agencies, Federal Territory Kuala Lumpur (FTKL) with 7 agencies, Perak State with 18 agencies, Selangor State with 14 agencies, Kedah State with 15 agencies, Federal Territory Labuan (FTL) with 6 agencies, Kelantan State with 15 agencies, Selangor State with 14 agencies, Pahang State with 14 agencies, Johore State with 13 agencies, Pahang State with 14 agencies, Malacca State with 7 agencies, Perlis State with 4 agencies, Sabah State with 15 agencies, Trengganu State with 10 agencies, and NS State with 10 agencies [
15]. Considering COVID-19, we follow the method of research methodology implemented through two steps: qualitative research and then quantitative research [
27]. In the region of Kuala Lumpur, seven spatial data sharing contributors were chosen as a case study and survey research sites; 15 respondents participated in an in-depth interview for qualitative analysis, while 83 participated in a questionnaire poll for quantitative analysis [
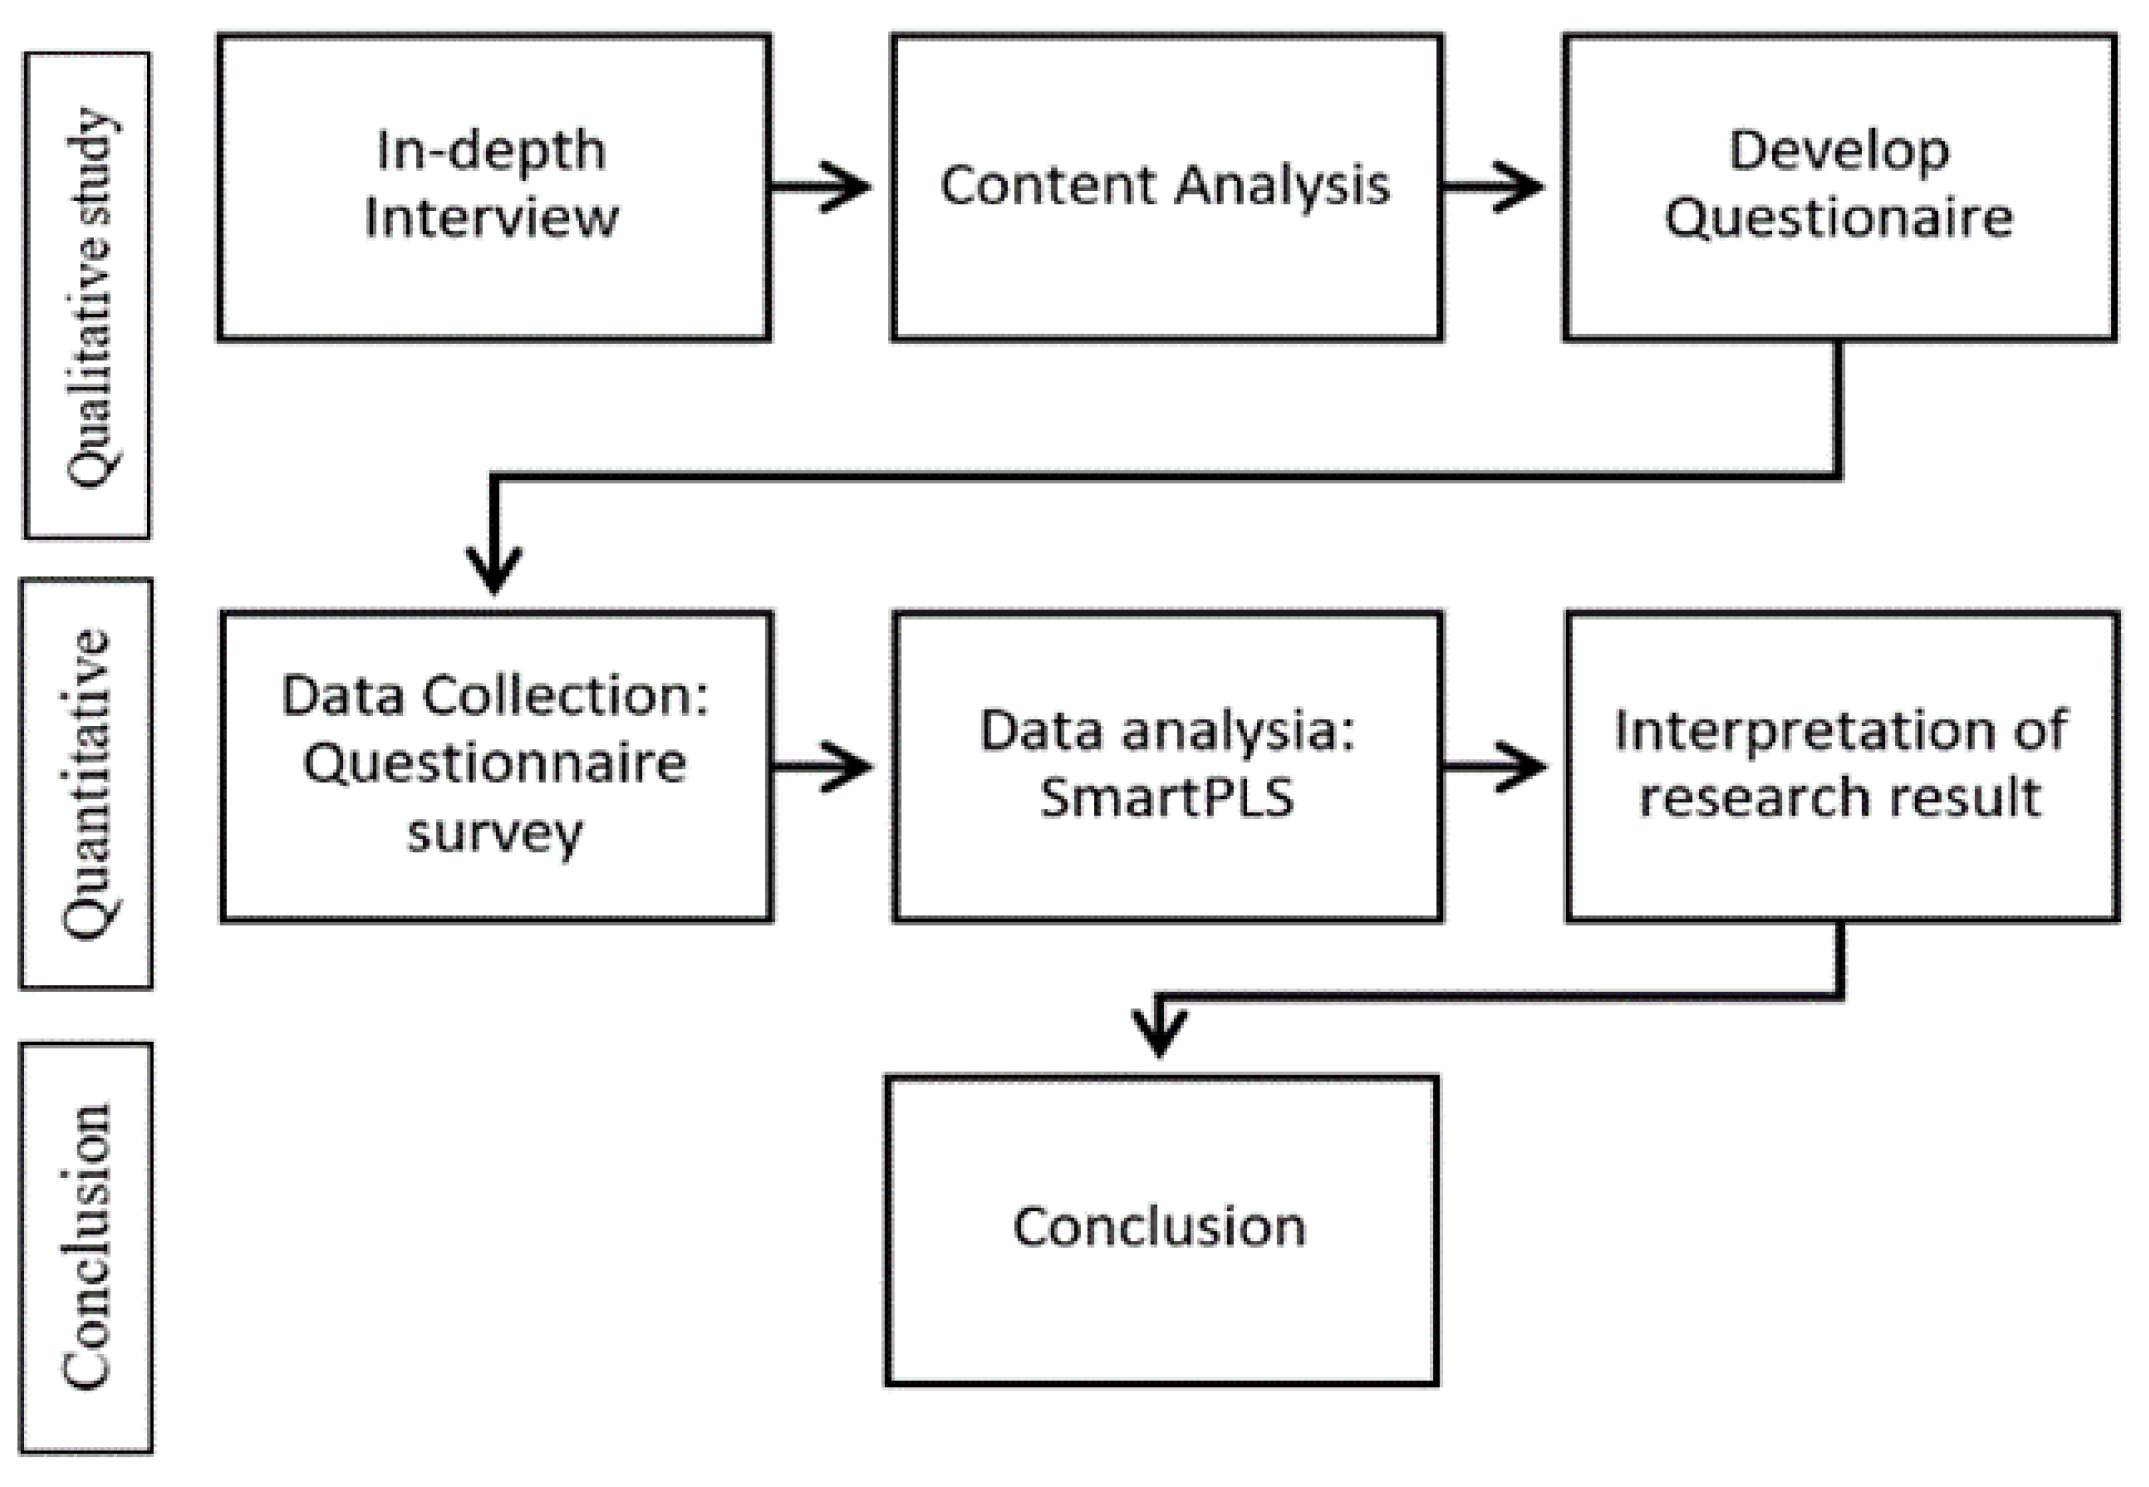
28]. They are comprised of government employees who serve as staff or departmental leaders. Using the method of purposive sampling, respondents who met the specified criteria were picked. A sequential exploratory design was employed to organise this study’s methodology. This study method is outlined in
Figure 5.
Figure 5 research process is comprised of two phases: a qualitative study in the first stage, see
Table 2, and a quantitative investigation in the second. The output of the first phase was used to design a questionnaire for the second stage of the study, while the output of the quantitative study was used to quantify the correlation between variables and prove the study’s hypothesis. The survey was developed using a 5-point Likert scale: strongly disagree “1”, disagree “2”, neither agree nor disagree “3”, agree “4”, and strongly agree “5” [
28]. It was used to determine respondents’ opinions and perspectives. Utilising content analysis, the qualitative information was investigated. This technique was used to retrieve all items, indications, and themes from qualitative information [
29]. Using the SmartPLS structural model analysis, essentially integrating factor analysis and regression analysis to determine the variables’ components and amount of correlation, the data collected were studied. The correlation coefficient was used to measure the degree of correlation [
30]. The correlation value for the ‘r’ coefficient is shown in
Table 3.
3.1. Hypothesis Developing
Using the organisation theory and the concept of spatial data sharing, this study’s relationship model is based on theoretical and conceptual approaches. In this study, these interactions are measured based on a hypothesis that is developed. The following hypotheses are held:
H1. The relationship between the human resource factor and spatial data sharing practice is good and strong.
H2. Organisational factor has a significant and positive association with spatial data exchange practice.
H3. Human capital aspect has a good and strong association with the organisation aspect.
H4. Organisations are significantly correlated with spatial data.
H5. The technology aspect has a good and strong link with the organisation aspect.
H6. Positive and strong link exists between spatial data aspect and spatial data sharing practice.
H7. Technology has a significant and positive association with spatial data sharing practice.
In this study, a questionnaire was used to collect data, while SmartPLS software was utilised for data analysis.
Table 4 describes several data collecting and analysis techniques.
3.2. Factors Determination
Based on the content analysis method of the interview data, it was determined that 18 determinant factors affecting 5 elements influenced the data sharing practice in Kuala Lumpur municipal regencies. These aspects are technology (3 factors); organisation (4 factors); human resources (3 factors); spatial data (3 factors); and spatial data sharing practices (5 factors). These factors are described in the following
Table 5.
Table 5, demonstrates the determinants of several variables based on interview findings. This study focuses on five areas of the SDI idea and organisational theory: organisational aspect, human resource aspect, spatial data aspect, and spatial data sharing. The highest number of respondents who were interviewed identified software and hardware, ITC, and geospatial technical assistance as influencing data sharing from a technological perspective, while organisational policy, organisation strategy, coordination intensity, and financial support influence data sharing were identified from an organisational perspective.
Table 4 demonstrates the impact of people number, personnel knowledge and skill, and personnel motivation on the human resource elements of data sharing, whereas spatial data applications of standard, currentness, and quality management have an impact on data sharing. In this study, the factors affecting data sharing are mutual trust, data searching and collection (metadata), the cost of data sharing, collaboration, and data protection.
4. Result and Discussion
In this study, several analytical outputs were identified. The first result was an outcome of a partial least-squares analysis, containing; convergent validity, discriminant validity, average variance extracted (AVE) R-Square, Cronbach alpha, and composite reliability. The last result was a hypothesis testing analysis of the content analysis outcome (H1, H2, H3, H4, H5, H6, and H7).
4.1. Partial Least Square Analysis Result
For the goal of assessing the interaction between organisations and spatial data sharing, both directly and indirectly via the technology, human resource, and spatial data aspects, a structure model of the relationship between each component was established. We used partial least square analysis to assess the modelling and relationship of the indicator with its variable to determine the most pertinent indicator and the optimal relationship in the projected structure modelling. Before evaluating the effect of an element on data sharing in this modelling, some conditions must be met for this study. Convergent validity and discriminant validity, average variance extracted (AVE), composite reliability, R-Square, and Cronbach alpha are these parameters.
4.1.1. Convergent Validity and Discriminant Validity
Several variables fail to meet convergent validity if their factor loading value is less than 0.60, as determined by the analysis of the measurement model [
31]. Based on this investigation, the unsuitable model elements were eliminated. The model is convergently valid when all factor loadings are greater than 0.60. This loading factor’s value indicates the strength of the association between the indicator or factors and their latent variable or facet in the current investigation. The outcome is shown in
Table 6.
The discriminant validity is measured by ensuring that each indicator of each latent variable is distinct from all other variables. If each indicator loading value has the biggest factor loading value to its latent variable when compared to other latent variables, the model has good discriminant validity. If each indicator loading value has the biggest factor loading value to its latent variable when compared to other latent variables, the model has good discriminant validity. If the required loading value is not met, it might be omitted from the structural model. This study’s discriminant validity was established, as the value of each factor’s latent variable was greater than other latent variables in the modelling (see
Table 7).
4.1.2. Average Variance Extracted (AVE)
This study used the average variance extracted (AVE), composite reliability, and Cronbach alpha value to measure the dependability of the components. If the AVE value is greater than 0.5, the composite reliability must be greater than 0.7, and the Cronbach alpha value must be greater than 0.6 [
30,
31].
Table 8, displays that all AVE values are between 0.59 and 0.76, the composite reliability is between 0.87 and 0.95, and the Cronbach alpha value is between 0.83 and 0.94, indicating that the dependability requirement for this study has been reached.
4.1.3. R-Square, Cronbach Alpha, and Composite Reliability
R-square can be used to anticipate the extent to which the independent variable (X) influences the dependent variable (Y). In this instance, R-square is utilised to evaluate the impact of independent variables on the dependent variable, based on the modelling performed in this study. This study was conducted to determine that the R-Square value of spatial data sharing practice was 47.8%, indicating that the influence of organisational aspect, technology, spatial data, and human resources per cent, as shown in
Table 9, whereas the influence of organisational aspect to the human resource aspect, spatial aspects of data and technology were equal to 57.2%, 60.2% and 57.0, respectively.
Table 10, demonstrates the relationship between the structural model aspect and the outcome of the partial least squares analysis.
The human resource aspect and spatial data aspect are related to the spatial data sharing practice to the extent of 0.451 and 0.544, respectively, as shown in
Table 10. This indicates that these qualities are moderate and substantial. While the organisation and technology components have a substantial association with the spatial data sharing practice, their correlation coefficients are 0.630 and 0.614, respectively. Therefore, it can be stated that to enhance the management of SDI and promote the efficacy of data sharing, it is required to strengthen the human resource and spatial data elements in the area of this study. In terms of organisational and technological assistance, it is adequate and can support the implementation of local SDI administration and data exchange.
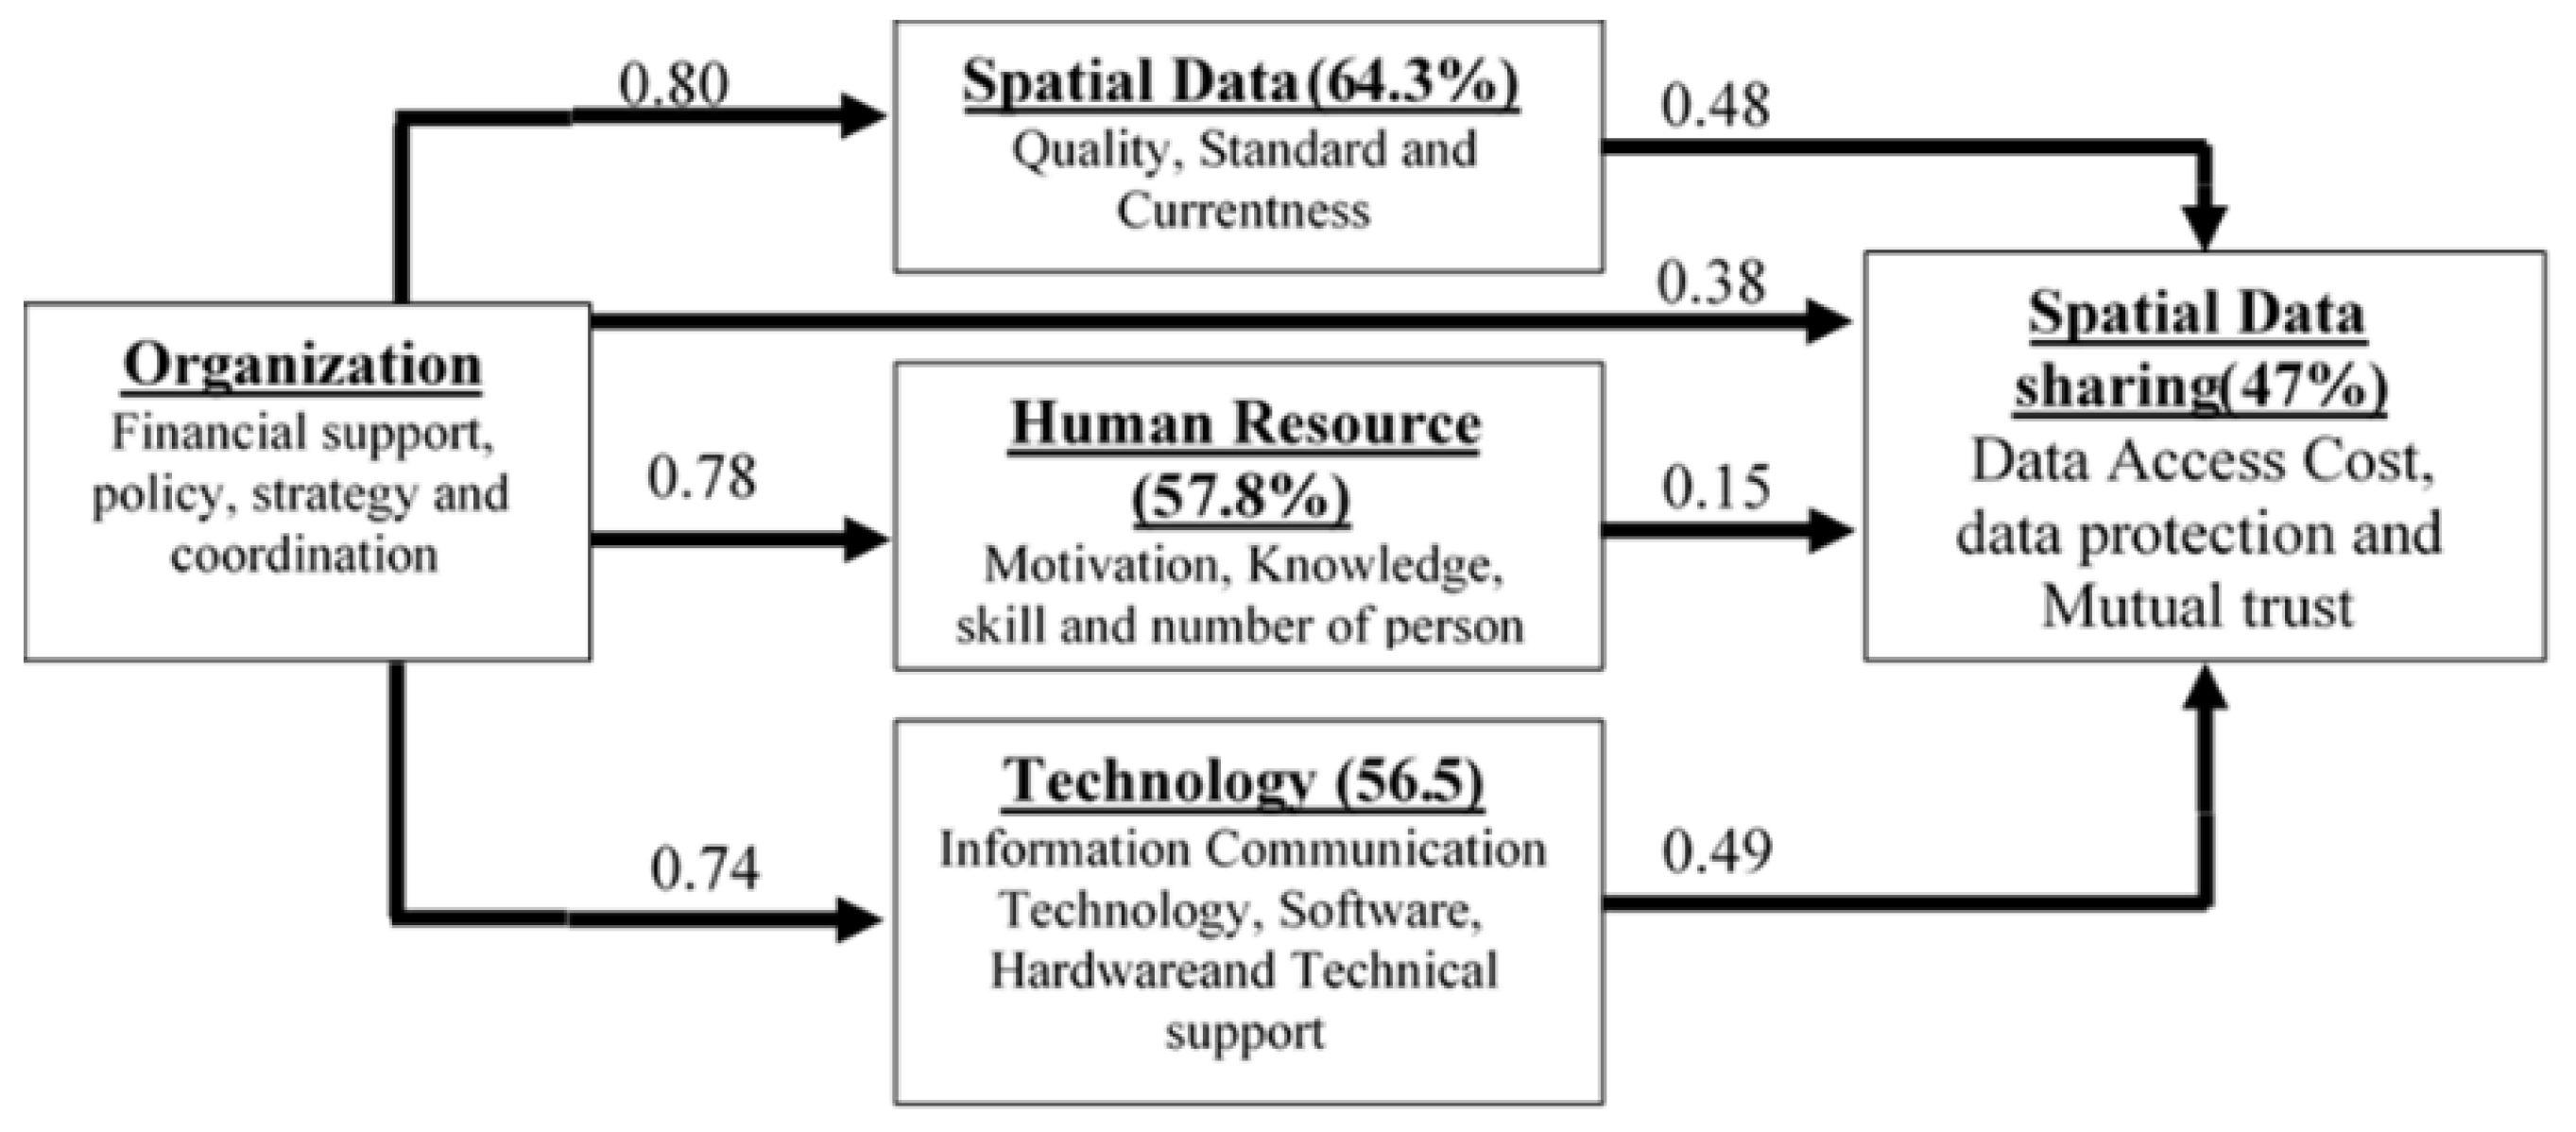
Figure 6, depicts the relationship between the determining elements of each aspect and the direct or indirect relationship of each aspect to the other. In terms of organisational and technological assistance, it is adequate and can support the implementation of local SDI administration and data exchange. This same coefficient correlation of each variable of the study ranges from 0.7248 to 0.8798 for the organisation aspect, from 0.8518 to 0.8706 for the human resource aspect, from 0.7289 to 0.8144 for the spatial data aspect, from 0.8518 to 0.8706 for the technology aspect, as well as from 0.7288 to 0.8589 for the spatial data sharing aspect. Therefore, it can be concluded that each factor has a strong relationship with the aspect that it reflects.
Figure 6, additionally illustrates the direct and indirect relationship between each aspect and the level of correlation between each aspect and the spatial data sharing technique.
4.2. Hypothesis Testing Result
In this study, the bootstrapping result of the partial least square analysis is employed to examine the hypothesis statement. This analysis compares the T statistics generated with the T-table value. If the
t-test is greater than the T-table (1.96), the hypothesis formulation is accepted; if the
t-test is less than the T-table, the hypothesis formulation is rejected. The results of bootstrapping are given in
Table 11.
This investigation determined, based on
Table 11, that two relationships were discarded because the T-statistic was smaller than the T-table. The human resource aspect and data sharing practice were correlated, as were the spatial data aspect and data sharing practice. The analysis of the seven hypotheses is as follows:
H1. The relationship between the human resource factor and spatial data sharing practice is good and strong.
According to
Table 11, there is a correlation between human resources and spatial data sharing practices. The value of the path coefficient is −0.15, while the value of T statistic is 1.636. This T-statistic is smaller than the T-table (1.96). This indicates that human resources have a negative moderate connection with the data sharing practice but with no significant effect, and hence the first hypothesis is rejected. This indicates that human resources variables have not contributed significantly to data sharing practices. Therefore, improvements must be made to human resource factors. This relates to personnel count, skill capacity, personnel understanding, and personnel incentive.
H2. Organisational factor has a significant and positive association with spatial data exchange practice.
According to
Table 11, the relationship between organisation and data sharing practice is as follows. The value of the path coefficient is 0.6291, and the T statistic value is 5.1246. These data from the table exceed the scope of a T-table (1.96). This indicates that organisation has a significant positive association and impact on data sharing practice, and hence the hypothesis (H2) is supported.
H3. Human capital aspect has a good and strong association with the organisation aspect.
Referring to
Table 11, the relationship between organisation and human resource is organisation to human resource. The value of the path coefficient is 0.7804 and the value of T statistic is 14.0147. This T-statistic exceeds the T-table (1.96). This indicates that organisation has a very strong positive connection with human resources and a significant influence, and hence hypothesis (H3) is accepted.
H4. Organisations are significantly correlated with spatial data sharing.
Referring to
Table 11, the relationship between spatial data and organisational data, the value of the path coefficient is 0.7901, and the T-statistics value is 20.2098. This T-statistic exceeds the T-table (1.96). This indicates that organisation has a very high positive correlation and considerable effect on geographical data, hence confirming the null hypothesis (H4).
H5. The technology aspect has a good and strong link with the organisation aspect.
According to
Table 11, there is a connection between organisation and technology. The value of the path coefficient is 0.7524, and the T statistic value is 15.701. This T-statistic exceeds the T-table (1.96). Thus, the hypothesis (H5) is accepted, as organisation has a very strong positive correlation and considerable effect on technology.
H6. Positive and strong link exists between spatial data aspect and spatial data sharing practice.
According to
Table 11, spatial data and spatial data sharing practices are related. The value of the path coefficient is 0.1492, and the value of T statistic is 0.7394. This T-statistic is smaller than the T-table (1.96). This indicates that spatial data has a modest positive correlation and has no substantial effect on the data sharing behaviour, thus refuting the hypothesis (H6). It also indicates that geographic data management must be enhanced in terms of the implementation of national standards, data preparedness, data updating, and data management quality. According to this study, some of them have been operating, while others still require development.
H7. Technology has a significant and positive association with spatial data sharing practice.
According to
Table 11, there is a correlation between technology and data sharing practices. The value of the path coefficient is 0.4657, and the T statistics value is 1.9786. This t statistic dwarfs the T-table (1.96). This indicates that technology has a somewhat positive association and a substantial effect on data sharing practice, therefore confirming the hypothesis (H7).
4.3. Discussion
An effective data-sharing practice from a local SDI will improve national geographic data-sharing initiatives in Malaysia with the implementation of a single map policy. This study was undertaken to establish the most influential characteristics of spatial data-sharing procedures at local government agencies in Malaysia based on the factors that indicate such aspects. This study seeks to answer the question of why local governments are less receptive to the national programme of local spatial data infrastructure to facilitate data-sharing practice. Previous research has uncovered several challenges at the local level, including organisational, personal, technology, data, and standards concerns. This study has identified determining elements associated with the data-sharing practice and measured the amount of its influence on local data-sharing practices. Thus, it is possible to determine which areas must be enhanced to promote local data-sharing procedures.
Ten practitioners of local government workers and a leader participated in an in-depth interview-based qualitative study. In this research, 18 determining elements were extracted from 5 aspects. These variables are technology (3 variables), organisation (4 variables), human resources (3 variables), spatial data (3 variables), and data sharing practices (3 variables) (5 factors). To measure these findings, 34 questionnaire items were developed using them. The questionnaires were then utilised to determine the perceptions of 75 respondents who participated in a survey-based quantitative study. The purpose of this activity is to validate the qualitative study using a quantitative study and to improve the findings of this study.
The objective of quantitative research is to assign the appropriate fit items to the appropriate latent variable using partial least squares analysis, and then to assess the level of correlation between those variables in the structural model. This structural model was developed using organisational theory and the framework of the spatial data infrastructure. The hypotheses H1 to H7 were developed to assess the degree of correlation between the variables in the structural modelling. These hypotheses were also utilised to assess the importance of the association in question. The result illustrates the correlation between the variables.
Figure 6, depicts the conclusions of this study, including the R-square value and level of correlation between research aspects. In total, 57.8% of the human resource aspect may be described by the organisation aspect, whereas 56.5% of the technological aspect and 64.3% of the spatial data aspect can be explained by the organisation aspect. Nonetheless, only 47% of data-sharing practices can be defined by organisation, human resources, technology, and spatial data. This indicates that the measuring model between the variables was able to quantify the link based on the correlation between the organisation, technology, human resource and spatial data.
This demonstrates the efforts made by local governments to strengthen the spatial data infrastructure in terms of technology, human resources, and spatial data characteristics. Even though 47% of data-sharing practices suggest that local governments have access to resources, spatial data and human resource components continue to have minimal impact on the actual exchange of data. To increase the efficacy of human resources and spatial data in data-sharing practice, the federal government should promote acceleration via continual awareness campaigns and mentorship within the framework of the national spatial data infrastructure and local SDI projects. These awareness programmes are anticipated to have a substantial impact on the human resource and spatial data aspects.
5. Conclusions
Based on this study, one may comprehend the difficulties local governments have in implementing local SDI programmes to enable spatial data sharing. Kuala Lumpur is one of the regional governments responding to this national initiative for local SDI under the Malaysian concept of unified data development. The technique of data sharing reduces duplication in data management and also saves money, time, and resources. However, local governments continue to be less responsive to the issue of geographic data exchange.
The novelty of the research refers to elements that are new in the research, including new mixed methods and factors observation, which leads to spatial data sharing and analysis. This study identified the determining factors of spatial data sharing practices and measured the levels of participation of the organisation and technology, human resources and spatial data in data sharing, as well as the level of consideration of the organisation to human resources, technology, and spatial data at the local SDI in Kuala Lumpur, Malaysia. This study shows the significant effects of organisation on human resources, technology, spatial data, and data sharing practice. This indicates that the organisation’s participation in the development of the local SDI in terms of human resources, technology, data management, and data sharing has been largely satisfactory at the level of Kuala Lumpur’s capital city and regency.
However, this study also indicated that human resource data and spatial data have little effect on data sharing. Because human resource and spatial data do not support the effectiveness of data sharing, it can be argued that local governments continue to face limits in the area of geographic data due to differences in data quality, data standards, and data updates. This difficult-to-resolve problem is caused by a lack of communication and information in the form of guidance and help for local governments. Local governments are less sensitive to spatial data because of this. Due to insufficient staff contributions and spatial data, the data-sharing practice has not been successful. This shows that, while corporate policies and tactics have been successful in driving improvements in personnel, technology, and human sharing initiatives at the local level, there is still room for improvement. This study suggests awareness campaigns, workshops, and assistance funded by the central government to increase skills, knowledge, and understanding of standards and implementation for local SDI managers to solve the human resource and geographic data difficulties in local SDI.


