1. Introduction
Location-based social networks such as Weibo and Twitter play an important role in people’s lives. They allow people to keep track of their friends and increase the interaction between them. The popularity of this software has led to the generation of many records of POIs showing when and where people have visited certain locations. These POI data have great significance for human mobility studies [
1], urban functional area identification [
2], and urban planning [
3]. Combined with census data, these users’ check-in trajectories in relation to POIs can also be used to estimate disaggregated employment size [
4]. Furthermore, based on the historical tracking information, the software can also recommend the next possible POI for users to visit, prompting them to better understand their city and improve the user experience.
Most of the early POI recommendation methods used collaborative filtering techniques and matrix factorization techniques. The collaborative filtering [
5] technique is used to discover users’ interests from their historical behavior data and recommend POIs that might be of similar interest to users. Simultaneously, the POI recommendation based on the matrix factorization [
6] technique constructs a rating matrix based on the user’s existing check-in information and recommends a POI according to its rating; however, people’s behavioral trajectory is often linked to the spatio-temporal context and the POI order. For example, when working all day, people are more likely to choose a nearby restaurant for dinner rather than a gym a hundred miles away. In this case, next POI recommendations are more helpful when they take the spatio-temporal context information and the trajectory sequence relationship into consideration.
In recent years, most of the work on next POI recommendations has used deep learning to capture user preferences. Networks, such as DNN (deep neural networks) [
7], RNN (recurrent neural networks) [
8], LSTM (long short-term memory) [
9], and self-attention [
10], have been widely used. For example, Lian et al. [
11] proposed a location recommendation method based on a self-attention network for geo-aware sequence recommendations. Zheng et al. [
12] presented a memory-enhanced hierarchical attention network, which considers both short-term check-in sequences and long-term memory. Although these deep learning-based methods are well developed, some issues still remain with regard to next POI recommendations. Particularly, these methods mainly resort to deep learning to capture user preferences by learning the nonlinear relations between the POIs and user preferences, and pay little attention to mining and using information that explicitly reflects user preferences. This may not lead to a good performance when there are few data for training or noise present in the data.
To improve next POI recommendations, this paper improves the self-attention network-based recommendation method by taking the information reflecting user preference explicitly into account. First, considering that there is often periodicity in people’s work and lives, there is also periodicity in the sequences of different POIs. Using the information that reflects the periodicity of next POI recommendations contributes to an improved recommendation performance. By taking the attribute of the month of check-ins as the constraint, our experiments showed that it improved the recall rate by 11.37%. Second, different people have preferences for different POIs in practice. Thus, the categories of POIs can also reflect user preference to a certain extent. We also used the attribute of categories of POIs for next POI recommendation, and the experiments showed its contribution. Moreover, distance is an important factor influencing people’s decisions regarding whether or not to visit a POI. In light of this, we used a filter to remove the candidate POIs that were more than a certain distance away when recommending the next POIs. The experiments showed that this also improved the accuracy of the recommendations.
The rest of the paper is structured as follows. The current state of the research on POI recommendations is described in
Section 2; the problems related to next POI recommendation are detailed in
Section 3; the details of our proposed approach are presented in
Section 4; then, the experiments and the results are explained and provided in
Section 5; finally, our conclusions and the future possibilities are explored in
Section 6.
2. Related Work
2.1. Traditional Research Work on POI Recommendation
Traditionally, collaborative filtering and matrix factorization techniques have been used for POI recommendations. For example, the works of Zeng et al. [
13] and Wang et al. [
14] used collaborative filtering algorithms to exploit the similarity of user trajectories. Tourinho et al. [
15] proposed a fuzzy region-based collaborative filtering recommendation algorithm that used only signed-in data. As such, users’ activities and preferences can be modeled from aspects such as regions of interest and POI prevalence. Furthermore, Li et al. [
16] proposed a collaborative filtering algorithm based on point-state preference learning on user-item sets.
However, collaborative filtering techniques cannot effectively utilize contextual information such as user space–time. Ren et al. [
17] and Davtalab et al. [
18] both proposed a probability matrix factorization method using textual information, spatio-temporal information, social network information, and categorization information. Hu et al. [
19] proposed a POI collaborative clustering method based on non-negative matrix decomposition using spatio-temporal information and user similarity. Silva et al. [
20] proposed a joint Bayesian recommendation model integrating item text content, user social networks, and user–item interaction. It generalized an existing Poisson decomposition model by adding content and social features. However, in general, the scoring matrix was very sparse, which limited the accuracy of the recommendations. Moreover, the model could not learn the sequence transformation of items, i.e., it did not consider the order effect. Accurate POI recommendations are closely related to the spatio-temporal context and trajectory sequences; thus, it is necessary to incorporate spatio-temporal contextual information and sequence transformation information regarding items into the reference factors for recommendations.
2.2. Deep Learning-Based Research on Next POI Recommendation
Next POI recommendation is actually a sequence recommendation, which considers the transition between POIs based on the user’s historical trajectory. Many algorithms have emerged in recent years. Zhang et al. [
21] designed a new approach for sequence recommendation based on a RNN and CNN (convolutional neural network). Hidasi et al. [
22] used a recurrent neural network to capture long semantic information for sequence recommendation. Chen et al. [
23] proposed a hybrid order gated graph neural network (GNN) to adequately apply GNN to control-based recommendations, based on the over smoothing problem. Gao et al. [
24] proposed a session recommendation model based on context-aware and gated graph neural networks, incorporating relevant contextual information into the recommendation influences. Mitheran et al. [
25] used a transformer with a target-attentive GNN for feature extraction and used multi-headed attention to capture local and global contexts. It was able to learn richer representations for sequence-based recommendation.
Based on sequential recommendations, recent research work on next POI recommendation has mainly used deep learning algorithms. Luo et al. [
26] utilized an attention mechanism to learn user preferences for next POI recommendation. Sun et al. [
27] proposed long- and short-term preference modeling, including a nonlocal network for long-term preference modeling and a geographically expanded RNN for short-term preference learning for next POI recommendation. Liu et al. [
28] proposed a real-time preference mining model based on LSTM to recommend the next POI with time constraints. Chen et al. [
29] presented an RNN-based next POI recommendation method that considered both the location interests of similar users and contextual information (e.g., time, current location, and friends’ preferences). Wang et al. [
30] proposed the DSPR method, which utilized different types of contextual information such as absolute time, POI–POI transition time/distance, and POI types to model real-time demand and combine user preferences for next POI recommendation. Xu et al. [
31] integrated user comprehensive trust relationships, user preferences, check-in time, and geographic location into a matrix factorization model for next POI recommendation. Agrawal et al. [
32] proposed an embedding-based venue recommendation framework that represented POI based on tag embedding and modeled users (user profiles) based on the POIs.
Different from existing methods, we improved the self-attention network-based next POI recommendation method by explicitly taking information reflecting user preference into consideration. We propose including attributes that reflect user preference and behavioral habits such as the month of check-in and the category of POI into consideration. Moreover, we also considered the influence of the distance factor and removed the candidate POIs that were more than a certain distance away when recommending the next POI.
3. Problem Definition
In this paper, a set of users is represented by , where is the number of users. A set of POIs is denoted by , where is the number of POIs. Each POI contains the information: ID, longitude, and latitude, denoted as: . Based on the above representations, all the check-in points of each user in a period of time can be formed into a trajectory in chronological order. Then, the trajectory of the user n can be represented as , where indicates that user checked in at POI at time . The category of POI is , and the month in which the check-in occurred is .
To facilitate the calculation, the length of user trajectories was unified as N. Furthermore, if , the nearest N check-in points are selected, and if , zero is added to the trajectory from the right. Given the above information, the problem of next POI recommendation is to recommend the next POI to a user given its trajectory and the information of all the POIs in L.
4. Methodology
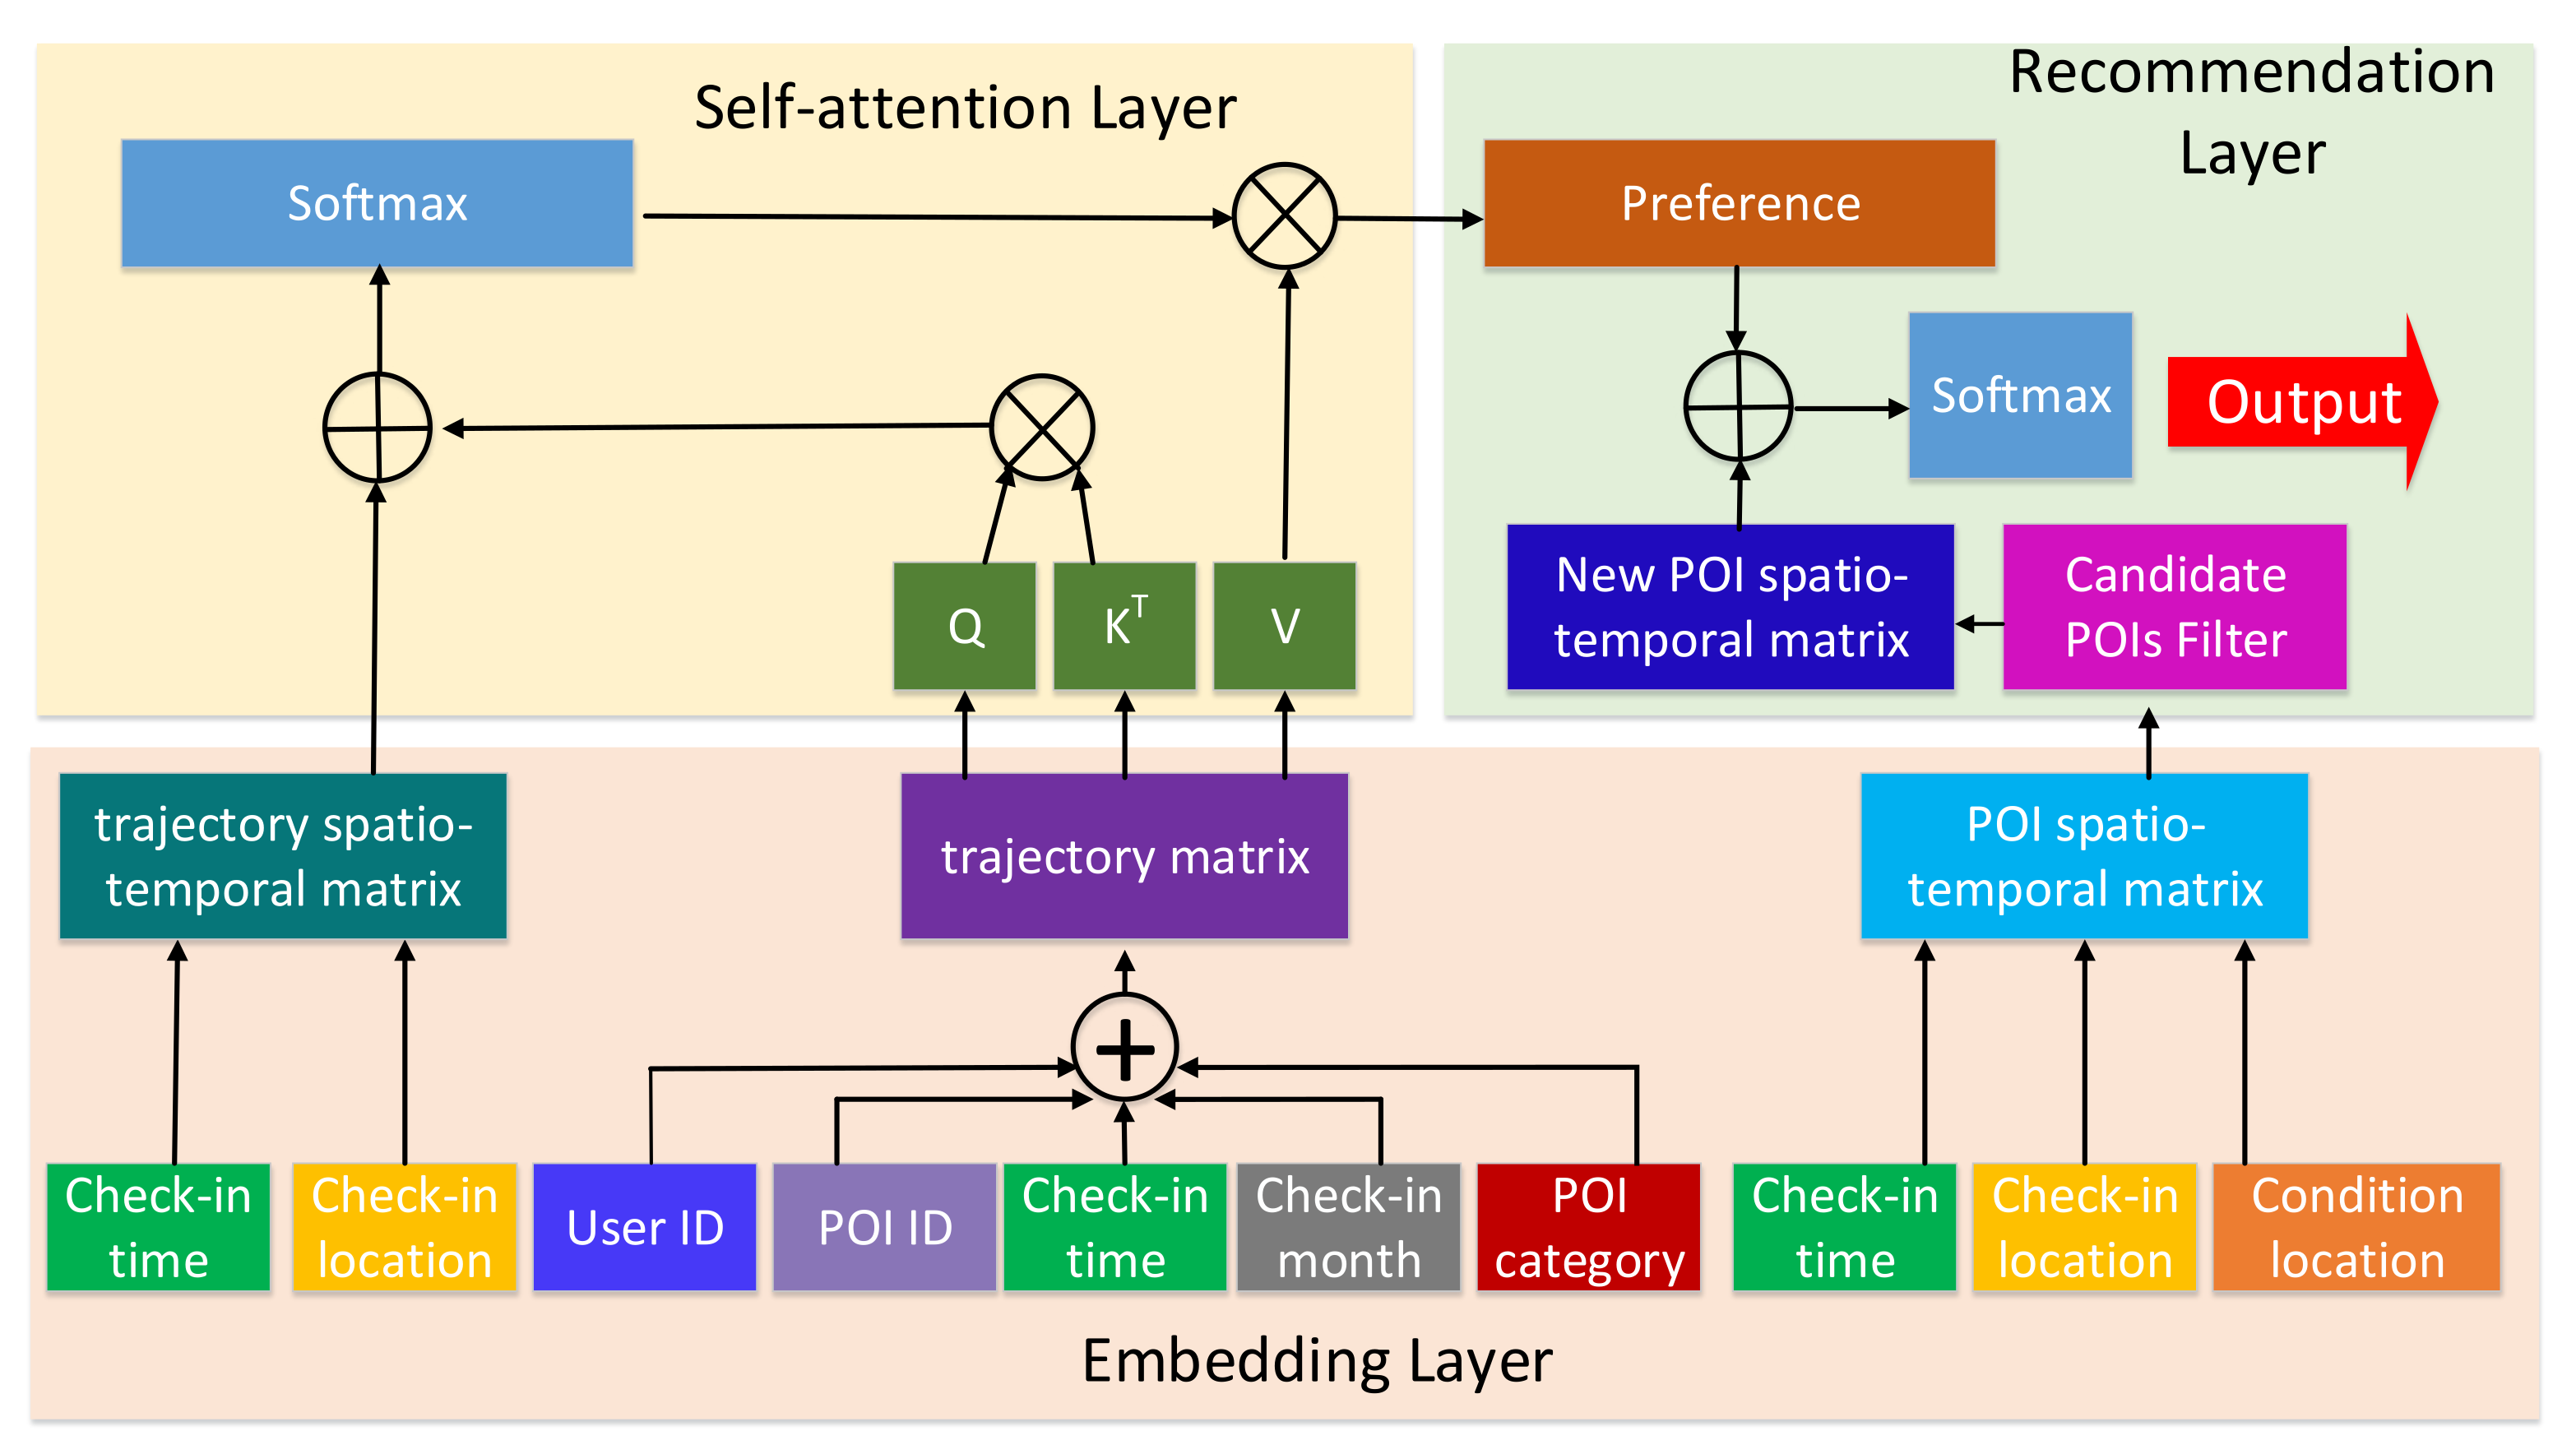
This paper improves the self-attention network-based next POI recommendation method by using attributes that explicitly reflect user preference. As shown in
Figure 1, the model of the proposed method mainly consists of three layers: an embedding layer, a self-attention layer, and a recommendation layer.
The first layer is the embedding layer, which embeds the basic information into certain dimensional features. The user trajectories, including the attributes of user ID, check-in point ID, check-in time, the month of check-in, and check-in point category, are transformed into the user trajectory matrix. Then, the trajectory spatio-temporal matrix is derived from the spatio-temporal information of the user trajectory matrix, and the POIs’ spatio-temporal matrix is calculated from the spatio-temporal information of the user track and the candidate POIs. As a result, three important matrices, namely the user trajectory matrix, the trajectory spatio-temporal matrix, and the POIs’ spatio-temporal matrix, are derived from the first layer. The second layer is the self-attention layer, whose purpose is to learn user preference features. Specifically, the user’s trajectory matrix and the trajectory spatio-temporal matrix obtained from the first layer are sent to the self-attention network to learn the user preference. The third layer is the recommendation layer in which the next POI is recommended with the learned user preference features. The details of these layers are described in the subsequent subsections.
4.1. Embedding Layer
The inputs of the embedding layer are the trajectories of each user, where indicates that user checked in POI at time , the category of POI is , and the month in which the check-in occurred is . Given these inputs, the embedding layer embeds these trajectories into the latent space and obtains their features. More specifically, each point in the trajectories is mapped into a d-dimension feature based on its five types of attributes. Once the features of each point of the trajectories are obtained, the spatio-temporal relationship between the different points in the trajectories and between the current POI of users and the candidate POIs are calculated. This is because the spatio-temporal context has a strong impact on the choice of the next POI, and this information will contribute to the awareness of user preference in the spatio-temporal context.
After embedding, the trajectory of each user is transformed into a matrix in the form of , where denotes the features of the i-th trajectory point. Because each point in the trajectory contains the five kinds of attributes of user ID, check-in point ID, check-in time, check-in month, and check-in point category, the features of the i-th trajectory point are the addition of the features of these attributes. That is, , where ,,,, and are the embedded features of these attributes of user ID, check-in point ID, check-in time, check-in month, and check-in point category, respectively, and d is the dimension of these embedded features. For the values of these attributes, they are the numbers in practice. Thus, we convert them from a scalar to a dense vector. What should be noted is that the values of check-in time have been transformed into a time of 7 (days) × 24 (hours) = 168 (hours), indicating one hour in a week. This fine-grained temporal information is meant to highlight the potential cyclical nature of people’s lives throughout the week.
To capture the spatio-temporal relationship between the different points in the trajectories, the spatial distances and the temporal time intervals between different points are calculated. The spatial distances between points are obtained by the way of the Haversine ranging method [
33]. The absolute difference between the embedded features of the check-in time of two different points is taken as the temporal time interval between the points. Then, the spatial distance and the temporal time interval between two points are summed together to capture the spatio-temporal relationship between two points of the trajectories. In this way, for each trajectory, there is one corresponding matrix in the form of
to capture the spatio-temporal relationship between any two points of the trajectory. In the same way, the spatio-temporal relationship between the current location of the user and the candidate POIs for recommendations can be captured. Finally, three kinds of matrices are obtained by the embedding layers. They are the user trajectory matrix capturing the features of the trajectories of different users, the trajectory spatio-temporal matrix capturing the spatio-temporal relationships between the points of the trajectory, and the POIs’ spatio-temporal matrix capturing the spatio-temporal relationships between the user’s current location and the candidate POIs.
4.2. Self-Attention Layer
The user’s transition between check-in points reflects their daily habit preferences, and the extraction of their personal preferences helps to recommend the next POI to the user. Traditional neural network models such as LSTM and RNN cannot capture long sequence information, but in order to obtain personal behavior and habit preferences long sequence trajectories are required. The self-attentive network uses the attention mechanism to calculate the correlation between POIs. This layer takes as inputs the user trajectory matrix and the trajectory spatio-temporal matrix to learn user preference features. Given the user trajectory matrix
and the trajectory spatio-temporal matrix
, the preference learning expression is:
is the semantic similarity weight between POIs, calculated as:
where
Q,
K, and
V denote the query, key, and value matrices in the self-attention network, respectively. We first compute the dot product of matrices
Q and
, add the trajectory spatio-temporal matrix to emphasize the spatio-temporal information, and apply
to scale the results. Then, the results are normalized to a probability distribution using the softmax operation. The
Q,
K, and
V are defined as follows, where
are the parameter matrices.
4.3. Recommendation Layer
User preferences are learned in the self-attention layer. With the learned user preference features, the recommendation layer matches the user preference with each candidate’s POI and recommends the POI with a high matching degree. For the selection of candidate POIs, all remaining POIs are often taken as candidates. In this paper, a candidate POI filter is used to remove the candidates, which are a longer distance away.
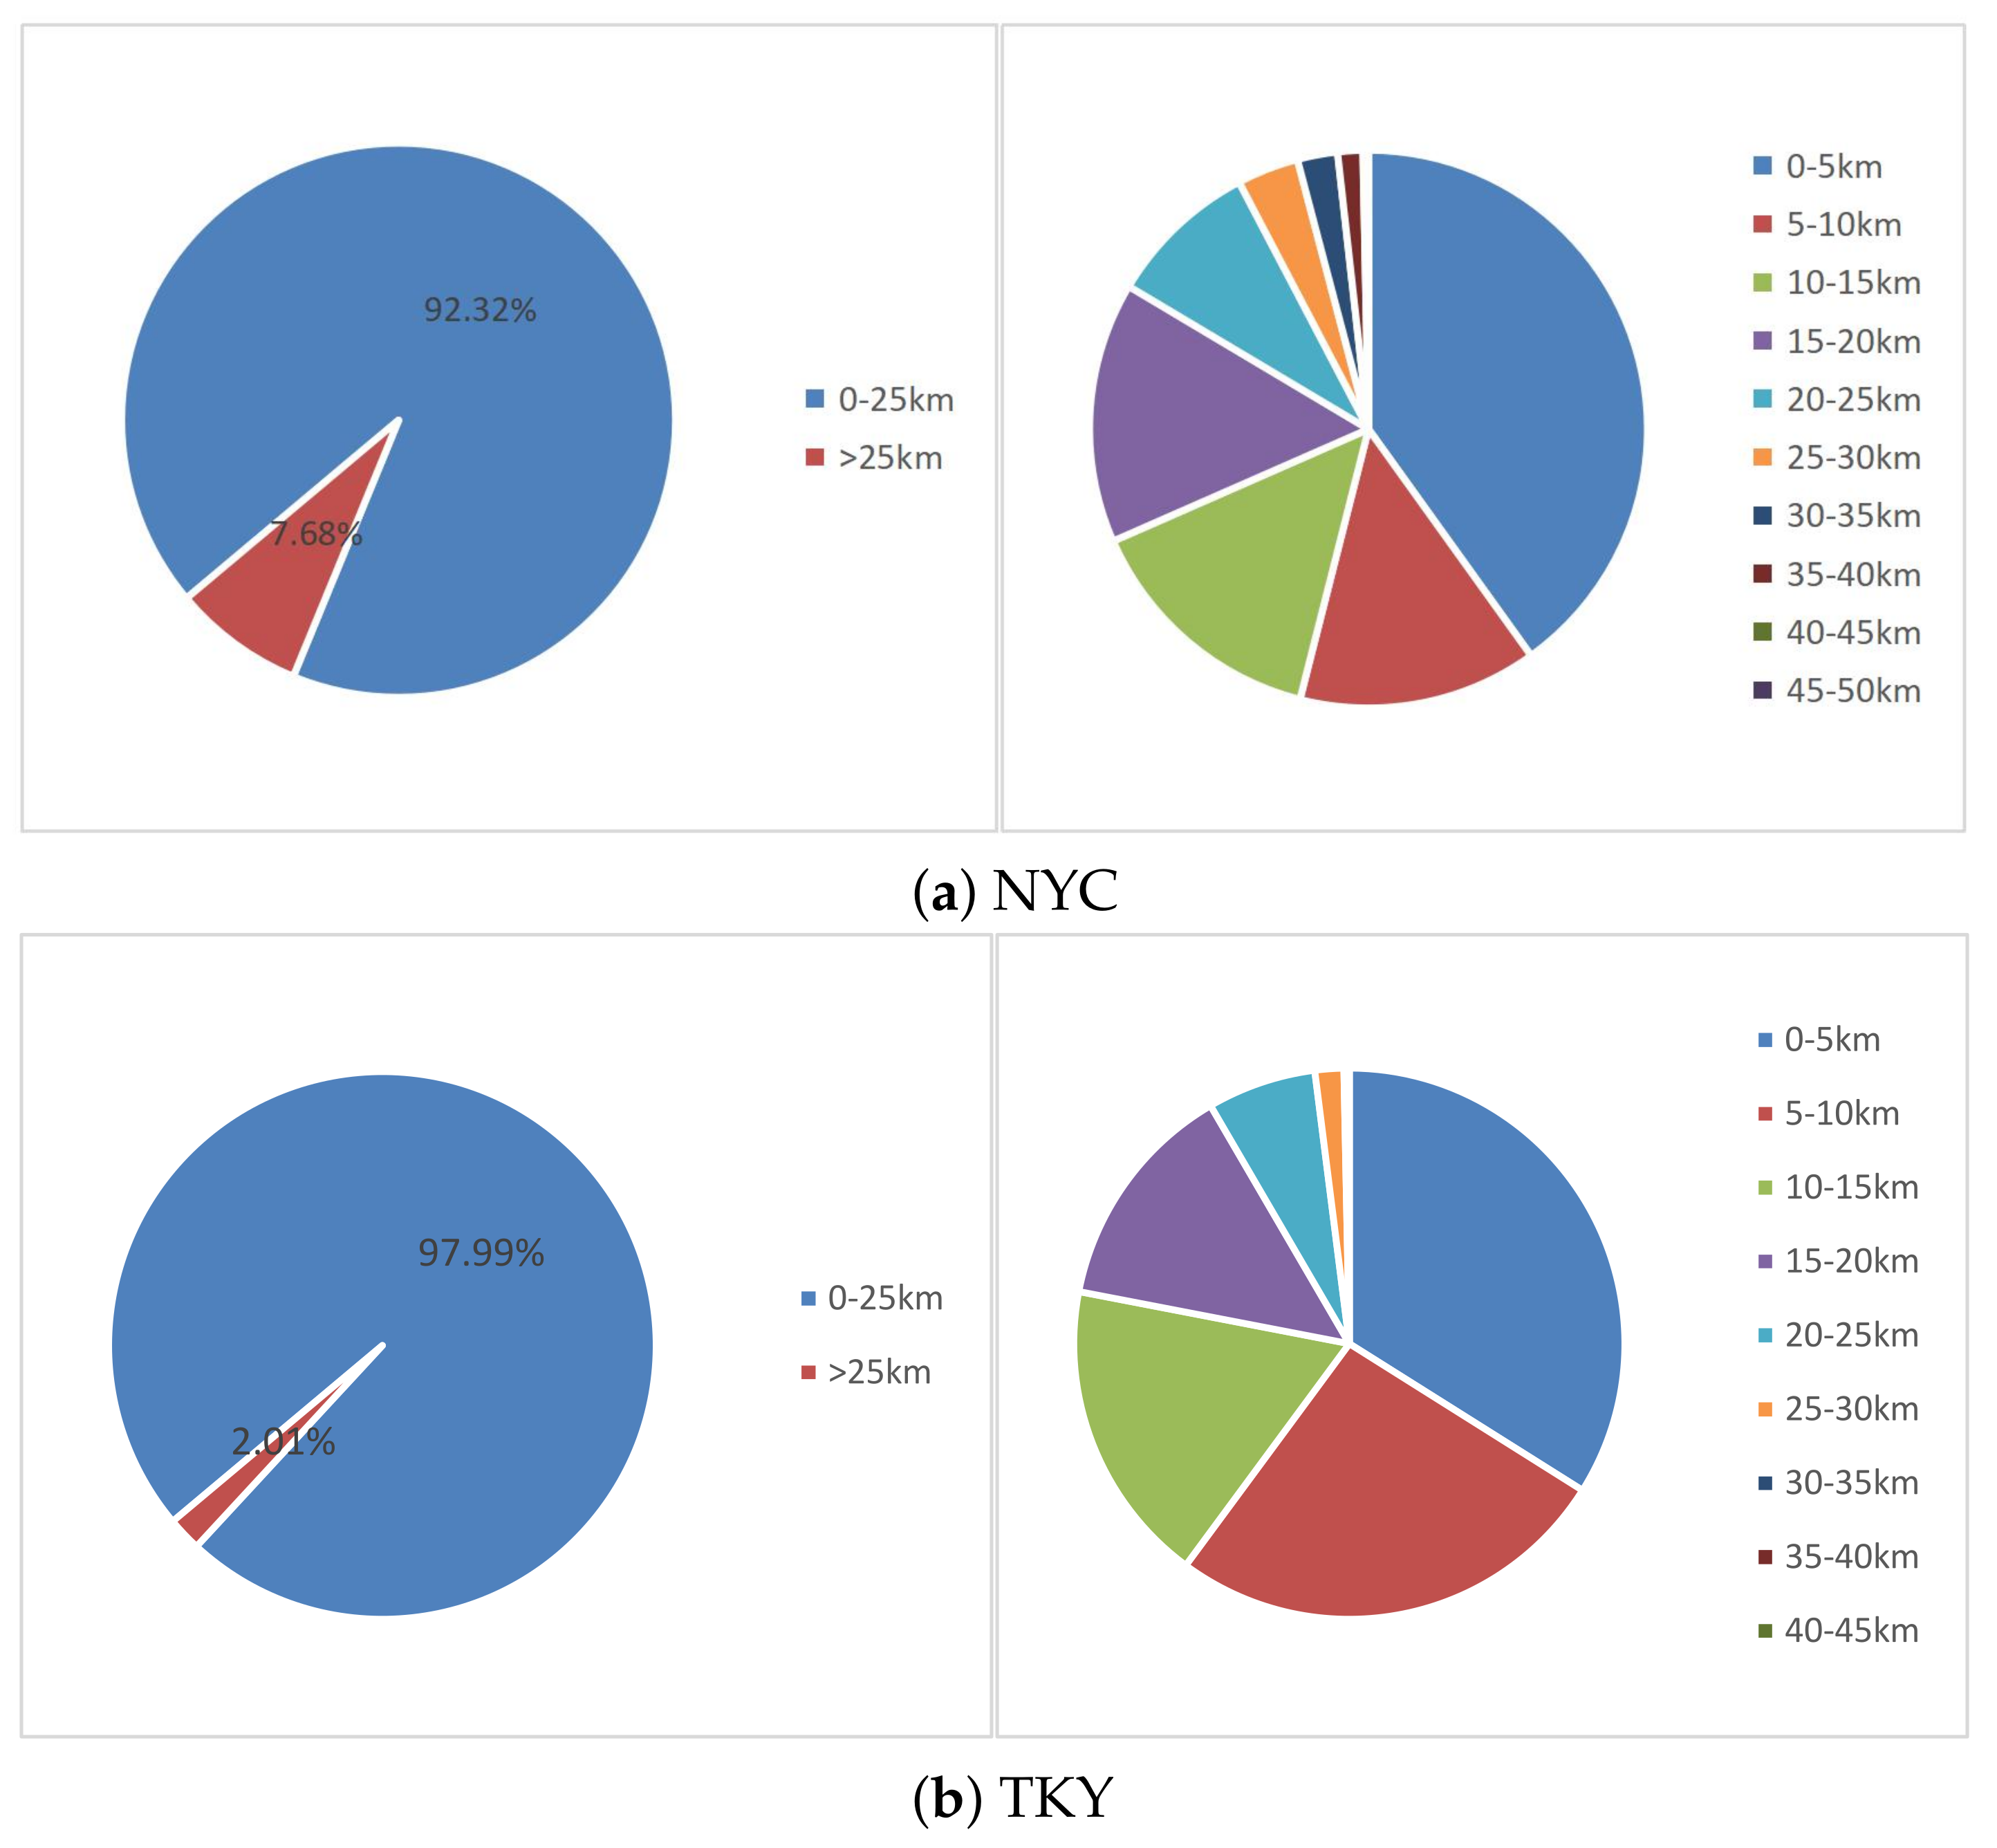
Given the NYC dataset and TKY dataset [
34], the statistics of the distance distribution between POIs are shown in
Figure 2.
Figure 2a shows the distance distribution between two consecutive visits in the NYC dataset, and
Figure 2a shows that of the TKY dataset. It can be seen that the distance between most of the consecutive visits does not exceed 25 km. Thus, the candidate POIs, which are more than 25 km away from the current POI, are excluded from the recommendations to improve the recommendation accuracy.
After filtering, the POI spatio-temporal matrix is changed from
to
. Then, the probabilities of each candidate POI to be recommended are calculated in the following way:
where
are defined in Formula (3), and
is the sum of the values of the last dimension. The probabilities are sorted from largest to smallest, and the POI with the highest probability is recommended.
5. Experiments and Results
In this section, the details of the experiments used to validate the proposed method are presented. The experimental setup, a comparison of the results with other related methods, and the results of the ablation experiment are described.
5.1. Experimental Setup
5.1.1. The Datasets
To validate the proposed method, two public datasets of NYC [
34] and TKY [
34] were used in our experiments. The information contained in each dataset included the user ID, POI ID, check-in time, check-in month, and check-in point category. We collected all the check-in records within one year. We considered the POIs that were checked into less than 10 times as “zombie” check-in points, users whose track length was less than 20 as extremely inactive users and removed such POIs and users from the datasets. Finally, the number of users, POIs, and the categories of the POIs of the datasets are shown in
Table 1.
To train the self-attention network, the first check-in points of a user’s trajectory were used as inputs, and the corresponding check-in points were used as labels. For the validation set, the -th check-in point was taken as an input and the -th check-in point was taken as the label. When testing, the -th check-in point in the test set was taken as the input to predict a point of interest at the N-th location.
5.1.2. Baselines
To show the improved performance, we selected the following related methods for comparison.
LSTM [
9] (Hochreiter et al., 1997): This is a special RNN model that contains a memory cell and three multiplicative gates to learn long-term preferences.
RNN [
8] (Zhang et al., 2014): A new framework based on a recurrent neural network is proposed. The framework models the dependence between the user sequence behavior directly into the click prediction process through the recurrent structure in RNN.
GRU [
35] (Cho et al., 2014): This approach consists of two recurrent neural networks. One RNN encodes a sequence of symbols into a fixed-length vector representation, and the other RNN decodes that representation into another sequence of symbols.
ST-RNN [
36] (Liu et al., 2016): This is a spatio-temporal recurrent neural network that can model the local temporal and spatial context of each layer with specific temporal transfer matrices for different time intervals and specific distance transfer matrices for different geographical distances.
Bi-STDDP [
37] (Xi et al., 2019): This method integrates the bi-directional spatio-temporal dependencies and the dynamic user preferences to identify POI check-ins accessed by users at a specific time.
GeoSAN [
11] (Lian et al., 2020): This is a location recommendation method for geo-aware sequence recommendation based on a self-attentive network. A self-attention-based geocoder is used to represent a hierarchical grid process for each GPS point.
LSTPM [
27] (Sun et al., 2020): This is a next POI recommendation method that combines long- and short-term preferences. In particular, the model includes a nonlocal network for long-term preference modeling and a geographically expanded RNN for short-term preference learning.
STAN [
26] (Luo et al., 2021): This method explicitly exploits the relative spatio-temporal information of all lattices with self-attentive layers along the trajectory. This improvement allows for point-to-point interactions between non-adjacent locations and non-contiguous check-ins with explicit spatio-temporal effects.
RTPM [
28] (Liu et al., 2021): This is an LSTM-based real-time preference mining model that can be used to recommend the next time-bound POI. Specifically, it mines users’ real-time preferences from long-term and short-term preferences in a unified framework.
5.1.3. Evaluation Indicators and Implementation Details
To measure the performance, the commonly used metric in the recommendation system
was adopted in this paper.
Rec@K is the ratio of the correct POIs among the top K recommended POIs to the ground truth. It is calculated as in the following Equation (
5), where
K denotes the number of recommended POIs,
denotes the list of recommended POIs, and
denotes the lists visited by users. In particular, three concrete metrics of
,
, and
were applied, with a larger number indicating a stronger effect. The test findings were averaged across five experiments.
We implemented the proposed method with the PyTorch deep learning framework. The experiments were run under Linux with Cuda version 10.1, PyTorch version 1.6.0, and Python version 3.8, and the GPU was NVIDIA Tesla T4. The optimizer used was the Adam optimizer. The initial learning rate was set to 0.0001, and the dropout was 0.2. The embedding dimension of NYC and TKY was set to 50, the NYC trajectory length was set to 120, the TKY trajectory length was set to 100, and the training epoch was 150.
5.2. Experimental Results and Analysis
The results of the comparisons with other related methods are shown in
Table 2. The performance data of the methods LSTM, RNN, GRU, STRNN, and Bi-STDDP are cited from the work of Bi-STDDP [
37], the performance data of GeoSAN and STAN are from the work of STAN [
26], and the LSTPM and RTPM data are from the work of RTPM [
28]. The missing data are replaced by “-”. In the comparison, the optimal result is emphasized by “_”. The comparison results revealed that the proposed method in this paper performed better in terms of the three metrics based on the two datasets.
Our model significantly outperformed all models it was compared to, with a 9–17% improvement in recall rate. The method also performed better on the NYC dataset. This is because more than half of the trajectories in the dataset were less than 100 in length. In this case, our innovative method was more effective. Comparing the results of the two datasets, it was found that only our method, the GeoSAN method, and the STAN method performed better on the NYC dataset. The reason for this is that all three methods used self-attention networks, which were better at capturing long sequence features. Our method was superior because we added more attribute information to obtain a more accurate picture of user preferences. The facility of candidate location filters also played an important role.
Among the three methods using the self-attention networks, the method proposed in this paper performed the best, and GeoSAN performed the worst. The reason for this may be that the pretraining of the GeoSAN geocoder was insufficient, and the information on the negative sampler was not enough. In addition, it was found that the STAN network was inferior to Bi-STDDP and LSTPM in the TKY dataset. The reasons may be the inadequate modeling of geographic information and the larger size of the TKY dataset. The overall performance of the RTPM method was excellent in Rec@1 on both datasets, probably because the network accounted for the periodicity of the LSTM networks and mined the relationship between users’ historical preferences and current preferences based on their spatio-temporal similarity. In addition, it also considered that the current preference of users may be affected by the public, so it filtered out unpopular POIs.
5.3. Ablation Experiments
Several sets of ablation experiments were also conducted in this paper to highlight the value of our improvements.
Table 3 shows the outcomes of the experiments: “-M-C-F” denotes the removal of the attributes of check-in month and check-in point category, as well as the candidate POIs filter; “-M” denotes the removal of the attribute of check-in month; “-C” denotes the removal of the attribute of check-in point category; and “-F” denotes the removal of the candidate POI filter. The comparison shows the contribution of the different improvements. For example, it improved recommendation accuracy by an average of 11.07% when adding the attribute of check-in month based on the TKY dataset, while the recommendation accuracy was improved by an average of 7.83% when adding the attribute of the check-in point category based on the NYC dataset. These data proved the usefulness of the added attributes “month of check-in” and “POI category” for the performance of the recommendations.
In particular, because the distance between most of the consecutive check-in places in the NYC and TKY datasets did not exceed 25 km, we designed a candidate POI filter to exclude the candidate POIs further than 25 km from a user’s current location. It can be seen that the inclusion of this filter improved the recommendation performance by 6.46%. When comparing the two datasets, the improvement on the TKY dataset was better, particularly for the indicator , which was improved by 13.12%. This is due to the larger size of the TKY dataset, which had a larger number of candidate sites; hence, many candidates were filtered out for recommendations.
5.4. Parameter Sensitivity Analysis
5.4.1. Track Length Setting
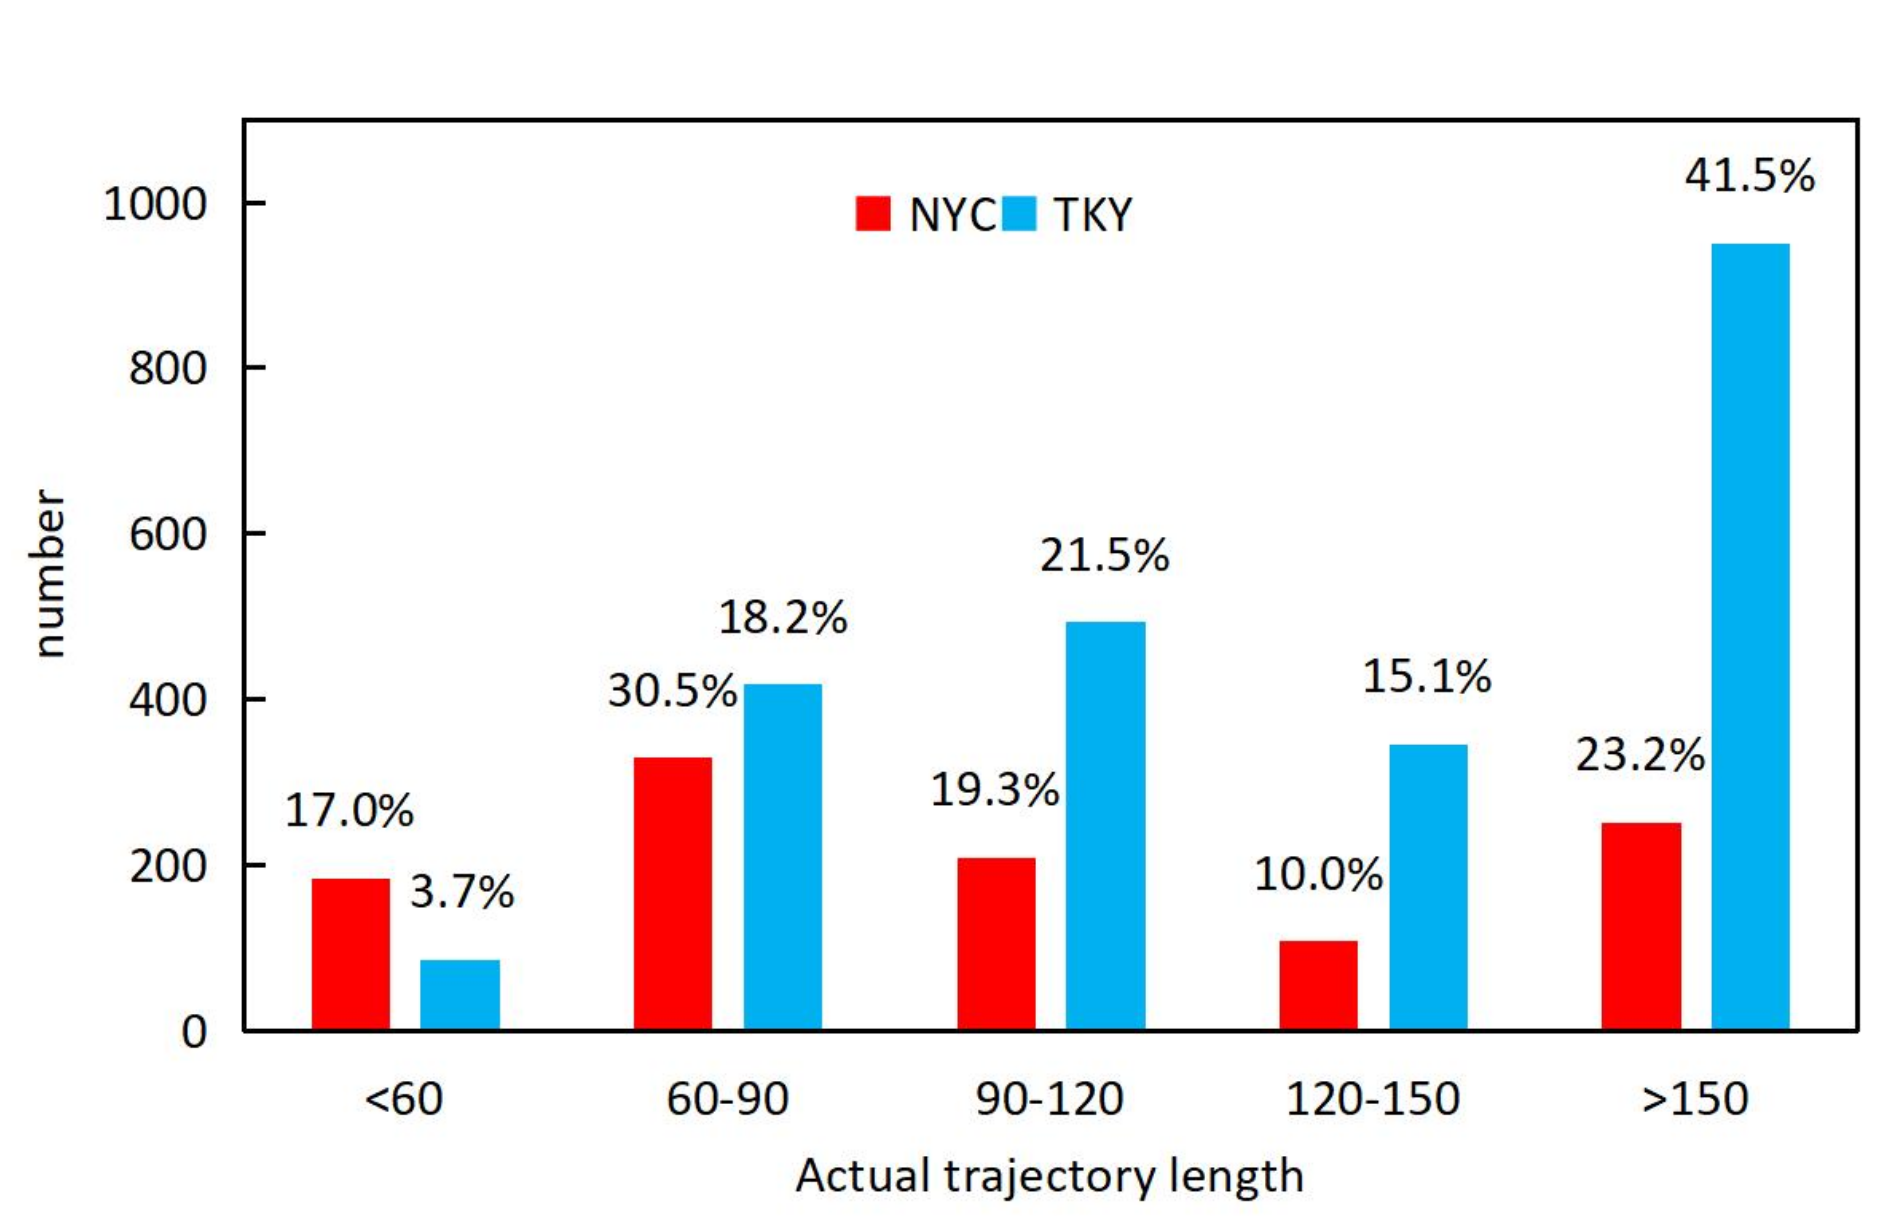
We know that the sparser the data are, the more difficult it is to learn user preference. For a shorter trajectory length, it is also difficult to accurately learn user preferences. Conversely, the longer the trajectory length is, the more accurate the user preference can be attained; however, if the trajectory length is set too long, it will result in part of the data being zeroed, which will also affect the experimental results.
Figure 3 shows the distribution of the trajectory length of two datasets. Considering that the actual trajectory length
of most users in both datasets is less than 150, we evaluated the influence of the trajectory length by observing the different accuracies when the trajectory length
N varied in the range of 60–150.
The experimental results are shown in
Figure 4. The red color in the figure indicates the experimental results of the NYC dataset, and the blue color indicates the experimental results of the TKY dataset, where the horizontal coordinate of the figure was the trajectory length setting, and the vertical coordinate was the recall rate. For the NYC dataset, we observed that the experimental effect showed an overall increasing trend with the increase in the trajectory length and leveled off after the length
N of 120, so the user trajectory length of the NYC dataset was fixed to
N = 120. For the TKY dataset, it was obvious that the experimental effect gradually increased with the increase in trajectory length and reached a peak at a length
N of 100, so the user trajectory length of the TKY dataset was fixed to
N = 100 in this paper.
From the statistical results shown in
Figure 3, we can see that in the TKY dataset, more than half of the users’ actual trajectory length
are longer than 120, and the user actions were relatively dense. On the contrary, in the NYC dataset, more than half of the users’ actual trajectory length
are less than 120, and the user actions were relatively sparse. This may be the reason why the best accuracy was achieved for the TKY dataset by setting the trajectory length to
N = 120 and for the NYC dataset by setting the trajectory length to
N = 100.
5.4.2. Embedding Dimension Setting
For the selection of feature dimensions in the embedding layer (see
Section 4.1), we tested the values of 10, 20, 30, 40, 50, 60, and 70 on two datasets, and the experimental results are shown in
Figure 5. The red color in the figure indicates the experimental results of the NYC dataset, and the blue color indicates the experimental results of the TKY dataset. It is obvious that the experimental effect gradually improved with the increase in the embedding dimension, reached a peak at the dimension of 50, and then tended to remain stable. Thus, we set the embedding dimension to 50 in our method.
6. Conclusions
This paper proposed a next POI recommendation method based on a self-attention network. Currently, next POI recommendation methods mainly use deep learning to capture user preferences by learning the nonlinear relations between the POIs and the user preference. Differing from these methods, the proposed method explicitly takes the information that can reflect user preference into the learning process to better capture user preferences. Considering that people’s work and lives are often organized in a periodic format, we chose the attribute of the month of check-in as the constraint for next POI recommendation. The experiments showed that this improved the method’s accuracy by 11.37% in both datasets. Based on the fact that the categories of the POIs can also reflect user preferences, we also used the attribute of the categories of POIs for next POI recommendation, and the experiments showed that it also made a positive contribution to the results. Moreover, distance influences people’s decisions regarding whether or not to visit a POI. Thus, we used a filter to remove the candidate POIs that were more than a certain distance away when recommending the next POIs. The experiments showed that this improved the accuracy of the recommendations to a great extent.
In the future, we will consider merging more POI data [
38], using more types of available information that may explicitly indicate user preferences [
39]—such as users who follow and are followed and user-friendly neighborhoods—for next POI recommendation to further improve the method’s performance.
Author Contributions
Conceptualization, Ruijing Li and Jianzhong Guo; methodology, Ruijing Li and Jianzhong Guo; software, Ruijing Li, Zheng Li and Shaoqing Zhang; validation, Ruijing Li and Shaoqing Zhang; investigation, Chun Liu; resources, Shaoqing Zhang; data curation, Ruijing Li and Shaoqing Zhang; writing—original draft preparation, Ruijing Li; writing—review and editing, Ruijing Li and Chun Liu; supervision, Zheng Li and Jianzhong Guo; project administration, Jianzhong Guo; funding acquisition, Jianzhong Guo. All authors have read and agreed to the published version of the manuscript.
Funding
This research received no external funding.
Institutional Review Board Statement
Not applicable for studies not involving humans or animals.
Informed Consent Statement
Not applicable for studies not involving humans.
Data Availability Statement
Conflicts of Interest
The authors declare no conflict of interest.
References
- Gong, L.; Liu, X.; Wu, L.; Liu, Y. Inferring trip purposes and uncovering travel patterns from taxi trajectory data. Cartogr. Geogr. Inf. Sci. 2016, 43, 103–114. [Google Scholar] [CrossRef]
- Liu, X.; Tian, Y.; Zhang, X.; Wan, Z. Identification of urban functional regions in chengdu based on taxi trajectory time series data. ISPRS Int. J. Geo. Inf. 2020, 9, 158. [Google Scholar] [CrossRef] [Green Version]
- Jiang, S.; Alves, A.; Rodrigues, F.; Ferreira, J., Jr.; Pereira, F.C. Mining point-of-interest data from social networks for urban land use classification and disaggregation. Comput. Environ. Urban Syst. 2015, 53, 36–46. [Google Scholar] [CrossRef] [Green Version]
- Rodrigues, F.; Alves, A.; Polisciuc, E.; Jiang, S.; Ferreira, J.; Pereira, F. Estimating disaggregated employment size from points-of-interest and census data: From mining the web to model implementation and visualization. Int. J. Adv. Intell. Syst. 2013, 6, 41–52. [Google Scholar]
- Linden, G.; Brent, S.; Jeremy, Y. Amazon.com recommendations: Item-to-item collaborative filtering. IEEE Internet Comput. 2003, 7, 76–80. [Google Scholar] [CrossRef] [Green Version]
- Lee, D.D.; Sebastian Seung, H. Learning the parts of objects by non-negative matrix factorization. Nature 1999, 401, 788–791. [Google Scholar] [CrossRef]
- Yosinski, J.; Clune, J.; Bengio, Y.; Lipson, H. How transferable are features in deep neural networks? Adv. Neural Inf. Process. Syst. 2014, 27, 3320–3328. [Google Scholar]
- Zhang, Y.; Dai, H.; Xu, C.; Feng, J.; Wang, T.; Bian, J.; Wang, B.; Liu, T.-Y. Sequential click prediction for sponsored search with recurrent neural networks. Proc. AAAI Conf. Artif. Intell. 2014, 28, 1369–1375. [Google Scholar] [CrossRef]
- Hochreiter, S.; Jürgen, S. Long short-term memory. Neural Comput. 1997, 9, 1735–1780. [Google Scholar] [CrossRef]
- Vaswani, A.; Shazeer, N.; Parmar, N.; Uszkoreit, J.; Jones, L.; Gomez, A.N.; Kaiser, Ł.; Polosukhin, I. Attention is all you need. Adv. Neural Inf. Process. Syst. 2017, 30, 3058. [Google Scholar]
- Lian, D.; Wu, Y.; Ge, Y.; Xie, X.; Chen, E. Geography-aware sequential location recommendation. In Proceedings of the 26th ACM SIGKDD International Conference on Knowledge Discovery & Data Mining, Virtual Event, CA, USA, 6–10 July 2020; pp. 2009–2019. [Google Scholar]
- Zheng, C.; Tao, D.; Wang, J.; Cui, L.; Ruan, W.; Yu, S. Memory augmented hierarchical attention network for next point-of-interest recommendation. IEEE Trans. Comput. Soc. Syst. 2020, 8, 489–499. [Google Scholar] [CrossRef]
- Zeng, J.; He, X.; Li, F.; Wu, Y. A recommendation algorithm for point of interest using time-based collaborative filtering. Int. J. Inf. Technol. Manag. 2020, 19, 347–357. [Google Scholar] [CrossRef]
- Wang, X.; Liu, Y.; Zhou, X.; Wang, X.; Leng, Z. A Point-of-Interest Recommendation Method Exploiting Sequential, Category and Geographical Influence. ISPRS Int. J. Geo. Inf. 2022, 11, 80. [Google Scholar] [CrossRef]
- Tourinho, I.A.D.S.; Tatiane, N.R. FACF: Fuzzy areas-based collaborative filtering for point-of-interest recommendation. Int. J. Comput. Sci. Eng. 2021, 24, 27–41. [Google Scholar] [CrossRef]
- Li, L.; Pan, W.; Ming, Z. CoFi-points: Collaborative Filtering via Pointwise Preference Learning on User/Item-Set. ACM Trans. Intell. Syst. Technol. 2020, 11, 1–24. [Google Scholar] [CrossRef]
- Ren, X.; Song, M.; Haihong, E.; Song, J. Context-aware probabilistic matrix factorization modeling for point-of-interest recommendation. Neurocomputing 2017, 241, 38–55. [Google Scholar] [CrossRef]
- Davtalab, M.; Alesheikh, A.A. A POI recommendation approach integrating social spatio-temporal information into probabilistic matrix factorization. Knowl. Inf. Syst. 2021, 63, 65–85. [Google Scholar] [CrossRef]
- Hu, L.; Xing, Y.; Gong, Y.; Zhao, K.; Wang, F. Nonnegative matrix tri-factorization with user similarity for clustering in point-of-interest. Neurocomputing 2019, 363, 58–65. [Google Scholar] [CrossRef]
- da Silva, E.d.S.; Langseth, H.; Ramampiaro, H. Content-based social recommendation with poisson matrix factorization. In Joint European Conference on Machine Learning and Knowledge Discovery in Databases; Springer: Cham, Switzerland, 2017; pp. 530–546. [Google Scholar]
- Zhang, J.; Ma, C.; Mu, X.; Zhao, P.; Zhong, C.; Ruhan, A. Recurrent convolutional neural network for session-based recommendation. Neurocomputing 2021, 437, 157–167. [Google Scholar] [CrossRef]
- Hidasi, B.; Karatzoglou, A.; Baltrunas, L.; Tikk, D. Session-based recommendations with recurrent neural networks. arXiv 2015, arXiv:1511.06939. [Google Scholar]
- Chen, Y.-H.; Huang, L.; Wang, C.-D.; Lai, J.-H. Hybrid-Order Gated Graph Neural Network for Session-Based Recommendation. IEEE Trans. Ind. Inform. 2021, 18, 1458–1467. [Google Scholar] [CrossRef]
- Li, D.; Qian, G. Session Recommendation Model Based on Context-Aware and Gated Graph Neural Networks. Comput. Intell. Neurosci. 2021, 2021, 7266960. [Google Scholar] [CrossRef] [PubMed]
- Mitheran, S.; Java, A.; Sahu, S.K.; Shaikh, A. Introducing Self-Attention to Target Attentive Graph Neural Networks. arXiv 2021, arXiv:2107.01516. [Google Scholar]
- Luo, Y.; Liu, Q.; Liu, Z. Stan: Spatio-temporal attention network for next location recommendation. In Proceedings of the Web Conference, Ljubljana, Slovenia, 19–23 April 2021; pp. 2177–2185. [Google Scholar]
- Sun, K.; Qian, T.; Chen, T.; Liang, Y.; Nguyen, Q.V.H.; Yin, H. Where to go next: Modeling long-and short-term user preferences for point-of-interest recommendation. Proc. AAAI Conf. Artif. Intell. 2020, 34, 76–80. [Google Scholar] [CrossRef]
- Liu, X.; Yang, Y.; Xu, Y.; Yang, F.; Huang, Q.; Wang, H. Real-time POI recommendation via modeling long-and short-term user preferences. Neurocomputing 2022, 467, 454–464. [Google Scholar] [CrossRef]
- Chen, M.; Li, W.-Z.; Qian, L.; Lu, S.-L.; Chen, D.-X. Next POI recommendation based on location interest mining with recurrent neural networks. J. Comput. Sci. Technol. 2020, 35, 603–616. [Google Scholar] [CrossRef]
- Wang, H.; Li, P.; Liu, Y.; Shao, J. Towards Real-time Demand-aware Sequential POI Recommendation. Inf. Sci. 2021, 547, 482–497. [Google Scholar] [CrossRef]
- Xu, C.; Ding, A.S.; Zhao, K. A novel POI recommendation method based on trust relationship and spatial–temporal factors. Electron. Commer. Res. Appl. 2021, 48, 101060. [Google Scholar] [CrossRef]
- Agrawal, S.; Roy, D.; Mitra, M. Tag embedding based personalized point of interest recommendation system. Inf. Process. Manag. 2021, 58, 102690. [Google Scholar] [CrossRef]
- Chopde, N.R.; Nichat, M. Landmark based shortest path detection by using A* and Haversine formula. Int. J. Innov. Res. Comput. Commun. Eng. 2013, 1, 298–302. [Google Scholar]
- Yang, D.; Qu, B.; Yang, J.; Cudre-Mauroux, P. Revisiting user mobility and social relationships in lbsns: A hypergraph embedding approach. In Proceedings of the WWW’19: The World Wide Web Conference, San Francisco, CA, USA, 13–17 May 2019; pp. 2147–2157. [Google Scholar]
- Cho, K.; Van Merriënboer, B.; Gulcehre, C.; Bahdanau, D.; Bougares, F.; Schwenk, H.; Bengio, Y. Learning phrase representations using RNN encoder-decoder for statistical machine translation. arXiv 2014, arXiv:1406.1078. [Google Scholar]
- Liu, Q.; Wu, S.; Wang, L.; Tan, T. Predicting the next location: A recurrent model with spatial and temporal contexts. In Proceedings of the Thirtieth AAAI Conference on Artificial Intelligence, Phoenix, AZ, USA, 12–17 February 2016. [Google Scholar]
- Xi, D.; Zhuang, F.; Liu, Y.; Gu, J.; Xiong, H.; He, Q. Modelling of bi-directional spatio-temporal dependence and users’ dynamic preferences for missing poi check-in identification. Proc. AAAI Conf. Artif. Intell. 2019, 33, 5458–5465. [Google Scholar] [CrossRef] [Green Version]
- Low, R.; Tekler, Z.D.; Cheah, L. An End-to-End Point of Interest (POI) Conflation Framework. ISPRS Int. J. Geo. Inf. 2021, 10, 779. [Google Scholar] [CrossRef]
- Tekler, Z.D.; Low, R.; Gunay, B.; Andersen, R.K.; Blessing, L. A scalable Bluetooth Low Energy approach to identify occupancy patterns and profiles in office spaces. Build. Environ. 2020, 171, 106681. [Google Scholar] [CrossRef]
| Publisher’s Note: MDPI stays neutral with regard to jurisdictional claims in published maps and institutional affiliations. |
© 2022 by the authors. Licensee MDPI, Basel, Switzerland. This article is an open access article distributed under the terms and conditions of the Creative Commons Attribution (CC BY) license (https://creativecommons.org/licenses/by/4.0/).


