Article

HDRLM3D: A Deep Reinforcement Learning-Based Model with Human-like Perceptron and Policy for Crowd Evacuation in 3D Environments

1
National Engineering Research Center for Geoinformatics, Aerospace Information Research Institute, Chinese Academy of Sciences, Beijing 100094, China
2
University of Chinese Academy of Sciences, Beijing 100049, China
3
Zhejiang-CAS Application Center for Geoinformatics, Jiaxing 314199, China
4
State Key Laboratory of Resources and Environmental Information System, Institute of Geographic Sciences and Natural Resources Research, CAS, Beijing 100101, China
5
School of Surveying and Geo-Informatics, Shandong Jianzhu University, Jinan 250101, China
*
Author to whom correspondence should be addressed.
ISPRS Int. J. Geo-Inf. 2022, 11(4), 255; https://doi.org/10.3390/ijgi11040255
Submission received: 28 February 2022 / Revised: 28 March 2022 / Accepted: 8 April 2022 / Published: 13 April 2022

Abstract

:
At present, a common drawback of crowd simulation models is that they are mainly simulated in (abstract) 2D environments, which limits the simulation of crowd behaviors observed in real 3D environments. Therefore, we propose a deep reinforcement learning-based model with human-like perceptron and policy for crowd evacuation in 3D environments (HDRLM3D). In HDRLM3D, we propose a vision-like ray perceptron (VLRP) and combine it with a redesigned global (or local) perceptron (GOLP) to form a human-like perception model. We propose a double-branch feature extraction and decision network (DBFED-Net) as the policy, which can extract features and make behavioral decisions. Moreover, we validate our method’s ability to reproduce typical phenomena and behaviors through experiments in two different scenarios. In scenario I, we reproduce the bottleneck effect of crowds and verify the effectiveness and advantages of HDRLM3D by comparing it with real crowd experiments and classical methods in terms of density maps, fundamental diagrams, and evacuation times. In scenario II, we reproduce agents’ navigation and obstacle avoidance behaviors and demonstrate the advantages of HDRLM3D for crowd simulation in unknown 3D environments by comparing it with other deep reinforcement learning-based models in terms of trajectories and numbers of collisions.

1. Introduction

As a typical interdisciplinary problem, crowd evacuation involving certain behavior patterns is affected by many factors, such as the crowd, building structures, and emergencies. It has also become an important research direction for geographic information systems (GISs). Today, many approaches, such as accident investigations (carried out through questionnaires [1,2], interviews [2], and videos [3,4]), animal experiments [5,6,7], real crowd experiments [8,9], virtual crowd experiments [10,11], and crowd simulations have been widely used in crowd evacuation modeling. However, due to the lack of real data and the difficulty of experimental organization, many phenomena and laws that arise during the interaction between crowds and their environment can only be studied by the method of crowd simulation [12]. Therefore, crowd simulations, especially crowd simulation models, have become a hotspot and frontier of current crowd evacuation research.
In the past few decades, many different crowd simulation models have been established. In terms of modeling scale, these models can be roughly divided into two types: macroscopic and microscopic models. Macroscopic models mainly model the overall behavior of crowds, and they consider the relationship between macroscopic features such as density, velocity, and flow, but do not consider individual movement and behavior. Therefore, they are more suitable for modeling the behavior of large-scale crowds. Typical macroscopic models include fluid-dynamic models [13], regression models [14], route-choice models [15], and queuing models [16]. Microscopic models take the individual as the basic unit of modeling and express the behavior of crowds by simulating the movement of individuals and the interaction between individuals. Compared with macroscopic models, they pay more attention to the expression of microscopic features such as individual position and velocity. Typical microscopic models include cellular automata models [17], lattice gas models [18], social force models [19], and agent-based models [20].
Thanks to the rapid development of artificial intelligence, agent-based models, especially deep reinforcement learning-based models (DRLMs), have received more attention due to their unique advantages. Torrey proposed a crowd simulation method based on multiagent reinforcement learning to simulate students’ behavior between classes and concluded that RL agents can produce more unpredictable and diversified behavior than rule-based agents [21]. Martinez-Gil proposed the multiagent reinforcement-learning-based pedestrian simulation framework (MARL-Ped) and verified the effectiveness of the framework through experiments [22]. Moreover, through additional experiments, the capability of the framework to generate emergent collective behaviors and its robustness when scaling in the number of agents were investigated [23]. Lee proposed an agent-based deep reinforcement learning approach, which enables agents to navigate in various complex scenarios with only a simple reward function [24]. Sun proposed an approach that uses algorithms such as proximal policy optimization (PPO), long short-term memory (LSTM) and velocity obstacles (VO) to solve the problem of crowd navigation in an unknown and dynamic environment [25]; Baker proved that simple game rules, multiagent competition, and standard reinforcement learning algorithms at scale can induce agents to learn complex strategies and skills [26].
At present, DRLMs have made remarkable progress, but they still have many shortcomings. Similar to traditional microscopic models, a common limitation of DRLMs at present is that they can only simulate crowd behaviors in two-dimensional environments [21,22,23,24]. Although some DRLMs support crowd simulation in three-dimensional environments, their computation process still occurs in two-dimensional space [25,27]. The inadequacy of the perceptron and policy is the main reason for this drawback. Currently, some crowd simulation models belonging to mathematical (or physical) models consider the individuals’ visibility domain [28,29,30,31,32]. However, due to the limitation of computing power, the global (or local) perceptron and the ray perceptron are still the most commonly used perceptrons in DRLMs compared with the image perceptron which is most similar to human vision, and they still have some drawbacks such as an inappropriate range (type) of perceived objects. For example, agents can obtain all information with only a global (or local) perceptron in some DRLMs [21,22,23]; the perceptual rays of agents are only at the same level and beyond the horizontal range of human vision in some DRLMs [24,25,26,27]. Due to the insufficiency of the perceptron, the policy of DRLMs reduces dimensions or adopts unified coding to process different types of environmental information, which causes the loss of relevant spatial information. Moreover, due to the limitation of computing power, it is still difficult to simulate large-scale crowds with only deep reinforcement learning. Therefore, DRLMs are generally combined with traditional microscopic models or observational data at present [25,33,34].
To overcome the above drawbacks, we propose a deep reinforcement learning-based model with human-like perceptron and policy for crowd evacuation in 3D environments (HDRLM3D). In HDRLM3D, we propose a vision-like ray perceptron (VLRP) and combine it with a redesigned global (or local) perceptron (GOLP) to form a human-like perception model. We propose a double-branch feature extraction and decision network (DBFED-Net) as the policy, which can extract features and make behavioral decisions. Moreover, we carry out experiments in two different scenarios, and through the analysis and comparison of the experimental results, we verify the effectiveness and advantages of HDRLM3D in the simulation of typical phenomena and behaviors. The remainder of this paper is organized as follows: Section 2 introduces our method in detail. Section 3 describes the experiments and discusses the experimental results. Section 4 presents the conclusions of this study.

2. Methods

2.1. Framework

Figure 1 shows the basic framework of HDRLM3D, which includes three main parts: Agent, Environment, and Interactions. In this framework, the learners or decision-makers are collectively called the Agent. Except for the Agent itself, all objects that can interact with the Agent are collectively called the Environment. In addition, there are three types of Interactions between the Agent and Environment: State, Reward, and Action. In each step of HDRLM3D, the Agent can obtain the State S t of the Environment and take a certain Action A t . The Environment will change accordingly so that the Agent can not only receive a certain Reward R t but also obtain a new State S t + 1 . Moreover, the learning goal of the Agent is to maximize the cumulative mathematical expectation of the Reward.

2.2. Agent

2.2.1. Avatar

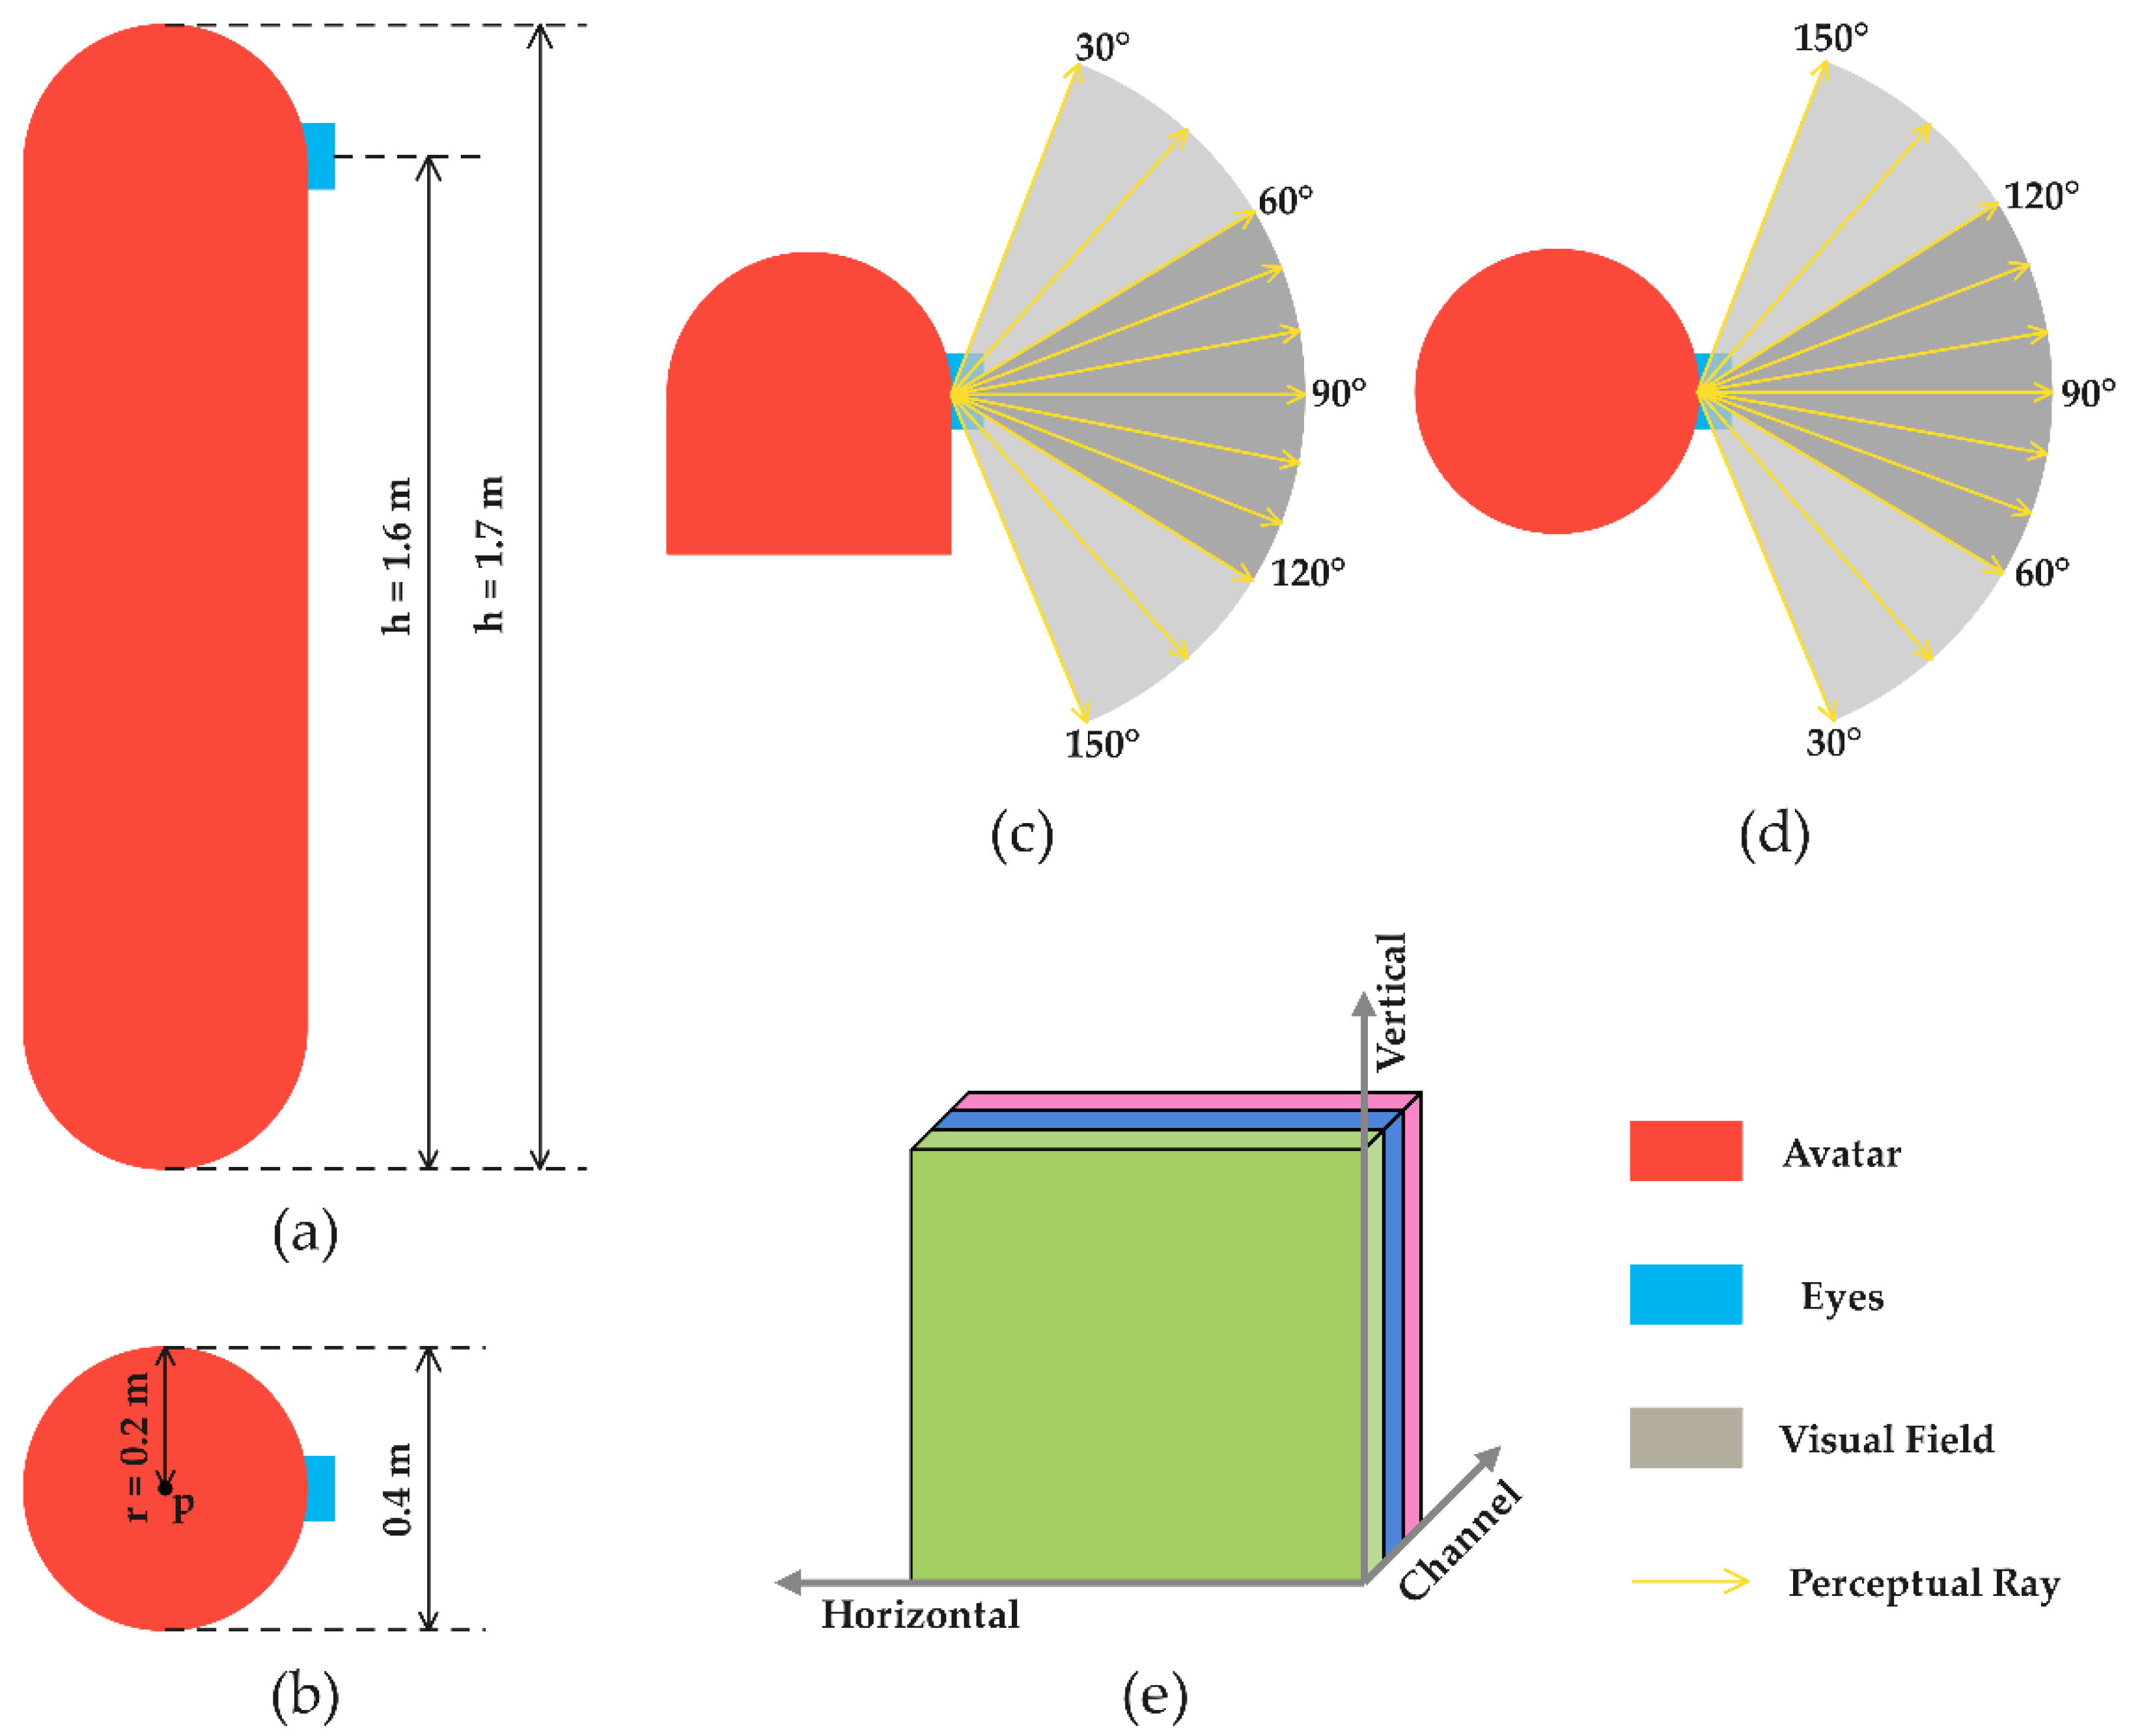
Currently, there are many ways to model the avatars of agents. For example, in two-dimensional space, the avatar of an agent is commonly represented as a circle or a square; in three-dimensional space, it is commonly represented as a capsule, a cylinder, or a cube; there are also instances in which the avatar is represented by a human model [35]. As shown in Figure 2a,b, in three-dimensional space, we regard the avatar as a capsule, which can be abstractly expressed as ( p , r , θ , h ) . p , r , θ , and h represent the position, radius, direction, and height of the avatar, respectively. According to the common size of the human body, we set r and h to 0.2   m [33,36] and 1.7   m , set the agents’ eyes at a height of 1.6   m ( h = 1.6   m ), and set the direction of the avatar to be consistent with that of the eyes. Moreover, we set up a capsule collider, which is the same size as the avatar, so that agents can interact with the environment through it.

2.2.2. Perceptron

In this section, we propose a vision-like ray perceptron and combine it with a redesigned global (or local) perceptron to form a human-like perception model.
(1)
Global (or local) perceptron
The GOLP is an extremely simple and important perceptron, and agents can perceive all environmental information only through it in many agent-based models. However, it still has some drawbacks, such as an inappropriate range (type) of perceived objects. To solve these problems, we redesign the GOLP, which can only obtain two kinds of information: personal information and known environmental information. The personal information mainly includes the agent’s own position, direction, and speed. The known environmental information is mainly the relevant environmental information that is given to the agent in advance, such as the position and direction of the target. As shown in Equation (1), we encode all information as a vector. Here, ( x p , y p , z p ) , ( x θ , y θ , z θ ) , and s represent the position, direction, and speed of the agent at the current moment, respectively. ( x d , y d , z d ) represents the position of the target. Moreover, the above values must be normalized accordingly to keep them within the range of [ 1 ,   1 ] .
{ x p , y p , z p , x θ , y θ , z θ , s , , x d , y d , z d , }
(2)
Vision-like ray perceptron
The ray perceptron is also the most commonly used perceptron in agent-based models, but it still has disadvantages such as an improper perceived range and a lack of spatial information. To overcome these problems, we propose a VLRP. As shown in Figure 2c,d, referring to the field of human vision, we set the field of the agents’ vision in both the vertical and horizontal directions to [30°, 150°] and set [60°, 120°] as the sensitive field of the agents’ vision. Starting from the agents’ eyes, we set many perceptual rays in the field of the agents’ vision and set more perceptual rays in the sensitive field. According to the complexity of the environment, we can set the number of perceptual rays vertically and horizontally to improve the computing performance.
As shown in Figure 2e, based on the above settings, we encode all environmental information obtained by the perceptual rays into a matrix that consists of three dimensions: Vertical, Horizontal, and Channel. The Vertical and Horizontal dimensions represent the position of the perceptual rays in the vertical and horizontal directions, and the Channel dimension represents the type of environmental information obtained by the perceptual rays. In this paper, perceptual rays obtain only two types of environmental information: the classes of objects and the distances between the agent and objects, and they also need to be normalized accordingly to keep them in the range of [ 0 ,   1 ] .

2.3. Interactions

2.3.1. State

In HDRLM3D, as shown in Equation (2), the state S t obtained by agents at time t mainly includes the internal state s t i n t and the external state s t e x t . The internal state s t i n t obtained through the GOLP is mainly composed of the agents’ own position, speed and direction and related known environmental information, and it is encoded as a vector (Equation (1)) to represent the state of the agents themselves at time t. The external state s t e x t obtained through the VLRP is mainly composed of the classes of objects and the distances between the agent and objects, and it is encoded as a matrix (Figure 2e) to represent the state of the external environment at time t. In this paper, the external environment mainly consists of five kinds of objects: the agent, obstacle, wall, ground, and target.
S t = ( s t i n t , s t e x t )

2.3.2. Action

In a DRLM, the actions of agents can be either continuous or discrete. However, the continuous action space is too large, and using it may cause the DRLM to require more training time or have difficulty converging; this phenomenon is particularly serious in the simulation of large-scale crowds. Therefore, we use discrete actions in HDRLM3D to reduce the training time. As shown in Equation (3), the action A t taken by an agent at time t is composed of two main parts: the rotation angle ω t and the forward speed s t . As shown in Equations (4) and (5), agents can rotate and move through action A t so that the direction θ t + 1 and position p t + 1 of the agents at time t + 1 can be calculated. Δ t represents the time interval between time t and time t + 1 .
A t = ( ω t , s t )
θ t + 1 = θ t + Δ t × ω t
p t + 1 = p t + Δ t × s t

2.3.3. Reward

In HDRLM3D, as shown in Equation (6), the reward R t received by the agents at each step is composed of three main parts: the time reward r t t i m e , the goal reward r t g o a l and the collision reward r t c o l l i s i o n .
R t = r t t i m e + r t g o a l + r t c o l l i s i o n
As shown in Equation (7), the time reward r t t i m e is a value ω t t i m e received by agents at each step to prompt them to explore the environment by selecting actions. ω t t i m e can be either a constant or a variable, and ω t t i m e 0 .
r t t i m e = ω t t i m e
As shown in Equation (8), the goal reward r t g o a l is a value ω t g o a l received by agents at each step to prompt them to select actions according to preset goals. When the agents complete the preset goals within the maximum number of steps, they receive the value ω t g o a l ; otherwise, they do not. ω t g o a l can be either a constant or a variable, and ω t g o a l > 0 .
r t g o a l = { ω t g o a l , i f   g o a l   i s   c o m p l e t e d 0 , o t h e r w i s e
As shown in Equation (9), the collision reward r t c o l l i s i o n is a value ω t c o l l i s i o n received by the agents at each step to prompt them to avoid obstacles. When agents collide with other objects in the environment, they receive a value of ω t c o l l i s i o n ; otherwise, they do not. ω t c o l l i s i o n can be either a constant or a variable, and ω t c o l l i s i o n 0 . Moreover, the class of the object colliding with the agent can also result in different values of ω t c o l l i s i o n .
r t c o l l i s i o n = { ω t c o l l i s i o n , i f   a   c o l l i s i o n   o c c u r s 0 , o t h e r w i s e

2.4. Deep Reinforcement Learning

Deep reinforcement learning (DRL) is the core of DRLMs. Compared with other DRL algorithms, PPO is easier to implement and adjust and has better sample complexity [37]. PPO belongs to the actor-critic algorithm in DRL, which maximizes the cumulative reward by iteratively updating the policy π θ and the value function V . PPO maintains two neural networks, one for π θ and the other for V . Their input is the state S t obtained by the agents, and the output of π θ is the agents’ action A t . As an important part of PPO, π θ realizes the mapping from S t to A t . In our method, PPO is the basis of HDRLM3D, and it directly determines the entire learning or decision-making process of the agents. This process is consistent with the basic framework of HDRLM3D (Section 2.1). In HDRLM3D, the agents obtain the state S t through the human-like perceptron, and π θ takes the S t as input. Therefore, we focus on improving the π θ of PPO to adapt it to the S t obtained by the human-like perceptron.

2.4.1. Policy

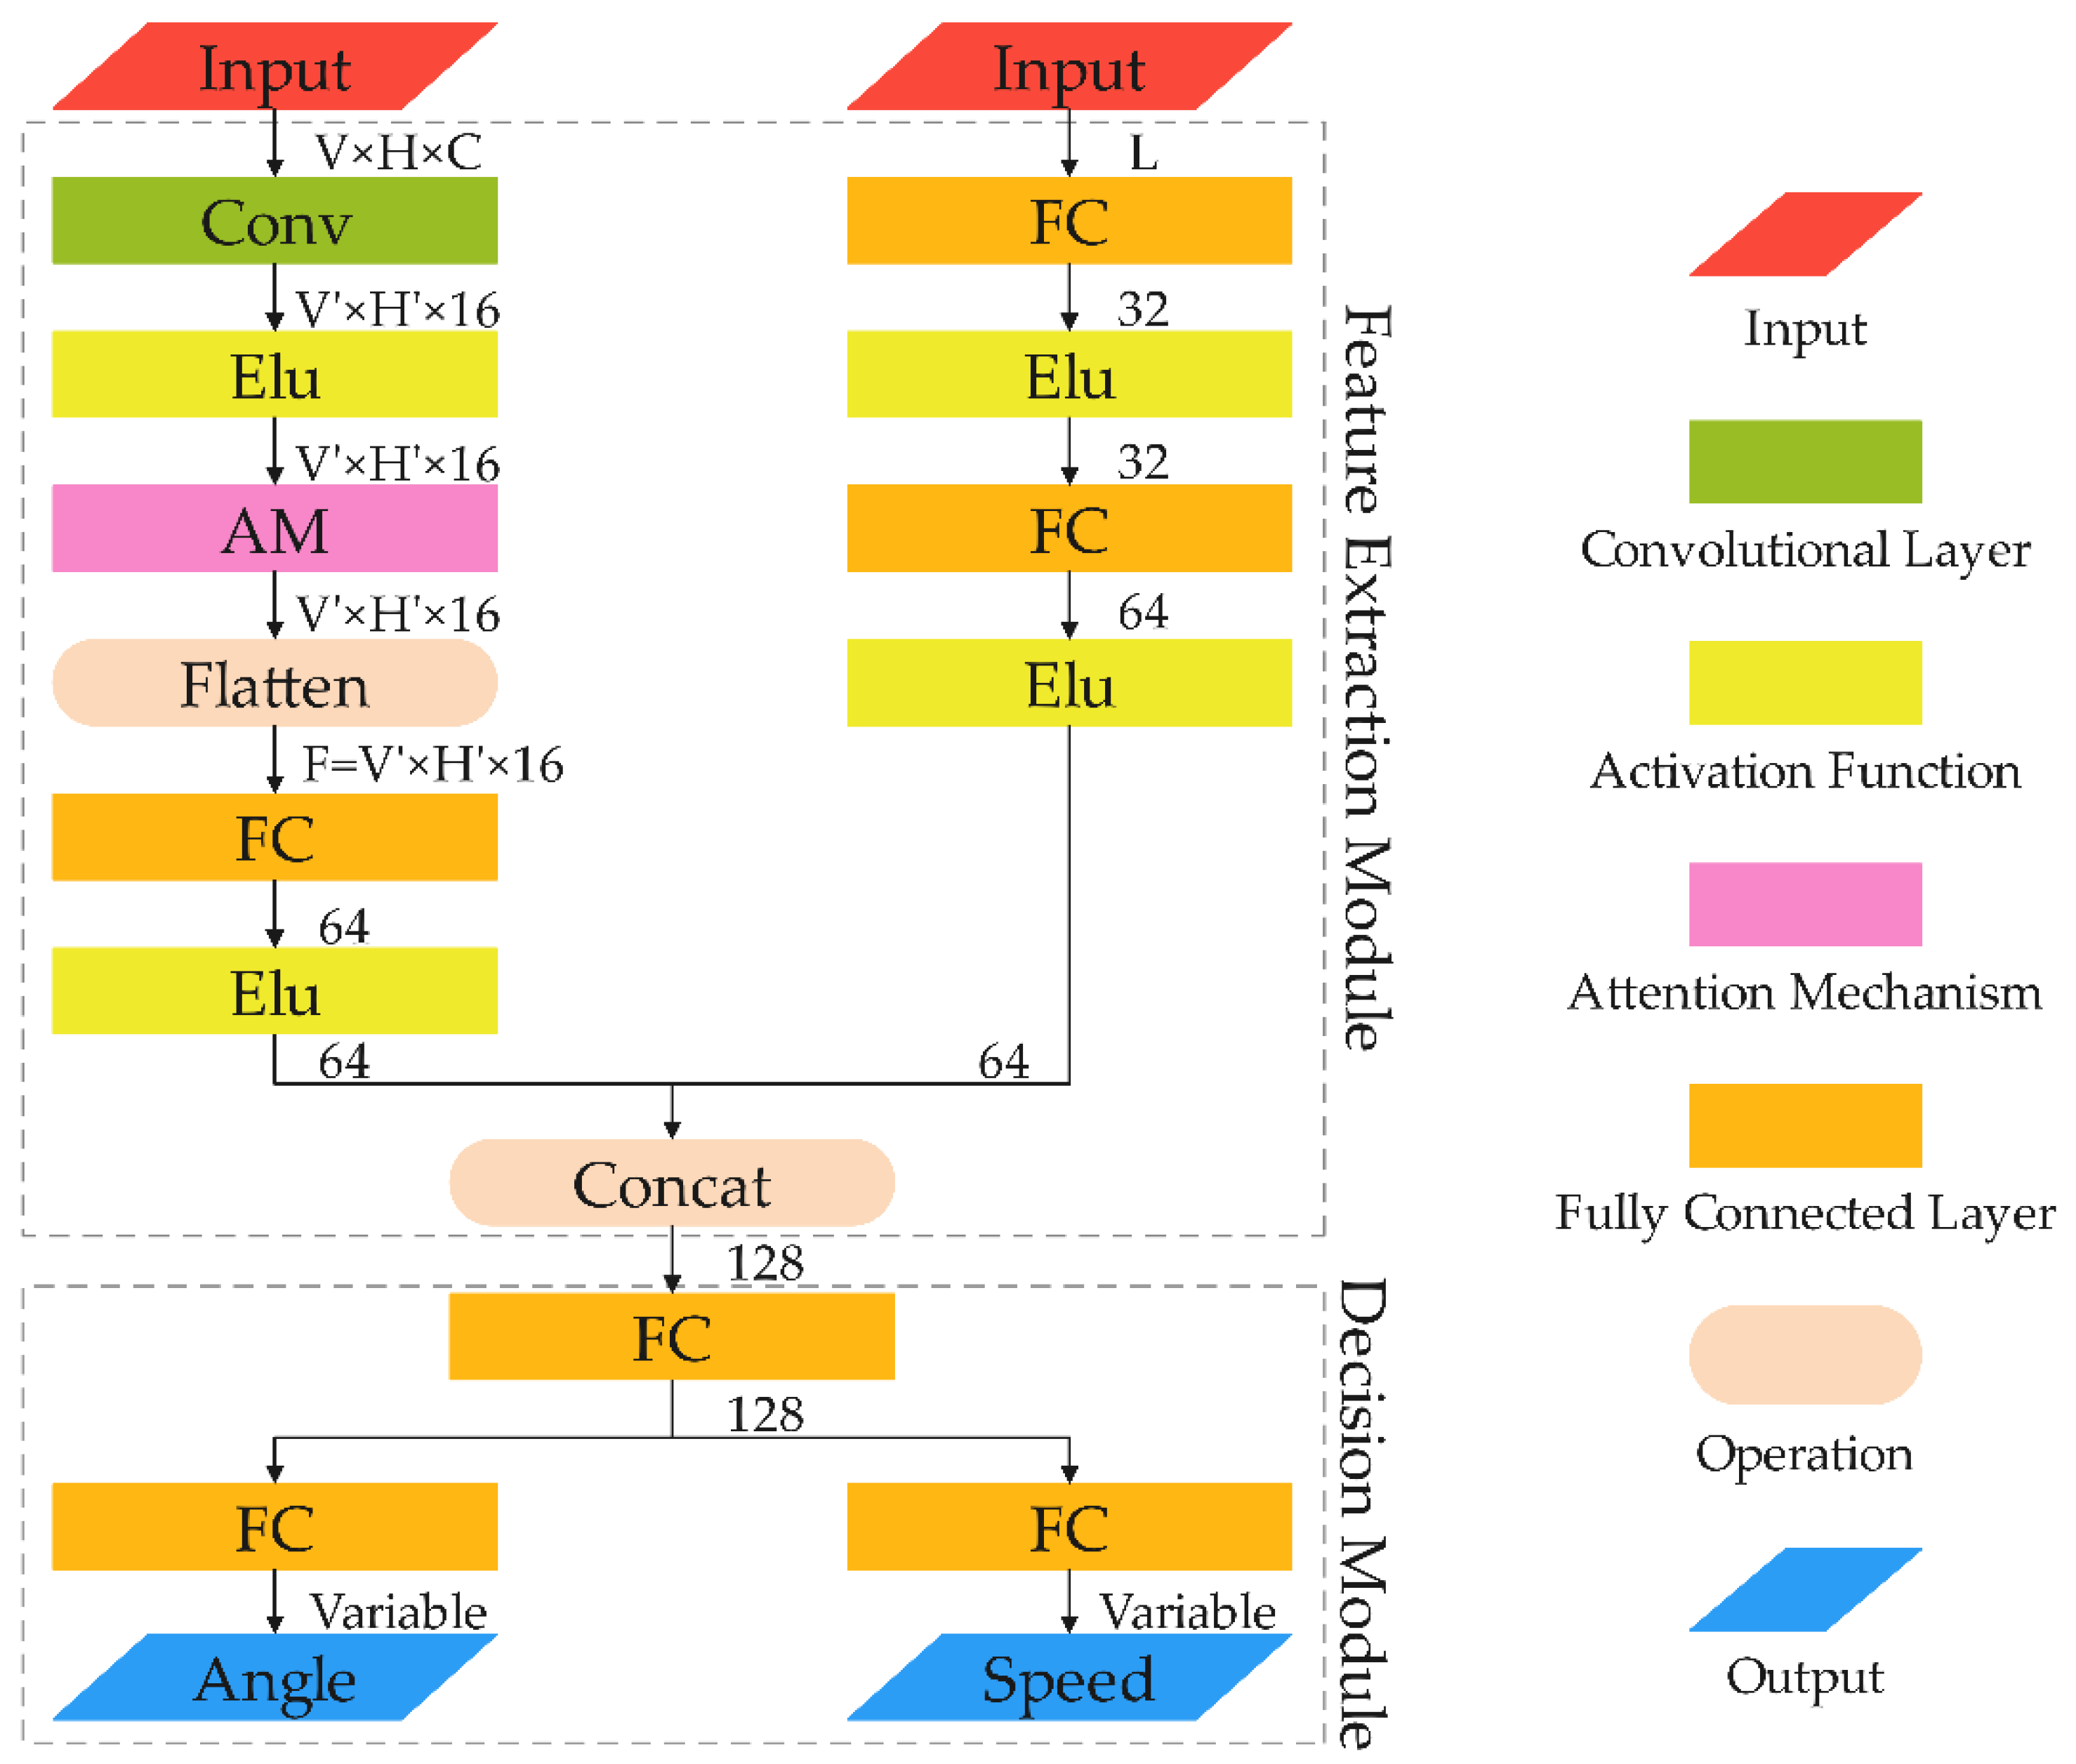
As shown in Figure 3, we design a DBFED-Net as the π θ of PPO. It can extract and integrate all features from the different types of information obtained by different perceptrons and finally apply them to decision-making. Although all agents obtain states and select actions independently, they use the same π θ (the parameters are shared) in HDRLM3D. DBFED-Net is composed of two main parts: a feature extraction module and a decision module.
The feature extraction module aims to extract key features from the input S t (Equation (2)) to help agents make decisions, and it is composed of two main branches. In one branch, s t e x t passes through the convolutional layer, attention mechanism, and fully connected layer to extract the key features of the external environment. In the other branch, s t i n t passes through two fully connected layers to extract the key features of the agents themselves. Then, these features are integrated to generate a feature vector containing all key features. This module mainly uses the activation function e l u .
The decision module can further process the feature vector from the feature extraction module to output the corresponding action A t (Equation (3)), and it is also composed of two main branches. In this module, the feature vector first passes through a fully connected layer to adjust its weight. Then, it passes through two branches, each of which only contains one fully connected layer, to finally output the corresponding ω t and s t . This module does not use other nonlinear activation functions.

2.4.2. Attention Mechanism

Attention plays an extremely important role in the human perception of external environmental information through vision. Similar to human attention, the attention mechanism in deep learning aims to strengthen important features and suppress unimportant features to improve the representation ability of the convolutional neural network (CNN). As shown in Figure 4, we use an attention mechanism (AM) [38], which consists of a channel attention mechanism (CAM) and a spatial attention mechanism (SAM), in DBFED-Net to improve the ability of agents to extract external environmental features. In the AM, the feature map F passes through the CAM and SAM to obtain the weighted feature map F . The overall calculation process is shown in Equations (10) and (11), where * represents elementwise multiplication, M c and M s are the attention maps of the channel and space, and F and F are the middle (CAM) and final (SAM) outputs.
F = M c ( F ) F
F = M s ( F ) F
The CAM can express the relationship between the different channels of the feature map. It automatically assigns different weights to each channel through network learning to strengthen important channels and suppress unimportant channels. In the CAM, we first use max-pooling ( M a x P o o l ) and average-pooling ( A v g P o o l ) to separately aggregate the spatial information of F , and we generate two feature vectors with different important clues: F c m a x and F c a v g . Then, we adjust their weights through two fully connected layers ( F C 4 and F C 16 ), where the weights ( W 0 and W 1 ) are shared between the same fully connected layers. Finally, we generate the channel attention map M c ( F ) by elementwise summation and normalization of the two weight-adjusted feature vectors. The calculation process is shown in Equation (12), where σ represents the activation function s i g m o i d , which plays the role of normalization.
M c ( F ) = S i g m o i d ( F C 16 ( F C 4 ( M a x P o o l ( F ) ) ) + F C 16 ( F C 4 ( A v g P o o l ( F ) ) ) ) = σ ( W 1 ( W 0 ( F c m a x ) ) + W 1 ( W 0 ( F c a v g ) ) )
Unlike the CAM, the SAM can express the relationship between different spaces of the feature map. It also automatically assigns different weights to each space through network learning to strengthen important spaces and suppress unimportant spaces. In the SAM, we first use max-pooling ( M a x P o o l ) and average-pooling ( A v g P o o l ) to separately aggregate the channel information of F , and we generate two feature maps ( F s m a x and F s a v g ) with different important clues. Then, we concatenate them along the channel dimension to generate a feature map [ F s m a x , F s a v g ] . Finally, we generate the spatial attention map M s ( F ) through a convolutional layer ( C o n v ) and the activation function s i g m o i d . The calculation process is shown in Equation (13), where C o n c a t represents the concatenation operation and f represents the convolution operation.
M s ( F ) = S i g m o i d ( C o n v ( C o n c a t ( M a x P o o l ( F ) , A v g P o o l ( F ) ) ) ) = σ ( f ( [ F s m a x , F s a v g ] ) )

3. Experiments and Results

3.1. Experiments

In crowd simulation, the ability to reproduce typical phenomena or behaviors is an important indicator for evaluating a model. Therefore, we design two experiments based on the Unity 3D platform to simulate common situations involving real pedestrians. In this section, we will introduce the experimental scenarios and parameter configurations in detail.

3.1.1. Scenarios

(1)
Scenario I
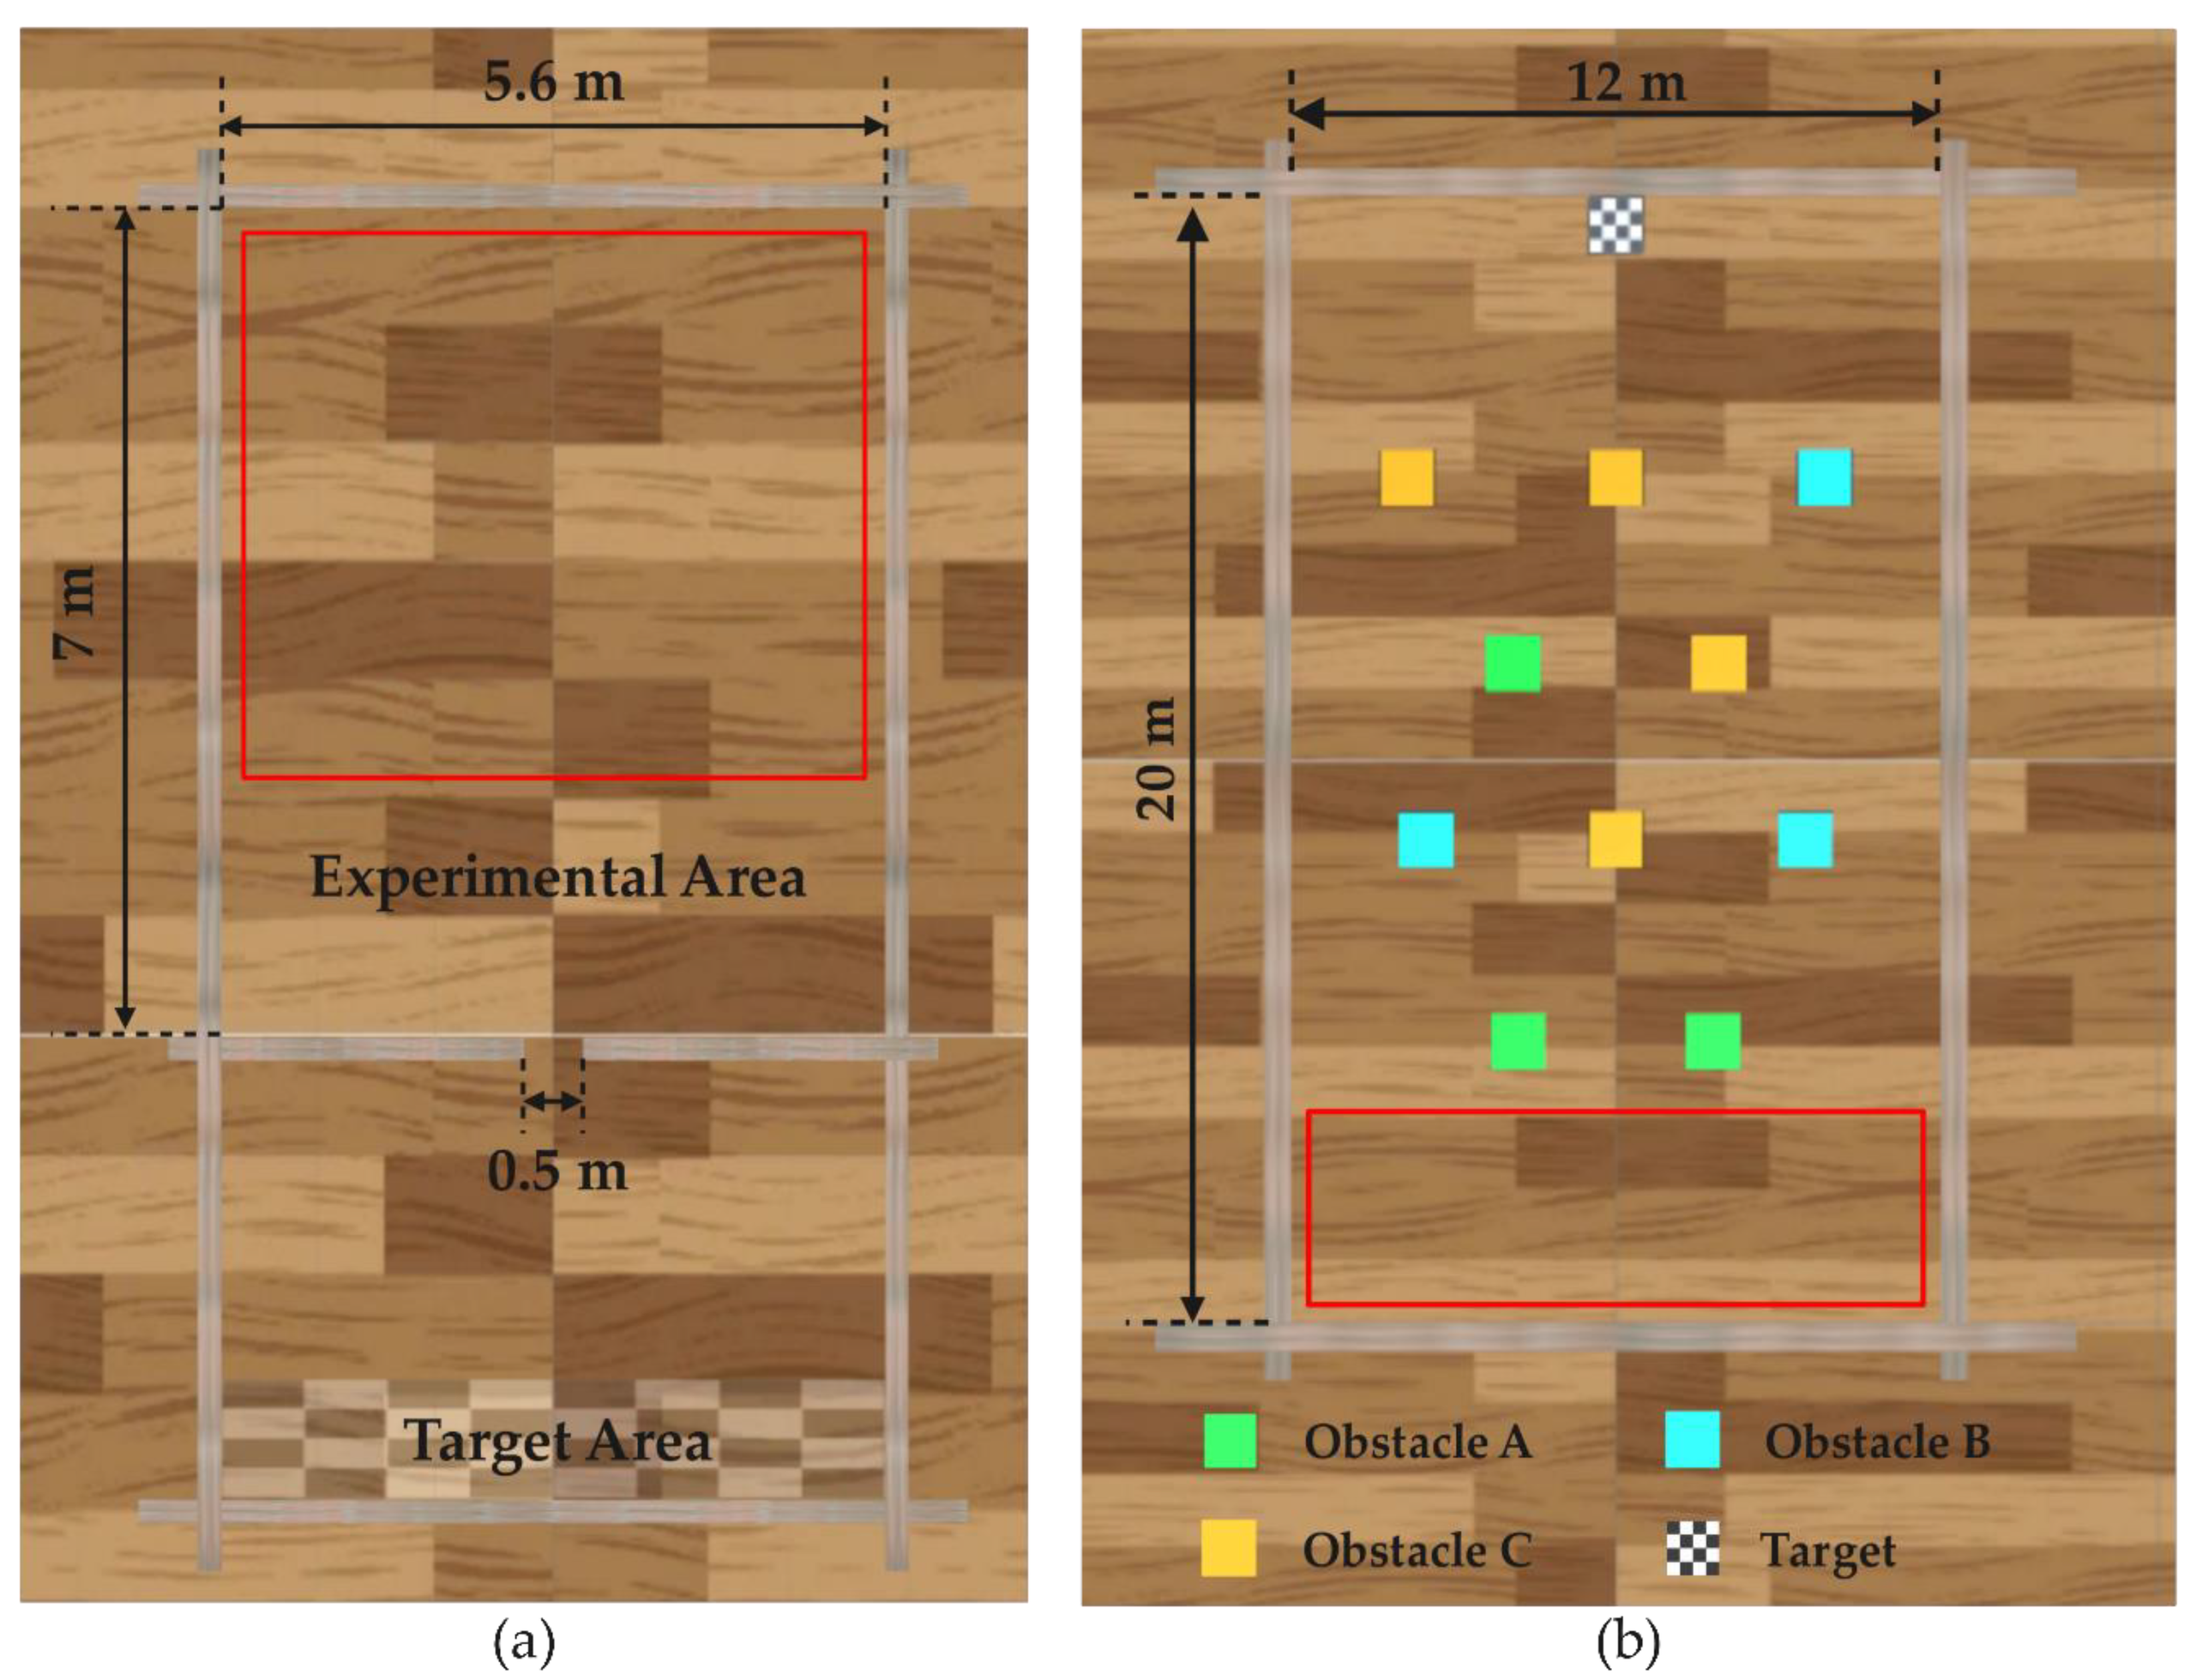
A typical self-organization phenomenon of crowded pedestrians, the bottleneck effect, mostly occurs in narrow exits (or entrances). Moreover, the scenario of a single exit (or entrance), as a common situation for real pedestrians, is found in many public places such as schools, markets, and stations. Therefore, as shown in Figure 5a, we construct scenario I with reference to a real crowd experiment [39] to simulate the bottleneck effect of pedestrians at a single exit. Scenario I is composed of two main parts: the experimental area and the target area. The experimental area is a rectangular area with a size of 5.6   m × 7   m , and it has an exit with a width of 0.5   m . There are seventy-five agents in the experiments (or trainings) in scenario I. Before each experiment (or training), all agents are randomly and uniformly placed within the red rectangle (Figure 5a), and the initial orientation of the agents is also random. Each experiment (or training) ends only when all agents reach the target area, and then all agents can be reinitialized for the next experiment (or training).
(2)
Scenario II
In crowd simulation, navigation and obstacle avoidance are important skills (or behaviors) that agents must possess; that is, the target must be reached without colliding with other obstacles, which mostly occurs in scenarios with obstacles. Moreover, as a common situation for real pedestrians, this scenario is also widely found in public places such as markets and schools. Therefore, as shown in Figure 5b, we construct scenario II to study agents’ navigation and obstacle avoidance. Scenario II is a rectangular area with a size of 12   m × 20   m , where there are ten obstacles and one target. The obstacles can be divided into three categories according to their heights, A (higher than that of the agents), B (slightly lower than that of the agents), and C (lower than that of the agents), and these heights are 2   m , 1.5   m , and 1   m , respectively. The height of the target is 2   m , and the length and width of the target and all obstacles are 1   m . There are twenty agents in the experiments (or trainings) in scenario II. Before each experiment (or training), all agents are randomly and uniformly placed within the red rectangle (Figure 5b), and the initial orientation of the agents is also random. Each experiment (or training) ends only when all agents reach the target, and then all agents can be reinitialized for the next experiment (or training).

3.1.2. Learning

Due to many factors, such as the environment, tasks, and number of agents, it is difficult for a DRLM to have a unified parameter configuration. Because different scenarios have different challenges, we need a concrete the analysis of specific issues to configure the corresponding optimal parameters for the DRLM [22]. As shown in Table 1 and Table 2, for the above scenarios, we configure the parameters of HDRLM3D regarding the agent, interactions and learning parameters to obtain the best experimental (or training) results.

3.2. Results and Discussion

In this section, we analyze the experimental results of the two scenarios and compare HDRLM3D with other crowd simulation methods to demonstrate the effectiveness and advantages of our method.

3.2.1. Scenario I

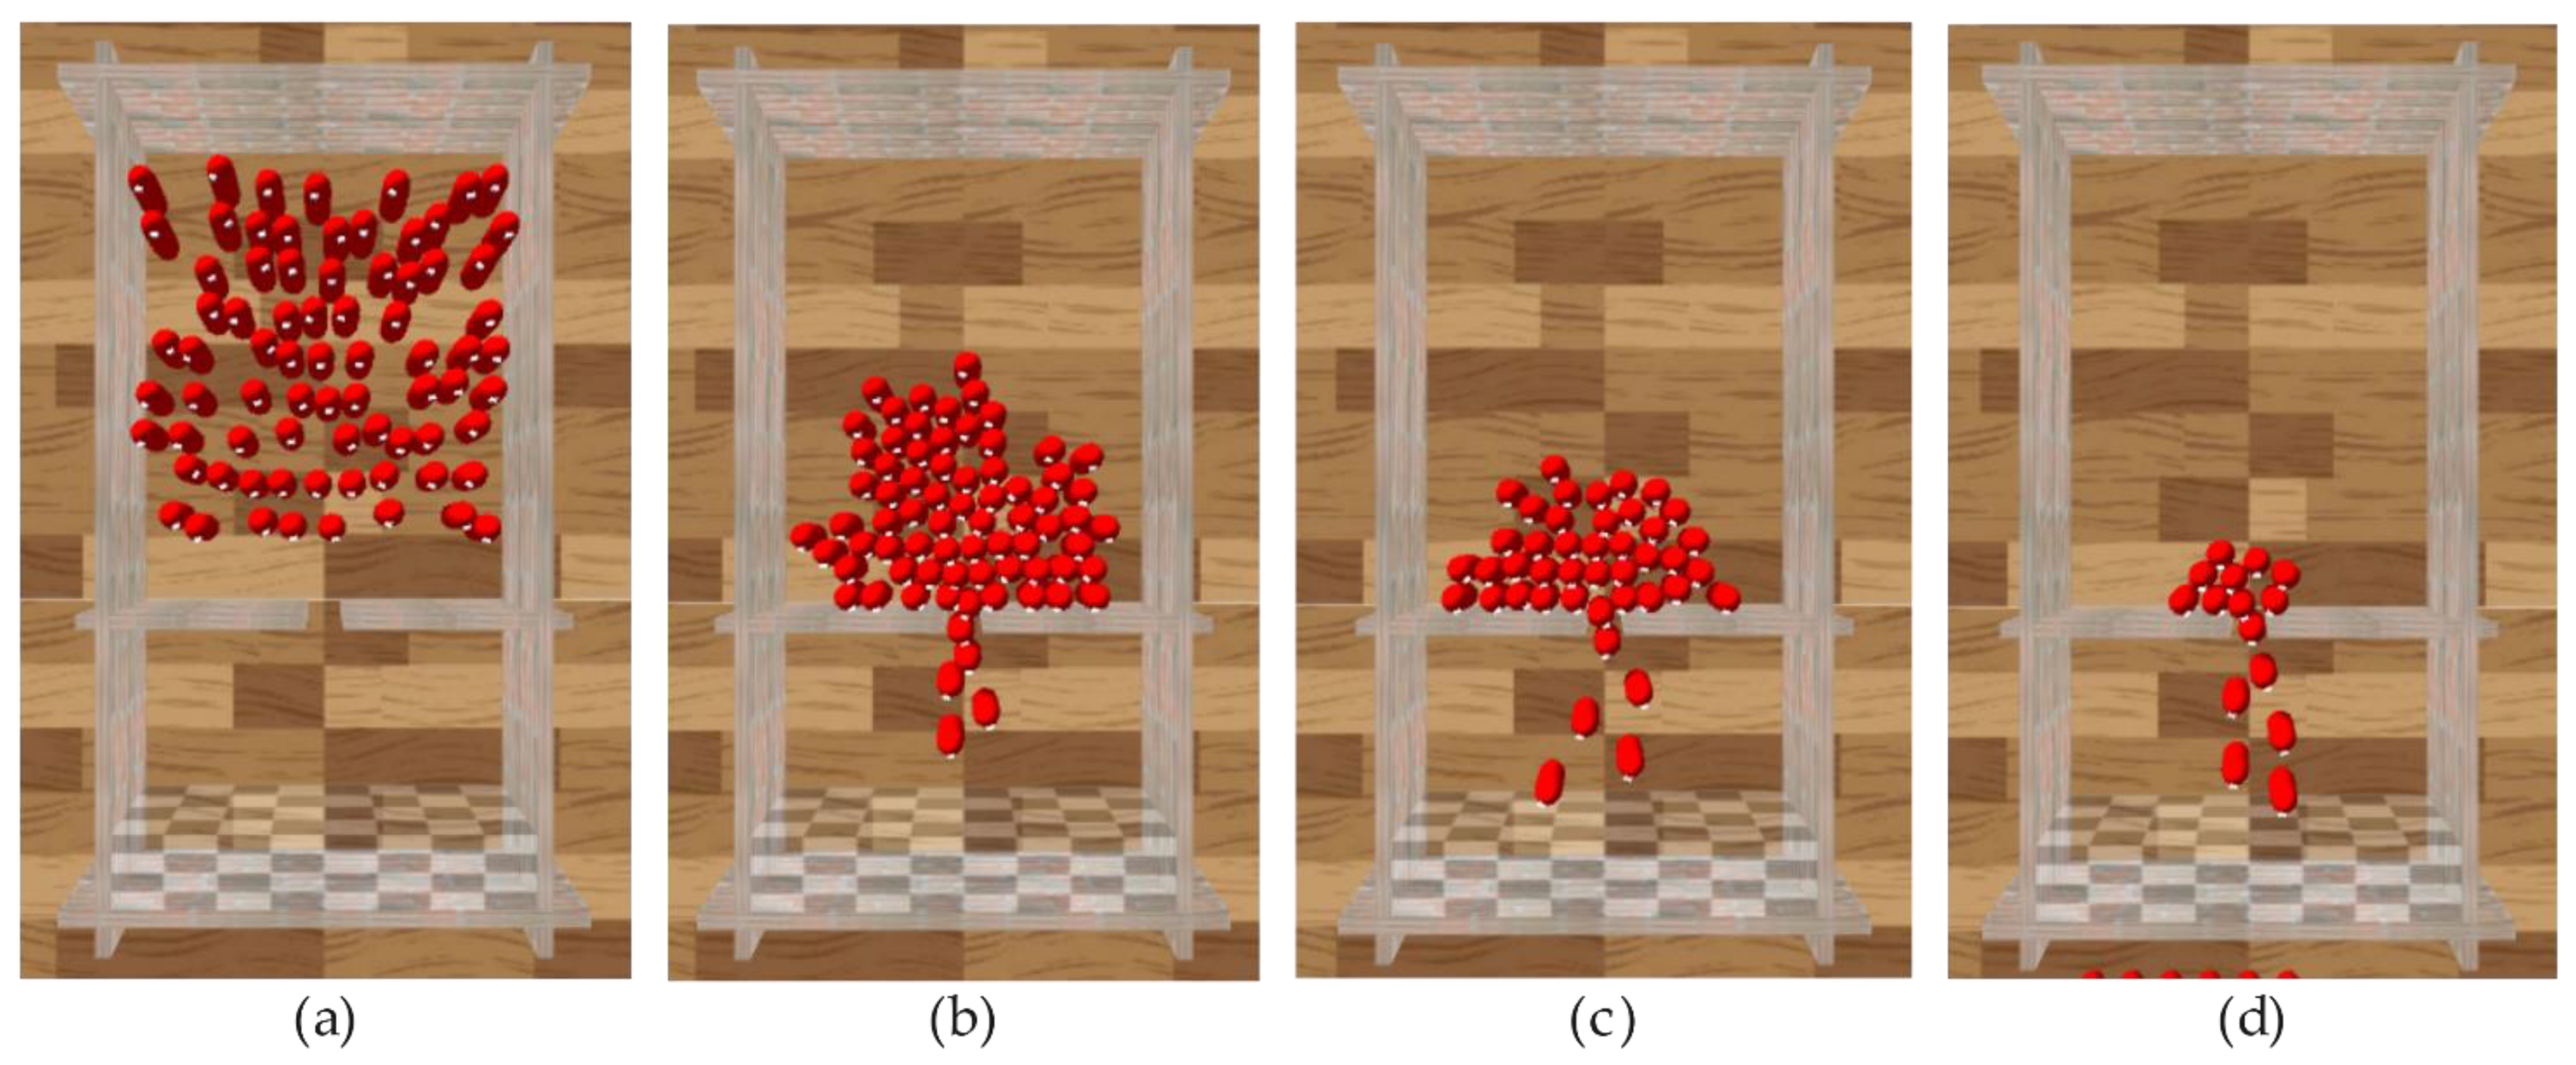
In Figure 6, a temporal sequence of an experimental result in scenario I is shown. During the experiment, all agents move toward the exit (Figure 6a). When the agents arrive at the exit, all agents cannot pass the exit together due to the narrowness of the exit, which causes the congestion of some agents at the exit (Figure 6b). This phenomenon is intuitively manifested in the blocked agents always gathering at the exit; all the agents as a whole take on the shape of an “arch” until they pass the exit (Figure 6c,d). This experimental result is consistent with the characteristics of the bottleneck effect.
(1)
Density map
As one of the basic quantities used to describe the characteristics of pedestrian flow, density can intuitively reflect the occupancy of physical space by pedestrians and can further reveal the movement patterns of pedestrians (such as areas of congestion and paths). Therefore, to verify the validity of the above experimental results, we use a density map to analyze the movement laws of the agents. Moreover, the social force model (SFM) and optimal reciprocal collision avoidance (ORCA) [40], as classic crowd simulation methods, have been widely recognized and applied in the field of crowd simulation. In scenario I, we compare HDRLM3D with SFM and ORCA to demonstrate the advantages of our method.
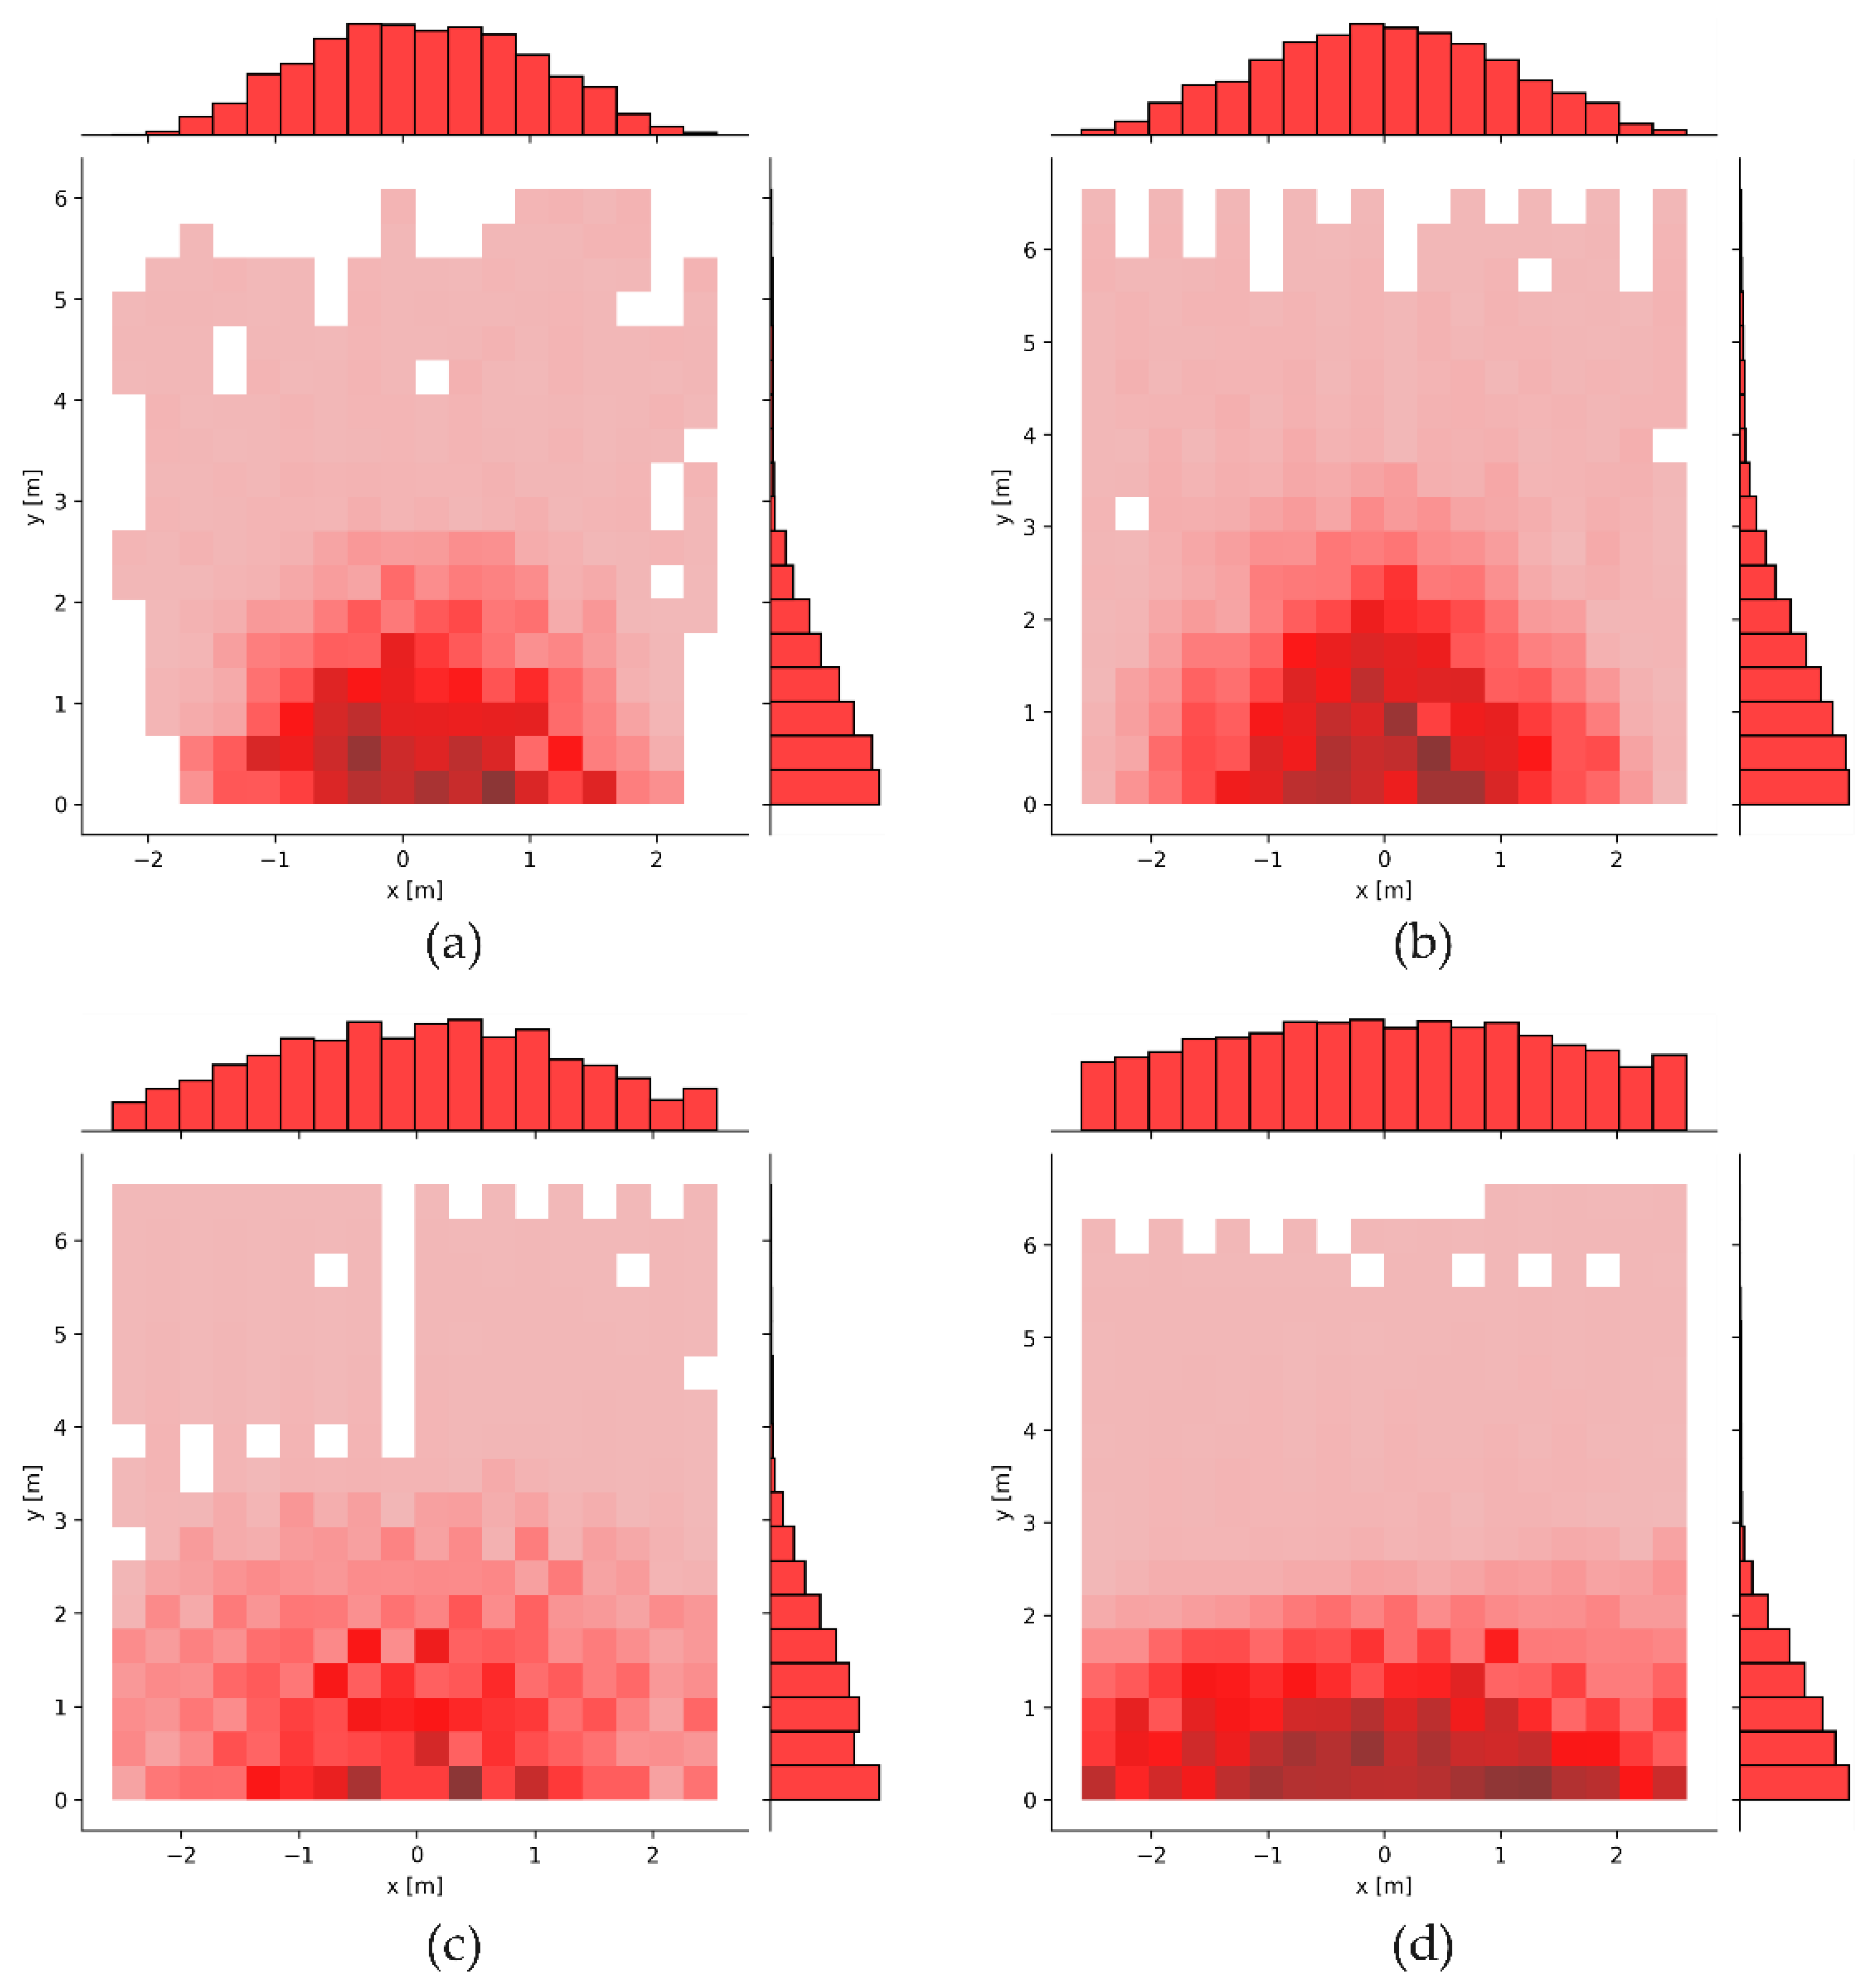
Figure 7a–d show the density maps generated by the real crowd experiment, HDRLM3D, SFM, and ORCA in scenario I, respectively. Taking point ( 0 , 0 ) as the center (exit), the densities gradually decrease from the center to both ends on the x-axis and continuously decrease along the positive direction of the y-axis. These density maps can intuitively reflect the congestion of agents (pedestrians) at the exit, which is represented as an arch. It is worth noting that the arches generated by SFM (Figure 7c) and ORCA (Figure 7d) are relatively flat compared to the arch generated by the real crowd experiment (Figure 7a), while the arch generated by HDRLM3D (Figure 7b) is similar to it.
To further verify the above conclusions, we calculate the mean and standard deviation of the densities along the x-axis. As shown in Table 3, the mean values of the real crowd experiment, HDRLM3D, SFM and ORCA are 0.15 , 0.02 , 0.00 and 0.00 , which proves that the agents (pedestrians) are all congested around the exit. Their standard deviations are 0.86 , 1.03 , 1.23 , and 1.40 , which indicates the flatness of the arches. The order of the results is as follows: real crowd experiment < HDRLM3D < SFM < ORCA. HDRLM3D also suffers from arch flattening, but its results are more similar to those of the real crowd experiment than those of SFM and ORCA.
(2)
Fundamental diagram and evacuation time
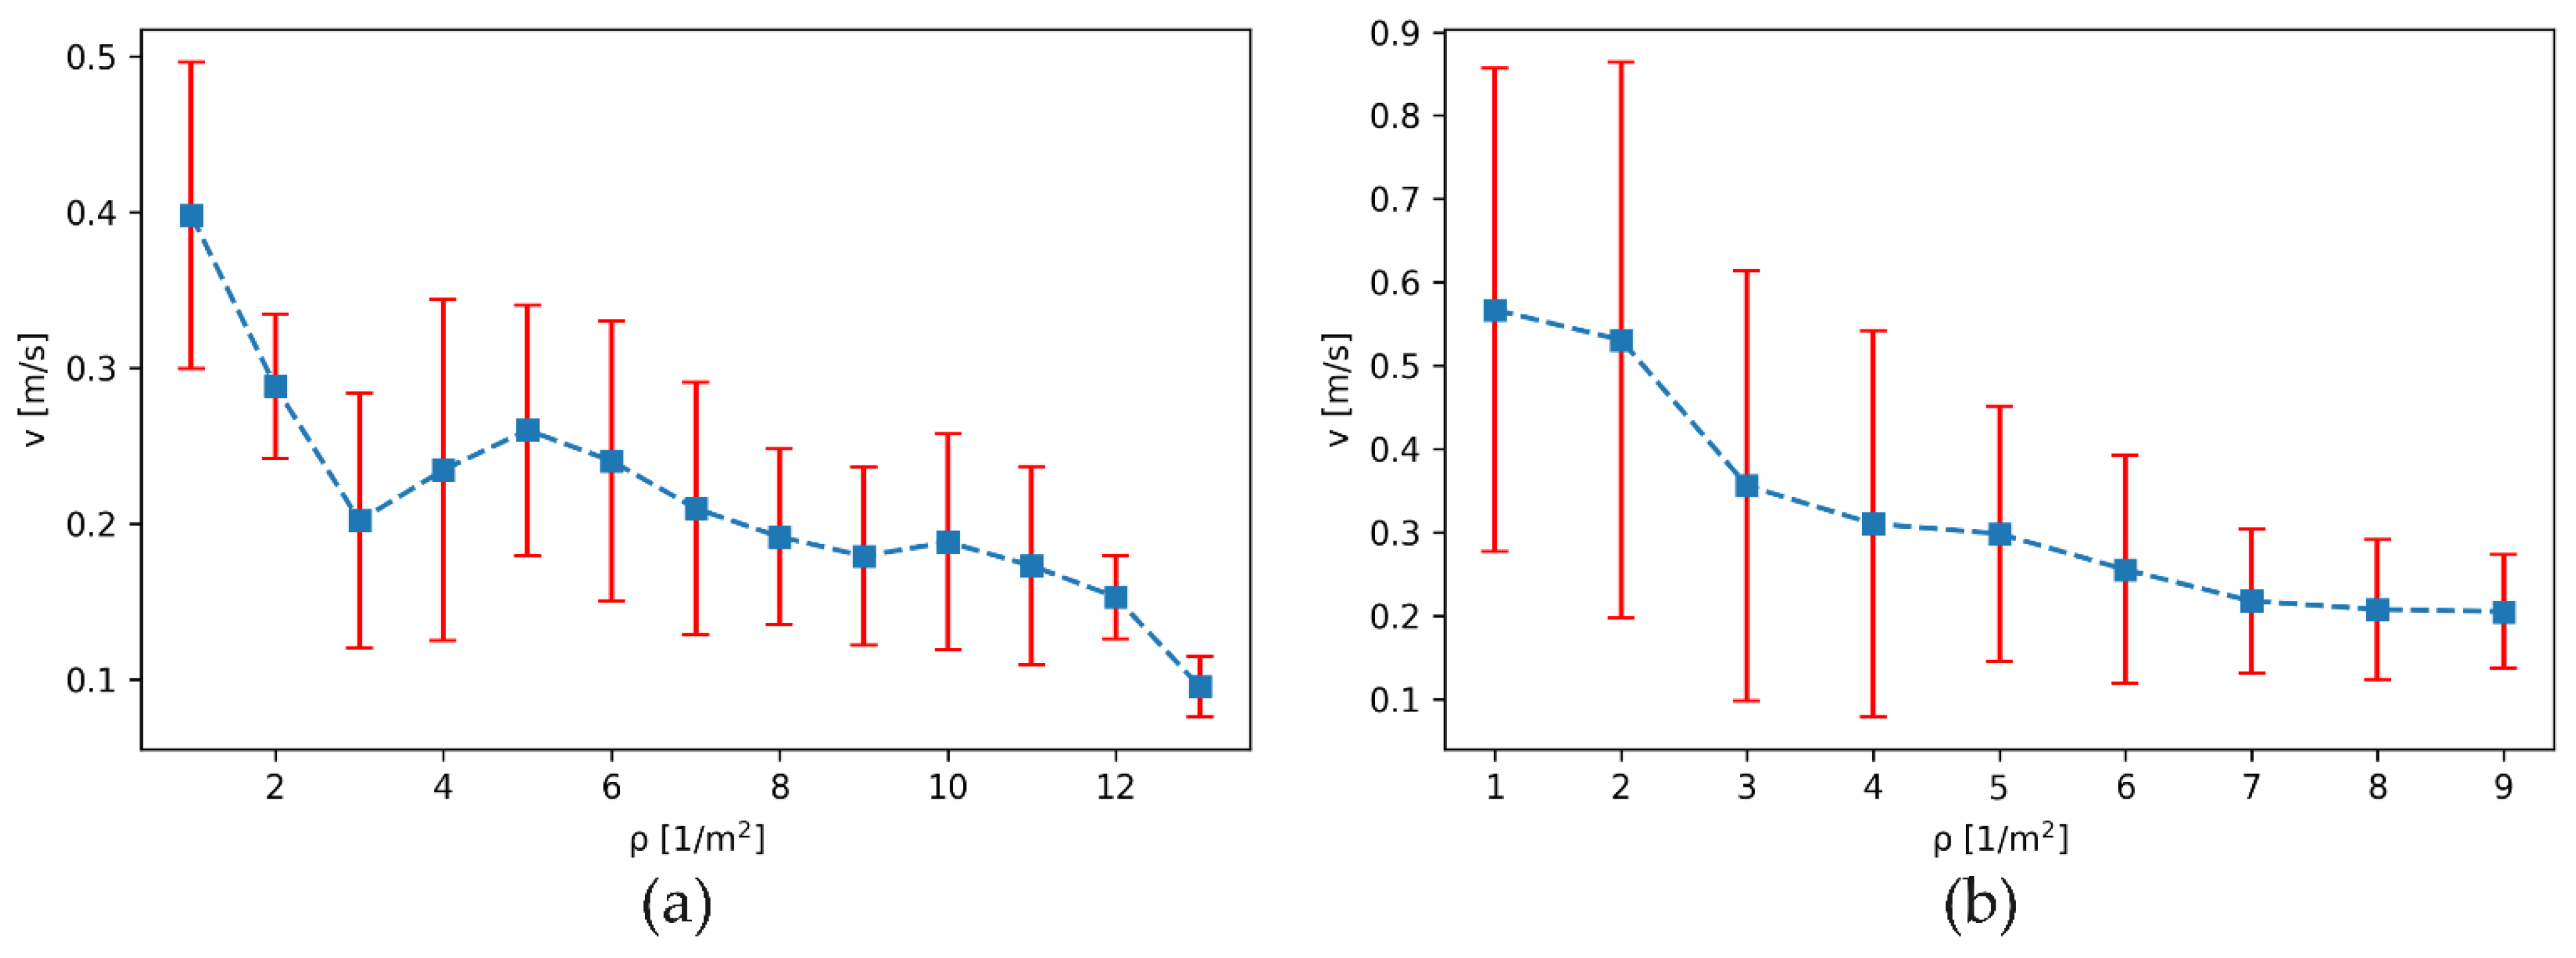
The fundamental diagram is an important test of whether a crowd simulation model is suitable for the description of pedestrian streams [41], which indicates the relation between density and velocity. Therefore, we set up a square area with a side length of 1   m in front of the exit to calculate the density and velocity of the agents (pedestrians). The fundamental diagrams generated by the real crowd experiment and HDRLM3D in scenario I are shown in Figure 8a,b, respectively. Their density and velocity are negatively correlated as a whole; that is, the greater the density is, the lower the velocity, and with increasing density, the decreasing trend of the velocity gradually becomes slower. This conclusion is consistent with the basic characteristics of crowd evacuation [42].
Moreover, our method exhibits some differences from the real crowd experiment. On the one hand, considering personnel safety and the evacuation atmosphere, it is difficult for real crowd experiments to simulate crowd evacuation in emergency situations, and the evacuation motivation of pedestrians is generally low. However, due to the time reward, the evacuation motivation of agents is stronger in HDRLM3D, so the agents’ velocity is slightly higher than the pedestrians’ velocity under the same density. On the other hand, agents cannot squeeze against each other in highly crowded situations due to their own colliders, so their maximum density is lower than the maximum density of pedestrians in the real crowd experiment.
Evacuation time is one of the indicators for evaluating the results of crowd evacuation, and it is also an important method of testing the performance of crowd simulation models. In Table 4, the evacuation times required by the real crowd experiment, HDRLM3D, SFM, and ORCA are displayed. The evacuation time required by HDRLM3D ( 60.54   s ) is the closest to that required by the real crowd experiment ( 63.00   s ) and is slightly shorter than that of the real crowd experiment. This result is consistent with the analysis of the fundamental diagrams. Because the velocity of the agents in HDRLM3D is slightly higher than that of pedestrians in the real crowd experiment, the evacuation time required by HDRLM3D is relatively low. Due to the highly crowded environment and extremely narrow exit, the agents tend to have balanced forces or disordered behavior in SFM and ORCA, so the evacuation times ( 75.76   s and 132.54   s ) they require are much longer than that in the real crowd experiment.

3.2.2. Scenario II

(1)
Experimental results in scenario II
In the case of an unknown environment, that is, when agents cannot obtain environmental information through the GOLP and the reward function does not contain any environmental information, we use the method of [27] and HDRLM3D to train agents in scenario II to obtain the corresponding training model and then conduct comparative experiments.
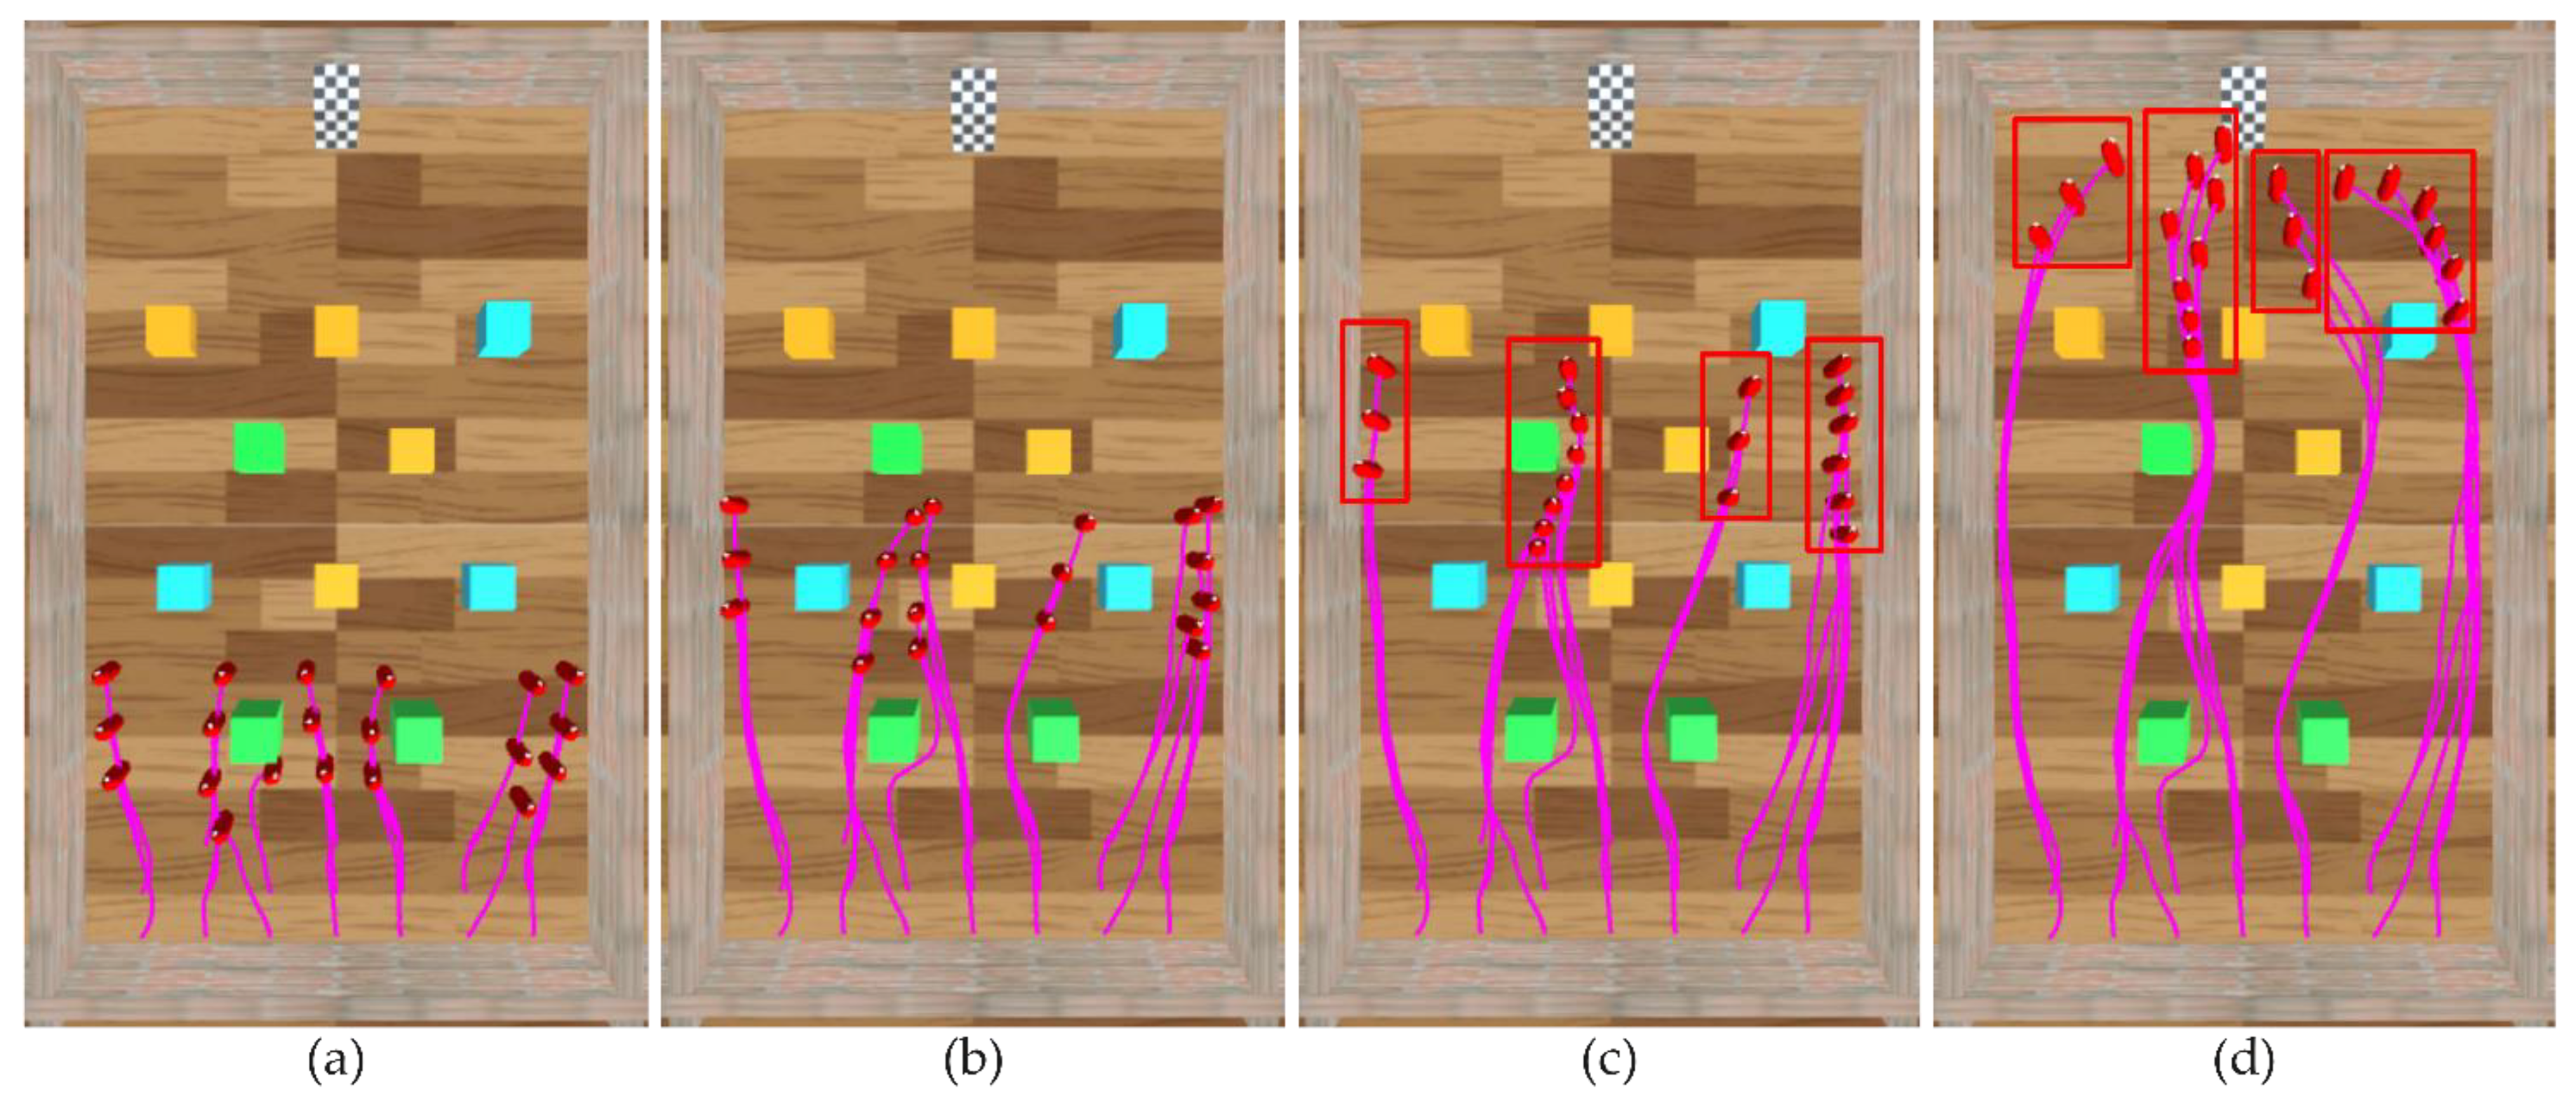
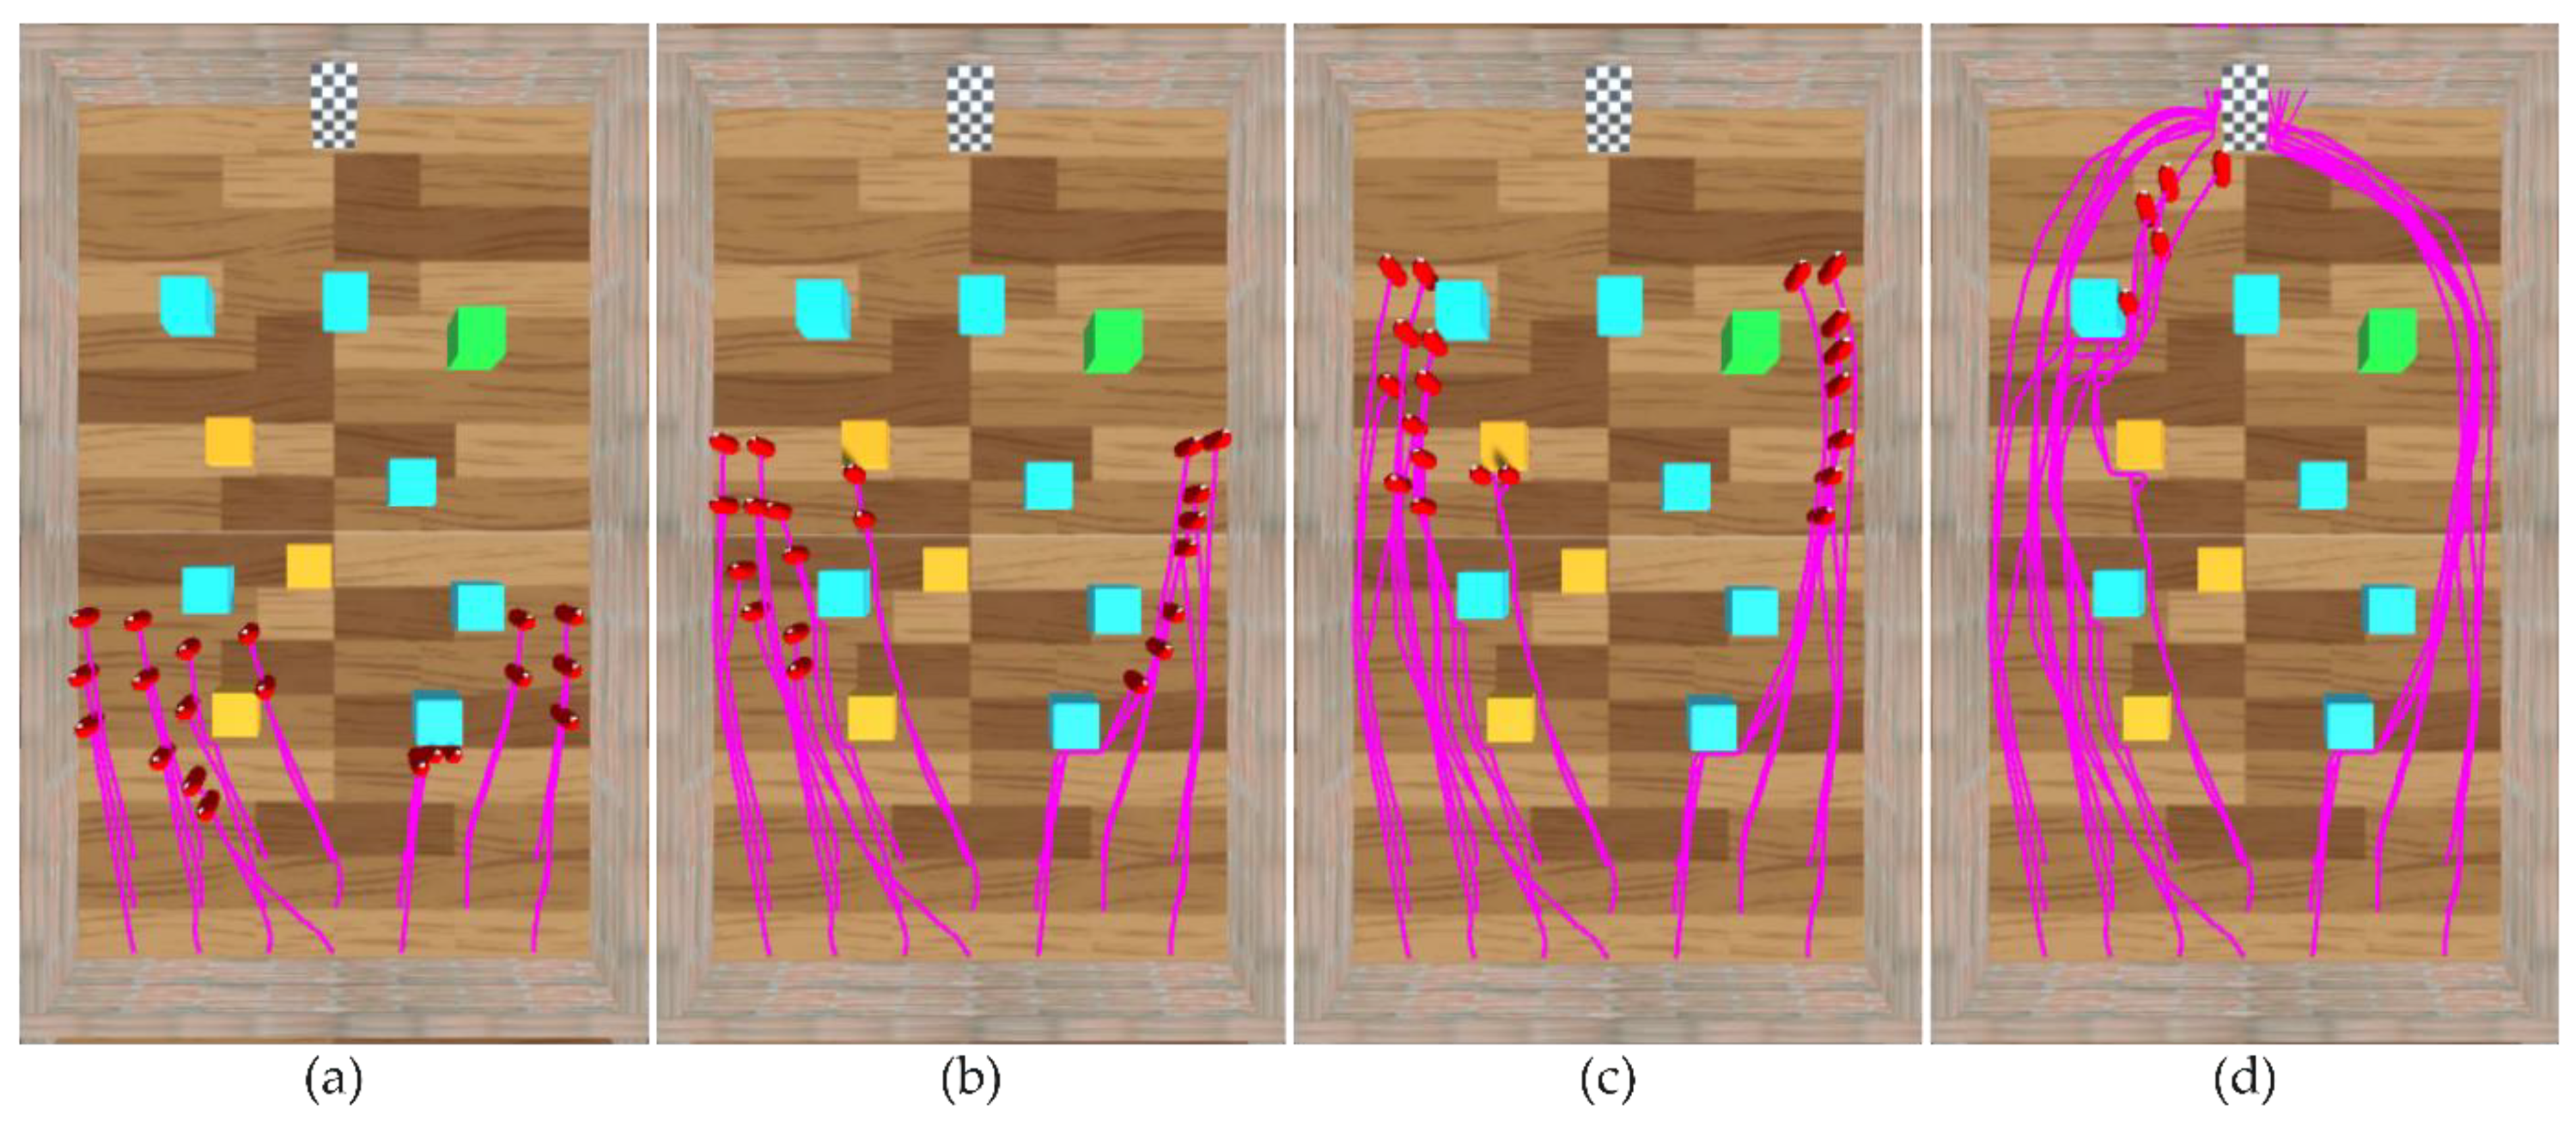
The method of [27] can enable agents to avoid obstacles and navigate in unknown three-dimensional scenarios, but it does not consider the height of the environment in the construction of the perceptron and policy, so these environments can be abstractly regarded as two-dimensional scenarios. In Figure 9, a temporal sequence of an experimental result generated by the method of [27] in scenario II is shown. During the experiment, the agents move toward the target without colliding with obstacles (Figure 9a), gradually gather (Figure 9b) to form four groups (Figure 9c,d, where each red rectangle represents a group), and finally reach the target. As seen from the trajectories (pink curves in Figure 9), the agents form four fixed and unified routes during the experiment, and two of the routes are very close to the walls on both sides.
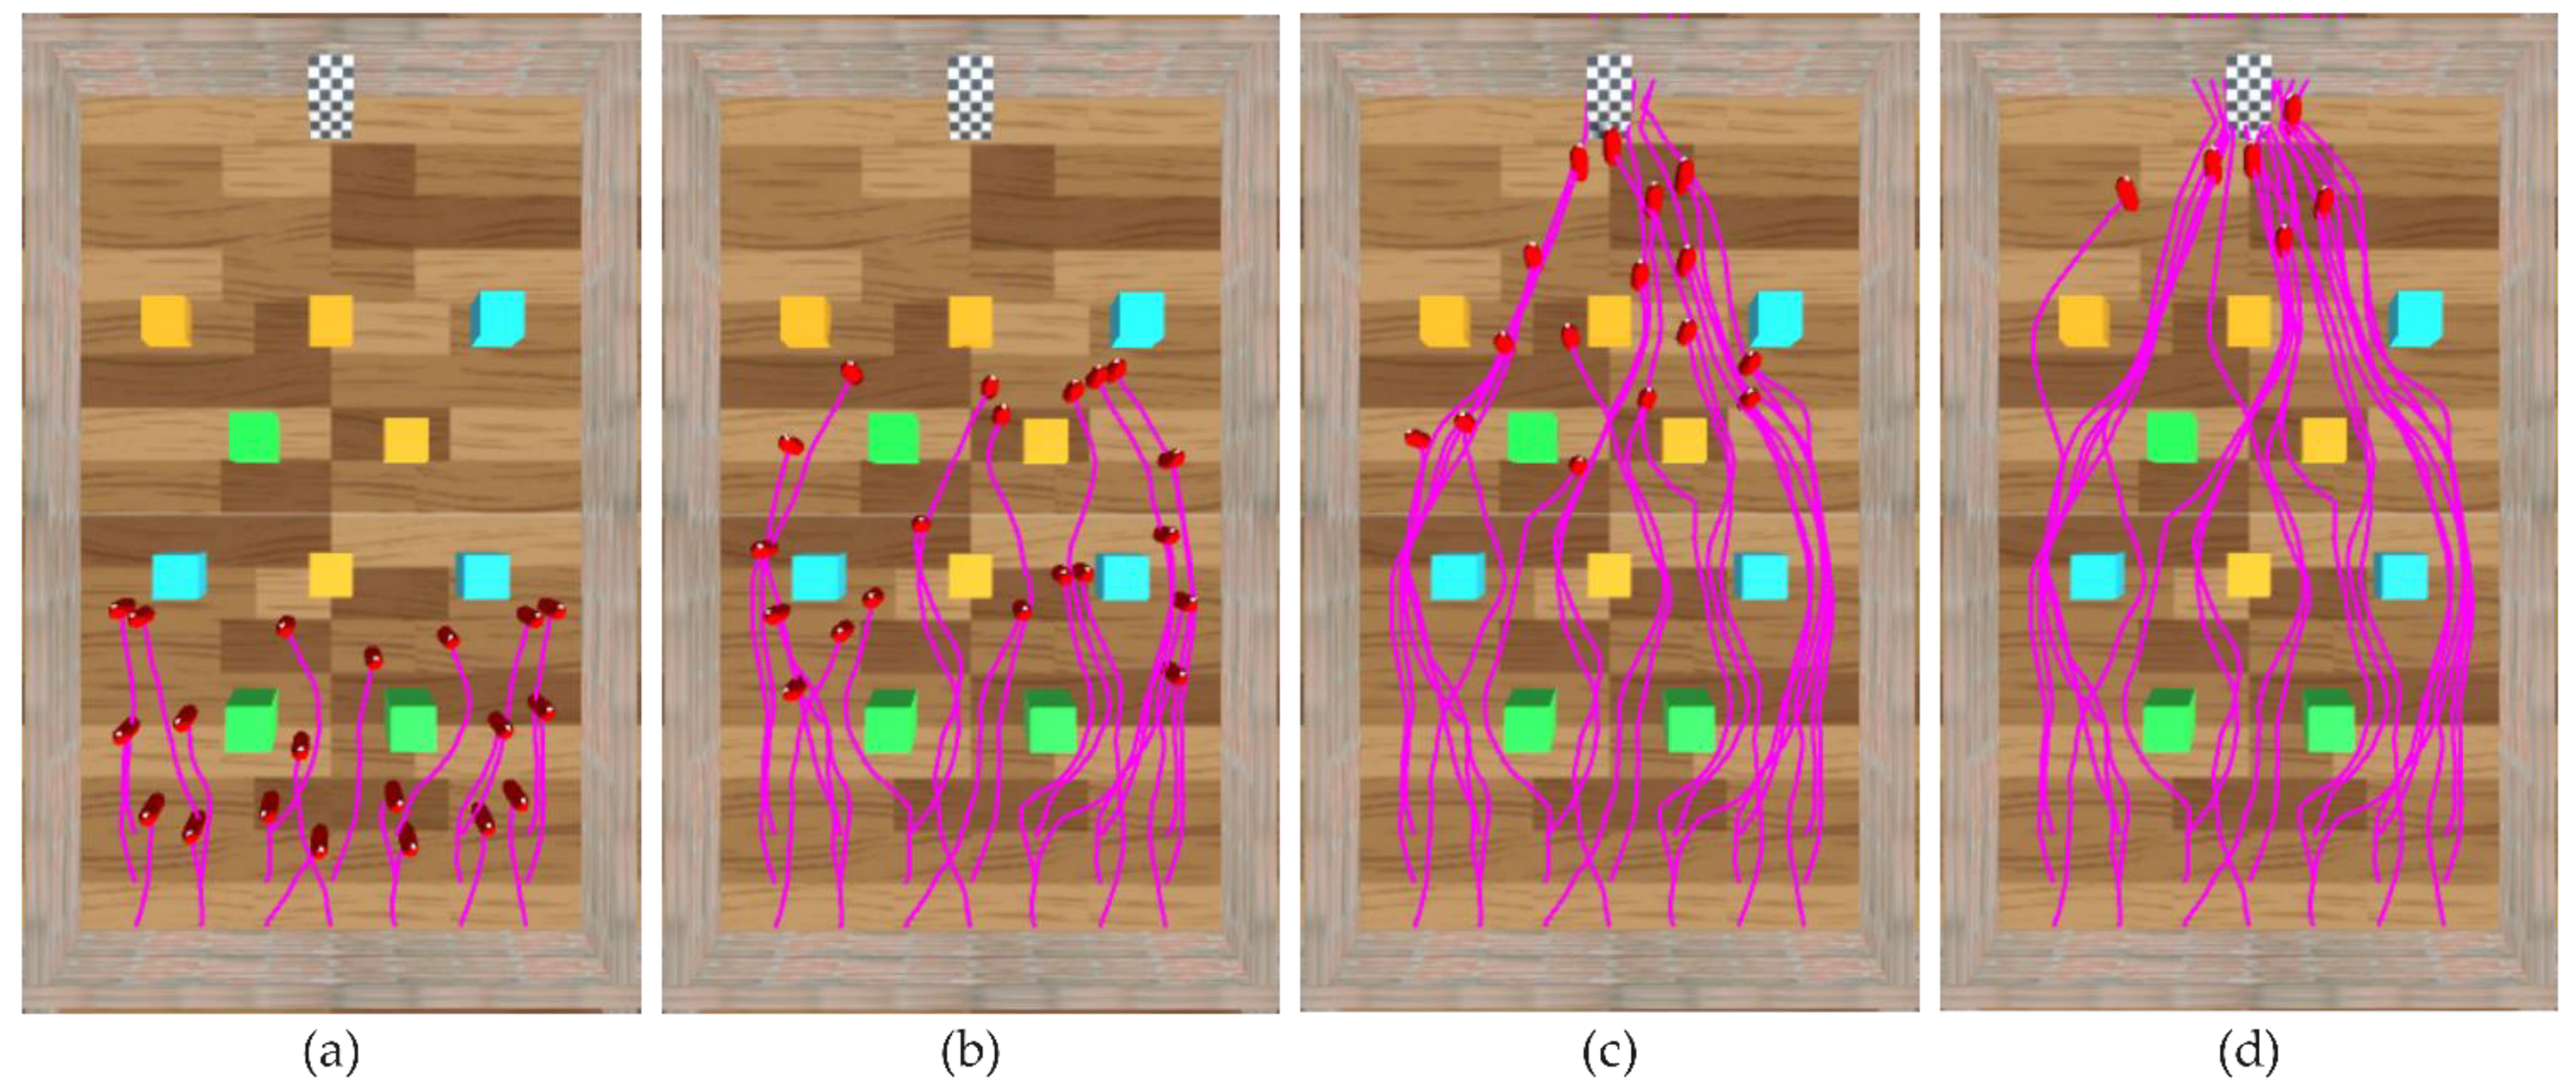
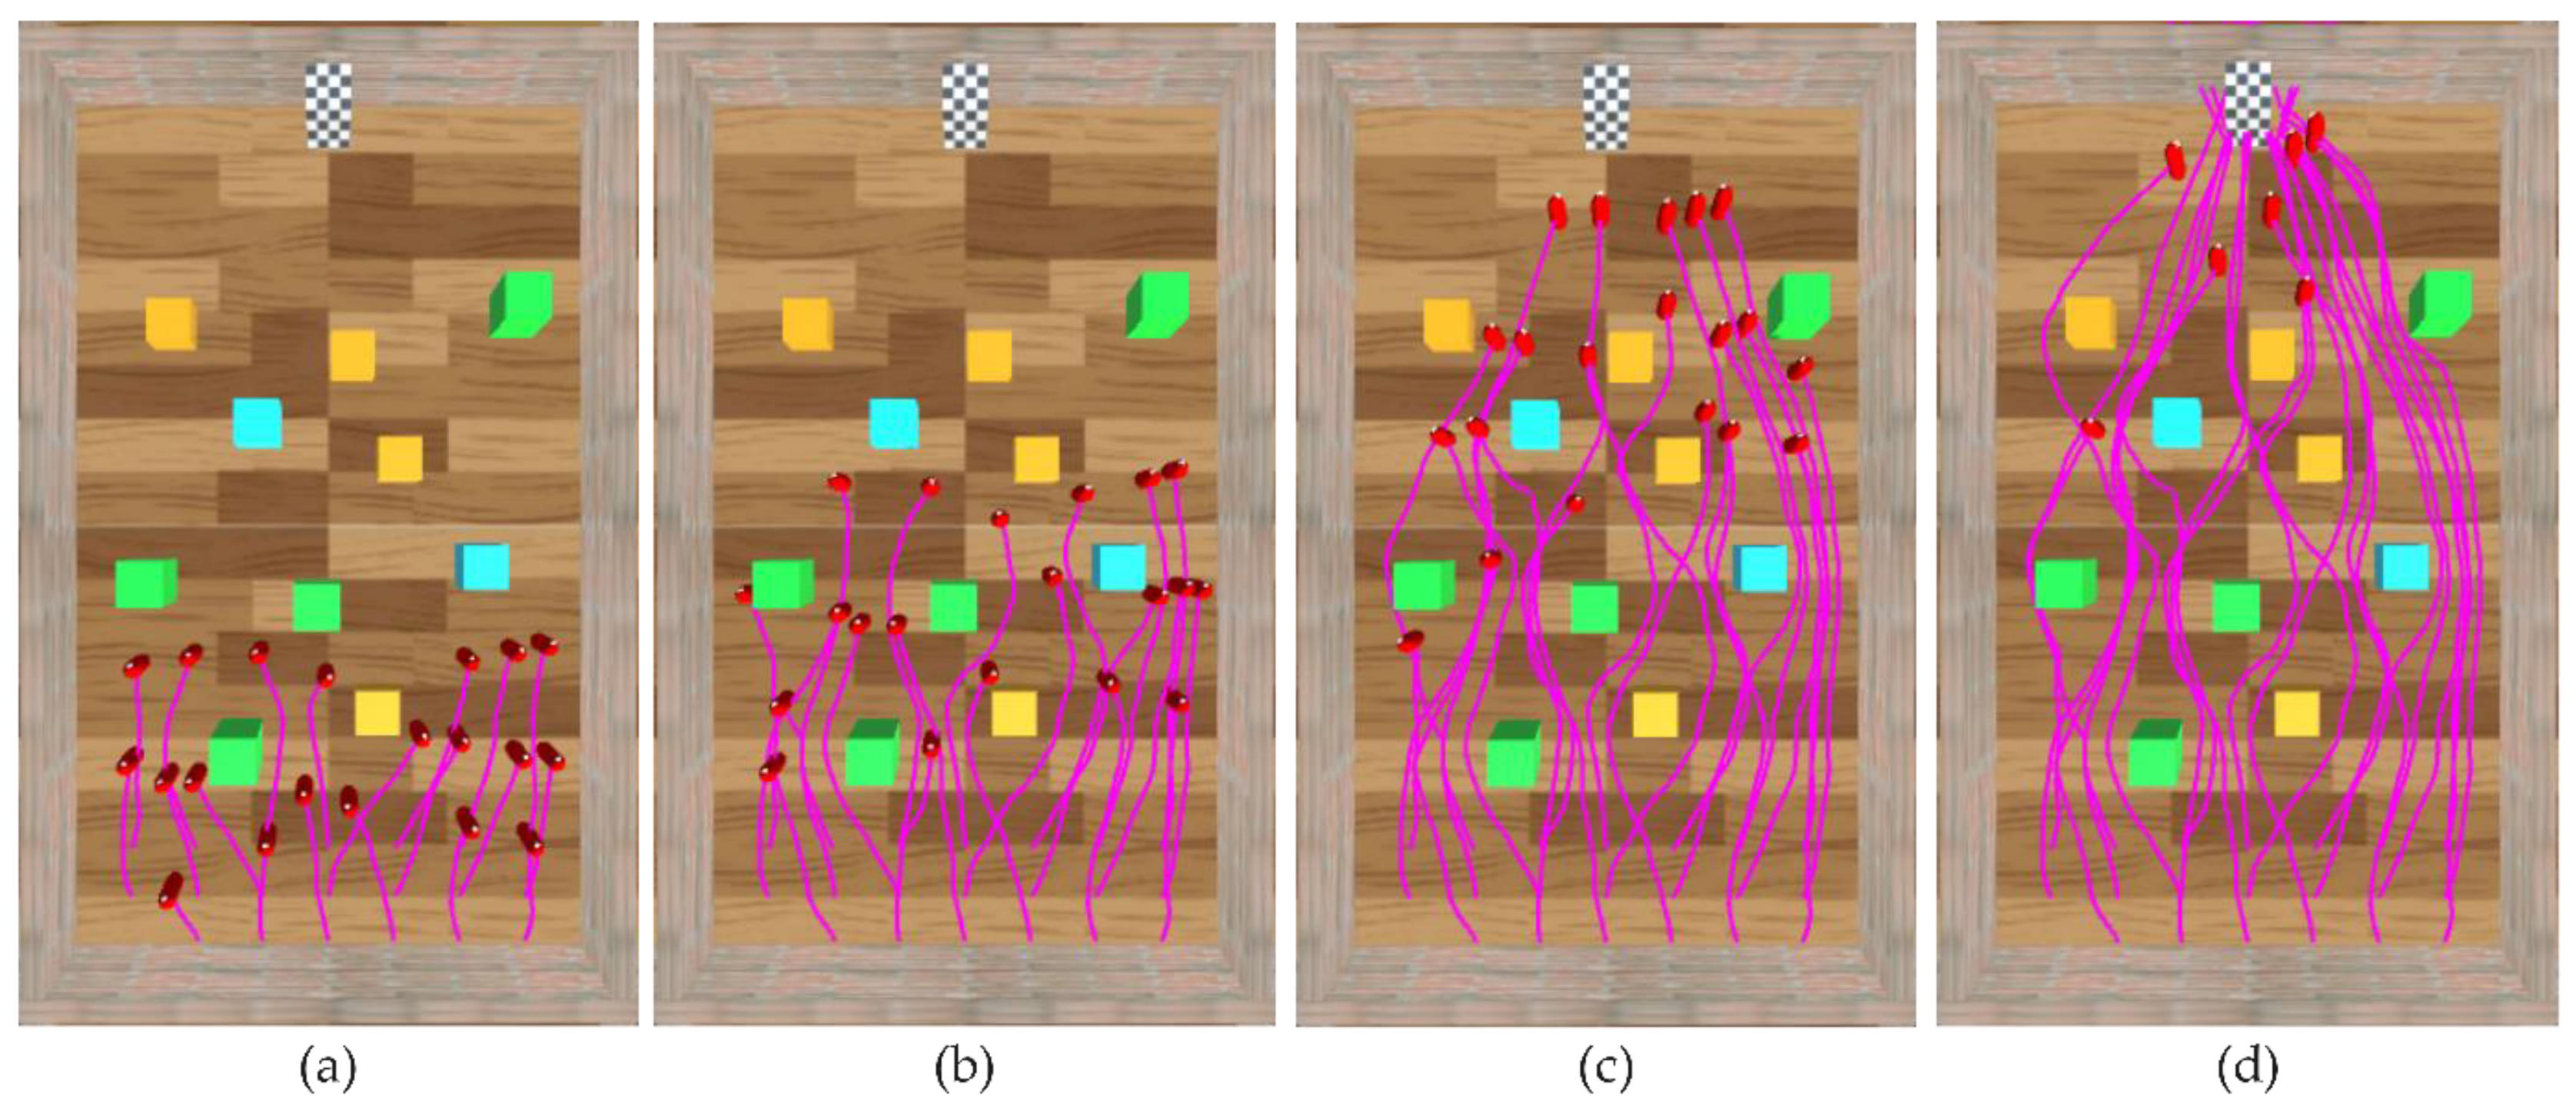
In Figure 10, a temporal sequence of an experimental result generated by HDRLM3D in scenario II is shown. During the experiment, the agents can also move toward the target without colliding with obstacles (Figure 10a), but they do not form obvious groups (Figure 10b,c), and they finally reach the target (Figure 10d). As seen from the trajectories (pink curves in Figure 10), the agents also do not form fixed and unified routes. Compared with the experimental result in Figure 9, their routes are more random and scattered and are far from the walls on both sides. This experimental result is intuitively more similar to the observation data of real crowds [36,43].
We further compare the performance of these two methods ([27] and HDRLM3D) in scenario II. We use the two methods to conduct one hundred experiments in scenario II, count the total number of collisions between all agents and obstacles, and obtain the average number of collisions for each agent in each experiment. As shown in Table 5, the average number of collisions for both methods is low ( 0.305 and 0.152 ), which indicates that they both have a strong obstacle avoidance ability in scenario II. Moreover, compared to the method of [27], the average number of collisions in HDRLM3D is smaller ( 0.152 < 0.305 ), which indicates that HDRLM3D has a stronger obstacle avoidance ability in scenario II.
(2)
Experimental results in an adjusted scenario II
To further demonstrate the advantages of HDRLM3D in unknown three-dimensional scenarios, we randomly adjust the heights and positions of the obstacles in scenario II and use the models trained in scenario II without additional training to conduct comparative experiments.
In Figure 11, a temporal sequence of an experimental result generated by the method of [27] in the adjusted scenario II is shown. Similar to the experimental result in Figure 9, the agents still gradually gather to form relatively fixed and unified routes (pink curves in Figure 11), and more routes are close to the walls on both sides. Moreover, as shown in Figure 12, because this method does not consider the height of the environment, the agents cannot cope well with the changes in the heights and positions of obstacles, which leads to frequent collisions between the agents and obstacles in the adjusted scenario II (inside the red rectangles in Figure 12).
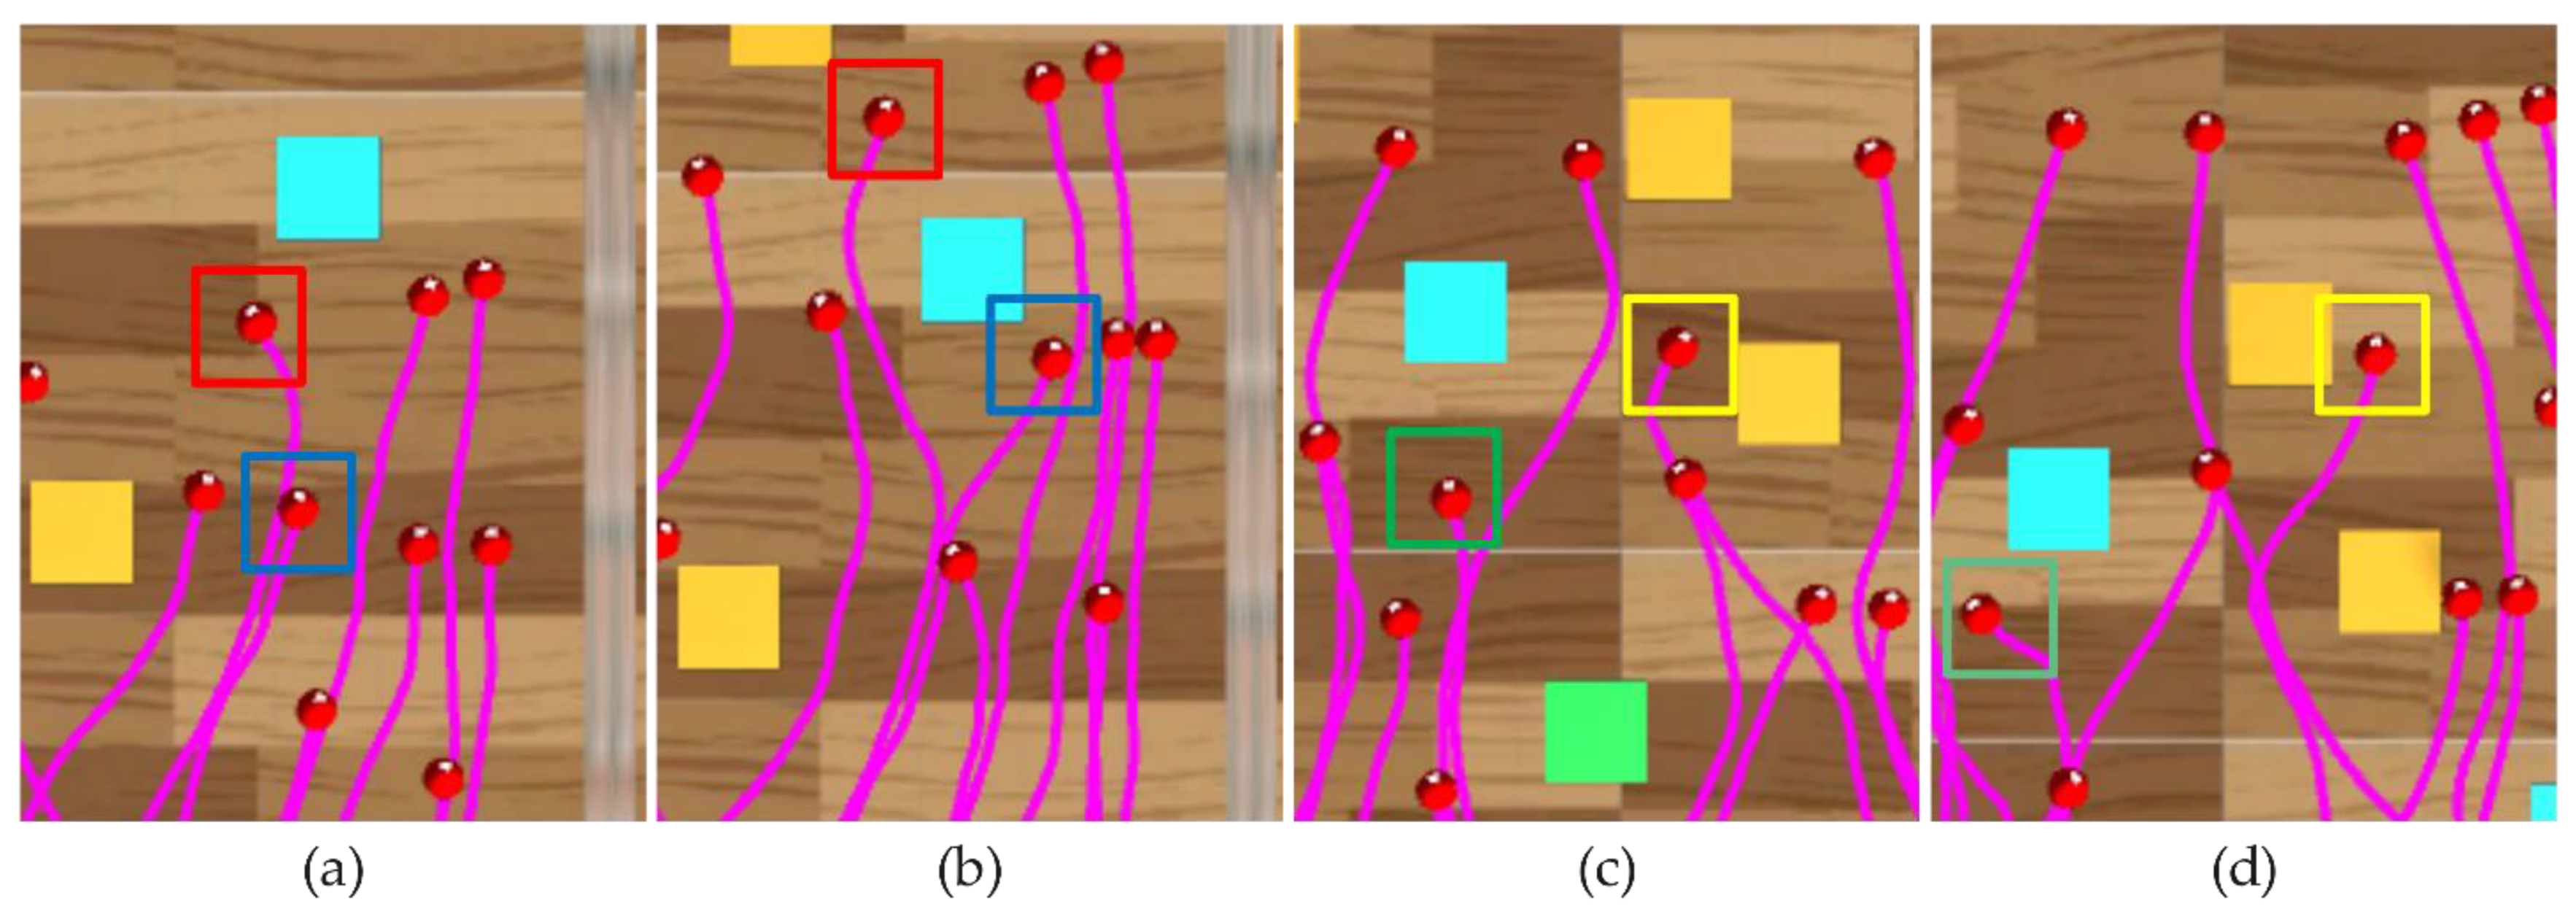
In Figure 13, a temporal sequence of an experimental result generated by HDRLM3D in the adjusted scenario II is shown. In this scenario, the agents can still reach the target without colliding with obstacles, and their routes (pink curves in Figure 13) are random and scattered and are far from the walls on both sides. This experimental result is intuitively similar to the experimental result in Figure 10. As shown in Figure 14, because HDRLM3D considers the height of the environment, the agents (marked by rectangles of different colors in Figure 14) can cope well with the changes in the heights and positions of the obstacles, which prevents frequent collisions between the agents and obstacles.
We further compare the performance of these two methods in the adjusted scenario II. We also conduct one hundred experiments in this scenario by using these methods to count and calculate the total number of collisions and the average number of collisions. As shown in Table 6, in the adjusted scenario II, the average number of collisions of HDRLM3D ( 0.193 ) is much smaller than that of the method of [27] ( 0.886 ), which indicates that HDRLM3D has a better obstacle avoidance ability in the adjusted scenario II. Moreover, compared to scenario II, the method of [27] increases the average number of collisions by approximately 190.5 % in the adjusted scenario II, while HDRLM3D only increases it by approximately 27.0 % , which indicates that the robustness of HDRLM3D is stronger.

3.2.3. Comparisons

In Table 7, we qualitatively compare HDRLM3D with other crowd simulation methods. More specifically, in contrast to classical methods, which plan paths according to known environments, such as SFM and ORCA, HDRLM3D enables agents to reach the target in unknown environments. That is, a known environment (global or local) is a premise of classical methods, while in HDRLM3D, agents can actively perceive unknown environments through the VLRP and can learn how to reach the target through the DBFED-Net. When an aspect of the environment changes, such as the positions of obstacles, HDRLM3D enables agents to avoid collisions and reach the target without additional training, while classical methods need to regenerate the known environment in advance. In contrast to other DRLMs, we consider the height of the environment when constructing the perceptron and policy, so HDRLM3D is more suitable for crowd simulation in 3D environments. Although artificial intelligence has made significant progress, it still has many drawbacks when dealing with unknown or crowded scenarios [44]. Therefore, a practical solution is to combine the DRLM with classical methods or observational data. However, HDRLM3D enables crowd simulation in 3D environments without other classical methods or observational data. We test our method on a computer with the following hardware configuration: Inter (R) Core (TM) i9-10920X CPU @ 3.5 GHz, and NVIDIA GeForce RTX 2080Ti. HDRLM3D can still operate at twenty-five frames per second or more when the number of agents reaches five hundred, which reflects its satisfactory computational performance.

4. Conclusions

The human–environment relationship is always the focus of geographic research. Thanks to the development of technology, the study of human–environment relationships in virtual geographic environments (scenarios) has gradually become an important research topic and method of GIS. Based on this method, many achievements have been made in the emergency management of disasters such as floods [45] and debris flows [46], but the research on indoor crowd evacuation is slightly insufficient. Indoor crowd evacuation is an important manifestation of the micro human–environment relationship. Therefore, our study on applying artificial intelligence and virtual environments to the modeling and simulation of crowd evacuations is not only a further exploration of the micro human–environment relationship in GIS, but also promotes the integration of GIS into other disciplines.
In this paper, to overcome the drawbacks of crowd simulations that rely on (abstract) 2D spaces, we propose a deep reinforcement learning-based model with human-like perceptron and policy for crowd evacuation in 3D environments (HDRLM3D). Our method makes two main contributions: (1) to enable the active acquisition of 3D environmental information by agents, we propose a vision-like ray perceptron (VLRP) and combine it with a redesigned global (or local) perceptron (GOLP) to form a human-like perception model; (2) to perform feature extraction on 3D environmental information, we propose a double-branch feature extraction and decision network (DBFED-Net) as the policy, which can extract and integrate features from different types of environmental information and make behavioral decisions.
Moreover, we conduct experiments in two different scenarios to verify our method’s ability to reproduce typical phenomena and behaviors. In scenario I, our method reproduces the bottleneck effect, which is a typical self-organization phenomenon of crowds, and we demonstrate the effectiveness and advantages of our method by comparing it with real crowd experiments and classical methods in terms of density maps, fundamental diagrams, and evacuation times. In scenario II, our method can enable agents to navigate and avoid obstacles, which are important skills (or behaviors) that agents must possess, and we demonstrate the advantages of our method for crowd simulation in unknown 3D environments by comparing it with other DRLMs in terms of trajectories and numbers of collisions.
It is worth noting that this study only initially performs crowd simulation in 3D environments, and there are still areas of these simulations that can be improved and perfected. In terms of environments, the experimental scenarios in this study are relatively simple, which is also a common problem faced by crowd simulations at present. Therefore, it is the main goal of our future work to conduct experiments in more realistic and complex 3D scenarios to reveal the behavioral laws of crowds. Regarding crowds, this study does not consider heterogeneity, so it is also important for us to simulate the behaviors of heterogeneous crowds in future work.

Author Contributions

Dong Zhang proposed the model, performed analysis and wrote the paper. Wenhang Li and Jianhua Gong conceived the study. Lin Huang, Guoyong Zhang, Shen Shen, Jiantao Liu and Haonan Ma processed and visualized the data. All authors have read and agreed to the published version of the manuscript.

Funding

This research is supported and funded by the National Natural Science Foundation of China (No. 41971361), the National Key Technology R&D Program of China (No. 2020YFC0833103), the Pilot Fund of Frontier Science and Disruptive Technology of Aerospace Information Research Institute, Chinese Academy of Sciences (No. E0Z21101) and the National Natural Science Foundation of China (No. 42171113).

Institutional Review Board Statement

Not applicable.

Informed Consent Statement

Not applicable.

Data Availability Statement

The data used to support the findings of this study are available from the corresponding author upon request.

Conflicts of Interest

The authors declare no conflict of interest.

References

  1. Zhao, C.M.; Lo, S.M.; Zhang, S.P.; Liu, M. A Post-fire Survey on the Pre-evacuation Human Behavior. Fire Technol. 2008, 45, 71–95. [Google Scholar] [CrossRef]
  2. Sekizawa, A.; Eb Ihara, M.; Notake, H.; Kubota, K.; Kaneko, H. Occupants’ behaviour in response to the high-rise apartments fire in Hiroshima City. Fire Mater. 2015, 23, 297–303. [Google Scholar] [CrossRef]
  3. Helbing, D.; Johansson, A.; Al-Abideen, H.Z. The Dynamics of Crowd Disasters: An Empirical Study. Phys. Rev. E 2007, 75, 046109. [Google Scholar] [CrossRef] [PubMed] [Green Version]
  4. Brscic, D.; Kanda, T.; Ikeda, T.; Miyashita, T. Person Tracking in Large Public Spaces Using 3-D Range Sensors. IEEE Trans. Hum.-Mach. Syst. 2013, 43, 522–534. [Google Scholar] [CrossRef]
  5. Saloma, C.; Perez, G.J.; Tapang, G.; Lim, M.; Palmes-Saloma, C. Self-organized queuing and scale-free behavior in real escape panic. Proc. Natl. Acad. Sci. USA 2003, 100, 11947–11952. [Google Scholar] [CrossRef] [Green Version]
  6. Garcimartín, A.; Pastor, J.M.; Ferrer, L.M.; Ramos, J.J.; Zuriguel, I. Flow and clogging of a sheep herd passing through a bottleneck. Phys. Rev. E 2015, 91, 022808. [Google Scholar] [CrossRef] [Green Version]
  7. Zuriguel, I.; Olivares, J.; Pastor, J.M.; Martín-Gómez, C.; Ferrer, L.M.; Ramos, J.J.; Garcimartín, A. Effect of obstacle position in the flow of sheep through a narrow door. Phys. Rev. E 2016, 94, 032302. [Google Scholar] [CrossRef] [Green Version]
  8. Von Krüchten, C.; Schadschneider, A. Empirical study on social groups in pedestrian evacuation dynamics. Phys. A Stat. Mech. Its Appl. 2017, 475, 129–141. [Google Scholar] [CrossRef] [Green Version]
  9. Cao, S.; Seyfried, A.; Zhang, J.; Holl, S.; Song, W. Fundamental diagrams for multidirectional pedestrian flows. J. Stat. Mech. Theory Exp. 2017, 2017, 033404. [Google Scholar] [CrossRef]
  10. Kinateder, M.; Comunale, B.; Warren, W.H. Exit choice in an emergency evacuation scenario is influenced by exit familiarity and neighbor behavior. Saf. Sci. 2018, 106, 170–175. [Google Scholar] [CrossRef]
  11. Huang, L.; Gong, J.; Li, W. A Perception Model for Optimizing and Evaluating Evacuation Guidance Systems. ISPRS Int. J. Geo-Inf. 2021, 10, 54. [Google Scholar] [CrossRef]
  12. Zheng, X.; Zhong, T.; Liu, M. Modeling crowd evacuation of a building based on seven methodological approaches. Build. Environ. 2009, 44, 437–445. [Google Scholar] [CrossRef]
  13. Henderson, L.F. The Statistics of Crowd Fluids. Nature 1971, 229, 381–383. [Google Scholar] [CrossRef]
  14. Milazzo, J.S.; Rouphail, N.M.; Hummer, J.E.; Allen, D.P. Effect of pedestrians on capacity of signalized intersections. Transp. Res. Rec. 1998, 1646, 37–46. [Google Scholar] [CrossRef]
  15. Hoogendoorn, S.P.; Bovy, P. Pedestrian Travel Behavior Modeling. Netw. Spat. Econ. 2005, 5, 193–216. [Google Scholar] [CrossRef] [Green Version]
  16. Løvås, G.G. Modeling and simulation of pedestrian traffic flow. Transp. Res. Part B Methodol. 1994, 28, 429–443. [Google Scholar] [CrossRef]
  17. Varas, A.; Cornejo, M.D.; Mainemer, D.; Toledo, B.; Rogan, J.; Mu?Oz, V.; Valdivia, J.A. Cellular automaton model for evacuation process with obstacles. Phys. A Stat. Mech. Its Appl. 2007, 382, 631–642. [Google Scholar] [CrossRef] [Green Version]
  18. Tajima, Y.; Nagatani, T. Scaling behavior of crowd flow outside a hall. Phys. A Stat. Mech. Its Appl. 2001, 292, 545–554. [Google Scholar] [CrossRef]
  19. Helbing, D.; Molnar, P. Social Force Model for Pedestrian Dynamics. Phys. Rev. E 1995, 51, 4282. [Google Scholar] [CrossRef] [Green Version]
  20. Goldstone, R.L.; Janssen, M.A. Computational models of collective behavior. Trends Cogn. Sci. 2005, 9, 424–430. [Google Scholar] [CrossRef]
  21. Torrey, L. Crowd Simulation Via Multi-Agent Reinforcement Learning. In Proceedings of the Sixth AAAI Conference on Artificial Intelligence and Interactive Digital Entertainment, Stanford, CA, USA, 11–13 October 2010. [Google Scholar]
  22. Martinez-Gil, F.; Lozano, M.; Fernández, F. MARL-Ped: A multi-agent reinforcement learning based framework to simulate pedestrian groups. Simul. Model. Pract. Theory 2014, 47, 259–275. [Google Scholar] [CrossRef]
  23. Martinez-Gil, F.; Lozano, M.; Fernández, F. Emergent behaviors and scalability for multi-agent reinforcement learning-based pedestrian models. Simul. Model. Pract. Theory 2017, 74, 117–133. [Google Scholar] [CrossRef] [Green Version]
  24. Lee, J.; Won, J. Crowd simulation by deep reinforcement learning. In Proceedings of the MIG ‘18: Motion, Interaction and Games, Limassol, Cyprus, 8–10 November 2018. [Google Scholar]
  25. Sun, L.; Zhai, J.; Qin, W. Crowd Navigation in an Unknown and Dynamic Environment Based on Deep Reinforcement Learning. IEEE Access 2019, 7, 109544. [Google Scholar] [CrossRef]
  26. Baker, B.; Kanitscheider, I.; Markov, T.; Wu, Y.; Powell, G.; McGrew, B.; Mordatch, I. Emergent tool use from multi-agent autocurricula. arXiv 2019, arXiv:1909.07528. [Google Scholar]
  27. Juliani, A.; Berges, V.-P.; Teng, E.; Cohen, A.; Harper, J.; Elion, C.; Goy, C.; Gao, Y.; Henry, H.; Mattar, M.; et al. Unity: A general platform for intelligent agents. arXiv 2018, arXiv:1809.02627. [Google Scholar]
  28. Degond, P.; Appert-Rolland, C.; Pettré, J.; Theraulaz, G. Vision-based macroscopic pedestrian models. Kinet. Relat. Models 2013, 6, 809–839. [Google Scholar] [CrossRef] [Green Version]
  29. Kim, D.; Quaini, A. A kinetic theory approach to model pedestrian dynamics in bounded domains with obstacles. Kinet. Relat. Models 2019, 12, 1273–1296. [Google Scholar] [CrossRef] [Green Version]
  30. Kim, D.; Quaini, A. Coupling kinetic theory approaches for pedestrian dynamics and disease contagion in a confined environment. Math. Models Methods Appl. Sci. 2020, 30, 1893–1915. [Google Scholar] [CrossRef]
  31. Aylaj, B.; Bellomo, N.; Gibelli, L.; Reali, A. A unified multiscale vision of behavioral crowds. Math. Models Methods Appl. Sci. 2020, 30, 1–22. [Google Scholar] [CrossRef]
  32. Bellomo, N.; Gibelli, L.; Quaini, A.; Reali, A. Towards a mathematical theory of behavioral human crowds. Math. Models Methods Appl. Sci. 2022, 32, 321–358. [Google Scholar] [CrossRef]
  33. Li, X.; Liu, H.; Li, J.; Li, Y. Deep deterministic policy gradient algorithm for crowd-evacuation path planning. Comput. Ind. Eng. 2021, 161, 107621. [Google Scholar] [CrossRef]
  34. Yao, Z.; Zhang, G.; Lu, D.; Liu, H. Data-driven crowd evacuation: A reinforcement learning method. Neurocomputing 2019, 366, 314–327. [Google Scholar] [CrossRef]
  35. Huang, L.; Gong, J.; Li, W.; Xu, T.; Shen, S.; Liang, J.; Feng, Q.; Zhang, D.; Sun, J. Social Force Model-Based Group Behavior Simulation in Virtual Geographic Environments. ISPRS Int. J. Geo-Inf. 2018, 7, 79. [Google Scholar] [CrossRef] [Green Version]
  36. Wang, Q.; Liu, H.; Gao, K.; Zhang, L. Improved multi-agent reinforcement learning for path planning-based crowd simulation. IEEE Access 2019, 7, 73841–73855. [Google Scholar] [CrossRef]
  37. Schulman, J.; Wolski, F.; Dhariwal, P.; Radford, A.; Klimov, O. Proximal policy optimization algorithms. arXiv 2017, arXiv:1707.06347. [Google Scholar]
  38. Woo, S.; Park, J.; Lee, J.-Y.; Kweon, I.S. Cbam: Convolutional block attention module. In Proceedings of the European Conference on Computer Vision (ECCV), Munich, Germany, 8–14 September 2018; pp. 3–19. [Google Scholar]
  39. Adrian, J.; Boltes, M.; Holl, S.; Sieben, A.; Seyfried, A. Crowding and Queuing in Entrance Scenarios: Influence of Corridor Width in Front of Bottlenecks. In Proceedings of the 9th International Conference on Pedestrian and Evacuation Dynamics (PED2018), Lund, Sweden, 21–24 August 2018. [Google Scholar]
  40. Berg, J.v.d.; Guy, S.J.; Lin, M.; Manocha, D. Reciprocal n-body collision avoidance. In Robotics Research; Springer: Berlin/Heidelberg, Germany, 2011; pp. 3–19. [Google Scholar]
  41. Seyfried, A.; Steffen, B.; Klingsch, W.; Boltes, M. The fundamental diagram of pedestrian movement revisited. J. Stat. Mech. Theory Exp. 2005, 2005, P10002. [Google Scholar] [CrossRef]
  42. Seyfried, A.; Boltes, M.; Kähler, J.; Klingsch, W.; Portz, A.; Rupprecht, T.; Schadschneider, A.; Steffen, B.; Winkens, A. Enhanced empirical data for the fundamental diagram and the flow through bottlenecks. Pedestr. Evacuation Dyn. 2008 2010, 145–156. [Google Scholar] [CrossRef] [Green Version]
  43. Liu, B.; Liu, H.; Zhang, H.; Qin, X. A social force evacuation model driven by video data. Simul. Model. Pract. Theory 2018, 84, 190–203. [Google Scholar] [CrossRef]
  44. Godoy, J.; Guy, S.J.; Gini, M.; Karamouzas, I. C-Nav: Distributed coordination in crowded multi-agent navigation. Robot. Auton. Syst. 2020, 133, 103631. [Google Scholar] [CrossRef]
  45. Li, W.; Zhu, J.; Fu, L.; Zhu, Q.; Guo, Y.; Gong, Y. A rapid 3D reproduction system of dam-break floods constrained by post-disaster information. Environ. Model. Softw. 2021, 139, 104994. [Google Scholar] [CrossRef]
  46. Li, W.; Zhu, J.; Fu, L.; Zhu, Q.; Xie, Y.; Hu, Y. An augmented representation method of debris flow scenes to improve public perception. Int. J. Geogr. Inf. Sci. 2021, 35, 1521–1544. [Google Scholar] [CrossRef]
Figure 1. Basic framework of HDRLM3D.
Ijgi 11 00255 g001
Figure 2. Models of the avatar and perceptron. (a) Left view of the avatar; (b) top view of the avatar; (c) vertical field of the agents’ view; (d) horizontal field of the agents’ view; (e) matrix of all environmental information obtained by perceptual rays.
Ijgi 11 00255 g002
Figure 3. Policy of HDRLM3D.
Ijgi 11 00255 g003
Figure 4. Attention mechanism.
Ijgi 11 00255 g004
Figure 5. Experimental scenarios. (a) Scenario I; (b) scenario II.
Ijgi 11 00255 g005
Figure 6. A temporal sequence of an experimental result in scenario I. (ad) Stills of the experimental result. The temporal sequence of these stills is sorted alphabetically.
Ijgi 11 00255 g006
Figure 7. Density maps. (a) Density map generated by the real crowd experiment; (b) density map generated by HDRLM3D; (c) density map generated by SFM; (d) density map generated by ORCA.
Ijgi 11 00255 g007
Figure 8. Fundamental diagrams. (a) Fundamental diagram generated by the real crowd experiment; (b) fundamental diagram generated by HDRLM3D.
Ijgi 11 00255 g008
Figure 9. A temporal sequence of an experimental result generated by the method of [27] in scenario II. (ad) Stills of the experimental result. The temporal sequence of these stills is sorted alphabetically.
Ijgi 11 00255 g009
Figure 10. A temporal sequence of an experimental result generated by HDRLM3D in scenario II. (ad) Stills of the experimental result. The temporal sequence of these stills is sorted alphabetically.
Ijgi 11 00255 g010
Figure 11. A temporal sequence of an experimental result generated by the method of [27] in the adjusted scenario II. (ad) Stills of the experimental result. The temporal sequence of these stills is sorted alphabetically.
Ijgi 11 00255 g011
Figure 12. Collisions based on the method of [27]. (ac) Collisions between the agents and obstacles.
Ijgi 11 00255 g012
Figure 13. A temporal sequence of an experimental result generated by HDRLM3D in the adjusted scenario II. (ad) Stills of the experimental result. The temporal sequence of these stills is sorted alphabetically.
Ijgi 11 00255 g013
Figure 14. Collisions based on HDRLM3D. (ad) Agents avoid collisions.
Ijgi 11 00255 g014
Table 1. Configuration of Agent and Interactions.
Scenario IScenario II
PerceptronThe GOLP can obtain the direction and speed of the agent and the relative position of the agent and target; the VLRP contains a total of twenty-seven perceptual rays with vertical angles of 90 ° , 95 ° , and 100 ° and horizontal angles of 30 ° , 50 ° , 65 ° , 80 ° , 90 ° , 100 ° , 115 ° , 130 ° , and 150 ° . They can detect four types of objects: the ground, wall, agent, and target.The GOLP can obtain the direction, speed and position of the agent; the VLRP contains a total of twenty-seven perceptual rays with vertical angles of 90 ° , 100 ° , and 115 ° and horizontal angles of 30 ° , 50 ° , 65 ° , 80 ° , 90 ° , 100 ° , 115 ° , 130 ° , and 150 ° . They can detect five types of objects: the ground, wall, agent, obstacle, and target.
State s t i n t is a one-dimensional vector, and its dimension is 7 ; s t e x t is a three-dimensional matrix, and its dimensions are 3 × 9 × 2 .
Action ω t has three discrete values, which represent no turn, turning right and turning left, and the rotation speed is 90 ° / s ; s t has twenty discrete values with an interval of 0.05 , and their range is [ 0 , 1 ] (unit: m / s ). ω t has three discrete values, which represent no turn, turning right, and turning left, and the rotation speed is 90 ° / s ; s t has twenty discrete values with an interval of 0.1 , and their range is [ 0 , 2 ] (unit: m / s ).
Reward ω t t i m e is set to ( 0.01 × d ) / d m a x , where d ( d m a x ) represents the distance (maximum distance) between the agent and target; ω t g o a l is set to 10 , and ω t c o l l i s i o n is set to 0 . ω t t i m e is set to ( 0.01 × d y ) / d m a x y , where d y ( d m a x y ) represents the distance (maximum distance) between the agent and target along the y-axis; ω t g o a l is set to 10 , and ω t c o l l i s i o n is set to 0.08 only when the agents collide with an agent, wall, or obstacle.
Table 2. Learning Parameters.
ParametersScenario IScenario II
Learning rate 1 × 10 3
Batch size 512
Max steps 2.5 × 10 5 1 × 10 6
Buffer size 10,240
Beta 5 × 10 3
Epsilon 0.2
Gamma 0.99
Table 3. Mean and standard deviation of different methods.
MethodMeanStandard Deviation
Real crowd experiment−0.150.86
HDRLM3D0.021.03
SFM 10.001.23
ORCA 20.001.40
1 SFM stands for the social force model. 2 ORCA stands for the optimal reciprocal collision avoidance.
Table 4. Evacuation times of different methods.
MethodEvacuation Time (s)
Real crowd experiment63.00
HDRLM3D60.54
SFM75.76
ORCA132.54
Table 5. Performance comparison of the methods in scenario II.
Method[27]HDRLM3D
Number of experiments100100
Total number of collisions610304
Average number of collisions0.3050.152
Table 6. Performance comparison of the methods in the adjusted scenario II.
Method[27]HDRLM3D
Number of experiments100100
Total number of collisions1771386
Average number of collisions0.8860.193
Table 7. Comparison of other methods and HDRLM3D.
Classical MethodsOther DRLMsHDRLM3D
Known or unknown environmentknownknown or unknownunknown
Recognized or unrecognized objectsunrecognizedrecognized or unrecognizedrecognized
Three-dimensional environmentnoyes or no, height is not consideredyes, height is considered
Obstacles can be changedyes, known environments must be regeneratedyesyes
Be combined with other methods-yesno
Publisher’s Note: MDPI stays neutral with regard to jurisdictional claims in published maps and institutional affiliations.