Article

Evaluation of Street Space Quality Using Streetscape Data: Perspective from Recreational Physical Activity of the Elderly

Tsinghua Shenzhen International Graduate School, Tsinghua University, Shenzhen 518055, China
*
Author to whom correspondence should be addressed.
ISPRS Int. J. Geo-Inf. 2022, 11(4), 241; https://doi.org/10.3390/ijgi11040241
Submission received: 14 February 2022 / Revised: 21 March 2022 / Accepted: 30 March 2022 / Published: 7 April 2022

Abstract

:
The quality of street space has attracted attention. It is important to understand the needs of different population groups for street space quality, especially the rapidly growing elderly group. Improving the quality of street space is conducive to promoting the physical leisure activities of the elderly to benefit to their health. Therefore, it is important to evaluate street space quality for the elderly. The existing studies, on the one hand, are limited by the sample size of traditional survey data, which is hard to apply on a large scale; on the other hand, there is a lack of consideration for factors that reveal the quality of street space from the perspective of the elderly. This paper takes Guangzhou as an example to evaluate the quality of street space. First, the sample street images were scored by the elderly on a small scale; then the regression analysis was used to extract the street elements that the elderly care about. Last, the street elements were put into the random forest model to assess street space quality io a large scale. It was found that the green view rate and sidewalks are positively correlated with satisfaction, and the positive effect increases in that order. Roads, buildings, sky, vehicles, walls, ceilings, glass windows, runways, railings, and rocks are negatively correlated with satisfaction, and the negative effect increases in that order. The mean satisfaction score of the quality of street space for the elderly’s recreational physical activities in three central districts of Guangzhou (Yuexiu, Liwan, and Haizhu) is 2.6, among which Xingang street gets the highest quality score (2.92), and Hailong street has the lowest quality score (2.32). These findings are useful for providing suggestions to governors and city designers for street space optimization.

1. Introduction

Street space quality refers to the human perception of the environmental conditions associated with street space [1]. The key word in this terminology is quality that can be perceived in different contexts and may have various meanings regarding its use [2]. When it is applied to the concept of street spaces, quality generally refers to a degree of satisfaction related to the environmental conditions [3]. In this context, a considerable number of researchers have carried out studies to assess the multi-sensory qualities of street spaces, including the auditory quality, the smellscape, and the visual Streetscape [3]. In this paper, the focus is the measurement of visual Streetscape and users’ physical reflection of the static image of the space that is convinced to be the cornerstones of street activities [4].
Recently, the quality of street space is increasingly acknowledged for its importance for the well-being of urban populations. It is crucial for urban planners to understand the needs of different population groups for street space quality. However, there is a lack of studies focusing on the specific needs for high-quality street space by the elderly. The global population is aging at an unprecedented rate, with the proportion of the global population aged 60 and over projected to increase by 56% between 2015 and 2030 [5]. Good street space quality is beneficial to the physical and mental health of the elderly [6]. Older people living with good street space quality are able to conduct more physical leisure activities and develop social networks [7]. Therefore, it is highly significant to evaluate the quality of street space from the perspective of the elderly.
The existing studies evaluating street space quality for the whole population can be divided into three types based on the available data. The first type of studies is based on survey data [8]. For example, Ewing and Clemente [9] constructed an urban design quality evaluation system. By analyzing respondents’ ratings of Streetscape images, they quantitatively evaluated five spatial quality factors: enclosure, human scale, transparency, tidiness, and imageability. Based on the five factors, Tang and Long [10] refined the indicators of the user’s subjective evaluation part, so that the subjective scoring results could more easily reflect various aspects of the street space quality. Although these studies based on survey data had the advantage of detailed and direct responses of people’s views on the street space quality, they failed to evaluate the large-scale street space quality, limited by the small data sample size and the low efficiency of data collecting [11]. The second type of study is based on geotagged social media data (mainly including online social media data, cell phone signaling data, etc.) [12]. Thomas Louai et al. [13] conducted a classified study of the types and spatial distributions of people’s activities based on cell phone signaling data from 20 Spanish cities. Fang [14] measured street vitality of the main urban area in Nanjing using cell phone signaling data and points of interest (POI) data. Although geotagged social media data had the advantages of large sample size, strong real-time performance, and rich information [15], the reliability is hard to verify. The third type of study is based on street images. Nikhil Naik et al. carried out automatic machine learning to score millions of Google Streetscapes in five cities, including New York, NY, USA, to evaluate the perceived safety of street spaces [16]. Based on Baidu Streetscape data, Ye et al. adopted a machine learning algorithm to extract street spatial elements, and they employed a neural network algorithm to train evaluation models and further build the street place quality measurement mode [17]. Liu et al. evaluated the qualities of urban appearance using machine learning, but it was limited to architectural-level analysis [18]. The Streetscape data combine the strengths of survey data and geotagged social media data, including the large sample size and abundant objective information. Thus, increasing studies have highlighted the advantages of using Streetscape data to evaluate the street space quality [15].
Currently, the research on evaluating street space quality based on Streetscape data is mostly about the practice and discourse of streets in large urban downtown areas, historical and cultural districts, and hutongs in old urban areas, despite the possibility of large-scale utilization of Streetscape images [3,19,20]. Besides, the existing studies have mainly evaluated street space quality from the perspective of overall population but ignored the specific needs of older people. Finally, but most importantly, although the utilization of Streetscape data has achieved great progress in the automated assessment of space quality on a large scale [21,22], a sophisticated understanding on how to correlate the human perception with the urban space in a more logical way is lacking, which limits the performance of these methods in terms of accuracy and their applications in supporting public policy [18]. Especially for the understanding of street space quality, the key to the evaluation is an accurate and stable interpretation of quality by different groups of people because of the subjective nature of human opinions. Since the concept of quality can be interpreted with different meanings depending on its use, different social groups have diverse perceptions regarding their needs being met. In this context, it is necessary to determine the elements of high-quality street space that the elderly care about [2].
However, the indicators for evaluating street space quality in terms of physical conditions in existing studies tend to be unified, mainly including the green view rate, exposure to sky, interface enclosure, road motorization degree, etc. [10,23]. There is a lack of exploration of the other elements related to Streetscape image segmentation that enable meeting and influencing the needs of the elderly, such a rocks, chairs, ceilings, windowpanes, railings, etc. Therefore, the focus of this paper is to evaluate the space quality of urban streets based on Streetscape data from the perspective of the recreational physical activities of the elderly and the index system of street space quality is expanded with many elements affecting the satisfaction of the elderly.
Specifically, we propose a novel classification-then-regression strategy that starts with the deep-learning PSPNet image semantic segmentation model to extract physical-spatial conditions of the street environment, followed by a regression model to determine the Streetscape elements that concern the elderly for their leisure physical activities. Finally, we employ the random forest model in machine learning to realize the automatic evaluation of street space quality. The introduction of a classification-then-regression strategy can mitigate the uncertainty and instability of human perceptions, thus achieving better performance than existing research in a more effective way.
The objectives of this paper are to figure out: (1) the visual elements of urban street space that affect the recreational physical activity of older adults, and (2) how to achieve an automated assessment of the spatial quality of large-scale streets in the study area. Based on the Streetscape data and the sample of street space quality scored by the elderly, first, we use the PSPNet algorithm to extract the Streetscape elements related to the street space characteristics, then we determine the Streetscape elements affecting the street space quality of the physical leisure activities of the elderly through regression analysis, and last we use the machine learning and deep learning methods to realize the automatic evaluation of street space quality.
The rest of this article is organized as follows. Section 2 presents the study area and data. Section 3 introduces the three research methods adopted in this paper. Section 4 is about the findings and results. Section 5 clarifies the conclusions and the last section discusses the implications for future studies and policy-making.

2. Research Area and Data
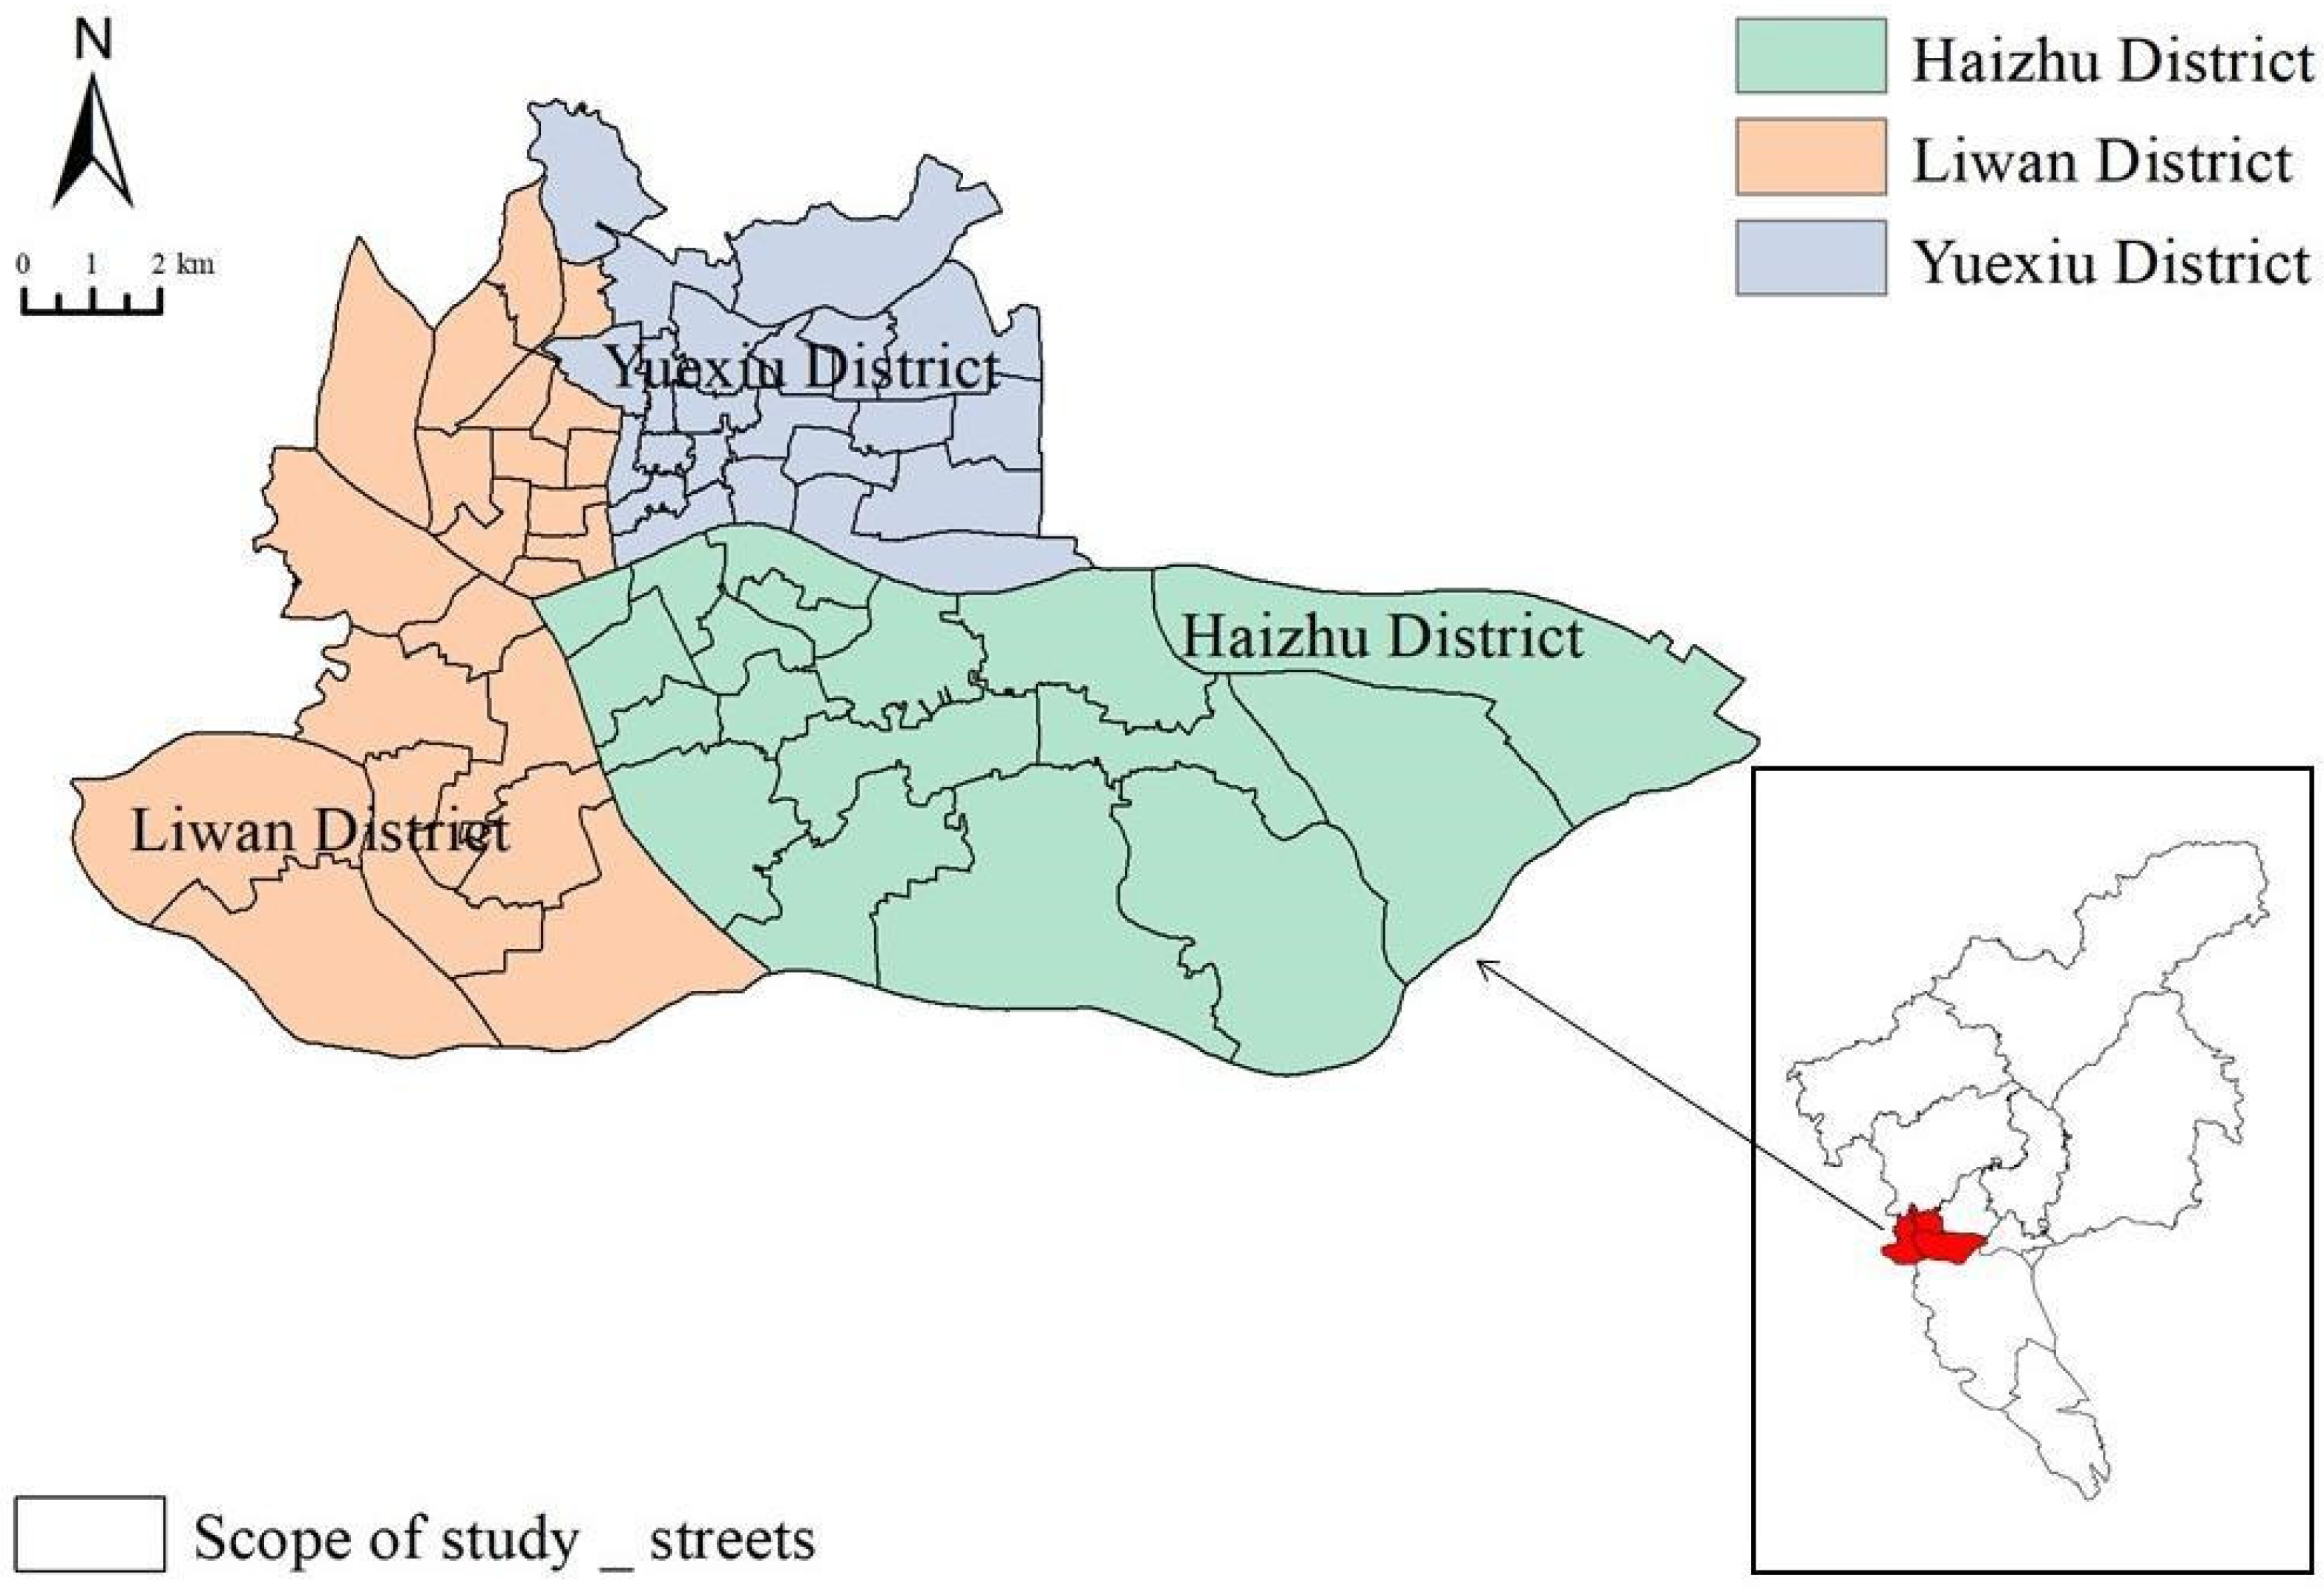
2.1. Research Area

Guangzhou, the capital city of Guangdong Province, located in the south of China, has one of the most aging populations in China. The three central districts of Guangzhou (i.e., Haizhu, Liwan, and Yuexiu) are the three areas with the most prominent aging-related challenges, with the proportion of the elderly population over 15%. Therefore, the three central districts (Figure 1) were selected as the areas for this study. Among them, Haizhu District includes 18 streets, Liwan District includes 22 streets, and Yuexiu District includes 22 streets.

2.2. Research Data

This paper mainly applies three types of data: road network data, Streetscape data, and the ratings of the quality of recreational physical activity by the elderly on the sample Streetscape data. Among them, road network data are used to determine the sampling points, Streetscape data are used to extract the Streetscape elements, and sample rating is used to determine the Streetscape element indicators that concern the elderly.

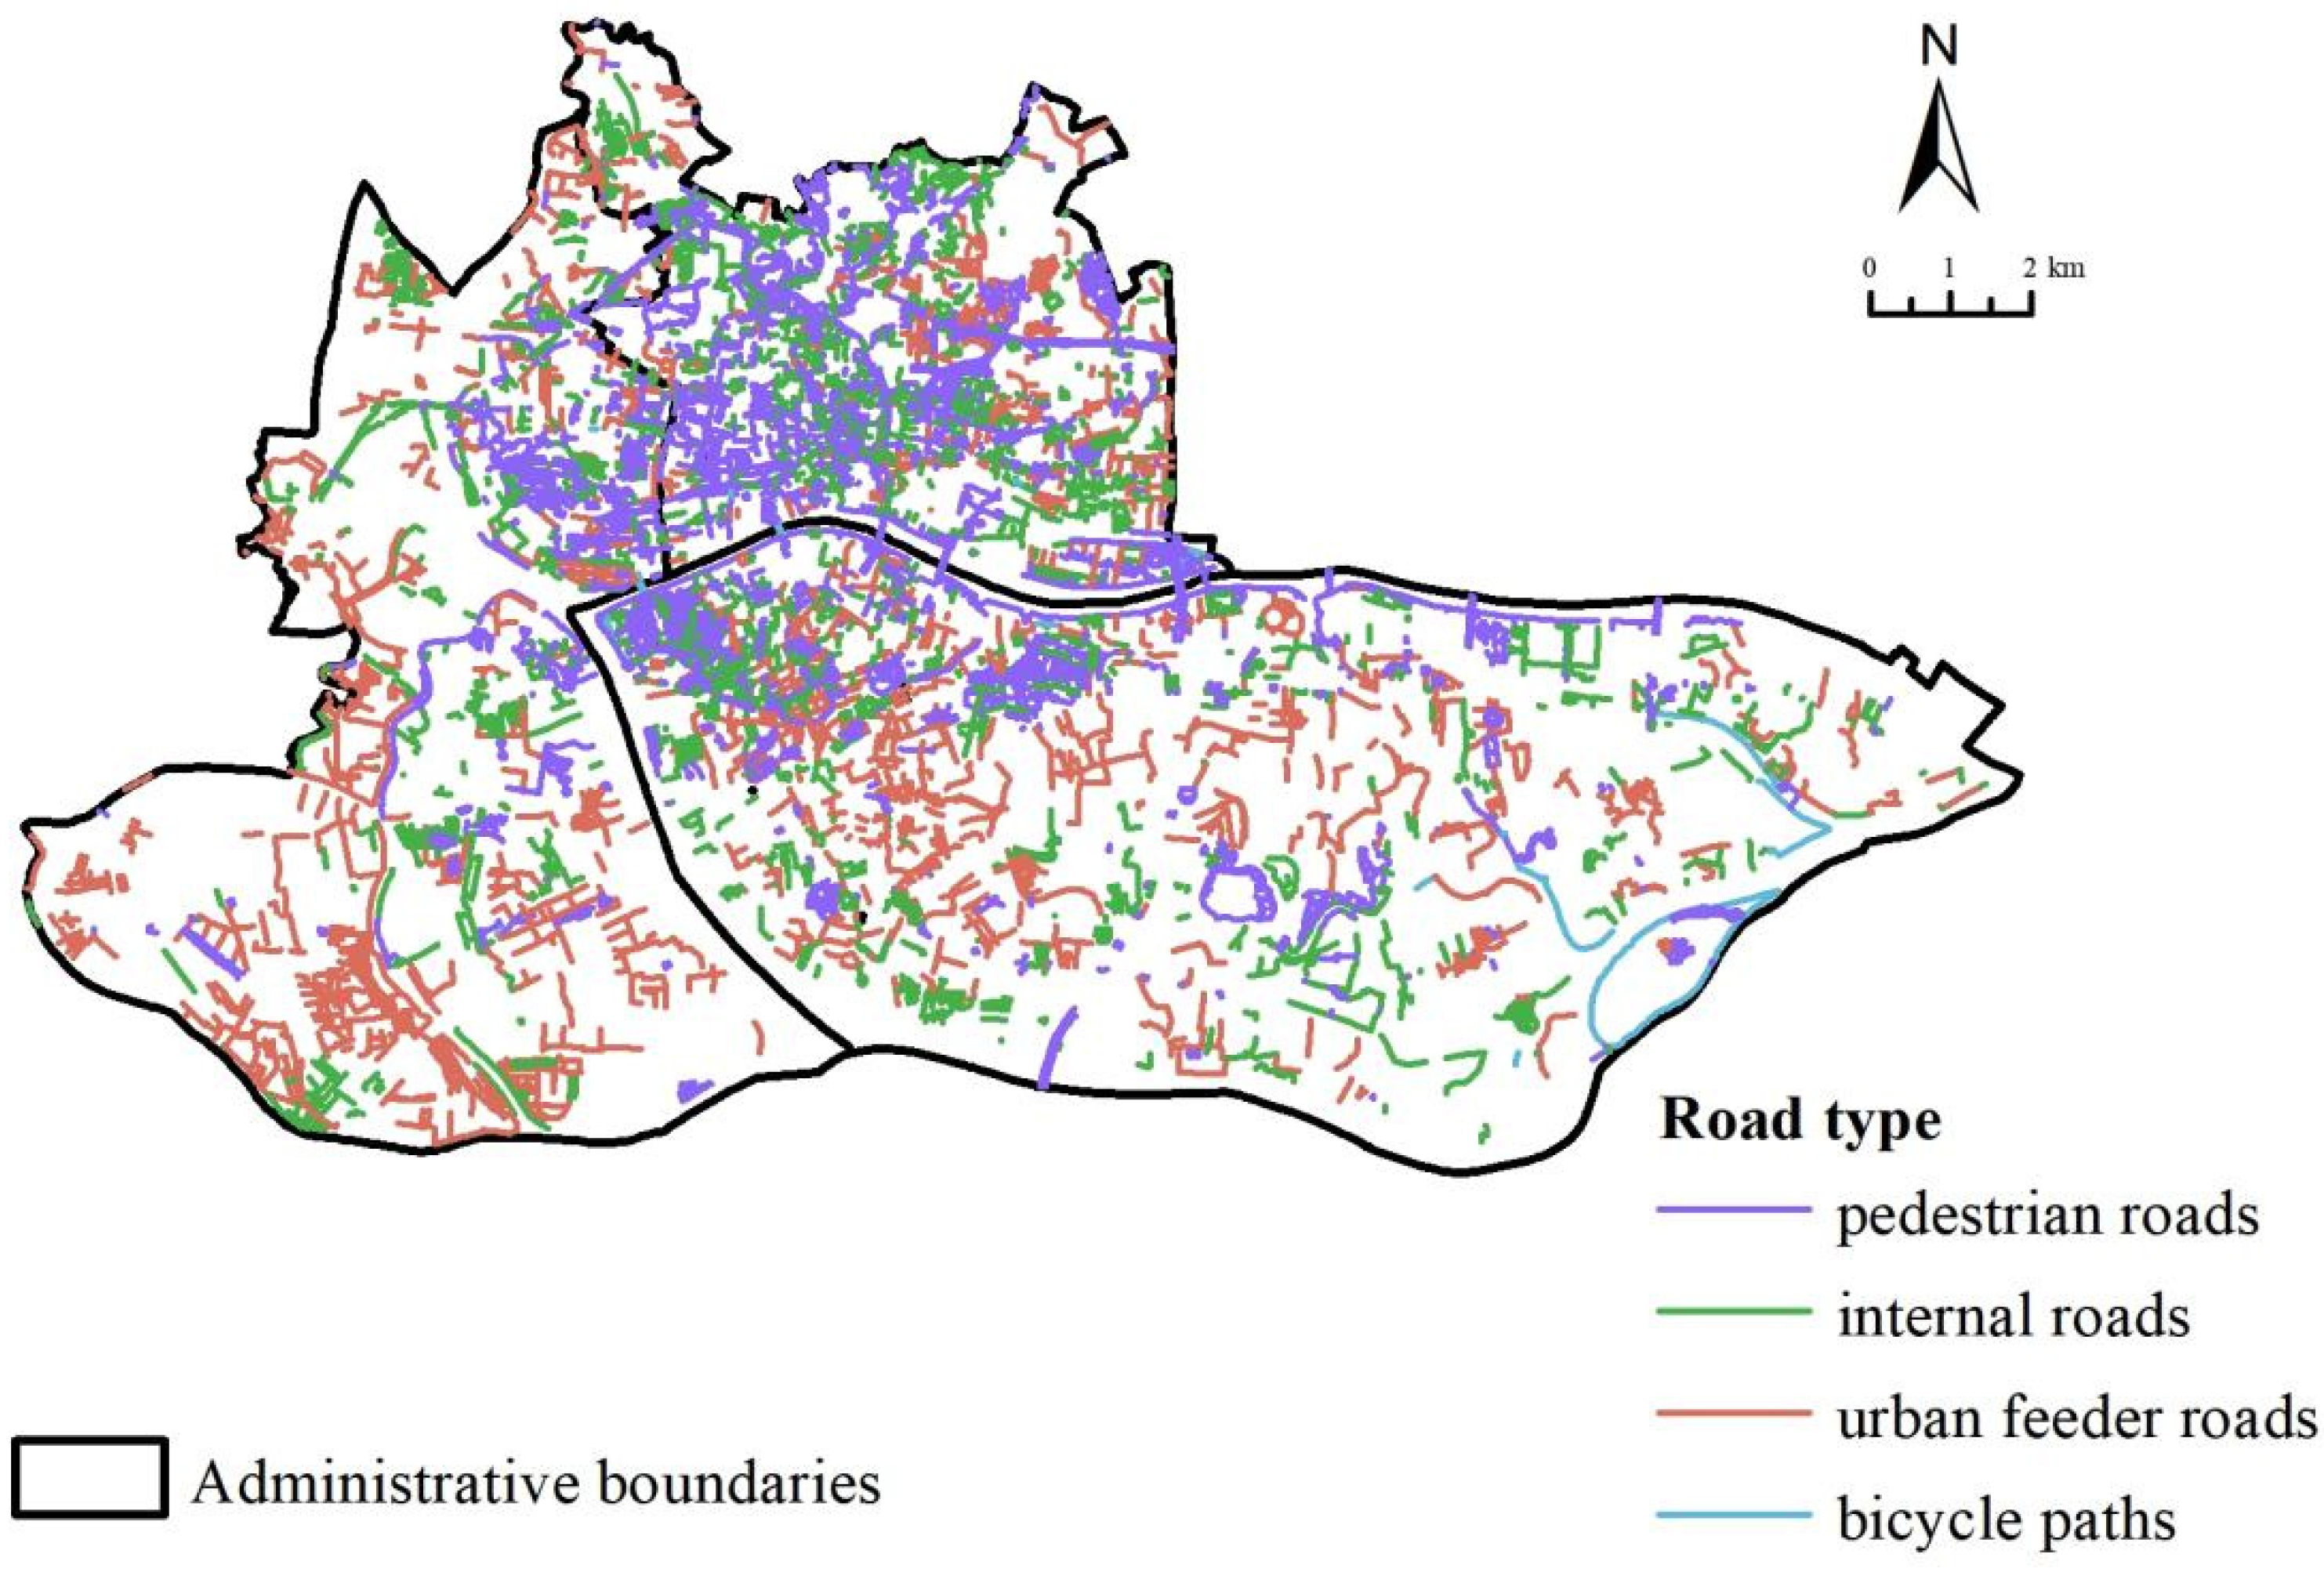
2.2.1. Road Network Data

Road network data are mainly used to determine the sampling points of Streetscapes. OpenStreetMap (OSM) is included as the data source of the road network in the research area, which contains detailed classification of road grades and types. As we are mainly concerned with streets where elderly people do recreational physical activities, we only study the pedestrian roads, internal roads, urban feeder roads, and bicycle paths. Figure 2 shows the spatial distribution of the studied roads.
First, the road network data is preprocessed by road type correction, topology correction, and geometry correction. Then, the Streetscape sampling points are obtained according to 100 m equal interval sampling, and 14,787 points can be obtained after a de-duplication process. Last, the latitude and longitude of the sample points are calculated by ArcGIS as the parameters for collecting Streetscape data. The spatial distribution is shown in Figure 3.

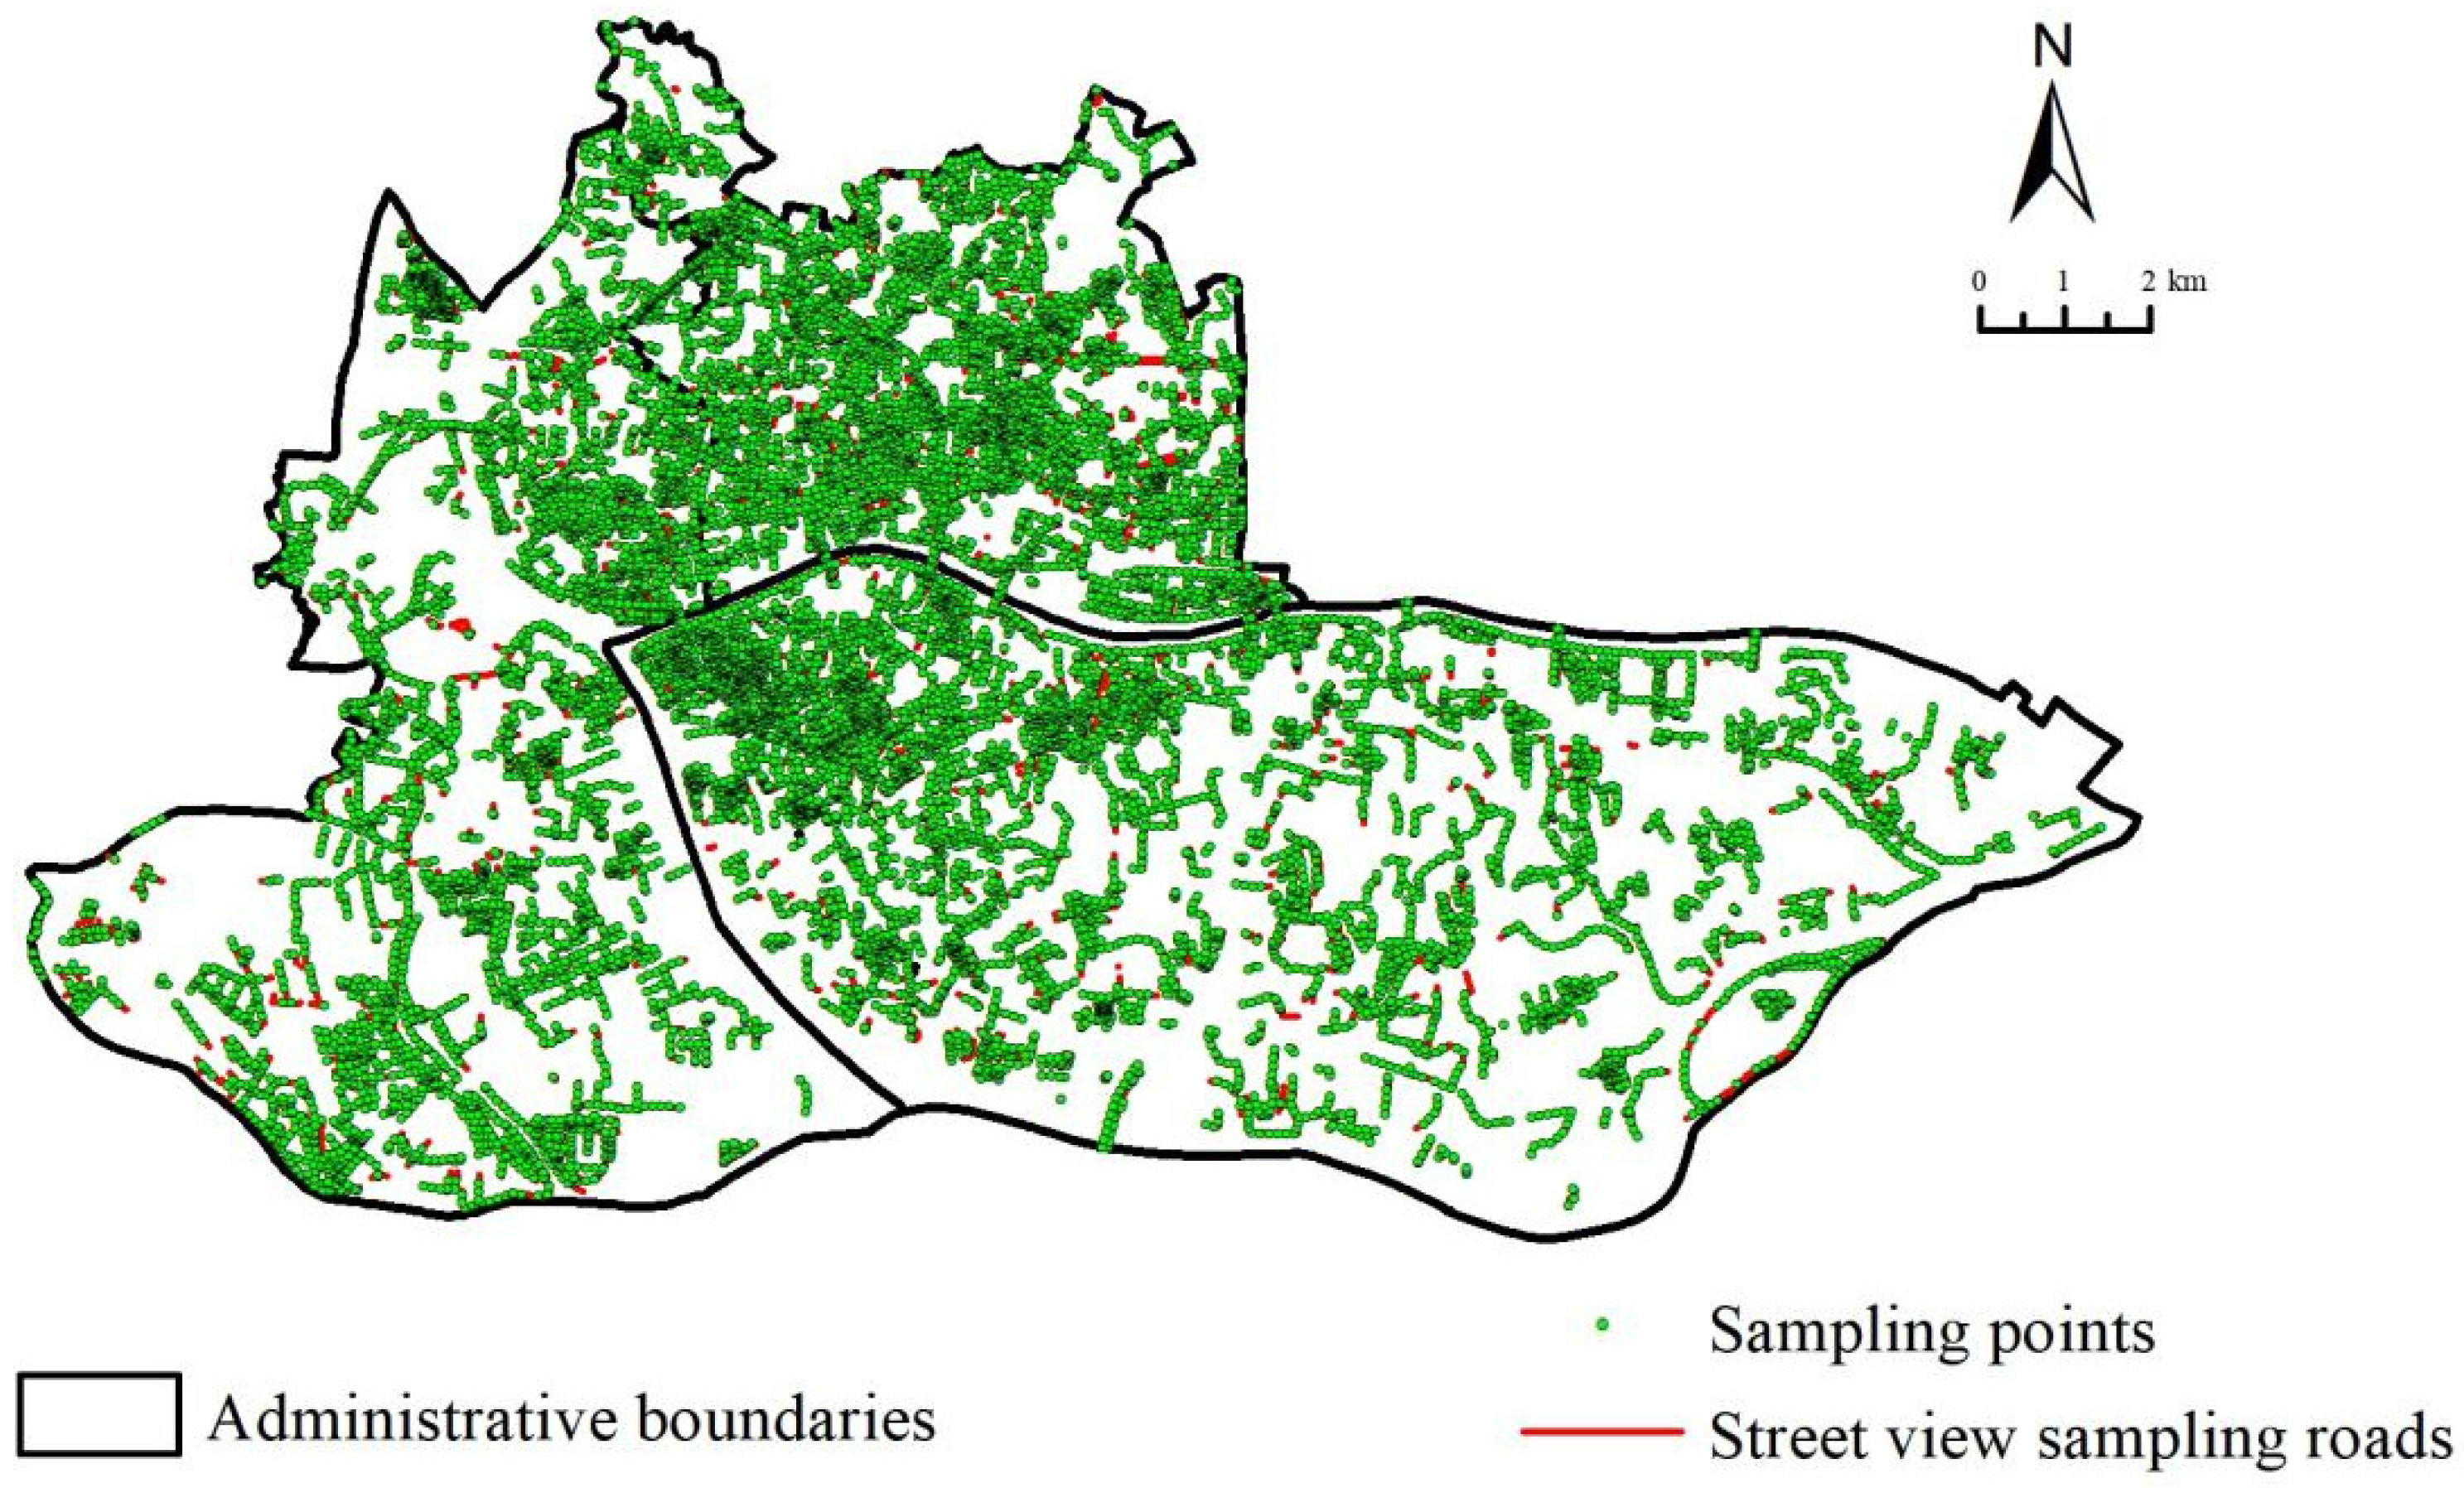
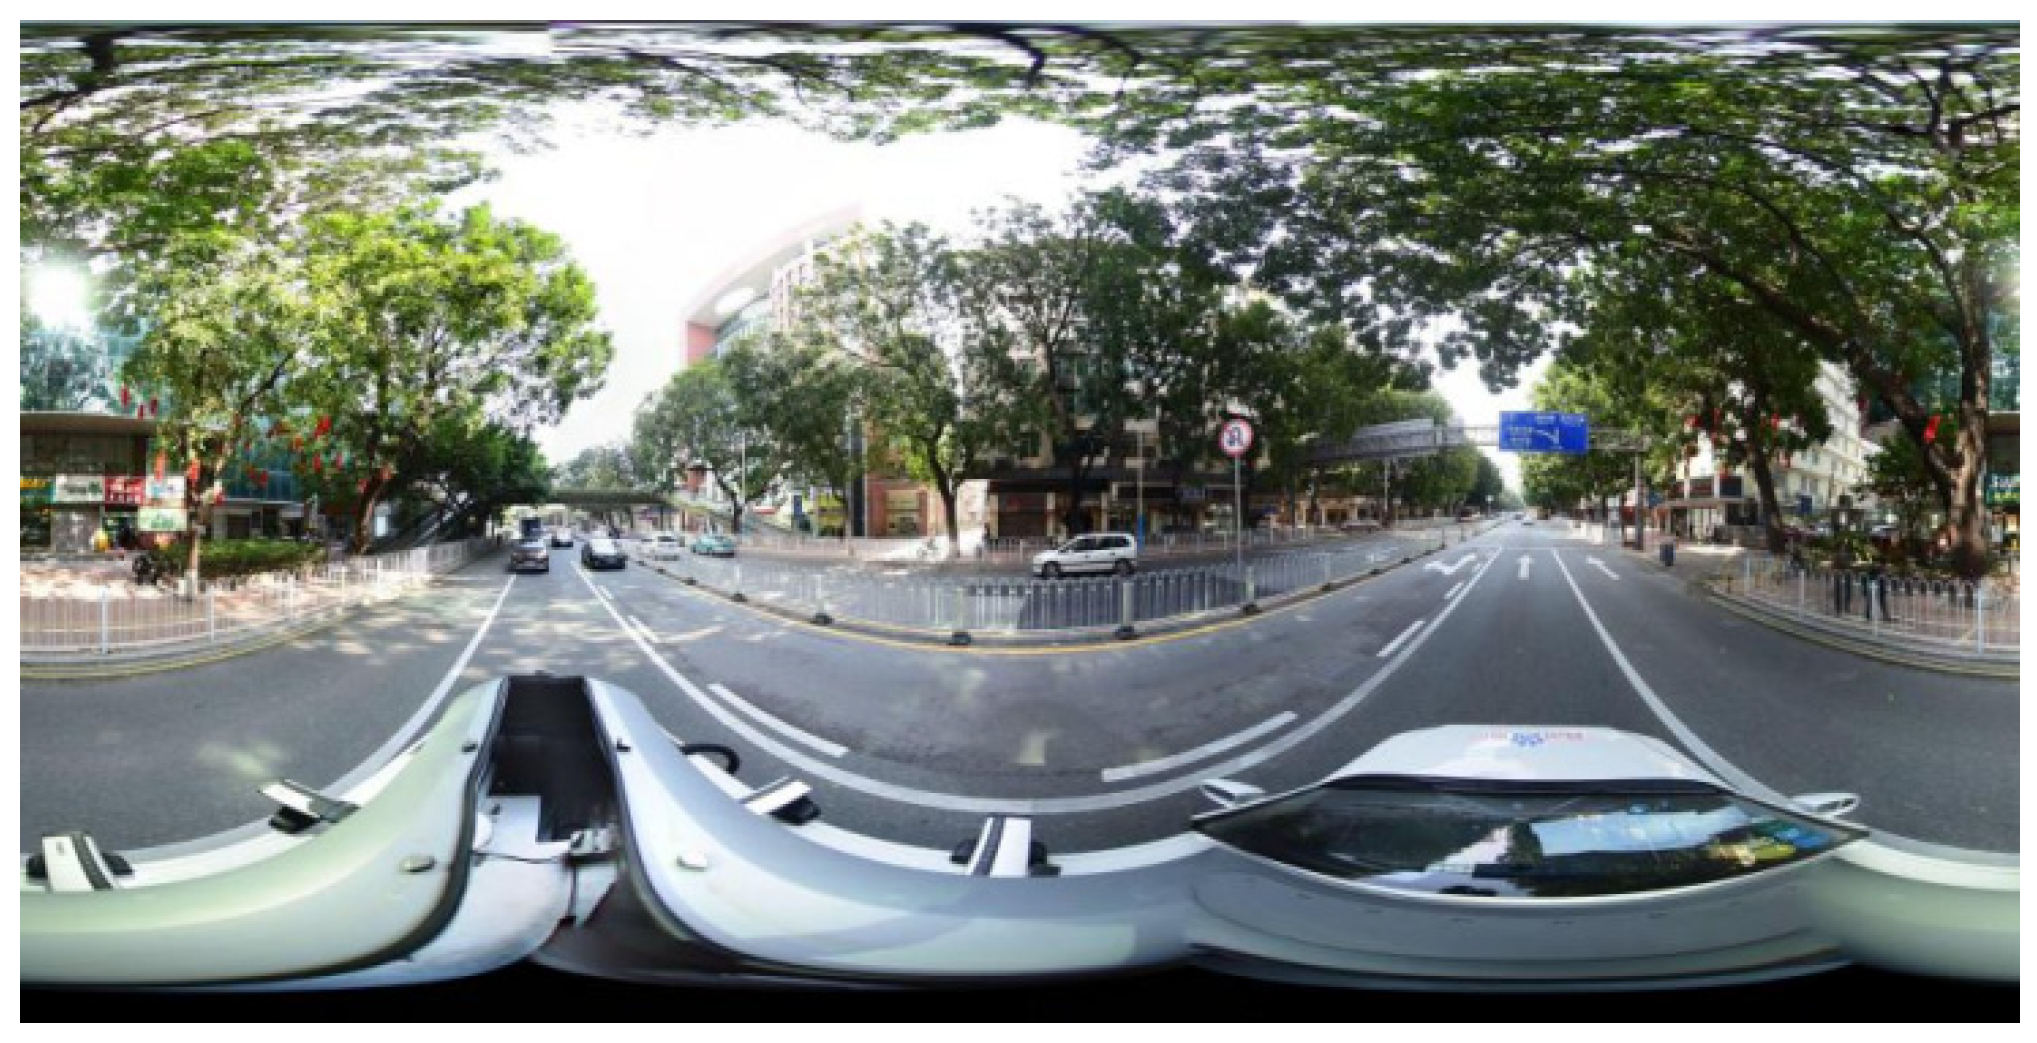
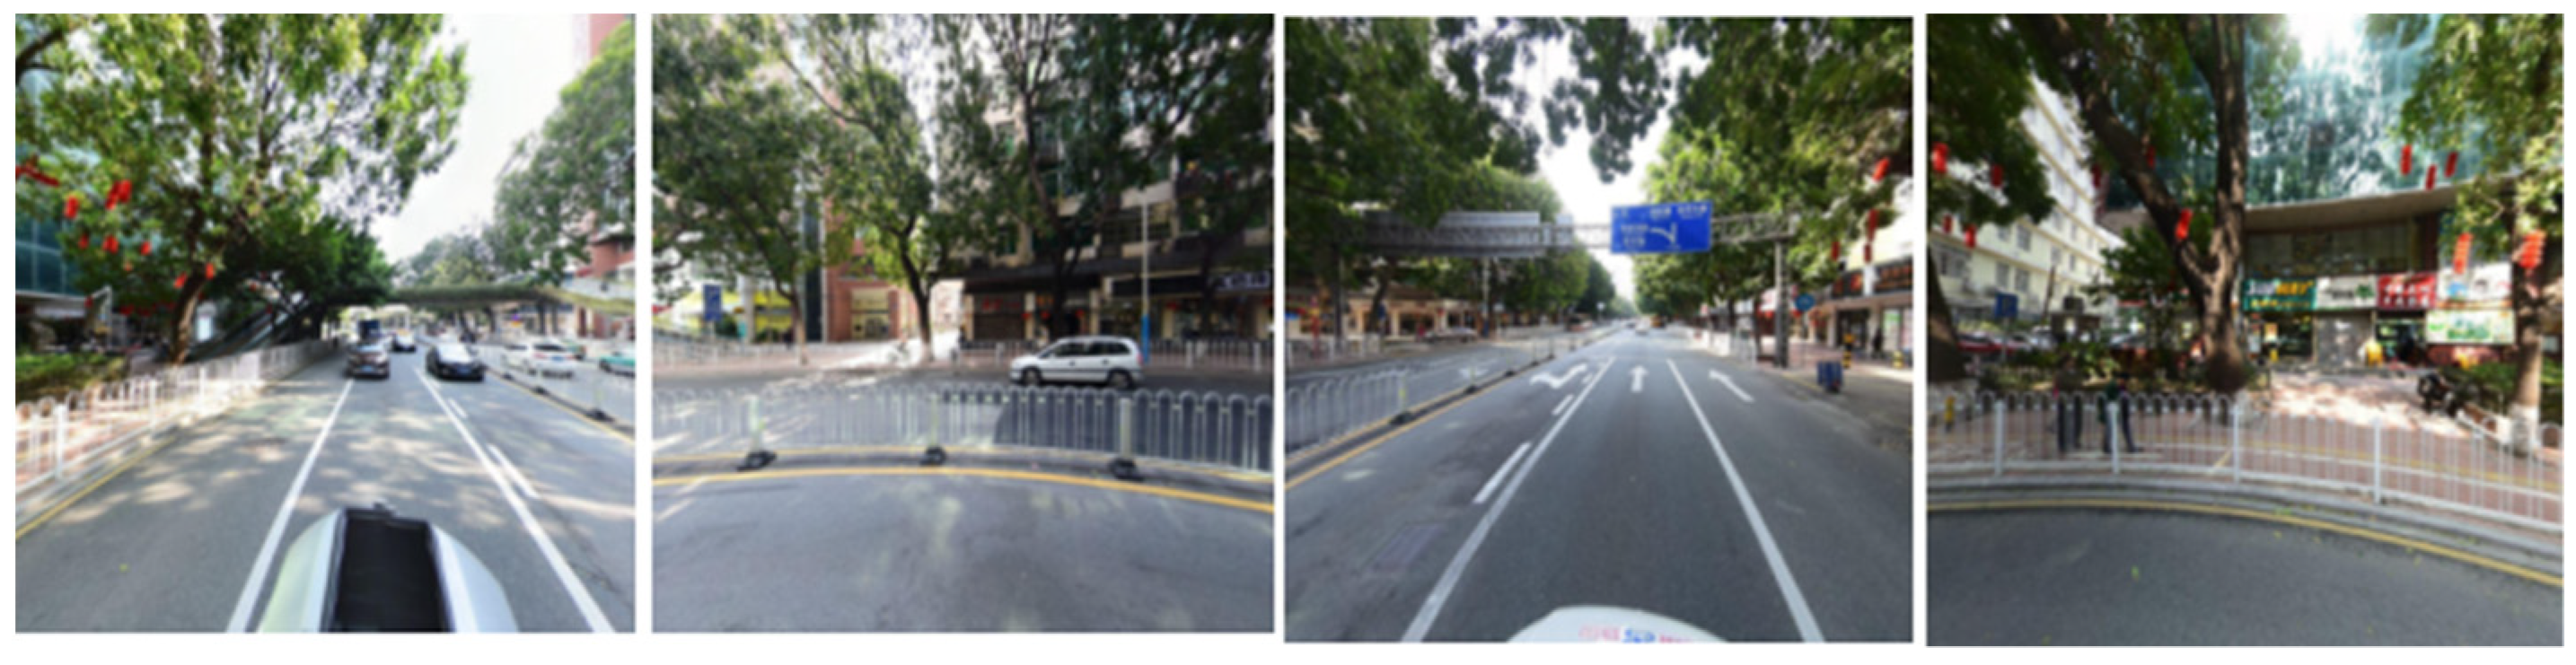
2.2.2. Streetscape Data

The Streetscape data are mainly used for extracting Streetscape elements. Traditionally, first-hand data are obtained from photographic records and several methods are taken to standardize the photographs and minimize variation for quantitative research on street space quality, which is costly, time-consuming and labor intensive [20]. With the emergence of the Street View Picture dataset and the development of image segmentation technology, an increasing number of studies have adopted panoramic street-level imagery that creates a continuous 360° image of a streetscape for street space quality analysis [3,20,24]. We are convinced that the image segmentation of 360° street images to expand the panorama into pictures in different directions can reflect real street scenes and get more accurate evaluations of street quality through repeated comparisons [1]. Compared to traditional methods, the use of panoramic street-level imagery has advantages in assessing large-scale street space quality effectively and economically [1,24]. In this context, a lot of companies including Tencent, Baidu, and Google provide API (Application Program Interface) for Streetscape downloading in their map products. Considering the quality of Streetscape, the availability of data crawling, data update time, and downloadable quantity, this paper adopts Baidu Streetscape images as the data source.
Streetscape data are from https://lbsyun.baidu.com/ (accessed on 20 March 2020). This paper collects Streetscape images of Yuexiu, Haizhu, and Liwan districts. First, we set the pitch angle of each sampling point to 0° (horizon angle). Then, we search the nearest Streetscape map within the scope based on the latitude and longitude coordinates of the sampling points gained by the Baidu panoramic coordinates pickup tool. Later, we apply the program to parse its URL address, and automatically combine the panoramic map tile data in its background to obtain a complete static panoramic image of 360° horizontal range of the point, which is a typical rectangular spherical panoramic image [25], as shown in Figure 4. Last, the computer segmentation program is used to expand the panorama into pictures in four directions, namely front, right, back, and left (i.e., 0°, 90°, 180° and 270°), which is shown in Figure 5. Eventually, a total of 14,569 panoramic pictures is obtained after removing useless data. These panoramic pictures represent 58,276 street images after being expanded, which are used for evaluating the street space quality.

2.2.3. Subjective Evaluation Data on the Street Space Quality at a Small Scale

The sample scoring data on the street space quality are collected from older people. Specifically, we employ questionnaires and interviews to evaluate the satisfaction of street space quality of leisure physical activity among the elderly. To ensure that the streets are roughly evenly distributed in space, three streets are randomly selected from each district and 100 street panoramas are randomly selected from each street; therefore, there are 900 street images in total.
First, in terms of selecting Streetscape image samples, the spatial and quantitative distribution of the overall sampling points are taken into account. Then, 1200 representative Streetscape images are initially selected and all the images are automatically calibrated in terms of brightness, chromaticity, light, etc. to reduce the potential influence of the light environment of the pictures themselves. Next, 900 Streetscape images with the spatial characteristics of the streets for the physical leisure activities of the elderly are selected manually, thus ensuring the representativeness and validity of the sample street scenes.
Second, in the research of the elderly to get a Streetscape image score, the subjects are 90 elderly people aged 60 and above in Guangzhou. For each street, since we do not know how many elderly people live in them, participants are recruited through convenience sampling with a number of 10. According to the definition of street space quality, the process of evaluation is a combined reflection of the physical and perceptual characteristics of the streets [2]. Especially, due to the limited range of activities of the elderly, it is of more practical significance to select the elderly who are familiar with the sampling streets in the sample selection for studying the quality of their activity space. Therefore, all the sampling people have been living there for a long time and often do physical activities, so they are for sure relatively familiar with the streets, which ensures the accuracy of their scoring of the sample pictures of the street. Before each respondent evaluates the Streetscape images, he or she needs to generally browse the images and understand all the pictures. A five-point Likert scale is applied, and the options “very poor, poor, fair, good, and very good” are valued “1, 2, 3, 4, and 5”, respectively [26]. The subjective quality score of each Streetscape sample map can be obtained by averaging the three scores. Meanwhile, to improve the accuracy of scoring and reduce the impact of mental memory on the evaluation results, before each scoring researchers emphasize to the respondents that the evaluation is about visual quality for physical activities. For example, a question such as, “If you look at this picture, from the point of view of physical leisure activity, such as whether it is suitable for you to take a walk, how would you like to see its quality?” is asked during the interview. Besides, further confirmation and double-check by means of in-depth interviews about reasons after scoring are conducted for analysis, so as to reduce the likelihood of biased responses.
Finally, the Streetscape sample results are scored as follows. The proportions of the five levels are shown in Table 1, and the sample Streetscape images are shown in Figure 6. From the table, most of the sampled Streetscape images score 2 or 3, with a total proportion of 84.11%. In contrast, the proportion of Streetscape images that scored 5 is very low, only 1.67%. From the sample of typical Streetscape images, the Streetscape with a score of 1 is very crowded. There are a lot of cars, little greenery, and very little space for pedestrians. By contrast, the Streetscape with a score of 5 has a very large proportion of greenery and a lot of space for pedestrians. They are mostly seen in parks with few cars, which makes the street space safer and more beautiful.

3. Research Methods

The research is carried out as follows. First, the deep learning PSPNet image semantic segmentation model is used to segment the collected Streetscape image elements to obtain the material element data of the street space. Then, the regression model is built for the scores of street space quality by the elderly and the street elements on a small scale. Finally, the random forest model is used to predict the large-scale street space quality based on the significant street elements of the regression model.

3.1. PSPNet

To quickly and effectively determine the physical-spatial conditions of the street environment, this study uses the PSPNet method to segment and assign meaningful labels to different pixel regions of Streetscape images.
The PSPNet [27] framework is a pixel-level image semantic segmentation network based on a convolutional neural network and pyramidal pooling model. Since it is very time- and resource-consuming to directly train based on the data, the pre-trained model is usually used for prediction. In this paper, the pre-trained weight files of PSPNet on the ADE20k dataset are downloaded for prediction. The Streetscape images obtained from each sampling point are put into the corresponding folder. After running the program, the results of image segmentation can be obtained.

3.2. Regression Analysis

To identify the space quality elements of streets that are of interest to the elderly for recreational physical activities, we conduct a regression analysis of elderly ratings and Streetscape elements by Stata software. First, 24 independent variables are screened out. A regression analysis of single-factor variables and dependent variables is conducted using a regression model, and the uncorrelated (significance > 0.05) variables are eliminated. Then, the remaining variables are tested for covariance to avoid collinearity. Last, the remaining independent variables are used to regress the elderly’s ratings.

3.3. Random Forest

To obtain large-scale street space quality scores for the study area, this research adopts a random forest algorithm in machine learning for street space quality prediction. Specifically, the 900 samples are randomly divided into training and test sets in a 7:3 ratio, and we ensure that the proportion of samples at five levels (1–5) in each dataset is approximately the same as the proportion of total samples. A subset of N, equal in size to the existing training data, is selected using random repeated sampling with put-back to grow N independent decision tree models.

4. Analysis Results

The research results are mainly analyzed from three aspects: (1) the pre-processing classification of the original extracted Streetscape elements, such as merging or deleting, to determine the Streetscape characteristics, (2) the exploration of the influencing factors of the quality of street space for senior citizens’ physical leisure activities, and (3) the analysis of the large-scale street space quality score in the study area.

4.1. Random Forest

During the PSPNet image semantic segmentation model experiment, the ADE20K dataset is used [28], containing 150 content labels. Through screening, 71 outdoor view labels are suitable for street environment identification. For the Streetscape image identification, considering some labels with similar contents in the original label list, the study combines parts of the similar labels (see Table 2). The 21 label pixels listed in Table 2 are the pixels with a higher proportion, and the sum of these pixels accounts for 99.04% of all, which basically represents the entire content of the image, while the percentage of other label pixels is too low (less than 0.05%), and it is difficult to recognize them visually; therefore, the 21 label pixels in Table 2 are mainly considered in this paper.
Specifically, Label 1 “Building 1” is combined with original labels including “building”, “door”, “house”, “toilet”, and “hovel”; Label 2 “Green view 2” is combined with original labels including “tree”, “plant”, “grass”, and “flower”; Label 3 “Vehicle 3” is combined with original labels including “car”, “bus”, and “truck”; Label 4 “Water 4” is combined with original labels including “water” and “sea”; Label 5 “Mountain 5” is combined with original labels including “mountain” and “hill”; Label 6 “Chair 6” is combined with original labels including “chair” and “seat”; Label 7 “Runway” refers to a narrow path within 1 m for people’s running and biking; Label 8 “Bike 8” is combined with original labels including “bicycle” and “minibike”; and “Total 9” represents the sum of the remaining labels’ pixels (except the top 21), accounting for 0.96% of the total.
In terms of the overall proportion of label pixels, the sum of labels, containing buildings, green view, roads, and sky, reaches 72.44%, which are the essential material elements of the street scene. The top eight labels with the highest proportion include buildings, green view, roads, sky, walls, floors, vehicles, and sidewalks. The proportion sum of their pixels is 92.79%, indicating that these elements appear in most Streetscape images, satisfying the need of daily street use. Other labels with smaller pixels such as ceilings, mountains, windowpanes, and brand names can be regarded as unique characteristics of some streets, which may play a key role in sensing the street space quality of senior citizens’ physical leisure activities.

4.2. Influencing Factors of the Quality of Street Space for the Elderly’s Leisure Physical Activity

By using a multiple linear regression model, it is possible to identify the elements affecting street space quality, which matters a lot for the elderly to do leisure activities. This can also facilitate the subsequent measurement of large-scale street space quality. More elaborately, the unrelated variables “floor”, “earth”, “person”, “mountain”, “chair”, “bike”, and variables that have covariance with the single elements (e.g., “enclosing”, “motorization”, and “walkability”) are first eliminated by single-factor analysis and covariance test. The remaining independent variables are then subjected to oprobit multiple linear regression with the elderly’s ratings. The results are shown in Table 3. The coefficient of determination (R2) of the model is 0.461, and the adjustable coefficient of determination (R2) is 0.452, both of which are greater than 40%, so the model is a good fit and basically describes the predicted street space quality.
From Table 3, the variables significantly associated with street space quality (p < 0.05) are as follows: “green view” and “sidewalk”, whose coefficient is positive, positively correlated with satisfaction; “road”, “building”, “sky”, “vehicle”, “wall”, “ceiling”, “windowpane”, “runway”, “railing”, and “rock”, whose coefficient is negative, negatively correlated with satisfaction and the negative effect increases. It is worth noting that the correlation results between “road”, “sky”, “railing” and street space quality are not consistent with some literature studies.
Specifically, a green view is positively related to street space quality, which coincides with most of the research, i.e., the larger the green view, the more green plants will be in the street, and the more conducive it is to creating a more ecological street space, which provides a pleasant environment for senior people and stimulates their participation in physical activities.
Open street space imagery enhances people’s willingness to hang out [29], and the elderly are more willing to do physical leisure activities there, and thus have higher satisfaction with the quality of the street space sidewalk.
For pedestrian-vehicle separated streets, safe walking space is provided, and studies have shown a strong positive correlation between the walking index and the elderly’s recreational physical activities [30]. Thus, sidewalks have a significant positive effect on the satisfaction of street space quality.
Wide streets tend to have more roadspace, most of which is traffic lanes, and there is less walking space, which is not suitable for senior citizens to do physical leisure activities, providing them less sense of safety. However, a study done by Liang et al. argues that the road has the function of a sidewalk and has a positive impact on the spatial quality of the street, as well as the sidewalk [31].
Areas where buildings are densely built tend to be more crowded and less walking-friendly, unsuitable for the elderly to do physical outdoor leisure activities, thus reducing their scores on the street space quality. This result is in contradiction to the space syntax walkability studies that reveal dense highly connected built environments promote physical activities. Potential reasons for this opposite direction may be the unique environmental aspect of our study area. Since Guangzhou is a city with high population and building densities, especially in the study areas of three central districts, this perhaps stifles people when buildings are more dense.
The proportion of sky can, to some extent, represent the exposure degree of the sky. Streets with more sky elements also tend to have fewer buildings, green plants, less sense of space and vitality, and be unsuitable for senior citizens to do physical outdoor leisure activities. However, some studies have also shown that a too high or too low sky exposure degree can reduce the quality of street space [32]. This is because too-wide skies tend to give people a sense of emptiness and bring them a poor spatial experience; too-low skies can cause a sense of visual closure and make people feel depressed psychologically, which will also affect the street wind environment and intensify the urban heat island effect [32].
Streets with a great number of vehicles make senior citizens feel unsafe, which does not conform with the prerequisite for the elderly’s hanging out, namely safety [33]. Even worse, the surrounding buildings might be under construction, not conducive for them to do physical leisure activities, thus negatively impacting the street space quality.
Streets with many walls tend to have an obvious enclosure effect on the space, blocking sight and making the space narrow. Especially in some construction sites, noise, dust, and other substantive environmental pollution is easily produced, which is not safe for the elderly, thus giving them a negative impression.
Streets with more ceilings tend to be underneath overpasses, in tunnels, or by large potted gardens, where the height of the outdoor space is limited. Generally, these areas are dark and humid or crowded with vehicles, unsuitable for senior citizens to do physical outdoor leisure activities, thus creating a negative impact on the street space quality.
Streets with more windowpanes tend to have more buildings, especially high-rise office buildings or large shopping malls. These places have a lot of foot traffic, and are noisy and crowded. Moreover, windowpanes in the light are likely to produce glare harmful to old people’s health, thus negatively influencing their comments on the street space quality.
Railings are often used to separate the sidewalk and roadway. Streets with more railings are often near viaducts or construction sites where it is hard to ensure people’s safety, thus they are unsuitable for elders to do physical outdoor leisure activities. However, some studies have argued that railings and sidewalks, which often appear together, are important elements that constitute street safety and therefore may also have a positive impact on the quality of the street space.
Streets with lots of rocks tend to be construction sites, with bricks and tiles and so on. Therefore, it is not safe for the elderly to do physical outdoor leisure activities in these areas.
Runways negatively correlate with the street space quality for senior citizens, mainly because the runways in parks are often occupied by young people, which increases the risk of pedestrian collision, unfriendly to some elders. However, the p value of a runway is close to 0.1, so the negative correlation is relatively not high.

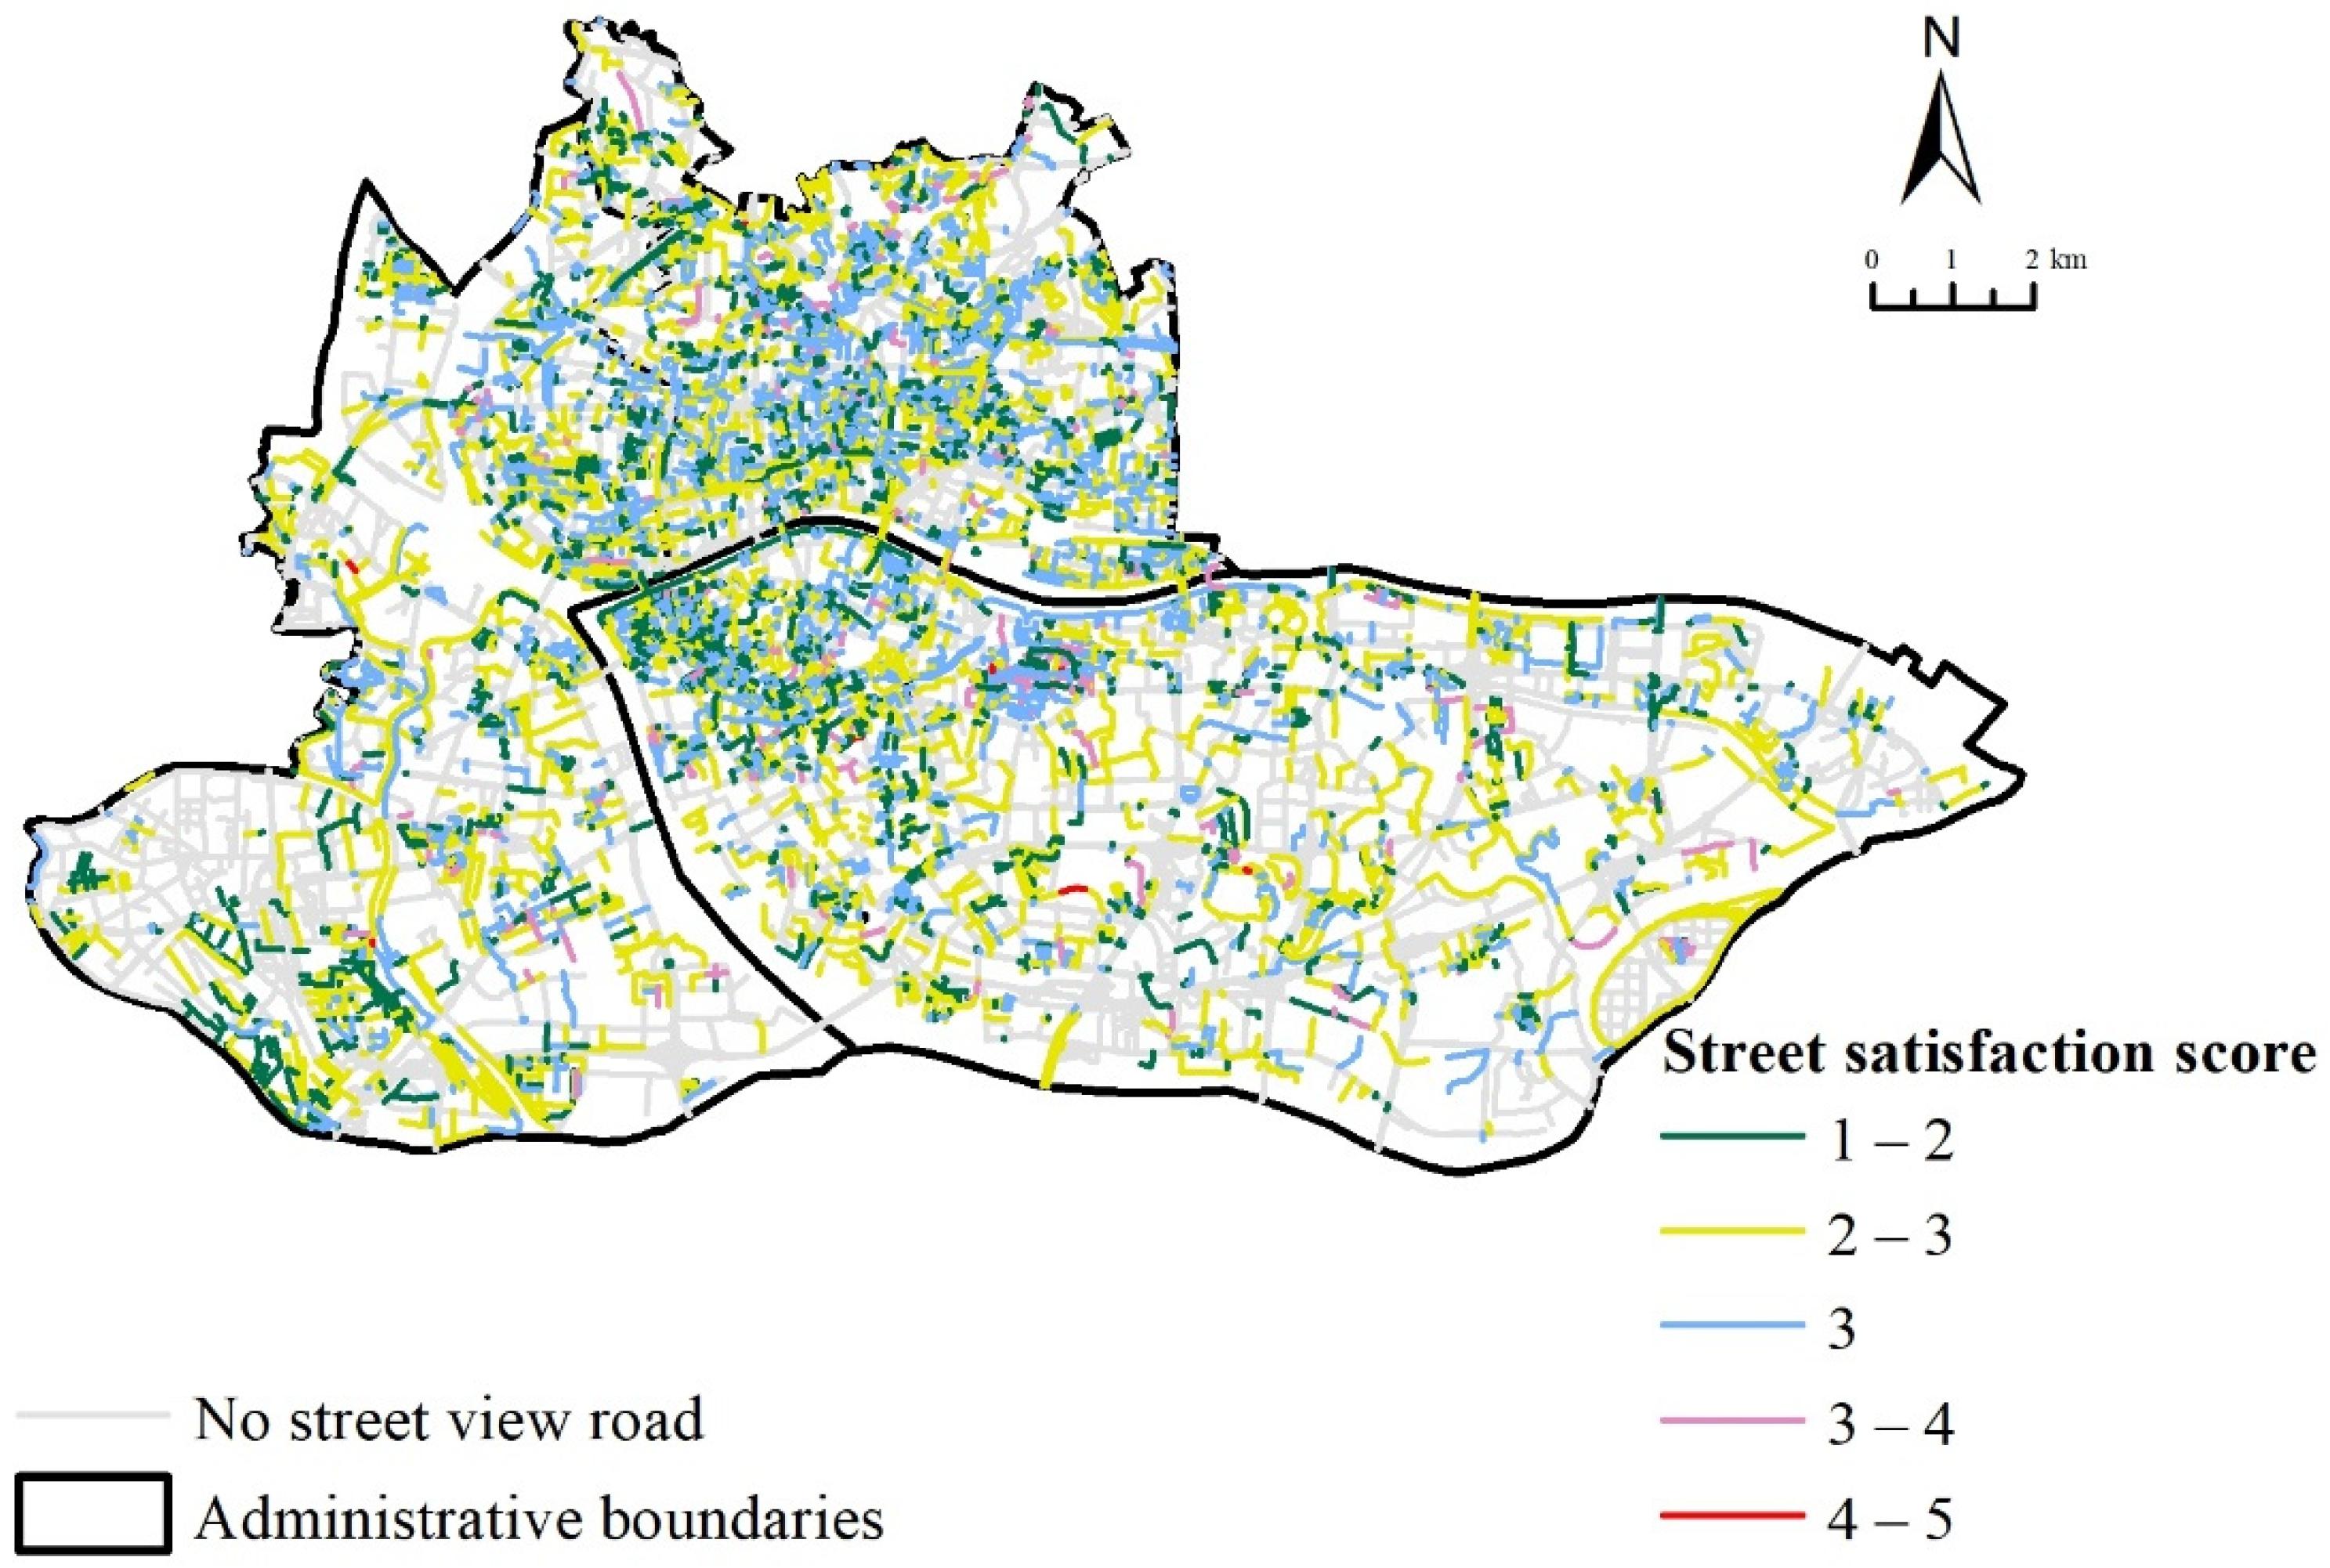
4.3. Large-Scale Street Space Quality Scores in the Study Area

The significant influencing elements of street spatial quality are input into the random forest algorithm to achieve the prediction of all street space quality scores in the study area. From the result accuracy and the total model error predicted with the calculation model, it can be found that the total model error tends to stabilize when 143 decision trees are generated, so the significant parameters for debugging the random forest model are determined. Then in the prediction of the street space quality of all samples, the last used model prediction accuracy is 70.6%, over 70%, and the probability of one-level deviation (e.g., “satisfied” is misjudged as “so-so”) is 27.6%. Therefore, the probability of accurate prediction or one-level deviation is 98.5%, over 95%, which is basically consistent with the error of subjective judgment. The prediction error of the model is acceptable for a large-scale street space quality measurement. Finally, the street space quality scores of all the streets in the study, the space distribution of nuclear density, and the space quality scores of 62 street elements in the study area are visualized in ArcGIS, as shown in Figure 7, Figure 8 and Figure 9.
As can be seen in Figure 7, the scores of the street space quality of senior citizens’ physical leisure activities in Guangzhou’s three central districts are mainly in two sections, 2–3 point and 3–4 point. Few streets are scored 1 or 5. The average value of the overall satisfaction is 2.6, which shows great room for improvement in street space quality. Streets with satisfaction of 4–5 have more green views, more sidewalks, and fewer people, vehicles, and buildings. Many of them are distributed near parks.
In Figure 8, the medium and low scores are relatively well-distributed. Yuexiu District enjoys a high overall satisfaction of the street space quality. The highest scores are mostly centered around the border of Longfeng Street, Datang Street, and Nonglin Street, as well as Qianzhong Street, in the northwest of Haizhu and Liwan District and the middle of Yuexiu District.
As shown in Figure 9, most of the 62 streets are scored below the average of 2.6. Among them, Xin’gang Street has the highest score of 2.92. A possible reason is that many levels of schools, including Sun Yat-Sen University and many secondary schools, where the overall greenery is good are located on these streets. The street also has outstanding cultural and sports undertakings, with more active mass cultural and arts teams and more cultural and sports venues, such as the Guangzhou Sailing Club at the North Gate Square of Sun Yat-sen University, which are conducive to strengthening the social and emotional ties of the elderly and thus have higher satisfaction with the quality of the street space.
In comparison, Hailong Street gains the lowest score of 2.32. More trunk roads and fewer sidewalks can explain the lowest score. From the perspective of element proportion, in Hailong Street, the proportion of sidewalk is the lowest and the green view is close to the minimum. At the same time, the proportion of sky is the highest, and the proportion of windowpane, ceiling, railing, and runway is greater than the average, and the proportion of wall is close to the maximum. Therefore, Hailong Street is in urgent need to improve its street space quality to encourage senior citizens to carry out physical leisure activities.

5. Conclusions

Traditionally, first-hand data on street space quality were obtained from photographic records and manual investigations combined with expert scoring and weight assignment methods, which is time-consuming, arduous for obtaining data, and labor intensive [20]. With the development of Streetscape images and computer technologies such as deep learning and machine learning, a large-scale and high-precision quantitative measurement of street space quality in urban region is achieved [18,24]. Given the limitation that the previous research did not explore the specific needs of the elderly [20,21], this study evaluates street space quality from the perspective of senior citizens’ physical leisure activities based on Streetscape data, which can make up for the lack of theoretical research on space quality of urban streets for the elderly, laying a theoretical foundation for future research. Moreover, a novel classification-then-regression strategy based on the PSPNet and random forest algorithm is proposed, which can mitigate the uncertainty and instability of quality evaluation caused by the subjective nature of human perceptions and achieve better accuracy than existing studies [2,20]. Meanwhile, in order to avoid the ignorance of the diverse perspectives of different groups of people when other researchers evaluated street pace quality [3,21], we capture street view images with multiple elements of physical appearance and expand the index system of high-quality street space that the elderly care about. Taking Guangzhou, which has a serious aging-related challenge, as an example, the paper explores the street space quality of senior citizens’ physical leisure activities based on Streetscape images of the three central districts (Yuexiu District, Liwan District and Haizhu District). The conclusions are as follows:
First, the Streetscape elements influencing the street space quality of senior citizens’ physical leisure activities mainly consist of green view, building, sky, vehicle, wall, person, and sidewalk. Among them, “green view” and “sidewalk” are positively correlated with satisfaction; “road”, “building”, “sky”, “vehicle”, “wall”, “ceiling”, “windowpane”, “runway”, “railing”, and “rock” are negatively correlated with satisfaction and the negative effect increases.
Second, the average value of the overall satisfaction in Guangzhou’s three central districts (Yuexiu, Liwan, and Haizhu) is 2.6, the minimum 1 and the maximum 5. Based on the kernel density analysis, the medium and low scores of the street space quality are relatively well-distributed. The highest scores are mostly centered around the border of Longfeng Street, Datang Street, and Nonglin Street, as well as Qianzhong Street, in the northwest of Haizhu and Liwan District and the middle of Yuexiu District. Besides, Yuexiu District enjoys a high overall satisfaction. Among the 62 streets, Xin’gang Street gets the highest score (2.92), whereas Hailong Street has the lowest score (2.32), indicating that it is in urgent need to improve the street space quality to encourage senior citizens to carry out physical leisure activities.
Third, based on the poorest quality of Hailong Street, more efforts could be made for the improvement of urban street space, such as expanding the narrow pavement, beautifying the green environment, and appropriately reducing the proportion of “sky”, “wall”, “ceiling”, “runway”, “railing”, and “windowpane”. Furthermore, vertical green designs, such as adding more green plants to the walls along streets, can be used to improve the quality of street space.

6. Discussion

This study is not confined to the traditional and inherent evaluation index. Based on the perspective of senior citizens, it extracts the concerned Streetscape elements, and then inputs them into the random forest model in machine learning, thus gaining the street quality evaluation from the perspective of the elderly and expanding the index system of street space quality elements. This study can make up for the deficiency of current research on space street quality for the physical leisure activities of the elderly, laying a theoretical foundation for future research. In addition, it also avoids the shortage of small data, high cost, and low efficiency of the traditional research methods. With Streetscape images and computer technologies such as deep learning and machine learning, a large-scale and high-precision quantitative measurement of street space quality can be achieved.
However, limitations also exist in the street space quality analysis with Streetscape images. Because of the characteristic of Streetscape involving car driving and shooting, Streetscape images still have certain differences in perspective from human eyes. The data of some areas that Streetscape cars cannot enter are still missing. For example, the study focuses on the streets where senior citizens do physical leisure activities, mainly sidewalks or inner roads. It is difficult for Streetscape cars to enter these areas and take pictures, leading to a lack of data, which may further affect the overall evaluation. Moreover, the time differences of the Streetscape pictures shot in different streets can interfere with the analysis of elements such as pedestrians and vehicles, which would affect the interpretation of the Streetscape image recognition to a certain extent. Therefore, in future research, field survey can help collect the data of the areas that Streetscape cars cannot enter. Besides, the sample size of the elderly should be further increased. Finally, better evaluation methods like the ELO system can be adopted to score the image quality, making the research data more accurate and further reducing the error of the evaluation model.
This work shows the value of employing Streetscape images and conducting machine learning and deep learning methods to evaluate urban space quality. The results of this work reveal visual elements of urban street space that are highly associated with the recreational physical activities of elderly people. By identifying streets of lower quality, some significant implications from this work can be provided to governors and city designers and help guide urban planning decisions aimed at improving space quality. The methodology framework and analysis process in this study can be replicated and applied in other cities with proper adjustments of details, which provides meaningful insights for academic research and practical experience in the field.

Author Contributions

Conceptualization, Ying Du and Wei Huang; writing—original draft, Ying Du; writing—review and editing, Ying Du and Wei Huang. All authors have read and agreed to the published version of the manuscript.

Funding

This research received no external funding.

Institutional Review Board Statement

Not applicable.

Informed Consent Statement

Informed consent was obtained from all subjects involved in the study.

Data Availability Statement

The data presented in this study are available on request from the corresponding author.

Conflicts of Interest

The authors declare no conflict of interest.

References

  1. Li, S.; Ma, S.; Tong, D.; Jia, Z.; Li, P.; Long, Y. Associations between the quality of street space and the attributes of the built environment using large volumes of street view pictures. Environ. Plan. B Urban Anal. City Sci. 2021, 23998083211056340. [Google Scholar] [CrossRef]
  2. Doğan, U. A comparison of space quality in streets in the context of public open space design: The example of Izmir, Barcelona, and Liverpool. J. Urban Aff. 2021. [Google Scholar] [CrossRef]
  3. Tang, J.; Long, Y. Measuring visual quality of street space and its temporal variation: Methodology and its application in the Hutong area in Beijing. Landsc. Urban Plan. 2019, 191, 103436. [Google Scholar] [CrossRef]
  4. Lynch, K. Good City Form; The MIT Press: Cambridge, UK, 1984. [Google Scholar]
  5. United Nations, 2015a. World Population Ageing 2015. United Nations, New York. United Nations, 2015b. Transforming Our World: The 2030 Agenda for Sustainable Development. Available online: http://sustainabledevelopment.un.org/content/documents/7891Transforming%20Our%20World.pdf (accessed on 12 January 2016).
  6. Yeh, C.Y.; Chang, C.K.; Yang, F.A. Applying a Treatment Effects Model to Investigate Public Amenity Effect on Physical Activity of the Elderly. J. Aging Soc. Policy 2018, 30, 72–86. [Google Scholar] [CrossRef] [PubMed]
  7. Meng, L.C.; Wen, K.H.; Zeng, Z.J.; Brewin, R.; Fan, X.; Wu, Q. The Impact of Street Space Perception Factors on Elderly Health in High-Density Cities in Macau—Analysis Based on Street View Images and Deep Learning Technology. Sustainability 2020, 12, 1799. [Google Scholar] [CrossRef] [Green Version]
  8. Chester, H.; Lisa, A. Measuring Urban Streetscapes for Livability: A Review of Approaches. Prof. Geogr. 2016, 68, 149–158. [Google Scholar]
  9. Reid, E.; Otto, C. Measuring Urban Design: Metrics for Livable Places; Island Press: Washington, DC, USA, 2013. [Google Scholar]
  10. Tang, J.X.; Long, Y. Metropolitan Street Space Quality Evaluation: Second and Third Ring of Beijing, Inner Ring of Shanghai. Planners 2017, 33, 68–73. [Google Scholar]
  11. Long, Y.; Tang, J.X. Large-scale Quantitative Measurement of the Quality of Urban Street Space: The Research Progress. City Plan. Rev. 2019, 43, 108–110. [Google Scholar]
  12. Li, B.Y. Study on the Spatial Quality Measurement of Living Streets in the Southwest Area of Mingcheng District Based on Multi-Source Big Data. Ph.D. Thesis, Xi’an University of Architecture and Technology, Xi’an, China, 2021. [Google Scholar]
  13. Louail, T.; Lenormand, M.; Ros, O.G.C.; Picornell, M.; Herranz, R.; Frias-Martinez, E.; Ramasco, J.; Barthelemy, M. From mobile phone data to the spatial structure of cities. Sci. Rep. 2014, 4, 5276. [Google Scholar] [CrossRef] [PubMed] [Green Version]
  14. Fang, Y.H. The Measurement and Influence Mechanism of City Street Vitality. Ph.D. Thesis, Southeast University, Nanjing, China, 2018. [Google Scholar]
  15. Zhang, L.Y.; Pei, T.; Chen, Y.J.; Song, C.; Liu, X. A Review of Urban Environmental Assessment based on Street View Images. J. Geo-Inf. Sci. 2019, 21, 46–58. [Google Scholar]
  16. Naik, N.; Philipoom, J.; Raskar, R.; Hidalgo, C. Streetscore: Predicting the Perceived Safety of One Million Streetscapes. In Proceedings of the Computer Vision and Pattern Recognition Workshops (CVPRW), 2014 IEEE Conference on, Columbus, OH, USA, 23–28 June 2014; pp. 793–799. [Google Scholar]
  17. Ye, Y.; Zhang, S.H.; Zhang, X.H.; Zeng, W. Human-scale Quality on Streets: A Large-scale and Efficient Analytical Approach Based on Street View Images and New Urban Analytical Tools. Urban Plan. Int. 2019, 34, 18–27. [Google Scholar] [CrossRef]
  18. Ji, H.; Qing, L.; Han, L.; Wang, Z.; Cheng, Y.; Peng, Y. A New Data-Enabled Intelligence Framework for Evaluating Urban Space Perception. ISPRS Int. J. Geo-Inf. 2021, 10, 400. [Google Scholar] [CrossRef]
  19. Dai, Z.M.; Hua, C. The Improvement of Street Space Quality Measurement Method Based on Streetscape. Planners 2019, 35, 57–63. [Google Scholar]
  20. Liu, M.; Jiang, Y.; He, J. Quantitative Evaluation on Street Vitality: A Case Study of Zhoujiadu Community in Shanghai. Sustainability 2021, 13, 3027. [Google Scholar] [CrossRef]
  21. Zhang, F.; Zhou, B.; Liu, L.; Liu, Y.; Fung, H.H.; Lin, H.; Ratti, C. Measuring human perceptions of a large-scale urban region using machine learning. Landsc. Urban Plan. 2018, 180, 148–160. [Google Scholar] [CrossRef]
  22. Dubey, A.N.N.; Parikh, D.; Raskar, R.; Hidalgo, C.A. Deep Learning the City: Quantifying Urban Perception at a Global Scale. In European Conference on Computer Vision; Springer: Cham, Switzerland, 2016; pp. 196–212. [Google Scholar]
  23. Alexander, C. A Pattern Language: Towns, Buildings, Construction; Oxford University Press: New York, NY, USA, 1977. [Google Scholar]
  24. Cinnamon, J.; Jahiu, L. Panoramic Street-Level Imagery in Data-Driven Urban Research: A Comprehensive Global Review of Applications, Techniques, and Practical Considerations. ISPRS Int. J. Geo-Inf. 2021, 10, 471. [Google Scholar] [CrossRef]
  25. Gao, L. Research on the Change of Urban Street Space Quality Based on Street View Image Recognition—A Case Study of Shijingshan. Master’s Thesis, North China University of Technology, Beijing, China, 2021. [Google Scholar]
  26. Song, Y.L.Q. Evaluation Research on the Building Environment of the Elderly Leisure-time Physical Activity Urban Community. Ph.D. Thesis, Nanjing Normal University, Nanjing, China, 2017. [Google Scholar]
  27. Zhao, H.; Shi, J.; Qi, X.; Wang, X.; Jia, J. Pyramid Scene Parsing Network. In Proceedings of the IEEE Conference on Computer Vision and Pattern Recognition (CVPR), Honolulu, HI, USA, 21–26 July 2017; pp. 2881–2890. [Google Scholar]
  28. Zhou, B.; Zhao, H.; Puig, X.; Xiao, T.; Fidler, S.; Barriuso, A.; Torralba, A. Semantic Understanding of Scenes Through the ADE20K Dataset. Int. J. Comput. Vis. 2019, 127, 302–321. [Google Scholar] [CrossRef] [Green Version]
  29. Xu, L.Q.; Jiang, W.J.; Chen, Z. Study on Perceived Safety in Public Spaces: Take Perception of Stree View in Shanghai as an Example. Landsc. Archit. 2018, 25, 23–29. [Google Scholar]
  30. Wu, Y.H.; Wang, J.L. A Review of the Effects of Built Environment on Recreational Physical Activity of The Elderly. Chin. J. Sports Med. 2016, 35, 1074–1075. [Google Scholar]
  31. Liang, J.Y. Exploration of Urban Street Space Quality in Macao Based on Multi-Source Data. Ph.D. Thesis, South China University of Technology, Guangzhou, China, 2020. [Google Scholar]
  32. Gao, L. Research on Space Quality Changes of Urban Streets Based on Street View Image Recognition. Ph.D. Thesis, North China University of Technology, Beijing, China, 2021. [Google Scholar]
  33. Song, Y.L.Q.; Liu, Y.; Wang, Z.Y.; Wu, Z.J.; Zhang, F. Grey Correlation Analysis of Factors Influencing the Built Environment of Urban Communities for Elderly People’s Leisure and Physical Activities. Chin. J. Gerontol. 2018, 8, 3778–3779. [Google Scholar]
Figure 1. Scope of Research Area.
Ijgi 11 00241 g001
Figure 2. Spatial distribution of Road Types in the Three Central Districts of Guangzhou.
Ijgi 11 00241 g002
Figure 3. Spatial distribution of Sampling Points of Streetscape Images.
Ijgi 11 00241 g003
Figure 4. Street Panorama.
Ijgi 11 00241 g004
Figure 5. Street Expanded View (0°, 90°, 180°, 270° from Left to Right).
Ijgi 11 00241 g005
Figure 6. Typical Examples of Streetscape Images with a Score of 1 to 5.
Ijgi 11 00241 g006
Figure 7. Satisfaction of the Quality of Street Space for Senior Citizens’ Physical Leisure Activity.
Ijgi 11 00241 g007
Figure 8. Spatial Distribution of Kernel Density of Street Space Quality. Note: Kernel density calculates the density of point features around each output raster cell.
Ijgi 11 00241 g008
Figure 9. Spatial Distribution of Street Element Quality Scores.
Ijgi 11 00241 g009
Table 1. The Proportion of Streetscape Images at Five Levels.
ScoreDegreeNumberProportion
1Very unsatisfactory525.78%
2Unsatisfactory33537.22%
3Neutral42246.89%
4Satisfying768.44%
5Very Satisfying151.67%
Table 2. Pixel Ratio of 21 Labels in All Streetscapes.
No.LabelsProportion
1Building 124.69%
2Green view 220.21%
3Road16.62%
4Sky10.92%
5Wall5.73%
6Floor5.15%
7Vehicle 35.02%
8Sidewalk4.45%
9Earth2.50%
10Ceiling1.32%
11Water 40.56%
12Person0.52%
13Mountain 50.27%
14Windowpane0.19%
15Chair 60.18%
16Rock 0.15%
17Runway 70.14%
18Bike 80.14%
19Railing0.13%
20Trade name0.10%
21Streetlight0.05%
Total 9/99.04%
Note: Building 1: A structure that has a roof and walls, for example, a house or a factory. Green view 2: The ratio of the green plants that can be seen within the human line of sight to the total field of view, that is, the proportion of tree, plants, grass and flower in the image, is a physical indicator that can be measured. Vehicle 3: A vehicle is a machine with an engine, such as a bus, car, or truck, that carries people or things from place to place. Water 4: A clear thin liquid that has no colour or taste when it is pure. It falls from clouds as rain and enters rivers and seas. All animals and people need water in order to live. Mountain 5: A land mass that projects well above its surroundings; higher than a hill. Chair 6: A piece of furniture for one person to sit on, with a back and four legs. Runway 7: A narrow path within 1 m for people’s running and biking. Bike 8: A wheeled vehicle that has two wheels and is moved by foot pedals. Total 9: The sum of the first 21 labels’ pixels.
Table 3. The Result of Correlation Analysis.
VariablesCoefficientStandard
Deviation
tp95% Confidence IntervalMulticollinearity Statistics
MinimumMaximumToleranceVIF
green view2.9180.7713.780 ***1.4064.4290.1168.61
building−1.8710.781−2.40.017 **−3.402−0.3410.1168.6
road−1.530.59−2.590.01 ***−2.686−0.3730.1725.81
sky−3.4430.898−3.840 ***−5.202−1.6830.3852.6
wall−4.3020.929−4.630 ***−6.124−2.4810.4262.35
vehicle−3.5780.955−3.750 ***−5.449−1.7060.432.33
sidewalk8.210.9728.440 ***6.30410.1160.691.45
ceiling−4.7371.632−2.90.004 ***−7.935−1.5390.7351.36
water2.8832.1481.340.179−1.3267.0930.8311.2
windowpane−13.1145.587−2.350.019 **−24.064−2.1650.8451.18
rock−29.8066.511−4.580 ***−42.567−17.0450.8651.16
runway−14.1237.288−1.940.053 *−28.4070.1620.8651.16
railing−26.0599.729−2.680.007 ***−45.128−6.9910.9071.1
trade name7.3799.8940.750.456−12.01326.7710.9241.08
streetlight25.23515.4171.640.102−4.98255.4530.961.04
Note: *** represents a significant correlation at 0.01 (bilateral); ** represents a significant correlation at 0.05 (bilateral); * represents a significant correlation at 0.1 (bilateral).
Publisher’s Note: MDPI stays neutral with regard to jurisdictional claims in published maps and institutional affiliations.

