Article

The Use of Machine Learning Algorithms in Urban Tree Species Classification

Department of Geomatic Engineering, Faculty of Civil Engineering, Yildiz Technical University, Davutpasa Campus, Esenler, Istanbul 34220, Turkey
*
Author to whom correspondence should be addressed.
ISPRS Int. J. Geo-Inf. 2022, 11(4), 226; https://doi.org/10.3390/ijgi11040226
Submission received: 17 January 2022 / Revised: 22 March 2022 / Accepted: 25 March 2022 / Published: 26 March 2022
(This article belongs to the Special Issue Artificial Intelligence for Multisource Geospatial Information)

Abstract

:
Trees are the key components of urban vegetation in cities. The timely and accurate identification of existing urban tree species with their location is the most important task for improving air, water, and land quality; reducing carbon accumulation; mitigating urban heat island effects; and protecting soil and water balance. Light detection and ranging (LiDAR) is frequently used for extracting high-resolution structural information regarding tree objects. LiDAR systems are a cost-effective alternative to the traditional ways of identifying tree species, such as field surveys and aerial photograph interpretation. The aim of this work was to assess the usage of machine learning algorithms for classifying the deciduous (broadleaf) and coniferous tree species from 3D raw LiDAR data on the Davutpasa Campus of Yildiz Technical University, Istanbul, Turkey. First, ground, building, and low, medium, and high vegetation classes were acquired from raw LiDAR data using a hierarchical-rule-based classification method. Next, individual tree crowns were segmented using a mean shift clustering algorithm from high vegetation points. A total of 25 spatial- and intensity-based features were utilized for support vector machine (SVM), random forest (RF), and multi-layer perceptron (MLP) classifiers to discriminate deciduous and coniferous tree species in the urban area. The machine learning-based classification’s overall accuracies were 80%, 83.75%, and 73.75% for the SVM, RF, and MLP classifiers, respectively, in split 70/30 (training/testing). The SVM and RF algorithms generally gave better classification results than the MLP algorithm for identifying the urban tree species.

1. Introduction

Urban areas have become one of the main habitats for human beings in recent years. Cities are suffering from various problems, such as air and water pollution, flood risk, and urban heat island effects, and urban life for citizens is becoming extremely difficult due to overpopulation and unplanned urbanization. Urban forests, especially trees, provide a sustainable solution to solve these ecological problems and help to improve the living conditions of the urban residents [1]. Urban trees are of major importance for the residents, offering various economic, environmental, health, and aesthetic benefits in urban environments [2]. Trees are crucial to improving the air, land, and water quality; absorbing and mitigating carbon dioxide (CO2); lowering urban temperatures; reducing the storm water runoff, wind speed, and noise pollution; as well as supporting biodiversity and providing shelters for different animals [1,3,4,5,6]. In addition to these environmental and ecological benefits, urban trees have many social and psychological effects, such as improving physical/mental health, alleviating life stresses, encouraging residents to build stronger social relationships, potentially reducing crime, and making neighborhoods more attractive places [2,7,8]. As a main component of city structures, urban trees decorate parks, roads, and pavements, provide recreational areas, and create shade, as well as influencing real estate value [2,4]. Contrary to the numerous benefits for cities and residents, some urban trees have some adverse effects, such as causing allergic reactions [9] and environmental pollution, damaging historical texture, and obstructing the silhouette of cities [2]. Different tree species face different environmental stresses, so they have different benefits or disadvantages for the urban ecology [10,11]. Due to the mostly positive, and few negative, effects of urban trees, accurate information about individual tree species in cities is important to enable city planners and local administrators to understand the value of urban vegetation for ecosystem services. Thus, the detection and monitoring of urban tree species is necessary for urban planning and protection, disaster management, and sustainable development of urban areas, and require detailed up-to-date data sources [2,12].
To date, many tree species identification studies have focused on forest areas rather than urban areas [13]. Urban environments have a complex structure with many different objects, such as buildings with different types and heights, vegetation on top of buildings, power lines, temporary objects, paved roads, driveways, road signs, and parking lots, in comparison with forests, where the surrounding areas are comparatively homogeneous and the tree crowns are generally densely distributed [13,14]. In urban environments, trees spatially exist with other urban elements, and they can be in groups of trees or in irregular spatial designs, as well as being isolated or evenly spaced [15]. Urban trees generally have a large variation in structural characteristics, according to planting purposes. Urban areas are faced with specific challenges in tree species identification applications because of the above mentioned factors [13].
Aerial photo interpretation and field surveys are the two traditional methods used to identify urban tree species in farraginous urban environments [3]. These traditional ways are successful in local and small-scale studies, but in fact are labor-intensive, expensive, time-consuming, and are generally not appropriate for the entire coverage of large urban areas [3,6,16,17]. Based on specialized photo interpreters’ experience, the large discrepancies between different interpreters are one of the disadvantages of the aerial photo interpretation technique. Today, the latest remote-sensing technologies offer a significant solution to the drawbacks of the traditional methods with their efficient, reliable, rapid, and repeatable methods for monitoring and analyzing urban tree species. Furthermore, they enable more cost-effective project budgets, especially for large-scale applications [6,8,11,18]. Over the last few decades, space-borne or airborne multispectral and hyperspectral images have been utilized for tree species identification [19,20,21,22]. However, multispectral and hyperspectral images have their own limitations, such as inadequate spectral resolution, shadowing, and obscuring impacts, which are caused by background features, spectral mixtures, etc. [21,23,24]. During multispectral and hyperspectral image acquisition, the lighting conditions change, both in time and in space [25]. In different parts of urban environments, the same urban tree species can have dissimilar spectral reflectance, or different urban tree species can have a similar spectral signature in the process of obtaining tree species using optical remote-sensing methods [21,26,27]. In addition, optical remote-sensing imagery is generally restricted to obtaining detailed information about the understory due to the heterogeneity of the urban environment [28]. Recently, active sensing light detection and ranging (LiDAR) systems have been successfully used in the detection of urban tree species, providing 3D information with high spatial resolution, returning multiple signals and high scanning speed [22,28,29]. Airborne light detecting and ranging systems can penetrate tree crowns, supply geometric and radiometric information, exhibit some of the inner structure of trees, and collect intensity data [30]. LiDAR capabilities can also be improved by increasing point density.
In tree species classification studies using LiDAR datasets, the test areas, used data types, number of classified tree species, and classification methods vary from application to application. Discrete-return LiDAR data are used in general, but full-waveform LiDAR data, which use a newer technology, have been used in recent applications for tree species classification [31,32,33,34,35,36]. While a LiDAR point cloud can be used alone in the classification of classic tree species, aerial photographs, satellite images, or hyperspectral images can be used additionally to a LiDAR point cloud as supplementary data for integrated tree species classification applications [37,38,39,40,41,42,43,44,45]. Raw LiDAR data or gridded LiDAR data, which enable the direct use of traditional image classification algorithms, can be used for tree species classification [46,47,48,49]. In some tree species classification studies, only deciduous and coniferous tree species are distinguished, while in others, a large number of different species are classified [50,51].
Nowadays, machine learning algorithms are used in many remote-sensing applications, such as change detection [52], monitoring of active wildfires [53], land usage identification [54], road edge detection [55], ground water potential assessment [56], marine oil spill detection, prediction, and vulnerability assessment [57], biomass and soil moisture retrievals [58], etc. The support vector machine (SVM), decision tree, random forest (RF), k-nearest neighbor (KNN), and artificial neural network (ANN) methods, which are traditional machine learning methods, have been mostly utilized for the classification of the LiDAR data to acquire tree species [17,59]. Zhang and Liu [47] aimed to analyze the applicability of LiDAR-derived geometric and intensity metrics to classify adjacent and dominant tree species using the support vector machine method at the individual tree level in their study area. Koma et al. [60] examined the object-based classification of urban trees using full-waveform three-dimensional LiDAR data in Vienna, Austria. The applicability of the geometric and radiometric features of deciduous trees and the coniferous pine species in an urban environment have been investigated using a random forest classification algorithm with the combined use of geometric and radiometric features. An overall accuracy of 87.5% was achieved as the most reliable classification by Koma et al. [60]. LiDAR data and hyperspectral imagery (0.5 m) were fused to differentiate eight common tree species in Dian et al. [61] by using vertical, spatial, and spectral features as an input to the classification of a support vector machine in Anyang, Henan, China, and a voting procedure was used to generate a tree species map. Shen and Cao [62] used hyperspectral images and LiDAR point cloud, which are acquired simultaneously, to classify five tree species with a RF classifier, aimed at detecting the most important variables for the classification, and an evaluation of the contribution of combined use of two different datasets. Shi et al. [21] used an RF classifier to obtain six different tree species and drew attention to the importance of using 37 different LiDAR features derived under leaf-on and leaf-off conditions. Kim et al. [63] analyzed the possible usage of LiDAR intensity data using a linear discriminant function to differentiate broadleaved and coniferous tree species and obtained overall classification results verifying their success. A methodology for coniferous and deciduous tree species classification in a forest area using both a k-means and expectation maximation (EM) classifier with full-waveform LiDAR features was proposed in Reitberger et al. [64], and a maximum overall accuracy of 85% in a leaf-on situation was reported. Ørka et al. [31] classified coniferous and deciduous tree species with linear discriminant analysis (LDA) in a boreal forest reserve in Norway using intensity and ALS-derived structural features and succeeded with 88% overall classification accuracy.
The primary aim for this research is to assess the potential usage of the support vector machine, random forest, and multi-layer perceptron machine learning algorithms for the classification of deciduous and coniferous tree species, using the Davutpasa Campus of Yildiz Technical University, Istanbul, Turkey as the urban study area.
The paper is subdivided into four main sections. Section 2 defines the materials and methods, including the study area, used dataset, general workflow, high vegetation classification, individual tree crown segmentation, feature extraction, urban tree species classification, and performance analysis subsections. The results and discussion in Section 3 presents an experimental evaluation and analysis of the machine learning-based urban tree classification process. Finally, Section 4 concludes the work presented in this paper.

2. Materials and Methods
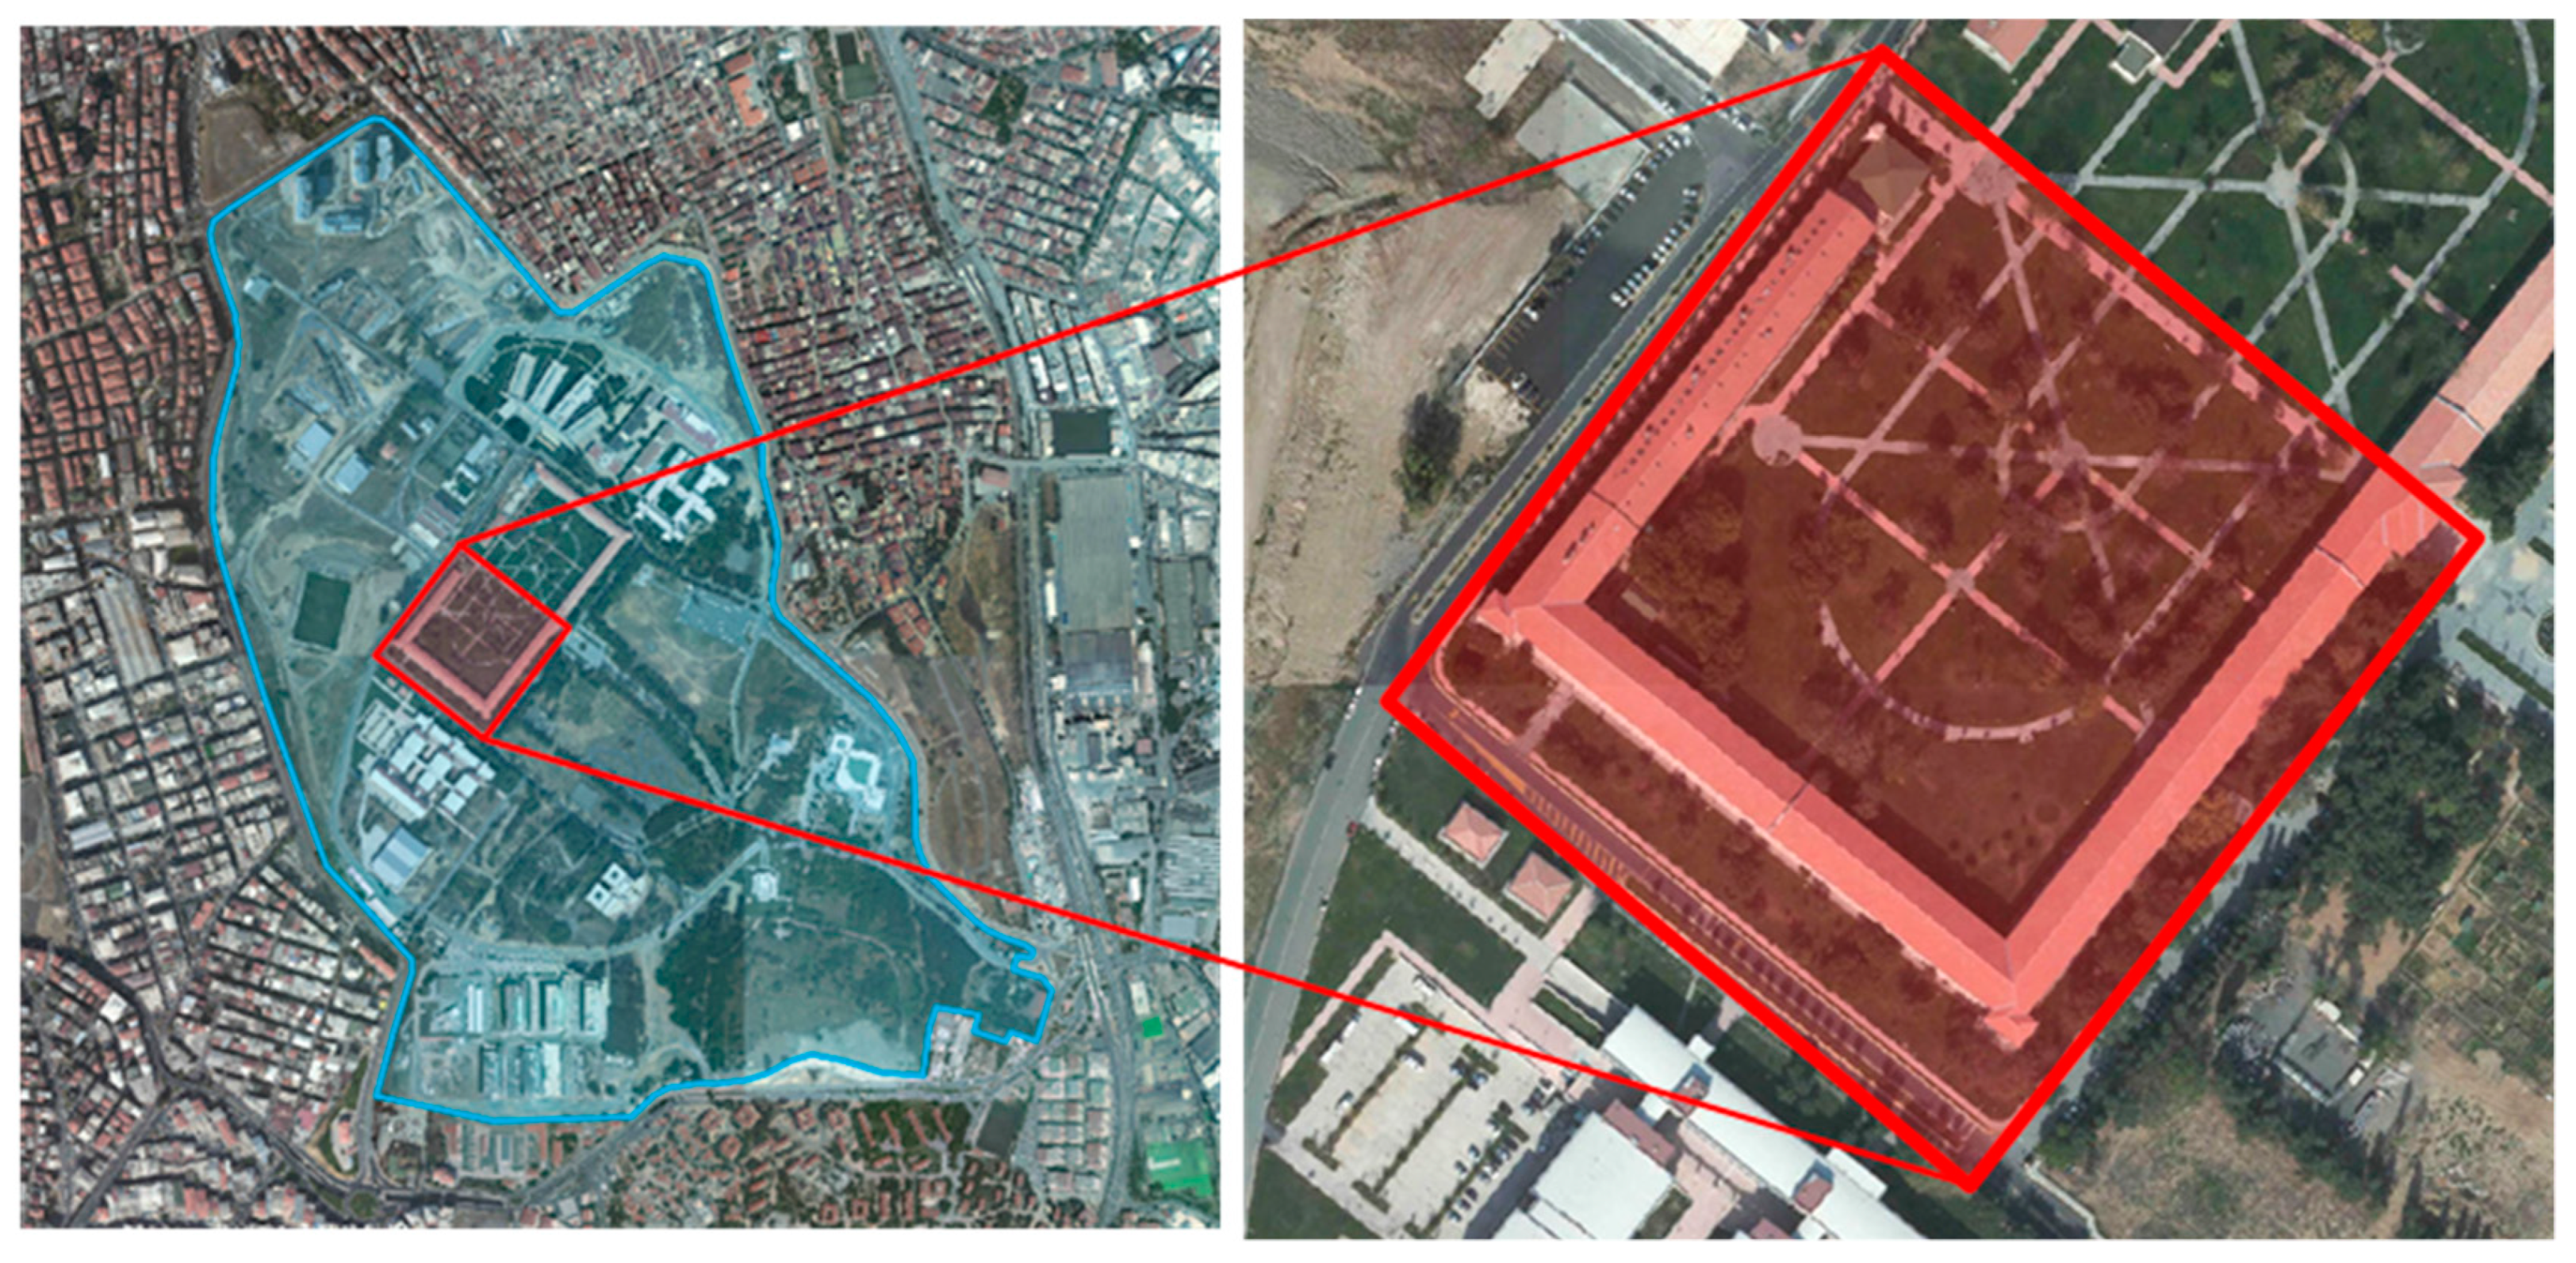
2.1. Study Area

The Davutpasa Campus of Yildiz Technical University, located in the Istanbul province district in northwest Turkey (41°01′33″ N, 28°53′21″ E), was selected as the urban study area and includes buildings of several types and heights, vegetation of different types and heights, paved roads, driveways, road signs, and parking lots (Figure 1). The selected urban study area (approximately 4.7 ha) in the Davutpasa Campus of Yildiz Technical University (approximately 125 ha) was used for testing the performance of SVM, RF, and MLP machine learning algorithms to discriminate deciduous and coniferous tree species (Figure 2). In the study area, different types of deciduous trees, such as linden, cherry, sycamore, mulberry, quince, plum, apple, and locust, and coniferous trees, including red pine, stone pine, blue spruce, and Norway spruce were available.

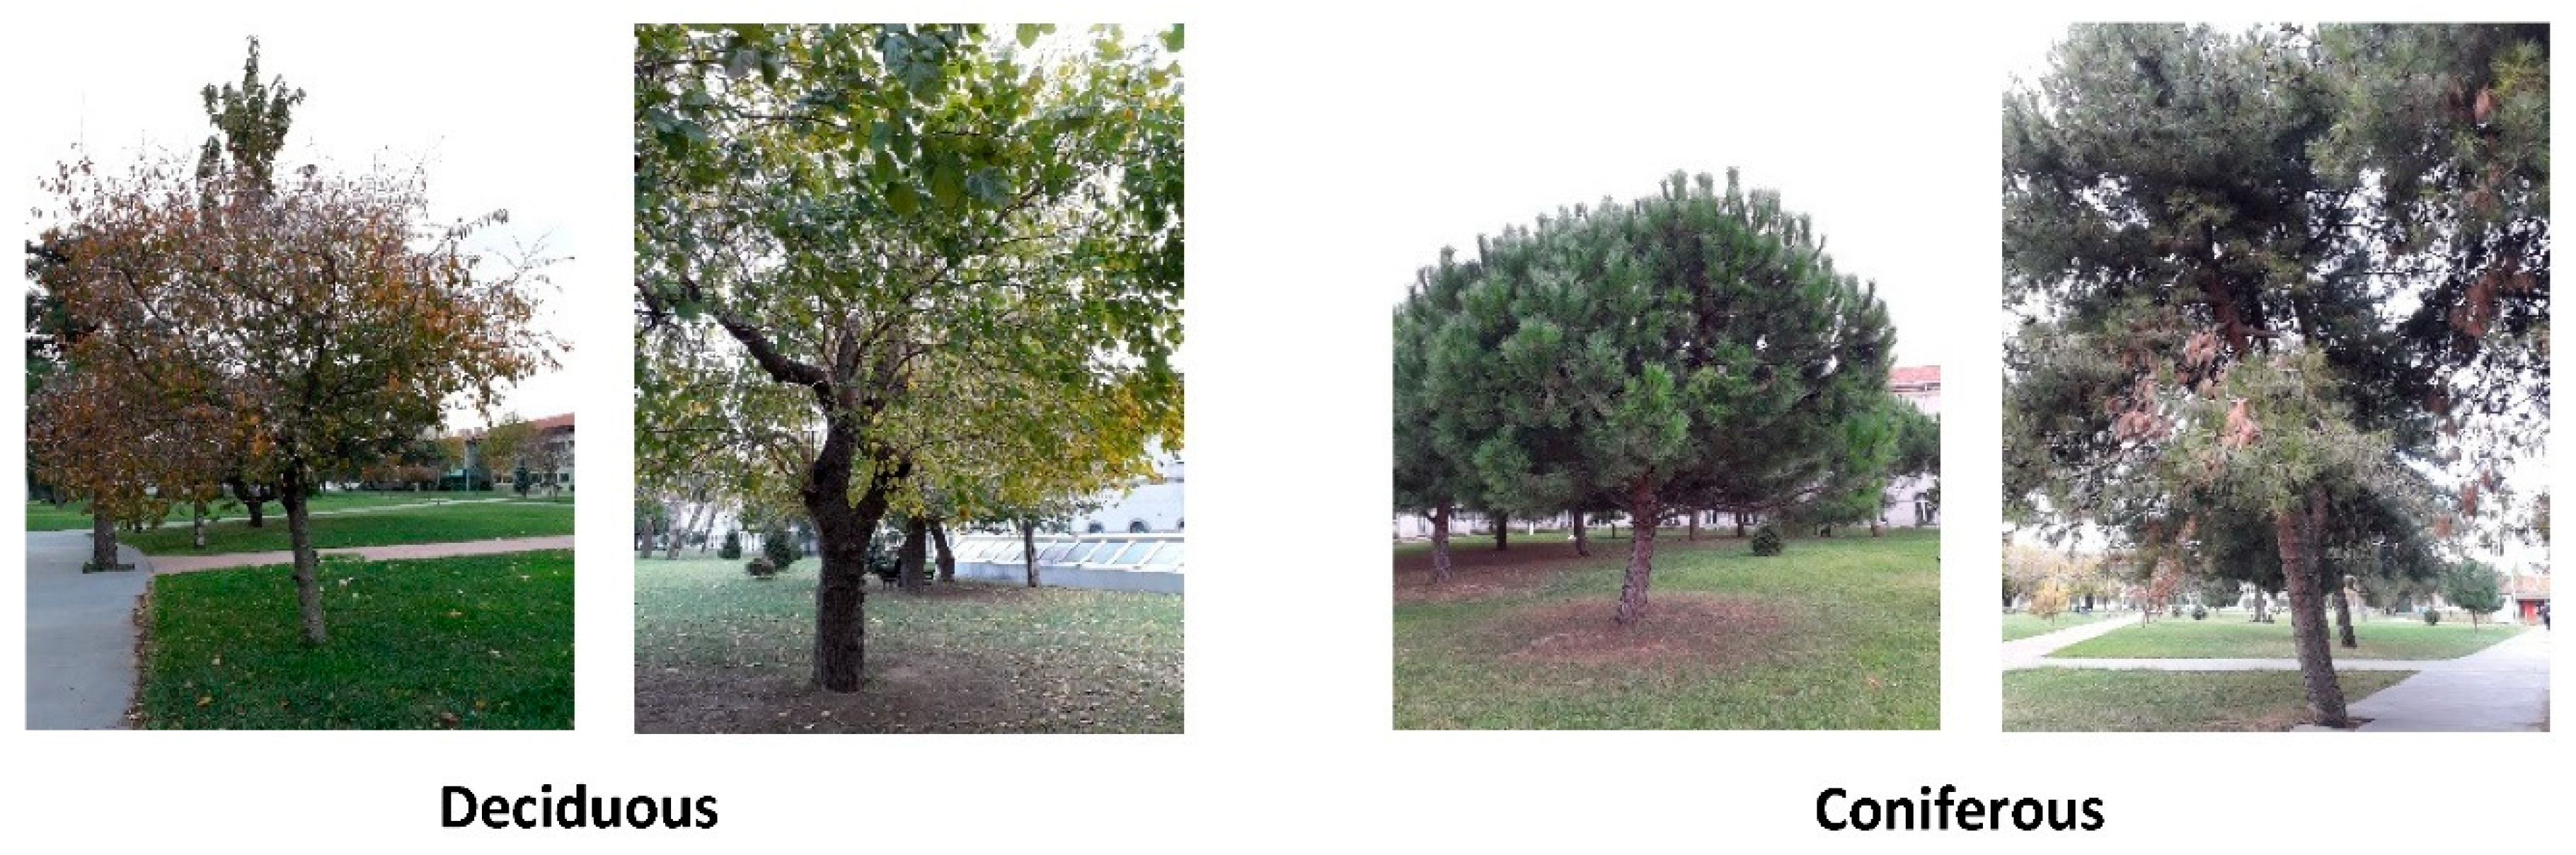
2.2. LiDAR Data and Field Data

The 3D LiDAR point-cloud data used in this study were acquired in September 2013 with a “Riegl LSM-Q680i” full-waveform laser scanner by the Istanbul Metropolitan Municipality. The LiDAR point cloud was provided in Log ASCII Standard (LAS format) with an average density of 16 points/m2. The flying height and speed of the helicopter were approximately 600 m and 148 km/h, respectively. The used LiDAR dataset was acquired at up to 400,000 Hz pulse repetition frequency (at a near infrared laser wavelength) with a scanning angle of 60° (±30°). The data were recorded with a rotating polygon mirror in parallel scan lines with beam divergences of less than or equal to 0.5 mrad. The laser data were recorded with multiple returns (echoes) and 16-bit uncalibrated intensity information.
The ground-truth data for tree species were acquired by field investigation and photo interpretation within the study area. The species of each tree in the study area was determined accurately as deciduous or coniferous.

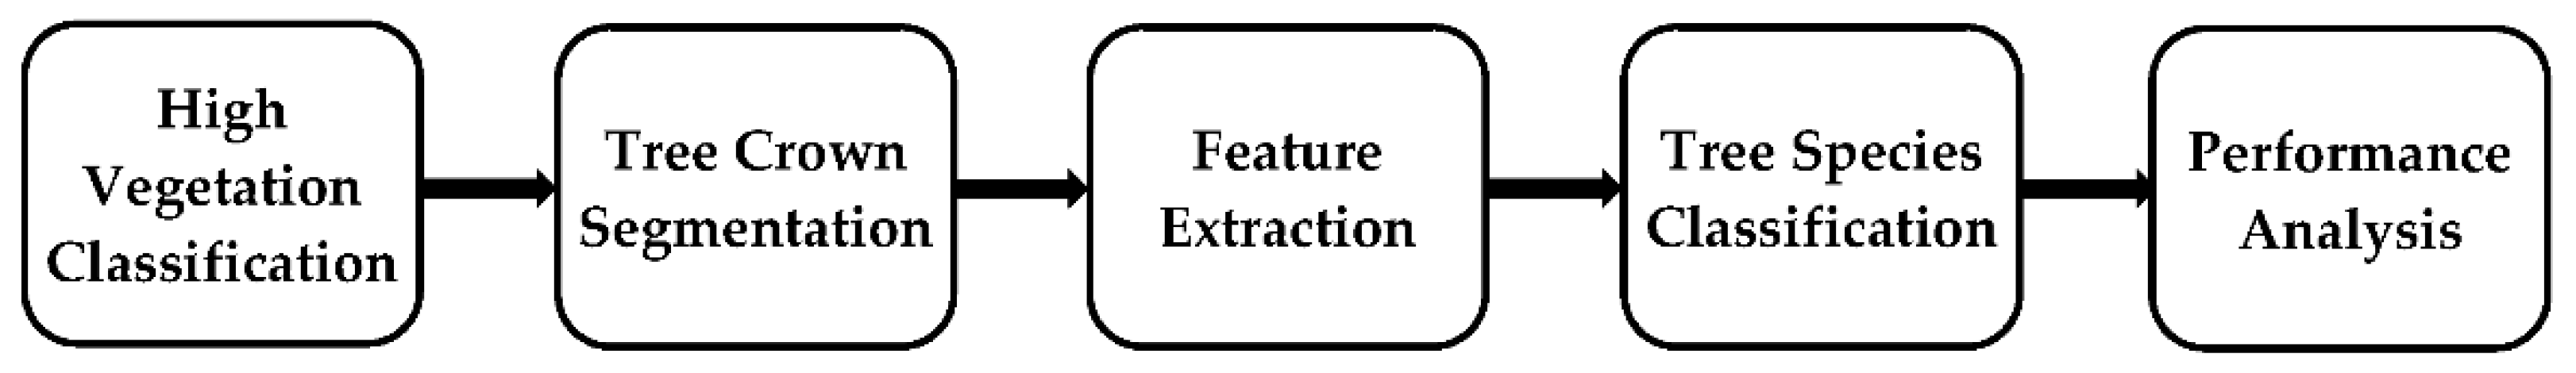
2.3. General Workflow

In this research, a tree species classification method from raw 3D LiDAR data based on SVM, RF, and MLP machine learning algorithms was developed to provide tree species identification with high efficiency in terms of time and cost for large-scale applications. As a first step, the ground, building, and low, medium, and high vegetation classes were acquired from a raw LiDAR point cloud with a hierarchical rule-based classification method; then, individual tree crowns were segmented using a mean shift clustering algorithm from high vegetation points. Feature extraction was conducted for each individual tree, and these features were used to classify the deciduous and coniferous tree species in the urban study area with SVM, RF, and MLP algorithms. An accuracy assessment for the classified tree species was carried out. A 10-fold cross-validation and feature importance process with Mean Decrease Gini (MDG) were also performed to evaluate the stability of the models and to analyze the effects of the classification features. TerraScan software and the Python programming language were utilized in this research. The flow chart of the proposed machine learning-based urban tree species classification process is shown in Figure 3.

2.4. High Vegetation Classification

The proposed method in this study starts with a classification of the high vegetation points from raw LiDAR point cloud data. The 3D raw LiDAR point cloud was classified with a hierarchical rule-based classification method using spatial features. The ground, building, low vegetation, medium vegetation, high vegetation, low point, air point, and default classes were obtained based on the standard point classes of the American Society for Photogrammetry and Remote Sensing (ASPRS) [65]. In the rule-based classification algorithms, the information about the terrain surface is converted to a set of rules; thus each terrain class has its own characteristic rules, and the classification is carried out based on these rules [66,67]. In this study, each individual LiDAR point was classified into the appropriate classes with point-based rules using spatial features. The details of the used point-based classification of the LiDAR data with the hierarchical rule-based classification method to acquire the high vegetation class (using the TerraScan module of TerraSolid software) can be found in Yastikli and Cetin [68].

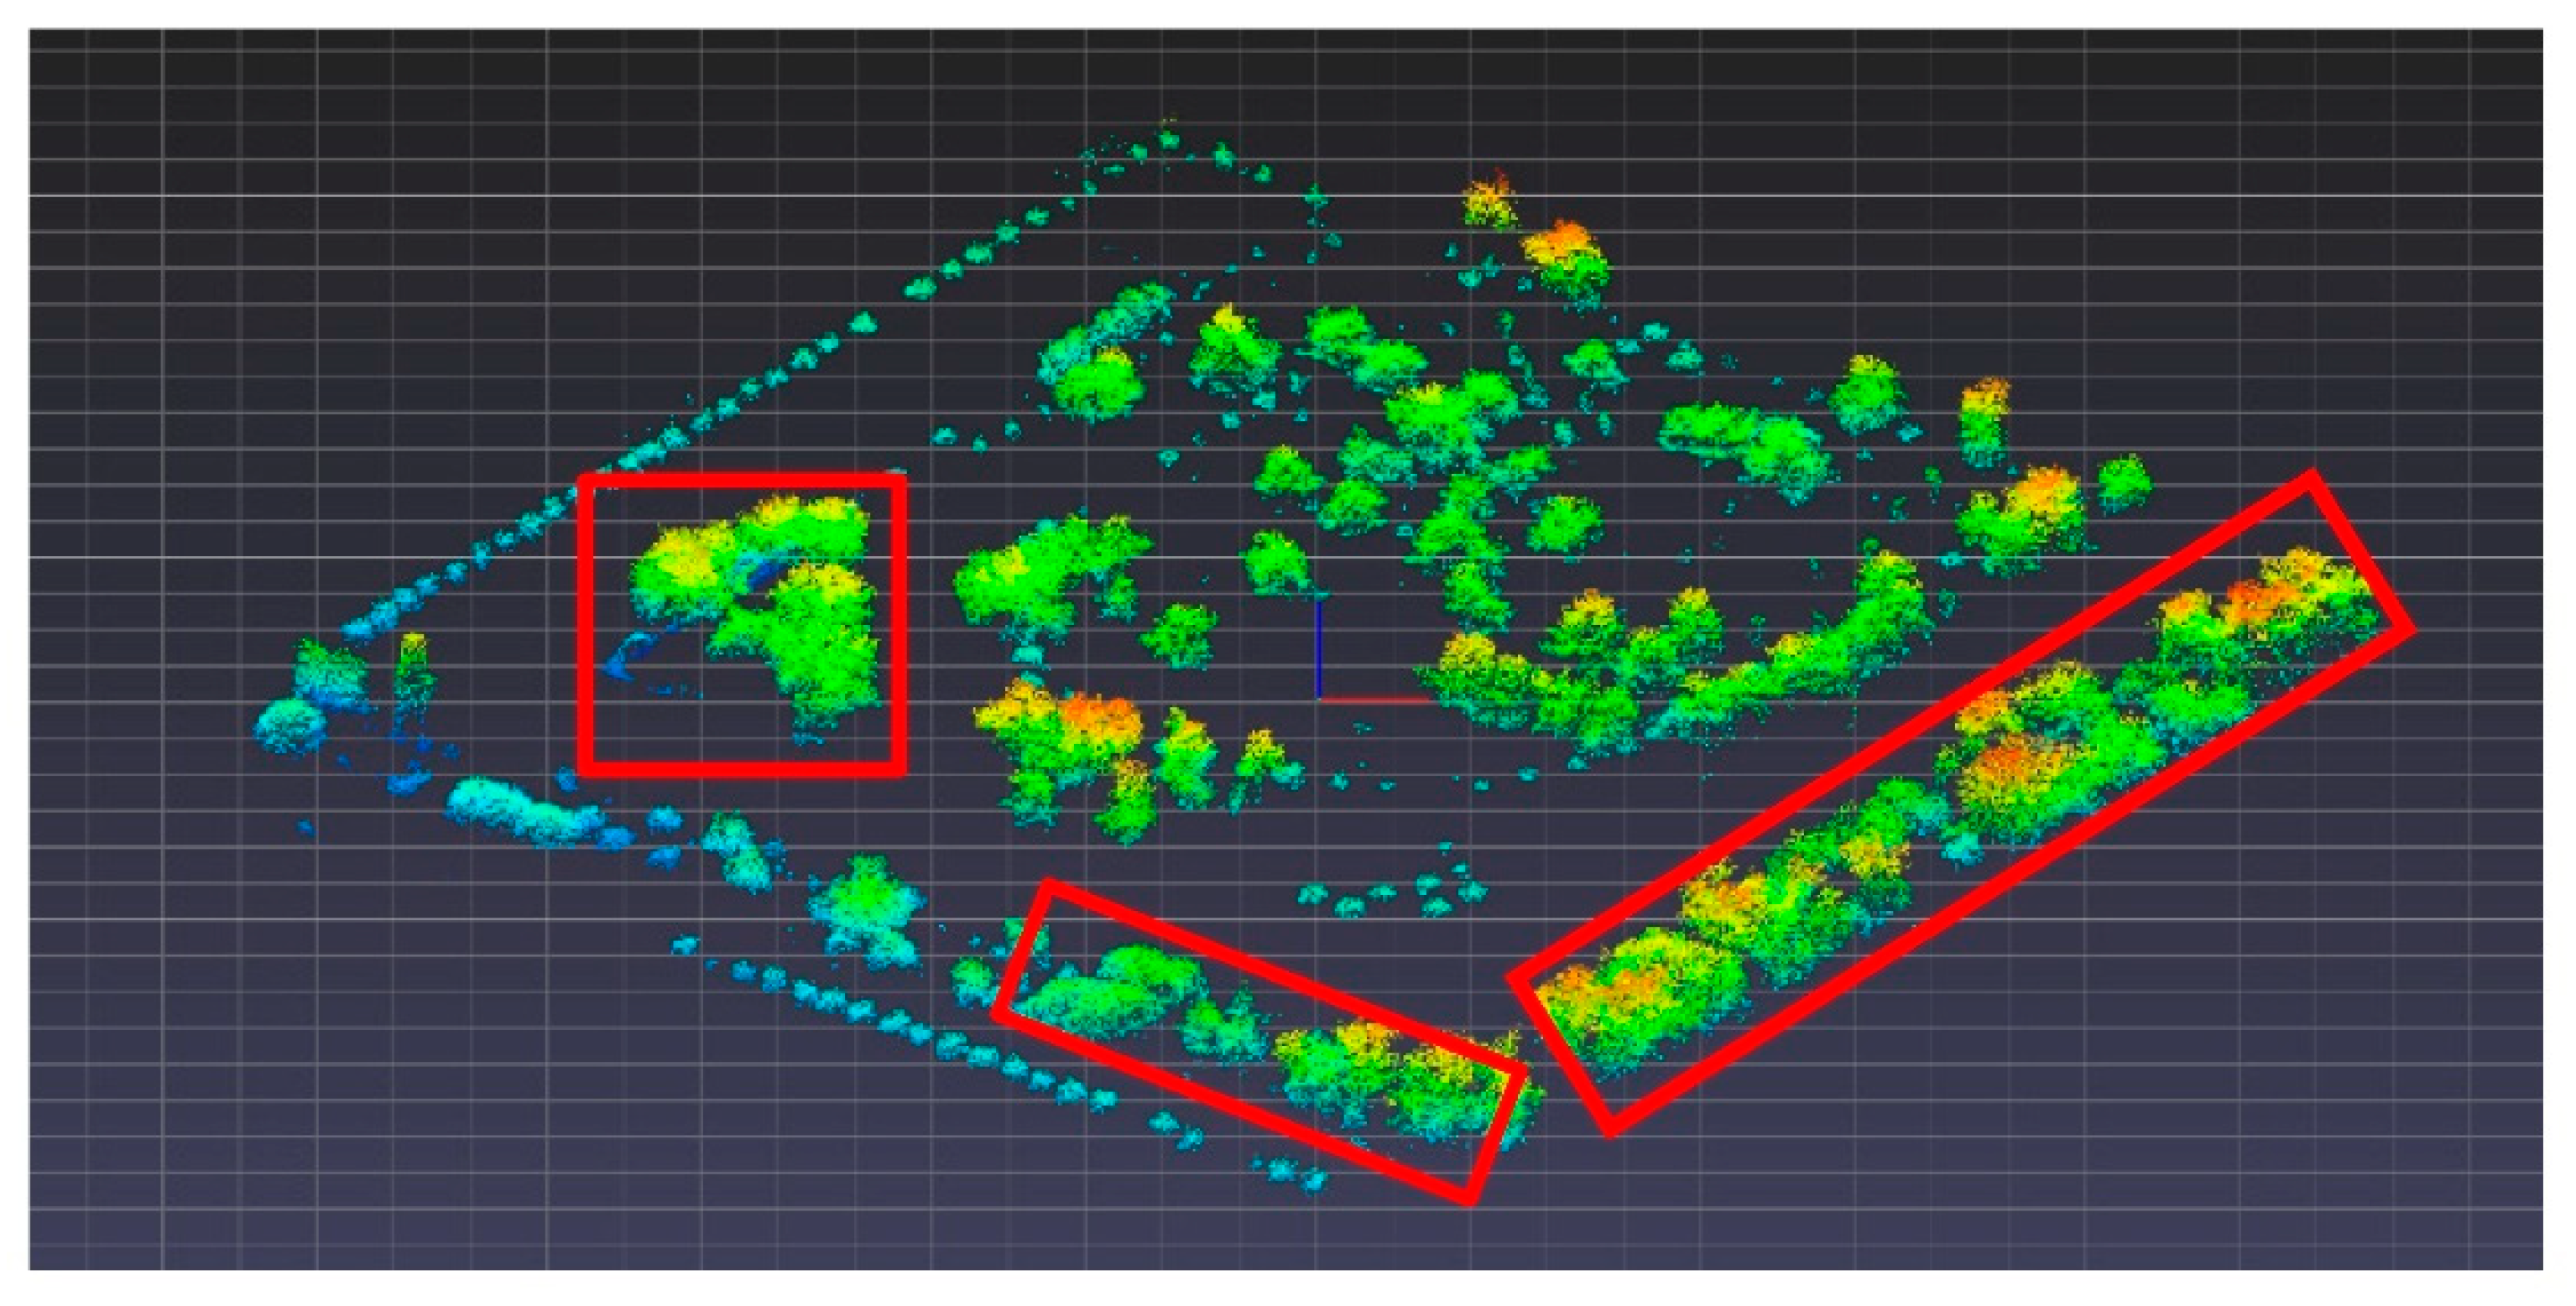
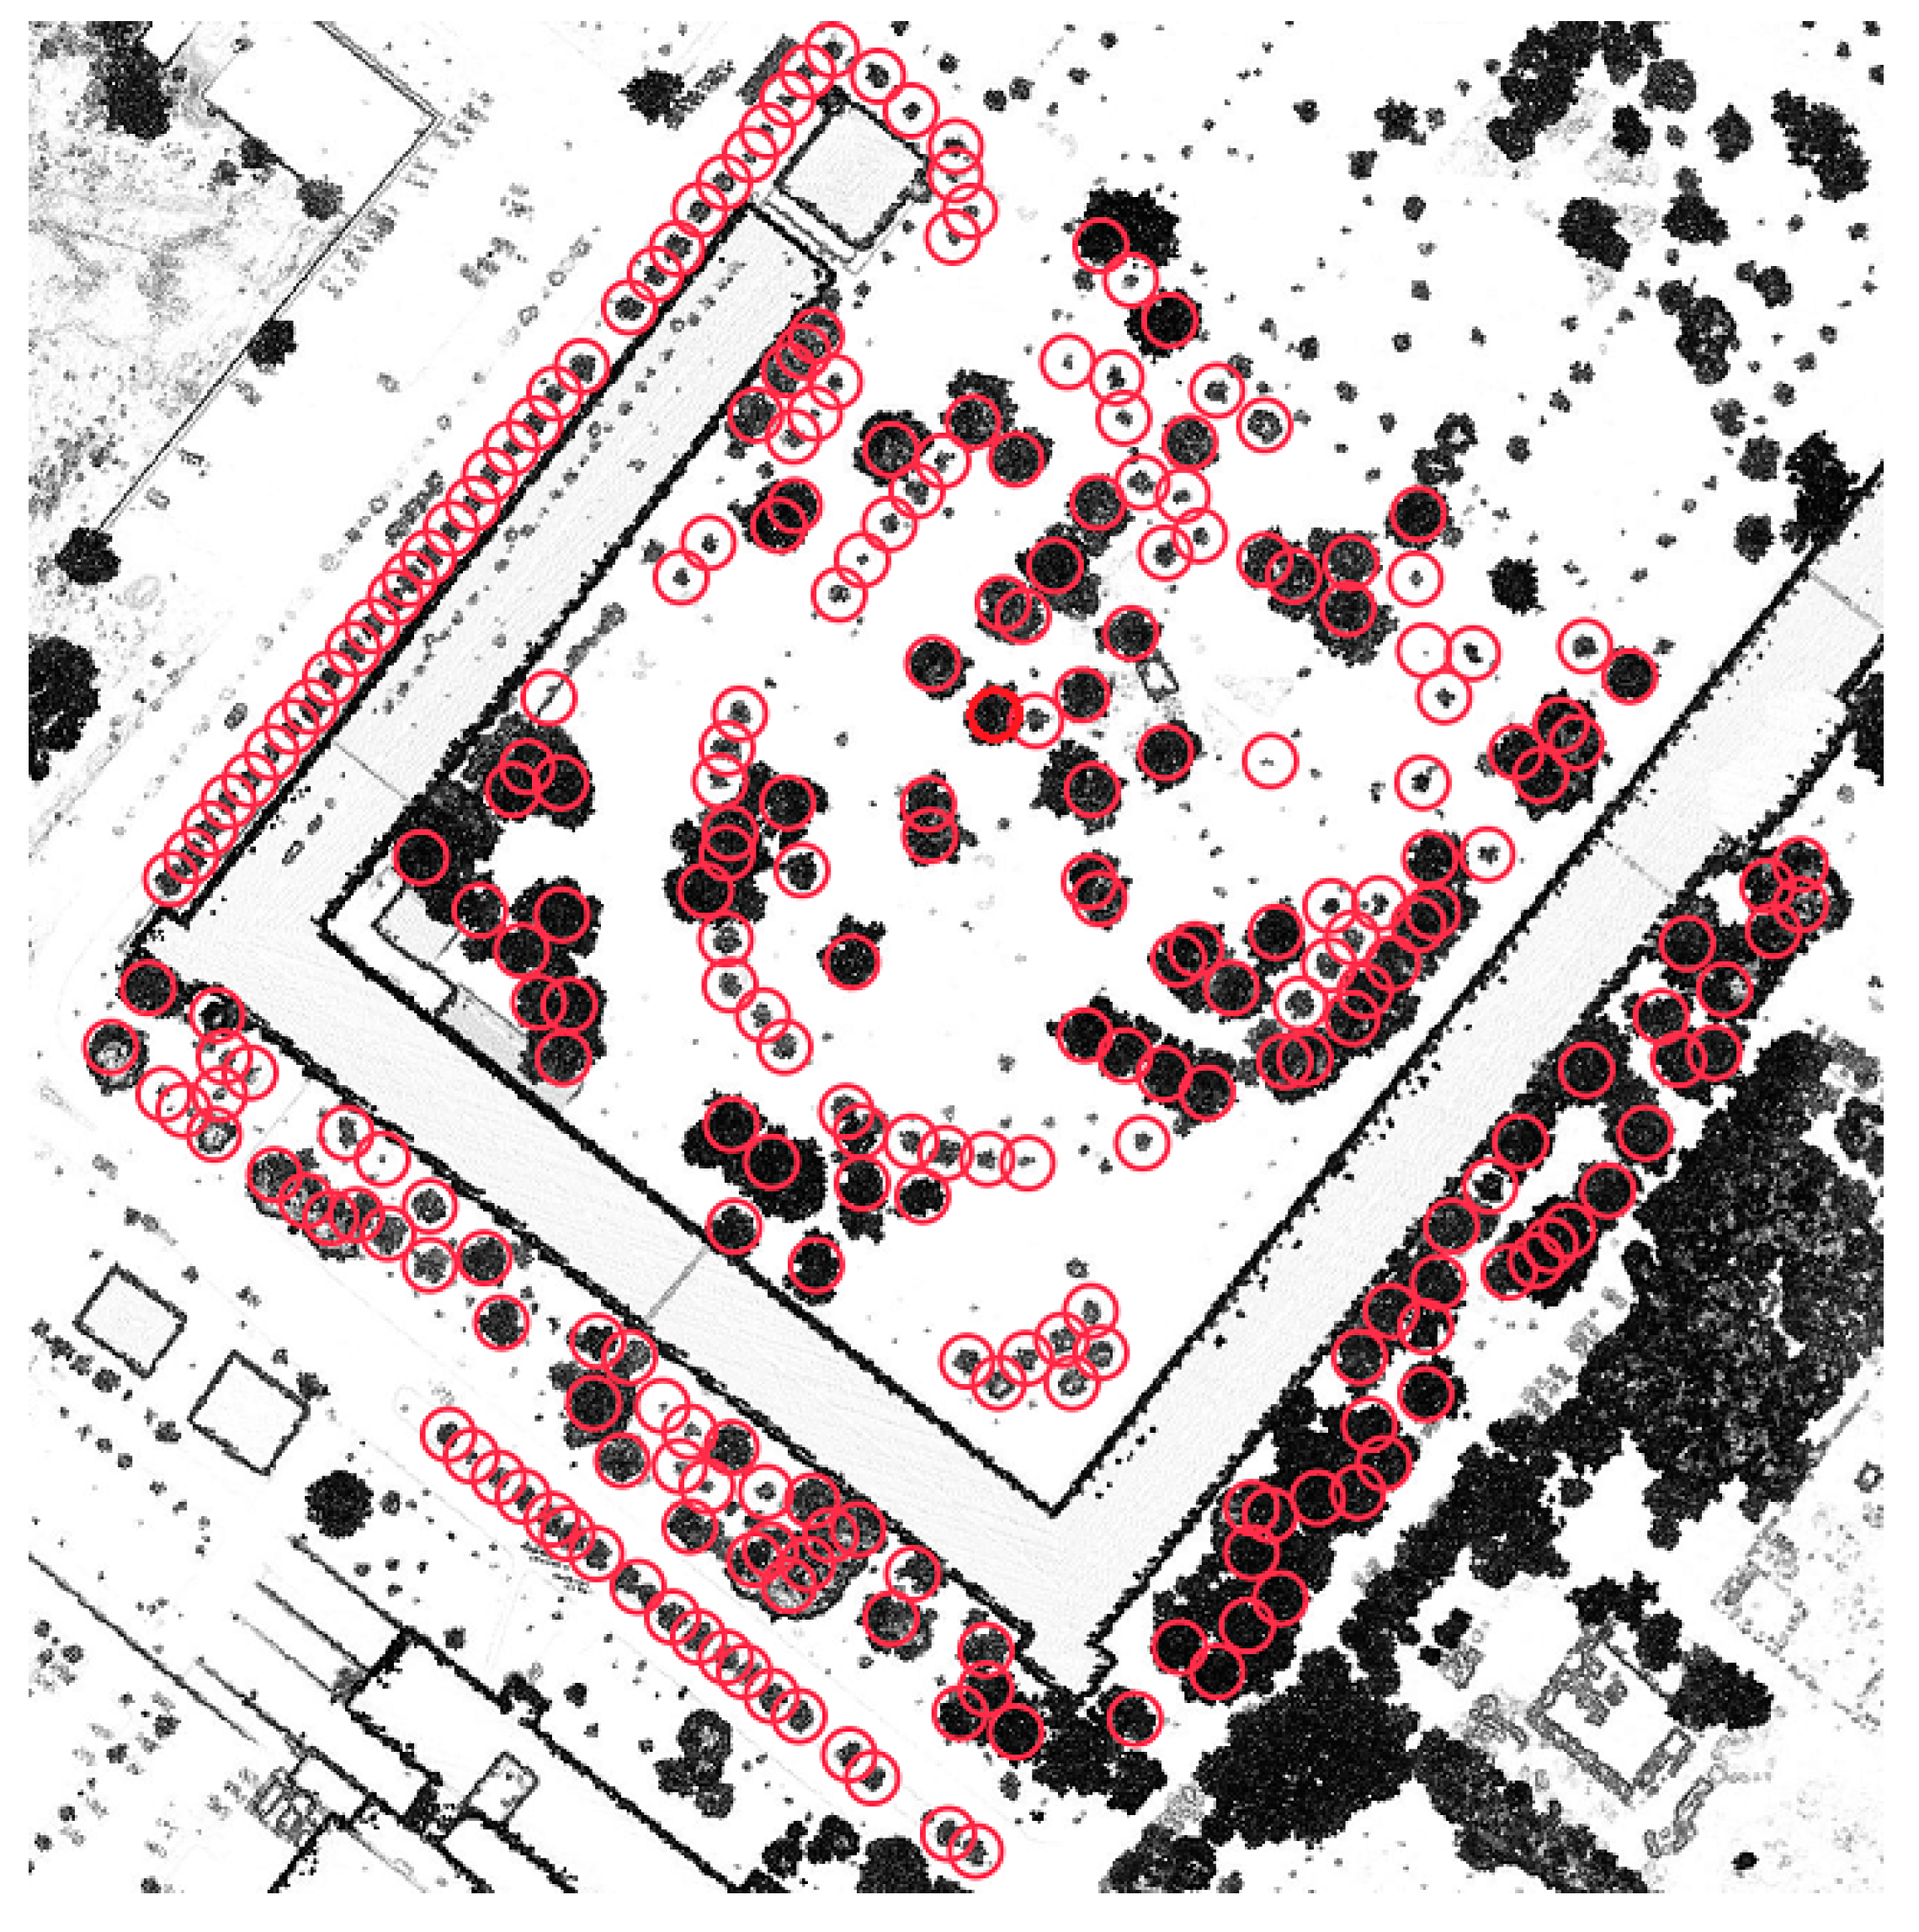
2.5. The Segmentation of Individual Tree Crowns

In the segmentation process, the high vegetation points are partitioned into subsets of neighboring points called “segments”. Individual tree crowns were achieved as a consequence of the segmentation step. The segmentation process was carried out using the mean shift clustering algorithm, which was first proposed by Fukunaga and Hostitler in 1975 [69]. Mean shift is an iterative and non-parametric method that shifts each data point based on the local maxima of density function with Kernel Density Estimation (KDE) [70]. This method chooses a random point as the cluster center from the used dataset, updating the cluster centers on the condition that the mean of the candidate points should be in a certain region. This segmentation algorithm automatically sets the number of clusters according to the bandwidth that determines the size of the region to be searched. The bandwidth is the most important parameter that needs to be specified in the mean shift process [71]. The bandwidth can be estimated with manual iterations or by using the bandwidth function. In this study, the 2D point-based segmentation of high vegetation has been conducted based on the x and y Cartesian coordinate pair of each raw LiDAR point to acquire individual tree crowns. The bandwidth parameter was estimated with manual iterations, and the high vegetation points were segmented by the flat kernel with a proper bandwidth of 3. The segmentation processes with mean shift clustering were performed with the Python programming language (Python 3.6.4), along with scikit-learn library. The segmentation results could be categorized as correct detection, under-segmentation, over-segmentation, missed, and noise [72]. The generated segments in this study include both the under-segmentation, which means multiple crowns were segmented as a single crown, and over-segmentation, which means a single crown was segmented as multiple crowns.

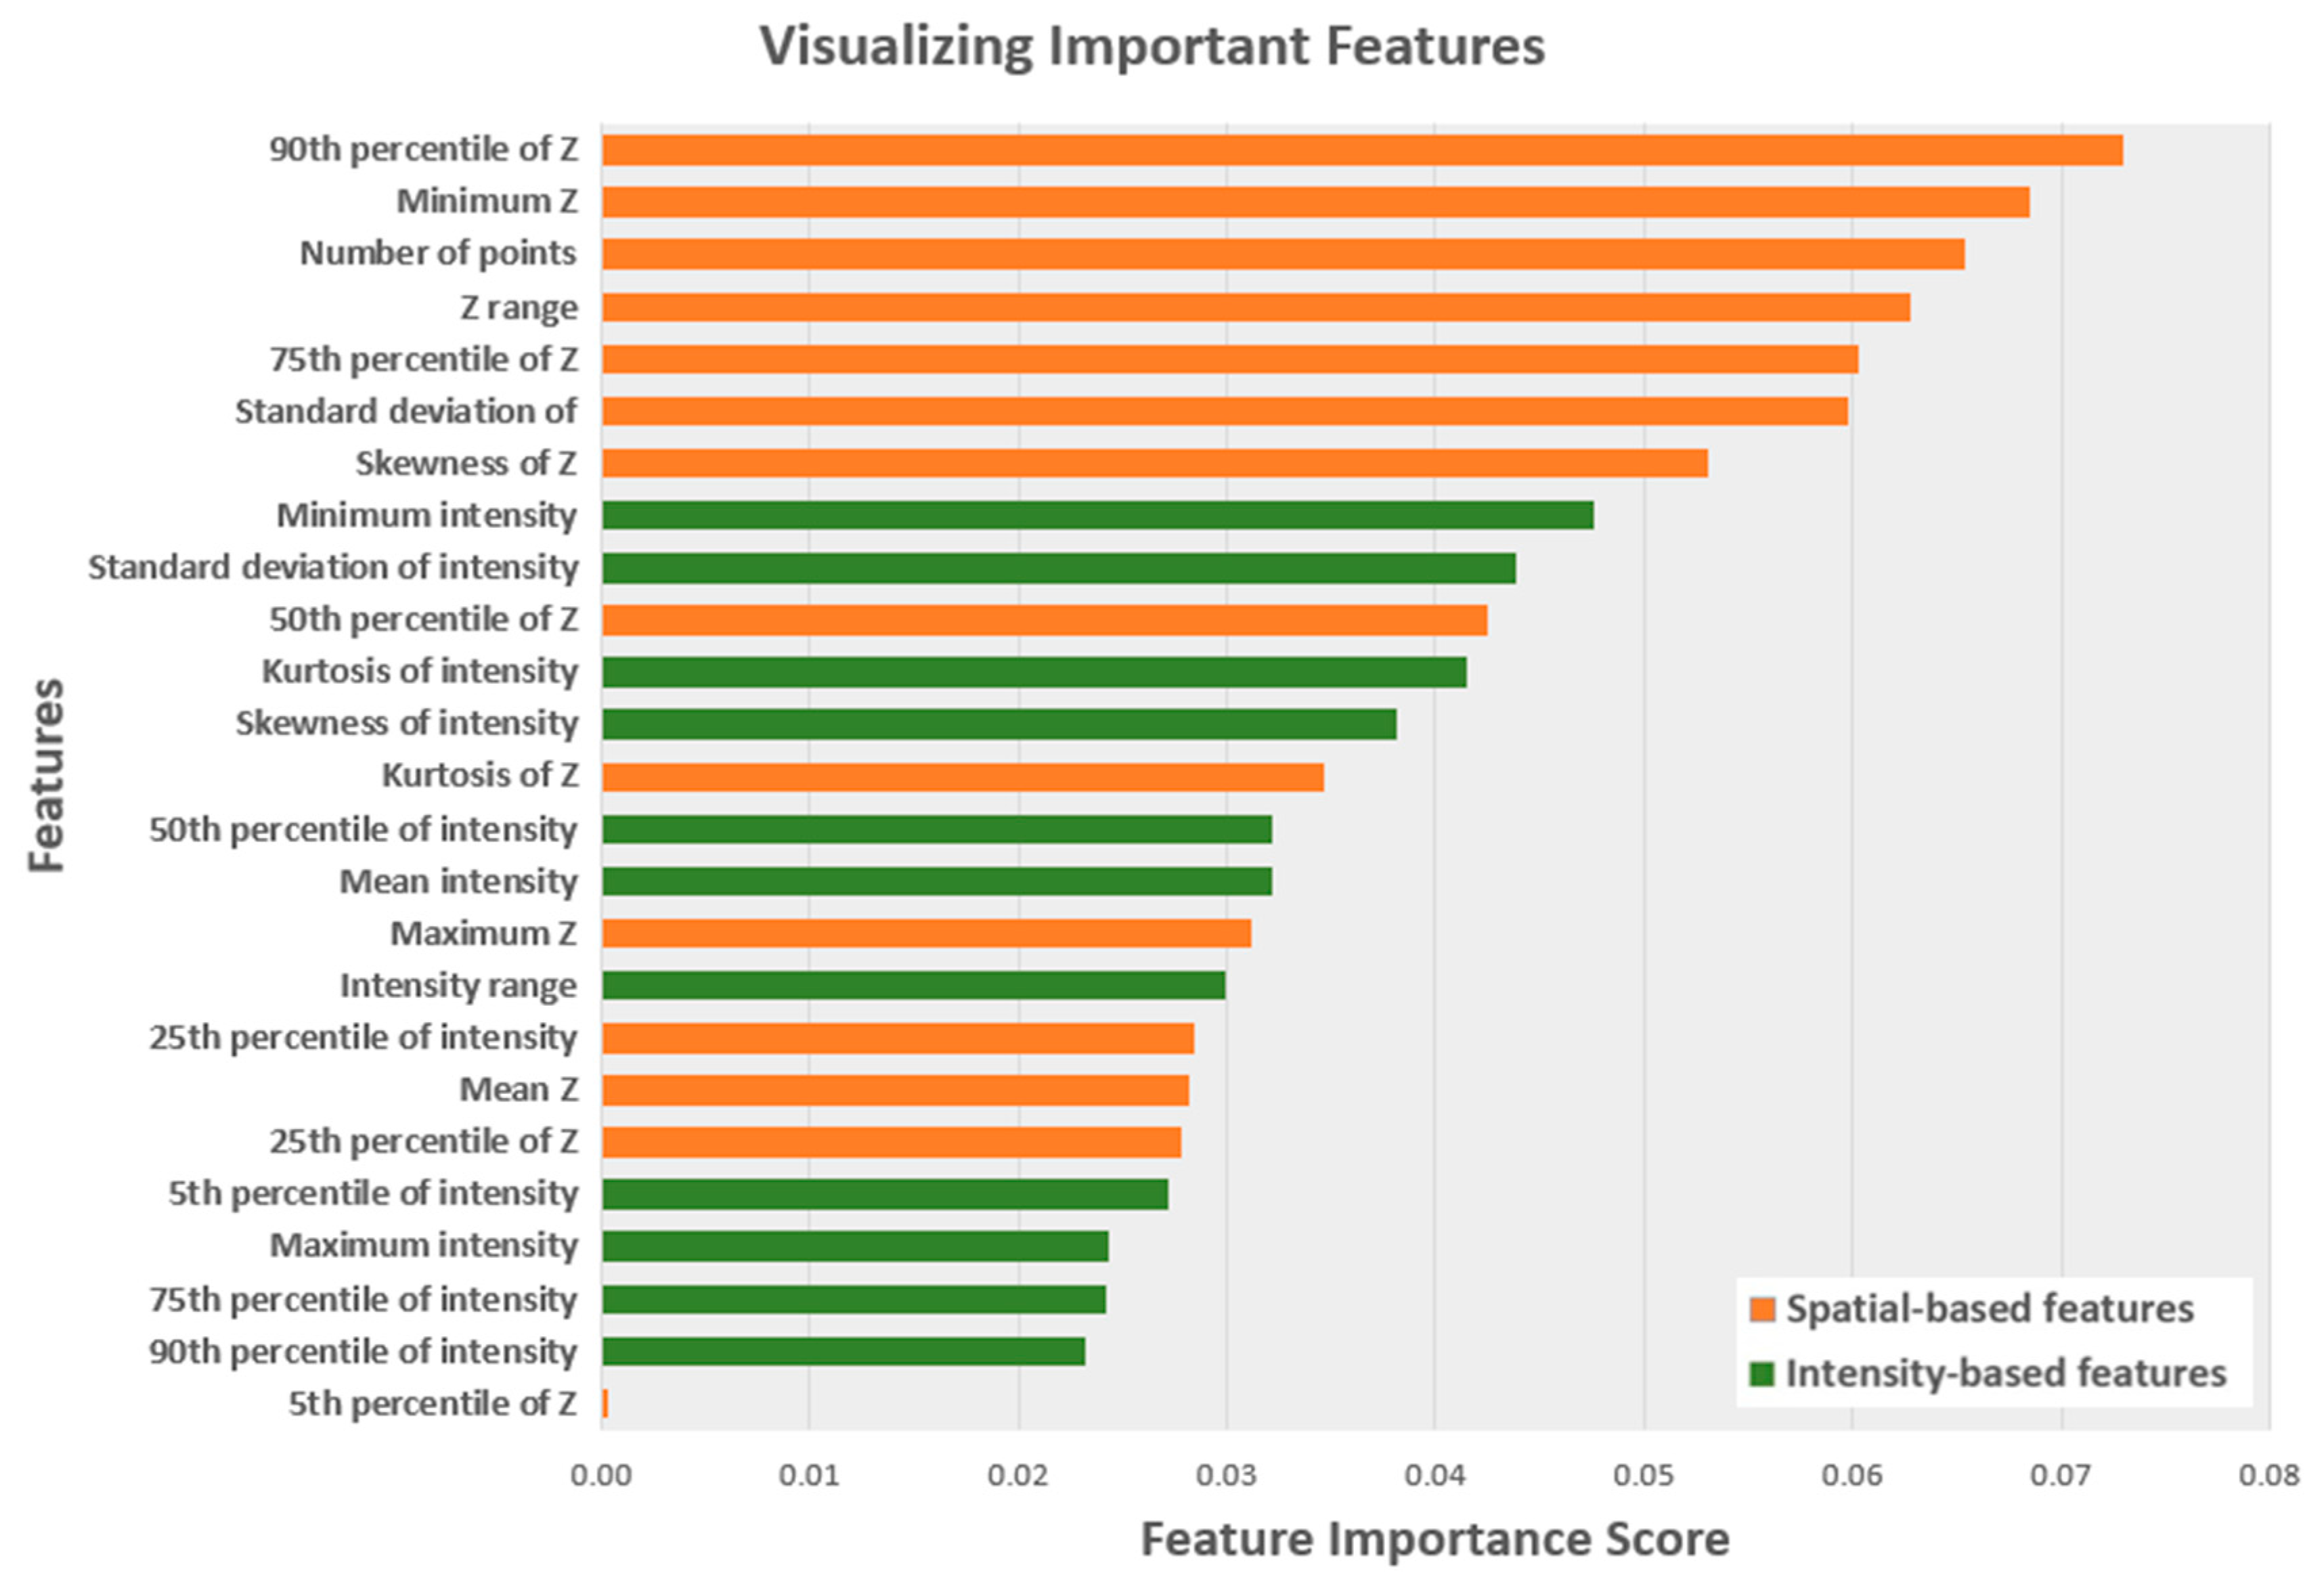
2.6. Feature Extraction

The extraction of the features to be used in the classification model by applying statistical analysis is a critical step in the machine learning field [73]. In our proposed approach (see Figure 1), the classification features were calculated using the height and intensity information of the LiDAR points, and they were then used as input to the machine learning-based classification algorithms for the classification of urban tree species. The spatial- and intensity-based features were obtained from the raw 3D LiDAR point clouds to differentiate the urban tree species. The determined features were generated for each tree crown using LiDAR height and intensity information, including minimum and maximum values, and results of statistical analyses (mean, standard deviation, skewness, kurtosis, etc.) [11,21,74,75]. In Table 1, the 25 generated features for the classification of targeted urban tree species using SVM, RF, and MLP algorithms are given. Z indicates the Z coordinate of the LiDAR points in the national coordinate system, and intensity indicates the uncalibrated intensity value of the LiDAR points in Table 1.

2.7. The Classification of Urban Tree Species

In the classification step, class labels were assigned to the obtained segments based on generated feature values. The generated segments on the study area were classified as deciduous or coniferous trees using machine learning algorithms. Machine learning is a type of automation as a branch of artificial intelligence, and it works on the function and structure of algorithms by constructing a data-driven model for estimations from sample inputs [76]. SVM, RF, and MLP are the chosen machine learning classifiers used in this study. Information about the used machine learning classifiers and performance analyses is given in the following subsection.

2.7.1. Support Vector Machine

Support vector machine (SVM) was developed in 1995 by Vladimir Naumovich Vapnik [77]. SVM is a non-parametric supervised machine learning algorithm that performs the classification process based on the statistical learning concept with adaptive computational learning [78]. SVMs are very popular kernel-based statistical machine learning algorithms [79]. Kernel-based methods, such as support vector machines, are the main subject of a study on classification, clustering, and regression problems [80]. A hyperplane or a set of hyperplanes were constructed between groups or observation classes by support vector machines in an infinite dimensional space to separate the samples [81]. The hyperplane is the decision surface for maximizing the distance to the neighboring data points in the classes [82,83]. The data points nearest to the obtained hyperplane are called support vectors [84]. Detecting the best separation hyperplane with the highest margin distance between the nearest points of the two classes is the objective of the SVM approach [85]. The linear hyperplane is only sufficient for linearly separable data. If the data are not linearly separable, the support vector machine method can map the data onto a higher dimensional space where they are linearly separable with a kernel function, such as sigmoid, polynomial, normalization, radial basis function (RBF), and Laplacian radial basis function kernel [79,83].
In the present work, the radial basis function (RBF) kernel was used in SVM algorithm. The most important C and gamma (ɣ) parameters were analyzed manually in detail, and the determined C value was 100,000,000, while the gamma value was 5.092462164188164 × 10⁻¹⁰.

2.7.2. Random Forest

Random forest (RF) [86] is a widespread, powerful, non-parametric machine learning algorithm based on the bagging principle of decision tree classifiers [21]. The RF algorithm provides reliable classifications with the estimations acquired from an ensemble of classification and regression trees (CARTs) [72]. The random vectors in RF are used to develop individual trees consisting of root nodes, internal nodes, branches, and leaf nodes in the forest. In its simplest form, RF requires the number of trees (n) to constitute the “forest” and the number of features (m) to be used in each node in the trees [87]. In random forest, each tree votes for the most popular class at each input instance, and the final classification is defined by the majority votes of the entire forest trees [87,88]. The RF commonly uses the Gini index as a splitting criterion to determine which attribute to split during the learning phase of the tree [89,90]. The impurity level of the samples assigned to a node is measured with the Gini index [89]. A bootstrap sample, which is two-thirds of the original data, also known as an “in-of bag” sample, is used in the training of trees, and the one-third remainder data called as “out-of bag” samples are used in estimating the classification error and determining the importance of the classification features [6,91].
RF provides a variable importance measure (VIM), which is a key advantage according to alternative machine learning algorithms [92]. The Mean Decrease Accuracy (MDA) and Mean Decrease Gini (MDG) are two different VIMs in RF to identify the most relevant features or perform a feature selection procedure [90,93]. While MDA is the average of the difference between two out-of-bag test errors, MDG assesses the difference between the Gini index before and after classification [94].
In this research, n_estimators (the number of decision trees in the forest) and max_features (the number of features considered for the best split) parameters in the RF algorithm were analyzed for accurate classification. A total of 150 trees and 10 features at each split were used as n_estimators and max features, respectively. We also present the feature importance measures with MDG.

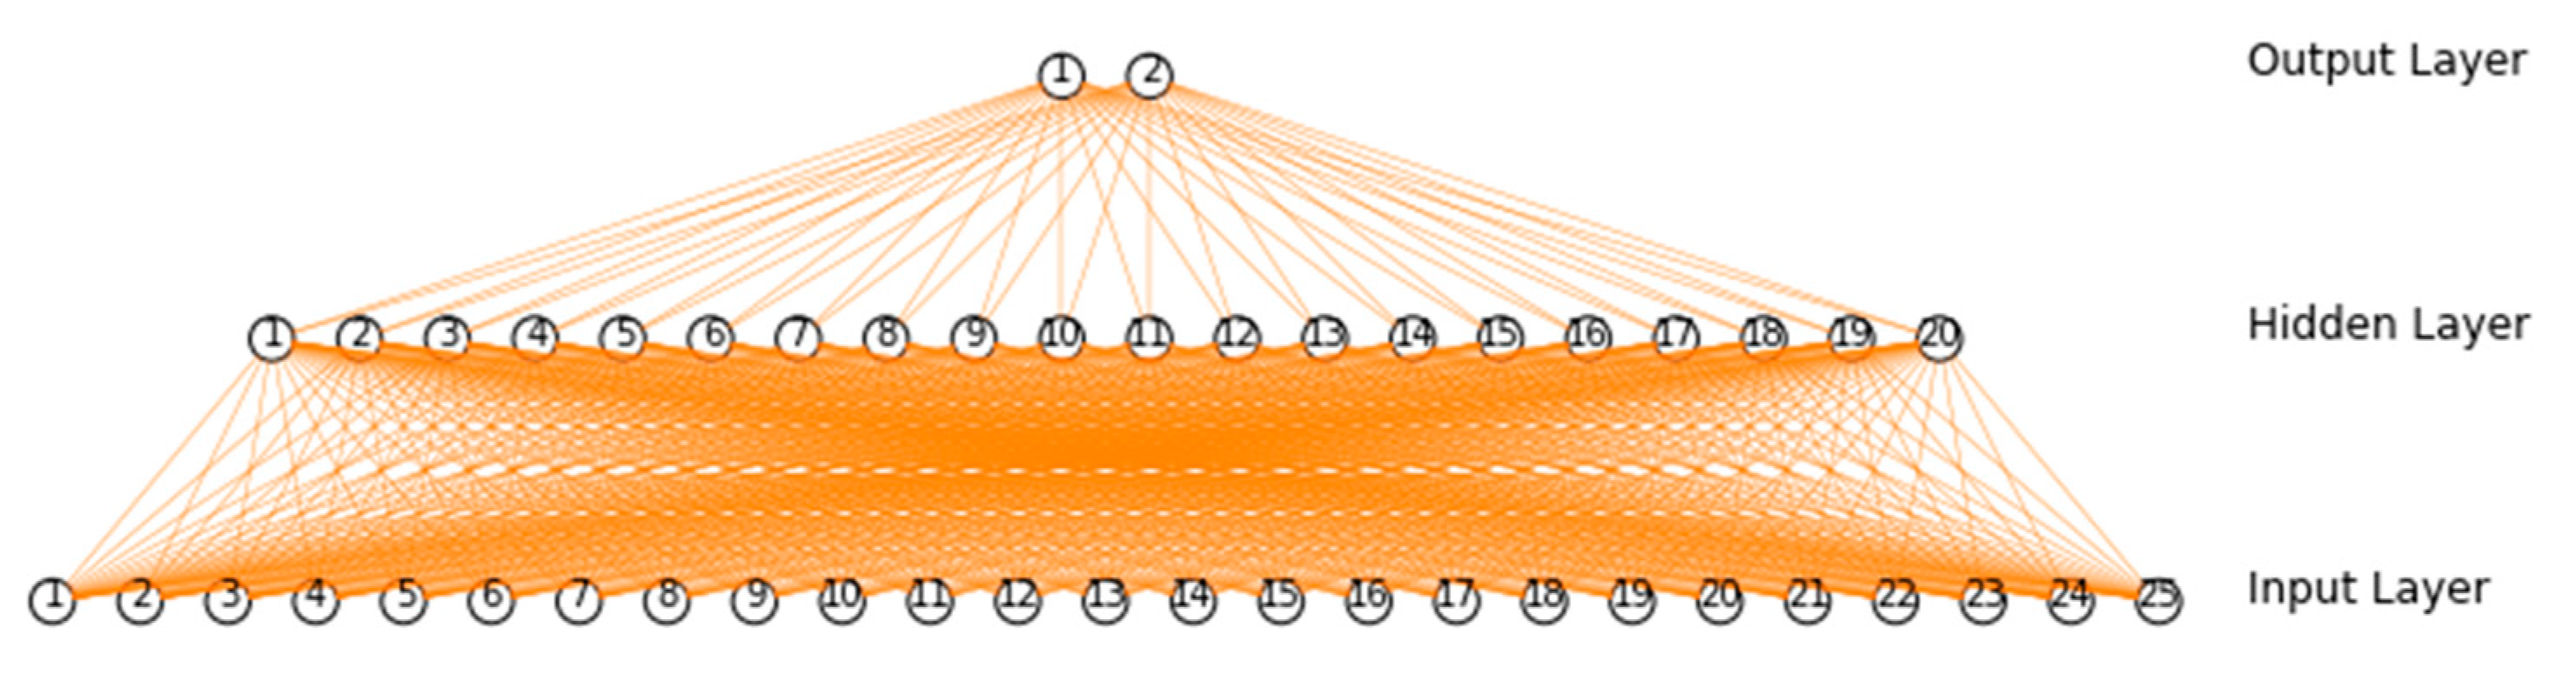
2.7.3. Multi-Layer Perceptron

Today, one of the most popular research topics in the machine learning and artificial intelligence fields is artificial neural network (ANNs) [95]. Multi-layer perceptron (MLP), a specific form of ANN, consists of the connection of neurons (the process elements) with each other in a given order, and each neuron is connected to another neuron in the next layer with connections that are named as weights [95,96]. Each neuron in a multi-layer perceptron structure receives an input array, and then generates a single output. MLP has one input layer, one or more hidden layer, and one output layer [76].
The information flows from the input to the output layer unidirectionally through the hidden layers, as MLP is a feed-forward neural network [97]. Each layer has a different role in a multi-layer perceptron algorithm. The first (input) layer indicates the inputs of the problem, and the last (output) layer represents the outputs of the problem. The main computational core of the multi-layer perceptron algorithm is the hidden layers [98]. The MLP structure used in this study is shown in Figure 4. As can be seen from Figure 4, the proposed MLP approach has a hidden layer with 20 neurons, as well as an input layer with 25 neurons and an output layer with 2 neurons.

2.8. Performance Analysis

Evaluation methods are needed to determine the classification success of a model [99]. The performance of the proposed machine learning-based classification model is evaluated by dividing the used dataset into training/testing samples. The accuracy of the classifications cannot be truly achieved, if the reference dataset is comparably small, and only a single split into training and test samples is used [18]. By applying iterative data-splitting, the cross-validation process allows us to validate the stability of the proposed classification technique [100]. In cross-validation, first the dataset is split into several different subsets, then a group is determined as a test set and the remaining groups are used as training sets, and the process is repeated for all possible training and test sets. Therefore, all the combinations are tested, and a performance value is acquired with the cross-validation by taking the average of each split result [101,102].
The classification performance of the used machine learning algorithms was quantitatively assessed with a statistical measurement of accuracy [73]. Equations (1)–(4) show the computed performance measures: the accuracy, recall, precision, and F1-score for tree species classification using a confusion matrix [103,104,105]. Accuracy indicates the ratio of correctly classified samples to all samples. Recall is used to assess the proportion of correctly predicted positive samples by the classification algorithm to the total number of samples that should be recognized as correct. Precision is used to estimate the ratio of correctly classified positive samples to the total predicted positive samples [106,107]. The F1-score is calculated with the harmonic mean of recall and precision measures [108]. The potential values of accuracy, recall, precision, and F1-score range from 0 to 1. The values closer to 1 describe a better classification performance, and the values closer to 0 express lower classification results [109]:
A c c u r a c y = T P + T N T P + T N + F P + F N
R e c a l l = T P T P + F N
P r e c i s i o n = T P T P + F P
F 1 s c o r e = 2 P r e c i s i o n × R e c a l l P r e c i s i o n + R e c a l l
TP, TN, FP, and FN in Equation (1) define the true positive, true negative, false positive, and false negative samples, respectively. TP refers to the entities classified correctly according to the ground-truth data, and TN defines the entities that were not acquired in the classification and also do not exist in the ground-truth data. FP represents the entities that have been obtained with the classification but do not exist in the ground-truth data, and FN refers to the entities defined as correct in the ground-truth data that were not acquired in the classification [2,110,111].
In this study, the machine learning-based classification models were formed with 70% training and 30% test samples. The classification results were interpreted using the accuracy, recall, precision, and F1-score values on the test dataset (30%). A 10-fold cross-validation was also used to evaluate the stability of the proposed machine learning-based SVM, RF, and MLP algorithms for tree species classification. All the segmentation processes of the high vegetation points, the urban tree species classification, and the performance analysis in this research were performed in the Jupyter Notebook environment with the Python programming language (Python 3.6.4), along with scikit-learn library.

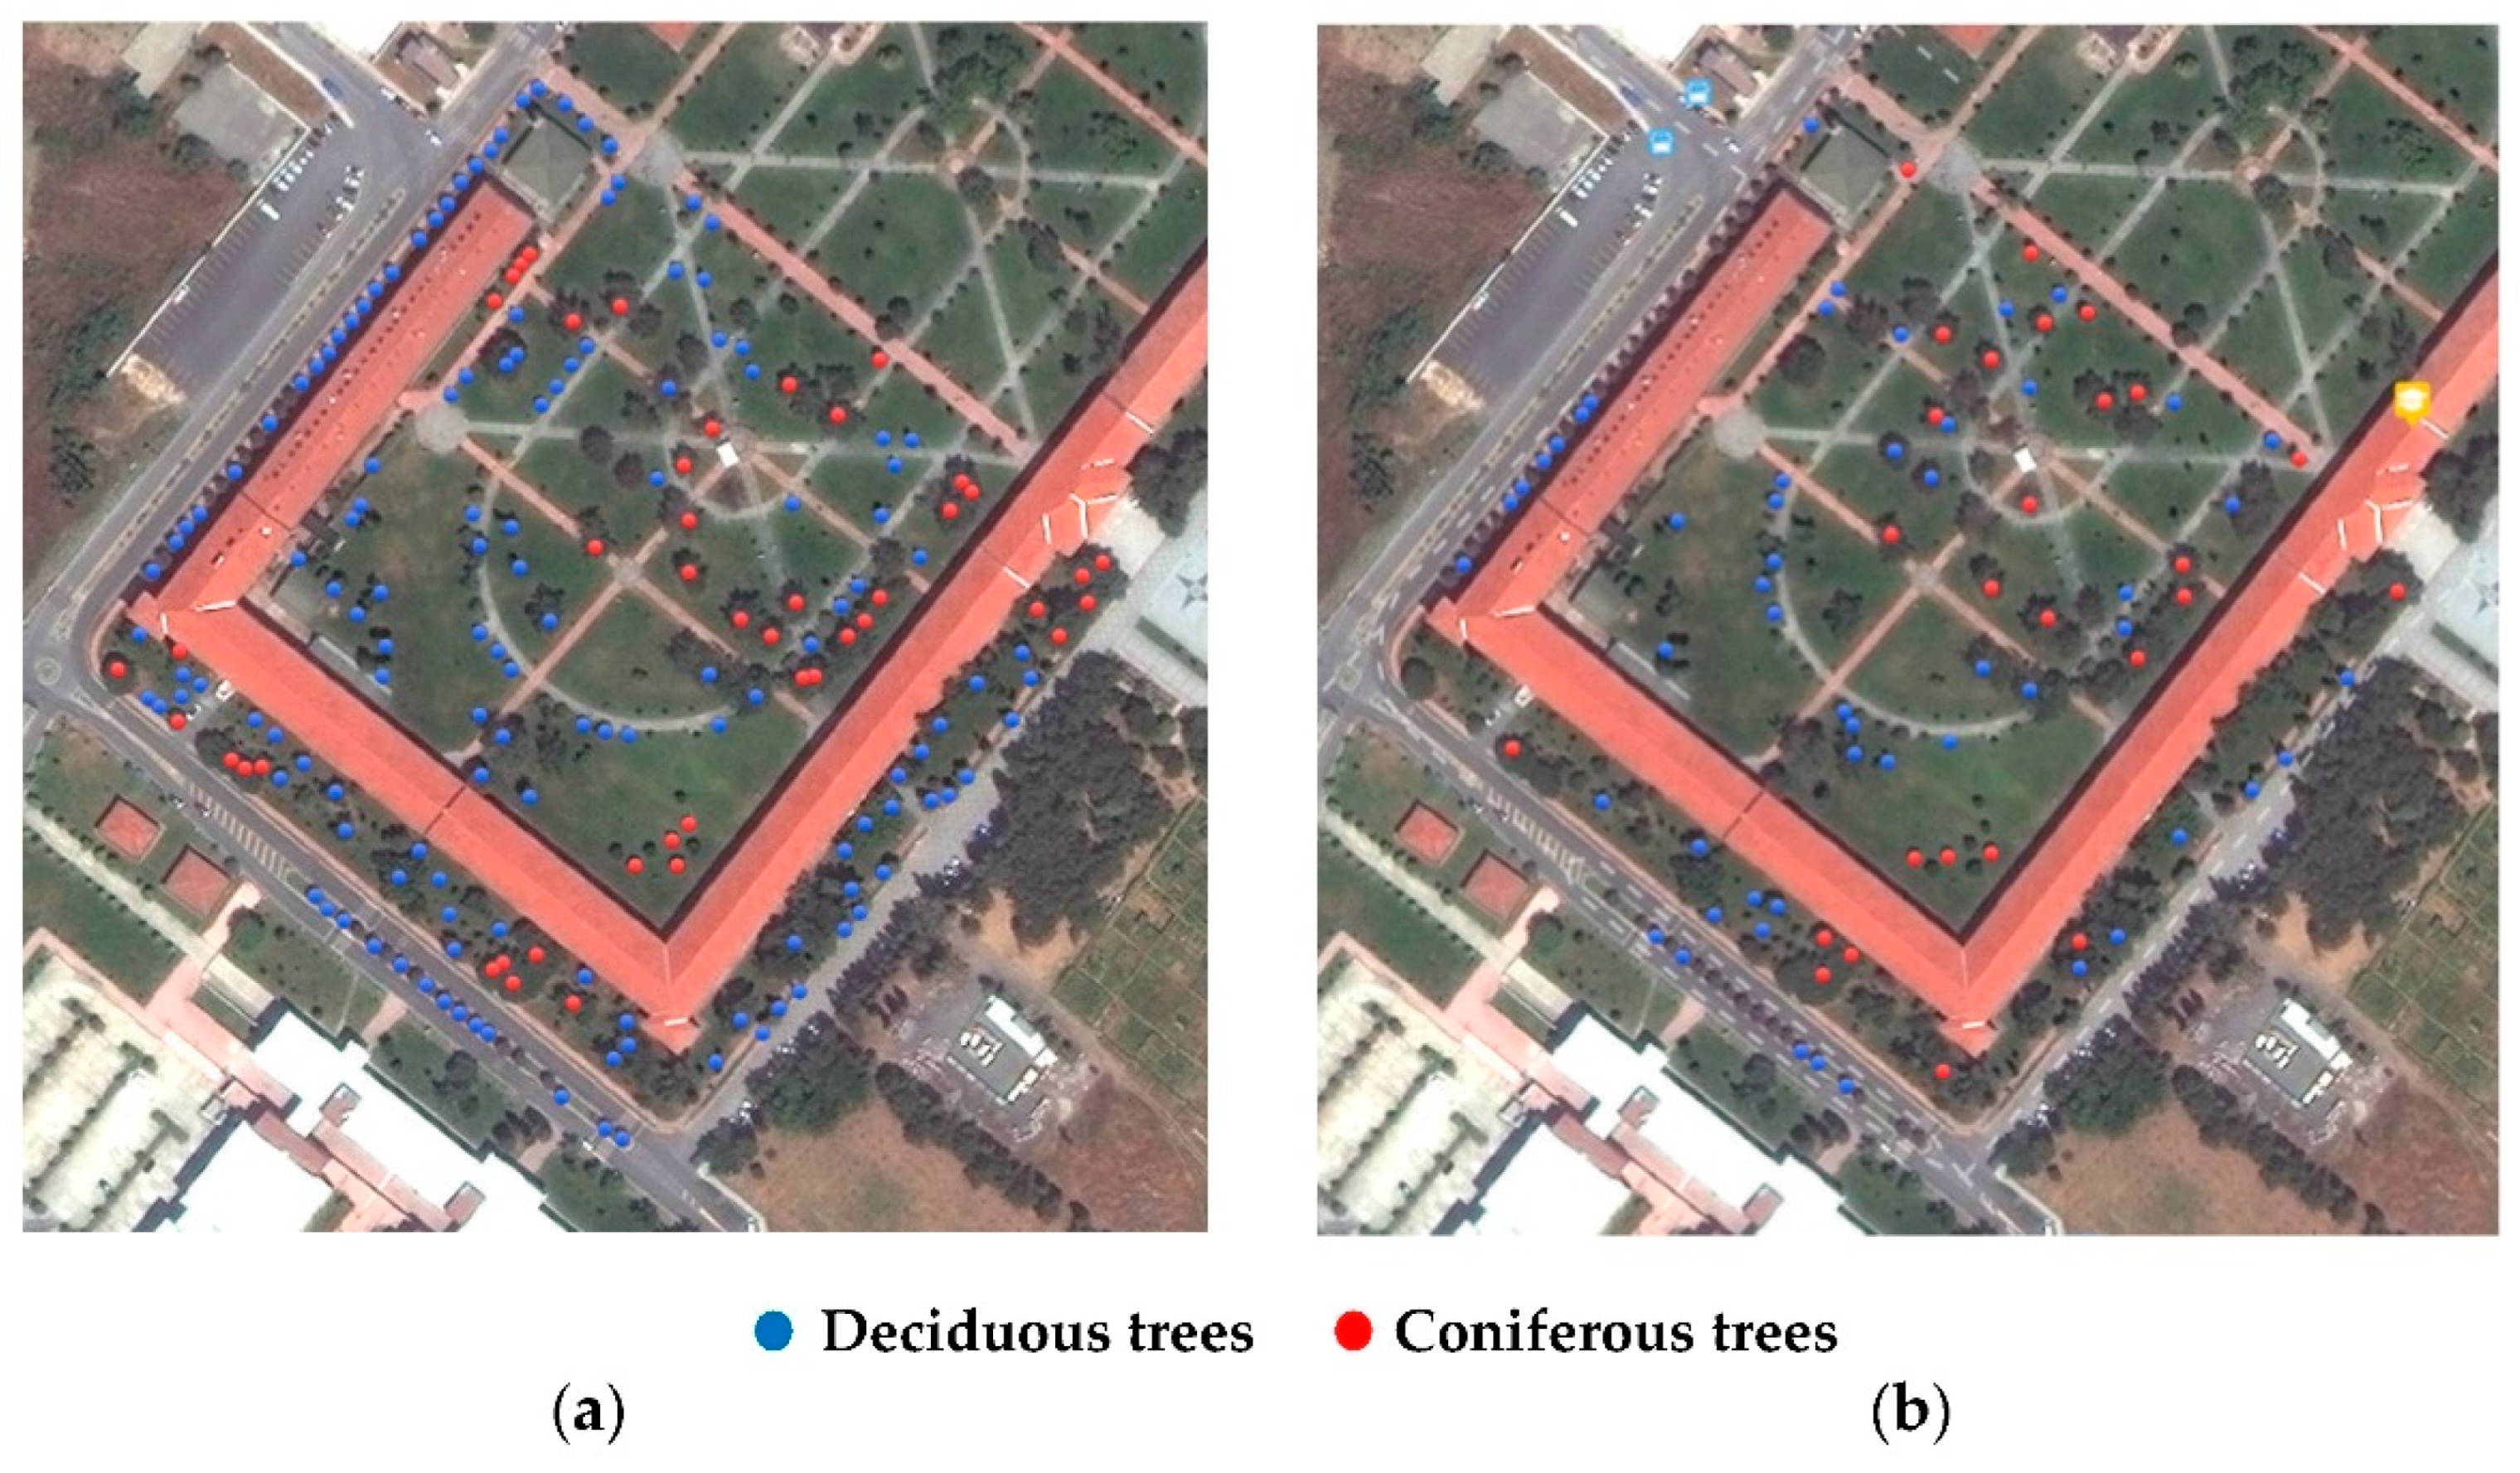
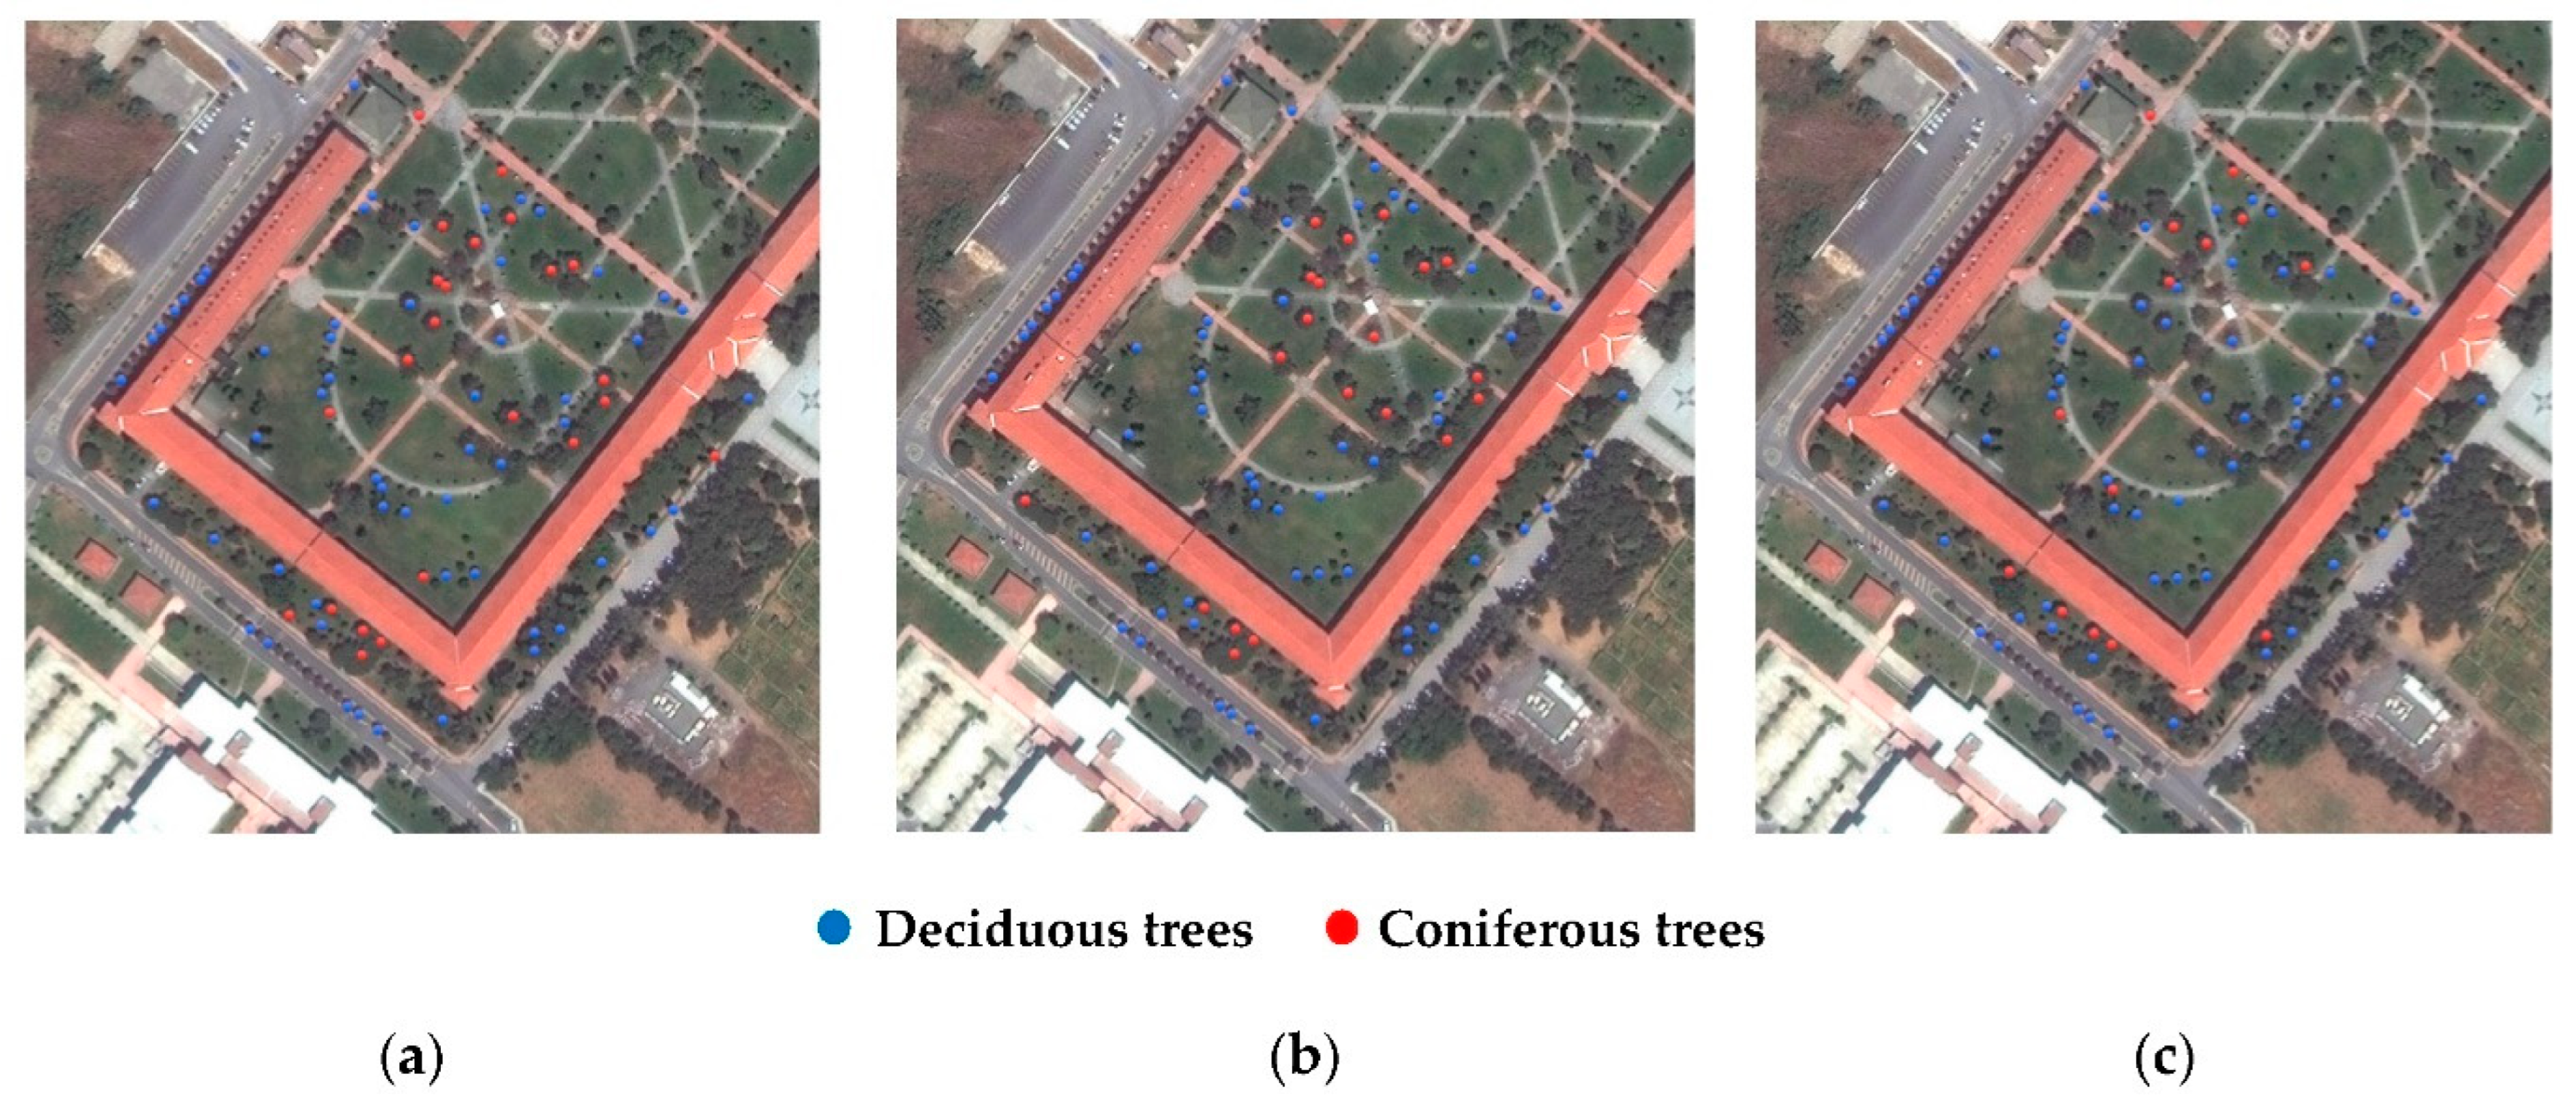
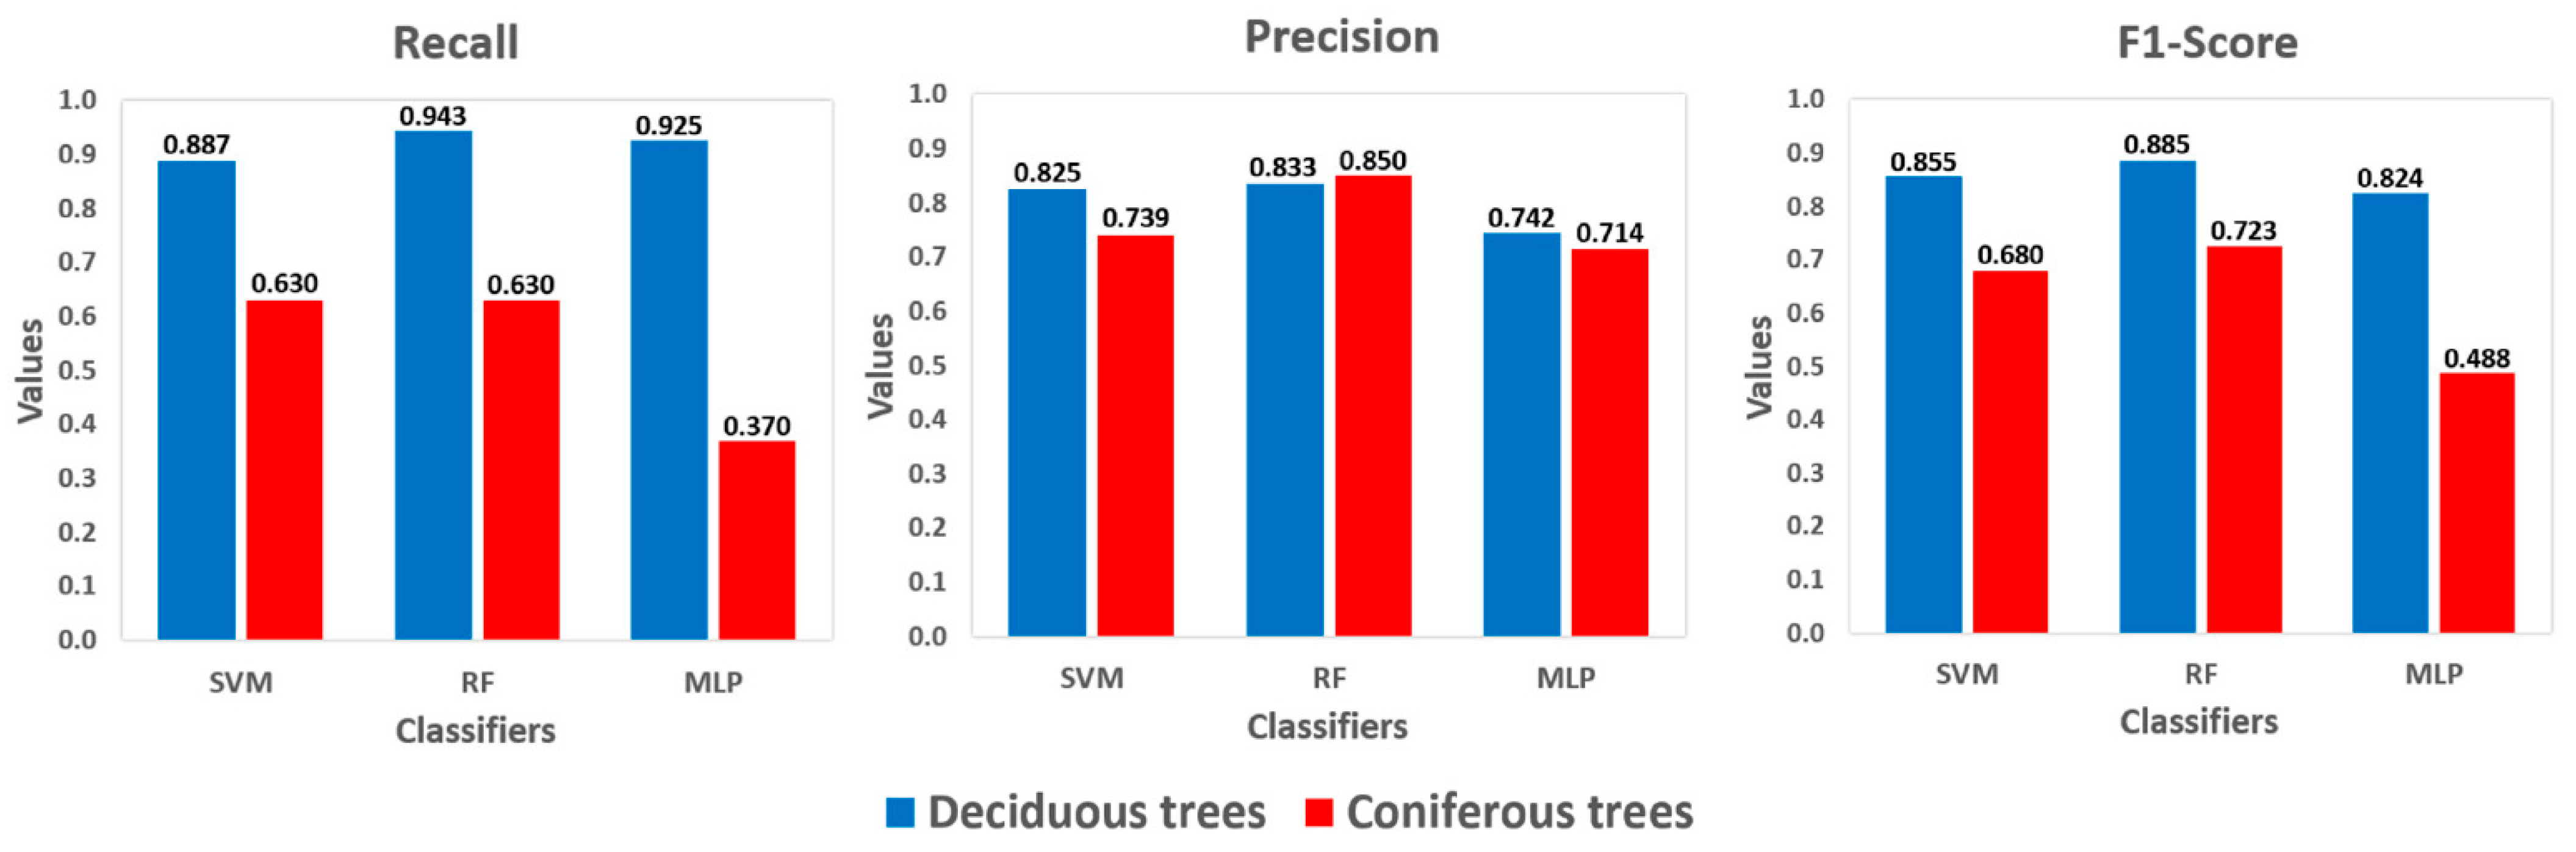
3. Results and Discussion

As the first step in the proposed methodology, the high vegetation classification results acquired with a hierarchical rule-based classification of a three-dimensional raw LiDAR point cloud using spatial (geometric) features are given in Figure 5. When the point-based classification results were analyzed, it was clearly seen that the points of high vegetation were obtained successfully; therefore, almost all the tree points in the study area were accurately assigned to the high vegetation class.
Individual tree crown segmentation is the second step of the proposed machine learning-based urban tree species classification after the high vegetation classification process. A total of 346 tree crowns were obtained using mean shift segmentation (2D kernel with a proper bandwidth of 3) in the study area as the primary results of 2D point-based tree crown segmentation. Under- and over-segmented urban trees existed in the study area, especially in areas where the trees were dense and the tree crowns were mixed with each other (see the red rectangles in Figure 5). The segmentation accuracy of the tree crowns was 77% based on ground-truth data. As we were focused on individual trees, the under-segmented and over-segmented tree crowns were removed from the output of mean shift segmentation. As a result, 265 individual tree crowns were obtained for the classification process of tree species (Figure 6). The ground-truth data, which were required for training and testing the machine learning-based classification models, were created by manually labeling the obtained individual tree segments as deciduous or coniferous trees based on visual interpretation and field investigation (Figure 7).
The segmented individual trees were classified into deciduous or coniferous tree species based on the spatial- and intensity-related features (see Table 1) of the LiDAR data with support vector machine, random forest, and multi-layer perceptron machine learning classification methods using determined parameters and 25 generated features. In the 3D point-based classification process, 193 deciduous and 72 coniferous trees, in total 265 individual tree crowns, were used. Each classifier (SVM, RF, and MLP) was trained with the same randomly determined training sample set (185 trees, which was 70% of the total segmented 265 tree crowns), and the remaining test samples (80 trees, which was 30% of the total segmented 265 tree crowns) were used to validate the classification performance of the models (Figure 7).
The classification results for urban deciduous and coniferous trees using SVM, RF, and MLP classification models are shown in Figure 8. As mentioned earlier, the classification results were interpreted by means of accuracy, recall, precision, and F1-score on the test dataset (30%). The overall accuracies for the proposed machine learning-based classification of urban tree species with SVM, RF, and MLP classification models are given in Table 2. The urban tree species classification results obtained from our study area show that the machine learning methods were able to classify the urban tree species using the 3D raw airborne LiDAR data with sufficient accuracy. According to the obtained overall classification accuracies of urban tree species, the RF classifier had the best classification accuracy with 83.75%, while SVM had a 3.75% lower classification accuracy and MLP had a 10% lower classification accuracy than RF.
The recall, precision, and F1-score values of each tree species (deciduous and coniferous trees) were also calculated and are shown in Figure 9. According to the recall values, RF was the best classification method for deciduous trees with a 0.943 recall value in the study area. The recall values of the SVM and MLP classifiers were also high, similar to the RF method, and were 0.887 and 0.925, respectively for deciduous trees. Lower recall values of the SVM, RF, and MLP algorithms were obtained for coniferous trees compared with deciduous trees in the study area. While the SVM and RF values were quite similar, the recall of the MLP algorithm was the worst with 0.370. Therefore, MLP is an insufficient method for the coniferous tree species. Similar precision values (0.825 and 0.833) were obtained for deciduous trees with the SVM and RF classifiers. MLP was the least successful classification method for deciduous trees according to the precision values (0.742). For the coniferous tree species, the RF classifier was the best method with 0.850 precision values. The values of 0.739 and 0.714 are the lower precision values for the coniferous tree species using the SVM and MLP methods, respectively, in the study area. Regarding the F1-scores, the coniferous tree species were classified worse than the deciduous tree species, and all the classification methods (SVM, RF, and MLP) were the successful for the deciduous tree species (with values of 0.855, 0.885, and 0.824). For the coniferous tree species, the MLP classifier was the worst classification method according to the 0.488 F1-score value. RF was the best classification method, and SVM was a relatively good algorithm for deciduous trees with regard to F1-scores (0.723 and 0.680, respectively). In general, the recall, precision, and F1-score values for the deciduous tree species were higher than for the coniferous tree species in the study area. Consequently, the SVM, RF, and MLP machine learning classifiers produced more successful classification results for the deciduous trees species compared with the coniferous tree species.
In this study, the classification success of the SVM, RF, and MLP classification models were tested using cross-validation. A 10-fold cross-validation was performed for the classification models in order to obtain better confidence classification results, evaluate the stability of the models, and avoid overfitting, as can be seen in Table 3. The average RF classification accuracy was the highest (81.54%) with the 10-fold cross-validation, which was 0.44% higher than SVM and 17.82% higher than the average MLP classification accuracy (see Table 3). The MLP classifier had the worst average classification accuracy. While the accuracy of the two urban tree species classified with SVM and RF algorithms was similar, the accuracy acquired with the MLP algorithm was relatively low compared to these.
A feature importance process was also conducted in this study to analyze the impact of the used 25 spatial- and intensity-based features of the tree species classification with RF. The Mean Decrease Gini (MDG) was used to indicate the feature importance in the RF classification (Figure 10). While the most important classification feature among the 25 features is “90th percentile of Z”, the least important classification feature was the “5th percentile of Z”. “Minimum Z”, “Number of points”, “Z range”, “75th percentile of Z”, and “Standard deviation of Z” were the next five most important features following “90th percentile of Z”. Generally, the spatial-based features had a higher importance than the intensity-based features for the proposed 3D point-based classification according to MDG in the RF classification.
The three widely-used machine learning algorithms (SVM, RF, and MLP) were selected to assess their usage for urban tree species classification. The results of this study provide preliminary findings for deciduous and coniferous tree species classification using 3D raw LiDAR data in an urban area. When the performances of our machine learning-based classification algorithms were analyzed, it was noted that the support vector machine, and particularly the random forest classifier, discovered reliable solutions, even for the urban tree objects that showed similar geometrical and textural properties, whereas the multi-layer perceptron classifier solutions were not competitive (Table 2 and Table 3). The success of the RF classifier against the SVM and MLP classifiers can be explained by the fact that the RF classifier is suitable for handling unbalanced samples and adds additional randomness to the classification model during the growing trees as well as searching for only the best features among a random subset of features in the splitting process of each node [112,113,114,115]. Compared with the SVM and RF classification models, the MLP models can have numerous weights for optimizing in each iteration [114,116,117]. In addition, the MLP needs more training data and more parameter tuning in the training stage [117]. Considering these reasons, the MLP classifier is less successful than the SVM and RF classifiers for the classification of urban tree species.
Most of the tree species classification studies in the literature have used a canopy height model (CHM) produced from LiDAR points, as well as features derived from full-waveform LiDAR data for deciduous and coniferous tree species [47,49,118,119]. In this study, commonly used spatial- and intensity-based features were computed from a traditional LiDAR dataset without using any reference terrain surface model or any CHM [11,75,120,121]. The features derived from full-waveform LiDAR data were not used since the full-waveform information was not available in our LiDAR dataset [21,64]. Based on deciduous and coniferous tree species classification, the maximum overall classification accuracy of 85% in Reitberger et al. [64], and the overall classification accuracy of 88% in Ørka et al. [31] are comparable with our maximum overall classification accuracy of 84% with random forest. However, the k-means and the expectation maximation (EM) classifier used in Reitberger et al. [64] and the linear discriminant analysis (LDA) classifier used in Ørka et al. [31] are different from our SVM, RF, and MLP machine learning-based classifiers. The full-waveform LiDAR features used in Reitberger et al. [64] and the structural and echo-based features used in Ørka et al. [31] were not included in our classification features. The study areas in Reitberger et al. [64] and in Ørka et al. [31] were selected as forest areas that were not comparable with our urban study area. Considering the obtained overall accuracy metrics in our urban study area, the proposed machine learning-based classification algorithms in tree species classification using the 3D raw LiDAR data were successful.
The number of training and test samples in the study area was relatively small in comparison with similar studies such as Yu et al. [121] and Nguyen et al. [122], but the obtained accuracies of the machine learning-based classifications are comparable. The classification results obtained from our study could serve as the basis for a pilot study in future deciduous and coniferous tree species classification studies using machine learning algorithms in large-scale urban applications.

4. Conclusions

In this paper, a machine learning-based 3D LiDAR point cloud classification algorithm was proposed to classify urban tree species as deciduous or coniferous using SVM, RF, and MLP. The experimental results indicate that SVM and RF classifications generally outperform MLP classification. The obtained results could be improved by extending the size of the used training and test samples, in addition to using full-waveform LiDAR to a produce larger number of spatial- and intensity-based features for discriminating deciduous and coniferous tree species in urban environments.
The classification results are encouraging with respect to the difficult study area, which included heterogeneous urban structures with dense trees in different sizes, ages, and species. This study offers insights for urban authorities regarding the potential use of machine learning algorithms for classifying deciduous (broadleaf) and coniferous tree species from 3D raw LiDAR data in urban environments using spatial- and intensity-based LiDAR features. Compared with traditional field surveys and aerial photograph interpretation methods for tree species classification, the proposed approach has essential benefits, such as automation, especially in terms of reducing the manpower and field study requirements. Many activities, such as the management, planning, and maintenance of urban trees, as well as the identification of endemic tree species, can be easily carried out in urban environments with the proposed machine learning-based 3D raw LiDAR point classification approach.

Author Contributions

Conceptualization, Zehra Cetin and Naci Yastikli; methodology, Zehra Cetin and Naci Yastikli; software, Zehra Cetin and Naci Yastikli; validation, Zehra Cetin and Naci Yastikli; formal analysis, Zehra Cetin and Naci Yastikli; investigation, Zehra Cetin and Naci Yastikli; resources, Zehra Cetin and Naci Yastikli; data curation, Zehra Cetin and Naci Yastikli; writing—original draft preparation, Zehra Cetin and Naci Yastikli; writing—review and editing, Zehra Cetin and Naci Yastikli; visualization, Zehra Cetin and Naci Yastikli; supervision, Naci Yastikli. All authors have read and agreed to the published version of the manuscript.

Funding

This research received no external funding.

Institutional Review Board Statement

Not applicable.

Informed Consent Statement

Not applicable.

Data Availability Statement

Not applicable.

Acknowledgments

The authors would like to thank the Metropolitan Municipality of Istanbul for supplying the LiDAR dataset in the study area of Davutpasa, Istanbul, Turkey.

Conflicts of Interest

The authors declare no conflict of interest.

References

  1. Wang, K.; Wang, T.; Liu, X. A Review: Individual Tree Species Classification Using Integrated Airborne LiDAR and Optical Imagery with a Focus on the Urban Environment. Forests 2019, 10, 1. [Google Scholar] [CrossRef] [Green Version]
  2. Yastikli, N.; Cetin, Z. Detection of Individual Trees in Urban Areas Using the Point Cloud Produced by Dense Image Matching Algorithms. In Proceedings of the FIG Working Week 2020, Amsterdam, The Netherlands, 10–14 May 2020. [Google Scholar]
  3. Pu, R.; Landry, S. A comparative analysis of high spatial resolution IKONOS and WorldView-2 imagery for mapping urban tree species. Remote Sens. Environ. 2012, 124, 516–533. [Google Scholar] [CrossRef]
  4. Ciesielski, M.; Sterenczak, K. Accuracy of determining specific parameters of the urban forest using remote sensing. Iforest Biogeosci. For. 2019, 12, 498–510. [Google Scholar] [CrossRef] [Green Version]
  5. Feng, X.; Li, P. A Tree Species Mapping Method from UAV Images over Urban Area Using Similarity in Tree-Crown Object Histograms. Remote Sens. 2019, 11, 1982. [Google Scholar] [CrossRef] [Green Version]
  6. Jombo, S.; Adam, E.; Byrne, M.J.; Newete, S.W. Evaluating the capability of Worldview-2 imagery for mapping alien tree species in a heterogeneous urban environment. Cogent Soc. Sci. 2020, 6, 1754146. [Google Scholar] [CrossRef]
  7. Strunk, J.L.; Mills, J.R.; Ries, P.; Temesgen, H.; Jeroue, L. An urban forest-inventory-and-analysis investigation in Oregon and Washington. Urban For. Urban Green. 2016, 18, 100–109. [Google Scholar] [CrossRef] [Green Version]
  8. Liu, L.; Coops, N.C.; Aven, N.W.; Pang, Y. Mapping urban tree species using integrated airborne hyperspectral and LiDAR remote sensing data. Remote Sens. Environ. 2017, 200, 170–182. [Google Scholar] [CrossRef]
  9. Xu, J.; Cai, Z.; Wang, T.; Liu, G.; Tang, P.; Ye, X. Exploring Spatial Distribution of Pollen Allergenic Risk Zones in Urban China. Sustainability 2016, 8, 978. [Google Scholar] [CrossRef] [Green Version]
  10. Dawe, G. The Routledge Handbook of Urban Ecology, 1st ed.; Douglas, I., Goode, D., Houck, M., Wang, R., Eds.; Routledge: New York, NY, USA, 2011; ISBN 9781138824423. [Google Scholar]
  11. Roffey, M.; Wang, J. Evaluation of Features Derived from High-Resolution Multispectral Imagery and LiDAR Data for Object-Based Support Vector Machine Classification of Tree Species. Can. J. Remote Sens. 2020, 46, 473–488. [Google Scholar] [CrossRef]
  12. Yastikli, N.; Cetin, Z. Detection of Individual Trees in Urban Areas Using Raw LiDAR Data. In Proceedings of the International Symposium on Applied Geoinformatics ISAG2019, Istanbul, Turkey, 7–9 November 2019. [Google Scholar]
  13. Li, D.; Ke, Y.; Gong, H.; Li, X. Object-Based Urban Tree Species Classification Using Bi-Temporal WorldView-2 and WorldView-3 Images. Remote Sens. 2015, 7, 16917–16937. [Google Scholar] [CrossRef] [Green Version]
  14. Höfle, B.; Hollaus, M.; Hagenauer, J. Urban vegetation detection using radiometrically calibrated small-footprint full-waveform airborne LiDAR data. ISPRS J. Photogramm. Remote Sens. 2012, 67, 134–147. [Google Scholar] [CrossRef]
  15. Ardila, J.P. Object-Based Methods for Mapping and Monitoring of Urban Trees with Multitemporal Image Analyses. Ph.D. Thesis, University of Twente Faculty of Geo-Information and Earth Observation (ITC), Enschede, The Netherlands, 2012. [Google Scholar]
  16. Alonzo, M.; Bookhagen, B.; Roberts, D.A. Urban tree species mapping using hyperspectral and lidar data fusion. Remote Sens. Environ. 2014, 148, 70–83. [Google Scholar] [CrossRef]
  17. Yan, S.; Jing, L.; Wang, H. A New Individual Tree Species Recognition Method Based on a Convolutional Neural Network and High-Spatial Resolution Remote Sensing Imagery. Remote Sens. 2021, 13, 479. [Google Scholar] [CrossRef]
  18. Fassnacht, F.E.; Latifi, H.; Stereńczak, K.; Modzelewska, A.; Lefsky, M.; Waser, L.T.; Straub, C.; Ghosh, A. Review of studies on tree species classification from remotely sensed data. Remote Sens. Environ. 2016, 186, 64–87. [Google Scholar] [CrossRef]
  19. Mustafa, Y.; Habeeb, H.; Stein, A.; Sulaiman, F. Identification and Mapping of Tree Species in Urban Areas Using Worldview-2 Imagery. ISPRS Ann. Photogramm. Remote Sens. Spat. Inf. Sci. 2015, II-2/W2, 175–181. [Google Scholar] [CrossRef] [Green Version]
  20. Shojanoori, R.; Shafri, H.Z.M.; Mansor, S.; Ismail, M.H. The use of worldview-2 satellite data in urban tree species mapping by object-based image analysis technique. Sains Malays. 2016, 45, 1025–1034. [Google Scholar]
  21. Shi, Y.; Skidmore, A.; Heurich, M. Important LiDAR metrics for discriminating forest tree species in Central Europe. ISPRS J. Photogramm. Remote Sens. 2018, 137, 163–174. [Google Scholar] [CrossRef]
  22. Jombo, S.; Adam, E.; Odindi, J. Classification of tree species in a heterogeneous urban environment using object-based ensemble analysis and World View-2 satellite imagery. Appl. Geomat. 2021, 13, 373–387. [Google Scholar] [CrossRef]
  23. Wang, J.; Lindenbergh, R.; Menenti, M. Scalable individual tree delineation in 3d point clouds. Photogramm. Rec. 2018, 33, 315–340. [Google Scholar] [CrossRef]
  24. Man, Q.; Dong, P.; Yang, X.; Wu, Q.; Han, R. Automatic Extraction of Grasses and Individual Trees in Urban Areas Based on Airborne Hyperspectral and LiDAR Data. Remote Sens. 2020, 12, 2725. [Google Scholar] [CrossRef]
  25. Pu, R. Broadleaf species recognition with in situ hyperspectral data. Int. J Remote Sens. 2009, 30, 2759–2779. [Google Scholar] [CrossRef]
  26. Ghiyamat, A.; Shafri, H.Z.M. A review on hyperspectral remote sensing for homogeneous and heterogeneous forest biodiversity assessment. Int. J. Remote Sens. 2010, 31, 1837–1856. [Google Scholar] [CrossRef]
  27. Immitzer, M.; Atzberger, C.; Koukal, T. Tree Species Classification with Random Forest Using Very High Spatial Resolution 8-Band WorldView-2 Satellite Data. Remote Sens. 2012, 4, 2661–2693. [Google Scholar] [CrossRef] [Green Version]
  28. Wang, Y.; Wang, J.; Chang, S.; Sun, L.; An, L.; Chen, Y.; Xu, J. Classification of Street Tree Species Using UAV Tilt Photogrammetry. Remote Sens. 2021, 13, 216. [Google Scholar] [CrossRef]
  29. Hartling, S.; Sagan, V.; Sidike, P.; Maimaitijiang, M.; Carron, J. Urban Tree Species Classification Using a WorldView-2/3 and LiDAR Data Fusion Approach and Deep Learning. Sensors 2019, 19, 1284. [Google Scholar] [CrossRef] [Green Version]
  30. Moradi, A.; Satari, M.; Momeni, M. Individual Tree of Urban Forest Extraction from Very High Density LiDAR Data. Int. Arch. Photogramm. Remote Sens. Spatial Inf. Sci. 2016, XLI-B3, 337–343. [Google Scholar] [CrossRef] [Green Version]
  31. Ørka, H.O.; Næsset, E.; Bollandsås, O.M. Classifying species of individual trees by intensity and structure features derived from airborne laser scanner data. Remote Sens. Environ. 2009, 113, 1163–1174. [Google Scholar] [CrossRef]
  32. Vaughn, N.R.; Moskal, L.M.; Turnblom, E.C. Fourier transformation of waveform LiDAR for species recognition. Remote Sens. Lett. 2011, 2, 347–356. [Google Scholar] [CrossRef]
  33. Ko, C.; Remmel, T.K.; Sohn, G. Mapping tree genera using discrete LiDAR and geometric tree metrics. Bosque 2012, 33, 313–319. [Google Scholar] [CrossRef] [Green Version]
  34. Vaughn, N.R.; Moskal, L.M.; Turnblom, E.C. Tree species detection accuracies using discrete point lidar and airborne waveform lidar. Remote Sens. 2012, 4, 377–403. [Google Scholar] [CrossRef] [Green Version]
  35. Lindberg, E.; Eysn, L.; Hollaus, M.; Holmgren, J.; Pfeifer, N. Delineation of tree crowns and tree species classification from full-waveform airborne laser scanning data using 3-D ellipsoidal clustering. IEEE J. Sel. Top. Appl. Earth Obs. Remote Sens. 2014, 7, 3174–3181. [Google Scholar] [CrossRef] [Green Version]
  36. Yu, X.; Litkey, P.; Hyyppä, J.; Holopainen, M.; Vastaranta, M. Assessment of low density full-waveform airborne laser scanning for individual tree detection and tree species classification. Forest 2014, 5, 1011–1031. [Google Scholar] [CrossRef] [Green Version]
  37. Brandtberg, T. Classifying individual tree species under leaf-off and leaf-on conditions using airborne lidar. ISPRS J. Photogramm. Remote Sens. 2007, 61, 325–340. [Google Scholar] [CrossRef]
  38. Heinzel, J.N.; Weinacker, H.; Koch, B. Full automatic detection of tree species based on delineated single tree crowns—A data fusion approach for airborne laser scanning data and aerial photographs. In SilviLaser 2008, Proceedings of the 8th International Conference on LiDAR Applications in Forest Assessment and Inventory; Hill, R.A., Rosette, J., Suárez, J., Eds.; SilviLaser: Edinburgh, UK, 2008; pp. 76–85. [Google Scholar]
  39. Holmgren, J.; Persson, A.; Söderman, U. Species identification of individual trees by combining high resolution LiDAR data with multi-spectral images. Int. J. Remote Sens. 2008, 29, 1537–1552. [Google Scholar] [CrossRef]
  40. Jones, T.G.; Coops, N.C.; Sharma, T. Assessing the utility of airborne hyperspectral and LiDAR data for species distribution mapping in the coastal Pacific Northwest, Canada. Remote Sens. Environ. 2010, 114, 2841–2852. [Google Scholar] [CrossRef]
  41. Kim, S.; Hinckley, T.; Briggs, D. Classifying individual tree genera using stepwise cluster analysis based on height and intensity metrics derived from airborne laser scanner data. Remote Sens. Environ. 2011, 115, 3329–3342. [Google Scholar] [CrossRef]
  42. Li, J. Individual Tree Delineation and Species Identification in Deciduous and Mixed Canadian Forests Using High Spatial Resolution Airborne Lidar And Image Data. Ph.D. Thesis, Graduate Program in Earth and Space Science York University, Toronto, ON, Canada, 2013. [Google Scholar]
  43. Ghosh, A.; Fassnacht, F.E.; Joshi, P.K.; Koch, B. A framework for mapping tree species combining hyperspectral and LiDAR data: Role of selected classifiers and sensor across three spatial scales. Int. J. Appl. Earth Obs. Geoinf. 2014, 26, 49–63. [Google Scholar] [CrossRef]
  44. Sommer, C.; Holzwarth, S.; Heiden, U.; Heurich, M.; Mueller, J.; Mauser, W. Feature-based treee species classification using airborne hyperspectral and lidar data in the Bavarian Forest National Park. EARSeL Eproc. 2015, 14, 49–70. [Google Scholar] [CrossRef]
  45. Alonzo, M.; McFadden, J.P.; Nowak, D.J.; Roberts, D.A. Mapping urban forest structure and function using hyperspectral imagery and lidar data. Urban For. Urban Green. 2016, 17, 135–147. [Google Scholar] [CrossRef] [Green Version]
  46. Sasaki, T.; Imanishi, J.; Ioki, K.; Morimoto, Y.; Kitada, K. Object-based classification of land cover and tree species by integrating airborne LiDAR and high spatial resolution imagery data. Landsc. Ecol. Eng. 2012, 8, 157–171. [Google Scholar] [CrossRef]
  47. Zhang, Z.; Liu, X. Support Vector Machines for Tree Species Identification Using Lidar Derived Structure and Intensity Variables. Geocarto Int. 2013, 28, 364–378. [Google Scholar] [CrossRef]
  48. Schumacher, J.; Nord-Larsen, T. Wall-to-Wall Tree Type Classification Using Airborne Lidar Data and CIR Images. Int. J. Remote Sens. 2014, 35, 3057–3073. [Google Scholar] [CrossRef]
  49. Hovi, A.; Korhonen, L.; Vauhkonen, J.; Korpela, I. LiDAR waveform features for tree species classification and their sensitivity to tree and acquisition related parameters. Remote Sens. Environ. 2016, 173, 224–237. [Google Scholar] [CrossRef]
  50. Kim, S.; Schreuder, G.; McGaughey, R.J.; Andersen, H.-E. Individual tree species identification using LIDAR intensity data. In Proceedings of the ASPRS 2008 Annual Conference, Portland, OR, USA, 28 April–2 May 2008; pp. 382–393. [Google Scholar]
  51. Cho, M.A.; Mathieu, R.; Asner, G.P.; Naidoo, L.; Van Aardt, J.A.; Ramoelo, A.; Debba, P.; Wessels, K.; Main, R.; Smit, I.P.; et al. Mapping tree species composition in South African savannas using an integrated airborne spectral and LiDAR system. Remote Sens. Environ. 2012, 125, 214–226. [Google Scholar] [CrossRef]
  52. Pati, C.; Panda, K.A.; Tripathy, A.K.; Pradhan, K.S.; Patnaik, S. A novel hybrid machine learning approach for change detection in remote sensing images. Eng. Sci. Technol. Int. J. 2020, 23, 973–981. [Google Scholar] [CrossRef]
  53. McCarthy, N.F.; Tohidi, A.; Valero, M.M.; Dennie, M.; Aziz, Y.; Hu, N. A Machine Learning Solution for Operational Remote Sensing of Active Wildfires. In Proceedings of the IGARSS 2020-2020 IEEE International Geoscience and Remote Sensing Symposium, Waikoloa, HI, USA, 26 September–2 October 2020; pp. 6802–6805. [Google Scholar] [CrossRef]
  54. Thepade, S.D.; Dindorkar, M.Y. Fusing deep convolutional neural network features with Thepade’s SBTC for land usage identification. Eng. Sci. Technol. Int. J. 2022, 27, 101014. [Google Scholar] [CrossRef]
  55. Senchuri, R.; Kuras, A.; Burud, I. Machine Learning Methods for Road Edge Detection on Fused Airborne Hyperspectral and LIDAR Data. In Proceedings of the 11th Workshop on Hyperspectral Imaging and Signal Processing: Evolution in Remote Sensing (WHISPERS), Amsterdam, The Netherlands, 24–26 March 2021; pp. 1–5. [Google Scholar] [CrossRef]
  56. Kamali Maskooni, E.; Naghibi, S.A.; Hashemi, H.; Berndtsson, R. Application of Advanced Machine Learning Algorithms to Assess Groundwater Potential Using Remote Sensing-Derived Data. Remote Sens. 2020, 12, 2742. [Google Scholar] [CrossRef]
  57. Temitope Yekeen, S.; Balogun, A.-L. Advances in Remote Sensing Technology, Machine Learning and Deep Learning for Marine Oil Spill Detection, Prediction and Vulnerability Assessment. Remote Sens. 2020, 12, 3416. [Google Scholar] [CrossRef]
  58. Ali, I.; Greifeneder, F.; Stamenkovic, J.; Neumann, M.; Notarnicola, C. Review of Machine Learning Approaches for Biomass and Soil Moisture Retrievals from Remote Sensing Data. Remote Sens. 2015, 7, 16398–16421. [Google Scholar] [CrossRef] [Green Version]
  59. Cao, L.; Coops, N.; Innes, J.L.; Dai, J.; Ruan, H.; She, G. Tree species classification in subtropical forests using small-footprint full-waveform LiDAR data. Int. J. Appl. Earth Obs. 2016, 49, 39–51. [Google Scholar] [CrossRef]
  60. Koma, Z.; Koenig, K.; Höfle, B. Urban Tree Classification Using Full-Waveform Airborne Laser Scanning. ISPRS Ann. Photogramm. Remote Sens. Spat. Inf. Sci. 2016, III-3, 185–192. [Google Scholar] [CrossRef] [Green Version]
  61. Dian, Y.; Pang, Y.; Dong, Y.; Li, Z. Urban Tree Species Mapping Using Airborne LiDAR and Hyperspectral Data. J. Indian Soc. Remote Sens. 2016, 44, 595–603. [Google Scholar] [CrossRef]
  62. Shen, X.; Cao, L. Tree-Species Classification in Subtropical Forests Using Airborne Hyperspectral and LiDAR Data. Remote Sens. 2017, 9, 1180. [Google Scholar] [CrossRef] [Green Version]
  63. Kim, S.; McGaughey, R.J.; Andersen, H.E.; Schreuder, G. Tree species differentiation using intensity data derived from leaf-on and leaf-off airborne laser scanner data. Remote Sens. Environ. 2009, 113, 1575–1586. [Google Scholar] [CrossRef]
  64. Reitberger, J.; Krzystek, P.; Stilla, U. Analysis of full waveform LIDAR data for the classification of deciduous and coniferous trees. Int. J. Remote Sens. 2008, 29, 1407–1431. [Google Scholar] [CrossRef]
  65. LAS Specification 1.4–R15; The American Society for Photogrammetry & Remote Sensing: Bethesda, ML, USA, 2019.
  66. Mehta, A.; Dikshit, O.; Venkataramani, K. Integration of high-resolution imagery and LiDAR data for object-based classification of urban area. Geocarto Int. 2014, 29, 418–432. [Google Scholar] [CrossRef]
  67. Gevaert, C.M.; Persello, C.; Nex, F.C.; Vosselman, G. A Deep Learning Approach to DTM Extraction from Imagery Using Rule-Based Training Labels. ISPRS J. Photogramm. Remote Sens. 2018, 142, 106–123. [Google Scholar] [CrossRef]
  68. Yastikli, N.; Cetin, Z. Classification of raw LiDAR point cloud using point-based methods with spatial features for 3D building reconstruction. Arab. J. Geosci. 2021, 14, 146. [Google Scholar] [CrossRef]
  69. Fukunaga, K.; Hostetler, L. The estimation of the gradient of a density function, with applications in pattern recognition. IEEE Trans. Inf. Theory 1975, 21, 32–40. [Google Scholar] [CrossRef] [Green Version]
  70. Wen, Z.Q.; Cai, Z.X. Mean shift algorithm and its application in tracking of objects. In Proceedings of the 5th International Conference on Machine Learning and Cybernetics, Dalian, China, 13–16 August 2006; pp. 4024–4028. [Google Scholar] [CrossRef]
  71. Chen, W.; Hu, X.; Chen, W.; Hong, Y.; Yang, M. Airborne LiDAR Remote Sensing for Individual Tree Forest Inventory Using Trunk Detection-Aided Mean Shift Clustering Techniques. Remote Sens. 2018, 10, 1078. [Google Scholar] [CrossRef] [Green Version]
  72. Le Louarn, M.; Clergeau, P.; Briche, E.; Deschamps-Cottin, M. “Kill Two Birds with One Stone”: Urban Tree Species Classification Using Bi-Temporal Pléiades Images to Study Nesting Preferences of an Invasive Bird. Remote Sens. 2017, 9, 916. [Google Scholar] [CrossRef] [Green Version]
  73. Aydin, F.; Aslan, Z. Recognizing Parkinson’s disease gait patterns by vibes algorithm and Hilbert-Huang transform. Eng. Sci. Technol. Int. J. 2021, 24, 112–125. [Google Scholar] [CrossRef]
  74. Chi, D.; Degerickx, J.; Yu, K.; Somers, B. Urban Tree Health Classification Across Tree Species by Combining Airborne Laser Scanning and Imaging Spectroscopy. Remote Sens. 2020, 12, 2435. [Google Scholar] [CrossRef]
  75. Michałowska, M.; Rapiński, J. A Review of Tree Species Classification Based on Airborne LiDAR Data and Applied Classifiers. Remote Sens. 2021, 13, 353. [Google Scholar] [CrossRef]
  76. Kececi, A.; Yildirak, A.; Ozyazici, K.; Ayluctarhan, G.; Agbulut, O.; Zincir, I. Implementation of machine learning algorithms for gait recognition. Eng. Sci. Technol. Int. J. 2020, 23, 931–937. [Google Scholar] [CrossRef]
  77. Vapnik, V.N. The Nature of Statistical Learning Theory; Springer: New York, NY, USA, 1995; ISBN 978-1-4757-3264-1. [Google Scholar]
  78. Ray, P.; Mishra, D.P. Support vector machine based fault classification and location of a long transmission line. Eng. Sci. Technol. Int. J. 2016, 19, 1368–1380. [Google Scholar] [CrossRef] [Green Version]
  79. Mallet, C.; Bretar, F.; Roux, M.; Soergel, U.; Heipke, C. Relevance Assessment of Full-Waveform Lidar Data for Urban Area Classification. ISPRS J. Photogramm. Remote Sens. 2011, 66, S71–S84. [Google Scholar] [CrossRef]
  80. Lodha, S.K.; Kreps, E.J.; Helmbold, D.P.; Fitzpatirck, D. Aerial lidar data classification using support vector machines (SVM). In Proceedings of the Third International Symposium on 3D Data Processing, Visualization and Transmission, Chapel Hill, NC, USA, 14–16 June 2006. [Google Scholar] [CrossRef] [Green Version]
  81. Nicolas, P.R. Scala for Machine Learning; Packt Publishing Ltd.: Birmingham, UK; ProQuest Ebook Central: Morrisville, NC, USA, 2014; ISBN 9781787122383. [Google Scholar]
  82. Petropoulos, G.P.; Arvanitis, K.; Sigrimis, N. Hyperion hyperspectral imagery analysis combined with machine learning classifiers for land use/cover mapping. Expert Syst. Appl. 2012, 39, 3800–3809. [Google Scholar] [CrossRef]
  83. Liu, H.J.; Wu, C.S. Crown-level tree species classification from AISA hyperspectral imagery using an innovative pixel-weighting approach. Int. J. Appl. Earth Obs. Geoinf. 2018, 68, 298–307. [Google Scholar] [CrossRef]
  84. Awad, M.; Khanna, R. Efficient Learning Machines: Theories, Concepts, and Applications for Engineers and System Designers; Apress: Berkeley, CA, USA, 2015; ISBN 978-1-4302-5989-3. [Google Scholar]
  85. Thome, A.C.G. SVM Classifiers—Concepts and Applications to Character Recognition. In Advances in Character Recognition; IntechOpen Book Series; Ding, X., Ed.; InTech: Rijeka, Croatia, 2012. [Google Scholar] [CrossRef] [Green Version]
  86. Breiman, L. Random Forests. Mach. Learn. 2001, 45, 5–32. [Google Scholar] [CrossRef] [Green Version]
  87. Sothe, C.; De Almeida, C.M.; Schimalski, M.B.; La Rosa, L.E.C.; Castro, J.D.B.; Feitosa, R.Q.; Dalponte, M.; Lima, C.L.; Liesenberg, V.; Miyoshi, G.T.; et al. Comparative performance of convolutional neural network, weighted and conventional support vector machine and random forest for classifying tree species using hyperspectral and photogrammetric data. GISci. Remote Sens. 2020, 57, 369–394. [Google Scholar] [CrossRef]
  88. Chehata, N.; Guo, L.; Mallet, C. Airborne LiDAR feature selection for urban classification using random forests. Int. Arch. Photogramm. Remote Sens. Spat. Inf. Sci. 2009, 39, 207–212. [Google Scholar]
  89. Qi, Y. Random Forest for Bioinformatics. In Ensemble Machine Learning; Zhang, C., Ma, Y., Eds.; Springer: New York, NY, USA, 2012; pp. 307–323. [Google Scholar] [CrossRef] [Green Version]
  90. Nembrini, S.; König, I.R.; Wright, M.N. The revival of the Gini importance? Bioinformatics 2018, 34, 3711–3718. [Google Scholar] [CrossRef] [PubMed] [Green Version]
  91. Belgiu, M.; Dragut, L. Random Forest in Remote Sensing: A Review of Applications and Future Directions. ISPRS J. Photogramm. Remote Sens. 2016, 114, 24–31. [Google Scholar] [CrossRef]
  92. Han, H.; Guo, X.; Yu, H. Variable selection using Mean Decrease Accuracy and Mean Decrease Gini based on Random Forest. In Proceedings of the 7th IEEE International Conference on Software Engineering and Service Science (ICSESS), Beijing, China, 26–28 August 2016; pp. 219–224. [Google Scholar] [CrossRef]
  93. Wang, H.; Yang, F.; Luo, Z. An experimental study of the intrinsic stability of random forest variable importance measures. BMC Bioinform. 2016, 17, 60. [Google Scholar] [CrossRef] [Green Version]
  94. García Moreno, A.I.; Alvarado Orozco, J.M.; Ibarra-Medina, J.R.; Martinez Franco, E. Image-based porosity classification in Al-alloys by laser metal deposition using random forests. Int. J. Adv. Manuf. Technol. 2020, 110, 2827–2845. [Google Scholar] [CrossRef]
  95. Turkoglu, B.; Kaya, E. Training multi-layer perceptron with artificial algae algorithm. Eng. Sci. Technol. Int. J. 2020, 23, 1342–1350. [Google Scholar] [CrossRef]
  96. Shoaib, M.; Shamseldin, A.Y.; Melville, B.W. Comparative study of different wavelet based neural network models for rainfall–runoff modeling. J. Hydrol. 2014, 515, 47–58. [Google Scholar] [CrossRef]
  97. Lek, S.; Guégan, J.-F. Artificial neural networks as a tool in ecological modelling, an introduction. Ecol. Model. 1999, 120, 65–73. [Google Scholar] [CrossRef]
  98. Nezami, S.; Khoramshahi, E.; Nevalainen, O.; Pölönen, I.; Honkavaara, E. Tree Species Classification of Drone Hyperspectral and RGB Imagery with Deep Learning Convolutional Neural Networks. Remote Sens. 2020, 12, 1070. [Google Scholar] [CrossRef] [Green Version]
  99. Topic, A.; Russo, M. Emotion recognition based on EEG feature maps through deep learning network. Eng. Sci. Technol. Int. J. 2021, 24, 1442–1454. [Google Scholar] [CrossRef]
  100. Yibre, A.M.; Kocer, B. Semen quality predictive model using Feed Forwarded Neural Networktrained by Learning-Based Artificial Algae Algorithm. Eng. Sci. Technol. Int. J. 2021, 24, 310–318. [Google Scholar] [CrossRef]
  101. Karagul Yildiz, T.; Yurtay, N.; Onec, B. Classifying anemia types using artificial learning methods. Eng. Sci. Technol. Int. J. 2021, 24, 50–70. [Google Scholar] [CrossRef]
  102. Zhang, Z.; Kazakova, A.; Moskal, L.M.; Styers, D.M. Object-Based Tree Species Classification in Urban Ecosystems Using LiDAR and Hyperspectral Data. Forests 2016, 7, 122. [Google Scholar] [CrossRef] [Green Version]
  103. Congalton, R.G.; Green, K. Assessing the Accuracy of Remotely Sensed Data: Principles and Practises, 2nd ed.; CRC Press Taylor and Francis Group: New York, NY, USA, 2009. [Google Scholar] [CrossRef]
  104. Ni, H.; Lin, X.; Zhang, J. Classification of ALS Point Cloud with Improved Point Cloud Segmentation and Random Forests. Remote Sens. 2017, 9, 288. [Google Scholar] [CrossRef] [Green Version]
  105. Atik, M.E.; Duran, Z.; Seker, D.Z. Machine Learning-Based Supervised Classification of Point Clouds Using Multiscale Geometric Features. ISPRS Int. J. Geo Inf. 2021, 10, 187. [Google Scholar] [CrossRef]
  106. Vo, A.-V.; Truong-Hong, L.; Laefer, D.F.; Bertolotto, M. Octree-based region growing for point cloud segmentation. ISPRS J. Photogramm. Remote Sens. 2015, 104, 88–100. [Google Scholar] [CrossRef]
  107. Pan, Y.; Dong, Y.; Wang, D.; Chen, A.; Ye, Z. Three-Dimensional Reconstruction of Structural Surface Model of Heritage Bridges Using UAV-Based Photogrammetric Point Clouds. Remote Sens. 2019, 11, 1204. [Google Scholar] [CrossRef] [Green Version]
  108. Dai, C.; Zhang, Z.; Lin, D. An Object-Based Bidirectional Method for Integrated Building Extraction and Change Detection between Multimodal Point Clouds. Remote Sens. 2020, 12, 1680. [Google Scholar] [CrossRef]
  109. Yancho, M.; Coops, N.; Tompalski, P.; Goodbody, T.; Plowright, A. Fine-Scale Spatial and Spectral Clustering of UAV-Acquired Digital Aerial Photogrammetric (DAP) Point Clouds for Individual Tree Crown Detection and Segmentation. IEEE J. Sel. Top. Appl. Earth Obs. Remote Sens. 2019, 12, 4131–4148. [Google Scholar] [CrossRef]
  110. Rutzinger, M.; Rottensteiner, F.; Pfeifer, N. A comparison of evaluation techniques for building extraction from airborne laser scanning. IEEE J. Sel. Top. Appl. Earth Obs. Remote Sens. 2009, 1, 11–20. [Google Scholar] [CrossRef]
  111. Uzar, M.; Yastikli, N. Automatic building extraction using LiDAR and aerial photographs. Bol. Ciênc. Geod. 2013, 19, 153–171. [Google Scholar] [CrossRef] [Green Version]
  112. Díaz-Uriarte, R.; Alvarez de Andrés, S. Gene selection and classification of microarray data using random forest. BMC Bioinform. 2006, 7, 3–15. [Google Scholar] [CrossRef] [PubMed] [Green Version]
  113. Azar, A.T.; Elshazly, H.I.; Hassanien, A.E.; Elkorany, A.M. A random forest classifier for lymph diseases. Comput. Methods Programs Biomed. 2014, 113, 465–473. [Google Scholar] [CrossRef]
  114. You, H.; Ma, Z.; Tang, Y.; Wang, Y.; Yan, J.; Ni, M.; Cen, K.; Huang, Q. Comparison of ANN (MLP), ANFIS, SVM, and RF models for the online classification of heating value of burning municipal solid waste in circulating fluidized bed incinerators. Waste Manag. 2017, 68, 186–197. [Google Scholar] [CrossRef]
  115. Indira, B.; Valarmathi, K. A perspective of the machine learning approach for the packet classification in the software defined network. Intell. Autom. Soft Comput. 2020, 26, 795–805. [Google Scholar] [CrossRef]
  116. Zhang, J.; Zhang, J.; Lok, T.-M.; Lyu, M.R. A hybrid particle swarm optimization-back-propagation algorithm for feedforward neural network training. Appl. Soft Comput. 2007, 185, 1026–1037. [Google Scholar] [CrossRef]
  117. Jozdani, S.E.; Johnson, B.A.; Chen, D. Comparing Deep Neural Networks, Ensemble Classifiers, and Support Vector Machine Algorithms for Object-Based Urban Land Use/Land Cover Classification. Remote Sens. 2019, 11, 1713. [Google Scholar] [CrossRef] [Green Version]
  118. Li, J.; Hu, B. Exploring high-density airborne light detection and ranging data for classification of mature coniferous and deciduous trees in complex Canadian forests. J. Appl. Remote Sens. 2012, 6, 063536. [Google Scholar] [CrossRef]
  119. Shi, Y.; Skidmore, A.; Holzwarth, S.; Heiden, U.; Pinnel, N.; Zhu, X.; Heurich, M. Tree species classification using plant functional traits from LiDAR and hyperspectral data. Int. J. Appl. Earth Obs. Geoinf. 2018, 73, 207–219. [Google Scholar] [CrossRef]
  120. Lin, Y.; Hyyppä, J. A comprehensive but efficient framework of proposing and validating feature parameters from airborne LiDAR data for tree species classification. Int. J. Appl. Earth Obs. Geoinf. 2016, 46, 45–55. [Google Scholar] [CrossRef]
  121. Yu, X.; Hyyppä, J.; Litkey, P.; Kaartinen, H.; Vastaranta, M.; Holopainen, M. Single-sensor solution to tree species classification using multispectral airborne laser scanning. Remote Sens. 2017, 9, 108. [Google Scholar] [CrossRef] [Green Version]
  122. Nguyen, H.M.; Demir, B.; Dalponte, M. Weighted Support Vector Machines for Tree Species Classification Using Lidar Data. In Proceedings of the IGARSS 2019—2019 IEEE International Geoscience and Remote Sensing Symposium, Yokohama, Japan, 28 July–2 August 2019; pp. 6740–6743. [Google Scholar] [CrossRef]
Figure 1. Davutpasa Campus of Yildiz Technical University (left) and the urban study area (right).
Ijgi 11 00226 g001
Figure 2. Deciduous and coniferous tree species in the urban study area.
Ijgi 11 00226 g002
Figure 3. Block diagram of proposed machine learning-based classification of urban tree species using SVM, RF, and MLP algorithms.
Ijgi 11 00226 g003
Figure 4. Structure of the proposed multi-layer perceptron algorithm.
Ijgi 11 00226 g004
Figure 5. Classified high vegetation points in the study area (dense and mixed tree points in red rectangles).
Ijgi 11 00226 g005
Figure 6. A total of 265 individual tree crowns (red circles) acquired with mean shift segmentation.
Ijgi 11 00226 g006
Figure 7. Training and test samples in the study area: (a) training sample set; (b) test sample set.
Ijgi 11 00226 g007
Figure 8. The classification results for urban deciduous and coniferous trees: (a) SVM; (b) RF; (c) MLP.
Ijgi 11 00226 g008
Figure 9. Recall, precision, and F1-score values of SVM, RF, and MLP classification algorithms for each deciduous and coniferous tree species.
Ijgi 11 00226 g009
Figure 10. The feature importance scores according to MDG in the RF classification.
Ijgi 11 00226 g010
Table 1. The generated spatial- and intensity-based features from LiDAR data.
LiDAR Data
Spatial-Based FeaturesIntensity-Based Features
Number of points
Maximum ZMaximum intensity
Minimum ZMinimum intensity
Standard deviation of ZStandard deviation of intensity
Mean ZMean intensity
Skewness of ZSkewness of intensity
Kurtosis of ZKurtosis of intensity
Z rangeIntensity range
5th percentile of Z5th percentile of intensity
25th percentile of Z25th percentile of intensity
50th percentile of Z50th percentile of intensity
75th percentile of Z75th percentile of intensity
90th percentile of Z90th percentile of intensity
Table 2. Overall accuracy values of the proposed three classification algorithms.
ClassifierOverall Accuracy
SVM80.00%
RF83.75%
MLP73.75%
Table 3. The 10-fold cross-validation results of the proposed three classification methods.
Classifier10-Fold Cross-Validation Average Accuracy
SVM81.10%
RF81.54%
MLP63.72%
Publisher’s Note: MDPI stays neutral with regard to jurisdictional claims in published maps and institutional affiliations.

