Article

Temperature Accuracy Analysis by Land Cover According to the Angle of the Thermal Infrared Imaging Camera for Unmanned Aerial Vehicles

1
Department of Spatial Information, Kyungpook National University, Daegu 41566, Korea
2
Department of Convergence and Fusion System Engineering, Kyungpook National University, Sangju 37224, Korea
*
Author to whom correspondence should be addressed.
ISPRS Int. J. Geo-Inf. 2022, 11(3), 204; https://doi.org/10.3390/ijgi11030204
Submission received: 3 February 2022 / Revised: 11 March 2022 / Accepted: 15 March 2022 / Published: 17 March 2022

Abstract

:
Land surface temperature (LST) is one of the crucial factors that is important in various fields, including the study of climate change and the urban heat island (UHI) phenomenon. The existing LST was acquired using satellite imagery, but with the development of unmanned aerial vehicles (UAV) and thermal infrared (TIR) cameras, it has become possible to acquire LST with a spatial resolution of cm. The accuracy evaluation of the existing TIR camera for UAV was conducted by shooting vertically. However, in the case of a TIR camera, the temperature value may change because the emissivity varies depending on the viewing angle. Therefore, it is necessary to evaluate the accuracy of the TIR camera according to each angle. In this study, images were simultaneously acquired at 2–min intervals for each of the three research sites by TIR camera angles (70°, 80°, 90°). Then, the temperature difference by land cover was evaluated with respect to the LST obtained by laser thermometer and the LST obtained using UAV and TIR. As a result, the image taken at 80° showed the smallest difference compared with the value obtained with a laser thermometer, and the 70° image showed a large difference of 1–6 °C. In addition, in the case of the impervious surface, there was a large temperature difference by angle, and in the case of the water-permeable surface, there was no temperature difference by angle. Through this, 80° is best when acquiring TIR data, and if it is impossible to take images at 80°, it is considered good to acquire TIR images between 80° and 90°. To obtain more accurate LST, correction studies considering the external environment, camera attitude, and shooting height are needed in future studies.

1. Introduction

As urbanization progresses, the urban heat island (UHI) phenomenon occurs, in which the temperature of urban areas is higher than that of surrounding areas [1]. The UHI phenomenon is driving the deterioration of the quality of the urban environment, such as heat waves, tropical nights, and the cooling load [2,3]. The main cause of the UHI phenomenon is concrete artificial structures and asphalt roads [4,5]. As the threat of persistent global warming increases, so does the interest in UHIs [6]. Accurate data on land surface temperature (LST) is needed as rapid climate change and urbanization progress [7]. In particular, LST is a crucial factor that can be used for the analysis of not only rapid climate change and urbanization but also agriculture, forest fire detection, environmental change, and geothermal energy utilization [8,9,10]. In the case of the LST, since the specific heat is small, the variability is very high, making regular observation difficult [11,12]. The LST data have been obtained using satellite images, with the most used satellites being the Landsat, ASTER, MODIS, and AVHRR satellites [13,14]. However, while satellite imagery makes it easy to observe a large area, it has the disadvantage in that obtaining high spatial resolution temperature data for a small area is difficult [15]. In addition, because the observation period is long, it is difficult to obtain LST data at a desired time, and it is also affected by clouds [16]. One of the ways to compensate for these shortcomings is an unmanned aerial vehicle (UAV) [17].
Recently, as thermal infrared (TIR) sensors for UAVs have been manufactured, it has become possible to acquire LST by mounting TIR cameras on UAVs [18,19]. In the case of an UAV, if it is raining or there is no wind, it is possible to acquire LST data without time and space restrictions. Unlike satellites, data can be acquired at low altitudes, enabling accurate and precise LST data to be acquired. Existing satellite TIR images have spatial resolution in m units, but UAVs can acquire high-resolution images in cm units [20]. There are various studies on LST using TIR sensors for UAVs. It is used in various fields such as underground coal fire evaluation, accuracy evaluation according to the land cover of the TIR camera, and vegetation temperature acquisition [11,21,22]. However, in previous studies, TIR cameras only captured photographs vertically. The accuracy of the TIR camera angle has not been evaluated. In the case of a TIR sensor, the emissivity varies depending on the viewing angle, so the temperature value may change. Among the studies, there was an evaluation of TIR images taken vertically by land cover, but there was no study on accuracy according to angle. It is considered necessary to verify the temperature accuracy for each angle.
Therefore, in this study, TIR images were taken at three locations: a university campus where various land cover exists, farmland where vegetation mainly exists, and rivers. The purpose of this study was to analyze the accuracy of the LST at each angle (70°, 80°, 90°) of the TIR camera for UAVs by shooting 3 days for each date (9 days in total) for each site. For each region, the LST data for each angle and the LST were obtained using an actual handheld laser thermometer, and were used to compare the LST values for each point of land cover.

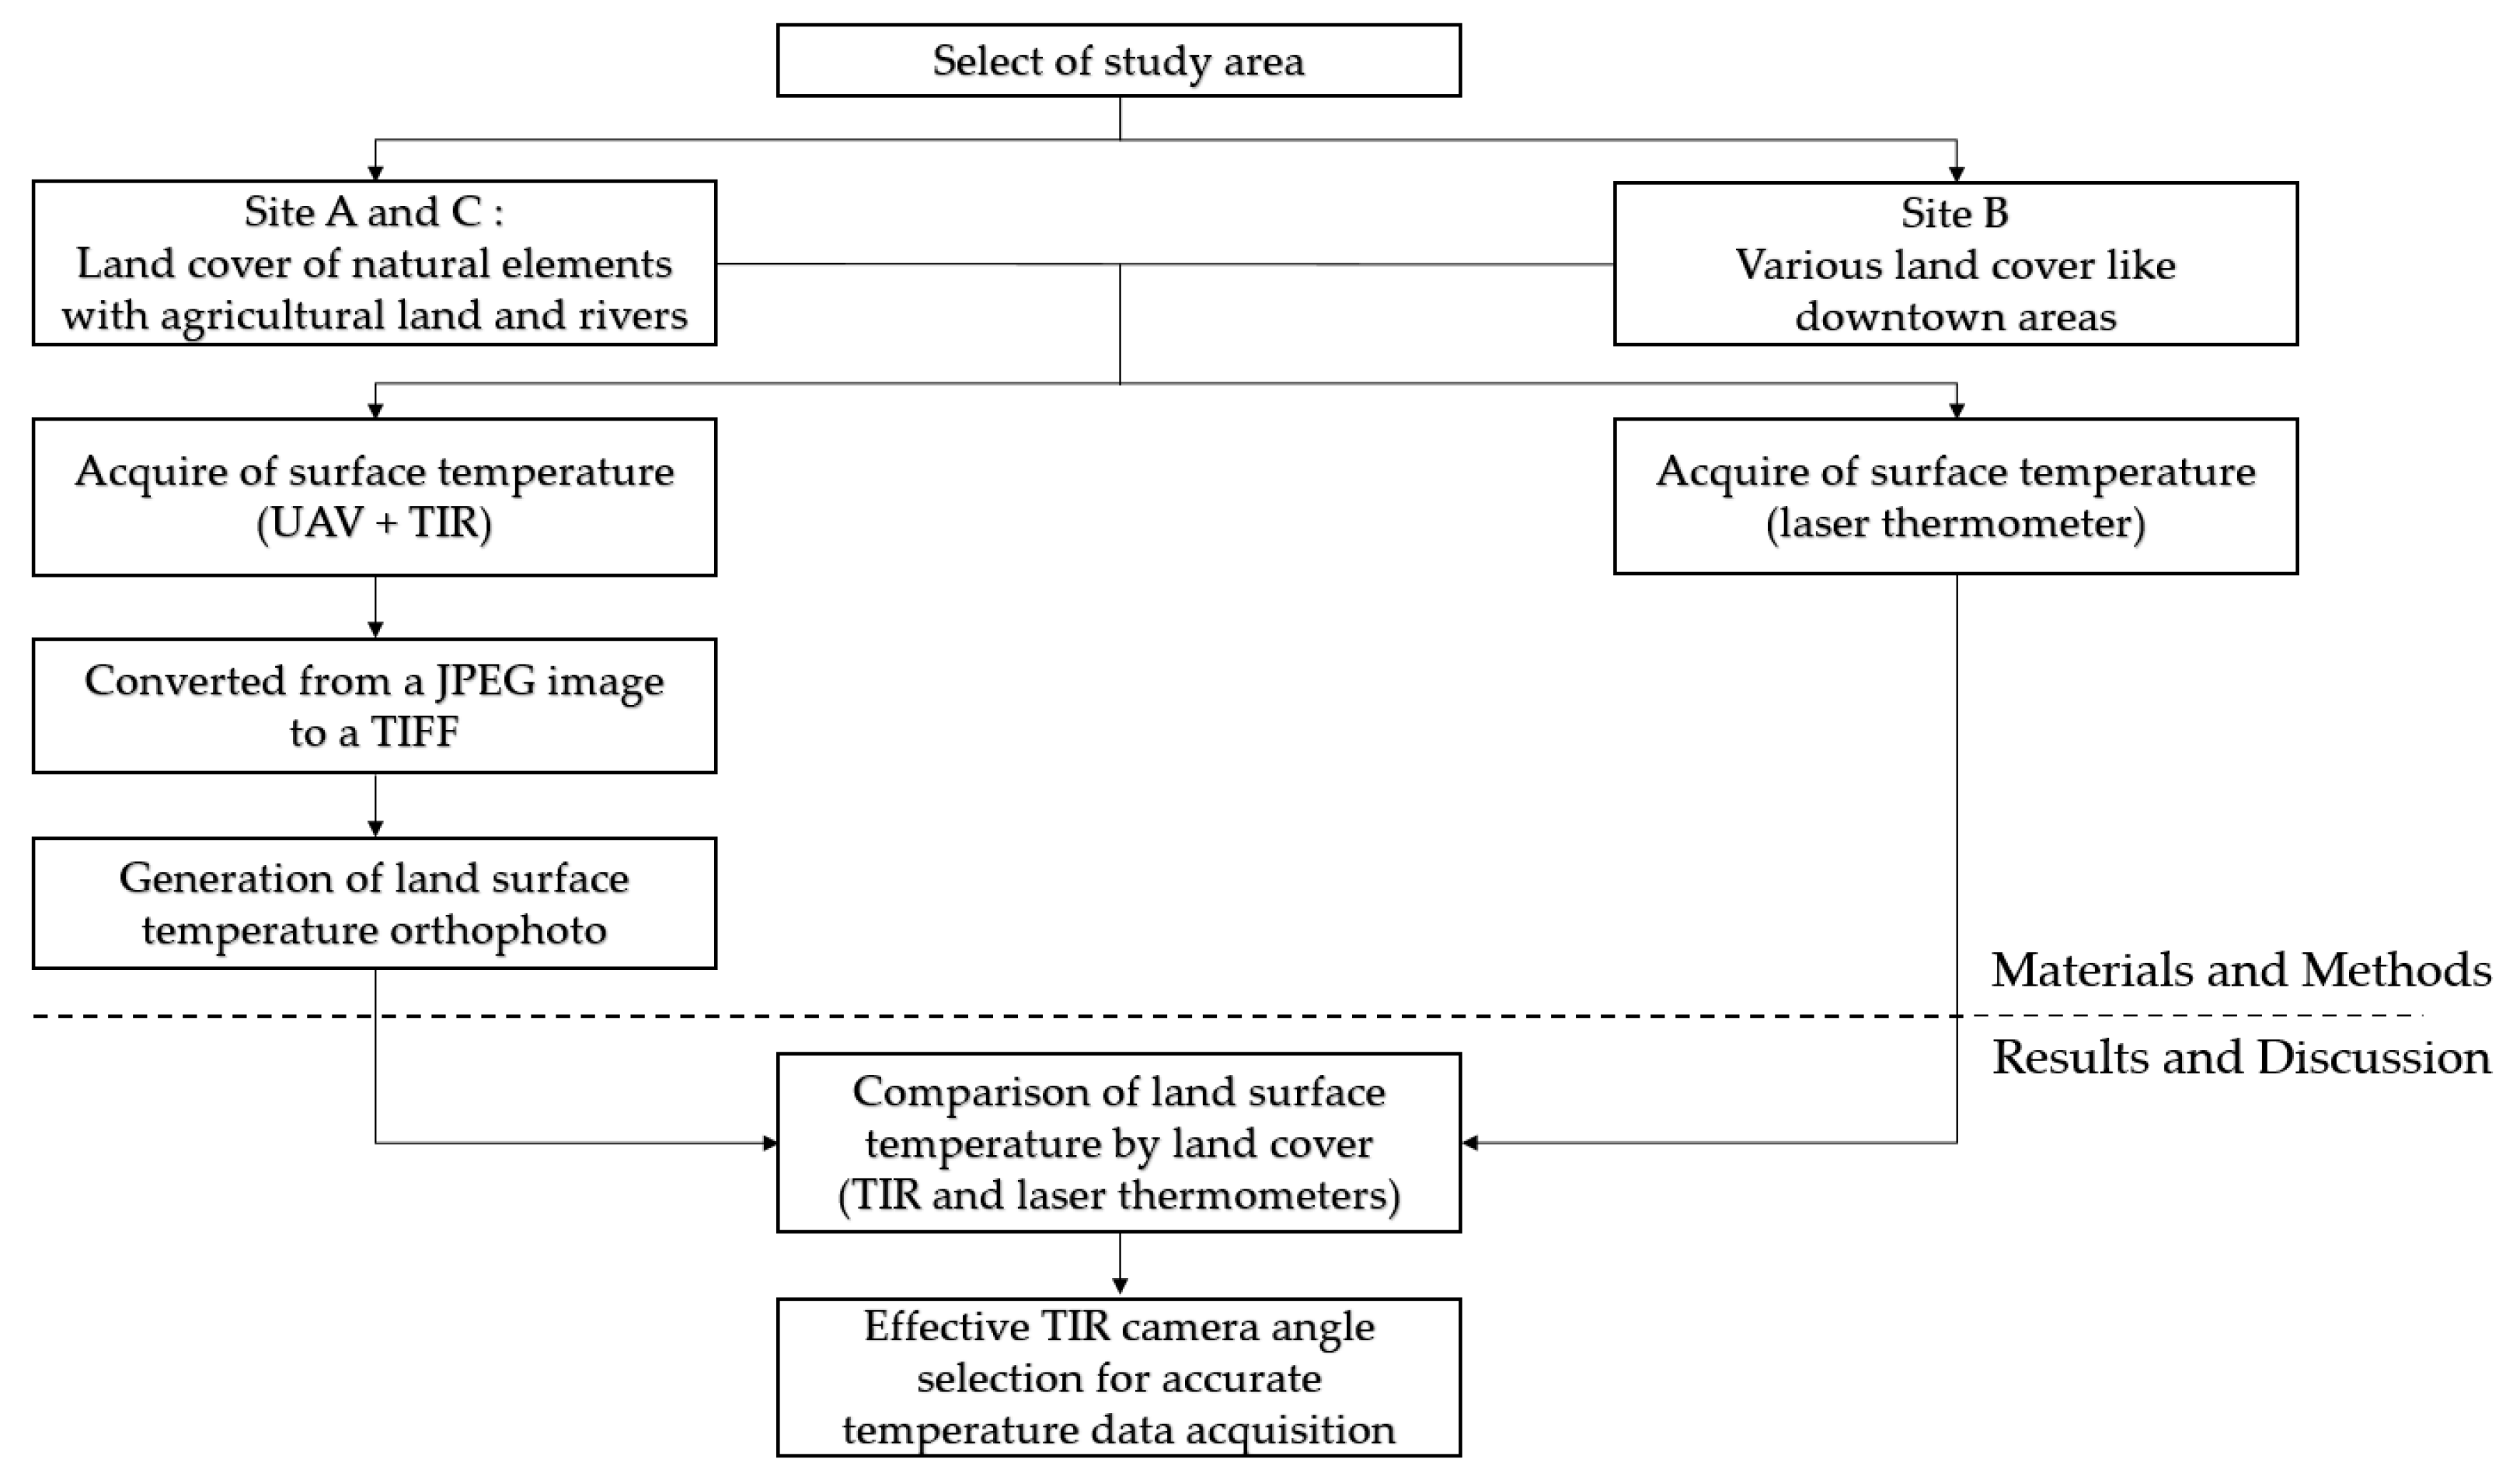
2. Materials and Methods

In Section 2, Materials and Methods, as shown in Figure 1, the selection of research area, the acquisition of LST (the method using a UAV and the method using a laser thermometer), and an orthophoto of the LST is generated. In the results and discussion, the TIR for UAV and the LST value for each land cover obtained with a laser thermometer were compared, and the TIR camera angle that can acquire accurate temperature data was selected through the comparison.

2.1. Study Equipment
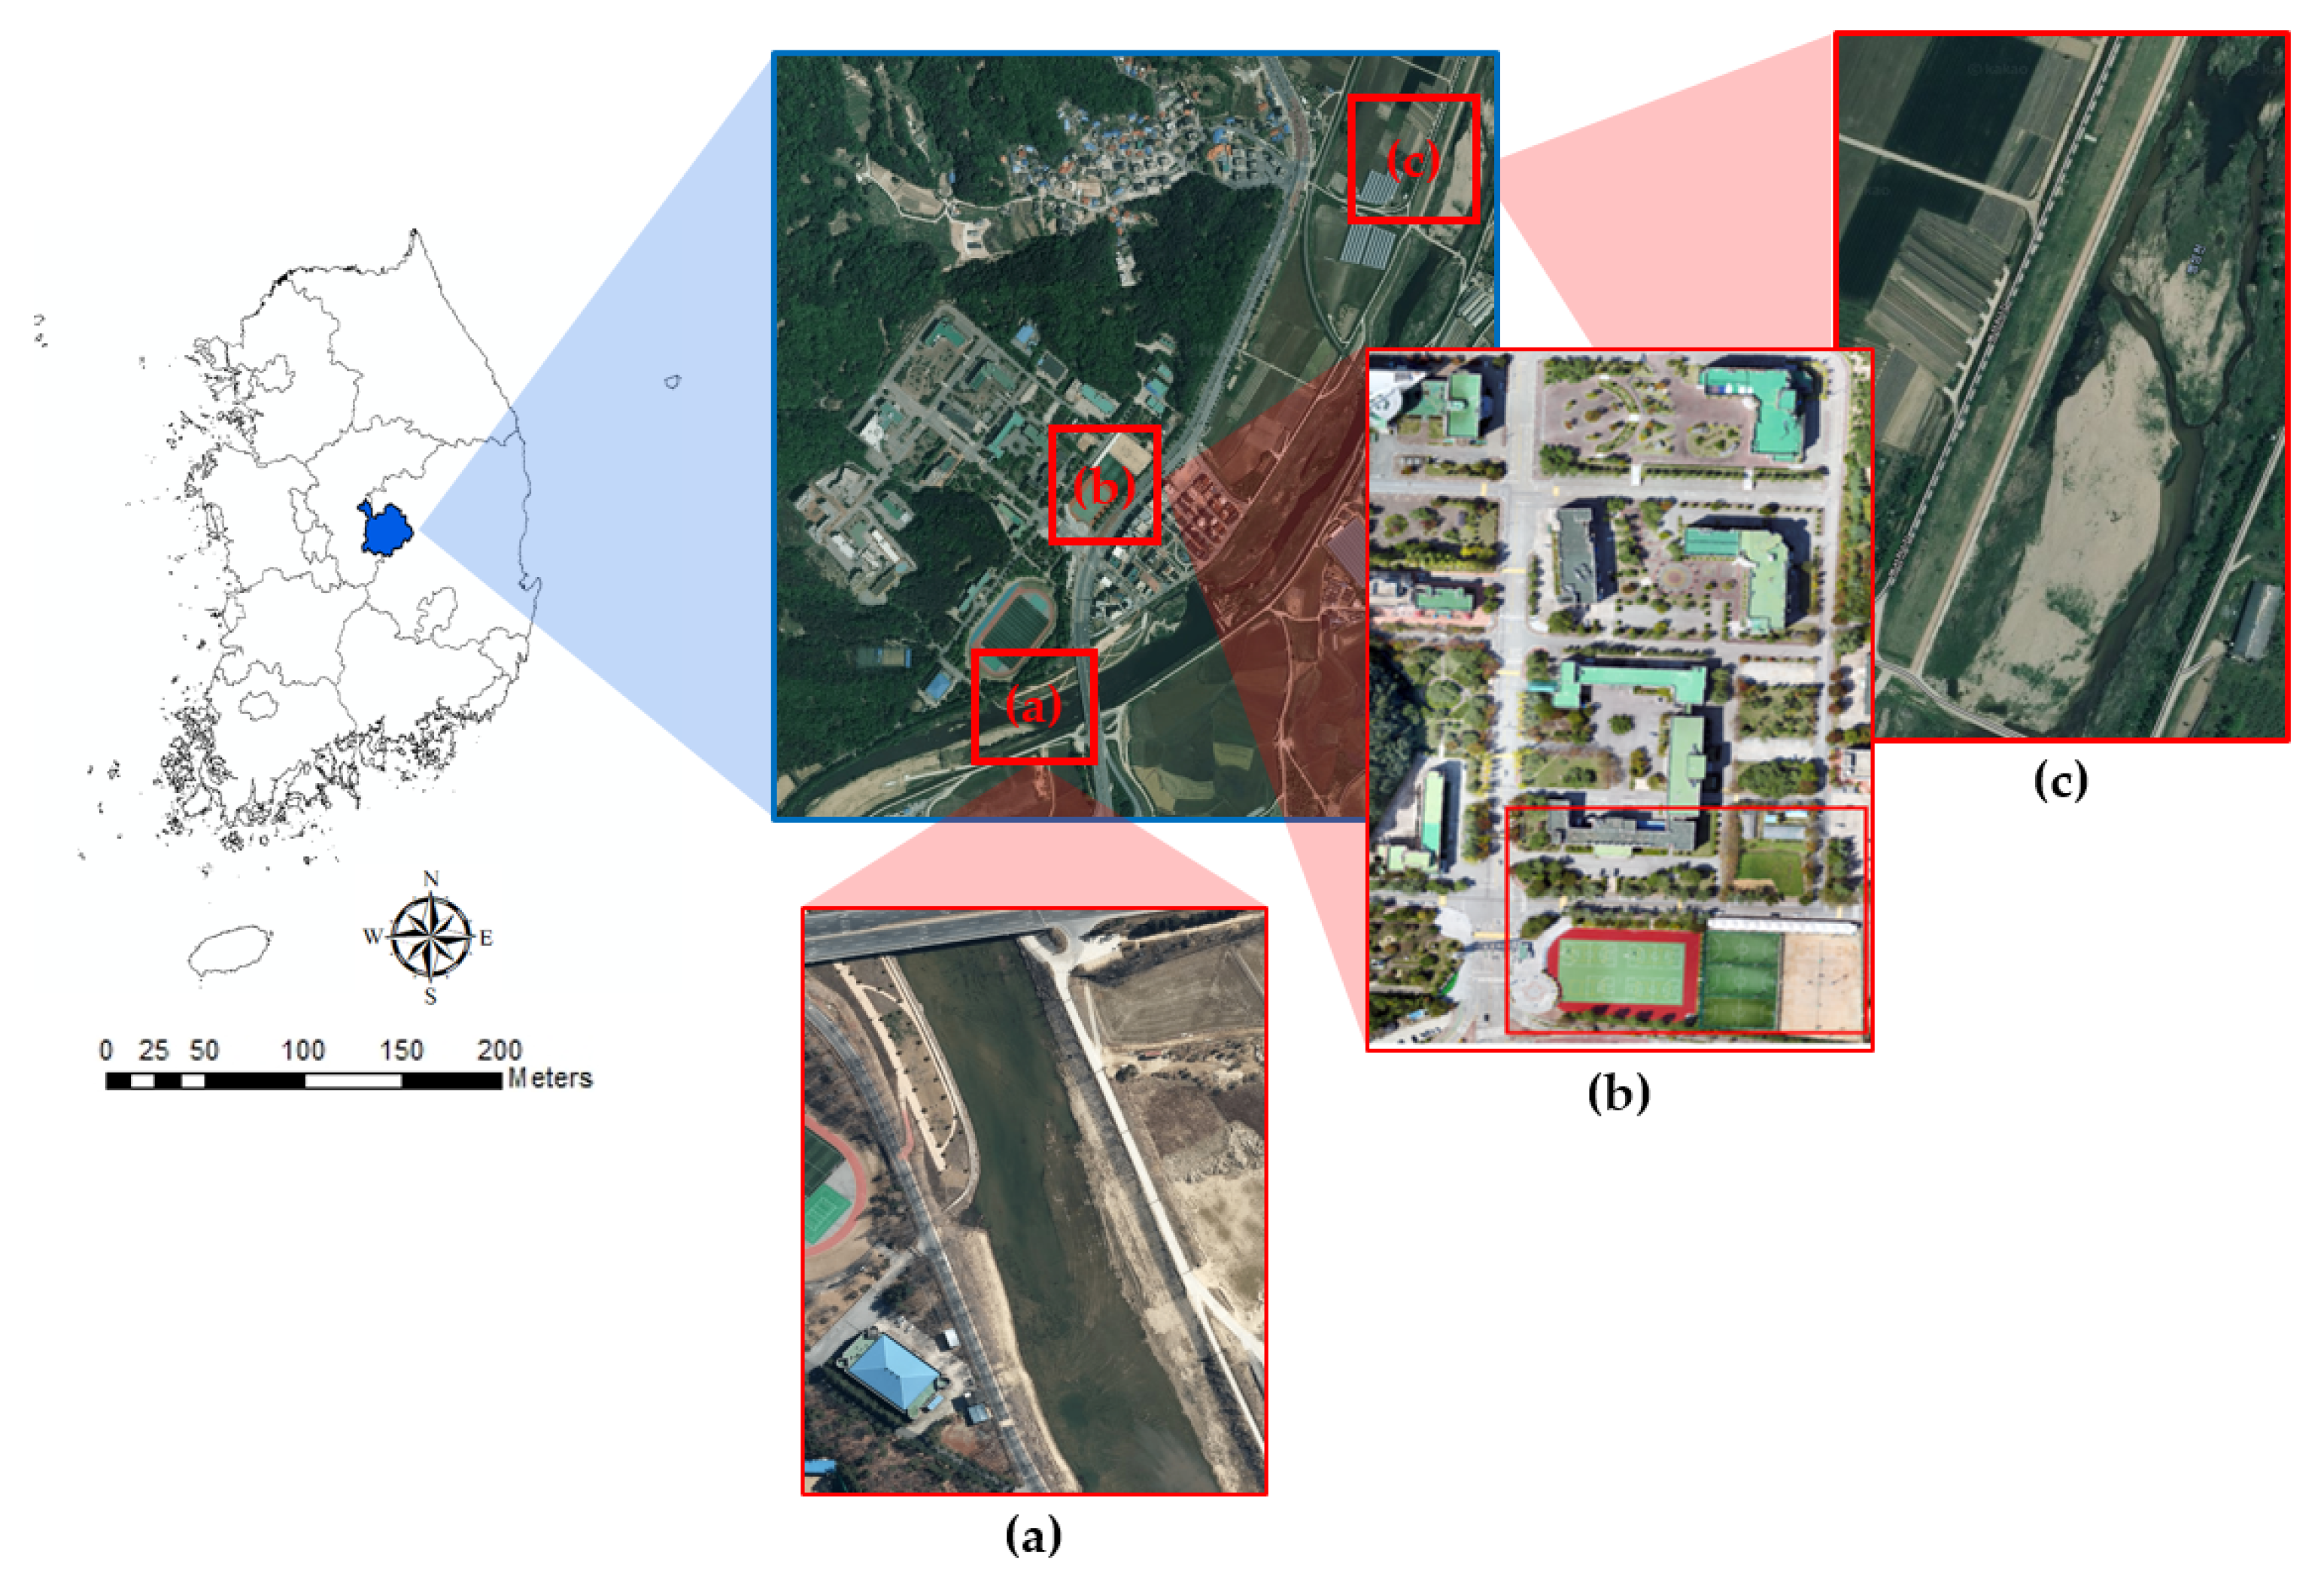
In this study, three UAVs of the same type and three TIR cameras were used, and TIR images were acquired through a remote sensing system. For the UAV, DJI’s Inspire 1 was used, and for the TIR camera, FLIR’s Zenmuse XT630 was used. The Inspire 1 platform can be operated for about 15–20 min, with a maximum flight altitude of 4500 m, a maximum speed of 22 m/s in no wind, and a maximum wind speed resistance of 10 m/s. The DJI Inspire 1 UAV weighs about 3 kg including the propellers and battery, and with the Zenmuse XT sensor it weighs about 3.3 kg. The Inspire 1 is a rotorcraft powered by four propellers (Table 1). The Zenmuse XT630 uses an uncooled VOx Microbolometer sensor and is available in a variety of lens models: 6.8 mm, 7.5 mm, 9 mm, 13 mm and 19 mm. A 13 mm lens was used in this study. This model has a 45° × 37° field of view (FOV) of 1.308 mrad and offers a resolution of 640 × 512 pixels. The sensor offers a 17-μm pixel pitch size, with a spectral band ranging from 7.5 to–13.5 μm. The TIR camera’s scene range consists of either −25 °C to 135 °C (High Gain) or −40 °C to 550 °C (Low Gain). In the case of Zenmuse XT630, the vibration angle range is as precise as ±0.03 °C to reduce the angle change owing to the vibration of the UAV, and the temperature accuracy is high at ±5% [23]. For the on-site LST acquisition, a laser thermometer (DT-8868H) was used, and for this model, the temperature range is −50 to 1650 °C, and the temperature accuracy is ±1.0% with high accuracy [24]. To compare the temperature value at the exact location when acquiring the ground LST of the site, the location coordinates were acquired through GNSS surveying (virtual reference station (VRS) survey method), and the GCP points required to produce temperature orthophotos were also acquired. The equipment used for the GNSS survey was Trimble’s R8s. In the case of Trimble R8s, the channel is 440 channels, and the VRS measurement accuracy is 8mm horizontal + 0.5 ppm RMS, and vertical 15 mm + 0.5 ppm RMS [25].

2.2. Study Area

In this study, a LST accuracy evaluation was performed for a total of three sites. Site A was chosen because it is a relatively small area, but there are various land covers, such as downtown areas, so various LSTs can be calculated and compared. Sites B and C were selected because, unlike site A, there is agricultural land and rivers around the land cover. Therefore, it is possible to calculate and compare the surface temperature for natural elements. The first site is the Kyungpook National University Sangju Campus located in Sangju, Gyeongsangbuk-do, Korea, and the second and third sites are farmland and river areas near the Sangju Campus (Figure 2). The land cover of the first site is urethane, artificial turf, soil, vegetation, marble, asphalt, the roof surface (green waterproof paint), the land cover of the second site is cement, vegetation, and asphalt, and the land cover of the third site is cement, vegetation, and urethane.

2.3. Data Acquisition and Processing

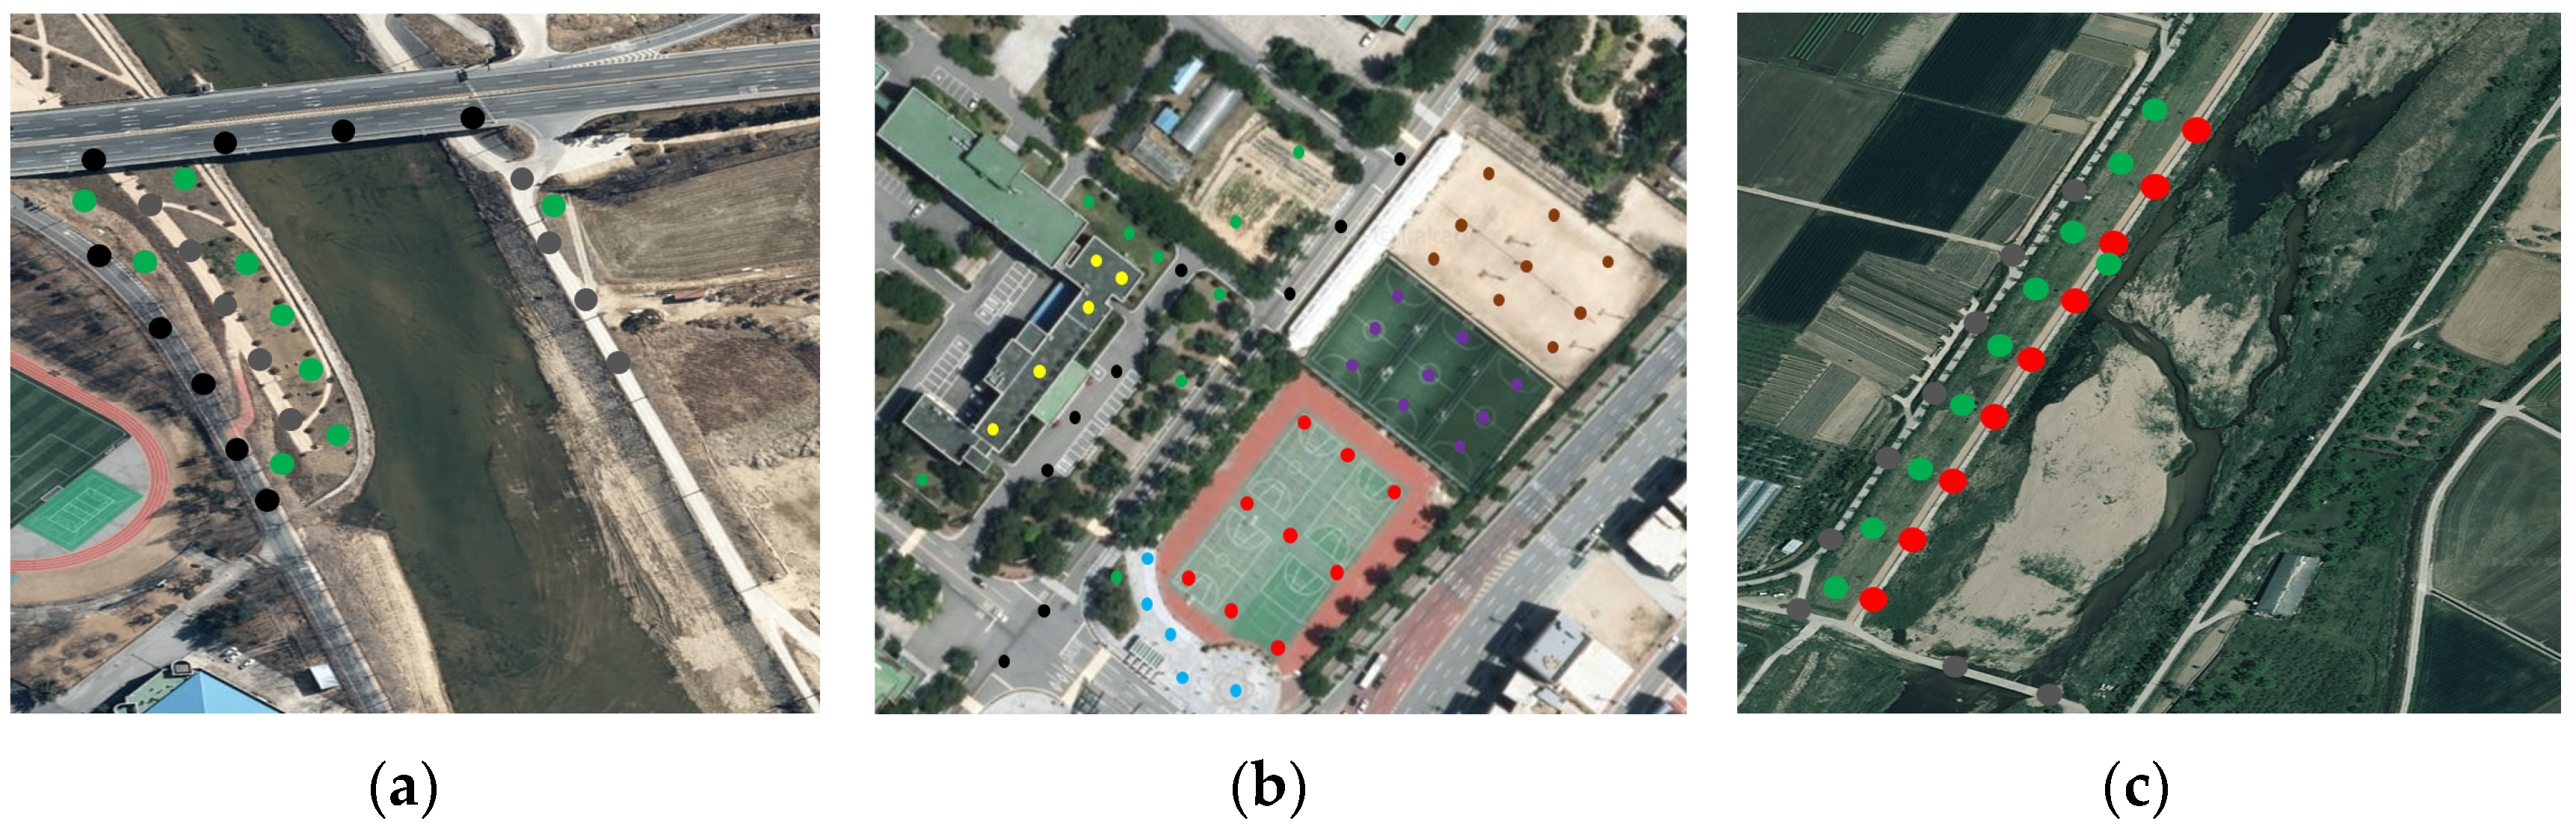
2.3.1. GPS Data Acquisition

GCPs and CPs were used to verify the accuracy of the orthophotos of the LST and obtain a coordinate point that can compare the LST value of the UAV TIR camera with the on-site measured LST value, temperature measurement point acquisition was performed. The GCPs and the CPs used anti-aircraft signs, and the GPS equipment used for the survey was Trimble’s R8s. As the survey method, the VRS method, which is one of the Network RTK methods, was used. The VRS method transmits the current GPS location of the mobile station to the virtual reference point server using one GPS receiver and mobile phone communication [26]. The transmitted information is integrated with the information of the three continuously operation reference station (CORS), and systematic errors on the effects of the ionosphere and convective layer are removed [27]. During the VRS survey, the GPS signals received L1C/A, L1C, L2C, and L5 signals. In addition, signals from GLONASS, SBAS, Galileo, and Beidou satellites were used. The number of GPS satellites was 11–16, and the data interval was observed for more than 10 s at an interval of 1 s. In addition, only values within 0.05 m horizontally and 0.10 m vertically were measured based on the allowable precision regulations (this satisfied the network RTK measurement regulations of the Work Provision for Public Survey (Republic of Korea) No. 2019–153 (Effective 1 January 2020).

2.3.2. Temperature Data Acquisition

For TIR images, images were taken between July and August 2021, 3 days at each site by selecting a sunny day with few clouds in order not to be affected by the sun (A total of 27 orthophotos). In Korea, July to August is the month with the highest average temperature, and it is the month with rainy seasons and typhoons. Therefore, there was a limitation in the acquisition period because a clear day was selected to minimize the effect of solar heat intensity due to cloud cover. The reason why the temporal range was summer (July and August) was that the winter LST was much lower than that of summer, so data were collected in the summer with the highest LST. In addition, data were collected in summer because it was difficult to operate the UAV owing to battery discharge in winter, which is one of the disadvantages of UAVs. In this study, a total of three DJI’s rotorcraft Inspire 1 and Flir’s TIR camera Zenmuse XT630 for UAVs were used. For TIR images, images were taken between July and August 2021, 3 days at each site by selecting a sunny day with few clouds in order not to be affected by the solar heat intensity (Table 2). The image shooting time was taken from 12 o’clock to 13 o’clock when the illuminance of the sun was longest. In this study, a total of three DJI’s rotorcraft Inspire 1 and Flir’s TIR camera Zenmuse XT630 for UAVs were used. The shooting altitude of the UAV was taken at 50 m. The drone speed was set to the lowest 3 m/s in order not to affect the camera, and the data were acquired using the automatic shooting method. In the case of a TIR camera, it is necessary to preheat to the operating temperature for stable operation. Although non-uniformity correction (NUC) is performed when the instrument is first operated, in order to increase the accuracy of temperature measurement, TIR image acquisition was performed after warming up for about 20 min in a stable environment before flying the UAV [28].
Since the LST may change over time, the images were taken at the same time with three UAVs at an interval of 2 min for each angle. The on-site measurement was carried out at the same time as the UAV was photographed for the coordinate points acquired in advance through the GNSS survey using two laser thermometers. In order not to affect the TIR images, measurements were taken after all UAVs per course were filmed. At the time of measurement, one point was measured five times, the average value was calculated, and the LST of the point was obtained. Site (a) has a total of three land covers (cement, vegetation, and asphalt), site (b) has a total of seven land covers (urethane, artificial turf, soil, vegetation, marble, asphalt, and green roof surface), site (c) has a total of three (cement, vegetation, and urethane) measured in the field (Figure 3).

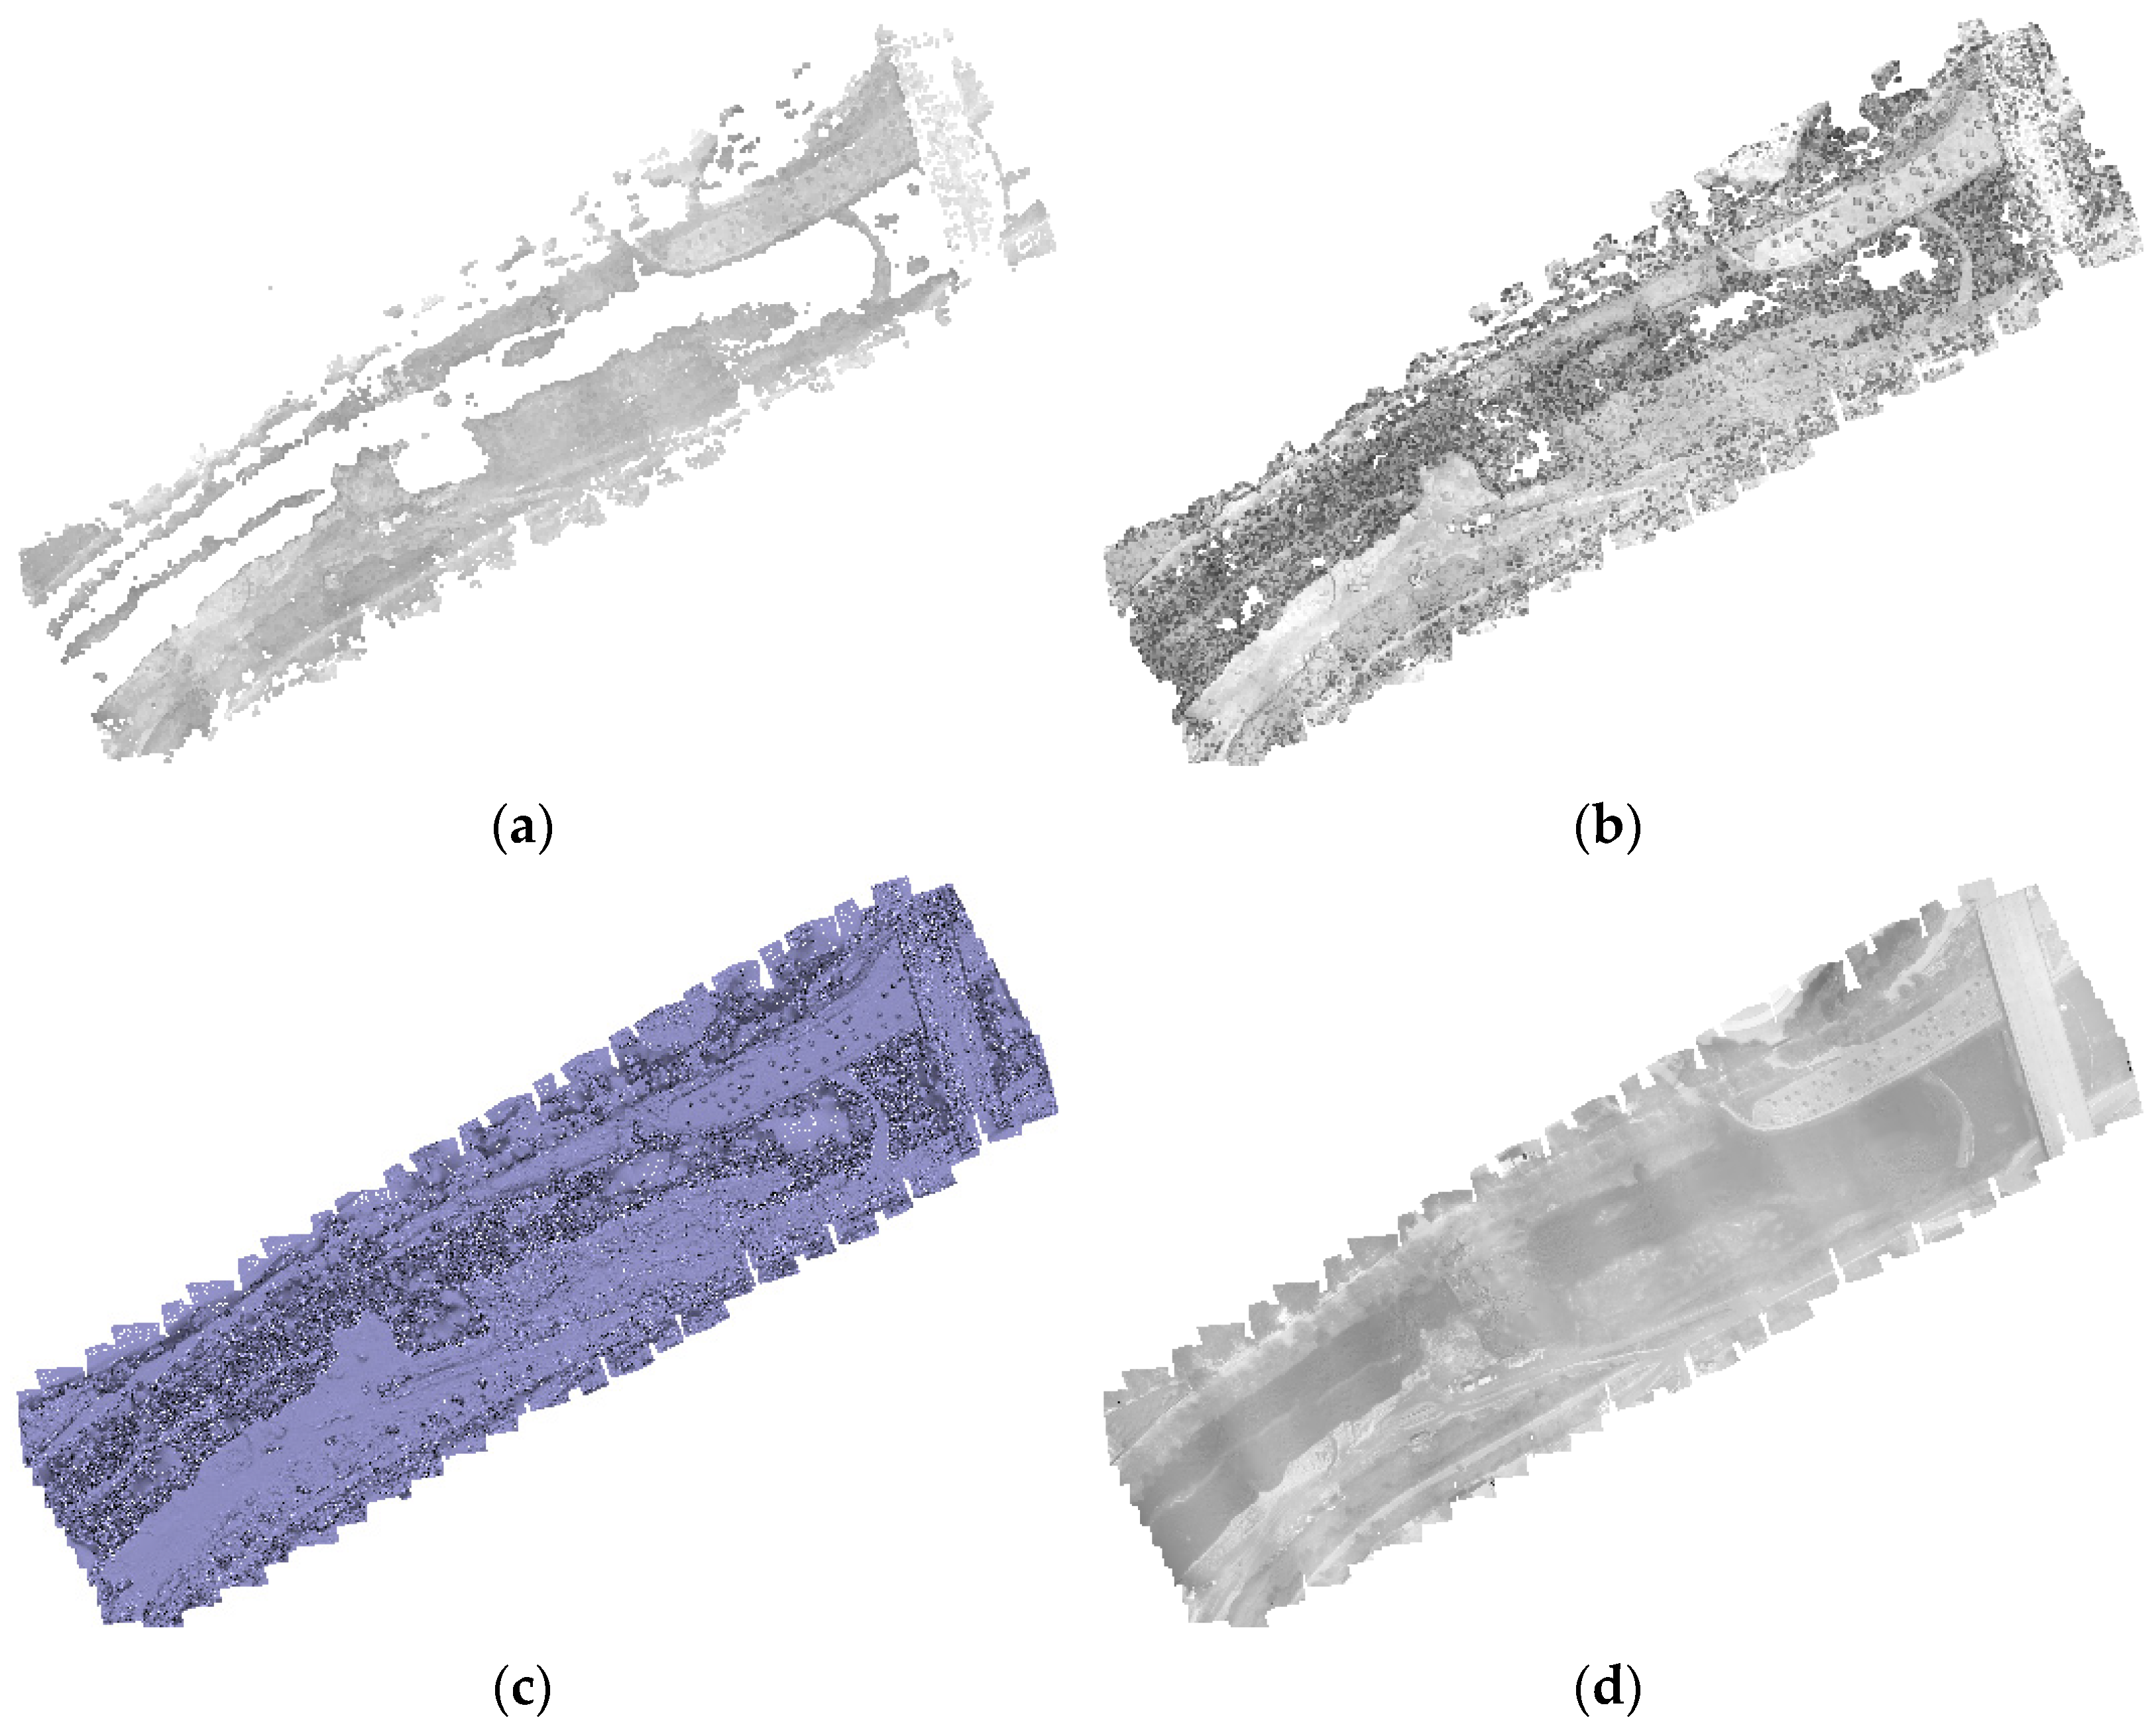
2.3.3. LST Orthophotos Generation

TIR images acquired by UAVs are acquired in 8-bit joint photographic expert group (JPEG) format. TIR images acquired in JPEG format show digital number (DN) values, not temperature values. A JPEG image consists of radiation data and metadata information [29]. Exchangeable image file format (EXIF) has information to calculate the temperature and certain metadata values [30]. In the case of a single TIR image, the temperature value can be checked with Flir tools + software provided by FLIR [31]. However, in this study, we intend to obtain the LST value by producing an orthophoto rather than a single image. To generate LST orthophotos, it is necessary to first run the Exiftool software in Matlab 2021a and convert the 8-bit JPEG format to a 16-bit tagged image file format (TIFF) image. After executing Exiftool in Matlab 2021a, an 8-bit JPEG image was converted into a 16-bit TIFF image using the metadata of the JPEG image and the -rawthermalimage-b command.
A single TIR image converted from a JPEG image to a TIFF image was produced as an orthophoto image using Agisift’s Photoscan professional software. Photoscan software produces orthophotos through camera distortion correction, photo alignment, feature point extraction, high-density point construction, mesh and texture construction [32,33]. The camera distortion correction method used Brown’s distortion model (Equations (1)–(6) [34]. Feature point extraction was performed using the scale invariant feature transform (SIFT) matching technique [35]. It proceeds in four steps: scale-space extrema detection, feature point positioning, orientation assignment, and feature descriptor. Then, through the structure from motion (SfM) process, a high-density point cloud with image expression and 3D relative coordinate values is formed [36]. Since the high-density point cloud constructed through the SfM method is a relative coordinate, the ground reference point acquired through VRS surveying is input and converted into absolute coordinates (Figure 4).
y = Y / Z
  r = ( x 2 + y 2 )
x = x ( 1 + K 1 r 2 + K 2 r 4 + K 3 r 6 + K 4 r 8 ) + ( P 2 ( r 2 + 2 x 2 ) + 2 P 1 x y ) ( 1 + P 3 r 2 + P 4 r 4 )
y = y ( 1 + K 1 r 2 + K 2 r 4 + K 3 r 6 + K 4 r 8 ) + ( P 1 ( r 2 + 2 y 2 ) + 2 P 2 x y ) ( 1 + P 3 r 2 + P 4 r 4 )
u = w   ×   0.5   + c x + x f + x B 1 + y B 2
v = h   ×   0.5 + c y + y f
where, X, Y, and Z are the point coordinates in the local camera coordinate system; u and v denote the projected point coordinates in the image coordinate system (in pixels); f is the focal length; c x and c y are the principal point offset; K 1 , K 2 , K 3 , and K 4 are the radial distortion coefficients; B 1 and B 2 represent the affinity and non-orthogonality (skew) coefficients, respectively; and w and h are the image width and height in pixels, respectively. Since the generated orthophoto is a DN value, it needs to be converted into a temperature value. The DN value was converted to a temperature value using Equations (7)–(12), and each parameter for Equations (7)–(12) differs depending on the type of TIR camera and the external environment at the time of shooting [30].
H 2 O = Hum × EXP ( 1.5587 + 0.06939 × AirT 0.00027816 × AirT + 0.00000068455 × AirT )
Ra w refl = PlanckR 1 PlanckR 2 × ( EXP ( PlanckB AirT + 273.15 ) PlanckF ) PlanckO
T = X × EXP   ( Dist × ( Alpha   1 + Beta   1 ) × H 2 O ) ) + ( 1 X ) × EXP ( Dist ) × ( ( Alpha   2 + Beta   2 ) × H 2 O )
RawAtmo s refl = PlanckR 1 PlanckR 2 × ( EXP ( PlanckB AirT + 273.15 ) PlanckF ) PlanckO
Ra w object = DN ( ( 1 T ) RawAtmo s refl ) ( 1 E ) × Ra w refl E T
T object = PlanckB LN ( PlanckR 1 PlanckR 2 × ( Ra w object + PlanckO ) + PlanckF ) 273.15
The parameter information for the TIR camera requires PlanckR 1 , PlanckR 2 , PlanckB , PlanckF , PlanckO , Alpha   1 , Alpha   2 , Beta   1 , Beta   2 , X [37]. These parameters are unique values that are stored in the sensor to calculate atmospheric attenuation. This information about the parameters is stored as metadata when the TIR image is taken. To know the metadata, it is necessary to extract the EXIF information of the image, and the ExifToolGUI software was used to extract the EXIF information. By entering the TIR image into the ExifToolGUI software and loading the full information about the TIR image, the parameter information can be checked (Table 3) [38,39]. In addition to the parameters in Table 3, detailed information such as camera specifications, camera posture at the time of shooting, and location information can be checked.
The parameters Dist , RAT , Hum , AirT , and E for the shooting environment can be changed by the user according to the external environment when shooting. The emissivity ( E ) of the surface was generally found to be 0.95 or more in the absence of snow and water and was also set to 0.95 in this study [40]. The emissivity of the laser thermometer used to evaluate the accuracy of TIR imaging was also set to 0.95. Using Matlab 2021a, Equations (7)–(12) and parameters were calculated to convert orthophotos generated with DN values into LST orthophotos (Figure 5).

3. Results and Discussion

In this section, Results and Discussion, the difference between the LST of each site obtained by each camera angles and the average temperature value obtained directly with a laser thermometer was compared. Through comparison, the temperature difference by angle was quantitatively analyzed to select which angle can obtain the most accurate temperature value when acquiring TIR images for UAVs. In this study, TIR images were simultaneously taken at three camera angles of 70°, 80°, and 90° for 3 days (9 days in total) at each site from July to August to generate LST orthophotos (a total of 27 LST orthophotos). The LST obtained with the UAV and the LST value obtained with a laser thermometer were calculated as an average and compared (Table 4, Table 5 and Table 6). The temperature values obtained using the orthophotos of the LST and the laser thermometer represent the average value for several points measured by land covers.
Before comparing the acquired temperatures of the TIR camera for UAV and the laser thermometer according to the date, angle, and land cover, it is necessary to check whether the average difference between the acquired temperatures is significant. For the verification of significance, analysis of variance (ANOVA) was used. ANOVA is a method used when the means of three or more different groups are compared with each other [41]. ANOVA is a method of testing a hypothesis using the F distribution by comparing the variances within groups, the sum, the mean of the sums, and the variance between groups caused by the difference in mean. If the p-value calculated through ANOVA analysis is less than 0.05, it can be considered that there is a significant difference [42]. Table 7, Table 8 and Table 9 are tables showing the significant results of the LST of each land cover according to the angles of study sites A, B, and C through the ANOVA method. When looking at the p-values of the research areas A, B, and C, it was confirmed that they were less than 0.05, and through this, it can be seen that there is a statistically significant difference between the land surfaces temperatures of each land cover according to the angles.
In the case of research site A, UAV imaging was conducted on 28 July 2021, 4 August 2021, and 16 August 2021, and the average temperature was the highest on 4 August 2021 among the three dates. The types of land cover consisted of concrete, vegetation, and asphalt, and the land cover with the highest LST had the highest temperature in the order of asphalt, concrete, and vegetation. When comparing the temperature acquired with the TIR image and the temperature acquired with a laser thermometer, the largest absolute difference average was 5.51 °C, 1.11 °C, and 6.60 °C in the 70° image on 16 August 2021, for concrete, vegetation, and asphalt. The smallest difference is that for concrete and asphalt, the 80° image on 28 July 2021, was the smallest at 0.73 °C and 0.64 °C, and for vegetation, the 80° image on 4 August 2021, was the smallest at 0.36 °C. When comparing three dates, the angle of the TIR camera with the same temperature value as the laser thermometer is 80°, and the angle with a large temperature difference is 70°. In the case of concrete and asphalt, the difference was about 1–6 °C depending on the camera angle (based on 80°), and it can be seen that the difference is large even considering that the camera accuracy is 5%. In the case of vegetation, the temperature difference by angle was not large, but it was most accurate when the camera angle was 80°.
In the case of research site B, UAV imaging was performed on 29 July 2021, 5 August 2021, and 17 August 2021, and 5 August 2021, had the highest average temperature among the three dates. There are seven types of land cover: urethane, artificial turf, soil, vegetation, marble, asphalt, and green roof (the most used roof color in Korea). The land cover with the highest LST was asphalt, artificial turf, green roof, urethane, soil, marble, and vegetation in that order. When comparing the temperature acquired with the TIR image and the temperature acquired with a laser thermometer, the largest absolute difference average was 6.29 °C, 4.28 °C, 2.72 °C, and 3.66 °C in the 70° image on 29 July 2021, in the case of urethane, artificial turf, soil, and marble. The lowest temperature difference in land cover excluding vegetation was at 80° Celsius, and urethane and green roofs showed a difference of 0.72 °C and 0.37 °C on 5 August 2021. Artificial turf, soil, marble, and asphalt showed differences of 1.04 °C, 0.55 °C, 0.62 °C, and 0.88 °C on 17 August 2021. The vegetation was the smallest at 0.48 °C in the 90° image on 17 August 2021, but there was no significant difference from the 70° and 80° images (70°: 0.71 °C, 80°: 0.84 °C). Like Site A, in Site B, the TIR image of 80 °C showed a similar temperature value to that of the laser thermometer, and it was confirmed that the TIR image of 70 °C had a large temperature difference. When compared by camera angle, there was a difference of about 1–5 in the land cover (based on 80°), and in the case of soil, vegetation, and green roof, there was no significant difference by angle compared to other land cover.
In the case of research site C, UAV imaging was conducted on 30 July 2021, 6 August 2021, and 18 August 2021, and 6 August 2021, had the highest average temperature among the three dates. There are three types of land cover: concrete, vegetation, and urethane, and the land cover with the highest LST has the highest temperature in the order of urethane, concrete, and vegetation. When the temperature obtained by TIR image and the temperature obtained by laser thermometer were compared, the largest absolute difference average was found in the images of all three land covers at 70°. Concrete and vegetation showed a difference of 5.48 °C and 0.80 °C on 6 August 2021, and urethane showed a difference of 5.77 °C on a 70° image on 30 July 2021. Conversely, the smallest difference was 0.91 °C in the 80° image on 30 July 2021, in concrete and 0.49 °C in the 90° image on 18 August 2021, in vegetation. Urethane showed a difference of 0.75 °C in the 80° image on 18 August 2021. Similarly, for site C, like sites A and B, the image at 80° showed the most similar value to the laser thermometer, but in the image of 18 August 2021, it was confirmed that 90° was a little more similar than 80° in vegetation. In the case of concrete and urethane, the difference was about 2–4 °C depending on the camera angle (based on 80°). In the case of vegetation, the temperature difference was not as large as in site A and B by angle, but it was most accurate when the camera angle was 80°.

4. Conclusions

In this study, the LST accuracy for each land cover was evaluated according to the angle of the TIR camera mounted on the UAV. In this study, the temperature accuracy according to the angle of the TIR camera mounted on the UAV was evaluated. Images were taken at each angle for 3 days at a total of three research sites, and to minimize the change in LST, images were taken simultaneously at 2-min intervals for each angle. The accuracy of the TIR camera for UAV was evaluated by comparing the LST acquired by TIR for UAV with the LST acquired by laser thermometer. TIR images were acquired at the same shooting altitude of 50 m. The land cover with the highest temperature was high on impervious surfaces such as concrete, asphalt, artificial turf, and green roofs, and the temperature was low on permeable surfaces such as soil and vegetation. In the case of the permeable surface, it is thought that the surface temperature was low due to evapotranspiration or surface radiation and thermodynamic properties. Marble is one of the impervious areas, but because of its cold nature, the temperature was lower than other impervious areas. As for the results according to the angle, the temperature difference was not significant compared to the laser thermometer in the TIR images acquired at the camera angle of 80° at all three research sites. The 80° image was more accurate than the 70° and 90° image. In the case of the 70° image, the temperature difference was larger than that of 80° and 90° (up to about 6°). In the case of a 90° image, it is acceptable within the 5% accuracy of the TIR camera used in this study, but the difference is larger than that of an 80° image.
In all three study sites, there was a large temperature difference in the land cover, which is an impervious surface. However, the temperature difference by angle was not large in the land cover, which is the permeable surface. Judging from the results of this experiment, it is believed that accurate temperature can be obtained regardless of the camera angle in the case of a water permeable surface. In the case of land covering an impervious surface, where there is no moisture and there is no space between the particles, which is not well ventilated, it is thought that the temperature value will be affected by the camera angle. The LST varies depending on the material of the surface, such as a permeable surface or an impervious surface, and may also vary depending on the camera angle. In the case of an unmanned aerial vehicle, an angle of 80° is considered to be accurate owing to the UAV’s posture, because it takes TIR images while flying. In addition, depending on the land surface material, the angle at which the maximum radiation is emitted is different. Therefore, it is thought that the optimal camera angle for emission of radiation at all land surfaces was 80° as shown in the results of this study.
Based on the results of this study, it is considered that it is best to set the camera angle to 80° when acquiring data using UAV and TIR cameras. In the case of 90°, although there is a temperature difference, it is possible to acquire within the tolerance range, so if it is impossible to acquire 80°, it can be acquired by setting an angle between 80 and 90°. Accurate temperature acquisition is important because the surface temperature is important data that can be used as basic data in various fields such as cities and environmental issues. Since the existing satellite imaging method has low spatial and temporal resolution, it can be seen that the acquisition of surface temperature using UAV is very effective. Therefore, it is considered to be good to use as basic data for urban and environmental issues by acquiring accurate temperature values using the optimal TIR camera angle. However, when acquiring data using a TIR camera for UAV, there are various factors such as the environment (wind, temperature, and ground state), UAV and camera performance, and shooting height, as well as the angle. Therefore, in future studies, correction studies for external factors other than angle are needed.

Author Contributions

Conceptualization, Kirim Lee and Won Hee Lee; Formal analysis, Kirim Lee and Won Hee Lee; Software, Kirim Lee; Writing—original draft, Kirim Lee; Writing—review & editing, Won Hee Lee. All authors have read and agreed to the published version of the manuscript.

Funding

This research was supported by the Basic Science Research Program through the National Research Foundation of Korea (NRF) funded by the Ministry of Education (NRF-2020R1I1A3061750), and the National Research Foundation of Korea (NRF) grant funded by the Korea government (MSIT) (No. NRF-2021R1A5A8033165).

Institutional Review Board Statement

Not applicable.

Informed Consent Statement

Not applicable.

Data Availability Statement

Data sharing not applicable.

Acknowledgments

The authors wish to acknowledge Research Institute of Artificial Intelligent Diagnosis Technology for Multi-scale Organic and Inorganic Structure, Kyungpook National University, Sangju, South Korea for providing the laboratory facilities.

Conflicts of Interest

The authors declare no conflict of interest.

References

  1. Acharya, T.; Riehl, B.; Fuchs, A. Effects of albedo and thermal inertia on pavement surface temperatures with convective boundary conditions—A CFD Study. Processes 2021, 9, 2078. [Google Scholar] [CrossRef]
  2. Kim, S.W.; Brown, R.D. Urban heat island (UHI) intensity and magnitude estimations: A systematic literature review. Sci. Total Environ. 2021, 779, 146389. [Google Scholar] [CrossRef]
  3. Keppas, S.C.; Papadogiannaki, S.; Parliari, D.; Kontos, S.; Poupkou, A.; Tzoumaka, P.; Kelessis, A.; Zanis, P.; Casasanta, G.; de’Donato, F. Future climate change impact on urban heat island in two mediterranean cities based on high-resolution regional climate simulations. Atmosphere 2021, 12, 884. [Google Scholar] [CrossRef]
  4. Mohajerani, A.; Bakaric, J.; Jeffrey-Bailey, T. The urban heat island effect, its causes, and mitigation, with reference to the thermal properties of asphalt concrete. J. Environ. Manag. 2017, 197, 522–538. [Google Scholar] [CrossRef] [PubMed]
  5. Chen, J.; Chen, X.; Dan, H.; Zhang, L. Combined prediction method for thermal conductivity of asphalt concrete based on meso-structure and renormalization technology. Appl. Sci. 2022, 12, 857. [Google Scholar] [CrossRef]
  6. Gao, Y.; Zhao, J.; Han, L. Exploring the spatial heterogeneity of urban heat island effect and its relationship to block morphology with the geographically weighted regression model. Sustain. Cities Soc. 2022, 76, 103431. [Google Scholar] [CrossRef]
  7. Abdullah, S.; Barua, D.; Abdullah, S.; Abubakar, M.; Rabby, Y.W. Investigating the impact of land use/land cover change on present and future land surface temperature (LST) of Chittagong, Bangladesh. Earth Syst. Environ. 2022, 6, 1–15. [Google Scholar] [CrossRef]
  8. Silvestri, M.; Marotta, E.; Buongiorno, M.F.; Avvisati, G.; Belviso, P.; Bellucci Sessa, E.; Caputo, T.; Longo, V.; De Leo, V.; Teggi, S. Monitoring of surface temperature on Parco delle Biancane (Italian Geo’ Area) using optical satellite data, UAV and field campaigns. Remote Sens. 2020, 12, 2018. [Google Scholar] [CrossRef]
  9. Çolak, E.; Sunar, F. Evaluation of forest fire risk in the Mediterranean Turkish forests: A case study of Menderes region, Izmir. Int. J. Disaster Risk Reduct. 2020, 45, 101479. [Google Scholar] [CrossRef]
  10. Khan, I.; Javed, T.; Khan, A.; Lei, H.; Muhammad, I.; Ali, I.; Huo, X. Impact assessment of land use change on surface temperature and agricultural productivity in Peshawar-Pakistan. Environ. Sci. Pollut. Res. 2019, 26, 33076–33085. [Google Scholar] [CrossRef]
  11. Park, J.H.; Lee, K.R.; Lee, W.H.; Han, Y.K. Generation of LST Orthophoto and Temperature Accuracy Analysis by Land Covers Based on Thermal Infrared Sensor Mounted on Unmanned Aerial Vehicle. J. Korean Soc. Surv. Geod. Photogramm. Cartogr. 2018, 36, 263–270. [Google Scholar]
  12. Mokari, E.; Mohebzadeh, H.; Samani, Z.; DuBois, D.; Daggupati, P. Spatiotemporal imputation of MODIS land surface temperature using machine learning techniques (Case study: New Mexico’s Lower Rio Grande Valley). Remote Sens. Appl. Soc. Environ. 2021, 24, 100651. [Google Scholar] [CrossRef]
  13. Jiménez-Muñoz, J.C.; Sobrino, J.A.; Skoković, D.; Mattar, C.; Cristóbal, J. LST retrieval methods from Landsat-8 thermal infrared sensor data. IEEE Geosci. Remote Sens. Lett. 2014, 11, 1840–1843. [Google Scholar] [CrossRef]
  14. Liu, K.; Su, H.; Li, X.; Wang, W.; Yang, L.; Liang, H. Quantifying spatial–temporal pattern of urban heat island in Beijing: An improved assessment using LST (LST) time series observations from LANDSAT, MODIS, and Chinese new satellite GaoFen-1. IEEE J. Sel. Top. Appl. Earth Obs. Remote Sens. 2016, 9, 2028–2042. [Google Scholar] [CrossRef]
  15. Jin, Y.; Zhu, J.; Sung, S.; Lee, D.K. Application of satellite data spatiotemporal fusion in predicting seasonal NDVI. Korean J. Remote Sens. 2017, 33, 149–158. [Google Scholar]
  16. Wang, T.; Shi, J.; Ma, Y.; Husi, L.; Comyn-Platt, E.; Ji, D.; Zhao, T.; Xiong, C. Recovering LST under cloudy skies considering the solar-cloud-satellite geometry: Application to MODIS and Landsat-8 data. J. Geophys. Res. Atmos. 2019, 124, 3401–3416. [Google Scholar] [CrossRef]
  17. Cho, J.W.; Lee, J.K.; Park, J. Large-Scale Earthwork Progress Digitalization Practices Using Series of 3D Models Generated from UAS Images. Drones 2021, 5, 147. [Google Scholar] [CrossRef]
  18. Kelly, J.; Kljun, N.; Olsson, P.; Mihai, L.; Liljeblad, B.; Weslien, P.; Klemedtsson, L.; Eklundh, L. Challenges and best practices for deriving temperature data from an uncalibrated UAV thermal infrared camera. Remote Sens. 2019, 11, 567. [Google Scholar] [CrossRef] [Green Version]
  19. Ortega-Farias, S.; Esteban-Condori, W.; Riveros-Burgos, C.; Fuentes-Peñailillo, F.; Bardeen, M. Evaluation of a two-source patch model to estimate vineyard energy balance using high-resolution thermal images acquired by an unmanned aerial vehicle (UAV). Agric. Meteorol. 2021, 304, 108433. [Google Scholar] [CrossRef]
  20. Lee, K.; Seong, J.; Han, Y.; Lee, W.H. Evaluation of Applicability of Various Color Space Techniques of UAV Images for Evaluating Cool Roof Performance. Energies 2020, 13, 4213. [Google Scholar] [CrossRef]
  21. Lee, K.; Park, J.; Jung, S.; Lee, W. Roof Color-Based Warm Roof Evaluation in Cold Regions Using a UAV Mounted Thermal Infrared Imaging Camera. Energies 2021, 14, 6488. [Google Scholar] [CrossRef]
  22. Neinavaz, E.; Schlerf, M.; Darvishzadeh, R.; Gerhards, M.; Skidmore, A.K. Thermal infrared remote sensing of vegetation: Current status and perspectives. Int. J. Appl. Earth Obs. Geoinf. 2021, 102, 102415. [Google Scholar] [CrossRef]
  23. DJI Science and Technology Co., Ltd. Zenmuse XT Powered by FLIR User Manual v1.2, 05, Shenzhen, China. 2016. Available online: https://dl.djicdn.com/downloads/zenmuse_xt/en/Zenmuse_XT_User_Manual_V1.2_en_0708.pdf (accessed on 20 October 2021).
  24. Senzhen Everbest Machinery Industry Co., Ltd. Professional Infrared Thermometer DT-8868H, Shenzhen, China. 2010. Available online: https://www.cem-instruments.com/en/Product/detail/id/869dd (accessed on 28 October 2021).
  25. Trimble Inc. Trimble R8s GNSS Recever User Guide Version 1.0 Revision D, California, USA. 2020. Available online: https://trl.trimble.com/docushare/dsweb/Get/Document-740604/R8s%20UserGuide_RevD.pdf (accessed on 28 October 2021).
  26. Elsobeiey, M.E. Accuracy Assessment of Satellite-Based Correction Service and Virtual GNSS Reference Station for Hydrographic Surveying. J. Mar. Sci. Eng. 2020, 8, 542. [Google Scholar] [CrossRef]
  27. Mageed, K.M.A. Accuracy Evaluation between GPS Virtual Reference Station (VRS) and GPS Real Time Kinamatic (RTK) Techniques. World Appl. Sci. J. 2013, 24, 1154–1162. [Google Scholar]
  28. Wan, Q.; Brede, B.; Smigaj, M.; Kooistra, L. Factors Influencing Temperature Measurements from Miniaturized Thermal Infrared (TIR) Cameras: A Laboratory-Based Approach. Sensors 2021, 21, 8466. [Google Scholar] [CrossRef]
  29. Misopolinos, L.; Zalidis, C.H.; Liakopoulos, V.; Stavridou, D.; Katsigiannis, P.; Alexandridis, T.K.; Zalidis, G. Development of a UAV system for VNIR-TIR acquisitions in precision agriculture. In Proceedings of the 3rd International Conference on Remote Sensing and Geoinformation of the Environment (RSCy2015), Paphos, Cyprus, 19 June 2015; Volume 9535, p. 95351H. [Google Scholar]
  30. Di Felice, F.; Mazzini, A.; Di Stefano, G.; Romeo, G. Drone high resolution infrared imaging of the Lusi mud eruption. Mar. Pet. Geol. 2018, 90, 38–51. [Google Scholar] [CrossRef]
  31. Urzędowski, A.; Wójcicka-Migasiuk, D.; Buraczyńska, B. Visual Effects of Surface Emissivity in Thermal Imaging. Adv. Sci. Technol. Res. J. 2020, 14, 215–222. [Google Scholar] [CrossRef]
  32. Fried, P.; Woodward, J.; Brown, D.; Harvell, D.; Hanken, J. 3D scanning of antique glass by combining photography and computed tomography. Digit. Appl. Archaeol. Cult. Herit. 2020, 18, e00147. [Google Scholar] [CrossRef]
  33. Lee, K.R.; Han, Y.K.; Lee, W.H. Comparison of orthophotos and 3D models generated by UAV-based oblique images taken in various angles. J. Korean Soc. Surv. Geod. Photogramm. Cartogr. 2018, 36, 117–126. [Google Scholar]
  34. Tsai, R. A versatile camera calibration technique for high-accuracy 3D machine vision metrology using off-the-shelf TV cameras and lenses. IEEE J. Robot. Autom. 1987, 3, 323–344. [Google Scholar] [CrossRef] [Green Version]
  35. Lowe, D.G. Distinctive image features from scale-invariant keypoints. Int. J. Comput. Vis. 2004, 60, 91–110. [Google Scholar] [CrossRef]
  36. Lucieer, A.; Jong, S.M.d.; Turner, D. Mapping landslide displacements using Structure from Motion (SfM) and image correlation of multi-temporal UAV photography. Prog. Phys. Geogr. 2014, 38, 97–116. [Google Scholar] [CrossRef]
  37. Aubrecht, D.M.; Helliker, B.R.; Goulden, M.L.; Roberts, D.A.; Still, C.J.; Richardson, A.D. Continuous, long-term, high-frequency thermal imaging of vegetation: Uncertainties and recommended best practices. Agric. Meteorol. 2016, 228, 315–326. [Google Scholar] [CrossRef] [Green Version]
  38. Kaushik, K.; Surana, S. An Offensive Approach for Hiding Malicious Payloads in an Image. In Proceedings of the Cyber Security and Digital Forensics (ICCSDF 2021), Haryana, India, 2 October 2021; pp. 265–272. [Google Scholar]
  39. Kao, D.; Chen, M.; Wu, W.; Lin, J.; Chen, C.; Tsai, F. Drone Forensic Investigation: DJI Spark Drone as A Case Study. Proc. Comput. Sci. 2019, 159, 1890–1899. [Google Scholar] [CrossRef]
  40. Prigent, C.; Rossow, W.B.; Matthews, E. Microwave land surface emissivities estimated from SSM/I observations. J. Geophys. Res. Atmos. 1997, 102, 21867–21890. [Google Scholar] [CrossRef]
  41. St, L.; Wold, S. Analysis of variance (ANOVA). Chemom. Intell. Lab. Syst. 1989, 6, 259–272. [Google Scholar]
  42. Yuksel, N.; Kanık, A.E.; Baykara, T. Comparison of in vitro dissolution profiles by ANOVA-based, model-dependent and-independent methods. Int. J. Pharm. 2000, 209, 57–67. [Google Scholar] [CrossRef]
Figure 1. Overall study flow chart (Site A: plants, trees and river; Site B: Kyungpook National University Sangju Campus; Site C: farmland and river).
Ijgi 11 00204 g001
Figure 2. Study area: (a) plants, trees and river, (b) Kyungpook National University Sangju Campus, (c) farmland and river.
Ijgi 11 00204 g002
Figure 3. On-site measurement points by land cover: (a) plants, trees and river; (b) Kyungpook National University Sangju Campus; (c) farmland and river. The pointer color indicates land cover: red (urethane); purple (artificial turf); brown (soil); green (vegetation); sky blue (marble); black (asphalt); yellow (green roof); grey (concrete).
Ijgi 11 00204 g003
Figure 4. DN value orthophoto generation process before LST conversion (Shows an example of one orthophoto generation process out of a total of twenty-seven orthophotos.): (a) point cloud, (b) Dense cloud, (c) mesh, (d) Orthophoto with DN value.
Ijgi 11 00204 g004
Figure 5. Orthophotos converted from DN value orthophotos to LST value (Among the 27 orthophotos, only the one with a camera angle of 80° for 3 sites is shown as an example.): (a) 28 July 2021; (b) 29 July 2021; (c) 30 July 2021.
Ijgi 11 00204 g005
Table 1. UAV, TIR camera and laser thermometer specifications.
UAVTIR CameraLaser Thermometer
Inspire 1Zenmuse XT630DT-8868H
Weight2935 gResolution640 × 512Temperature range−50 °C~1650 °C
(−58 °F–3002 °F)
Flight
altitude
Max: 4500 mPixel
size
17μmTemperature accuracy±1.0% of reading
Flight
time
Max: 18 minFOV45° × 37°
SpeedMax: 22 m/sFocal
length
13 mm
Maximum wind
resistance
10 m/sScene
range
−25 °C~+135 °C
(High gain)
−40 °C~+550 °C
(Low gain)
Table 2. Weather information on the day the image was taken, and the average monthly temperatures were recorded.
Maximum Temperature (°C)Minimum Temperature (°C)Temperature at the Time of Shooting (°C)Wind Speed at the Time of Shooting (m/s)
28 July 202133.522.731.81.0
29 July 202133.722.831.21.2
30 July 202134.524.231.61.1
4 August 202133.723.830.10.6
5 August 202134.424.231.81.4
6 August 202134.524.332.71.3
16 August 202127.820.726.91.3
17 August 202128.220.226.51.3
18 August 202128.519.827.21.5
Average temperature in July 2021 (°C) 26.2
Average temperature in August 2021 (°C)24.4
Table 3. The parameters for the TIR sensor and environment included in Equations (7)–(12).
ParameterValue
TIR SensorPlanckR117096.453
PlanckR20.046642166
PlanckB1428
PlanckF1
PlanckO−342
Alpha 10.006569
Alpha 20.012620
Beta 1−0.002276
Beta 2−0.006670
X1.9
EnvironmentDist50 m
RAT22 °C
Hum50%
AirT22 °C
E0.95
Table 4. Average LST difference of site A by land cover (unit: °C): (a) 28 July 2021, (b) 4 August 2021, (c) 16 August 2021.
Land Cover
(Total Number)
UAV & TIRLaser ThermometerDifference
(a)(b)(c)(a)(b)(c)(a)(b)(c)
70°80°90°70°80°90°70°80°90°70°80°90°70°80°90°70°80°90°
Concrete
(9)
52.9154.9052.2053.1557.1052.2047.0549.3048.3255.0055.9149.563.120.732.802.761.193.712.510.881.88
Vegetation
(9)
39.0438.1438.3739.3539.2839.4635.3135.3435.1338.1639.5335.261.080.520.600.670.360.621.110.480.90
Asphalt
(9)
64.8366.9565.5865.8269.1966.3562.5065.0364.1566.7869.4165.442.080.642.413.601.153.293.340.982.25
Table 5. Average LST difference of site B by land cover (unit: °C): (a) 29 July 2021, (b) 5 August 2021, (c) 17 August 2021.
Land Cover
(Total Number)
UAV & TIRLaser ThermometerDifference
(a)(b)(c)(a)(b)(c)(a)(b)(c)
70°80°90°70°80°90°70°80°90°70°80°90°70°80°90°70°80°90°
Urethane
(9)
57.5263.3867.8068.5265.2365.3856.9860.9161.8263.8165.1061.336.291.443.983.420.722.324.350.852.14
Artificial turf
(9)
66.2563.0864.5065.9570.0869.2960.4662.9462.6461.9769.8463.514.281.202.543.891.071.243.061.042.24
Soil
(9)
48.4651.0550.3850.9652.5751.0246.1646.3946.6151.1851.8546.632.720.570.950.950.720.850.650.550.57
Vegetation
(9)
40.8641.0441.3641.6741.7742.2639.6840.0940.2842.1741.8140.361.521.581.451.150.851.140.710.840.48
Marble
(5)
44.3639.8542.9643.3443.4645.2437.3139.0741.5440.7042.6839.373.660.932.261.430.792.562.070.622.16
Asphalt
(9)
69.5574.3471.0272.1976.6674.0064.4570.7969.2974.5976.4070.525.050.673.584.200.882.406.070.881.35
Green roof
(5)
61.2262.0362.6564.1264.7664.8458.9159.5660.3461.0264.7961.010.701.012.060.840.370.572.111.450.74
Table 6. Average LST difference of site B by land cover (unit: °C): (a) 30 July 2021, (b) 6 August 2021, (c) 18 August 2021.
Land Cover
(Total Number)
UAV & TIRLaser ThermometerDifference
(a)(b)(c)(a)(b)(c)(a)(b)(c)
70°80°90°70°80°90°70°80°90°70°80°90°70°80°90°70°80°90°
Concrete
(9)
51.5855.2451.9251.8356.9352.9650.4353.6851.6755.2957.3153.703.710.913.375.480.924.353.271.072.03
Vegetation
(9)
38.1838.3537.7741.1540.8640.9937.1937.5037.2837.9140.5037.390.630.590.420.800.650.910.750.570.49
Urethane
(9)
56.2060.9759.0758.1963.7361.4361.8057.1558.8061.9762.9957.675.771.112.904.791.512.064.130.751.13
Table 7. ANOVA test to compare the difference in LST for each land cover according to the angle in study area A.
GroupsCountSum (°C)Average (°C)Variance (°C)
Concrete 70°271350.9450.0324.77
Concrete 80°1451.7653.7715.08
Concrete 90°1374.450.908.67
Vegetation 70°1023.3137.904.89
Vegetation 80°1014.9537.593.88
Vegetation 90°1016.5737.654.39
Asphalt 70°1667.3461.755.20
Asphalt 80°1808.6266.994.21
Asphalt 90°1764.7265.364.70
Source of VariationSum of Squares (°C)Degrees of FreedomMean of Squares (°C)F-Valuep-ValueF-Critical Value
Between groups30,095.4683761.93446.754.2 × 10−1371.98
Within groups1970.442348.42
Total32,065.89242
Table 8. ANOVA test to compare the difference in LST for each land cover according to the angle in study area B.
GroupsCountSum (°C)Average (°C)Variance (°C)
Urethane 70°271647.1361.0030.50
Urethane 80°1705.6563.175.39
Urethane 90°1754.9865.009.85
Artificial turf 70°1733.8764.228.09
Artificial turf 80°1764.9465.3712.61
Artificial turf 90°1767.9565.4810.19
Soil 70°1310.2048.534.53
Soil 80°1350.1450.017.98
Soil 90°1332.1249.344.64
Vegetation 70°1099.9840.741.63
Vegetation 80°1106.0640.971.11
Vegetation 90°1115.0641.301.16
Asphalt 70°1855.7368.7311.30
Asphalt 80°1996.0773.936.88
Asphalt 90°1928.7971.444.57
Marble 70°15625.0441.6711.23
Marble 80°611.9340.804.15
Marble 90°648.6843.252.88
Green roof 70°921.1961.415.27
Green roof 80°931.7962.125.19
Green roof 90°939.1762.613.98
Source of VariationSum of Squares (°C)Degrees of FreedomMean of Squares (°C)F-Valuep-ValueF-critical Value
Between groups62,540.46203127.02412.99985.9 × 10−2851.59
Within groups3588.894747.57
Total66,129.35494
Table 9. ANOVA test to compare the difference in LST for each land cover according to the angle in study area C.
GroupsCountSum (°C)Average (°C)Variance (°C)
Concrete 70°271384.5051.281.05
Concrete 80°1492.6555.282.43
Concrete 90°1408.9452.180.74
Vegetation 70°1048.7338.843.18
Vegetation 80°1050.3738.902.42
Vegetation 90°1044.3038.683.28
Urethane 70°1585.7758.736.28
Urethane 80°1636.6760.628.03
Urethane 90°1613.7159.771.97
Source of VariationSum of Squares (°C)Degrees of FreedomMean of Squares (°C)F-Valuep-ValueF-Critical Value
Between groups18,697.4882337.19715.987.5 × 10−1601.98
Within groups763.852343.26
Total19,461.33242
Publisher’s Note: MDPI stays neutral with regard to jurisdictional claims in published maps and institutional affiliations.

