
Aquaculture Site Selection of Oncorhynchus Mykiss (Rainbow Trout) in Markazi Province Using GIS-Based MCDM


Abstract
:1. Introduction
2. Materials and Methods
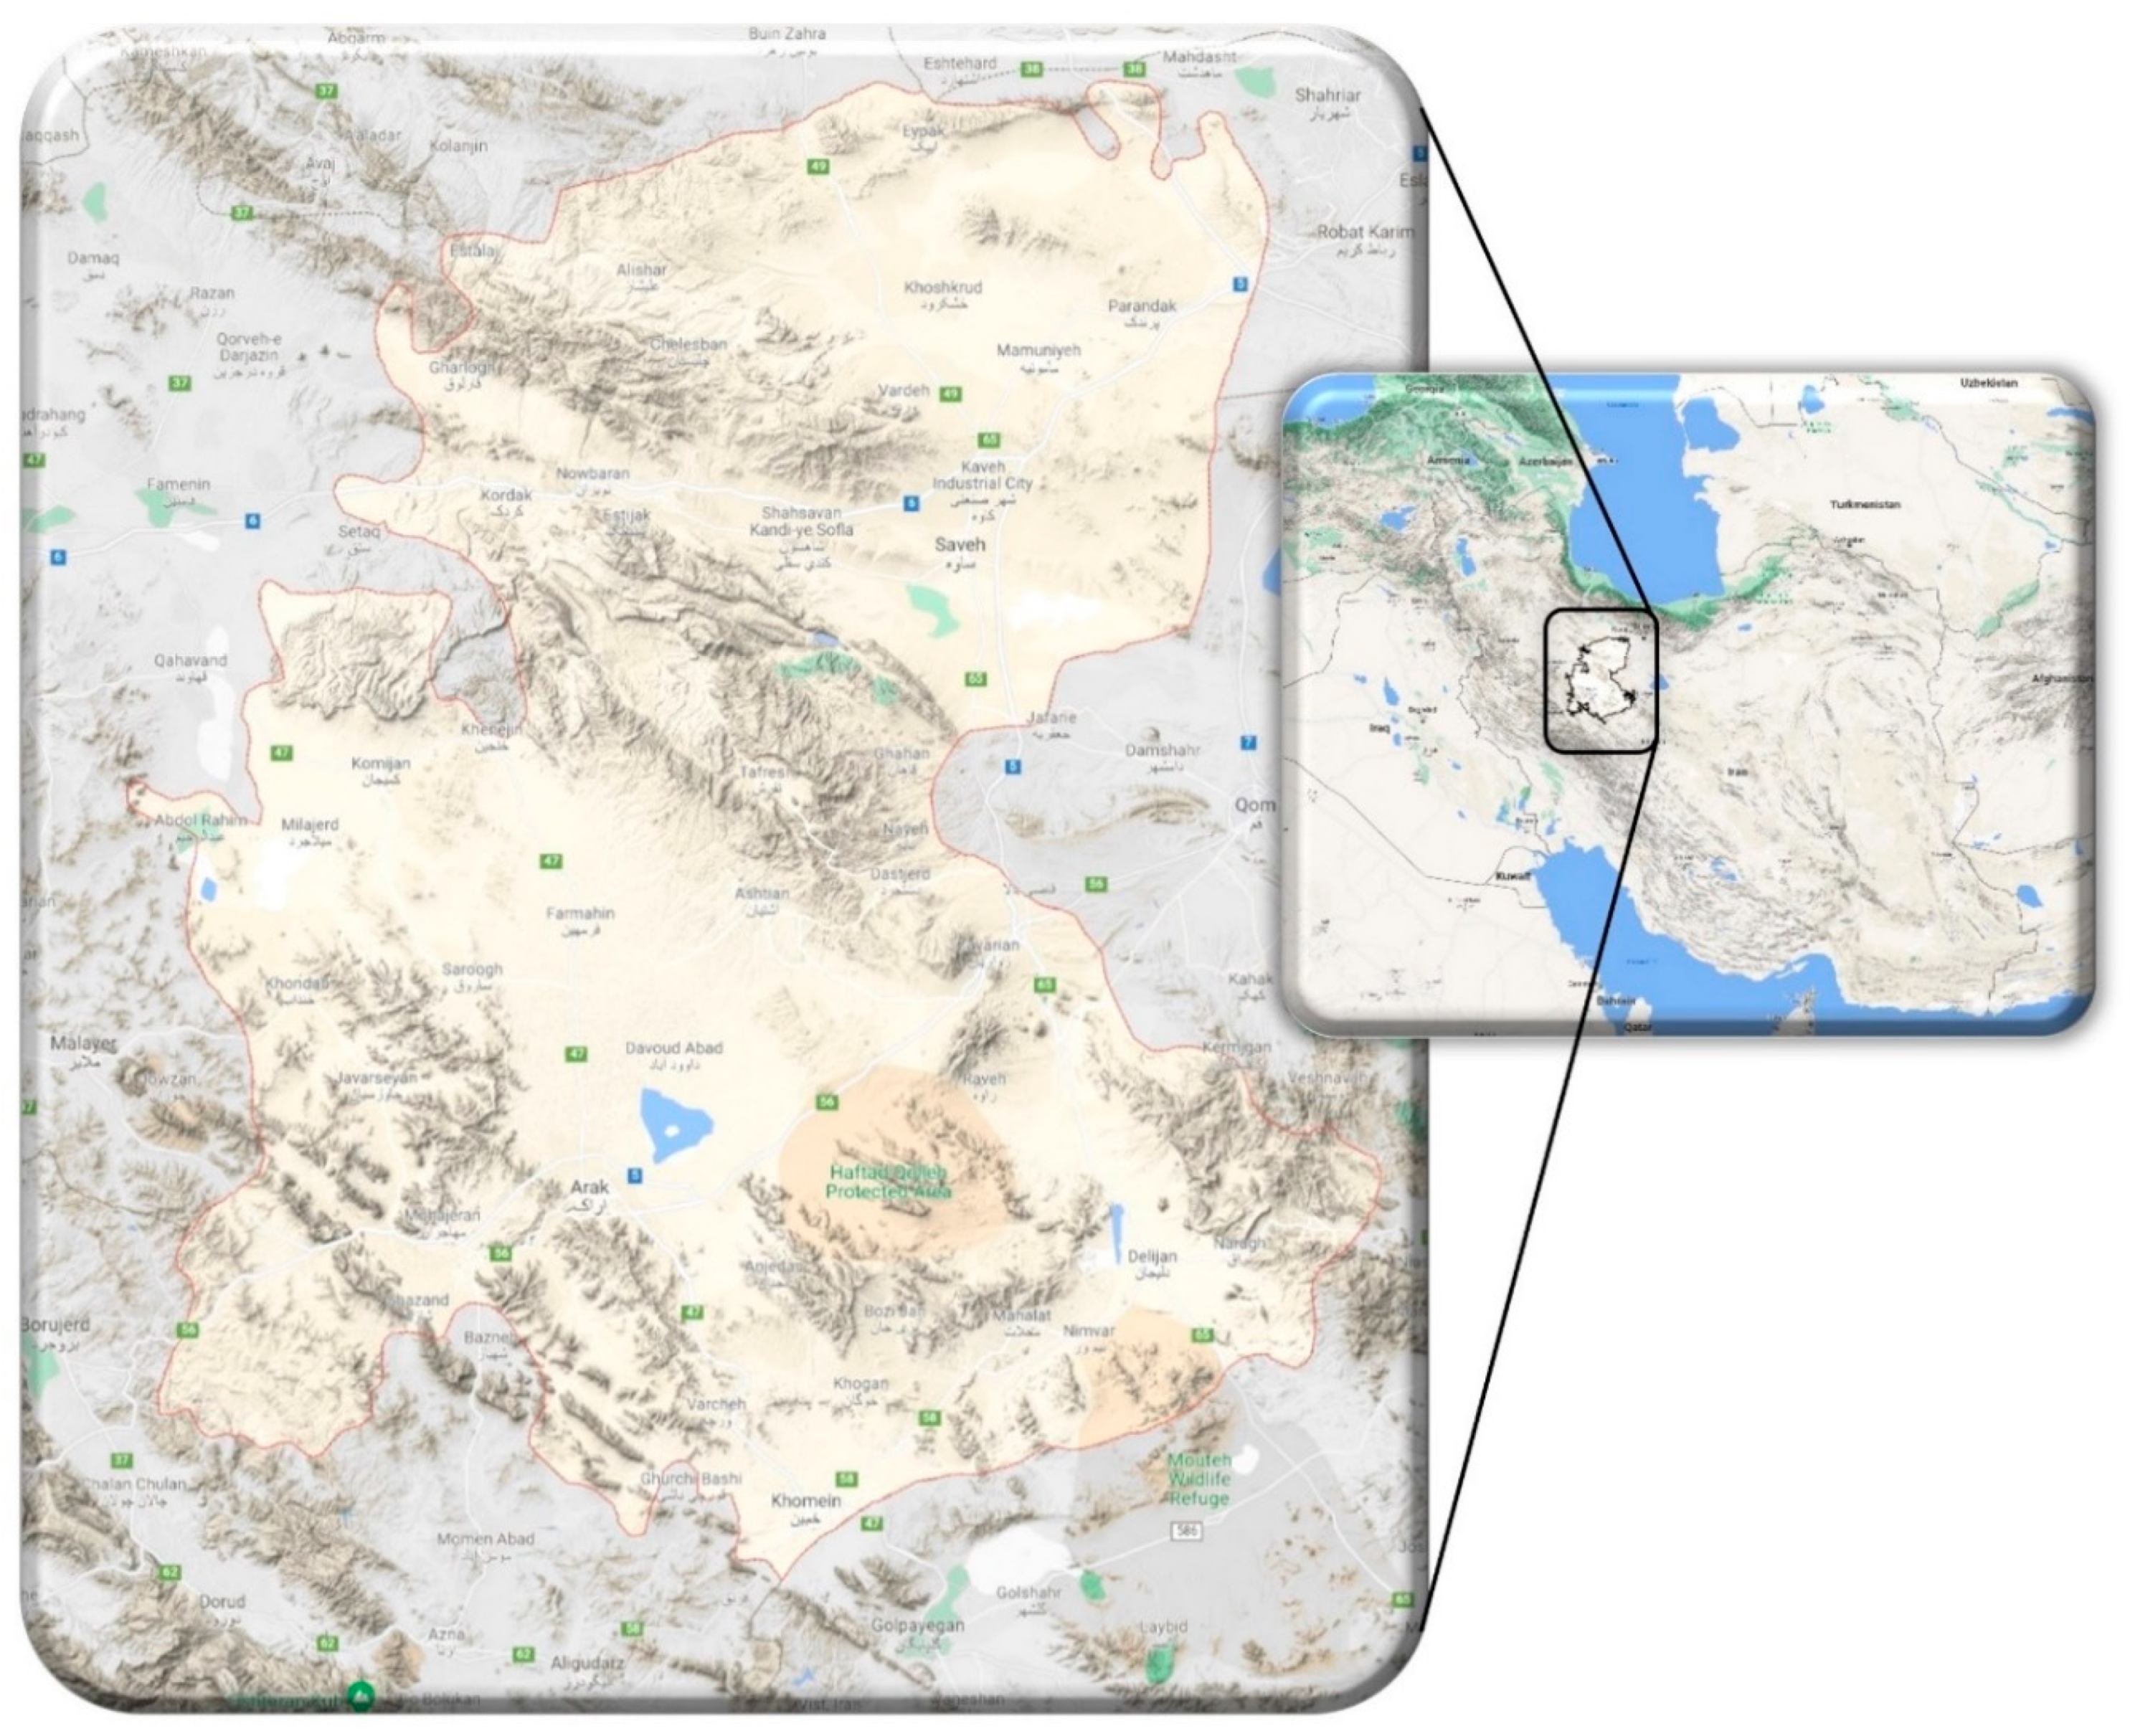
2.1. Study Area
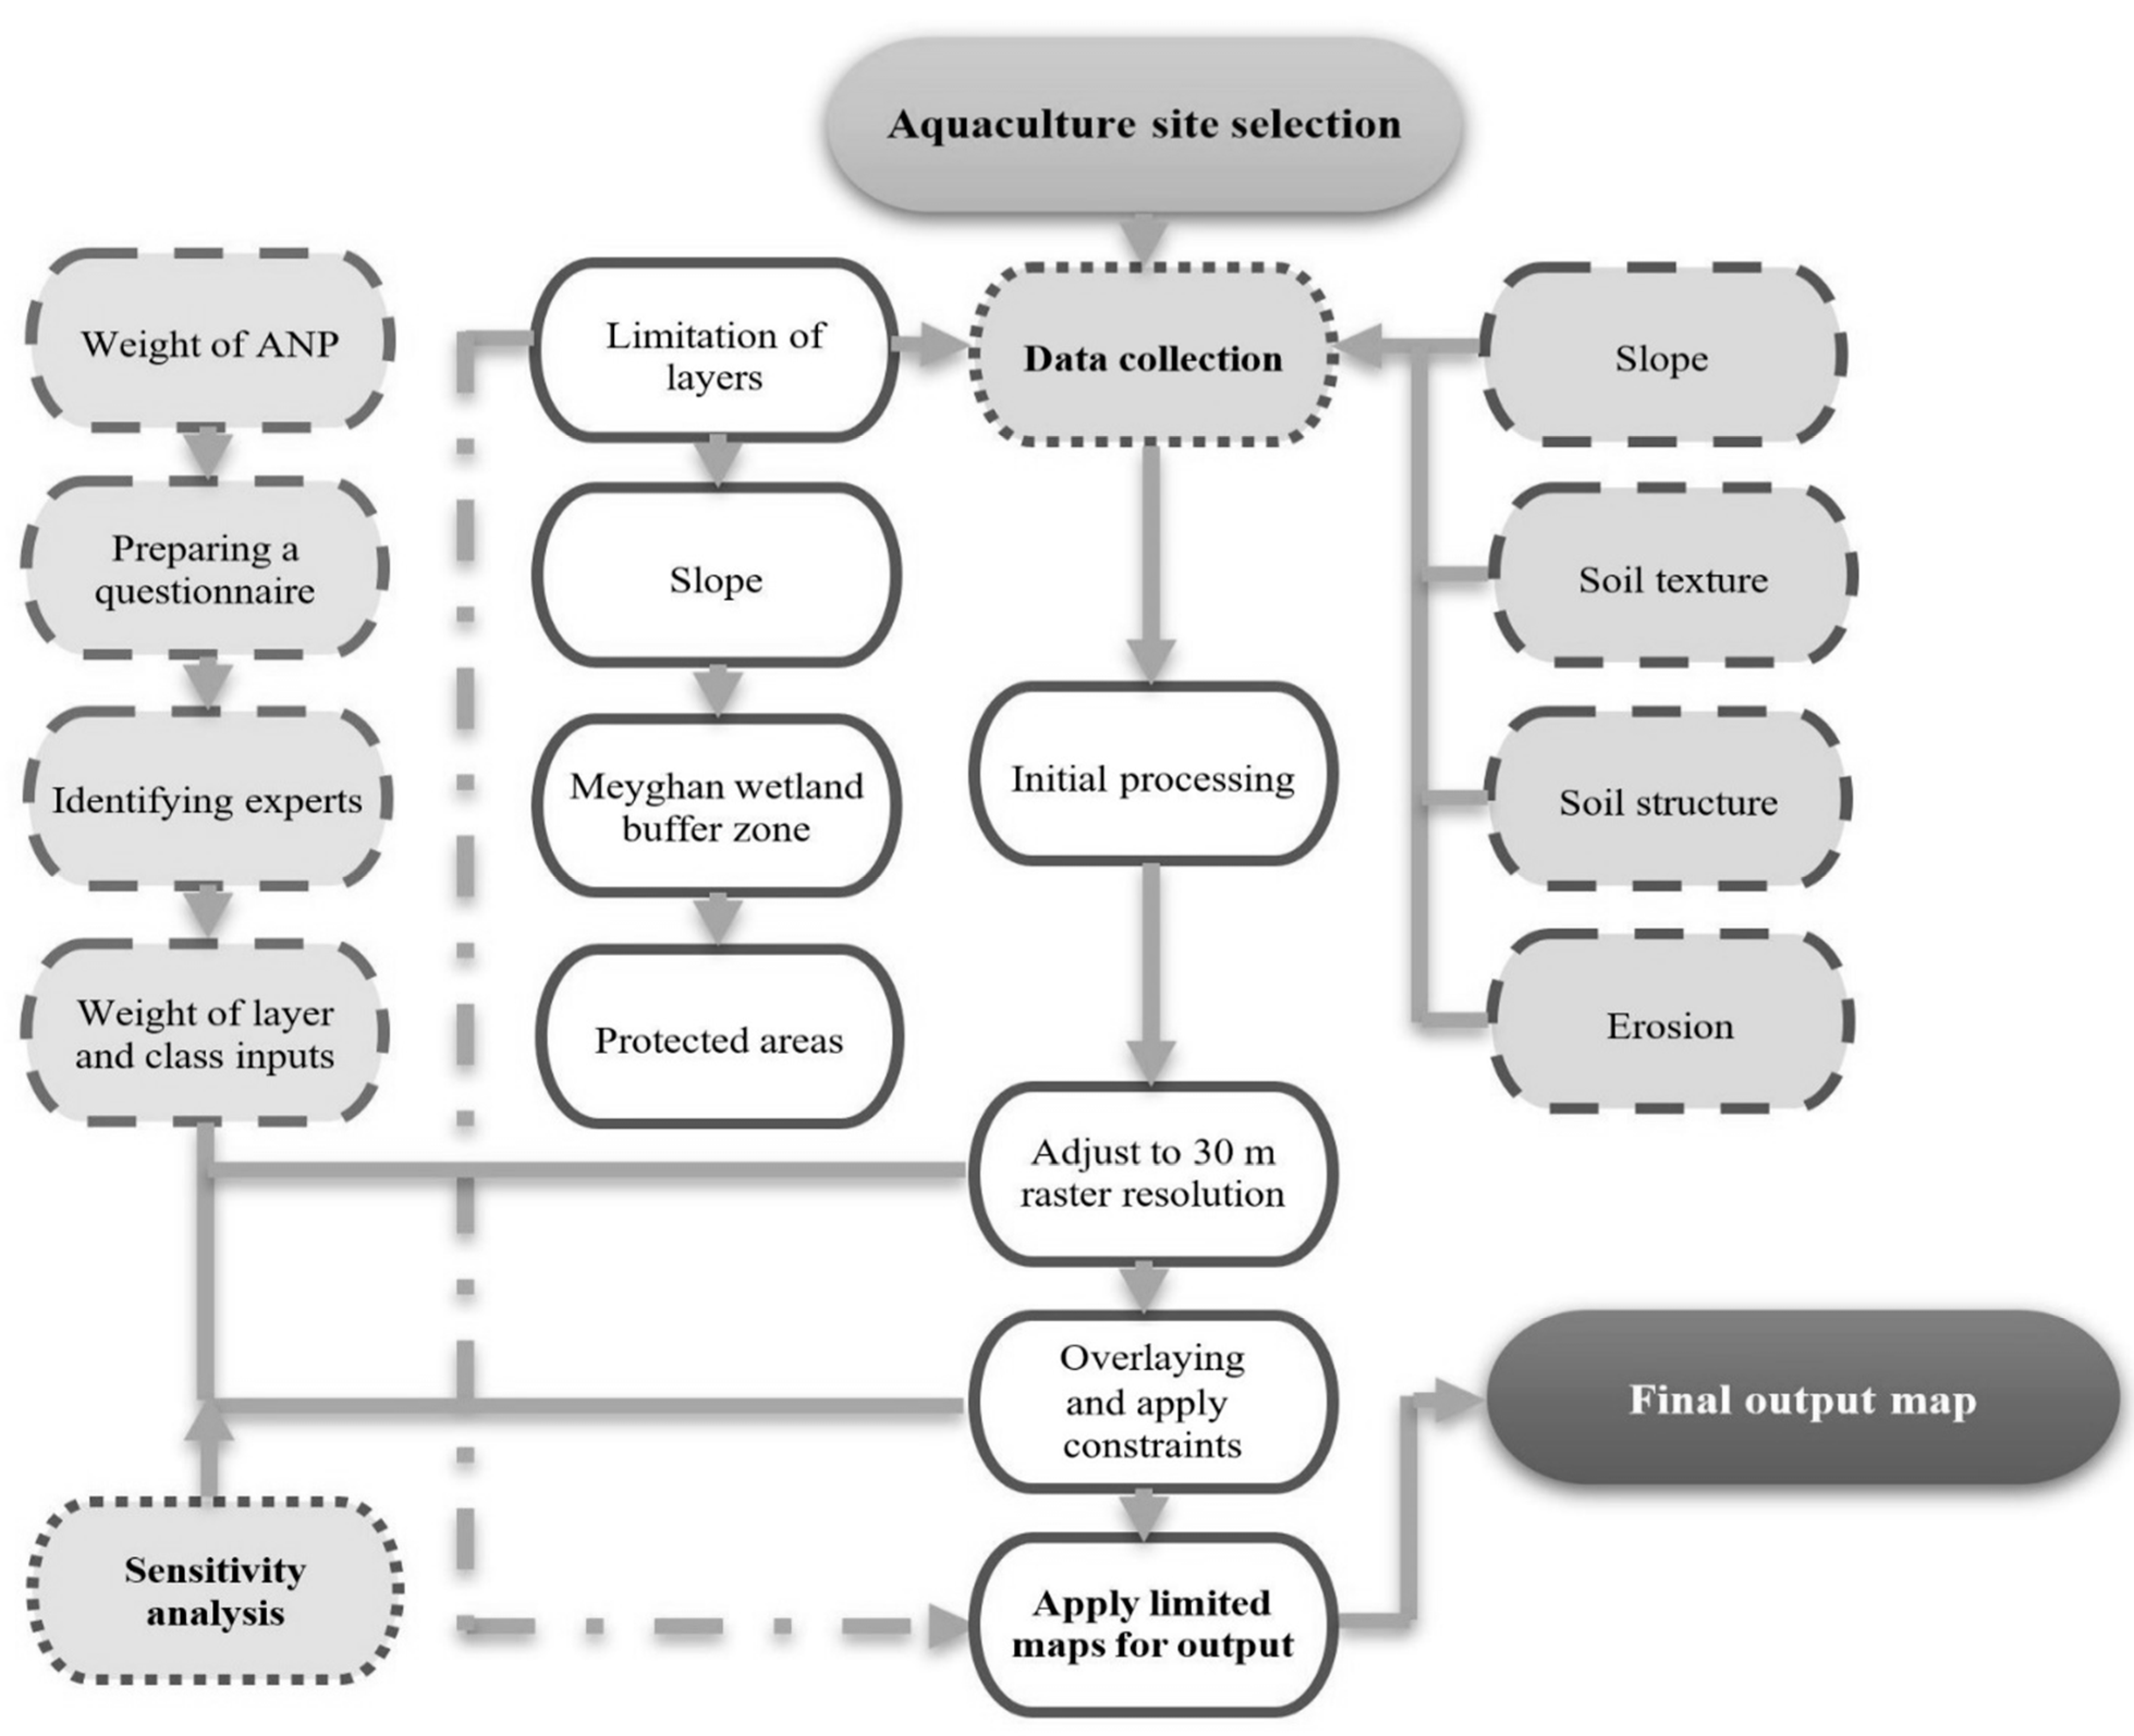
2.2. Methods
2.3. Determining Criteria
2.4. Analytical Process
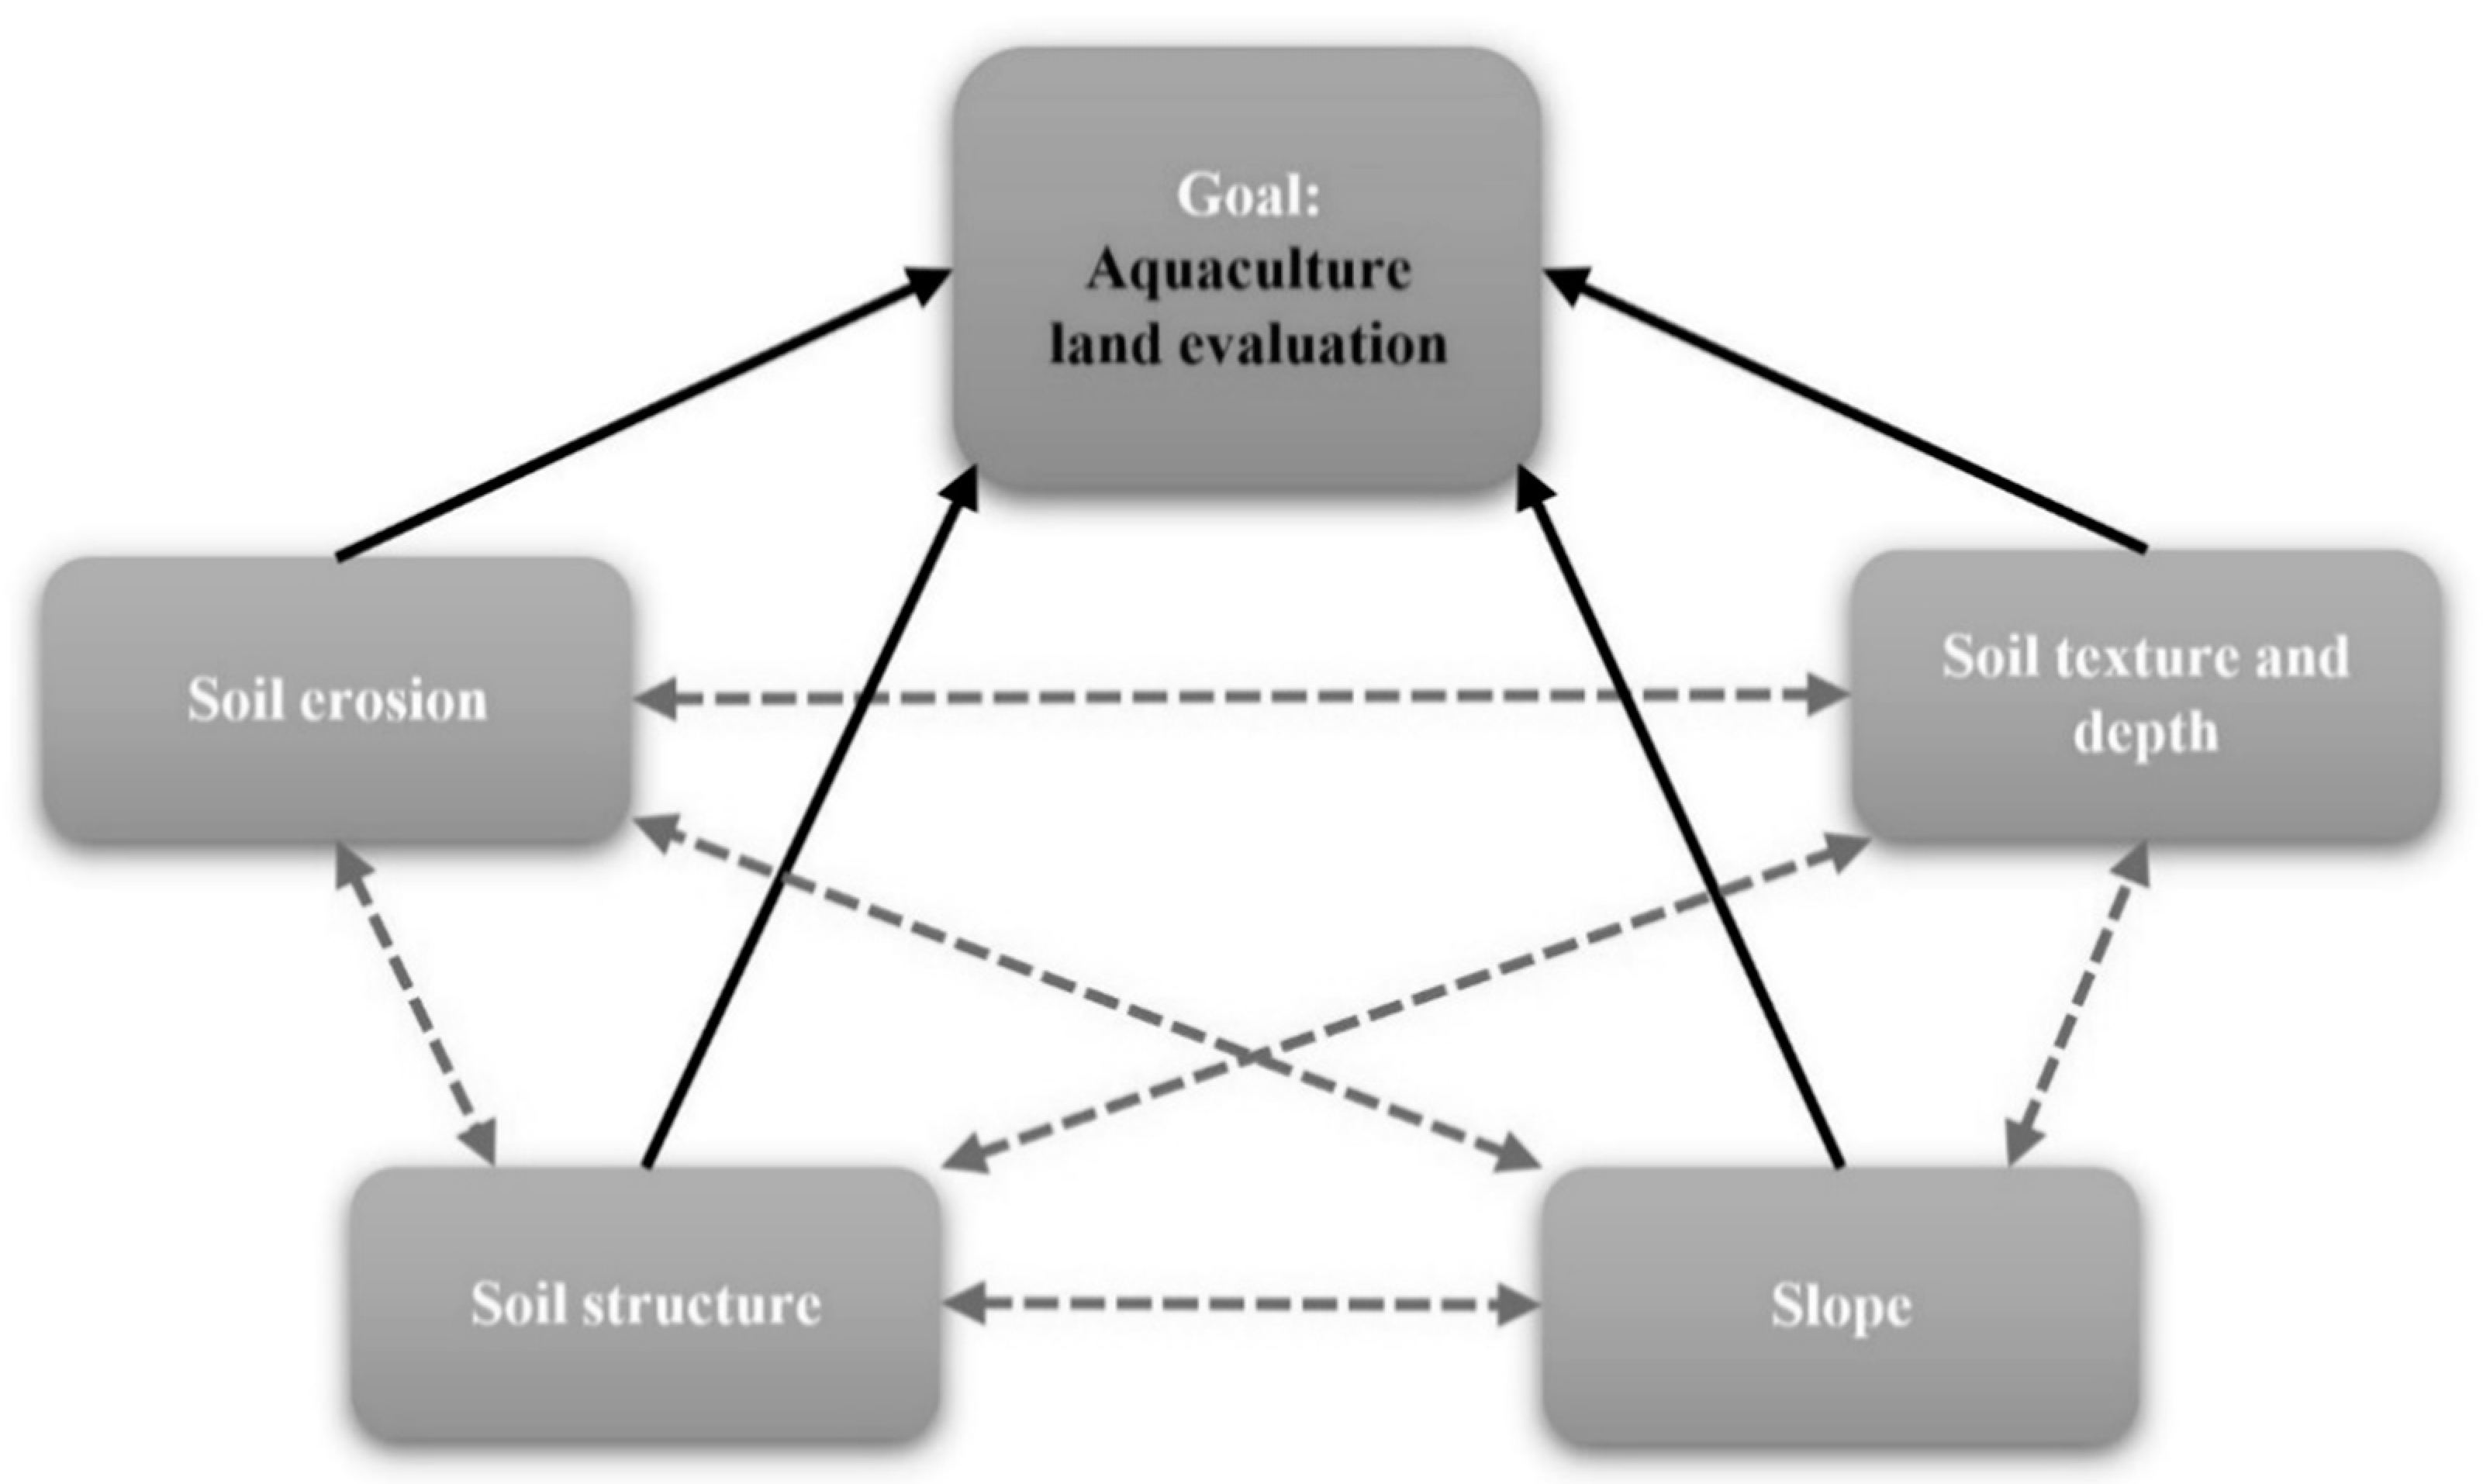
- Step 1. Show the significance and value of the factors based on the criteria. Utilize pairwise comparison to consider the impact of each element versus other elements. Conceptually, an example of the pairwise comparison used to evaluate the suitability of land in can be seen in Figure 4.
- Step 2. Scale sub-factors of the elements. To compare elements in each cluster, scales in discrete intervals are chosen (i.e., 1–9 where scale 9 shows the absolute significance of an element in comparison with others and scale 1 shows the equal significance of the elements). Note the indicates the importance of the th element with respect to the th element [72,73].
- Step 3. Calculate the super matrix that is partitioned and based on the cluster (i.e., factors) and its elements (i.e., from the pairwise comparison). The super matrix, i.e., Equation (2), consists of clusters is presented as follows:where: = the th cluster (i.e., = 1, 2, …, ) and each cluster consists of items displayed by , , …, . Each column of = the priority vector acquired from the identical pairwise comparison, indicating the significance of the elements in the th cluster with respect to an element in the th cluster.
- Step 4. Compute the weight of the super matrix by multiplying the matrix by priority factors, creating a limited super matrix, and raising the weighted super matrix to the appropriate limit. The limited super matrix is obtained using Equation (3).where: = weighted super matrix, = element, and = limit of the function.
3. Results
4. Discussion and Conclusions
Supplementary Materials
Author Contributions
Funding
Institutional Review Board Statement
Informed Consent Statement
Data Availability Statement
Acknowledgments
Conflicts of Interest
References
- Belton, B.; Little, D.C.; Zhang, W.; Edwards, P.; Skladany, M.; Thilsted, S.H. Farming fish in the sea will not nourish the world. Nat. Commun. 2020, 11, 5804. [Google Scholar] [CrossRef] [PubMed]
- FAO. Fishery and Aquaculture Statistics; Food and Agriculture Organization of the United Nations: Rome, Italy, 2018. [Google Scholar]
- Naylor, R.L.; Hardy, R.W.; Buschmann, A.H.; Bush, S.R.; Cao, L.; Klinger, D.H.; Little, D.C.; Lubchenco, J.; Shumway, S.E.; Troell, M. A 20-year retrospective review of global aquaculture. Nature 2021, 591, 551–563. [Google Scholar] [CrossRef] [PubMed]
- Vaz, L.; Sousa, M.C.; Gomez-Gesteira, M.; Dias, J.M. A habitat suitability model for aquaculture site selection: Ria de Aveiro and Rias Baixas. Sci. Total Environ. 2021, 801, 149687. [Google Scholar] [CrossRef] [PubMed]
- Charisiadou, S.; Halling, C.; Jiddawi, N.; von Schreeb, K.; Gullström, M.; Larsson, T.; Nordlund, L.M. Coastal aquaculture in Zanzibar. Tanzania. Aquac. 2022, 546, 737331. [Google Scholar] [CrossRef]
- Jing, Z.; Ningning, Z.; Zaki, S.; Yong, L.; Jun, M.; Yanan, L. Effects of dietary lipid and protein levels on growth and physiological metabolism of Pelteobagrus fulvidraco larvae under recirculating aquaculture system (RAS). Aquaculture 2018, 495, 458–464. [Google Scholar]
- Hossain, M.S.; Das, N.G. GIS-based multi-criteria evaluation to land suitability modelling for giant prawn (Macrobrachium rosenbergii) farming in Companigonj Upazila of Noakhali, Bangladesh. Comput. Electron Agric. 2010, 70, 172–186. [Google Scholar] [CrossRef]
- De Novaes Vianna, L.F.; Bonetti Filho, J. Spatial analysis for site selection in marine aquaculture: An ecosystem approach applied to Baía Sul, Santa Catarina, Brazil. Aquaculture 2018, 489, 162–174. [Google Scholar] [CrossRef]
- FAO; World Bank. Aquaculture Zoning, Site Selection and Area Management under the Ecosystem Approach to Aquaculture a Handbook; Food and Agriculture Organization of the United Nations: Rome, Italy, 2017. [Google Scholar]
- Brugère, C.; Aguilar-Manjarrez, J.; Beveridge, M.C.M.; Soto, D. The ecosystem approach to aquaculture 10 years on—A critical review and consideration of its future role in blue growth. Rev. Aquac. 2019, 11, 493–514. [Google Scholar] [CrossRef] [Green Version]
- Rikalovic, A.; Cosic, I.; Lazarevic, D. GIS Based Multi-Criteria Analysis for Industrial Site Selection. 24th DAAAM International Symposium on Intelligent Manufacturing and Automation, 2013. Procedia Eng. 2014, 69, 1054–1063. [Google Scholar] [CrossRef] [Green Version]
- Chao, L.; Yanbing, J.; Ernesto, D.R.S.G.; Peiwu, D.; Aihua, W. The waste-to-energy incineration plant site selection based on hesitant fuzzy linguistic Best-Worst method ANP and double parameters TOPSIS approach: A case study in China. Energy 2020, 211, 118564. [Google Scholar]
- Li, Y.; Wang, Y.; Gao, X.; Xie, T.; Hai, R.; Zhang, X. Multi-criteria Evaluation Method for Site Selection of Industrial Wastewater Discharge in Coastal Regions. J. Clean. Prod. 2017, 161, 1143–1152. [Google Scholar] [CrossRef]
- Nayak, A.K.; Pant, D.; Kumar, P.; Mahanta, P.C.; Pandey, N.N. GIS-based aquaculture site suitability study using multi-criteria evaluation approach. Indian J. Fish 2014, 61, 108–112. [Google Scholar]
- Ghobadi, M.; Nasri, M.; Ahmadipari, M. Land suitability assessment (LSA) for aquaculture site selection via an integrated GIS-DANP multi-criteria method; a case study of lorestan province, Iran. Aquaculture 2021, 530, 735776. [Google Scholar] [CrossRef]
- ESRI. ArcGIS Desktop. Environmental Systems Research Institute Web. 2011. Available online: https://desktop.arcgis.com/en/arcmap (accessed on 12 June 2020).
- Nath, S.S.; Bolte, J.P.; Ross, L.G.; Aguilar-Manjarrez, J. Applications of geographical information systems (GIS) for spatial decision support in aquaculture. Aquacult. Eng. 2000, 23, 233–278. [Google Scholar] [CrossRef]
- Dapueto, G.; Massa, F.; Costa, S.; Cimoli, L.; Olivari, E.; Chiantore, M.; Federici, B.; Povero, P. A spatial multi-criteria evaluation for site selection of offshore marine fish farm in the Ligurian Sea, Italy. Ocean Coast. Manag. 2015, 116, 64–77. [Google Scholar] [CrossRef]
- Yin, S.; Takeshige, A.; Miyake, Y.; Kimura, S. Selection of suitable coastal aquaculture sites using Multi-Criteria Decision Analysis in Menai Strait, UK. Ocean. Coast. Manag. 2018, 165, 268–279. [Google Scholar] [CrossRef]
- Kapetsky, J.M.; Aguilar-Manjarrez, J. Geographic Information Systems, remote sensing and mapping for the development and management of marine aquaculture. In Fisheries and Aquaculture Technical Paper 458; FAO: Rome, Italy, 2007. [Google Scholar]
- Aguilar-Manjarrez, J.; Kapetsky, J.M.; Soto, D. The potential of spatial planning tools to support the ecosystem approach to aquaculture. FAO/Rome Expert Workshop. 19–21 November 2008, Rome, Italy. In FAO Fisheries and Aquaculture Proceedings; No. 17; FAO: Rome, Italy, 2010; 176p. [Google Scholar]
- Meaden, G.J.; Aguilar-Manjarrez, J. (Eds.) Advances in Geographic Information Systems and Remote Sensing for Fisheries and Aquaculture, Summary Version; Food and Agriculture Organization of the United Nations: Rome, Italy, 2013. [Google Scholar]
- Ross, L.G.; Mendoza, Q.M.E.A.; Beveridge, M.C.M. The application of geographical information systems to site selection for coastal aquaculture: An example based on salmonid cage culture. Aquaculture 2013, 112, 165–178. [Google Scholar] [CrossRef]
- Khamis, A.; Khatib, T.; Yosliza, N.A.H.M.; Azmi, A.N. Optimal selection of renewable energy installation site in remote areas using segmentation and regional technique: A case study of Sarawak, Malaysia. Sustain. Energy Technol. Assess. 2020, 42, 100858. [Google Scholar] [CrossRef]
- Malczewski, J. GIS-based land-use suitability analysis: A critical overview. Prog. Plan. 2004, 62, 3–65. [Google Scholar] [CrossRef]
- Diaz, H.; Soares, C.G. An integrated GIS approach for site selection of floating offshore wind farms in the Atlantic continental European coastline. Renew. Sustain. Energy Rev. 2020, 134, 110328. [Google Scholar] [CrossRef]
- Izadikhah, M.; Saen, R.F. A new preference voting method for sustainable location planning using geographic information system and data envelopment analysis. J. Clean. Prod. 2016, 137, 1347–1367. [Google Scholar] [CrossRef]
- El-Gayar, O.F.; Leung, P.S. A multiple criteria decision-making framework for regional aquaculture development. European J. Oper. Res. 2001, 133, 462–482. [Google Scholar] [CrossRef]
- Martinez-Cordero, F.J.; Leung, P.S. Multi-criteria Decision making (MCDM) Model for regional sustainable shrimp farming development in northwest Mexico. Aquac. Econ. Manag. 2004, 8, 179–192. [Google Scholar] [CrossRef]
- Hasala, D.; Supak, S.; Rivers, L. Green infrastructure site selection in the Walnut Creek wetland community: A case study from southeast Raleigh, North Carolina. Landsc. Urban Plan. 2020, 196, 103743. [Google Scholar] [CrossRef]
- Wiltshire, K.H.; Tanner, J.E. Comparing maximum entropy modelling methods to inform aquaculture site selection for novel seaweed species. Ecol. Model. 2020, 429, 109071. [Google Scholar] [CrossRef]
- Venier, C.; Menegon, S.; Possingham, H.P.; Gissi, E.; Zanella, A.; Depellegrin, D.; Sarretta, A.; Barbanti, A.; McGowan, J. Multi-objective zoning for aquaculture and biodiversity. Sci. Total Environ. 2021, 785, 146997. [Google Scholar] [CrossRef]
- Hadipour, A.; Vafaie, F.; Hadipour, V. Land suitability evaluation for brackish water aquaculture development in coastal area of Hormozgan, Iran. Aquac. Int. 2014, 23, 329–343. [Google Scholar] [CrossRef]
- Buitrago, J.; Rada, M.; Hernandez, H.; Buitrago, E. A single-use site selection technique, using GIS, for aquaculture planning, choosing locations for mangrove oyster raft culture in Margarita Island, Venezuela. Environ. Manag. 2005, 35, 544–556. [Google Scholar] [CrossRef]
- Silva, C.; Ferreira, J.G.; Bricker, S.B.; Delvalls, T.A.; Martín-Díaz, M.L.; Yañez, E. Site selection for shellfish aquaculture by means of GIS and farm-scale models, with an emphasis on data-poor environments. Aquaculture 2011, 318, 444–457. [Google Scholar] [CrossRef]
- Radiarta, I.N.; Saitoh, S.I.; Miyazono, A. GIS-based multi-criteria evaluation models for identifying suitable sites for Japanese scallop (Mizuhopecten yessoensis) aquaculture in Funka Bay, southwestern Hokkaido, Japan. Aquaculture 2008, 284, 127–135. [Google Scholar] [CrossRef]
- Micael, J.; Costa, A.C.; Aguiar, P.; Medeiros, A.; Calado, H. Geographic information system in a multi-criteria tool for mariculture site selection. Coast Manag. 2015, 43, 52–66. [Google Scholar] [CrossRef]
- Liu, Y.; Saitoh, S.-I.; Radiarta, I.N.; Isada, T.; Hirawake, T.; Mizuta, H.; Yasui, H. Improvement of an aquaculture site-selection model for Japanese kelp (Saccharina japonica) in southern Hokkaido, Japan: An application for the impacts of climate events. ICES J. Mar. Sci. 2013, 70, 1460–1470. [Google Scholar] [CrossRef] [Green Version]
- Aguilar-Manjarrez, J.; Ross, L.G. Geographical information systems (GIS), environmental models for aquaculture development in Sinaloa state, Mexico. Aquac. Int. 1995, 3, 103–115. [Google Scholar] [CrossRef]
- Arnold, W.S.; White, M.W.; Norris, H.A.; Berrigan, M.E. Hard clam (Mercenaria spp.) aquaculture in Florida, USA: Geographic information system applications to lease site selection. Aquac. Eng. 2000, 23, 203–231. [Google Scholar] [CrossRef]
- Calle Yunis, C.R.; Salas López, R.; Cruz, S.M.O.; Barboza Castillo, E.; Silva López, J.O.; Iliquín Trigoso, D.; Briceño, N.B.R. Land Suitability for Sustainable Aquaculture of Rainbow Trout (Oncorhynchus mykiss) in Molinopampa (Peru) Based on RS, GIS, and AHP. ISPRS Int. J. Geo-Inf. 2020, 9, 28. [Google Scholar] [CrossRef] [Green Version]
- Karthik, M.; Suri, J.; Saharan, N.; Biradar, R.S. Brackish water aquaculture site selection in Palghar Taluk, Thane district of Maharashtra, India, using the techniques of remote sensing and geographical information system. Aquac. Eng. 2005, 32, 285–302. [Google Scholar] [CrossRef]
- Mcleod, I.; Pantus, F.; Preston, N. The use of a geographical information system for land-based aquaculture planning. Aquac. Res. 2002, 33, 241–250. [Google Scholar] [CrossRef]
- Giap, D.H.; Yi, Y.; Yakupitiyage, A. GIS for land evaluation for shrimp farming in Haiphong of Vietnam. Ocean Coast Manag. 2005, 48, 51–63. [Google Scholar] [CrossRef]
- Perez, O.M.; Telfer, T.; Glenn Ross, L. Use of GIS-Based Models for Integrating and Developing Marine Fish Cages within the Tourism Industry in Tenerife (Canary Islands). J. Coast. Manag. 2003, 31, 355–366. [Google Scholar] [CrossRef]
- Perez, O.M.; Telfer, T.; Glenn Ross, L. Geographical information systems-based models for offshore floating marine fish cage aquaculture site selection in Tenerife, Canary Islands. Aquac. Res. 2005, 36, 946–961. [Google Scholar] [CrossRef]
- Radiarta, I.N.; Saitoh, S.I. Biophysical models for Japanese scallop, Mizuhopecten yessoensis, aquaculture site selection in Funka Bay, Hokkaido, Japan, using remotely sensed data and geographic information system. Aquac. Int. 2009, 17, 403–419. [Google Scholar] [CrossRef]
- Salam, M.A.; Lindsay, G.R.; Beveridge, M.C.M. A comparison of development opportunities for crab and shrimp aquaculture in south-western Bangladesh, using GIS modeling. Aquaculture 2003, 220, 477–494. [Google Scholar] [CrossRef]
- Hossain, M.S.; Chowdhury, S.R.; Das, N.G.; Sharifuzzaman, S.M.; Sultana, A. Integration of GIS and multicriteria decision analysis for urban aquaculture development in Bangladesh. Landsc. Urban Plan 2009, 90, 119–133. [Google Scholar] [CrossRef]
- Hossain, M.S.; Chowdhury, S.R.; Das, N.G.; Rahaman, M.M. Multi criteria evaluation approach to GIS-based land suitability classification for tilapia farming in Bangladesh. Aquac. Int. 2007, 15, 425–443. [Google Scholar] [CrossRef]
- Assefa, W.W.; Abebe, W.B. GIS modeling of potentially suitable sites for aquaculture development in the lake tana basin, Northwest Ethiopia. Agric. Food Secur. 2018, 7, 72. [Google Scholar] [CrossRef] [Green Version]
- Nayak, A.K.; Kumar, P.; Pant, D.; Mohanty, R.K. Land suitability modelling for enhancing fishery resource development in central Himalayas (India) using GIS and multi-criteria evaluation approach. Aquac. Eng. 2018, 83, 120–129. [Google Scholar] [CrossRef]
- Esmaeilpour-Poodeh, S.; Ghorbani, R.; Hosseini, S.A.; Salmanmahiny, A.; Rezaei, H.; Kamyab, H. A multi-criteria evaluation method for sturgeon farming site selection in the southern coasts of the Caspian Sea. Aquaculture 2019, 513, 734416. [Google Scholar] [CrossRef]
- Vafaie, F.; Hadipour, A.; Hadipour, V. GIS-based fuzzy multi-criteria decision-making model for coastal aquaculture site selection. Environ. Eng. Manag. J. 2012, 14, 2415–2425. [Google Scholar] [CrossRef]
- Mousavi, S.H.; Danehkar, A.; Shokri, M.R.; Poorbagher, H.; Azhdari, D. Site selection for artificial reefs using a new combine multi-criteria decision-making (MCDM) tool for coral reefs in the kish island—Persian Gulf. Ocean Coast Manag. 2015, 111, 92–102. [Google Scholar] [CrossRef]
- Mahalakshmi, P.; Panigrahi, A.; Ravisankar, T.; Kumar, J.A.; Shanthi, B. Multi criteria decision making for identification of optimal location for aquaculture development. Int. J. Adv. Sci. Eng. Technol. 2014, 2, 11–14. [Google Scholar]
- Vergara-Solana, F.; Araneda, M.E.; Ponce-Díaz, G. Opportunities for strengthening aquaculture industry through multicriteria decision-making. Rev. Aquac. 2019, 11, 105–118. [Google Scholar] [CrossRef] [Green Version]
- Villacreses, G.; Gaona, G.; Martínez-Gómez, J.; Jijón, D.J. Wind farms suitability location using geographical information system (GIS), based on multi-criteria decision making (MCDM) methods: The case of continental Ecuador. Renew. Energy 2017, 109, 275–286. [Google Scholar] [CrossRef]
- Teniwut, W.A.; Marimin, M.; Djatna, T. GIS-based multi-criteria decision-making model for site selection of seaweed farming information centre: A lesson from small islands, Indonesia. Decis. Sci. Lett. 2019, 8, 137–150. [Google Scholar] [CrossRef]
- Markazi Province Meteorological Organization. Climatic Data of Meteorological Station of Markazi Province from 1991 to 2018. 2020. Available online: http://www.markazimet.ir/Index.aspx?tempname=MainEng&lang=2&sub=0 (accessed on 10 July 2020).
- Google Earth. Google Earth Website. 2022. Available online: https://earth.google.com/web/ (accessed on 15 January 2022).
- Makhdoum, M.F. Fundamental of Land Use Planning, 15th ed.; University of Tehran Press: Tehran, Iran, 2015. [Google Scholar]
- Mehrdad, M.; Oakes, B.J.; Saraoglu, M.; Morozov, A.; Janschek, K.; Denil, J. Exploring Fault Parameter Space Using Reinforcement Learning-based Fault Injection. In Proceedings of the 50th Annual IEEE/IFIP International Conference on Dependable Systems and Networks Workshops (DSN-W), Valencia, Spain, 29 June–2 July 2020. [Google Scholar] [CrossRef]
- Aghmashhadi, A.H.; Azizi, A.; Hoseinkhani, M.; Zahedi, S.; Cirella, G.T. Industrial park land capability assessment and post evaluation in Markazi province. Appl. Geomat. 2021. [Google Scholar] [CrossRef]
- Malmir, M.; Kheirkhah Zarkesh, M.; Monavari, S. Analysis of land suitability for urban development in Ahwaz County in southwestern Iran using fuzzy logic and analytic network process (ANP). Environ. Monit. Assess. 2016, 188, 1–23. [Google Scholar] [CrossRef] [PubMed]
- Seyedmohammadi, J.; Sarmadian, F.; Jafarzadeh, A.A.; McDowell, R.W. Integration of ANP and Fuzzy set techniques for land suitability assessment based on remote sensing and GIS for irrigated maize cultivation. Arch. Agron. Soil Sci. 2019, 65, 1063–1079. [Google Scholar] [CrossRef]
- Aragonés-Beltrán, P.; Chaparro-González, F.; Pastor-Ferrando, J.P.; Rodríguez-Pozo, F. An ANP-based approach for the selection of photovoltaic solar power plant investment projects. Renew. Sustain. Energy Rev. 2010, 14, 249–264. [Google Scholar] [CrossRef]
- Kuei-Lun, C.; Sen-Kuei, L.; Tzeng-Wei, T.; Chi-Yi, L. An ANP based TOPSIS approach for Taiwanese service apartment location selection. Asia Pac. Manag. Rev. 2015, 20, 49–55. [Google Scholar]
- Zarei, M.; Fatemi, M.R.; Mortazavi, M.S.; Pouebrahim, S.; Ghoddousi, J. Selection of the optimal tourism site using the ANP and fuzzy TOPSIS in the framework of Integrated Coastal Zone Management: A case of Qeshm Island. Ocean. Coast. Manag. 2016, 130, 179–187. [Google Scholar]
- Arsic, S.; Nikolic, D.; Zivkovic, Z. Hybrid SWOT—ANP—FANP model for prioritization strategies of sustainable development of ecotourism in National Park Djerdap, Serbia. For. Policy Econ. 2017, 80, 11–26. [Google Scholar] [CrossRef]
- Yunna, W.; Buyuan, Z.; Chuanbo, X.; Lingwenying, L. Site selection decision framework using fuzzy ANP-VIKOR for large commercial rooftop PV system based on sustainability perspective. Sustain. Cities Soc. 2018, 40, 454–470. [Google Scholar]
- Saaty, T.L. Decision Making with Dependence and Feedback: The Analytic Network Process: The Organization and Prioritization of Complexity; RWS Publications: Pittsburgh, PA, USA, 1996. [Google Scholar]
- Saaty, T.L. The Analytic Network Process. Decision Making with the Analytic Network Process: Economic, Political, Social and Technological Applications with Benefits, Opportunities, Costs and Risks; Saaty, T.L., Vargas, L.G., Eds.; Springer: New York, NY, USA, 2006; pp. 1–26. [Google Scholar]
- Department of Environment. Rules and Regulations for the Establishment of Production, Industrial and Mining Units; Office of Environmental Assessment, Deputy of Human Environment, Iranian Department of Environment: Tehran, Iran, 2019.
- Ramadhini, M.; Sihombing, A.R. Utilization of Geographic Information System (GIS) in Determining the Suitability of Fisheries Locations Cultivation of Freshwater Fishponds in South Aceh Regency. J. Inotera 2018, 3, 81. [Google Scholar] [CrossRef]
- Hemmatyar, A.H.; Asad, A.; Kalantari, K.H. Sustainability Study of Groundwater Sources for Rainbow Trout Farming in Sardasht County, Using Geographic Information Systems (GIS) and Multi—Criteria Decision Making (MCDM). Research 2011, 2, 1–5. [Google Scholar]
- Gholifar, E.; Abbasi, E.; Pezeshki Rad, G.; Salehi, H.; Rezaei, A. Development and Validation of Sustainable Aquaculture Indicators: Case of Alborz Dam Basin, Mazandaran, Iran. Int. J. Agric. Manag. Dev. (IJAMAD) 2016, 7, 191–199. [Google Scholar]
- Statistical Center of Iran. Markazi Province Statistical Yearbook; Iran Data Portal: Tehran, Iran, 2015. [Google Scholar]


| Raw | Layer | Reference | Year of Dataset Layer |
|---|---|---|---|
| 1 | Political areas of the country and province | Iran National Cartographic Center | 2016 |
| 2 | Digital elevation model (DEM) | DEM Shuttle Radar Topography Mission with 30 m raster resolution | 2020 |
| 3 | Slope | DEM data obtained from ArcGIS | 2020 |
| 4 | Soil texture | Office of Planning and Budget Organization, Markazi province | 2009 |
| 5 | Soil structure | Office of Planning and Budget Organization, Markazi province | 2009 |
| 6 | Soil erosion layer | Office of Agriculture Organization at Jahad, Markazi province | 2012 |
| 7 | Wetland and environmentally sensitive areas | Department of Environment, Markazi province | 2020 |
| Raw | Layer | Properties | |||||||||
|---|---|---|---|---|---|---|---|---|---|---|---|
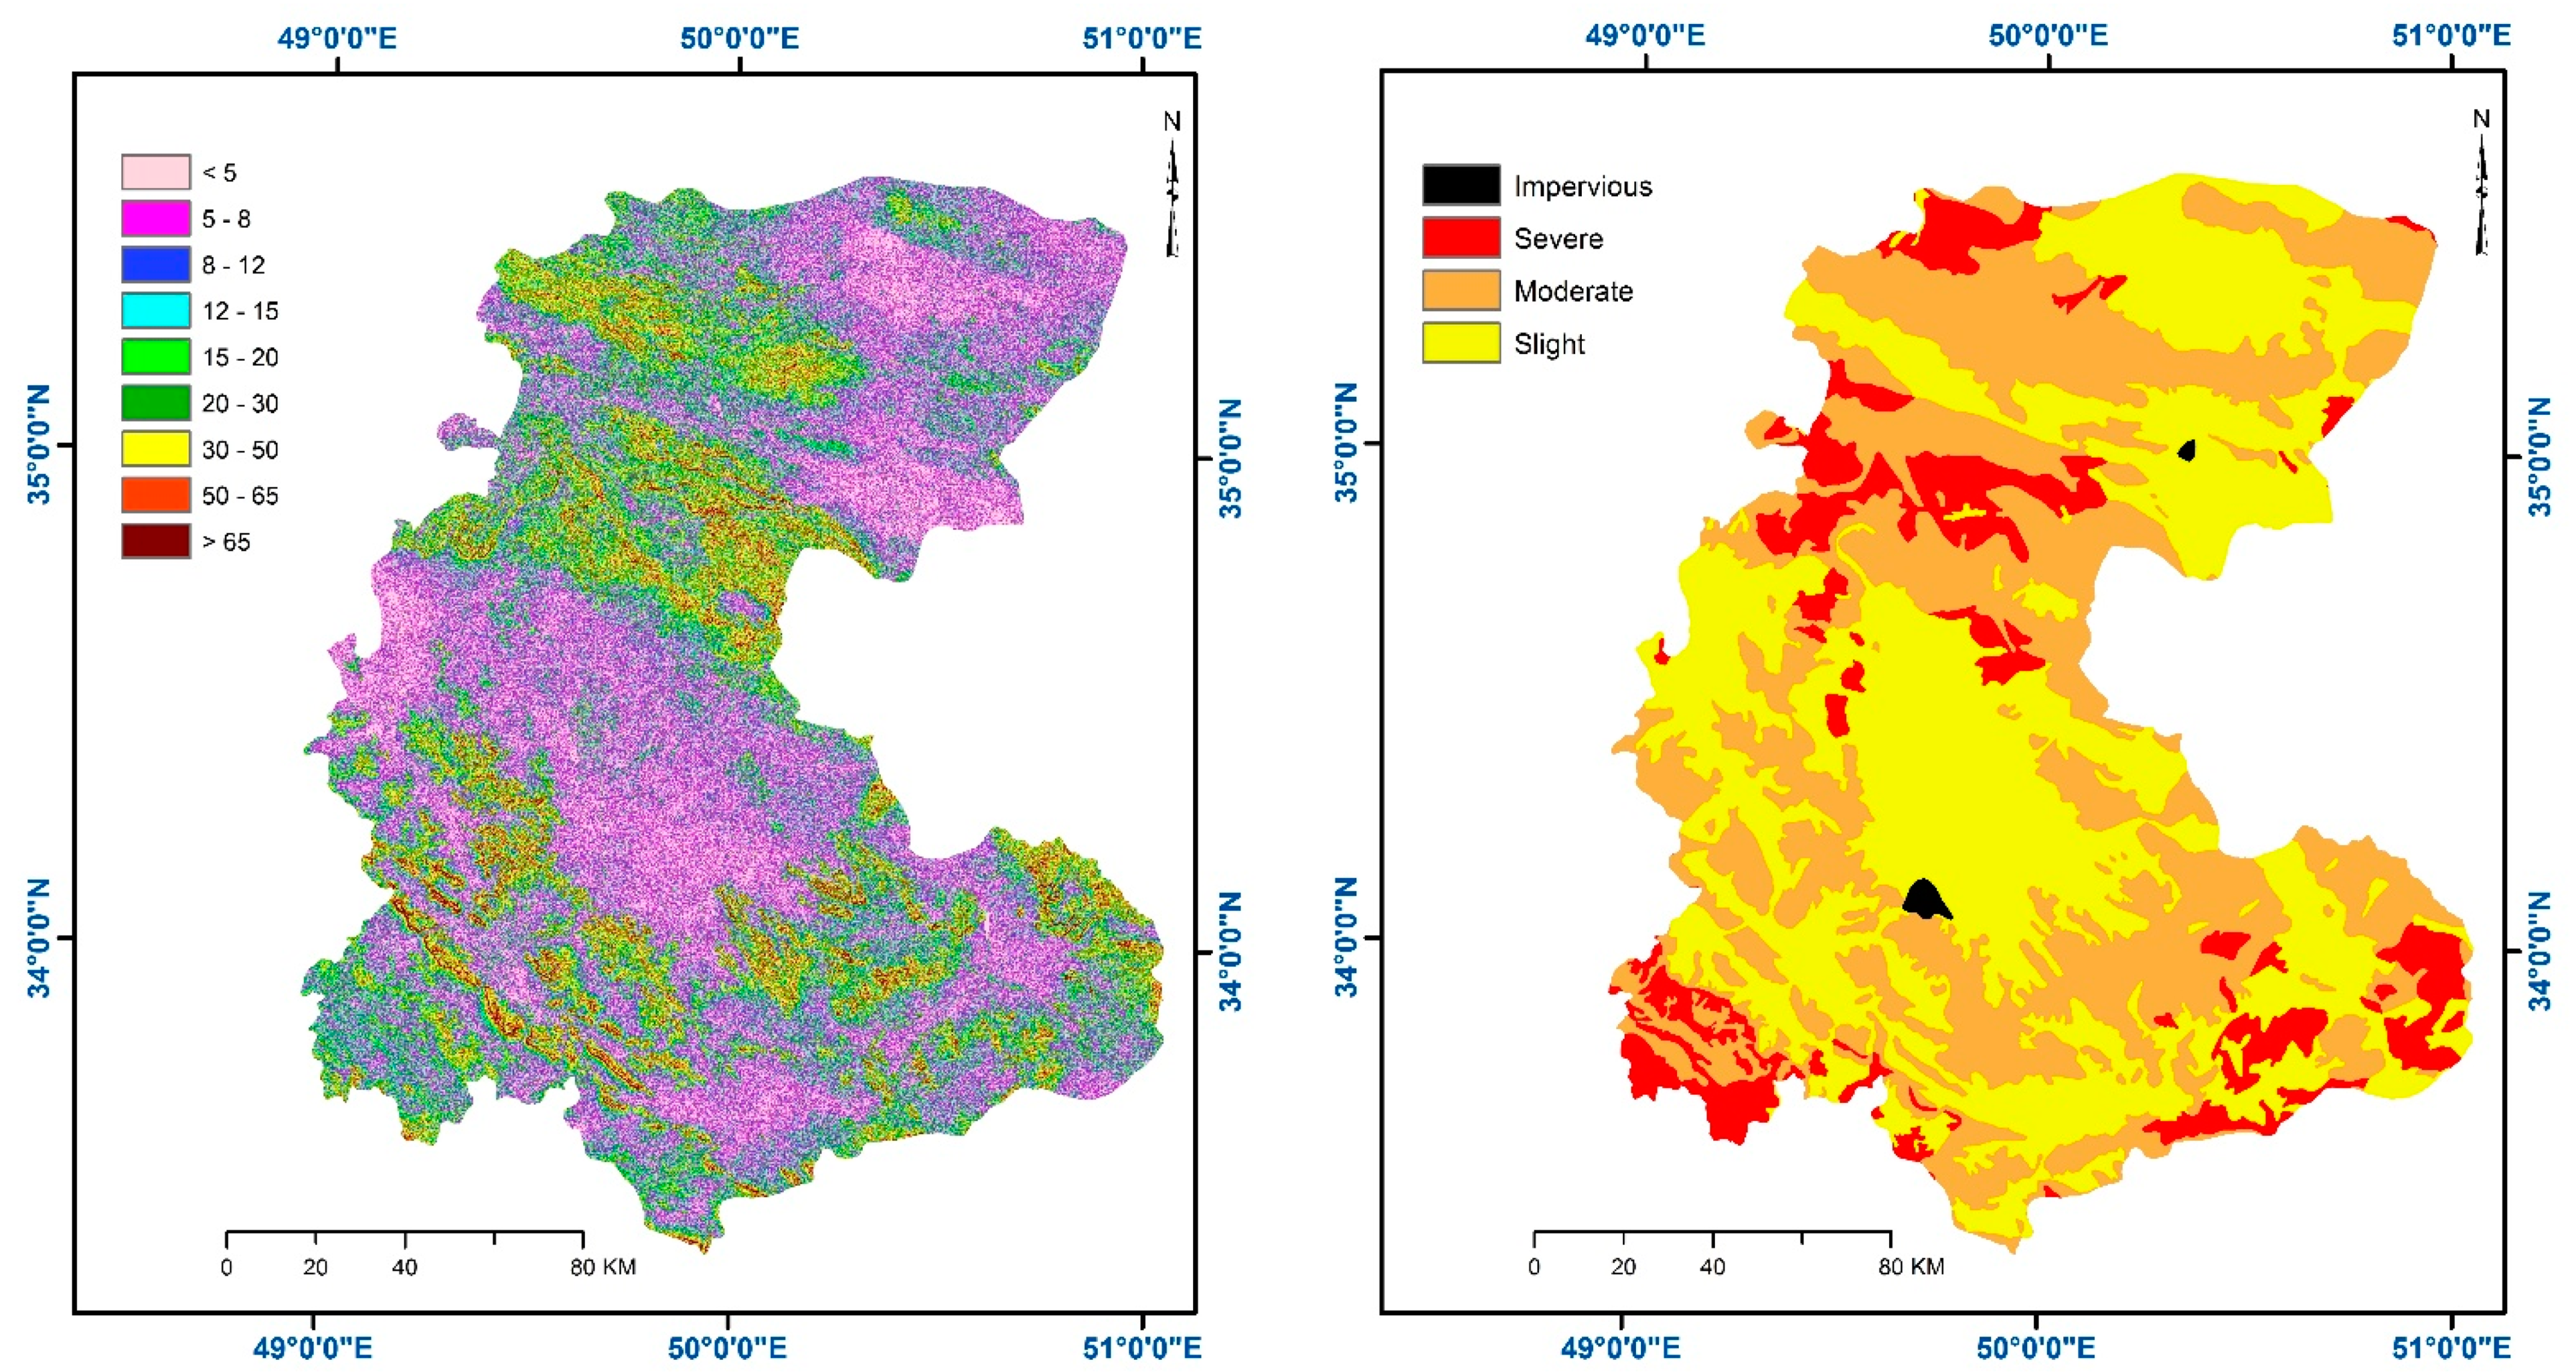
| 1 | Slope (%) | Class | 0–5 | 5–8 | 8–12 | 12–15 | 15–20 | 20–30 | 30–50 | 50–65 | >65 |
| Weight | 0.325 | 0.233 | 0.165 | 0.111 | 0.078 | 0.059 | 0.048 | 0.036 | 0.026 | ||
| 2 | Soil erosion | Class | Low | Medium | High | ||||||
| Weight | 0.670 | 0.201 | 0.129 | ||||||||
| 3 | Soil texture and depth | Class | Deep loam clay | Semi-deep sandy loam clay | Semi-deep clay loam | Deep sandy | Shallow sandy | Shallow sandy loam | Semi-deep sandy loam | Semi-deep loam clay | |
| Weight | 0.331 | 0.231 | 0.156 | 0.106 | 0.071 | 0.048 | 0.033 | 0.024 | |||
| 4 | Soil structure | Class | Fine-grained sediment | Semi-transformed | Flooded soil | Frost soil | Flat and calcareous | Low-transformed | Without evolution and rocky | Without evolution and coarse texture | Often salty |
| Weight | 0.313 | 0.223 | 0.152 | 0.108 | 0.074 | 0.051 | 0.036 | 0.025 | 0.018 | ||
| Raw | Layer | Limitation |
|---|---|---|
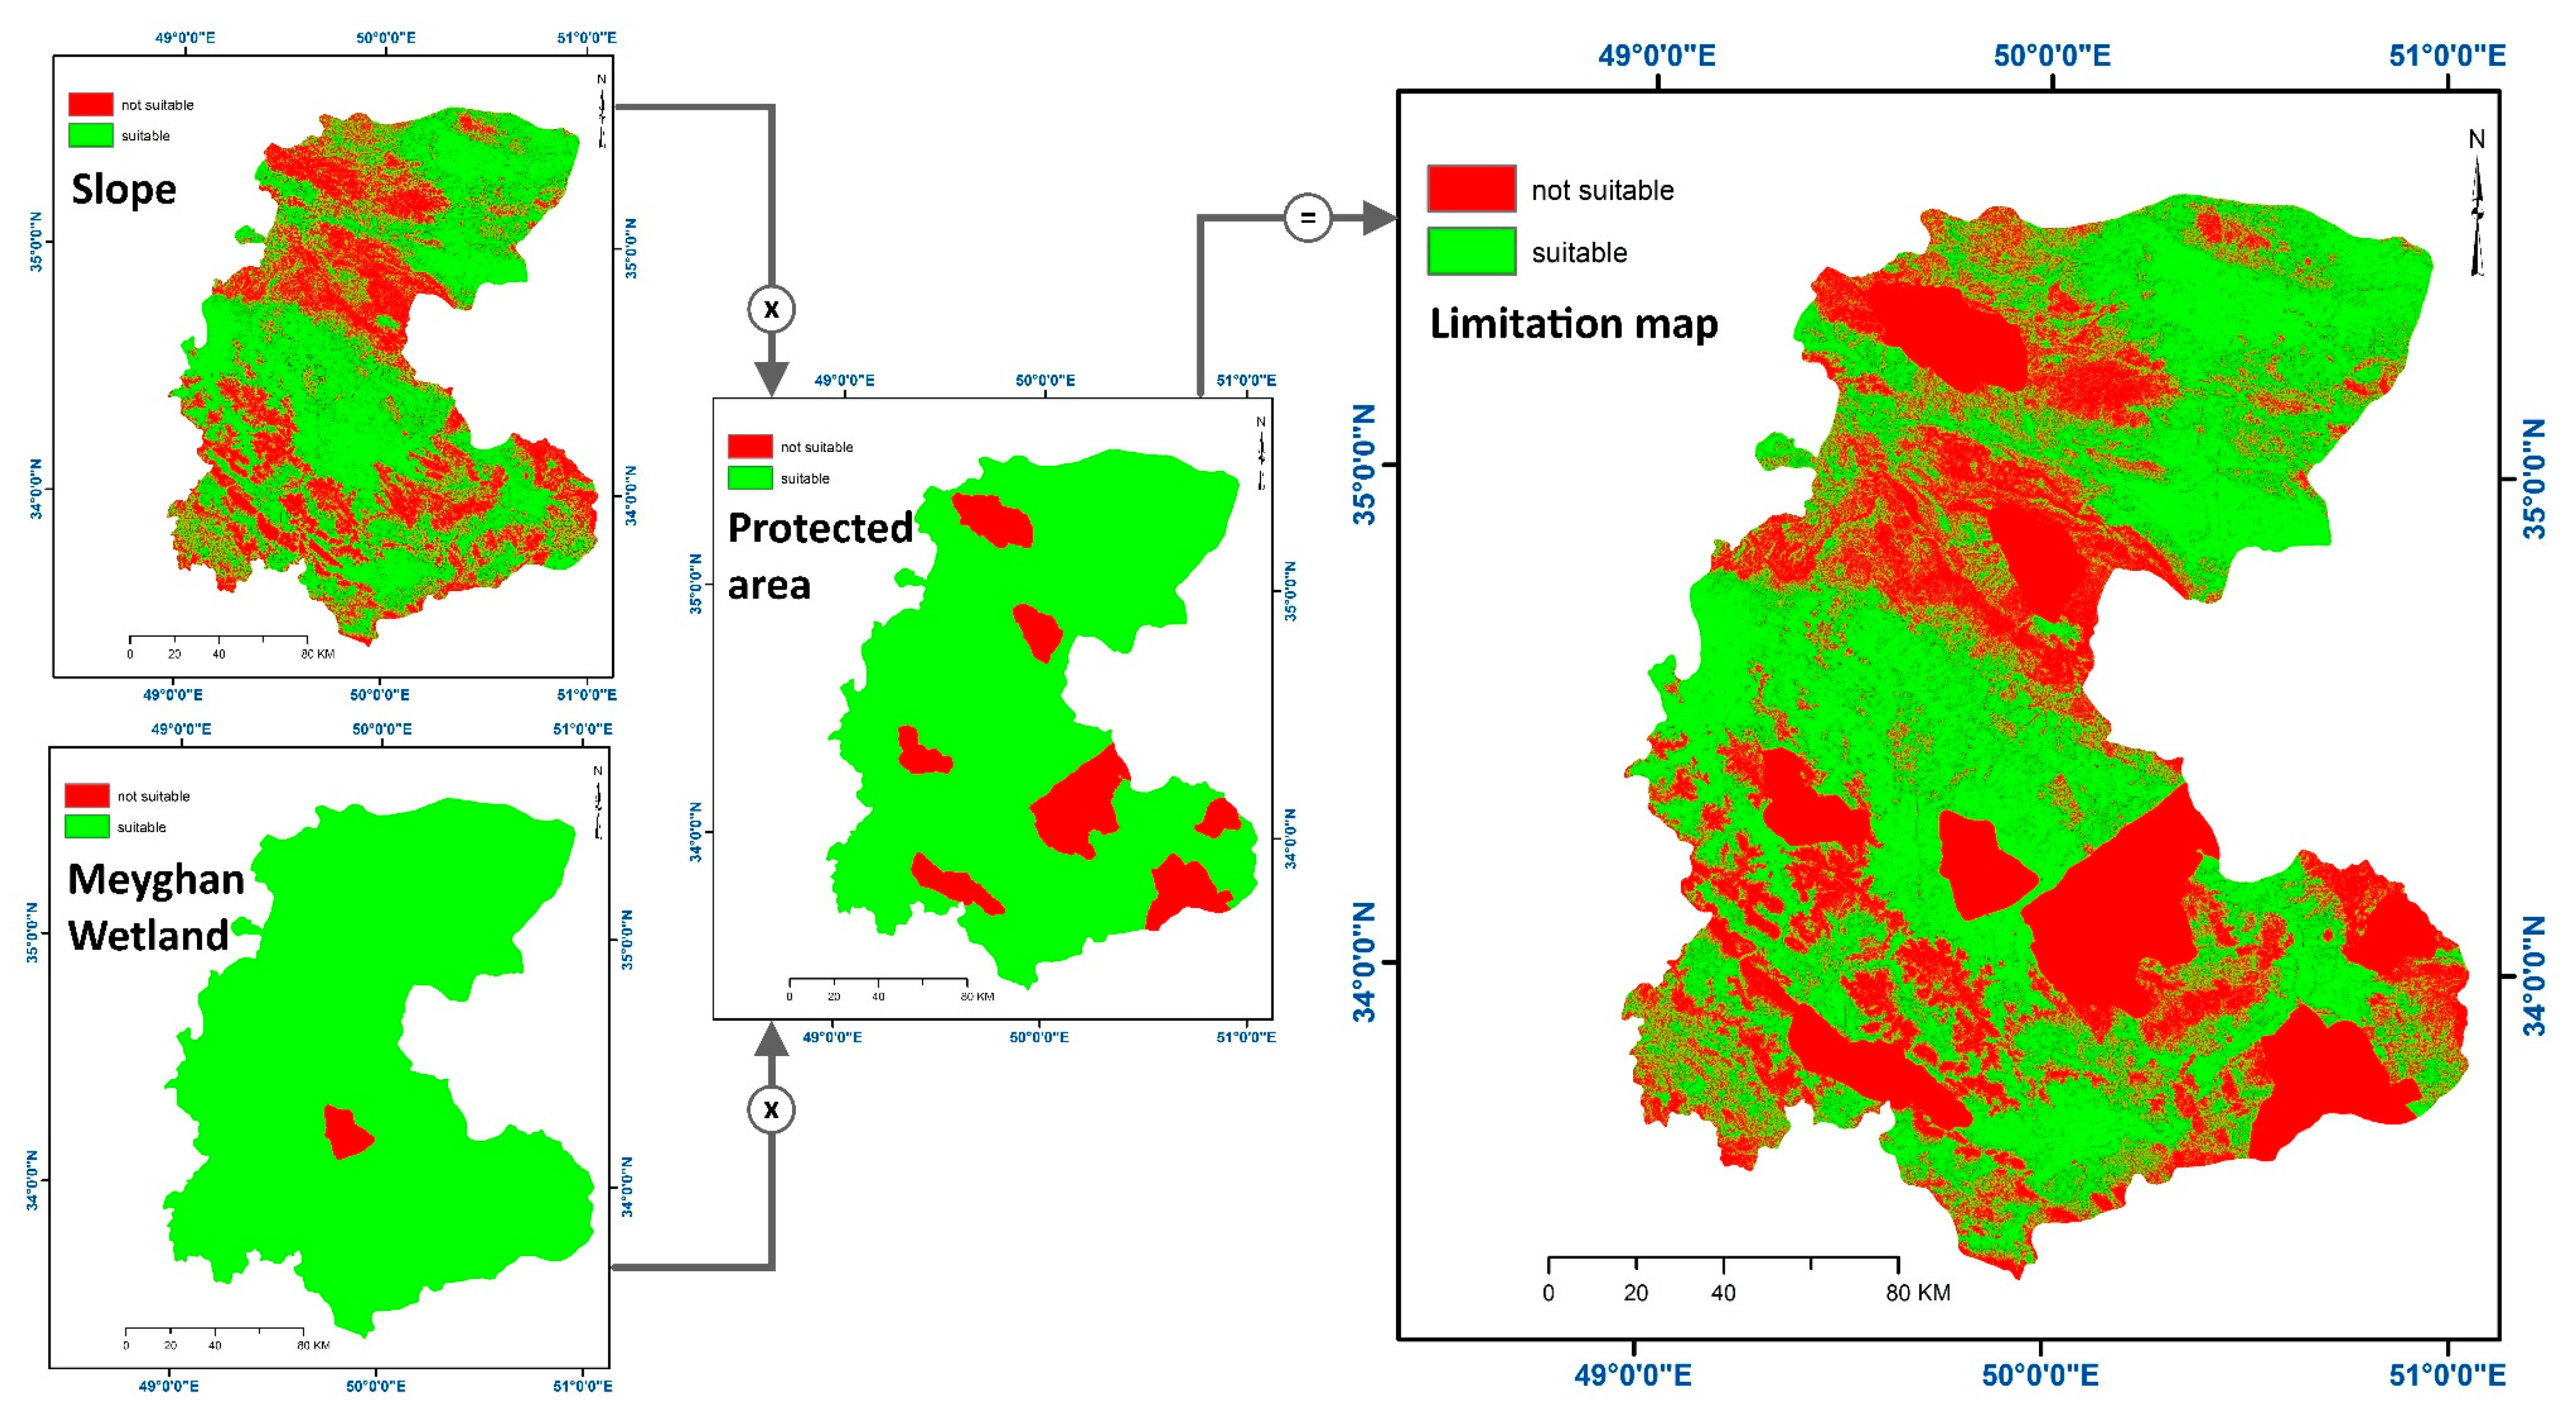
| 1 | Slope (%), Makhdoum (2015) | 15 |
| 2 | Protected area, Makhdoum (2015) | Protected area |
| 3 | Meyghan Wetland buffer zone (m), Department of Environment [74] | 1500 |
| Land Potential | Area (Ha) | Area (%) |
|---|---|---|
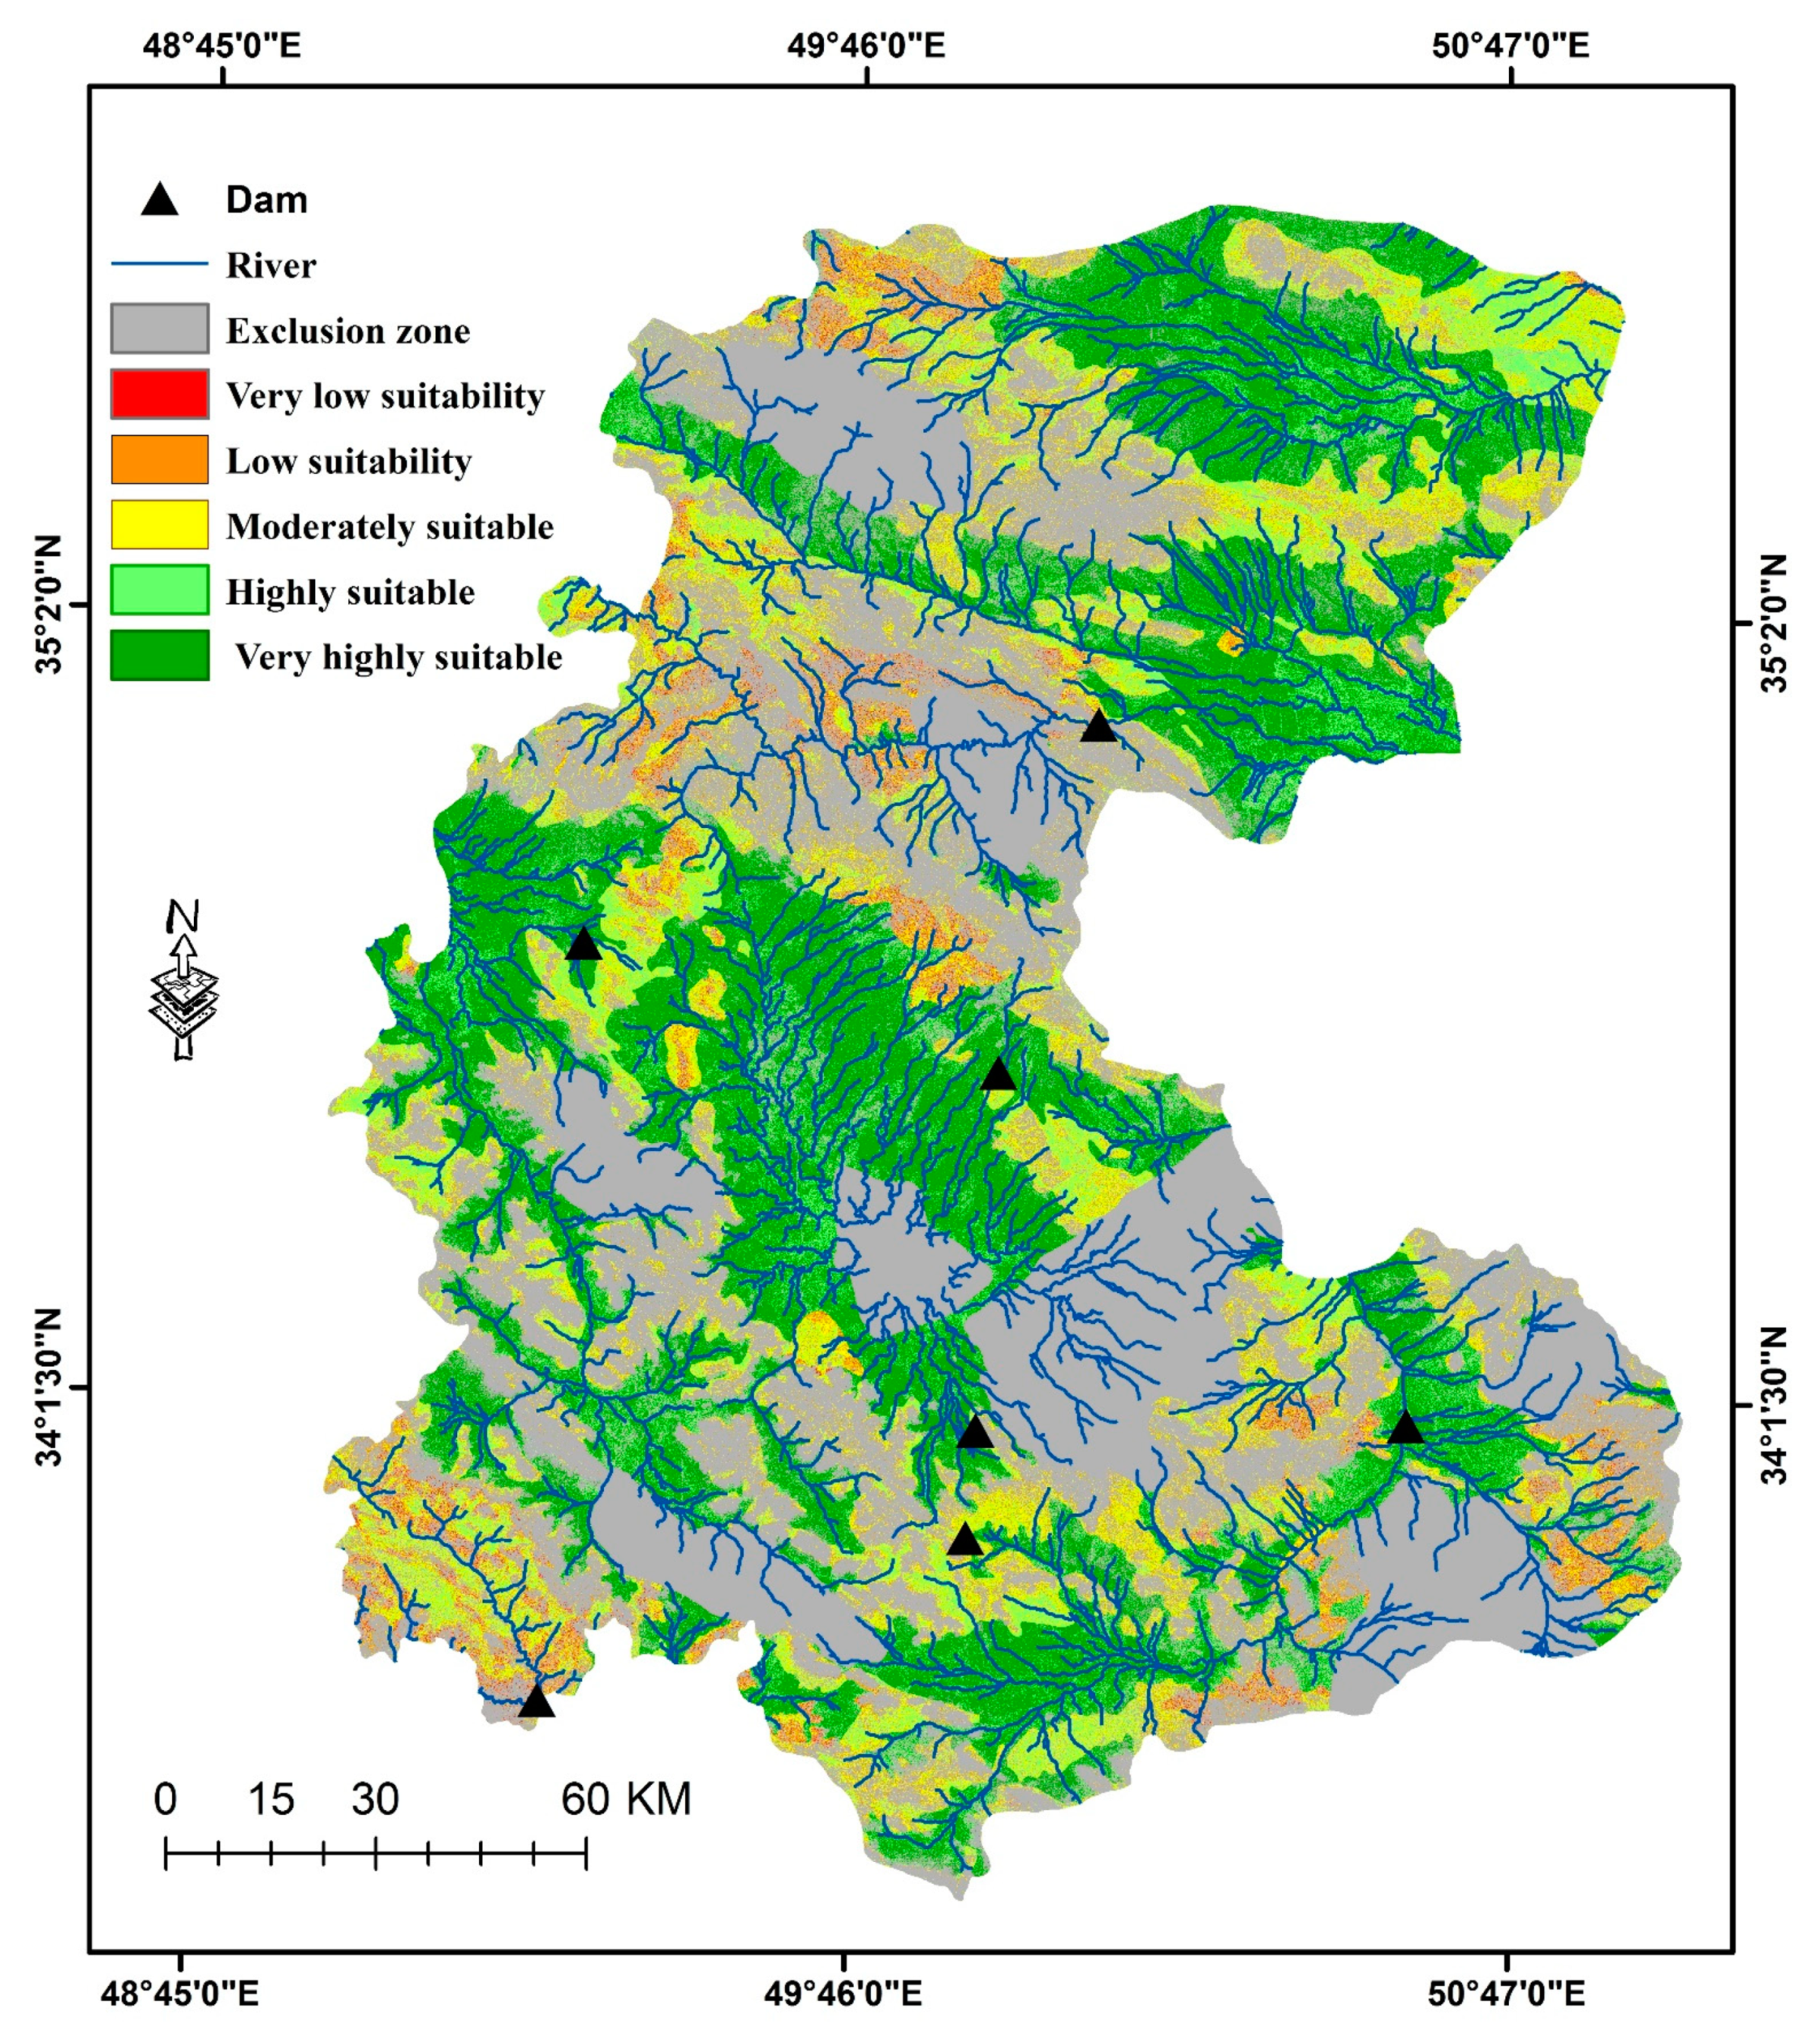
| Exclusion Zone | 1,275,062 | 43.8 |
| Very low suitability | 19,968 | 0.69 |
| Low suitability | 109,950 | 3.78 |
| Moderately suitable | 320,076 | 10.99 |
| Highly suitable | 402,943 | 13.84 |
| Very highly suitable | 784,656 | 26.95 |
| Interval | Criteria | |||
|---|---|---|---|---|
| Increase by 10% | Slope | Soil erosion | ||
| slope | 0.469 | slope | 0.440 | |
| soil erosion | 0.260 | soil erosion | 0.280 | |
| soil structure | 0.142 | soil structure | 0.142 | |
| soil texture and depth | 0.138 | soil texture and depth | 0.138 | |
| Soil structure | Soil texture and depth | |||
| slope | 0.441 | slope | 0.441 | |
| soil erosion | 0.260 | soil erosion | 0.260 | |
| soil structure | 0.160 | soil structure | 0.142 | |
| soil texture and depth | 0.138 | soil texture and depth | 0.156 | |
| Decrease by 10% | Slope | Soil erosion | ||
| slope | 0.440 | slope | 0.452 | |
| soil erosion | 0.269 | soil erosion | 0.260 | |
| soil structure | 0.147 | soil structure | 0.146 | |
| soil texture and depth | 0.143 | soil texture and depth | 0.142 | |
| Soil structure | Soil texture and depth | |||
| slope | 0.451 | slope | 0.451 | |
| soil erosion | 0.266 | soil erosion | 0.266 | |
| soil structure | 0.142 | soil structure | 0.146 | |
| soil texture and depth | 0.141 | soil texture and depth | 0.138 | |
Publisher’s Note: MDPI stays neutral with regard to jurisdictional claims in published maps and institutional affiliations. |
© 2022 by the authors. Licensee MDPI, Basel, Switzerland. This article is an open access article distributed under the terms and conditions of the Creative Commons Attribution (CC BY) license (https://creativecommons.org/licenses/by/4.0/).
Share and Cite
Aghmashhadi, A.H.; Azizi, A.; Hoseinkhani, M.; Zahedi, S.; Cirella, G.T. Aquaculture Site Selection of Oncorhynchus Mykiss (Rainbow Trout) in Markazi Province Using GIS-Based MCDM. ISPRS Int. J. Geo-Inf. 2022, 11, 157. https://doi.org/10.3390/ijgi11030157
Aghmashhadi AH, Azizi A, Hoseinkhani M, Zahedi S, Cirella GT. Aquaculture Site Selection of Oncorhynchus Mykiss (Rainbow Trout) in Markazi Province Using GIS-Based MCDM. ISPRS International Journal of Geo-Information. 2022; 11(3):157. https://doi.org/10.3390/ijgi11030157
Chicago/Turabian StyleAghmashhadi, Amir H., Ali Azizi, Maryam Hoseinkhani, Samaneh Zahedi, and Giuseppe T. Cirella. 2022. "Aquaculture Site Selection of Oncorhynchus Mykiss (Rainbow Trout) in Markazi Province Using GIS-Based MCDM" ISPRS International Journal of Geo-Information 11, no. 3: 157. https://doi.org/10.3390/ijgi11030157
APA StyleAghmashhadi, A. H., Azizi, A., Hoseinkhani, M., Zahedi, S., & Cirella, G. T. (2022). Aquaculture Site Selection of Oncorhynchus Mykiss (Rainbow Trout) in Markazi Province Using GIS-Based MCDM. ISPRS International Journal of Geo-Information, 11(3), 157. https://doi.org/10.3390/ijgi11030157