Article

Impact of Land Use/Land Cover Change on Landslide Susceptibility in Rangamati Municipality of Rangamati District, Bangladesh

1
Department of Geography, University of Tennessee, Knoxville, TN 37916, USA
2
Department of Engineering, Wake Forest University, Winston-Salem, NC 27101, USA
3
Department of Geography and Environment, University of Dhaka, Dhaka 1000, Bangladesh
4
Department of Geography, Texas A&M University, College Station, TX 77843, USA
*
Author to whom correspondence should be addressed.
ISPRS Int. J. Geo-Inf. 2022, 11(2), 89; https://doi.org/10.3390/ijgi11020089
Submission received: 15 November 2021 / Revised: 21 January 2022 / Accepted: 23 January 2022 / Published: 27 January 2022

Abstract

:
Landslide susceptibility depends on various causal factors such as geology, land use/land cover (LULC), slope, and elevation. Unlike other factors that are relatively stable over time, LULC is a dynamic factor associated with human activities. This study evaluates the impact of LULC change on landslide susceptibility in the Rangamati municipality of Rangamati district, Bangladesh, based on three LULC scenarios—the existing (2018) LULC, the proposed LULC (proposed in 2010, but not yet implemented), and the simulated LULC of 2028—using artificial neural network (ANN)-based cellular automata. The random forest model was used for landslide susceptibility mapping. The model showed good accuracy for all three LULC scenarios (existing: 82.7%; proposed: 81.4%; and 2028: 78.3%) and strong positive correlations (>0.8) between different landslide susceptibility maps. LULC is either the third or fourth most important factor in these scenarios, suggesting that is has a moderate impact on landslide susceptibility. Future LULC changes will likely increase landslide susceptibility, with up to 14.5% increases in the high susceptibility zone for both the proposed and simulated LULC scenarios. These findings may help policymakers carry out proper urban planning and highlight the importance of considering landslide susceptibility in LULC planning.

1. Introduction

Landslides cause damage to infrastructure and casualties worldwide. As a representation of the spatial probability of landslides over an area [1,2], landslide susceptibility mapping is critical to mitigating landslide disasters [3,4,5]. Landslide susceptibility maps are produced using landslide inventory and causal factors [6,7,8]. Landslide inventory shows the locations of landslides, while landslide casual factors create suitable conditions for landslides [4,9]. Various statistical and machine learning models, including logistic regression, linear discriminant analysis, random forest, support vector machines, decision tree, extreme gradient boosting (XGBoost), frequency ratio, and certainty factor, have been used for landslide susceptibility mapping [7,9,10,11,12,13,14,15,16,17]. These models explore the relationships between landslide occurrences and causal factors to determine the spatial probability over the area [8,18,19]. Simple statistical models such as logistic regression, frequency ratio, and certainty factor can produce easily understandable results with satisfactory accuracy [9,20]. However, advanced machine learning models such as random forest and artificial neural networks (ANN) usually produce much higher accuracy, but less interpretability [21].
Landslide causal factors can be categorized into geological factors, including lithology and distance from the fault lines; physiographic factors such as slope, aspect, plan curvature, and profile curvature; and environmental factors such as land use/land cover (LULC) and distance from a river [22]. Geological and physiological factors are generally considered static because they are relatively stable. In contrast, environmental factors, particularly LULC, are dynamic [19]. Different LULC types have different impacts on landslides. For example, vegetation usually stabilizes a slope because tree roots hold the soil together. Therefore, removing vegetation can create a conducive condition for landslides [19]. Similarly, as in road construction, infrastructural development alters slopes and causes landslides [23].
Several studies have assessed the impact of LULC change on landslide susceptibility [19,24,25,26,27,28,29]. Primarily associated with agricultural activities, deforestation increases the weathering and erosion processes and ultimately increases the landslide susceptibility of an area [30]. Chen et al. (2019) [26] assessed the impact of LULC on landslide susceptibility based on decade-wise LULC maps. Reichenbach et al. (2014) [19] evaluated the effects of different LULC scenarios on the landslide susceptibility in the Briga catchment of Messina, Italy. However, these studies used different LULC scenarios for the assessment without considering the role of the LULC trend of change on landslide susceptibility. Meneses et al. (2019) [27] evaluated the effects of two different LULC maps on landslide susceptibility. Their main aim was to assess the effect of the quality of LULC on landslide susceptibility. Liu et al. (2021) [29] assessed the impact of LULC change on landslide susceptibility over 38 years in Lixian county, China. This study suggests that landslide susceptibility increases in agricultural land and rural and urban construction lands, indicating the impact of anthropogenic activities on landslide susceptibility.
In recent days, machine learning methods have been used to simulate LULC change and the transitional potential of LULC types [31,32,33]. The simulated LULC has been considered the business as usual (BAU) scenario, reducing subjectivity [19,30,34]. At the same time, LULC planning has been adopted to minimize the effects of natural hazards. Although it is generally assumed that planned LULC mitigates the impacts of natural hazards, few studies have evaluated the impact of a planned LULC on landslide susceptibility.
Most of the studies have either assessed the impact of LULC change in the past on landslide susceptibility [29] or assessed the impact of defined future scenarios on landslide susceptibility [19]. Very few studies have assessed the impact of simulated LULC (BAU scenario) on landslide susceptibility. It is essential to assess how the change of LULC in a BAU and in a planned way may affect the landslide susceptibility of an area. In addition, this will help to understand the role of LULC planning in mitigating the effects of landslides. In this study, we assessed the impact of LULC change on the landslide susceptibility of Rangamati municipality, Bangladesh. Landslides occur mainly in the Chittagong Hilly Areas (CHA) (south of Bangladesh) [35,36] in Bangladesh, especially in the three urban areas of the Chittagong Metropolitan Area (CMA), Cox’s Bazar, and the Rangamati municipalities. These urban areas suffer from unplanned LULC change [23,36,37]. Therefore, it is critical to assess future LULC changes on the landslide susceptibility in the Rangamati municipality. We evaluated the change of landslide susceptibility using the proposed LULC plan and simulated the LULC of 2028 (BAU). Specifically, this study helped answer the following research questions: a) what is the landslide susceptibility scenario in the BAU condition of LULC change, and b) can planned LULC change prevent the increase of landslide susceptibility in the study area?

2. Materials and Methods
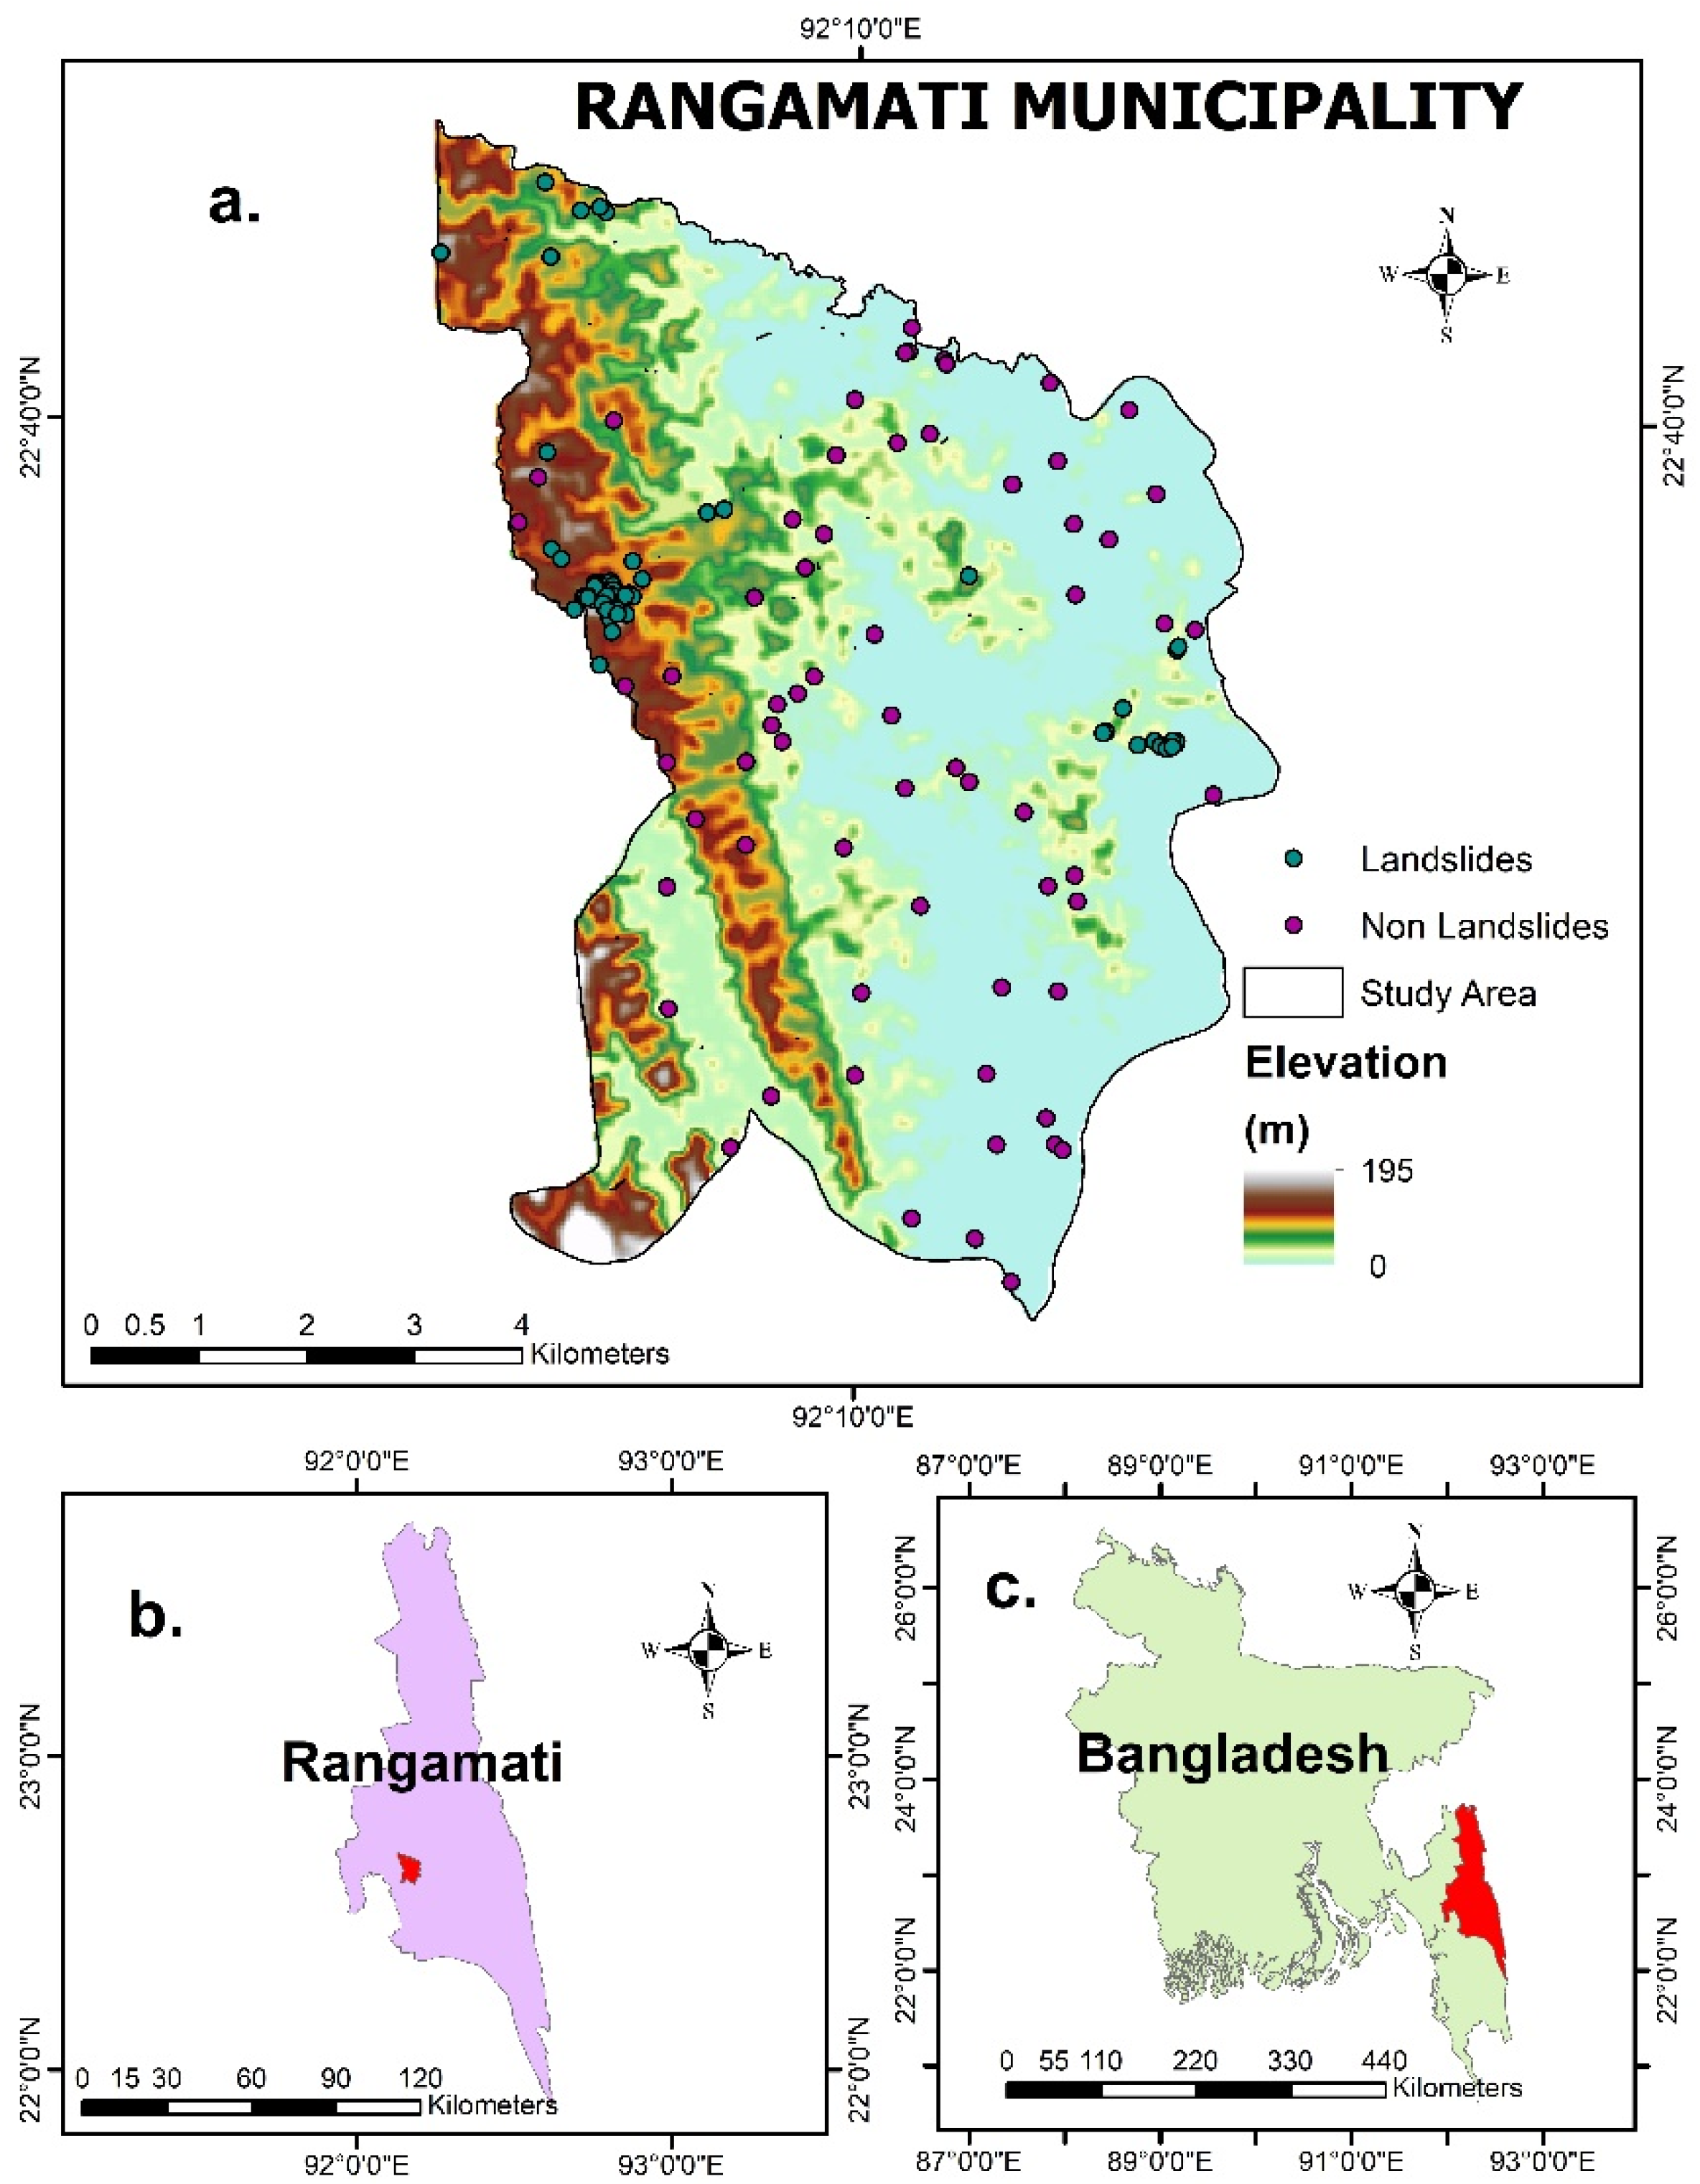
2.1. Study Area

Rangamati municipality (Figure 1) is the administrative headquarter of the Rangamati district. It covers approximately 64.8 km2 of the area between 22°37′60 N and 91°2′0 E. The total population is around 150,000, six times more than the area’s carrying capacity [38]. Population density is about 200 people/km2 [39]. The elevation ranges from 0 to 195 m above sea level. Vegetation covers 75% of the study area and waterbodies cover 18%. Half of the study area is inhabitable, and this is why people clear forests and level hills to spread settlements and build new infrastructure [38]. The maximum and minimum annual average temperatures are 36.5 °C and 12.5 °C, respectively. The average annual rainfall is around 2673 mm [39]. Folded, faulted, and uplifted tertiary and quaternary sediments form the study area [23]. Kaptai Lake, situated in the east of the study area, is an artificial lake formed due to the construction of the Kaptai dam.
Rangamati municipality is prone to landslides and during June–July 2017, 73 people died due to landslides [38]. In a short period, excessive monsoon rainfall triggered landslides [23,40]. In the study area, population density has doubled in the past two decades because people have migrated to this city [38]. Due to the proximity to the Kaptai Lake and natural scenic landscapes, tourism industries have started to grow. In recent years, plantations have become common in the city’s western part [23]. Natural vegetation has been removed for plantations, increasing soil erosion [38]. Unplanned LULC changes, such as conversion of natural vegetation to plantation agriculture, infrastructural and tourism development, and agriculture, have increased the risk of landslides in this area.

2.2. Landslide Susceptibility Mapping

2.2.1. Landslide Inventory and Landslide Causal Factors

We used 65 landslide locations (Figure 1) for susceptibility mapping. From these landslides, 54 landslides occurred during June–July, 2017, and were mapped in the field The rest of the landslides were mapped using the visual interpretation of Google Earth images. These landslides occurred from January 2001 to June 2017. From 65 landslides, types were identified for 43 landslides. Unfortunately, some of the landslides (11) were old and it was difficult to determine their type. In the study area, slide (18) is the most dominant type of landslide, followed by flow (16) and complex (7).
The same number of non-landslides (65; absence-data) were generated from the comparatively safer zones. These landslide and non-landslide locations were split into training (80%; 104) and validation (20%; 26) datasets.
In this study, ten landslide causal factors: elevation, slope, aspect, topographic wetness index (TWI), stream power index (SPI), distance from the drainage network, plan curvature, profile curvature distance from fault lines, and LULC were used. We selected 30 m as the resolution for the landslide susceptibility map because most causal factors are with this resolution.

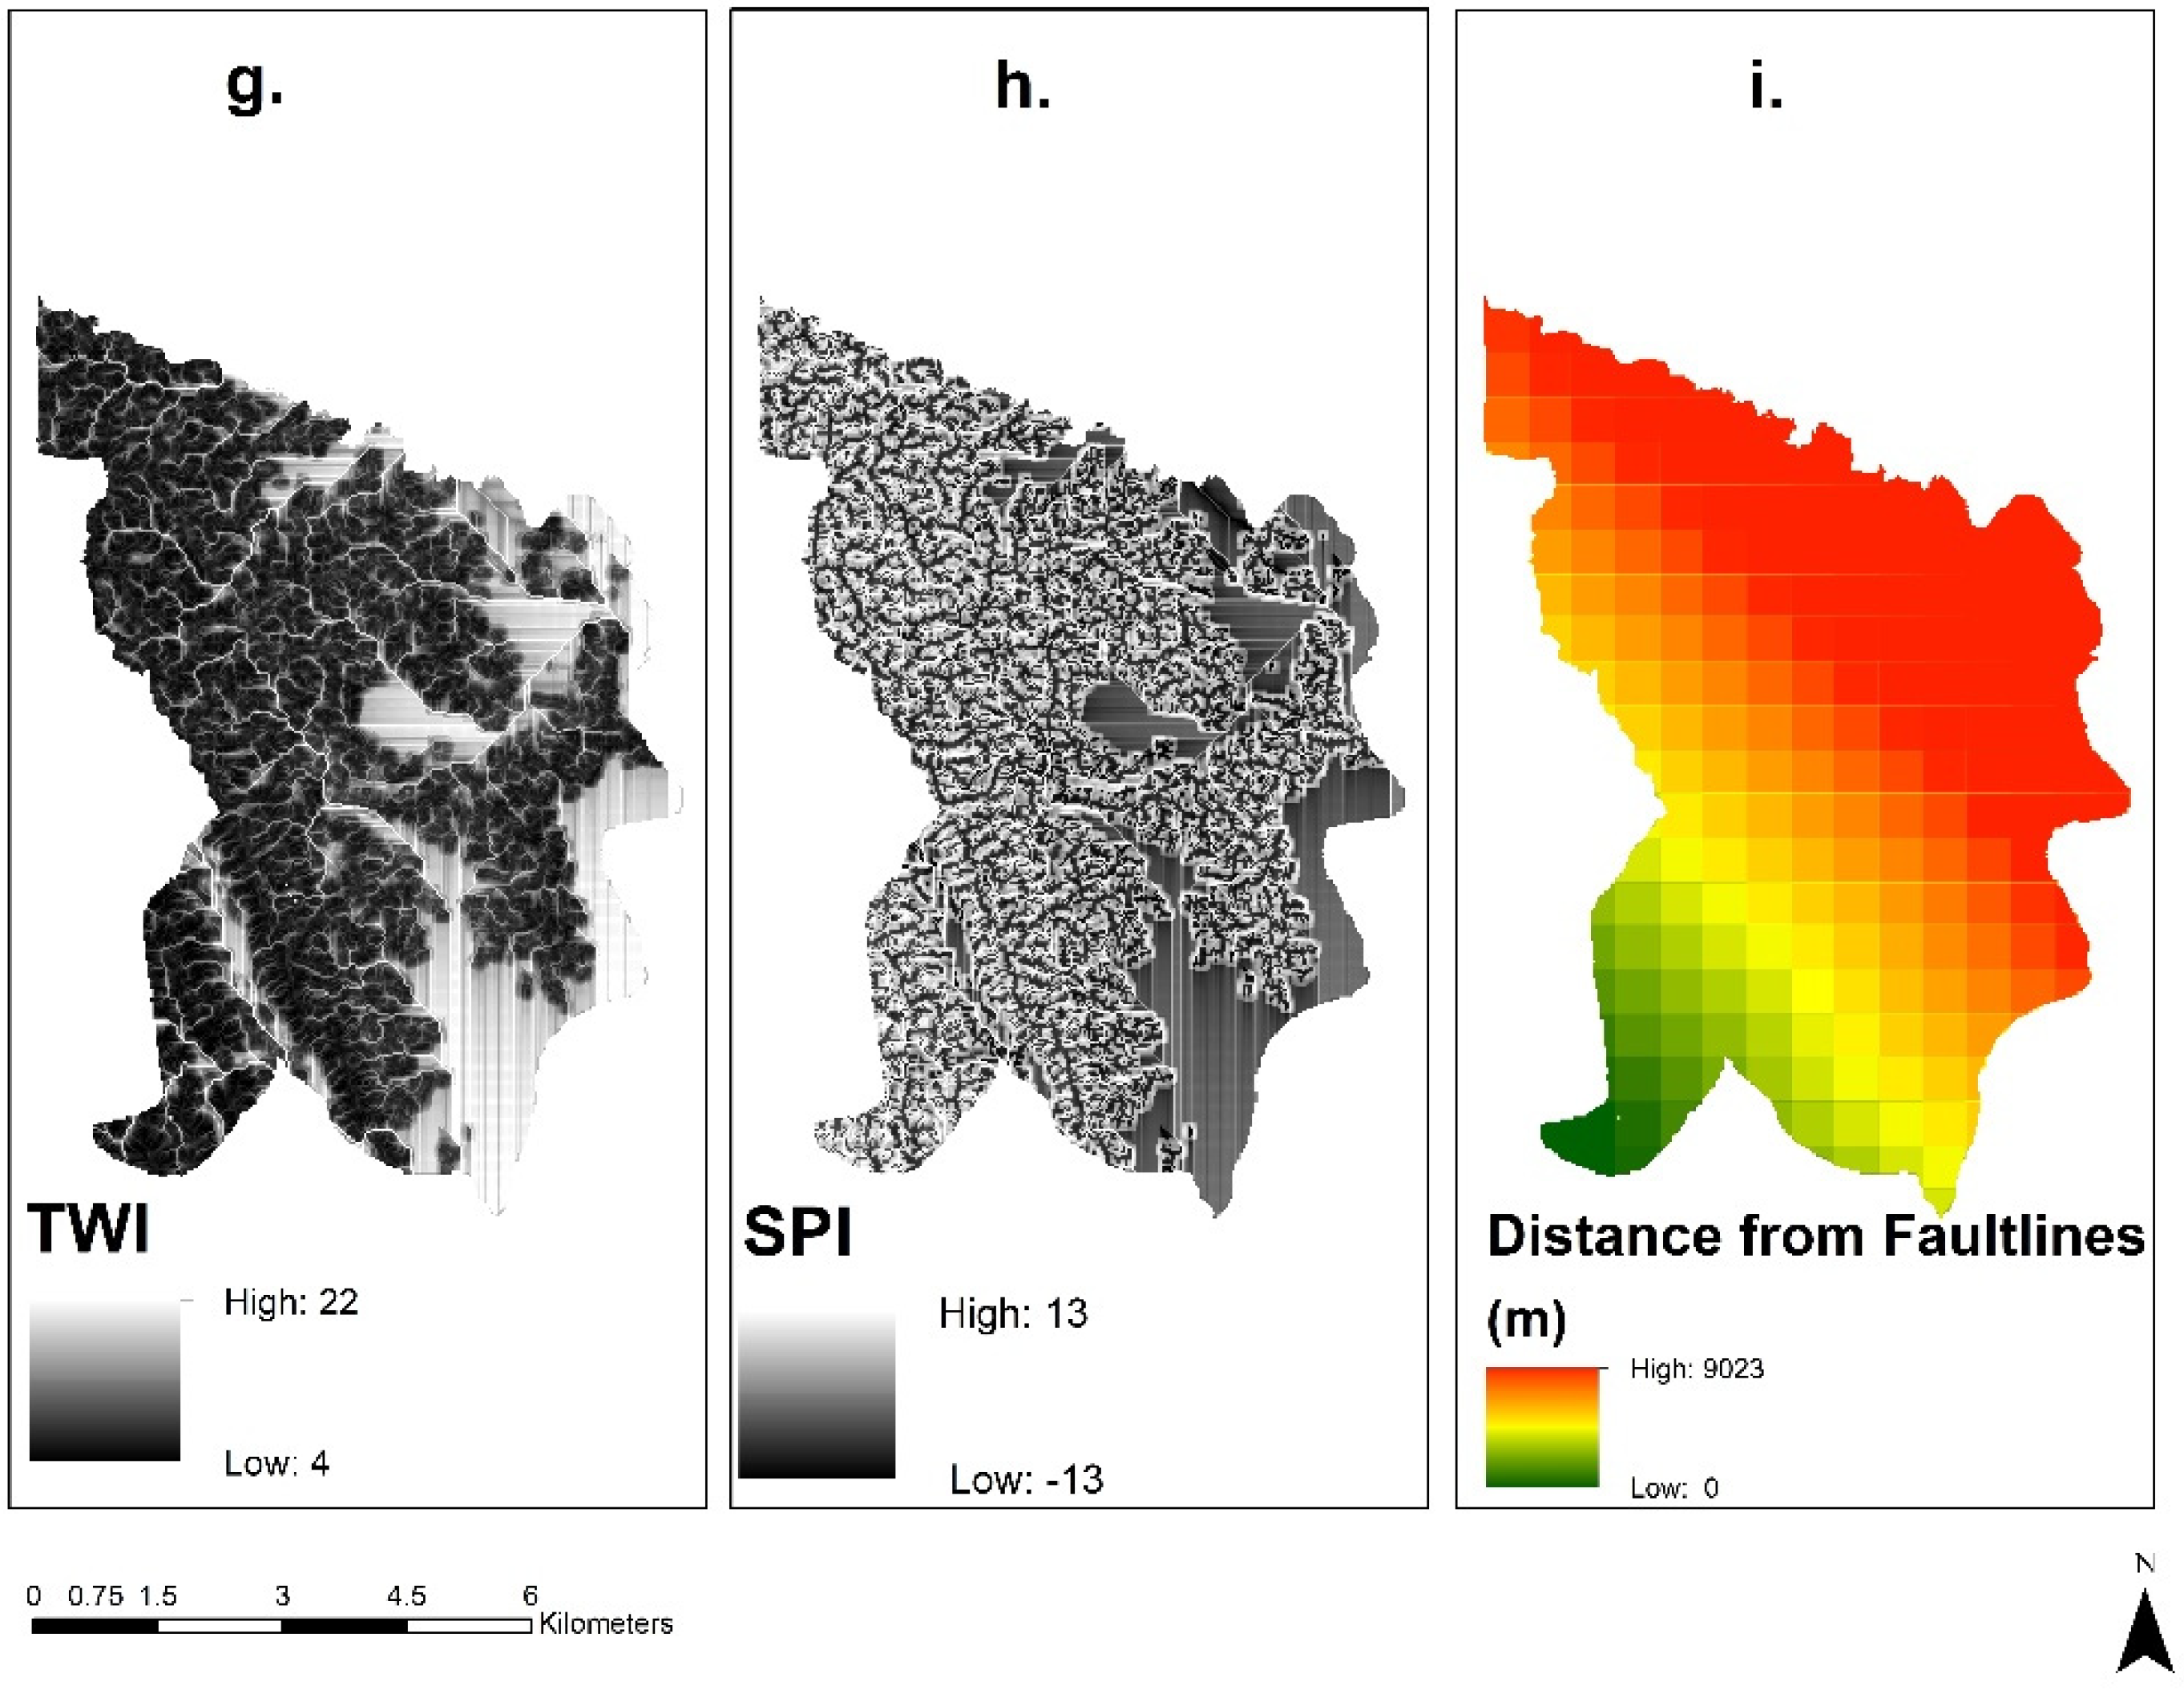
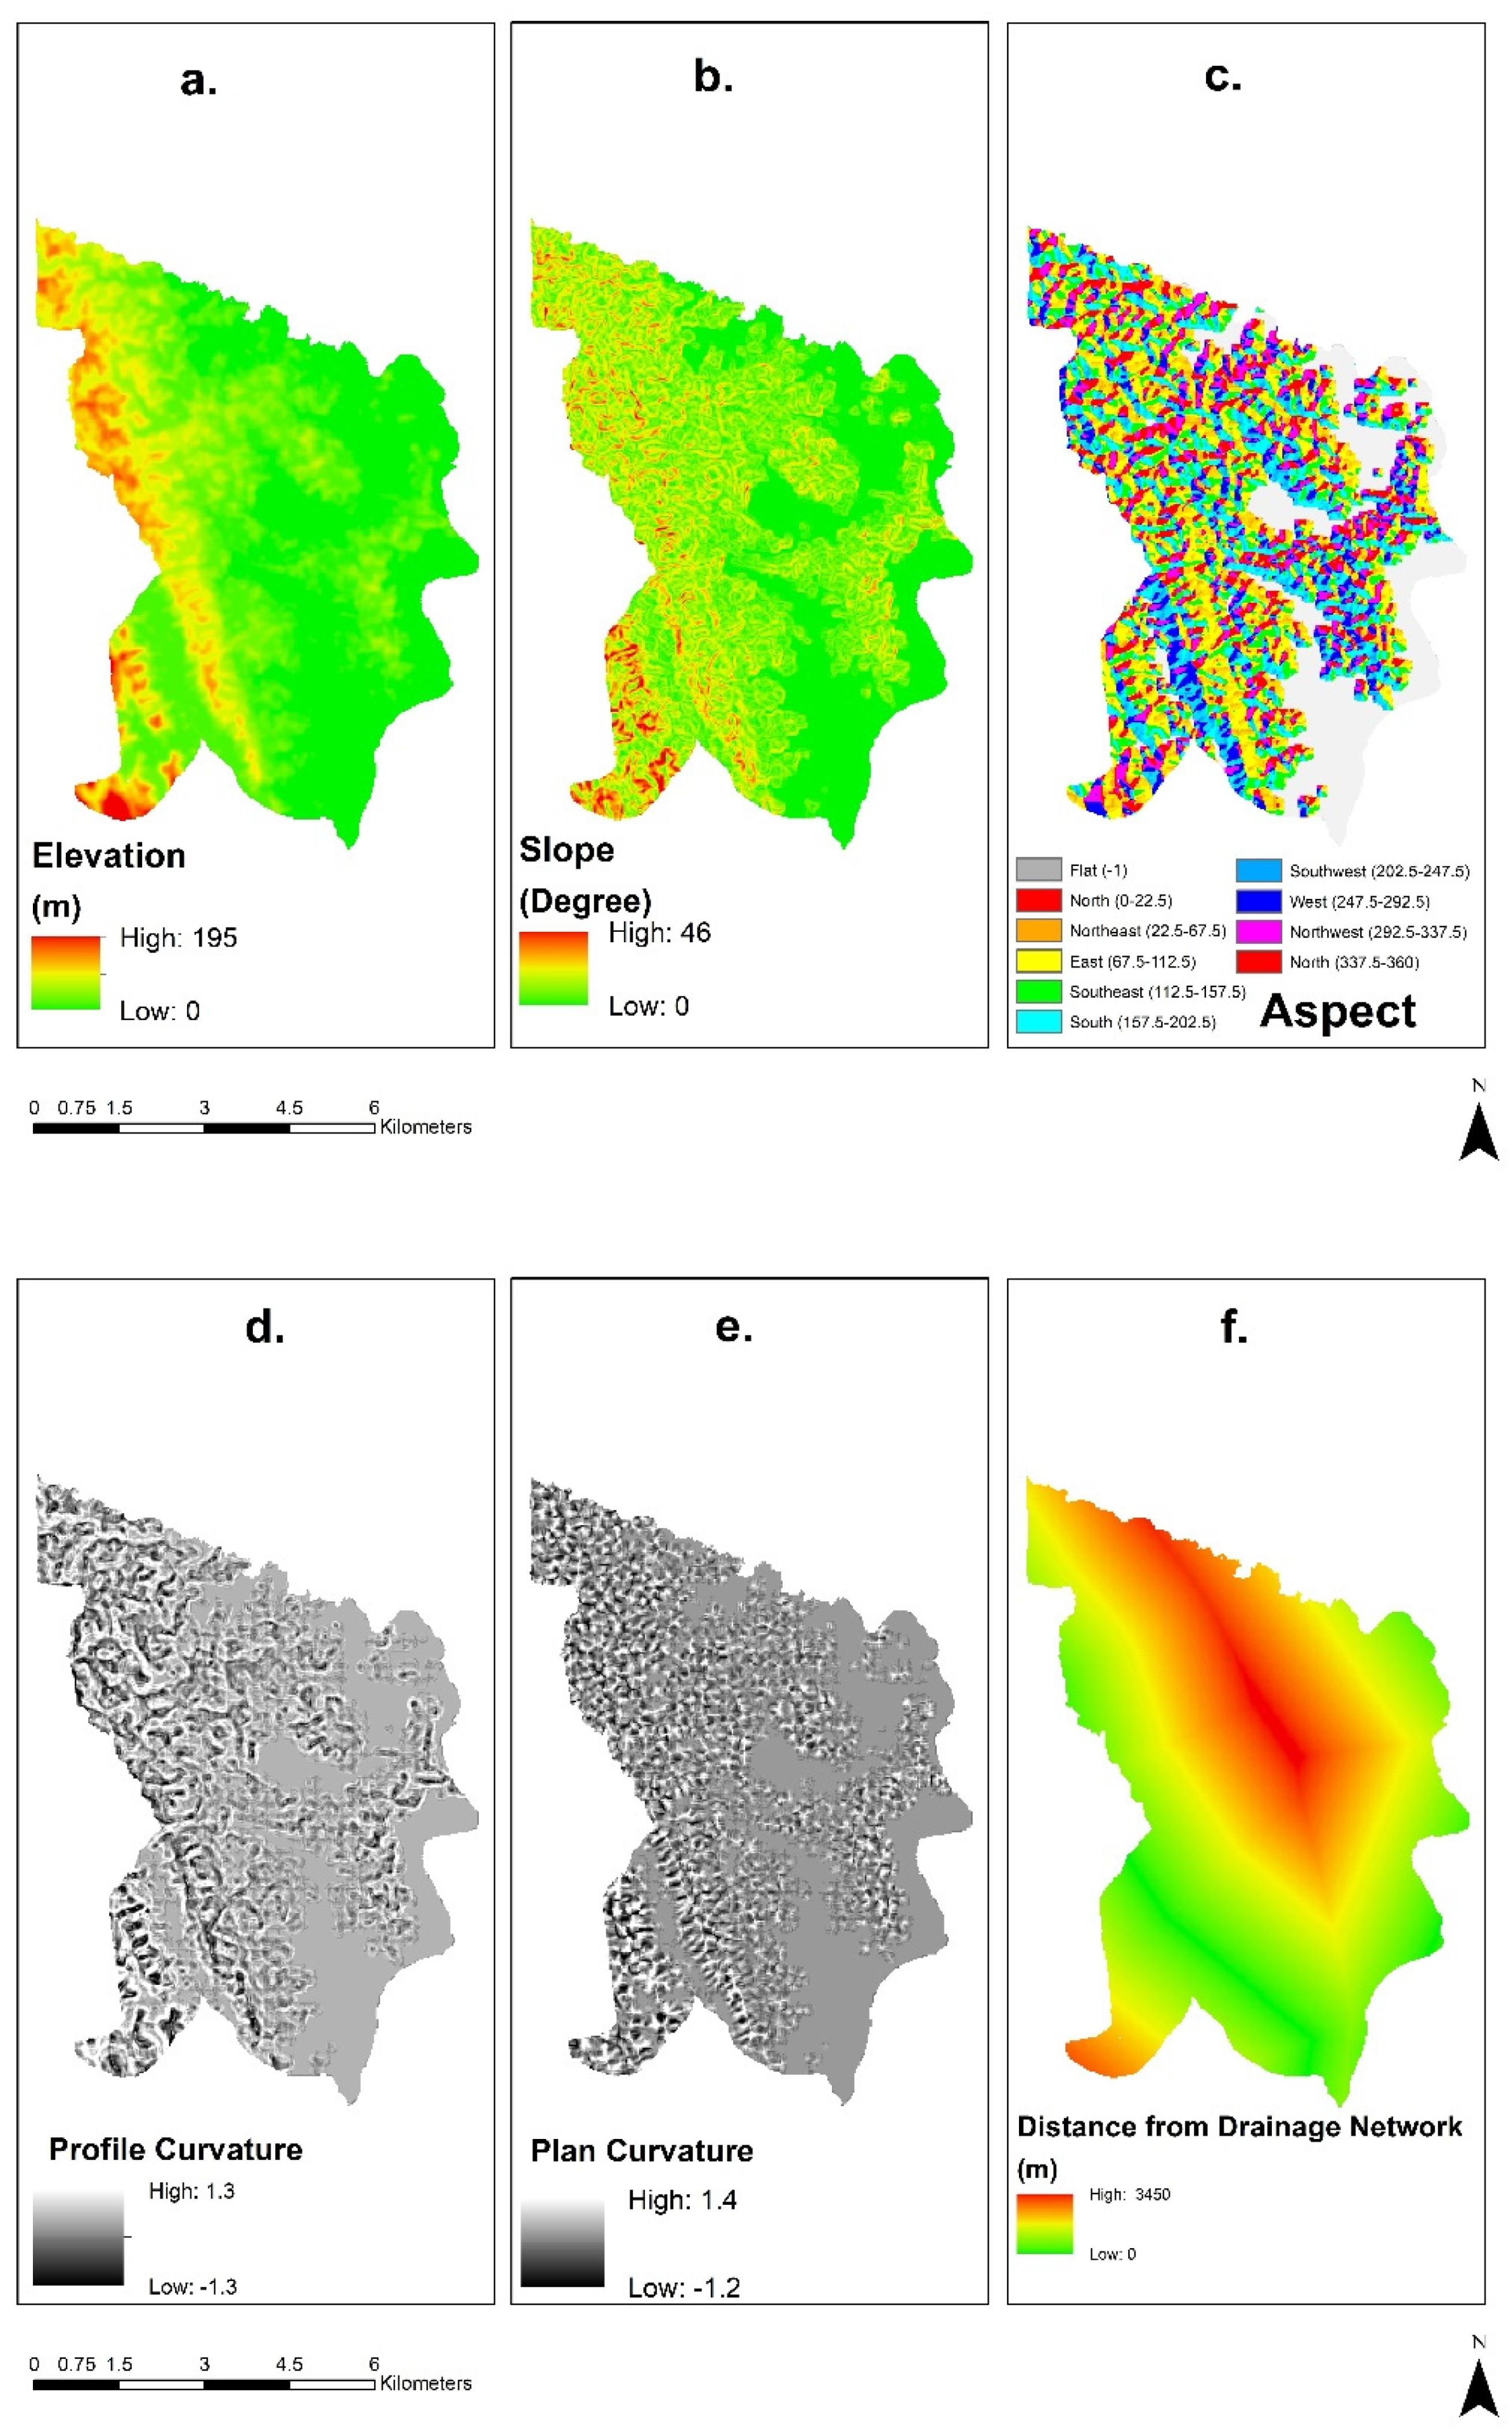
Relatively Stable Causal Factors
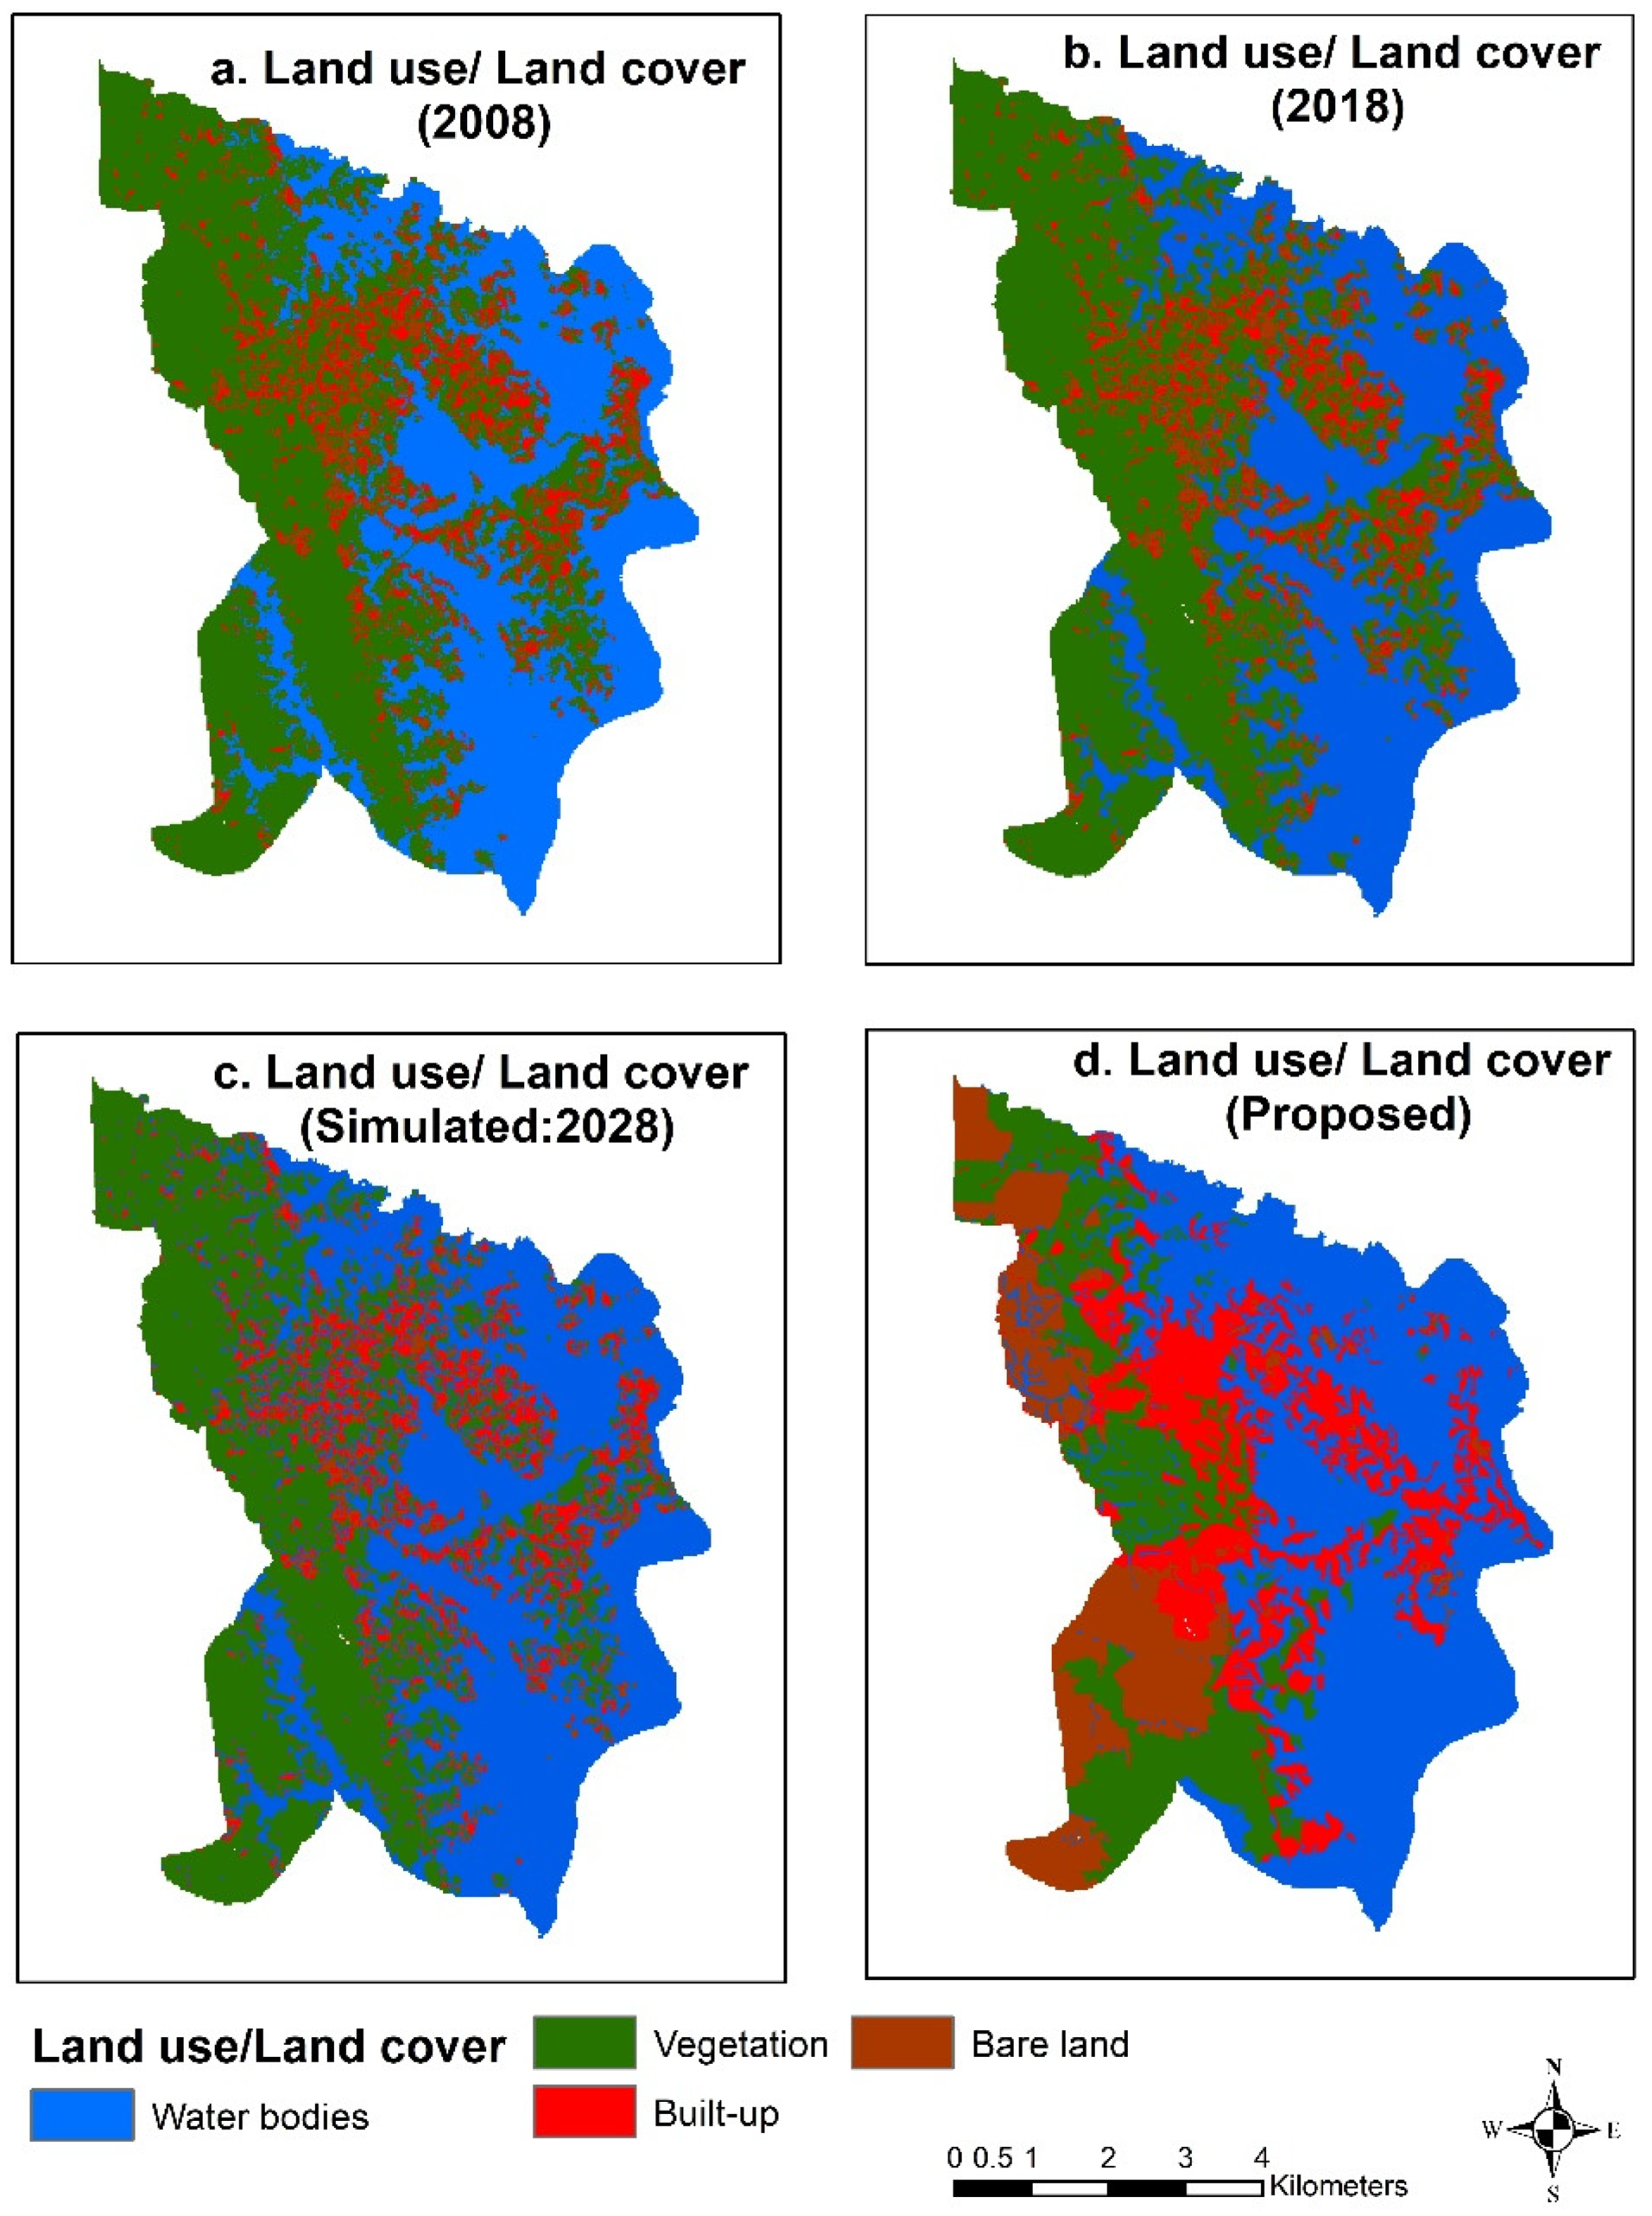
Most causal factors we selected, except for the LULC, are relatively stable factors. The Advanced Spaceborne Thermal Emission Reflection Radiometer (ASTER) (30 m × 30 m) DEM was used to derive elevation, slope, aspect, plan curvature, and profile curvature (Figure 2a–e). The slope is considered one of the most important causal factors because landslide probability increases with the increase of slope [22]. Other factors such as pore pressure and water drainage also depend on the slope [7]. Aspect represents the direction of the slope. Profile curvature is defined as parallel to the direction of the maximum slope. In contrast, plan curvature is perpendicular to the direction of maximum slope. These three factors may not directly affect landslide susceptibility but, together with other factors, can create conducive conditions for landslides [22,35]. Distance from the drainage network (Figure 2f) was derived from the drainage network downloaded from GeoDash, an open-access geospatial database provided by Bangladesh’s government. Both the Topographic Wetness Index (TWI) (Figure 2g) and Stream Power Index (SPI) (Figure 2h) are hydrological factors associated with runoff potential [22], and they were also derived from the DEM. The map of fault lines from the Geological Survey of Bangladesh (GSB) was used to determine the distance from the fault lines (Figure 2i). Closer distances to fault lines generally represent weak locations with a high probability of landslides [22].

Land Use/Land Cover

Different from the stable factors described above, LULC is a dynamic factor. For example, Abedin et al. (2020) [23] found that LULC affects the landslide susceptibility of the study area. In particular, anthropogenic activities such as plantation agriculture and urban infrastructure development cause rapid LULC change. In this paper, we examined the impact of three LULC scenarios on landslide susceptibility: (a) the existing (2018) LULC (Figure 3b), (b) a proposed LULC (Figure 3d), and (c) a simulated LULC of 2028 (Figure 3c).

Existing LULC of 2018

A Landsat 8 OLI image during the dry season (29 November 2018) was used to classify the LULC of 2018. The geometric and radiometric corrections were performed before the classification, and the image was reprojected to the Bangladesh Transverse Mercator System (BTM). We classified the image based on modifying the Anderson Level-I scheme [41]. Before classification, all satellite data were studied using spectral and spatial profiles, and digital numbers were converted into surface reflectance. The classification scheme was established based on ancillary information of field survey, visual image interpretation, and local knowledge of the study area. The classification of images was performed using a supervised maximum likelihood classification (MLC) algorithm. Based on the visual interpretation of the locations on Google Earth and the image itself, 60 polygons were digitized for each category. The land cover maps were validated using Rangamati district guide maps and Google Earth images. Four land-cover types, namely built-up, waterbodies, vegetation, and bare land, were classified based on study area knowledge. Vegetation includes natural vegetation, plantation agriculture, and other agricultural lands; waterbodies include lakes, rivers, and ponds; bare land includes fallow lands and lands under slash and burn agriculture (in slash and burn agriculture, farmers clear a forested slope, in which case we considered it as bare land, and then they cultivate crops there, in which case we considered it as vegetation). Post-classification refinement was used to improve the classification accuracy [42,43]. Overall classification accuracy was 91.0%, and the kappa statistic was 0.88. A 3 ∗ 3 majority filter was also applied to the classified maps to reduce the salt-and-pepper effect [44].
The classification accuracy was assessed using field data and the geographical features on land-use maps, topographic maps from the survey of Bangladesh, and visual interpretation of very high spatial resolution data from Google Earth. The Landsat-derived classified images’ total accuracy was 96%, with a corresponding kappa coefficient of 0.93. The user’s and producer’s accuracy of individual classes ranged between 73–100% and 89–100%, respectively. The accuracy meets the 85–90% standard for LULC mapping studies, as suggested by Anderson et al. (1976) [41].

Proposed Land Use/Land Cover

The second LULC scenario is a proposed LULC map (Figure 3d) from the town planning unit of Rangamati municipality under the “Urban Governance and Infrastructure Improvement Project.” This proposed LULC has not yet been implemented. We aimed to assess whether the proposed LULC map can reduce landslide susceptibility. Communication with urban planners of the municipality and the stakeholders indicates that landslide susceptibility or the landslide risk were not considered when proposing the LULC map. However, all the urban planning rules were used during the preparation of the proposed LULC. For example, the new industrial and urban areas were proposed only in gentle slope areas.
We digitized this proposed land-use map in ArcGIS. To be comparable with other LULC maps, we combined the eight LULC classes of the proposed map into four types: vegetation, waterbodies, built-up, and bare land. We dissolved them with: vegetation which includes natural forest, plantation agriculture, and orchard; built-up land, which includes settlement, roads, and recreational centers; and bare land, which includes fallow land and areas under slash and burn agriculture.

Simulated Land Use/Land Cover

The third LULC scenario is a simulated LULC for 2028 (Figure 3c). For LULC simulation, it is necessary to determine the factors that drive the LULC change of an area. These LULC classes are controlled by different factors [33]. For Chittagong Hilly Areas (CHA), Hasan et al. (2020) used four categories of influencing factors: socio-economic, proximity to building infrastructure, climate, geophysical, and environmental. Table 1 shows the factors and their data sources used in the LULC simulation of 2028 in this study.
An artificial neural network (ANN)-based cellular automata (ANN-CA) model was used to simulate and predict the land use/land cover map of 2028 based on the land use/land cover of 2008 and 2018. To implement the ANN-CA model, the open-source software package QGIS’s MOLUSCE (Modules for Land-use Change Evaluation) plugin was used. This plugin measures the percentage of area change for each study area’s land use/land cover. In addition, this plugin provides ANN logistic regression, multi-criteria evaluation, and weight of evidence methods to measure transitional potential based on the change and transition matrix [45]. The transitional potential was used in the cellular automata simulation of MOLUSCE plugins to predict future land use/land cover [46]. We adopted the method proposed by Li and Yeh (2002) [47] and Saputra and Lee (2019) [46] for LULC prediction in which accuracy was around 80% in different parts of China.
Table 2 shows the transitional probability matrix of different LULC from 2008 to 2018. It is based on the percentage of LULC change from 2008 to 2018. The values in the matrix range from 0 to 1. The higher the value, the higher the transitional probability of a land-use type converting into another type. The most active LULC type was vegetation since it had a higher probability of changing to bare land (0.28) and built-up (0.34). On the other hand, waterbodies and built-up areas were the most stable types, since Kaptai Lake is a protected area in the study area. Therefore, the probability of change of Kaptai Lake is minimal. On the other hand, built-up areas will not convert back into vegetation or waterbodies.
In the MOLUSCE plugin, the first step is to define the input variables for neural network-based simulation. Our initial data was the land use/land cover map of 2008, and the final data was the land use/land cover map of 2018. Spatial variables were the eight exploratory variables (Table 3) that were used in the input section of the MOLUSCE plugin. The percentage of change of each of the land use/land cover was calculated between the land use/land cover maps of 2008 and 2018. This also provides the transitional probability matrix, which is the proportion of cells changed from one land use/land cover to another.
Transitional potential modeling using ANN multi-layer perception is the main part of the module. In the neural network, there are three layers: input, hidden, and output. Here, the input layers are the eight exploratory variables. For a perfect fit, we used the 2n/3 approach and used five hidden neurons. The learning rate is the hyperparameter, and a high learning rate value will give an unstable model. Simultaneously, a low learning rate will cause a lengthy training process [48]. In this study, the learning rate was 0.001.
Transitional probability obtained from ANN was used in cellular automata (CA) simulation for predicting the future land use/land cover of 2028. In CA-based simulation, the composition and correlation of one cell with the surrounding cells are considered. The CA-based simulation requires iterations to determine whether a cell can be changed into another LULC class. The change of the pixel or cell from one LULC to another depends on a user-defined threshold, ranging from 0 to 1 [47]. The threshold value should be chosen so that the LULC is not changed quickly, and it is ensured by a relatively larger value [47]. In other words, a somewhat larger value provides the step-by-step change of LULC [46]. In this study, we set the threshold value as 0.9 based on the findings of Li and Yeh (2002) [47] and Saputra and Lee (2019) [46].

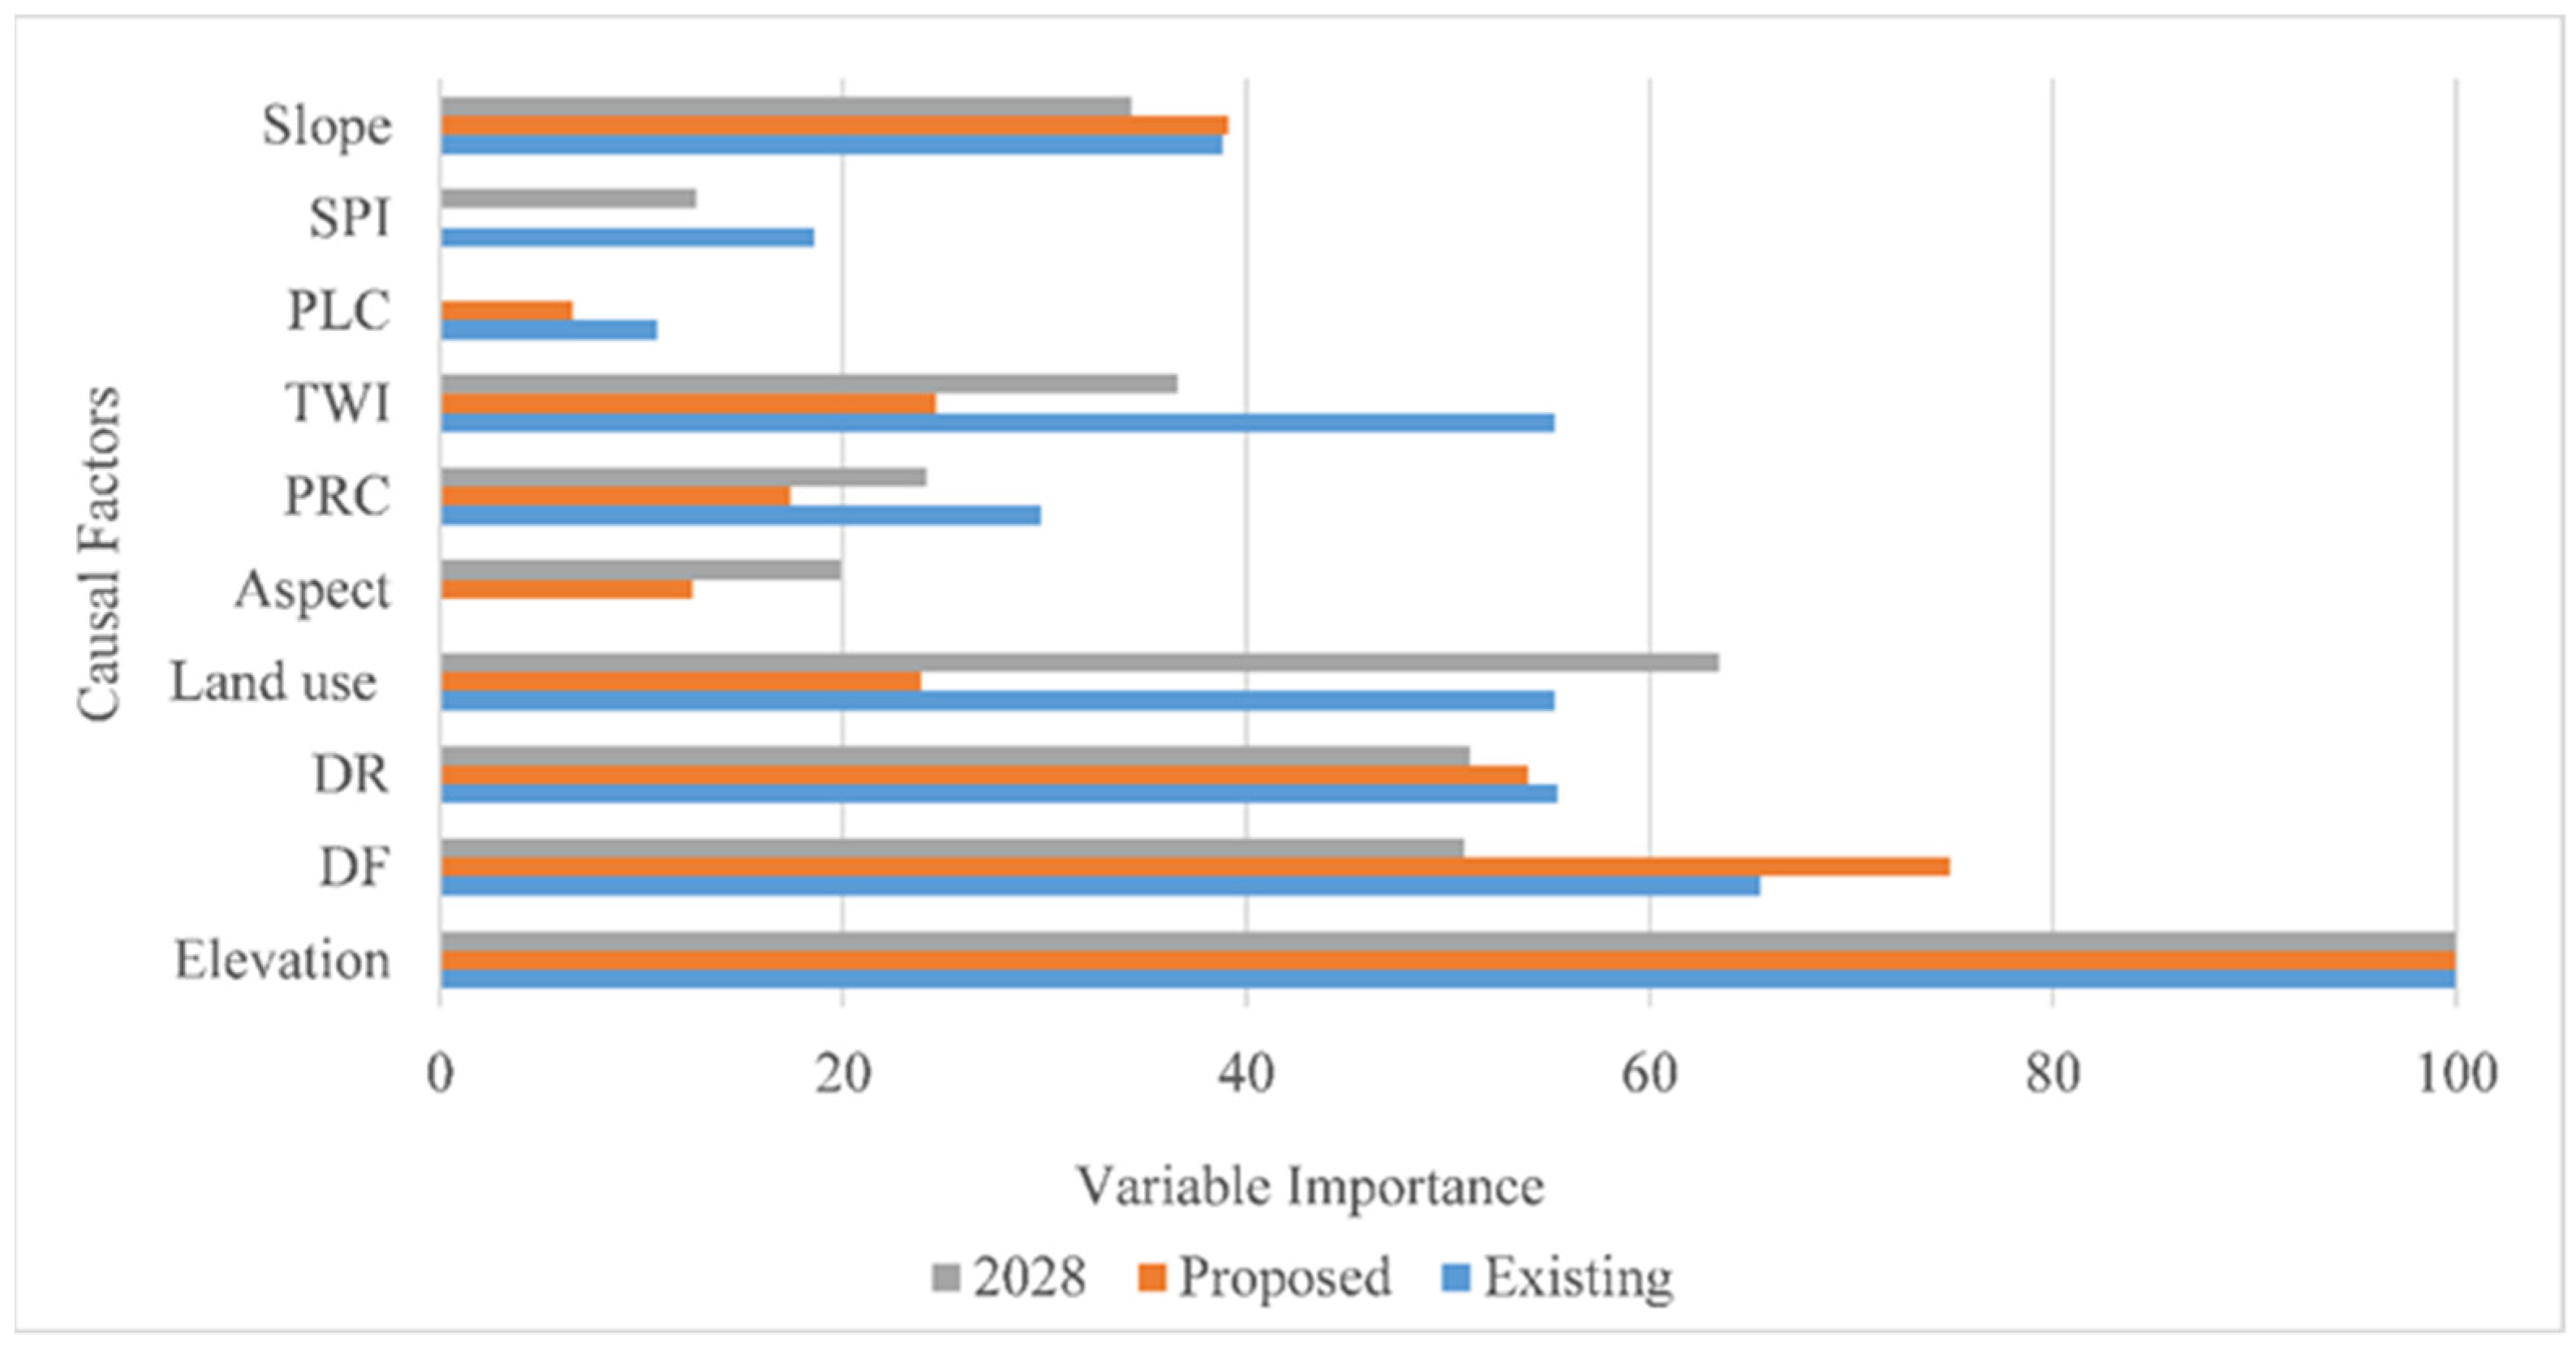
2.2.2. Random Forest Model and Accuracy Assessment

The random forest model was used for landslide susceptibility mapping. Random forest is a widely used model in landslide susceptibility mapping since it shows better prediction capability [7,14,16,17,26]. Breiman (2001) [49] proposed a random forest model that improves the decision tree model. The model ensembles the decision trees and identifies the membership class depending on the maximum number of votes [21]. Random forest uses bootstrap aggregation and selects samples from the training dataset to develop a classification tree [21]. Out of the bag samples or the unselected samples are used to determine the error and the importance of the model’s factors [7]. The random forest model gives predictions by integrating individual classification trees [26,50]. This model depends on two hyperparameters: ntree or the number of trees, and mtry or the number of node splits. For a stable model, ntree can be a large value and mtry = E/3, where E is the number of independent variables. In this study, mtry was 4 since the number of independent variables was 10; ntree was 500, and node size was 4 [34]. We chose a comparatively smaller node size; therefore, the processing time was comparatively long, but larger trees were formed [21]. The “randomForest” package of R 3.8 was utilized to carry out the random forest modeling [51].
The areas under the success and prediction rate curves were used for model validation. The training dataset was used to calculate the area under the success rate curve (AUC), while the validation dataset was used to calculate the area under the prediction rate. The success rate curve shows how well the model learns the behavior of the training dataset, while the prediction rate indicates how well the model can predict future landslides. The AUCs of success and prediction rates range between 0.5 to 1.0 or 50% to 100% [18]. Accuracy of 90–100% falls under the excellent category; 80–90% accuracy falls under the good category; 70–80% accuracy falls under the moderate category, and <70% falls under the poor category [20]. In this study, we used three LULC scenarios to produce three landslide susceptibility models. We used landslides that occurred from 2001 to 2017. Therefore, in our study design, for the landslide susceptibility map produced using existing LULC, we calculated the success rate using the training dataset. The random forest model was trained using training data for the existing LULC and the stored model. For landslide susceptibility maps produced using proposed and simulated LULC, we changed the LULC scenarios. Therefore, for these two susceptibility maps, validation accuracy was calculated using a validation dataset. The validation dataset was not used during the training process and was totally new to the random forest model. Therefore, it can be considered as future landslides. Although these landslides occurred from 2001 to 2017, during the process of training these landslides were totally unknown to the random forest model; this is a very common approach for validating a machine-learning model as well as checking the prediction accuracy [21]. Machine-learning models such as the random forest model are prepared based on an available dataset and are used for predicting future scenarios. We cannot obtain the data of future scenarios and in such a case splitting the available dataset into training and testing sets is considered the best approach where test or validation dataset is used to measure prediction accuracy [21]. Therefore, in this study, for measuring the prediction accuracy of the landslide susceptibility maps produced using the proposed and simulated LULC scenarios, we used the validation dataset.

3. Results

3.1. LULC Scenarios

In 2018 (Figure 3b), around 48.9% (Table 3) of the study area was designated as waterbodies. Vegetation covered around 36.5% of the study area. The percentage of built-up area and bare lands were 8.2% and 6.5%, respectively.
In the proposed LULC (Figure 3d), around 38.4% were designated as either built-up areas or bare land. According to this proposed plan, some vegetation would be removed to develop industrial and commercial areas. Some areas in the southwest were designated as fallow or bare land.
LULC of 2028 was simulated based on the trend of change of LULC from 2008 to 2018 and its association with the eight explanatory variables. From 2008 to 2018, vegetation decreased by 10.1% (Table 3), while bare land increased by 27.0% and built-up area increased by 88.9%. The increasing population and development of tourism industries are the reason behind the sharp increase of built-up area and the decrease of vegetation. The simulated LULC pattern suggests that the built-up area would increase by 77.2%, and the bare land would increase by 54.8%. In contrast, vegetation would decrease by 4.9%, and the waterbodies would reduce by 19.8% due to conversion to built-up or bare land.

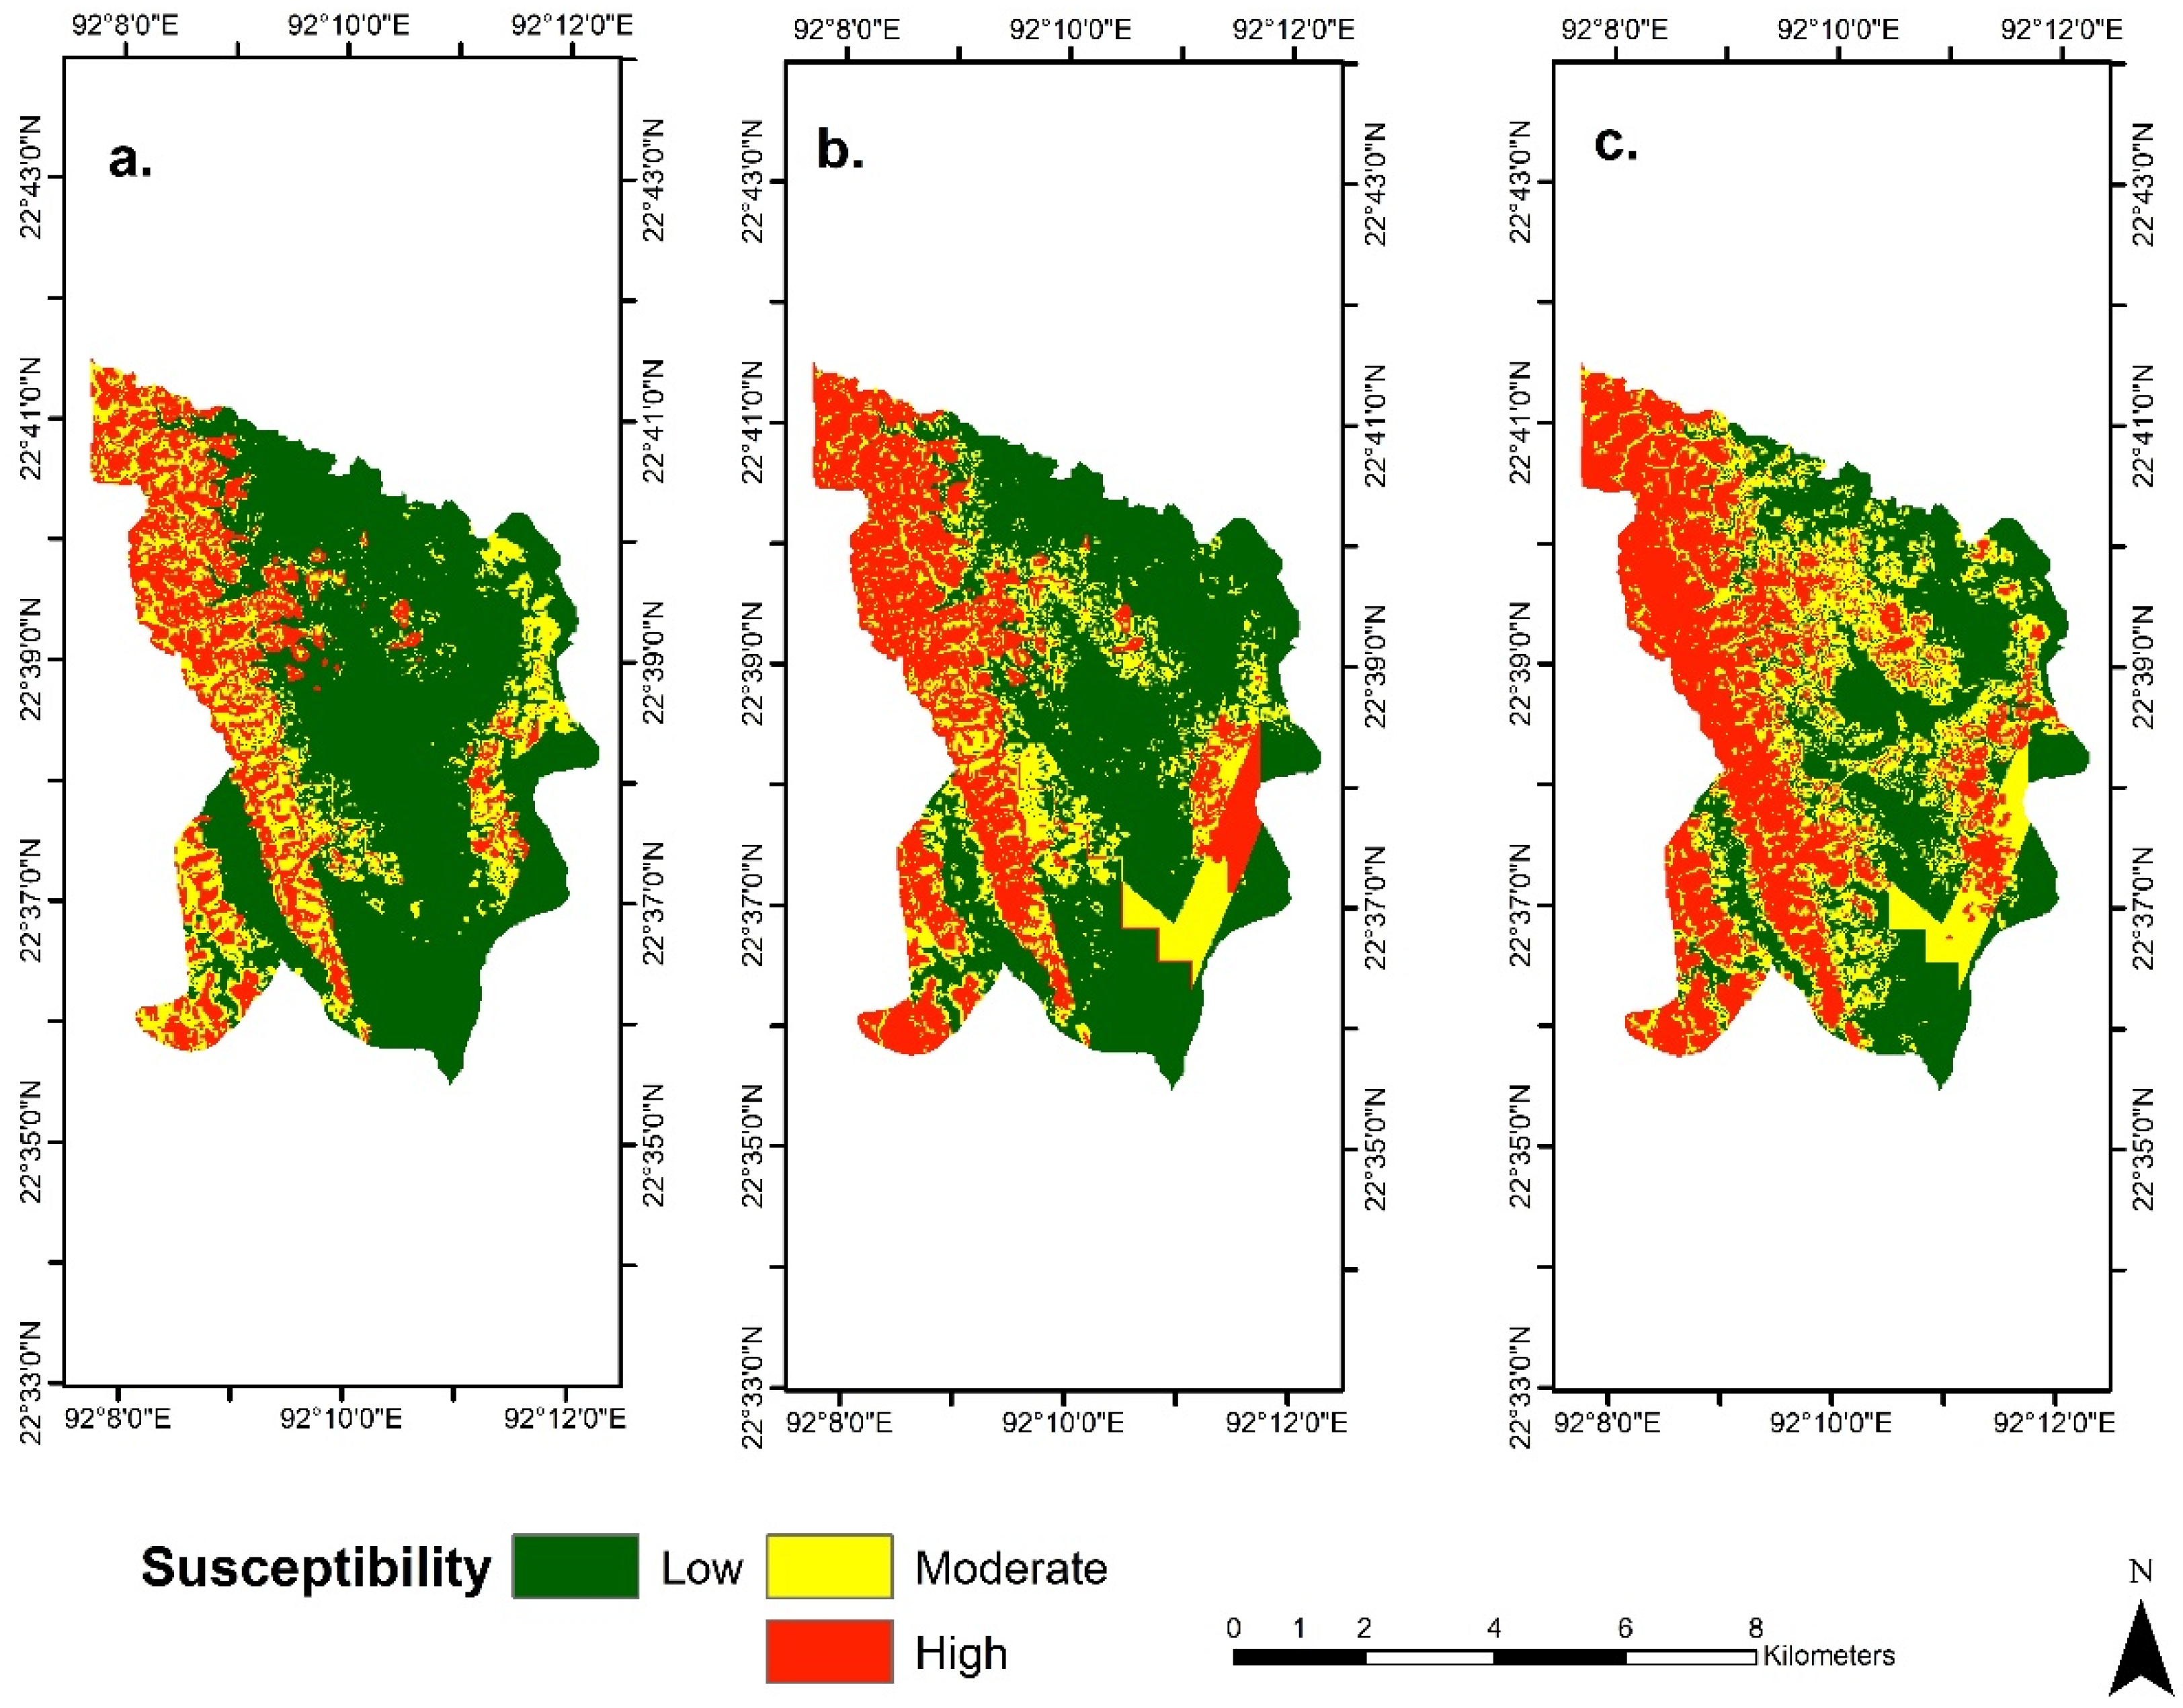
3.2. Landslide Susceptibility Mapping

The variable importance plot (Figure 4) shows that for the existing (2018) LULC, elevation (100.0) is the most important causal factor, followed by distance from fault lines (65.5), distance from drainage network (55.4), and LULC (55.3). In the proposed LULC scenario, the importance of LULC (23.9) was not as high as the existing LULC scenario. For the simulated (BAU) LULC of 2028, elevation (100.0) was the most important causal factor, followed by distance from drainage networks (51.1) and distance from the fault lines (50.8).
Since elevation was the most important causal factor in the existing LULC scenario (Figure 5), areas with higher elevation in the northwest and south-west regions were classified as either high or very high susceptibility zones. Simultaneously, the same areas near the built-up area were classified as either high or very high susceptibility zones. On the other hand, areas near waterbodies were classified as low susceptibility zones. For the proposed LULC map, the same areas were classified as either high or very high susceptibility zones. Moreover, new high susceptibility zones in the proposed LULC map were spread around the high susceptibility zones classified in the existing LULC map. In this scenario, the same areas near the waterbodies and Kaptai Lake were classified as moderate susceptibility zones. In the simulated LULC scenario (Figure 5), as in the previous two models, the same areas were classified as high susceptibility zones and spread around the high susceptibility zones classified in the existing LULC model. As in the proposed scenario, areas near the waterbodies and the Kaptai Lake were classified as moderate susceptibility zones because these areas were classified as vegetation or built-up areas in the proposed and simulated LULC scenarios. In contrast, these areas were classified as waterbodies in the existing LULC with low landslide probability.
In the existing LULC scenario (Table 4), 20.2% of the area was classified as a high susceptibility zone. However, the high susceptibility zones increased by 28.7% and 34.2% in the proposed and simulated LULC scenarios. In the existing LULC scenario, 22.4% (Table 5) of the built-up area falls under the very high susceptibility zone, while in the proposed LULC scenario, 27.1% of the built-up area falls under the very high susceptibility zone. In the BAU scenario, 42.4% of the built-up area will be a high susceptibility zone. For both the proposed and BAU scenarios, bare land in the very high susceptibility zone will increase by almost 100.0%, since it will increase from 33.2% to 67.8% for the proposed scenario and 65.4% for the BAU scenario.
The success (Table 6) (88.9%) and prediction rates (82.7%) were higher for the existing LULC than those of the other two LULC scenarios. The prediction rates for the current and proposed LULC scenarios were relatively higher (>80%) than the rate for the simulated (2028) scenario (<80.0%).

4. Discussion

In this study, we assessed the impact of LULC on landslide susceptibility mapping in the Rangamati municipality based on three LULC scenarios. LULC is not the most important factor for landslides in our study area. However, its dynamic nature can affect landslide susceptibility [26]. Furthermore, well-planned LULC can limit the increase of high susceptibility zones, and the business-as-usual scenario may exacerbate the conditions [19]. Therefore, LULC change affects landslide susceptibility in the future. Our study revealed that elevation is the most important causal factor (Figure 4) in the study area since people want to carry out anthropogenic activities such as infrastructure development in areas where elevation is low. Moreover, with the increase of elevation, the probability of landslides increases; then, after a specific elevation due to rock structure and geomorphic conditions, the probability decreases [26]. In the study area, the highest elevation is 195 m. Due to the presence of Kaptai Lake in the east; most of the anthropogenic activities are concentrated in the north and southwest of the study area. Therefore, in these areas, elevation played a crucial role in landslides. On the other hand, the role of LULC (Figure 4) was variable across different scenarios. It was comparatively more critical for the simulated and existing LULC scenario than the proposed LULC scenario. This indicates that in the proposed scenario, planned LULC would reduce the impact of LULC change on landslide susceptibility.
The random forest model showed that landslide susceptibility would increase for both the proposed and simulated LULC scenarios, but the increase is lower in the proposed scenario. This suggests that the proposed LULC scenario is more sustainable than the BAU scenario. Although landslide susceptibility was not considered in the proposed LULC, the urban planning rules and regulations applied to the proposed LULC mitigate the increase of landslide susceptibility. As mentioned before, in the proposed LULC, the area under the built-up areas will increase, but new built-up areas will be proposed only in areas with gentle slopes. In contrast, BAU is dependent on the past trend of the LULC change. If the LULC trend of change continues, LULC will likely elevate the landslide susceptibility much higher. The built-up and bare land changes are similar for the proposed and BAU scenarios. In BAU, the analysis was conducted at the pixel level, leading to more sporadic changes. In contrast, the proposed LULC was vector-based, with large and continuous areas designated for a single LULC type. For example, the southwest portion of the study area includes four LULC types in the BAU scenario, but only two LULC types in the proposed LULC.
BAU will increase the percentage of areas under high susceptibility zones in future scenarios. It is also evident that new high susceptibility zones will spread around the already classified susceptibility zones in the existing landslide susceptibility map based on the LULC of 2018. Therefore, this indicates that high susceptibility zones will not shift to entirely new places; instead, they will be spread around the previous locations.
Previous studies have found that LULC plays an essential role in determining landslide susceptibility in this area [23,37]. Our study confirmed previous studies and suggested that the impact of LULC will increase in future scenarios. The quality of the landslide susceptibility map depends on the quality and accuracy of landslide inventory and the causal factors [4,22]. In this study, 65 landslide locations were used for training and validating the models. These landslides occurred in 2017, and most of the landslides were near settlements and other infrastructures such as road networks. Because these landslides caused infrastructural damages and causalities, they were reported in newspapers and governmental reports. To reduce the biases, we excluded factors such as distance from the road network from the model. Due to the lack of high-resolution rainfall data and a detailed geological map, rainfall and geology were not included as causal factors in landslide susceptibility mapping.
Rainfall is considered a causal factor in landslide susceptibility mapping, whereas rainfall is considered a triggering factor in developing landslide early warning systems [52], which is not the scope of this study. The study area is small in size, and there was no spatial variation of mean annual rainfall, therefore indicating that mean yearly rainfall will not affect the landslide susceptibility. However, in the study area, most landslides are triggered by rainfall. This means that causal factors create conducive conditions for landslides and triggering factors such as rainfall initiate the landslide events. Our study only assessed the impact of LULC change on landslide susceptibility with the assumption that all other factors are unchanged. We acknowledge that other dynamic factors may also affect the landslide susceptibility scenario. If the pattern of mean annual rainfall changes due to climate change in the future, it will affect landslide susceptibility. In our study area, landslides are mainly triggered by intensive rain, and climate change may result in more or less intensive rainfall events. More studies are needed to assess the impact of climate change on landslide susceptibility and the role of changing rainfall as a triggering factor.

5. Conclusions

In landslide susceptibility mapping, geomorphic and physiographic factors such as slope, aspect, plan curvature, profile curvature, and geology are static. On the other hand, LULC is a dynamic factor related to human activities. We assessed the impact of LULC change on landslide susceptibility based on three scenarios: existing, proposed, and simulated LULC patterns. The random forest model showed that due to LULC change, landslide susceptibility would increase, and thus the percentage of high susceptibility zone would also increase. All models showed satisfactory accuracy (>80.0%) in success and prediction rates. Future landslide susceptibility will keep changing, with new high susceptibility zones spreading around the existing high susceptibility zones, mainly in the urban areas and areas with high elevation in the north and southeast of the study area. A proper LULC management plan should be implemented to minimize the increase of high susceptibility zones. This study highlighted that new high susceptibility zones will likely be spread around existing high susceptibility zones. A proper LULC management policy is necessary to mitigate the increase of high susceptibility zones.
This study did not use causal factors such as geology, rainfall, and soil characteristics in landslide susceptibility mapping due to data unavailability. We also did not consider climate change in the assessment. Therefore, the produced landslide susceptibility maps may have some bias and uncertainties. Future work is necessary to include more factors in the evaluation and assess the impact of climate change on landslide susceptibility.
Our results suggest that the proposed LULC scenario may have a relatively lower increase in landslide susceptibility than the BAU scenario. However, it is unclear if the proposed LULC minimizes landslide susceptibility. Therefore, it is important to explore different LULC scenarios to minimize landslide susceptibility in LULC planning and management.

Author Contributions

Conceptualization, methodology, formal analysis, writing and editing Yasin Wahid Rabby; writing and editing Yingkui Li; formal analysis Joynal Abedin; formal analysis Sabiha Sabrina. All authors have read and agreed to the published version of the manuscript.

Funding

This work is funded by the W.K. McClure Scholarship program of the University of Tennessee, Knoxville.

Institutional Review Board Statement

Not applicable.

Informed Consent Statement

Not applicable.

Data Availability Statement

Not applicable.

Conflicts of Interest

The authors declare no conflict of interest.

References

  1. Reichenbach, P.; Rossi, M.; Malamud, B.D.; Mihir, M.; Guzzetti, F. A review of statistically-based landslide susceptibility models. Earth-Sci. Rev. 2018, 180, 60–91. [Google Scholar] [CrossRef]
  2. Samia, J.; Temme, A.; Bregt, A.K.; Wallinga, J.; Stuiver, J.; Guzzetti, F.; Ardizzone, F.; Rossi, M. Implementing landslide path dependency in landslide susceptibility modelling. Landslides 2018, 15, 2129–2144. [Google Scholar] [CrossRef] [Green Version]
  3. Fell, R.; Corominas, J.; Bonnard, C.; Cascini, L.; Leroi, E.; Savage, W.Z. Guidelines for landslide susceptibility, hazard and risk zoning for land-use planning. Eng. Geol. 2008, 102, 99–111. [Google Scholar] [CrossRef] [Green Version]
  4. Guzzetti, F.; Mondini, A.C.; Cardinali, M.; Fiorucci, F.; Santangelo, M.; Chang, K.T. Landslide inventory maps: New tools for an old problem. Earth-Sci. Rev. 2012, 112, 42–66. [Google Scholar] [CrossRef] [Green Version]
  5. Segoni, S.; Pappafico, G.; Luti, T.; Catani, F. Landslide susceptibility assessment in complex geological settings: Sensitivity to geological information and insights on its parameterization. Landslides 2020, 17, 2443–2453. [Google Scholar] [CrossRef] [Green Version]
  6. Guzzetti, F.; Salvati, P.; Stark, C.P. Evaluation of risk to the population posed by natural hazards in Italy. In Landslide Risk Management; Hungr, O., Fell, R., Couture, R., Eberhardt, E., Eds.; Taylor & Francis Group: London, UK, 2005; pp. 381–389. [Google Scholar]
  7. Zhu, A.X.; Miao, Y.; Liu, J.; Bai, S.; Zeng, C.; Ma, T.; Hong, H. A similarity-based approach to sampling absence-data for landslide susceptibility mapping using data-driven methods. Catena 2019, 183, 104188. [Google Scholar] [CrossRef]
  8. Dou, J.; Yunus, A.P.; Merghadi, A.; Shirzadi, A.; Nguyen, H.; Hussain, Y.; Avtar, R.; Chen, Y.; Pham, B.T.; Yamagishi, H. Different sampling strategies for predicting landslide susceptibilities are deemed less consequential with deep learning. Sci. Total Environ. 2020, 720, 137320. [Google Scholar] [CrossRef]
  9. Ayalew, L.; Yamagishi, H. The application of GIS-based logistic regression for landslide susceptibility mapping in the Kakuda-Yahiko Mountains, Central Japan. Geomorphology 2005, 65, 15–31. [Google Scholar] [CrossRef]
  10. Nefeslioglu, H.A.; Gokceoglu, C.; Sonmez, H. An assessment on the use of logistic regression and artificial neural networks with different sampling strategies for the preparation of landslide susceptibility maps. Eng. Geol. 2008, 97, 171–191. [Google Scholar] [CrossRef]
  11. Bai, X.; McAllister, R.R.; Beaty, R.M.; Taylor, B. Urban policy and governance in a global environment: Complex systems, scale mismatches and public participation. Curr. Opin. Environ. Sustain. 2010, 2, 129–135. [Google Scholar] [CrossRef]
  12. Regmi, N.R.; Giardino, J.R.; McDonald, E.V.; Vitek, J.D. A comparison of logistic regression-based models of susceptibility to landslides in western Colorado, USA. Landslides 2014, 11, 247–262. [Google Scholar] [CrossRef]
  13. Budimir, M.E.A.; Atkinson, P.M.; Lewis, H.G. A systematic review of landslide probability mapping using logistic regression. Landslides 2015, 12, 419–436. [Google Scholar] [CrossRef] [Green Version]
  14. Chen, W.; Xie, X.; Wang, J.; Pradhan, B.; Hong, H.; Bui, D.T.; Duan, Z.; Ma, J. A comparative study of logistic model tree, random forest, and classification and regression tree models for spatial prediction of landslide susceptibility. Catena 2017, 151, 147–160. [Google Scholar] [CrossRef] [Green Version]
  15. Zhang, S.; Li, R.; Wang, F.; Iio, A. Characteristics of landslides triggered by the 2018 Hokkaido Eastern Iburi earthquake, Northern Japan. Landslides 2019, 16, 1691–1708. [Google Scholar] [CrossRef]
  16. Rabby, Y.W.; Li, Y. Landslide inventory (2001–2017) of Chittagong hilly areas, Bangladesh. Data 2020, 5, 4. [Google Scholar] [CrossRef] [Green Version]
  17. Dikshit, A.; Pradhan, B.; Alamri, A.M. Pathways and challenges of the application of artificial intelligence to geohazards modelling. Gondwana Res. 2021, 100, 290–301. [Google Scholar] [CrossRef]
  18. Althuwaynee, O.F.; Pradhan, B.; Park, H.J.; Lee, J.H. A novel ensemble bivariate statistical evidential belief function with knowledge-based analytical hierarchy process and multivariate statistical logistic regression for landslide susceptibility mapping. Catena 2014, 114, 21–36. [Google Scholar] [CrossRef]
  19. Reichenbach, P.; Mondini, A.C.; Rossi, M. The influence of land use change on landslide susceptibility zonation: The Briga catchment test site (Messina, Italy). Environ. Manag. 2014, 54, 1372–1384. [Google Scholar] [CrossRef] [Green Version]
  20. Abedini, M.; Tulabi, S. Assessing LNRF, FR, and AHP models in landslide susceptibility mapping index: A comparative study of Nojian watershed in Lorestan province, Iran. Environ. Earth Sci. 2018, 77, 405. [Google Scholar] [CrossRef]
  21. James, G.; Witten, D.; Hastie, T.; Tibshirani, R. An Introduction to Statistical Learning; Springer: New York, NY, USA, 2013; Volume 112, p. 18. [Google Scholar]
  22. Kanwal, S.; Atif, S.; Shafiq, M. GIS based landslide susceptibility mapping of northern areas of Pakistan, a case study of Shigar and Shyok Basins. Geomat. Nat. Hazards Risk 2017, 8, 348–366. [Google Scholar] [CrossRef]
  23. Abedin, J.; Rabby, Y.W.; Hasan, I.; Akter, H. An investigation of the characteristics, causes, and consequences of June 13, 2017, landslides in Rangamati District Bangladesh. Geoenviron. Disasters 2020, 7, 23. [Google Scholar] [CrossRef]
  24. Genet, M.; Kokutse, N.; Stokes, A.; Fourcaud, T.; Cai, X.; Ji, J.; Mickovski, S. Root reinforcement in plantations of Cryptomeria japonica D. Don: Effect of tree age and stand structure on slope stability. For. Ecol. Manag. 2008, 256, 1517–1526. [Google Scholar] [CrossRef]
  25. Persichillo, M.G.; Bordoni, M.; Meisina, C.; Bartelletti, C.; Giannecchini, R.; Avanzi, G.A.; Galanti, Y.; Cevasco, A.; Brandolini, P.; Galve, J.P.; et al. Shallow landslide susceptibility analysis in relation to land use scenarios. In Landslides and Engineered Slopes. Experience, Theory and Practice; CRC Press: Boca Raton, FL, USA, 2018; pp. 1605–1612. [Google Scholar]
  26. Chen, L.; Guo, Z.; Yin, K.; Shrestha, D.P.; Jin, S. The influence of land use and land cover change on landslide susceptibility: A case study in Zhushan Town, Xuan’en County (Hubei, China). Nat. Hazards Earth Syst. Sci. 2019, 19, 2207–2228. [Google Scholar] [CrossRef] [Green Version]
  27. Meneses, B.M.; Pereira, S.; Reis, E. Effects of different land use and land cover data on the landslide susceptibility zonation of road networks. Nat. Hazards Earth Syst. Sci. 2019, 19, 471–487. [Google Scholar] [CrossRef] [Green Version]
  28. Luti, T.; Segoni, S.; Catani, F.; Munafò, M.; Casagli, N. Integration of remotely sensed soil sealing data in landslide susceptibility mapping. Remote Sens. 2020, 12, 1486. [Google Scholar] [CrossRef]
  29. Liu, J.; Wu, Z.; Zhang, H. Analysis of Changes in Landslide Susceptibility according to Land Use over 38 Years in Lixian County, China. Sustainability 2021, 13, 10858. [Google Scholar] [CrossRef]
  30. Mao, D.; Cherkauer, K.A. Impacts of land-use change on hydrologic responses in the Great Lakes region. J. Hydrol. 2009, 374, 71–82. [Google Scholar] [CrossRef]
  31. Deng, J.S.; Wang, K.; Hong, Y.; Qi, J.G. Spatio-temporal dynamics and evolution of land use change and landscape pattern in response to rapid urbanization. Landsc. Urban Plan. 2009, 92, 187–198. [Google Scholar] [CrossRef]
  32. Karimi, F.; Sultana, S.; Babakan, A.S.; Suthaharan, S. Urban expansion modeling using an enhanced decision tree algorithm. GeoInformatica 2019, 25, 715–731. [Google Scholar] [CrossRef]
  33. Hasan, S.S.; Sarmin, N.S.; Miah, M.G. Assessment of scenario-based land use changes in the Chittagong Hill Tracts of Bangladesh. Environ. Dev. 2020, 34, 100463. [Google Scholar] [CrossRef]
  34. Chen, W.; Xie, X.; Peng, J.; Shahabi, H.; Hong, H.; Bui, D.T.; Duan, Z.; Li, S.; Zhu, A.X. GIS-based landslide susceptibility evaluation using a novel hybrid integration approach of bivariate statistical based random forest method. Catena 2018, 164, 135–149. [Google Scholar] [CrossRef]
  35. Ahmed, B. Landslide susceptibility mapping using multi-criteria evaluation techniques in Chittagong Metropolitan Area, Bangladesh. Landslides 2015, 12, 1077–1095. [Google Scholar] [CrossRef] [Green Version]
  36. Rabby, Y.W.; Li, Y. An integrated approach to map landslides in Chittagong Hilly Areas, Bangladesh, using Google Earth and field mapping. Landslides 2019, 16, 633–645. [Google Scholar] [CrossRef]
  37. Rahman, M.S.; Ahmed, B.; Di, L. Landslide initiation and runout susceptibility modeling in the context of hill cutting and rapid urbanization: A combined approach of weights of evidence and spatial multi-criteria. J. Mt. Sci. 2017, 14, 1919–1937. [Google Scholar] [CrossRef]
  38. Prothom Alo. Rangamati Landslide Death Toll 118. 2017. Available online: https://en.prothomalo.com/bangladesh/news/151605/Rangamati-Landslide-death-toll-118 (accessed on 22 January 2019).
  39. Bangladesh Bureau of Statistics (BBS). Population Census 2011, Rangamati; Ministry of Planning: Dhaka, Bangladesh, 2011.
  40. Rabby, Y.W.; Hossain, M.B.; Abedin, J. Landslide Susceptibility Mapping in Three Upazilas of Rangamati Hill District Bangladesh: Application and Comparison of GIS-based Machine Learning Methods. Geocarto Int. 2020, 1–24. [Google Scholar] [CrossRef]
  41. Anderson, J.R. A Land Use and Land Cover Classification System for Use with Remote Sensor Data; US Government Printing Office: Washington, DC, USA, 1976; Volume 964.
  42. Dewan, A.M.; Yamaguchi, Y. Land use and land cover change in Greater Dhaka, Bangladesh: Using remote sensing to promote sustainable urbanization. Appl. Geogr. 2009, 29, 390–401. [Google Scholar] [CrossRef]
  43. Billah, M.M.; Rahman, M.M.; Abedin, J.; Akter, H. Land cover change and its impact on human–elephant conflict: A case from Fashiakhali forest reserve in Bangladesh. SN Appl. Sci. 2021, 3, 649. [Google Scholar] [CrossRef]
  44. Lillesand, T.; Kiefer, R.W.; Chipman, J. Remote Sensing and Image Interpretation; John Wiley & Sons: Hoboken, NJ, USA, 2015. [Google Scholar]
  45. Gismondi, M.; Kamusoko, C.; Furuya, T.; Tomimura, S.; Maya, M. MOLUSCE–An Open Source Land Use Change Analyst for QGIS. 2014. Available online: https://www.ajiko.co.jp/download/pdf_tf2014/p62-63.pdf (accessed on 8 November 2021).
  46. Saputra, M.H.; Lee, H.S. Prediction of land use and land cover changes for north sumatra, indonesia, using an artificial-neural-network-based cellular automaton. Sustainability 2019, 11, 3024. [Google Scholar] [CrossRef] [Green Version]
  47. Li, X.; Yeh, A.G.O. Neural-network-based cellular automata for simulating multiple land use changes using GIS. Int. J. Geogr. Inf. Sci. 2002, 16, 323–343. [Google Scholar] [CrossRef]
  48. Brownlee, J. Understand the Inpact of Learning Rate on Neural Network Performance. Machine Learning Mastery. 2019. Available online: https://books.google.co.kr/books?hl=ko&lr=&id=DOamDwAAQBAJ&oi=fnd&pg=PP1&dq=Brownlee,+J.+Understand+the+inpact+of+learning+rate+on+neural+network+performance,+Machine+Learning+Mastery+2019&ots=3rwsdJEJER&sig=1T5FcUq3hDxbg8v5QIUgfZ8KlL0#v=onepage&q&f=false (accessed on 8 November 2021).
  49. Breiman, L. Random forests. Mach. Learn. 2001, 45, 5–32. [Google Scholar] [CrossRef] [Green Version]
  50. Pham, B.T.; Prakash, I.; Dou, J.; Singh, S.K.; Trinh, P.T.; Tran, H.T.; Le, T.M.; Van Phong, T.; Khoi, D.K.; Shirzadi, A.; et al. A novel hybrid approach of landslide susceptibility modelling using rotation forest ensemble and different base classifiers. Geocarto Int. 2020, 35, 1267–1292. [Google Scholar] [CrossRef]
  51. Liaward, A.; Wiener, M. Classification and regression by randomForest. R News 2002, 2, 18–22. [Google Scholar]
  52. Ahmed, B.; Rahman, M.S.; Sammonds, P.; Islam, R.; Uddin, K. Application of geospatial technologies in developing a dynamic landslide early warning system in a humanitarian context: The Rohingya refugee crisis in Cox’s Bazar, Bangladesh. Geomat. Nat. Hazards Risk 2020, 11, 446–468. [Google Scholar] [CrossRef]
Figure 1. Location of Rangamati municipality in Rangamati district, Bangladesh: (a) Rangamati Municipality; (b) Location of Rangamati Municipality in Rangamati District; (c) Location of Rangamati District in Bangladesh.
Ijgi 11 00089 g001
Figure 2. Relatively stable causal factors: (a) elevation, (b) slope, (c) aspect, (d) plan curvature, (e) profile curvature, (f) distance from the drainage network, (g) TWI, (h) SPI, (i) distance from fault lines.
Ijgi 11 00089 g002aIjgi 11 00089 g002b
Figure 3. Land use/land cover maps (dynamic causal factors): (a) land use/land cover of 2008, (b) LULC of 2018, (c) simulated LULC (2028), (d) proposed land use/land cover.
Ijgi 11 00089 g003
Figure 4. Variable importance plot for random forest models based on three LULC scenarios (SPI = stream power index; PLC = plan curvature; TWI = topographic wetness index; PRC = profile curvature; DR = distance from drainage; DF = distance from fault lines).
Ijgi 11 00089 g004
Figure 5. Landslide susceptibility maps based on random forest: (a) existing land use/land cover, (b) proposed land use/land cover, (c) simulated land use/land cover for 2028.
Ijgi 11 00089 g005
Table 1. Influencing factors of LULC in Rangamati municipality.
Factor TypeInfluencing FactorData Source
Socioeconomic FactorsPopulation DensityLandScan Project
Proximity to Building InfrastructureDistance from the Road NetworkGeoDash
Distance from Urban AreasLandsat 8
Climatic VariablesRainfallBangladesh Meteorological Department (BMD)
ElevationASTER (30 m)
SlopeASTER (30 m)
NDVIAbedin et al., 2020
Distance from Drainage NetworkGeoDash
Table 2. Transitional probability matrix of different land use/land covers in Rangamati municipality from 2008 to 2018.
LULC TypesWaterbodiesVegetationBare LandBuilt-Up
Waterbodies0.900.090.00.0
Vegetation0.040.360.280.34
Bare land0.00.010.930.06
Built up0.00.080.040.88
Table 3. Percentage of LULC change in different LULC scenarios.
ScenarioYearWaterbodies (%)Vegetation (%)Built-Up (%)Bare Land (%)
200850.240.24.35.1
Base Year201848.936.58.26.5
Business as Usual (BAU)202840.830.714.510.6
Proposed 46.719.214.919.2
Table 4. Percentage of area under different susceptibility zones.
ModelLand UseSusceptibilityArea (%)Increase (+) or Decrease (−) (Based on Existing Susceptibility) (%)
Random ForestExistingLow63.6-
Moderate16.2-
High20.2-
ProposedLow59.0−7.2
Moderate15.0−8.0
High26.0+28.7
2028 (Simulated)Low53.0−16.7
Moderate19.9+22.8
High27.1+34.2
Table 5. Percentage of landslide susceptibility classes in every LULC class in different scenarios.
Susceptibility ClassLand UseVegetation (%)Waterbodies (%)Bare Land
(%)
Built-Up
(%)
LowExisting58.295.837.953.8
Moderate22.44.228.923.8
High19.40.033.222.4
ProposedVegetation (%)Waterbodies (%)Bare land
(%)
Built-up
(%)
Low37.378.412.238.3
Moderate22.213.020.034.6
High40.58.667.827.1
SimulatedVegetation (%)Waterbodies (%)Bare land
(%)
Built-up
(%)
Low22.169.07.611.2
Moderate43.531.027.046.4
High34.40.065.442.4
Table 6. Success and prediction rates of random forest models.
ModelLand Use DataSuccess RatePrediction Rate
Random ForestExisting88.982.7
Proposed-81.4
2028-78.3
Publisher’s Note: MDPI stays neutral with regard to jurisdictional claims in published maps and institutional affiliations.

