
The Impact of Urban Public Transport on Residential Transaction Prices: A Case Study of Poznań, Poland


Abstract
1. Introduction
1.1. Urban Public Transport
1.2. Residential Housing Market
2. Materials and Methods
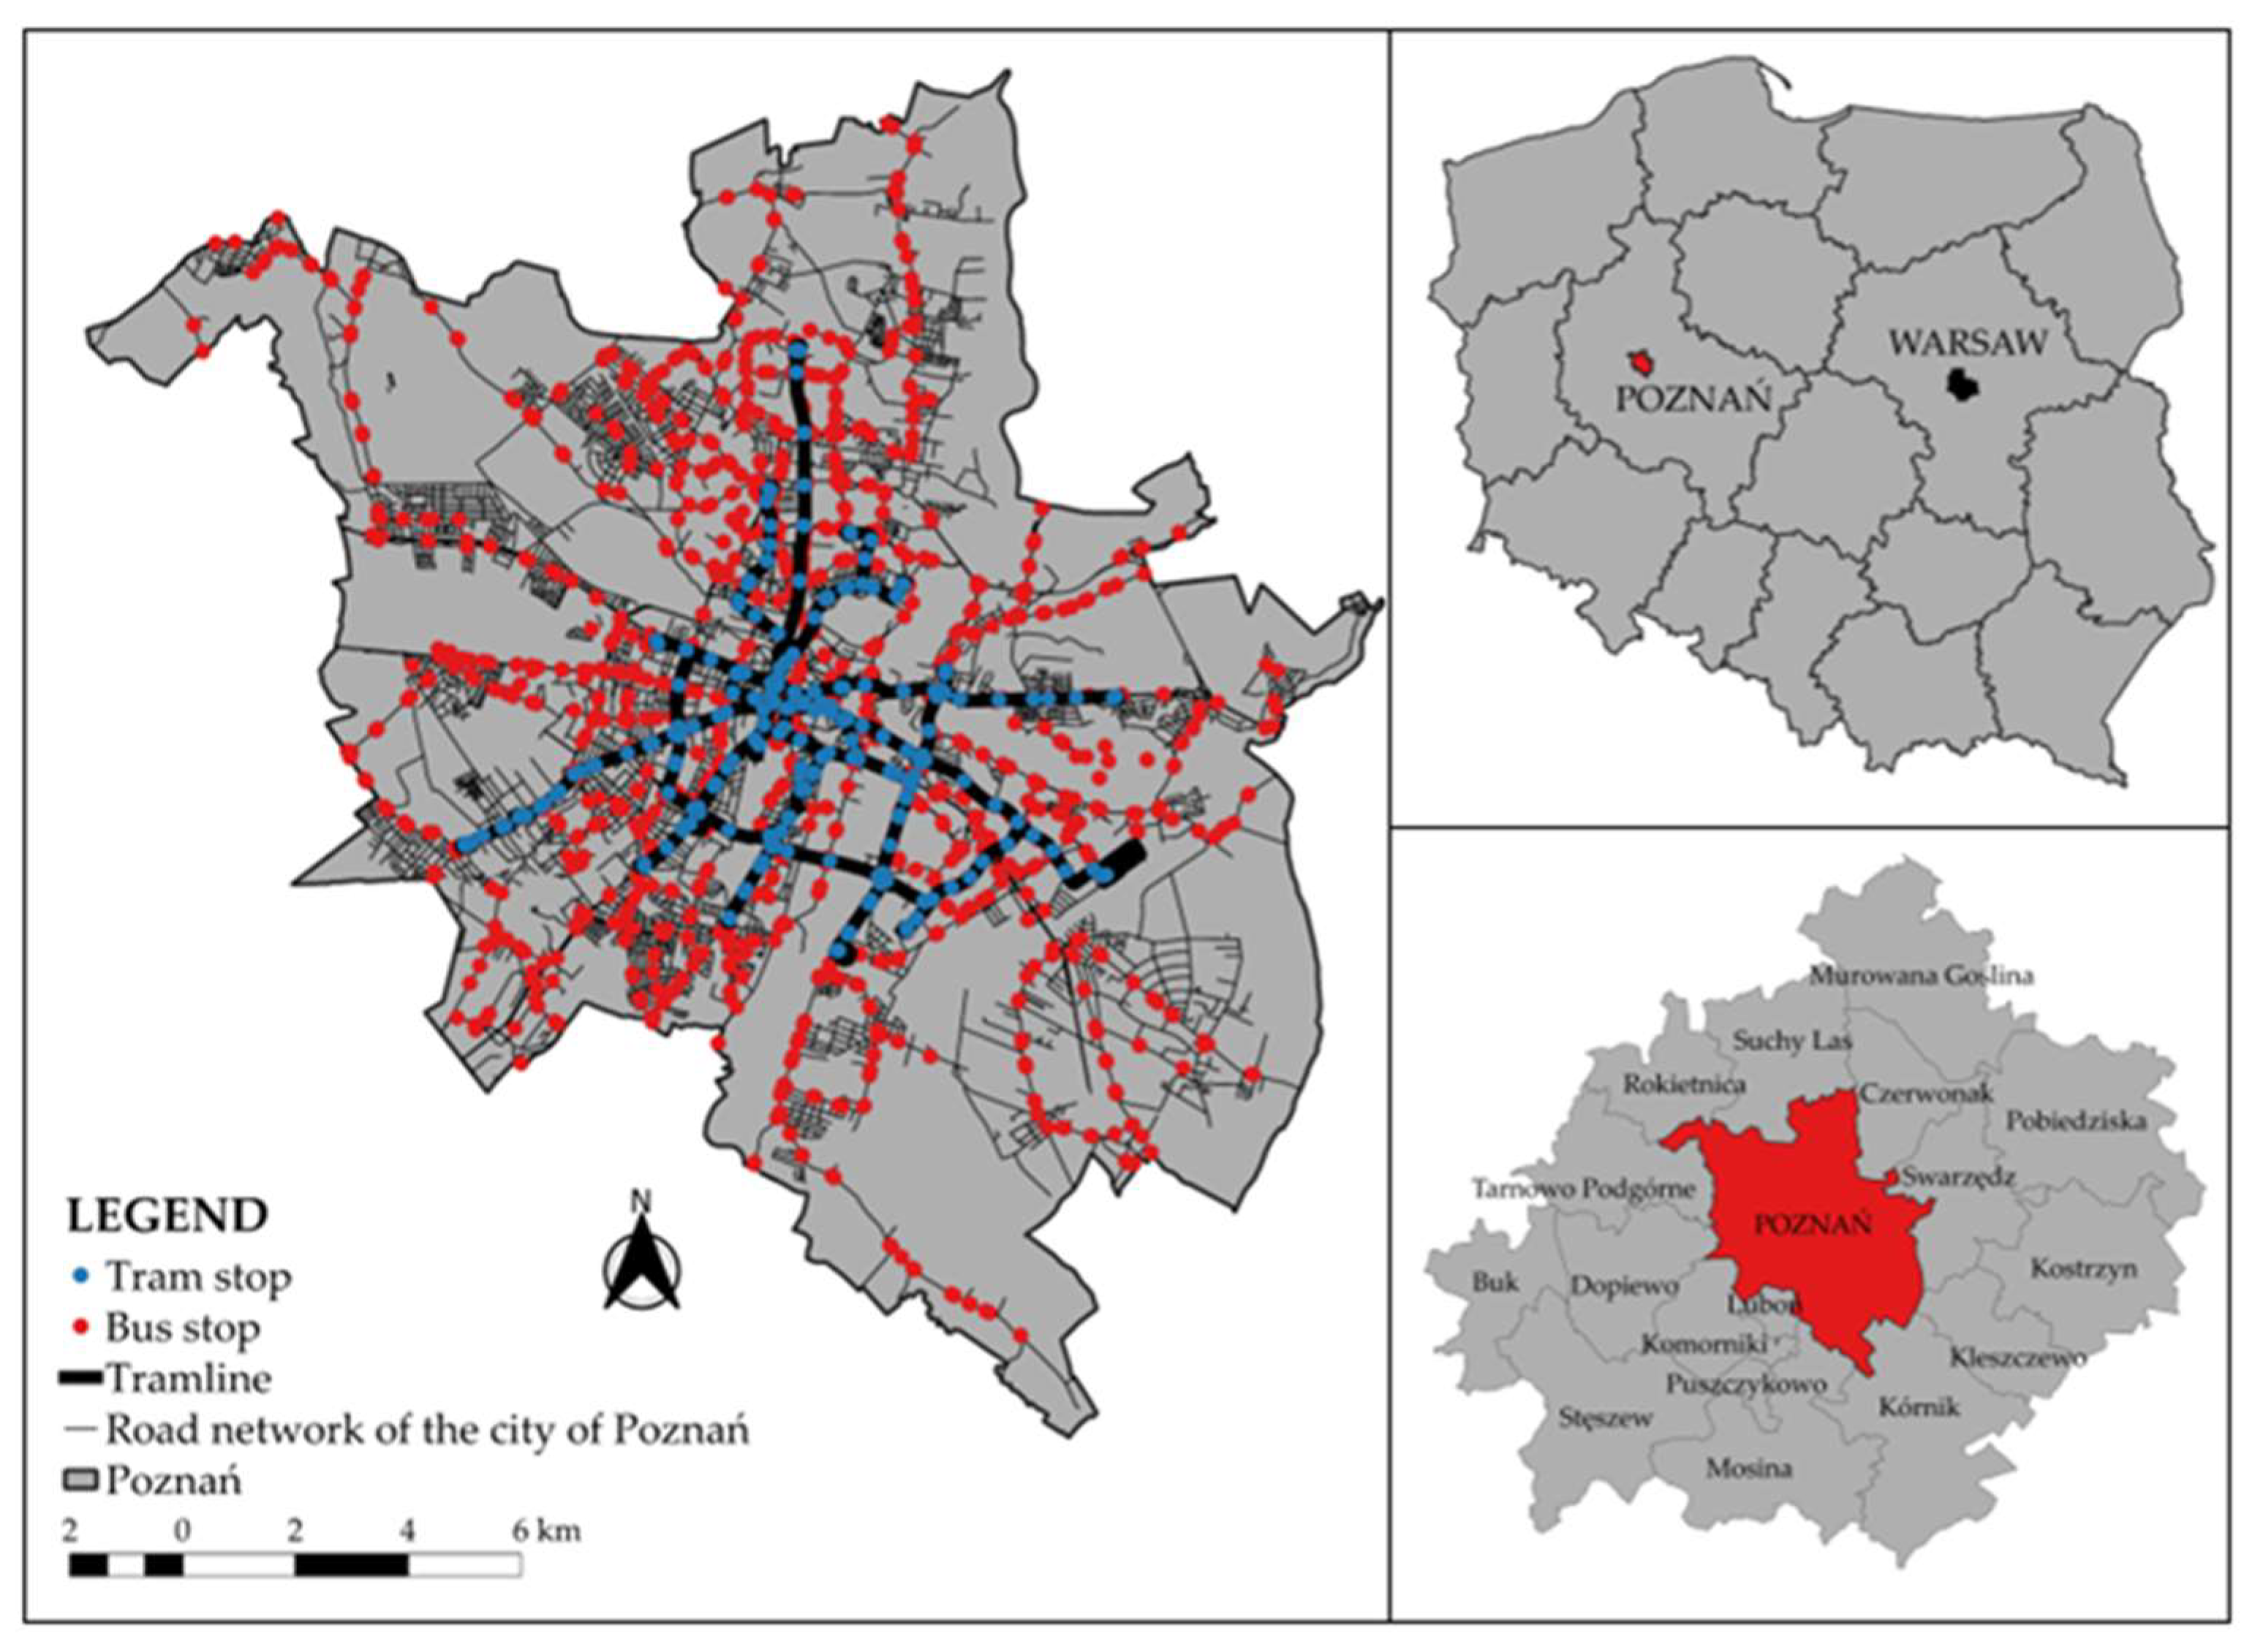
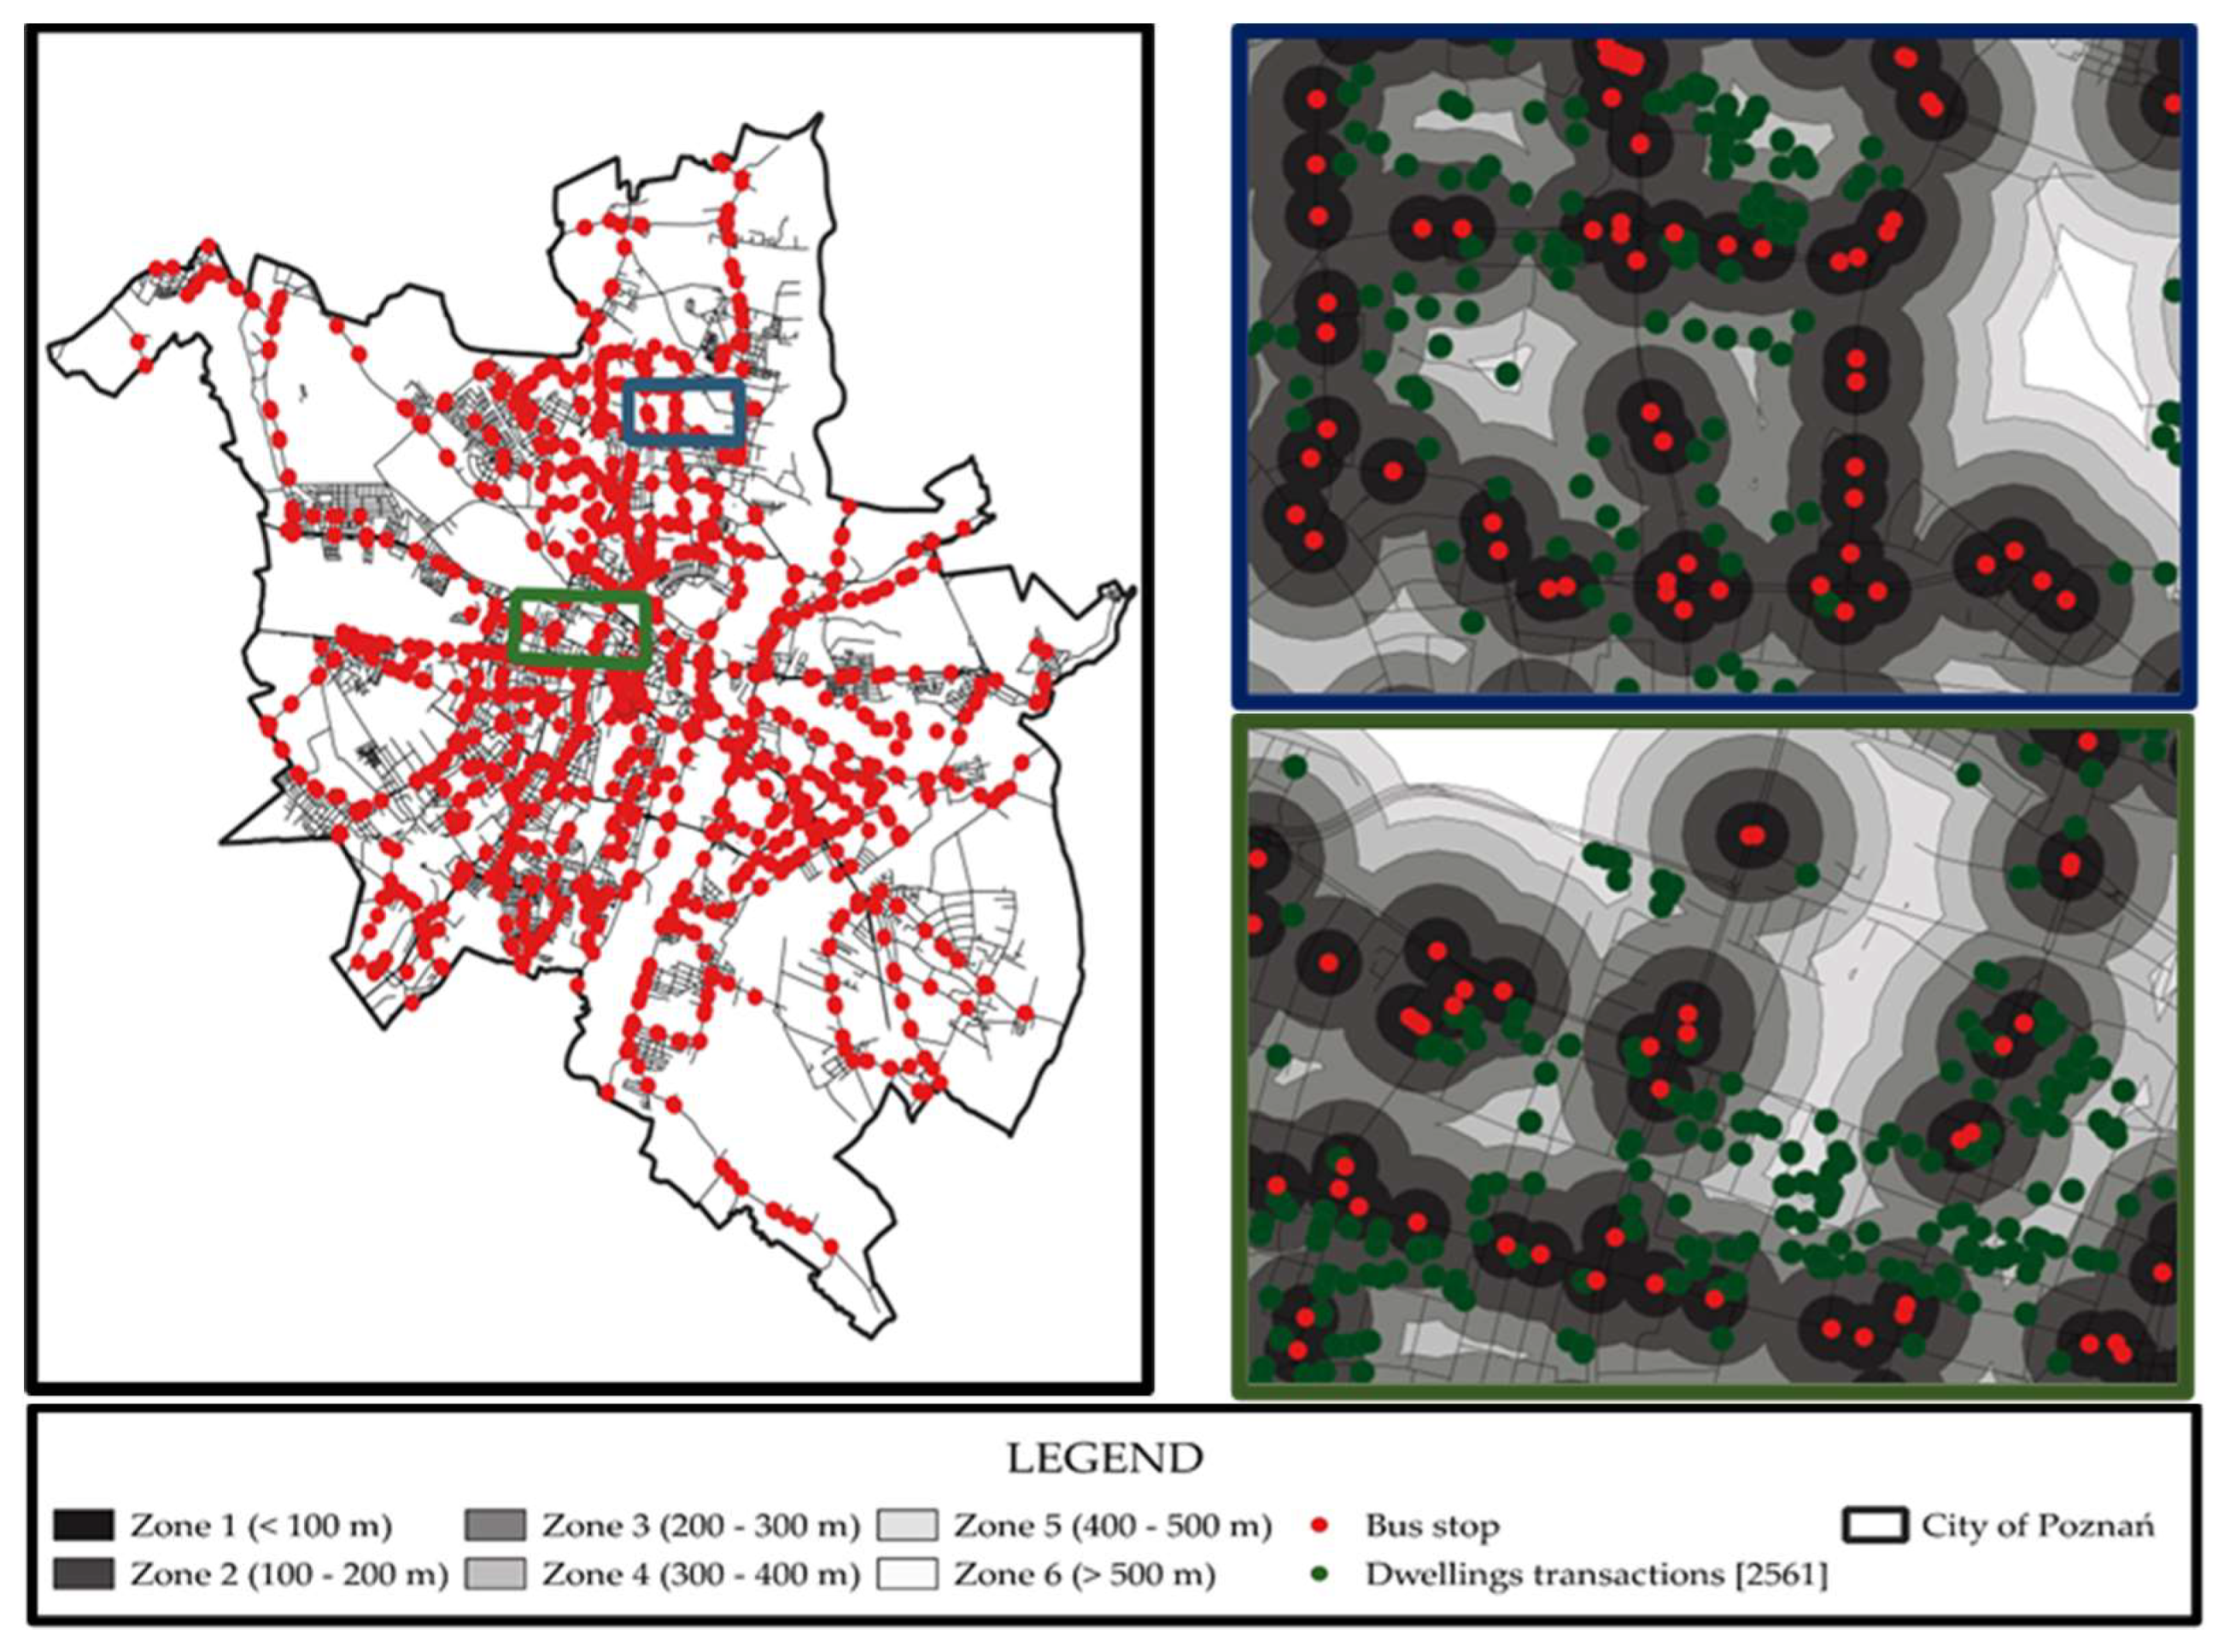
2.1. Study Site and Data
2.2. Methods
2.3. Variables
3. Results
3.1. Spatial Analysis
3.2. Statistical Analysis
4. Discussion
Author Contributions
Funding
Institutional Review Board Statement
Informed Consent Statement
Data Availability Statement
Conflicts of Interest
References
- Mahmoudi, R.; Shetab-Boushehri, S.N.; Hejazi, S.R.; Emrouznejad, A. Determining the relative importance of sustainability evaluation criteria of urban transportation network. Sustain. Cities Soc. 2019, 47, 101493. [Google Scholar] [CrossRef]
- Lucas, K. Transport and social exclusion: Where are we now? Transp. Policy 2012, 20, 105–113. [Google Scholar] [CrossRef]
- Giuffrida, N.; Inturri, G.; Caprì, S.; Spica, S.; Ignaccolo, M. The impact of a bus rapid transit line on spatial accessibility and transport equity: The case of Catania. In Transport Infrastructure and Systems; CRC Press: London, UK, 2017; pp. 753–758. [Google Scholar] [CrossRef]
- Currie, G.; Richardson, T.; Smyth, P.; Vella-Brodrick, D.; Hine, J.; Lucas, K.; Stanley, J.; Morris, J.; Kinnear, R.; Stanley, J. Investigating links between transport disadvantage, social exclusion and well-being in Melbourne–Updated results. Res. Transp. Econ. 2010, 29, 287–295. [Google Scholar] [CrossRef]
- Wong, R.C.P.; Szeto, W.Y.; Yang, L.; Li, Y.C.; Wong, S.C. Public transport policy measures for improving elderly mobility. Transp. Policy 2018, 63, 73–79. [Google Scholar] [CrossRef]
- Pojani, D.; Stead, D. Sustainable Urban Transport in the Developing World: Beyond Megacities. Sustainability 2015, 7, 7784–7805. [Google Scholar] [CrossRef]
- Buchanan, M. The benefits of public transport. Nat. Phys. 2019, 15, 876. [Google Scholar] [CrossRef]
- Johnson, D.; Ercolani, M.; Mackie, P. Econometric analysis of the link between public transport accessibility and employment. Transp. Policy 2017, 60, 1–9. [Google Scholar] [CrossRef]
- Saif, M.A.; Zefreh, M.M.; Torok, A. Public transport accessibility: A literature review. Period. Polytech. Transp. Eng. 2019, 47, 36–43. [Google Scholar] [CrossRef]
- Debrezion, G.; Pels, E.; Rietveld, P. The impact of rail transport on real estate prices: An empirical analysis of the Dutch housing market. Urban Stud. 2011, 48, 997–1015. [Google Scholar] [CrossRef]
- Xu, T.; Zhang, M.; Aditjandra, P.T. The impact of urban rail transit on commercial property value: New evidence from Wuhan, China. Transp. Res. Part A Policy Pract. 2016, 91, 223–235. [Google Scholar] [CrossRef]
- Pagliara, F.; Papa, E. Urban rail systems investments: An analysis of the impacts on property values and residents’ location. J. Transp. Geogr. 2011, 19, 200–211. [Google Scholar] [CrossRef]
- Li, H.; Wei, Y.D.; Wu, Y.; Tian, G. Analyzing housing prices in Shanghai with open data: Amenity, accessibility and urban structure. Cities 2019, 91, 165–179. [Google Scholar] [CrossRef]
- Berawi, M.A.; Miraj, P.; Saroji, G.; Sari, M. Impact of rail transit station proximity to commercial property prices: Utilizing big data in urban real estate. J. Big Data 2020, 7, 71. [Google Scholar] [CrossRef]
- Lieske, S.N.; van den Nouwelant, R.; Han, J.H.; Pettit, C. A novel hedonic price modelling approach for estimating the impact of transportation infrastructure on property prices. Urban Stud. 2021, 58, 182–202. [Google Scholar] [CrossRef]
- Trojanek, R.; Gluszak, M. Spatial and time effect of subway on property prices. J. Hous. Built Environ. 2018, 33, 359–384. [Google Scholar] [CrossRef]
- Yang, L.; Chau, K.W.; Szeto, W.Y.; Cui, X.; Wang, X. Accessibility to transit, by transit, and property prices: Spatially varying relationships. Transp. Res. Part D Transp. Environ. 2020, 85, 102387. [Google Scholar] [CrossRef]
- Yang, L.; Zhou, J.; Shyr, O.F. Does bus accessibility affect property prices? Cities 2019, 84, 56–65. [Google Scholar] [CrossRef]
- Heres, D.R.; Jack, D.; Salon, D. Do public transport investments promote urban economic development? Evidence from bus rapid transit in Bogotá, Colombia. Transportation 2014, 41, 57–74. [Google Scholar] [CrossRef]
- Banister, D.; Thurstain-Goodwin, M. Quantification of the non-transport benefits resulting from rail investment. J. Transp. Geogr. 2011, 19, 212–223. [Google Scholar] [CrossRef]
- Neto, E.S.V.; Pereira, R.H.; de Oliveira Trindade, A.G. Property value assessment in Rio de Janeiro: The effects of transport investments. ANPET 2019. Available online: https://bibliotecadigital.fgv.br/dspace;/bitstream/handle/10438/29485/Property%20Value%20Assessment.pdf (accessed on 30 September 2021).
- Xie, R.; Wei, D.; Han, F.; Lu, Y.; Fang, J.; Liu, Y.; Wang, J. The effect of traffic density on smog pollution: Evidence from Chinese cities. Technol. Forecast. Soc. Change 2019, 144, 421–427. [Google Scholar] [CrossRef]
- Jacyna, M.; Wasiak, M.; Lewczuk, K.; Karoń, G. Noise and environmental pollution from transport: Decisive problems in developing ecologically efficient transport systems. J. Vibroengineering 2017, 19, 5639–5655. [Google Scholar] [CrossRef]
- Pietrzak, K.; Pietrzak, O. Environmental Effects of Electromobility in a Sustainable Urban Public Transport. Sustainability 2020, 12, 1052. [Google Scholar] [CrossRef]
- Diao, M. Towards sustainable urban transport in Singapore: Policy instruments and mobility trends. Transp. Policy 2019, 81, 320–330. [Google Scholar] [CrossRef]
- Abidoye, R.B.; Chan, A.P. Modelling property values in Nigeria using artificial neural network. J. Prop. Res. 2017, 34, 36–53. [Google Scholar] [CrossRef]
- Cordera, R.; Chiarazzo, V.; Ottomanelli, M.; dell’Olio, L.; Ibeas, A. The impact of undesirable externalities on residential property values: Spatial regressive models and an empirical study. Transp. Policy 2019, 80, 177–187. [Google Scholar] [CrossRef]
- Chen, Y.; Yazdani, M.; Mojtahedi, M.; Newton, S. The impact on neighbourhood residential property valuations of a newly proposed public transport project: The Sydney Northwest Metro case study. Transp. Res. Interdiscip. Perspect. 2019, 3, 100070. [Google Scholar] [CrossRef]
- Potoglou, D.; Maoh, H.; Wang, Y.; Orford, S. The Impact of Public Transport Infrastructure on Residential Land Value: Using Spatial Analysis to Uncover Policy-Relevant Processes. In The Practice of Spatial Analysis; Springer: Cham, Switzerland, 2019; pp. 275–293. [Google Scholar] [CrossRef]
- Kondo, M.C.; Fluehr, J.M.; McKeon, T.; Branas, C.C. Urban Green Space and Its Impact on Human Health. Int. J. Environ. Res. Public Health 2018, 15, 445. [Google Scholar] [CrossRef]
- Riechers, M.; Barkmann, J.; Tscharntke, T. Perceptions of cultural ecosystem services from urban green. Ecosyst. Serv. 2016, 17, 33–39. [Google Scholar] [CrossRef]
- Vieira, J.; Matos, P.; Mexia, T.; Silva, P.; Lopes, N.; Freitas, C.; Correia, O.; Santos-Reis, M.; Branquinho, C.; Pinho, P. Green spaces are not all the same for the provision of air purification and climate regulation services: The case of urban parks. Environ. Res. 2018, 160, 306–313. [Google Scholar] [CrossRef] [PubMed]
- Sakieh, Y.; Jaafari, S.; Ahmadi, M.; Danekar, A. Green and calm: Modeling the relationships between noise pollution propagation and spatial patterns of urban structures and green covers. Urban For. Urban Green. 2017, 24, 195–211. [Google Scholar] [CrossRef]
- Hewitt, C.N.; Ashworth, K.; MacKenzie, A.R. Using green infrastructure to improve urban air quality (GI4AQ). Ambio 2020, 49, 62–73. [Google Scholar] [CrossRef]
- Ghorbani, S.; Afgheh, S.M. Forecasting the house price for Ahvaz City: The comparison of the hedonic and artificial neural network models. J. Urban Econ. Manag. 2017, 5, 29–44. [Google Scholar] [CrossRef][Green Version]
- Xiao, Y.; Chen, X.; Li, Q.; Yu, X.; Chen, J.; Guo, J. Exploring Determinants of Housing Prices in Beijing: An Enhanced Hedonic Regression with Open Access POI Data. ISPRS Int. J. Geo-Inf. 2017, 6, 358. [Google Scholar] [CrossRef]
- Hong, J.; Choi, H.; Kim, W.S. A house price valuation based on the random forest approach: The mass appraisal of residential property in South Korea. Int. J. Strateg. Prop. Manag. 2020, 24, 140–152. [Google Scholar] [CrossRef]
- Chwiałkowski, C.; Zydroń, A. Socio-Economic and Spatial Characteristics of Wielkopolski National Park: Application of the Hedonic Pricing Method. Sustainability 2021, 13, 5001. [Google Scholar] [CrossRef]
- Mathur, S. Impact of transit stations on house prices across entire price spectrum: A quantile regression approach. Land Use Policy 2020, 99, 104828. [Google Scholar] [CrossRef]
- Trojanek, R.; Tanas, J.; Raslanas, S.; Banaitis, A. The Impact of Aircraft Noise on Housing Prices in Poznan. Sustainability 2017, 9, 2088. [Google Scholar] [CrossRef]
- Park, J.H.; Lee, D.K.; Park, C.; Kim, H.G.; Jung, T.Y.; Kim, S. Park Accessibility Impacts Housing Prices in Seoul. Sustainability 2017, 9, 185. [Google Scholar] [CrossRef]
- Kisiała, W.; Racka, I. Spatial and Statistical Analysis of Urban Poverty for Sustainable City Development. Sustainability 2021, 13, 858. [Google Scholar] [CrossRef]
- Nakamura, S.; Avner, P. Spatial distributions of job accessibility, housing rents, and poverty: The case of Nairobi. J. Hous. Econ. 2021, 51, 101743. [Google Scholar] [CrossRef]
- Allam, H.; Bliemel, M.; Spiteri, L.; Blustein, J.; Ali-Hassan, H. Applying a multi-dimensional hedonic concept of intrinsic motivation on social tagging tools: A theoretical model and empirical validation. Int. J. Inf. Manag. 2019, 45, 211–222. [Google Scholar] [CrossRef]
- Poor, P.J.; Pessagno, K.L.; Paul, R.W. Exploring the hedonic value of ambient water quality: A local watershed-based study. Ecol. Econ. 2007, 60, 797–806. [Google Scholar] [CrossRef]
- Moore, M.R.; Doubek, J.P.; Xu, H.; Cardinale, B.J. Hedonic Price Estimates of Lake Water Quality: Valued Attribute, Instrumental Variables, and Ecological-Economic Benefits. Ecol. Econ. 2020, 176, 106692. [Google Scholar] [CrossRef]
- Rebelo, J.; Lourenço-Gomes, L.; Gonçalves, T.; Caldas, J. A hedonic price analysis for the Portuguese wine market: Does the distribution channel matter? J. Appl. Econ. 2019, 22, 40–59. [Google Scholar] [CrossRef]
- Fedderke, J.W.; Li, K. Art in Africa: Hedonic price analysis of the South African fine art auction market, 2009–2014. Econ. Model. 2020, 84, 88–101. [Google Scholar] [CrossRef]
- Wang, F.; Zheng, X. Performance analysis of investing in Chinese oil paintings based on a hedonic regression model of price index. China Financ. Rev. Int. 2017, 7, 323–342. [Google Scholar] [CrossRef]
- Chen, H.; He, Z.; Hong, W.; Liu, J. An Assessment of Stumpage Price and the Price Index of Chinese Fir Timber Forests in Southern China Using a Hedonic Price Model. Forests 2020, 11, 436. [Google Scholar] [CrossRef]
- Colwell, P.F.; Dilmore, G. Who Was First? An Examination of an Early Hedonic Study. Land Econ. 1999, 75, 620–626. [Google Scholar] [CrossRef]
- Coulson, E. Monograph on Hedonic Estimation and Housing Markets; Penn State University: State College, PA, USA, 2008. [Google Scholar]
- Lancaster, K.J. A new approach to consumer theory. J. Political Econ. 1966, 74, 132. [Google Scholar] [CrossRef]
- Rosen, S. Hedonic Prices and Implicit Markets: Product Differentiation in Pure Competition. J. Political Econ. 1974, 82, 34–55. [Google Scholar] [CrossRef]
- Maclennan, D. Some Thoughts on the Nature and Purpose of House Price Studies. Urban Stud. 1977, 14, 59–71. [Google Scholar] [CrossRef]
- Trojanek, R.; Gluszak, M.; Tanas, J. The Effect of Urban Green Spaces on House Prices in Warsaw. Int. J. Strateg. Prop. Manag. 2018, 22, 358–371. [Google Scholar] [CrossRef]
- Trojanek, R. The impact of aircraft noise on the value of dwellings—The case of Warsaw Chopin airport in Poland. J. Int. Stud. 2014, 7, 155–161. [Google Scholar] [CrossRef] [PubMed]
- Zygmunt, R.; Gluszak, M. Forest proximity impact on undeveloped land values: A spatial hedonic study. For. Policy Econ. 2015, 50, 82–89. [Google Scholar] [CrossRef]
- Tomal, M. Modelling Housing Rents Using Spatial Autoregressive Geographically Weighted Regression: A Case Study in Cracow, Poland. ISPRS Int. J. Geo-Inf. 2020, 9, 346. [Google Scholar] [CrossRef]
- Trojanek, R.; Tanaś, J.; Trojanek, M. The effect of perpetual usufruct on single-family house prices in Poznań. J. Int. Stud. 2019, 12, 212–221. [Google Scholar] [CrossRef] [PubMed]
- Trojanek, R. The impact of green areas on dwelling prices: The case of Poznań city. Entrep. Bus. Econ. Rev. 2016, 4, 27–35. [Google Scholar] [CrossRef]
- Zhang, B.; Li, W.; Lownes, N.; Zhang, C. Estimating the Impacts of Proximity to Public Transportation on Residential Property Values: An Empirical Analysis for Hartford and Stamford Areas, Connecticut. ISPRS Int. J. Geo-Inf. 2021, 10, 44. [Google Scholar] [CrossRef]
- Ransom, M.R. The effect of light rail transit service on nearby property values: Quasi-experimental evidence from Seattle. J. Transp. Land Use 2018, 11, 387–404. [Google Scholar] [CrossRef]
- Zhong, H.; Li, W. Rail transit investment and property values: An old tale retold. Transp. Policy 2016, 51, 33–48. [Google Scholar] [CrossRef]
- Pilgram, C.A.; West, S.E. Fading premiums: The effect of light rail on residential property values in Minneapolis, Minnesota. Reg. Sci. Urban Econ. 2018, 69, 1–10. [Google Scholar] [CrossRef]
- Gallo, M. The Impact of Urban Transit Systems on Property Values: A Model and Some Evidences from the City of Naples. J. Adv. Transp. 2018, 2018, 1767149. [Google Scholar] [CrossRef]
- Martinez, L.M.; Viegas, J.M. Effects of Transportation Accessibility on Residential Property Values: Hedonic Price Model in the Lisbon, Portugal, Metropolitan Area. Transp. Res. Rec. 2009, 2115, 127–137. [Google Scholar] [CrossRef]
- Li, Z. The impact of metro accessibility on residential property values: An empirical analysis. Res. Transp. Econ. 2018, 70, 52–56. [Google Scholar] [CrossRef]
- Cervero, R.; Kang, C.D. Bus rapid transit impacts on land uses and land values in Seoul, Korea. Transp. Policy 2011, 18, 102–116. [Google Scholar] [CrossRef]
- Ma, L.; Ye, R.; Titheridge, H. Capitalization Effects of Rail Transit and Bus Rapid Transit on Residential Property Values in a Booming Economy: Evidence from Beijing. Transp. Res. Rec. 2014, 2451, 139–148. [Google Scholar] [CrossRef]
- Escobedo, F.J.; Adams, D.C.; Timilsina, N. Urban forest structure effects on property value. Ecosyst. Serv. 2015, 12, 209–217. [Google Scholar] [CrossRef]
- Wen, H.; Xiao, Y.; Zhang, L. Spatial effect of river landscape on housing price: An empirical study on the Grand Canal in Hangzhou, China. Habitat Int. 2017, 63, 34–44. [Google Scholar] [CrossRef]
- Rahadi, R.A.; Wiryono, S.K.; Koesrindartoto, D.P.; Syamwil, I.B. Attributes Influencing Housing Product Value and Price in Jakarta Metropolitan Region. Procedia-Soc. Behav. Sci. 2013, 101, 368–378. [Google Scholar] [CrossRef]
- Aluko, O. The effects of location and neighbourhood attributes on housing values in metropolitan Lagos. Ethiop. J. Environ. Stud. Manag. 2011, 4, 69–82. [Google Scholar] [CrossRef]
- Daams, M.N.; Sijtsma, F.J.; van der Vlist, A.J. The effect of natural space on nearby property prices: Accounting for perceived attractiveness. Land Econ. 2016, 92, 389–410. [Google Scholar] [CrossRef]
- Čeh, M.; Kilibarda, M.; Lisec, A.; Bajat, B. Estimating the Performance of Random Forest versus Multiple Regression for Predicting Prices of the Apartments. ISPRS Int. J. Geo-Inf. 2018, 7, 168. [Google Scholar] [CrossRef]
- Liu, T.; Hu, W.; Song, Y.; Zhang, A. Exploring spillover effects of ecological lands: A spatial multilevel hedonic price model of the housing market in Wuhan, China. Ecol. Econ. 2020, 170, 106568. [Google Scholar] [CrossRef]
- Wu, H.; Jiao, H.; Yu, Y.; Li, Z.; Peng, Z.; Liu, L.; Zeng, Z. Influence Factors and Regression Model of Urban Housing Prices Based on Internet Open Access Data. Sustainability 2018, 10, 1676. [Google Scholar] [CrossRef]
- Ko, H.J.; Yun, K.B.; Shim, Y.J.; Hwang, H.Y. Impact analysis of an eco-park on the adjacent apartment unit price by using the hedonic model. J. Korean Hous. Assoc. 2011, 22, 47–57. [Google Scholar] [CrossRef]
- Szczepańska, A.; Senetra, A.; Wasilewiczh, M. The Influence of Traffic Noise on Apartment Prices on the Example of a European Urban Agglomeration. Sustainability 2020, 12, 801. [Google Scholar] [CrossRef]
- Ooi, J.T.; Le, T.T.; Lee, N.J. The impact of construction quality on house prices. J. Hous. Econ. 2014, 26, 126–138. [Google Scholar] [CrossRef]
- Morano, P.; Tajani, F. Bare ownership evaluation. Hedonic price model vs. artificial neural network. Int. J. Bus. Intell. Data Min. 2013, 8, 340. [Google Scholar] [CrossRef]
- Ottensmann, J.R.; Payton, S.; Man, J. Urban location and housing prices within a hedonic model. J. Reg. Anal. Policy 2008, 38. [Google Scholar] [CrossRef]
- Tomal, M. The impact of macro factors on apartment prices in Polish counties: A two-stage quantile spatial regression approach. Real Estate Manag. Valuat. 2019, 27, 1–14. [Google Scholar] [CrossRef]
- Zancanella, P.; Bertoldi, P.; Boza-Kiss, B. Energy Efficiency, the Value of Buildings and the Payment Default Risk; Publications Office of the European Union: Luxembourg, 2018. [Google Scholar]
- Jasińska, E.; Preweda, E. Statistical Modelling of the Market Value of Dwellings, on the Example of the City of Kraków. Sustainability 2021, 13, 9339. [Google Scholar] [CrossRef]
- Sah, V.; Conroy, S.J.; Narwold, A. Estimating school proximity effects on housing prices: The importance of robust spatial controls in hedonic estimations. J. Real Estate Financ. Econ. 2016, 53, 50–76. [Google Scholar] [CrossRef]
- Cordera, R.; Coppola, P.; dell’Olio, L.; Ibeas, Á. The impact of accessibility by public transport on real estate values: A comparison between the cities of Rome and Santander. Transp. Res. Part A Policy Pract. 2019, 125, 308–319. [Google Scholar] [CrossRef]
- Heyman, A.V.; Law, S.; Berghauser Pont, M. How is Location Measured in Housing Valuation? A Systematic Review of Accessibility Specifications in Hedonic Price Models. Urban Sci. 2019, 3, 3. [Google Scholar] [CrossRef]
- Sikorska, D.; Łaszkiewicz, E.; Krauze, K.; Sikorski, P. The role of informal green spaces in reducing inequalities in urban green space availability to children and seniors. Environ. Sci. Policy 2020, 108, 144–154. [Google Scholar] [CrossRef]
- Kopsch, F. The cost of aircraft noise—Does it differ from road noise? A meta-analysis. J. Air Transp. Manag. 2016, 57, 138–142. [Google Scholar] [CrossRef]
- Wittowsky, D.; Hoekveld, J.; Welsch, J.; Steier, M. Residential housing prices: Impact of housing characteristics, accessibility and neighbouring apartments–a case study of Dortmund, Germany. Urban Plan. Transp. Res. 2020, 8, 44–70. [Google Scholar] [CrossRef]
- Yuan, F.; Wu, J.; Wei, Y.D.; Wang, L. Policy change, amenity, and spatiotemporal dynamics of housing prices in Nanjing, China. Land Use Policy 2018, 75, 225–236. [Google Scholar] [CrossRef]
- Łaszkiewicz, E.; Czembrowski, P.; Kronenberg, J. Can proximity to urban green spaces be considered a luxury? Classifying a non-tradable good with the use of hedonic pricing method. Ecol. Econ. 2019, 161, 237–247. [Google Scholar] [CrossRef]
- Pearson, L.J.; Tisdell, C.; Lisle, A.T. The impact of Noosa National Park on surrounding property values: An application of the hedonic price method. Econ. Anal. Policy 2002, 32, 155–171. [Google Scholar] [CrossRef]
- Xiao, Y.; Hui, E.C.; Wen, H. Effects of floor level and landscape proximity on housing price: A hedonic analysis in Hangzhou, China. Habitat Int. 2019, 87, 11–26. [Google Scholar] [CrossRef]
- Chen, J.; Hao, Q.; Yoon, C. Measuring the welfare cost of air pollution in Shanghai: Evidence from the housing market. J. Environ. Plan. Manag. 2018, 61, 1744–1757. [Google Scholar] [CrossRef]
- Munro, K.; Tolley, G. Property values and tax rates near spent nuclear fuel storage. Energy Policy 2018, 123, 433–442. [Google Scholar] [CrossRef]
- Lai, C.F. Effects of demographic structure and tax policies on real estate prices. Appl. Econ. Financ. 2016, 3, 88–96. [Google Scholar] [CrossRef]
- Ding, W.; Zheng, S.; Guo, X. Value of access to jobs and amenities: Evidence from new residential properties in Beijing. Tsinghua Sci. Technol. 2010, 15, 595–603. [Google Scholar] [CrossRef]
- Perdomo, J.A. A methodological proposal to estimate changes in residential property value: Case study developed in Bogota. Appl. Econ. Lett. 2011, 18, 1577–1581. [Google Scholar] [CrossRef][Green Version]
- Feng, Z. Household Income, Asset Location and Real Estate Value: Evidence from REITs. Asset Locat. Real Estate Value Evid. REITs 2021. [Google Scholar] [CrossRef]
- Md, A.; Sheikh, H. Measuring Affordability of the Middle Income Group for Residential House Price in Real Estate Sector of Rajshahi, Bangladesh. Am. Acad. Sci. Res. J. Eng. Technol. Sci. 2021, 82, 1–10. [Google Scholar]
- Hussain, T.; Abbas, J.; Wei, Z.; Nurunnabi, M. The Effect of Sustainable Urban Planning and Slum Disamenity on The Value of Neighboring Residential Property: Application of The Hedonic Pricing Model in Rent Price Appraisal. Sustainability 2019, 11, 1144. [Google Scholar] [CrossRef]
- Bertolaccini, K.; Lownes, N.E.; Mamun, S.A. Measuring and mapping transit opportunity: An expansion and application of the Transit Opportunity Index. J. Transp. Geogr. 2018, 71, 150–160. [Google Scholar] [CrossRef]
- Mamun, S.A.; Lownes, N.E.; Osleeb, J.P.; Bertolaccini, K. A method to define public transit opportunity space. J. Transp. Geogr. 2013, 28, 144–154. [Google Scholar] [CrossRef]


| Category | Variable | Author |
|---|---|---|
| Characteristics of a dwelling | Surface area | Čeh et al. [76] |
| Number of rooms | Liu et al. [77] | |
| Type of a housing unit | Park et al. [41] | |
| Age of a building | Wu et al. [78] | |
| Parking space/garage | Ko et al. [79] | |
| Upper-floor location | Szczepańska et al. [80] | |
| Type of building construction | Ooi et al. [81] | |
| Form of ownership | Marano and Tajani [82] | |
| Accessibility of basement | Ottensmann et al. [83] | |
| Standard of finish | Tomal [84] | |
| Energy efficiency | Zancanella et al. [85] | |
| Characteristics of neighbourhood | Distance to the centre | Jasińska and Preweda [86] |
| Distance to the primary schools and kindergartens | Sah et al. [87] | |
| Access to public transport | Cordera et al. [88] | |
| Distance to shops | Heyman et al. [89] | |
| Distance to recreational areas | Sikorska et al. [90] | |
| Bothersome neighbourhood (airport, etc.) | Kopsch [91] | |
| Distance to industrial zones | Wittowsky et al. [92] | |
| Characteristics of Environment | Distance to lakes | Yuan et al. [93] |
| Distance to green areas, parks | Łaszkiewicz et al. [94] | |
| Distance to legally protected areas | Pearson et al. [95] | |
| Distance to other valuable natural areas (rivers, mountains, etc.) | Xiao et al. [96] | |
| Air pollution | Chen et al. [97] | |
| Characteristics of local social, economic and planning conditions | Amount of tax | Munro and Tolley [98] |
| Demographic structure | Lai [99] | |
| Employment opportunities | Ding et al. [100] | |
| Prospects of economic development | Perdomo [101] | |
| Increase in revenue generated | Feng [102] | |
| Dynamic business development | Md and Sheikh [103] | |
| Occurrence of planning barriers | Hussain et al. [104] |
| Group 1 | Group 2 | Group 3 | Group 4 | Group 5 | Group 6 | |||||||
|---|---|---|---|---|---|---|---|---|---|---|---|---|
| Mean | Σ | Mean | σ | Mean | σ | Mean | σ | Mean | σ | Mean | σ | |
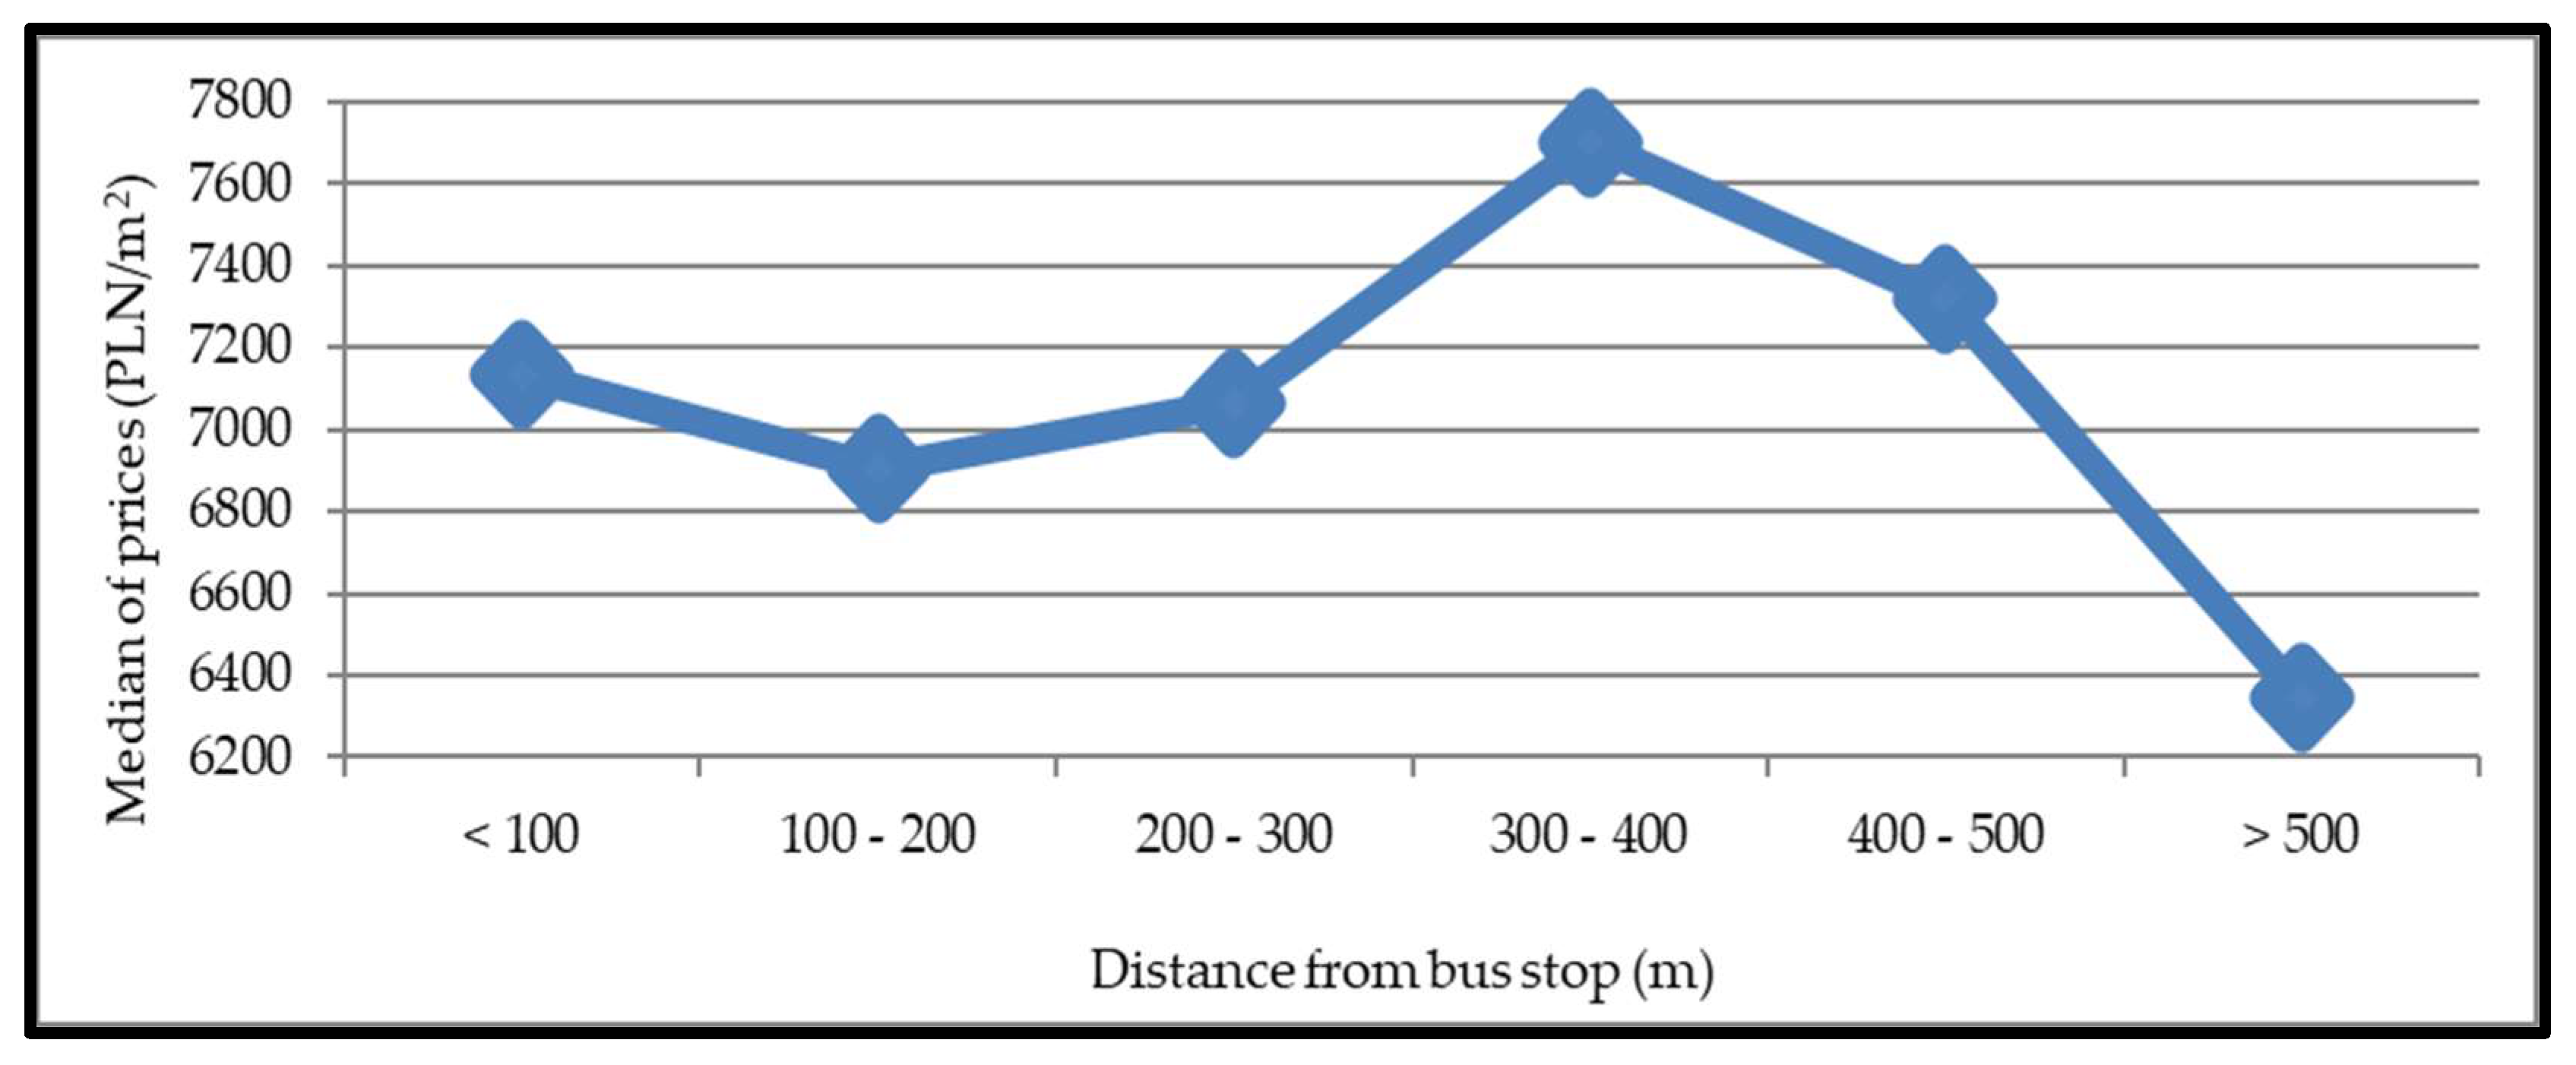
| Price (PLN/m2) | 7170.05 | 1654.80 | 6993.44 | 1588.99 | 7120.34 | 1748.98 | 7602.56 | 1857.10 | 7207.53 | 1991.29 | 6225.96 | 1181.38 |
| Number of rooms | 2.81 | 1.01 | 3.07 | 1.04 | 2.92 | 1.08 | 2.79 | 1.15 | 2.87 | 1.12 | 2.87 | 0.92 |
| Surface area (m2) | 51.32 | 19.96 | 53.92 | 21.37 | 54.36 | 23.86 | 54.60 | 25.94 | 59.62 | 29.81 | 60.04 | 29.48 |
| Floor | 2.87 | 3.21 | 2.70 | 2.64 | 2.69 | 2.55 | 2.39 | 1.98 | 1.74 | 1.51 | 2.30 | 1.46 |
| Associated premise | 0.33 | 0.52 | 0.42 | 0.59 | 0.37 | 0.59 | 0.36 | 0.53 | 0.43 | 0.63 | 0.20 | 0.56 |
| Distance to tram stop-m | 671.42 | 984.93 | 628.04 | 830.56 | 527.55 | 583.27 | 743.34 | 924.17 | 1038.06 | 1085.99 | 1631.02 | 700.13 |
| Distance to bus stop-m | 65.31 | 23.86 | 151.72 | 28.31 | 241.98 | 27.21 | 340.58 | 27.49 | 442.11 | 30.47 | 591.21 | 104.88 |
| Distance to Warta River-km | 2910.11 | 1603.23 | 2756.53 | 1512.43 | 2661.50 | 1505.37 | 2530.20 | 1,56.42 | 3100.32 | 1848.53 | 2085.00 | 1865.95 |
| Distance to primary school and kindergartens-m | 644.38 | 513.46 | 634.70 | 471.93 | 663.77 | 480.42 | 652.85 | 415.33 | 877.30 | 807.86 | 1030.07 | 599.86 |
| Distance to the centre of Poznań-m | 3775.99 | 1888.13 | 3704.42 | 1642.72 | 3476.51 | 1663.07 | 3395.58 | 1916.00 | 4267.22 | 2100.28 | 4750.79 | 1358.66 |
| Distance to urban green areas-m | 562.37 | 493.44 | 468.43 | 408.75 | 536.72 | 474.93 | 535.80 | 495.32 | 861.46 | 795.77 | 659.87 | 733.93 |
| Distance to shopping centre-m | 965.35 | 959.75 | 867.99 | 771.47 | 777.30 | 594.73 | 845.71 | 643.93 | 1298.85 | 843.40 | 1255.08 | 595.23 |
| Number of observations | 491 | 943 | 593 | 306 | 119 | 109 | ||||||
| Group 1 | Group 2 | Group 3 | Group 4 | Group 5 | Group 6 | |||||||
|---|---|---|---|---|---|---|---|---|---|---|---|---|
| Mean | σ | Mean | σ | Mean | σ | Mean | σ | Mean | Σ | Mean | σ | |
| Price (PLN/m2) | 7348.85 | 1893.52 | 7228.31 | 1777.02 | 6833.13 | 1546.40 | 7068.00 | 1482.24 | 7189.75 | 1731.14 | 6826.19 | 1420.52 |
| Number of rooms | 2.83 | 1.15 | 2.84 | 1.02 | 3.20 | 1.02 | 3.02 | 0.90 | 2.78 | 0.92 | 3.04 | 1.09 |
| Surface area (m2) | 54.19 | 25.90 | 51.69 | 19.16 | 54.37 | 17.87 | 48.07 | 15.23 | 48.06 | 19.83 | 61.46 | 29.54 |
| Floor | 3.03 | 2.98 | 2.73 | 2.48 | 2.80 | 2.93 | 2.71 | 2.96 | 2.73 | 2.73 | 1.89 | 1.63 |
| Associated premise | 0.35 | 0.56 | 0.39 | 0.59 | 0.43 | 0.61 | 0.33 | 0.51 | 0.33 | 0.56 | 0.34 | 0.56 |
| Distance to tram stop-m | 129.31 | 45.91 | 288.54 | 58.36 | 483.00 | 53.74 | 707.06 | 60.08 | 881.16 | 55.08 | 2014.34 | 1140.76 |
| Distance to bus stop-m | 161.84 | 98.37 | 214.71 | 98.98 | 200.36 | 113.40 | 182.61 | 112.47 | 201.57 | 111.62 | 277.81 | 191.17 |
| Distance to Warta River-km | 2196.24 | 1245.89 | 2319.43 | 1171.62 | 2787.24 | 1271.36 | 3560.04 | 1435.54 | 3546.87 | 1674.61 | 3390.80 | 2214.14 |
| Distance to primary school and kindergartens-m | 501.39 | 365.79 | 604.90 | 416.14 | 581.01 | 383.03 | 661.81 | 403.21 | 727.11 | 341.56 | 1023.27 | 718.19 |
| Distance to the centre of Poznań-m | 2561.90 | 1393.76 | 2919.39 | 1316.67 | 3783.15 | 1223.05 | 4608.42 | 1025.09 | 4484.23 | 823.31 | 5595.28 | 1626.24 |
| Distance to urban green areas-m | 384.58 | 282.37 | 472.16 | 314.84 | 506.54 | 328.00 | 519.57 | 313.75 | 539.32 | 315.69 | 831.14 | 860.26 |
| Distance to shopping centre-m | 753.38 | 541.69 | 803.69 | 516.97 | 864.68 | 560.55 | 886.69 | 524.86 | 773.16 | 511.02 | 1272.60 | 1280.58 |
| Number of observations | 567 | 812 | 350 | 178 | 138 | 516 | ||||||
| Feature | Symbol | Feature Description |
|---|---|---|
| Price | p | Housing price (PLN/m2) |
| Number of rooms | R1 (up to 2 rooms) R2 (3 to 5 rooms) R3 (more than 5 rooms) | 3 variables are used in the model; if the housing unit has a given number of rooms, it is assigned the value of 1; otherwise, it is assigned the value of 0. |
| Surface area | SA | Surface area of the housing unit-m2 |
| Floor | F1 (up to the 2nd floor) F2 (3rd to 5th floor) F3 (above the 5th floor) | 3 variables are used in the model; if the housing unit can be classified under one of the aforementioned floor level classes, it is assigned the value of 1; otherwise, it is assigned the value of 0. |
| Associated premise | BT | 1 variable is used in the model. If the housing unit had an associated premise, it is assigned the value of 1; otherwise, it is assigned the value of 0. |
| Tram stop | DT | Distance to a tram stop (km) |
| Bus stop | DB | Distance to a bus stop (km) |
| Warta River | DW | Distance to the river (km) |
| Primary school and kindergartens | DS | Distance to primary school and kindergartens (km) |
| City centre | DCC | Distance to the centre of Poznań (km) |
| Urban green areas | DUGA | Distance to urban green areas (km) |
| Shopping centre | DSC | Distance to the shopping centre (km) |
| R1 | R2 | R3 | SA | F1 | F2 | F3 | BT | DT | DB | DW | DS | DCC | DU GA | DSC | |
|---|---|---|---|---|---|---|---|---|---|---|---|---|---|---|---|
| R1 | 1000 | ||||||||||||||
| R2 | −0.659 * | 1000 | |||||||||||||
| R3 | −0.200 * | −0.330 * | 1.000 | ||||||||||||
| SA | −0.456 | 0.136 * | 0.579 * | 1.000 | |||||||||||
| F1 | −0.067 * | 0.023 | 0.081 * | 0.129 * | 1.000 | ||||||||||
| F2 | 0.052 * | −0.016 | −0.065 * | −0.093 * | −0.630 * | 1.000 | |||||||||
| F3 | 0.030 | −0.012 | −0.033 | −0.068 * | −0.355 * | −0.226 * | 1.000 | ||||||||
| BT | −0.164 * | 0.152 * | 0.011 | 0.018 | 0.015 | −0.045 | 0.050 | 1.000 | |||||||
| DT | −0.074 * | 0.005 | 0.127 * | 0.209 * | 0.169 * | −0.114 * | −0.104 * | 0.003 | 1.000 | ||||||
| DB | 0.007 | −0.013 | 0.012 | 0.091 * | 0.042 | 0.009 | −0.089 * | −0.044 | 0.192 * | 1.000 | |||||
| DW | −0.091 * | 0.036 | 0.098 * | 0.145 * | 0.129 * | −0.102 * | −0.054 * | 0.080 * | 0.382 * | −0.060 * | 1.000 | ||||
| DS | −0.068 * | −0.015 | 0.153 * | 0.229 * | 0.078 * | −0.086 * | 0.008 | −0.095 * | 0.286 * | 0.167 * | 0.100 * | 1.000 | |||
| DCC | −0.138 * | 0.072 * | 0.117 * | 0.188 * | 0.151 * | −0.138 * | −0.033 | 0.020 | 0.695 * | 0.080 * | 0.674 * | 0.384 * | 1.000 | ||
| DUGA | −0.022 | −0.042 | 0.121 * | 0.217 * | 0.141 * | −0.090 * | −0.096 * | −0.029 | 0.424 * | 0.118 * | 0.402 * | 0.275 * | 0.425 * | 1.000 | |
| DSC | −0.047 | −0.025 | 0.135 * | 0.212 * | 0.166 * | −0.129 * | −0.072 * | 0.074 * | 0.572 * | 0.086 * | 0.368 * | 0.151 * | 0.417 * | 0.338 * | 1 |
| OLS | WLS | |||||
|---|---|---|---|---|---|---|
| Coefficient | Standard Error | p-Value | Coefficient | Standard Error | p-Value | |
| Constant | 9.136 | 0.019 | 0.000 | 9.143 | 0.018 | 0.000 |
| 3 to 4 rooms | −0.220 | 0.011 | <0.001 | −0.235 | 0.01 | <0.001 |
| More than 4 rooms | −0.165 | 0.025 | <0.001 | −0.186 | 0.024 | <0.001 |
| Surface | −0.235 | 0.000 | <0.001 | −0.224 | 0.000 | <0.001 |
| 3rd, 4th, 5th floor | 0.025 | 0.010 | 0.169 | 0.016 | 0.009 | 0.385 |
| From 6th floor | 0.025 | 0.017 | 0.168 | 0.017 | 0.014 | 0.338 |
| Associated premise | −0.049 | 0.010 | 0.007 | −0.043 | 0.009 | 0.018 |
| Tram stop | −0.104 | 0.000 | <0.001 | −0.149 | 0.000 | <0.001 |
| Bus stop | 0.006 | 0.000 | 0.725 | 0.007 | 0.000 | 0.718 |
| Warta river | 0.13 | 0.000 | <0.001 | 0.128 | 0.000 | <0.001 |
| Primary schools and kindergartens | 0.023 | 0.000 | 0.249 | 0.01 | 0.000 | 0.592 |
| Town centre | −0.246 | 0.000 | <0.001 | −0.234 | 0.000 | <0.001 |
| Parks | −0.043 | 0.000 | 0.039 | −0.011 | 0.000 | 0.622 |
| Shopping centre | −0.066 | 0.000 | 0.003 | −0.125 | 0.000 | <0.001 |
| R2 N | 0.521 2561 | 0.701 2561 | ||||
Publisher’s Note: MDPI stays neutral with regard to jurisdictional claims in published maps and institutional affiliations. |
© 2022 by the authors. Licensee MDPI, Basel, Switzerland. This article is an open access article distributed under the terms and conditions of the Creative Commons Attribution (CC BY) license (https://creativecommons.org/licenses/by/4.0/).
Share and Cite
Chwiałkowski, C.; Zydroń, A. The Impact of Urban Public Transport on Residential Transaction Prices: A Case Study of Poznań, Poland. ISPRS Int. J. Geo-Inf. 2022, 11, 74. https://doi.org/10.3390/ijgi11020074
Chwiałkowski C, Zydroń A. The Impact of Urban Public Transport on Residential Transaction Prices: A Case Study of Poznań, Poland. ISPRS International Journal of Geo-Information. 2022; 11(2):74. https://doi.org/10.3390/ijgi11020074
Chicago/Turabian StyleChwiałkowski, Cyprian, and Adam Zydroń. 2022. "The Impact of Urban Public Transport on Residential Transaction Prices: A Case Study of Poznań, Poland" ISPRS International Journal of Geo-Information 11, no. 2: 74. https://doi.org/10.3390/ijgi11020074
APA StyleChwiałkowski, C., & Zydroń, A. (2022). The Impact of Urban Public Transport on Residential Transaction Prices: A Case Study of Poznań, Poland. ISPRS International Journal of Geo-Information, 11(2), 74. https://doi.org/10.3390/ijgi11020074