Abstract
Despite the extensive discussion on the educational potential of GIS and the changes made in the curricula in many countries, the implementation of GIS in classrooms has still been relatively slow. This is because of variables limiting the process of GIS implementation in lessons. Although research into the limits of GIS implementation has been carried out quite extensively, there is a need for knowledge systematisation in the field. Therefore, the presented systematic review of 34 empirical studies addresses this need and pays attention to the methodological approaches used to research the limits, the identified limits of GIS implementation, their categorisation, and any temporal trends in their occurrence. Altogether, the analysed studies identified 68 limits of GIS implementation in education using mainly quantitative methodology (especially the questionnaire), with utmost attention paid to teachers as participants. These limits then formed complex categorisation that distinguishes elementarily between the limits related to humans and resources. The most frequent and variable category of limits was teachers followed by technology, while both kept their positions in all periods. The systematisation of the research enables the formulation of implications for educational and geoinformatics practice and recommendations for future research.
1. Introduction
A geographic information system (GIS) is a powerful tool for examining the real world around us [1,2]. As an educational tool, it can enhance education in geography, specifically in helping students understand geographical concepts [3,4]; solve discipline-specific problems [5,6,7,8,9]; develop higher-order thinking skills [9,10,11,12,13,14]; and emphasise the synthetical nature of the discipline of geography [2]. Although there is a sound body of literature underlining the GIS’s potential for geographic education [9,15,16,17], and, concurrently, Wiegand [7] (p. 68) claims “that GIS represents the single biggest contribution geographers have made to society and the economy”, it is a misunderstanding to think that GIS is a geography-specific learning tool with limited versatility [6]. As GIS has developed and become simpler, more user-friendly, and, therefore, easier and more practical to use, educators have begun to use it in various disciplines [3,6].
Considering the technological development of human society in the last decades, it is more than evident that GIS is integrated into the lives of the twenty-first century “digital native” young people [18] and that GIS in schools prepares students for the future use of spatial technologies later in their professional and personal lives [19]. Consequently, GIS closely relates to students’ future professional lives (helps produce future knowledge-based workers and motivates young people to pursue careers in science and engineering) and presents an opportunity for teachers to offer students the technological capability for real-world (and particularly local community environment) problem-solving using data analysis, modelling, and presentation tools [2,5,6,9,19,20].
Despite the extensive discussion on the justification of GIS use in lessons and the necessary changes made in the curriculum [2,9,12,20], the implementation of GIS in classrooms has been relatively slow [9,21,22,23]. Although already in 2001, Wiegand [7] announced the GIS revolution (initiated by lower software costs, increasing hardware provision, the emergence of GIS-trained teachers, and curriculum emphasis on enquiry), leading to the increase in GIS implementation in education, not all teachers have welcomed the introduction of GIS in schools a decade later [2]. It is evident that some variables limit the process of GIS implementation in lessons. Some of these limits are, according to Höhnle et al. [17], country- and time-specific. Others are of a more general nature and transferable in space or time [24].
Bednarz [9] declares that more intensive future GIS implementation needs to be informed and framed by research into the limits of GIS implementation. To complete this task and help eliminate the GIS implementation limits [25], the research evidence should be neither sparse, inconsistent, nor monotonous from the perspective of the chosen methodology or research design in general [3,12]. Therefore, there is a need for research that is well designed and systematic [26]. As the field of GIS has evolved rapidly over the last decades, the research should also be attentive to progress, i.e., should be time-sensitive and may need to be reexamined periodically [3]. As a result, although research studies on the limits of GIS implementation have been carried out quite extensively (e.g., [17,27,28,29]), the findings need to be systemised and analysed considering, inter alia, the development of the GIS implementation limits in time.
The present study attempts to address the mentioned research needs for knowledge systematisation in the field of GIS implementation limits. It is expected that its findings can significantly contribute to the discussion on which types of pedagogical support help teachers implement GIS and use the educational potential of GIS (as emphasised by Baker et al. [12]). Specifically, this study focuses on the following research questions:
- What methodology approaches and methods of data collection are used to research the limits of GIS implementation in education?
- What are the limits of GIS implementation in education, and what is their structure and frequency?
- What are the temporal trends of the identified limits and their structure?
Considering the need for systematic research, the research questions are addressed by employing the systematic review of existing empirical research. The review follows the PRISMA Statement recommendations for systematic reviews [30].
1.1. Variability in GIS Terminology and Definitions
The critical first step in the presented systematic review is to define its key term: GIS. When examining the many definitions of GIS provided in the literature, Green [20] claims that it is hard to find one definition that suits all the situations GIS can be used in. Therefore, there is no single definition or interpretation of GIS. Simply said, just as GIS technology has evolved, so have its various definitions and their interpretations. Moreover, diverse definitions of GIS have been developed in various fields and disciplines over its existence [2,31].
In general, GIS can be viewed from a narrow or broad perspective. A narrow perspective views GIS as a specialised computer system whose main objective is to collect, store, analyse, and present (visualise) geographic data [19,32]. Only software such as ArcMap or QGIS then correspond to this perspective on GIS. A GIS definition corresponding to this narrow perspective was adequate in the days when digital technology was still insufficiently developed. However, with the development of the internet, other applications that work with geographic information and operate independent of a particular computer have begun to appear.
Therefore, in recent years, the broad perspective on the term GIS has been coming to the forefront, with a greater variety of online and mobile applications and geoportals being included under the umbrella of GIS [24,33,34]. Consequently, the complexity of content and application of GIS are wide-ranging, from online, simple GIS that allow users to view datasets to complex GIS software that allows users to collect and manipulate their own data, create maps, and evaluate and make decisions based on the spatial data represented on those maps [24]. Specifically, within the broad perspective on the definition of GIS, we can classify GIS beyond specialised desktop software suitable mainly for professionals to applications such as StoryMaps [35], Survey123 [36], geoportals (e.g., Google Earth [34,37], ISPIRE [38], Windy.com [39], the Estonian Land Board Geoportal [40]), and others.
Focusing specifically on GIS in education, its definition places emphasis on the activities associated with GIS and the benefits that working with GIS brings to students, teachers, and education in general more than on specific forms of GIS. This is in contrast with traditional technical definitions [20]. Thus, GIS can be defined a set of tools that increases users’ knowledge and helps them to solve spatial problems [2] through collecting, storing, manipulating, analysing, and displaying data (similarly [12,24,33]).
Since this study focuses on education, GIS is viewed from the broad perspective and therefore defined (combining the technical and educational definition) as an application that stores spatial information or even helps to collect it and enables its manipulation, analysis, and/or presentation (visualisation). GIS can be both desktop and online. Given the focus on the limits of GIS implementation in education, another necessary characteristic of GIS is that it brings something new and beneficial to a lesson compared with teaching with static maps or atlases. For this reason, only an application that contained at least one dynamic or interactive map was considered GIS.
Nonetheless, it should be kept in mind that not every study included in the review took the broad perspective of GIS, which may have been reflected in their results, and it is necessary to take this into consideration during their interpretation and discussion.
2. Methods
The present study addresses the issue of the limits of GIS use in education and aims to answer three research questions through the systematisation of the previous studies’ findings.
2.1. Literature Search
For that reason, a systematic literature review was carried out for peer-reviewed articles which empirically identified at least one limit of GIS implementation in education. The systematic review is methodologically grounded in the Preferred Reporting Items for Systematic Reviews and Meta-Analyses (PRISMA), i.e., an explicit systematic method for identifying, evaluating, and synthesising relevant results. PRISMA consists of a 27-item checklist and a 3-phase (identification, screening, included) flow diagram ([30,41]; see Figure 1). Given the focus of the systematic review on the fields of education and geotechnologies, Scopus and Education Resources Information Center (ERIC) databases were selected for the search of relevant peer-reviewed articles (similarly [42]). The Scopus database is the most comprehensive abstract and citation database in the fields of life sciences, social sciences, health sciences, and physical sciences [43], with more than 87 million articles [44]. Therefore, it is relevant for the search of studies in the fields of both education and geotechnologies. Additionally, ERIC has a growing collection of about two million education resources (including journal articles, research reports, fact sheets, conference papers, books, and other nonjournal materials [45]).
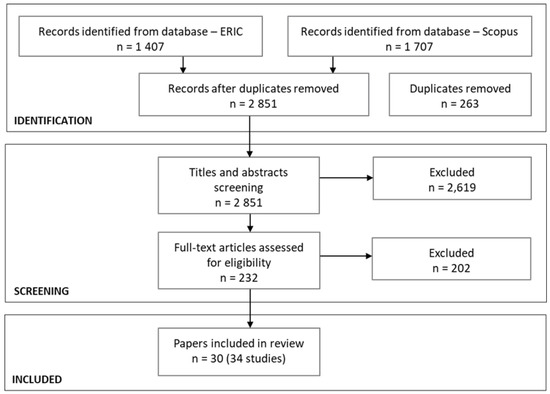
Figure 1.
PRISMA flow diagram for the conducted systematic review.
2.1.1. Search Command
The initial phase in the PRISMA methodology consists of selecting relevant keywords and formulating a search command. Based on the previous research on GIS in education and an analysis of previous reviews [33] from the education research field, a search command was created. The search command used Boolean operations and was composed of two parts. The first connected to the technical definition of GIS, and the second related to teaching and education. Originally, terms referring to limits were also added to the search command. However, the inclusion of limits-related keywords in the search command led to the elimination of relevant articles, as some studies focusing on limits did not mention them directly in the title or the abstract. Thus, terms associated with limits were not used in the final command:
(“geoinformat* technolog*“ OR “geographic information system*“ OR “*GIS“ OR “geoportal*“ OR “web portal*“ OR “webportal*“ OR “geospatial technolog*“) AND (“education*“ OR “teach*“ OR “pedagog*“ OR “lesson*“)
This command was inserted into the selected databases’ search engines (Scopus and ERIC). There was no limitation on the date of publication of the article as the development of GIS in education almost did not take place until the 1990s, and one of the research questions focused on the evolution of limits over time. The search in Scopus was limited by the document type (articles), the language (English), and the subject area (social science) due to the focus on GIS and education. The ERIC database does not allow users to specifically filter the search; therefore, there were no specific criteria chosen. The search was conducted on 4 June 2020. After removing duplicates, a database containing 2851 records in total was created (see Figure 1).
Additional selection criteria were applied for the first screening of the identified records. The titles and abstracts of the identified records were checked during this screening (Figure 1). A total of nine criteria were used during this screening process. The articles had to
- Be about GIS, as defined in Section 1.1;
- Examine GIS use in education;
- Deal with the limits of GIS use in education;
- Have secondary school students (i.e., aged 11 to 18), preservice teachers, or in-service secondary school teachers as participants;
- Not be dedicated to participants with special educational needs;
- Contain empirical research with a clearly defined research methodology and not be a review;
- Be peer-reviewed;
- Be written in English.
If the article was evaluated as not meeting all the given criteria, it was excluded from the database. Two evaluators (the first and second authors) independently performed this screening of the abstracts based on the selected criteria. At first, approximately 10% of the articles (288 articles) were randomly selected and their abstracts screened by both evaluators. Subsequently, the agreement rate of evaluators was calculated. This rate was 87.1% (236 articles), and Cohen’s kappa was 0.479. This agreement was considered to be insufficient (according to [46]). The evaluators together considered the articles for which there was no agreement and specified the selection criteria in more detail. Subsequently, a sample of 5% of the remaining articles (144 articles) was randomly selected for the evaluation. The agreement between the evaluators for this sample was 97.9% (141 articles), and Cohen’s kappa was 0.858. This agreement was considered to be sufficient for the two evaluators [46], and therefore each of the remaining articles was separately evaluated by one of the evaluators. Based on the abstract screening, a total of 223 potentially eligible articles formed the database for the next PRISMA phase—full-text eligibility assessment (Figure 1).
It was necessary to get a full text of individual articles prior to the full text screening. For articles that were not found, the corresponding author was contacted and asked for the full text of the article. Despite contacting the authors, the full text of seven articles could not be obtained; therefore, these articles were excluded from further stages of the research.
The full texts were then subjected to the identical criteria as the abstracts, given that it was not possible to verify from each abstract whether articles met all the stated criteria. In the first step of the full-text screening, 10% of the potential eligible articles (24 articles) were randomly selected (similar to the abstract screening) and evaluated by three evaluators (the first, second, and third authors). The average agreement was 75%, and the average pairwise Cohen’s kappa was 0.449. This agreement was considered statistically sufficient for the three evaluators (according to [46]), but some coding ambiguities were still found.
These ambiguities were discussed by the evaluators, and the coding procedure was specified and refined. Subsequently, the other 23 randomly selected articles were evaluated with average agreement of 91.3% (and an average pairwise Cohen’s kappa of 0.815). The remaining full texts were divided among the three evaluators, where each article was evaluated by two of them (the assignment of articles to each evaluator was random). The evaluation had to be unanimous.
Most of the evaluated articles focused on the effectiveness of GIS usage in terms of skills development or knowledge acquisition and addressed the desired limits of GIS implementation in lessons only marginally or not at all. Considering the aim of this systematic review, these articles were excluded, and only articles where the identification of GIS limits was one of the aims or the limits of GIS implementation were part of one of the research questions were counted as eligible. As a result, the systematic review identified 30 relevant articles (Figure 1). Four of these articles presented findings of two separate studies, specifically, one focused on teachers and one focused on learners. These articles were then divided into eight studies. As a result, 34 studies from 30 articles [2,6,15,17,19,23,24,27,28,29,47,48,49,50,51,52,53,54,55,56,57,58,59,60,61,62,63,64,65,66] were analysed to answer the research questions.
2.2. Data Extraction and Analysis
After identifying the relevant articles, it was necessary to extract relevant information from them. A structured form was developed by all the authors and used to collect the data. The main characteristics of the empirical studies relevant to the aims of the review were collected, i.e., author’s name, the title of the study, year of the study, country, research aim, methodological approach, method of data collection, participant type, sample size, school subject, type of teaching method, the specific type of GIS, and identified limit(s) of GIS use in education.
The frequency of each identified limit was calculated in such a way that one specific identified limit was counted only once per each study, even if it was identified by more than one participant or in more described situations/lessons. Consequently, the maximum possible frequency of each limit is equal to the number of studies included in the review.
In addition, a categorisation of the limits of GIS use in education was proposed (see Section 3.2.1 for its description). This categorisation helped, among other things, to answer the stated research questions since a more general view on the limits of GIS implementation enabled the identification of the key issues related to GIS use in education and the temporal trends. The frequency of the limit categories is in most of the cases a sum of the frequencies of the corresponding lower categories, but it is important to note that there are some exceptions.
Precisely, if the formulation of the identified limit was too general and it was not possible to assign it to a specific limit, this limit was counted up to the higher category to which all the limits mentioned in it were related. The frequency calculation of these cases is explained in Figure 2. For example, in Meyer et al. [19], the limit “lack of equipment or its insufficient hardware capacity” (in Figure 2 as limit X + Y) was identified. This limit cannot be included in the lowest level of the categorisation, i.e., the level of specific identified limits, because on this level “hardware unavailability” (in Figure 2 as limit X) is distinguished from “suitable hardware unavailability” (in Figure 2 as limit Y). For this reason, the frequency of this limit is counted directly into the superior category “hardware availability” (in Figure 2 as subcategory XY).
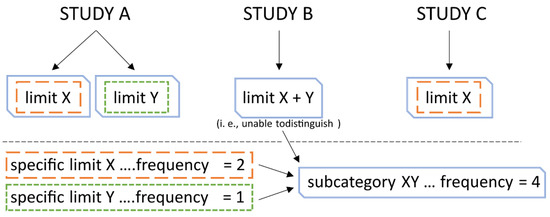
Figure 2.
Calculation of the frequency of higher categories in the case of an unspecified limit.
3. Results and Discussion
The systematic review identified 30 relevant articles with 34 studies. The oldest relevant article dates from 1997. For the analysis of the identified limits change over time, it was necessary to divide studies into time periods (Figure 3). Based on the time distribution of the studies, they were divided into four intervals (four time periods). In placing the interval boundaries, an effort was made to follow natural breaks in the data as well as to create similarly wide intervals. This was successful except for the first period, which is longer because of the low number of studies published. The years 2005, 2010, and 2015 were chosen as the boundaries of the four time periods (Figure 3).
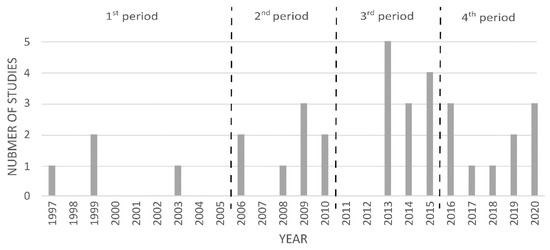
Figure 3.
Frequency of the studies in relation to their publication year and the chosen time periods.
Although the first study was published in 1997, the research topic was not continuously studied until the year 2012 (Figure 3). This changed in 2013, when at least one study on the limits of GIS implementation was published each year, and the overall frequency of published studies increased. The temporal perspective on the published studies shows that research interest in the limits of GIS use in education is, in comparison with other topics spanning geography, education, and cartography/computer science (see e.g., [67,68,69]), still rather novel. Nevertheless, the results indicate a growing interest in this issue in recent years that corresponds to technical progress and increasing efforts to include modern technologies in education [70,71]. Still, given the number of studies identified and the importance of the topic, the limits of GIS use are not sufficiently researched.
When considering the spatial distribution of the identified studies, it is apparent that the topic (particularly the country-specific limits) still requires greater attention from researchers worldwide. Even though every inhabited continent except South America is represented by at least one study, the identified studies came from only twelve different countries (see Figure 4).
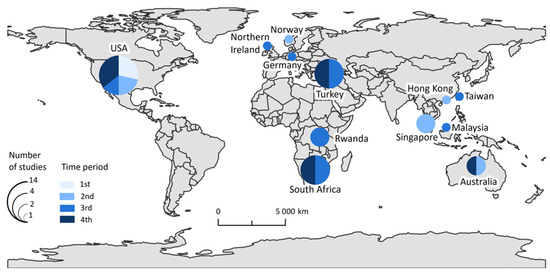
Figure 4.
Spatial distribution of the identified studies.
Most articles devoted to the implementation of GIS in which the limits of implementation have been empirically investigated came from the USA (14 studies), followed by South Africa and Turkey (both 4 studies) (Figure 4). On top of that, each of the set time periods contain at least two studies from the USA, and all the studies published by 2005 were conducted in the USA.
In the second period, in addition to articles from the USA, two studies from Singapore and one study from Australia, Hong Kong, and Norway were identified. In the third period, the identified studies were the most diverse from the spatial point of view since they came from the education systems of Germany, Malaysia, Northern Ireland, Rwanda, South Africa, Taiwan, Turkey, and the USA. In the last period, no study from a previously unmentioned country was found. The studies originated from Australia, South Africa, and Turkey, and five studies were from the USA.
There might be several reasons for the lack of diversity in the studies since 2015. It is clear that the issue of GIS use in education and its limits is relevant to many other countries (e.g., Brazil, Canada, Egypt, South Korea, and Spain) in which no study dealing specifically with it was found. They might, nevertheless, be focusing on this issue in more practical ways and focusing directly on how to eliminate the limits that are generally known or that resonate among teachers in their country (e.g., by preparing handbooks for teachers and materials for GIS use in education or carrying out case studies; see [72,73,74]). Another reason might be that they are solving the issue only on the national level and thus publish the results of the conducted studies only in the official/national language of the country [75]. Therefore, they might have difficulties in publishing the study results in international peer-reviewed journals. Editors might not find the results of the researchers from the countries where GIS implementation in education started years later sufficiently innovative as most of the identified limits might already be well-known.
The diversity of the identified articles was also investigated in terms of their connection to school subjects and the type of used GIS tools. The results show that different types of GIS tools were used in the reviewed studies, although not all studies included this specific information. The studies examined the implementation of GIS tools and applications that are available both online (e.g., StoryMaps [59] or OpenStreetMap [48]) and offline (desktop installation required) (e.g., ArcGIS 10.0 [47]). Similarly, studies were dealing with specialised (e.g., ArcGIS 10.0 [47] or ArcViewer II [19]) and nonspecialised (e.g., Google Earth [63] or OpenStreetMap [48]) GIS tools. The results also confirm the close link between GIS and geographic education since geography was the most frequent subject in which the limits were researched (22 studies) together with social studies (6 studies), in which geographic topics are included in some countries. Nevertheless, the multidisciplinary nature of GIS is apparent from the results given that the limits of its use were also investigated in mathematics [19,50,56,63], history [56], English language [50], and other school subjects. The existence of these studies, among other things, encourages a search for other school subjects in which GIS can be efficiently used and for collaboration among teachers of various subjects, which can help eliminate the limits of GIS use or prevent their occurrence.
3.1. What Methodological Approaches and Methods of Data Collection Are Used to Research the Limits of GIS Use in Education?
To address the first research question, each study from the pool was analysed from the perspective of the methodological approach employed to identify the limits of GIS implementation. The most used methodological approach was quantitative, employed in 18 studies, followed by qualitative research in 10 studies and mixed research used in six studies. The employed methodological approaches were relatively evenly distributed across all four time periods. The only exception was the 3rd period, when no mixed research was identified, and 9 from 12 studies used the quantitative approach. The distribution of the methodological approaches in this research issue is therefore even more anchored in the two traditional approaches, sometimes still considered to be opposite to each other, than the studies related to geographic education in general [76]. Moreover, given the predominance of the quantitative approach in general and in the third period where the studies were the most diverse from the spatial perspective, it shows that researchers find it suitable for the primary identification of the limits hindering GIS use in education in their country.
Accordingly, the most frequently used methods of data collection were the questionnaire, interview, observation, and the focus group. The questionnaire was used in 23 studies, and in 19 studies it was the only research method, while it was employed almost twice as frequently as the interview, the second most used method (12 studies). The frequent use of the questionnaire and interview proves their unique positions in education research among quantitative and qualitative methods, respectively [76,77]. The predominance of these two methods was substantial since observation was used as a data collection method only in four studies [19,60,65] and the focus group in two [29,60]; moreover, these collection methods were never used separately but were supplemented by another method. Due to the different methodologies employed, the sample size varied across the studies and ranged from 1 respondent in an interview [78] to more than 300 in questionnaires [17,29,51].
Most of the identified studies (25) focused on the issue from the perspective of teachers. Learners were the focus of seven studies [6,15,59,60,64,79], and only two studies examined preservice teachers [24,47]. Nonetheless, studies focusing on learners used all types of methodological approaches evenly. In studies focusing on teachers, the quantitative approach was dominant (15 of the 25 studies), which may indicate challenges that researchers face when they intend to conduct qualitative research focused on teachers, given that, for example, teachers often do not want to show their weaknesses and thus limit GIS use in their lessons if they are not completely assured that nobody will find them out [80].
3.2. What Are the Limits of GIS Implementation in Education and What Is Their Structure and Frequency?
One of the purposes of the systematic review was to create a list of all the previously empirically identified limits of GIS implementation in education, determine their frequencies, and create a comprehensive categorisation of them.
A total of 68 various specific limits were identified in 34 studies (for the list of identified limits, see Appendix A). As was mentioned in Section 2.2, from the results of some of the studies, it was not possible to assign limits to a single specific limit given that they were described too generally. Specifically, three more general limits were identified (see Appendix A).
The high number of identified limits at least partially explains why, after more than 20 years of efforts to incorporate GIS into education, its implementation on a national level was not successful in some countries and why in many others, its use is not regular let alone systematic [81,82]. The number and variability of potential limits make it harder for all stakeholders (curriculum makers, researchers interested in related topics, school principals, etc.) to prevent their occurrence or to at least prepare general recommendations for efficiently eliminating them that would not be difficult to stick to.
3.2.1. Categorisation of the Limits of GIS Use in Education
The identified 68 specific limits and 3 more general limits were classified according to their nature in a multilevel categorisation (see Figure 5). The review included two of articles [17,23,29,58] that already contained diverse categorisations of the limits of GIS use. However, it was not possible to use existing categorisations as they lacked complexity and thus did not enable the categorisation of all the identified limits.
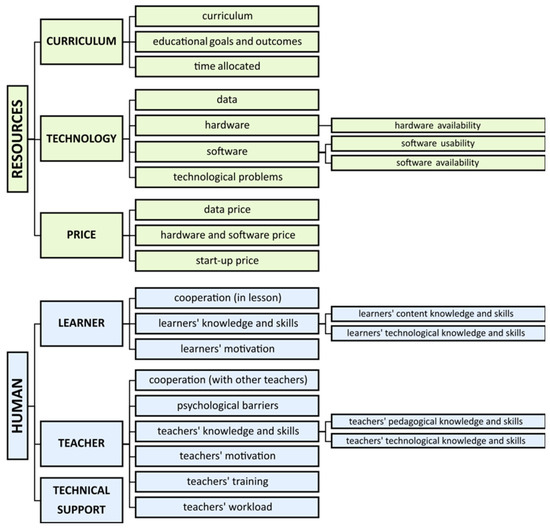
Figure 5.
The categorisation of the limits of GIS implementation in education.
The proposed categorisation contains a minimum of two and a maximum of four levels (without considering the level of the specific limits). The main, i.e., the most general, category is grounded in the classification of factors influencing the implementation of IT education made by Hewlett Packard company [83] and emphasises the difference among limits on the side of humans and resources (Figure 5 and Figure 6). The classification of subcategories was inspired by existing empirical studies such as Höhnle et al. [17] and Hong [58] and developed by all four authors during their mutual discussion and consequent modifications and refinements of the categories until the categories were comprehensible, unequivocal, and disjunctive and the categorisation as a whole was appropriate not only for the current review but also for future research and educational practices.
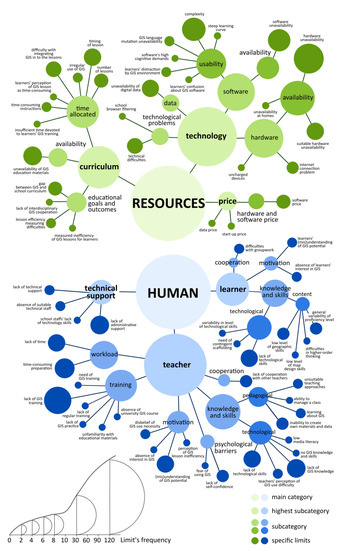
Figure 6.
The identified limits of GIS implementation in lessons and their frequency.
The main category ‘resources’ contains on the highest level the subcategories relating to resources in the context of technology, deficiencies related to the curriculum, and financial resources. The subcategory ‘technology’ distinguishes primarily the limits on the ‘hardware’ and ‘software’ side, and these limits are complemented by ‘technological problems’ and ‘data unavailability’. The specific limits connected to unavailability play an important role in the subcategories of ‘hardware’ and ‘software’ as well. However, even when hardware and software are available, the lack of their quality might substantially impede GIS use in education.
The subcategory ‘curriculum’ contains limits related to the curricular documents themselves, where either GIS is not mentioned at all or GIS and GIS-related topics (or geography classes in general) are given insufficient time. This category furthermore includes the ‘unavailability of GIS education materials’ that would help teachers implement GIS more easily in their lessons. The last resources subcategory is ‘price’, not only of the hardware and software but also of the data necessary for GIS activities in lessons.
The main category ‘human’ includes subcategories directly related to the main actors in education, i.e., ‘teacher’, ‘learner’, and ‘technical support’. The subcategories ‘teacher’ and ‘learner’ have three common third-level categories, which are knowledge and skills; motivation; and cooperation. The limits assigned to the ‘knowledge and skills’ subcategory for teachers are related to the lack of their technological and pedagogical knowledge and skills necessary for GIS use in education and for learners are related to the lack of their technological and subject skills and content knowledge needed to use GIS as an effective educational tool. Additionally, motivation is seen by several authors of the identified studies as a very important factor in GIS implementation [15,24,49]. Given that, when a teacher does not see the potential of using GIS, s/he is not motivated to implement it in his/her lessons. If a learner is not motivated to work with GIS and learning with GIS is not fun and rewarding for him/her, it may become ineffective to use it in lessons [6].
The last common subcategory for the ‘teacher’ and ‘learner’ is ‘cooperation’. For the learners, it includes limits, e.g., difficulties related to groupwork which is, due to a lack of (suitable) hardware, often the only way to work with GIS at schools [79]. For ‘teacher’, the subcategory ‘cooperation’ indicates mainly a ‘lack of collaboration between teachers’, highlighting, e.g., a lack of sharing materials or successful teaching strategies among them, which is in contrast to the interdisciplinary potential of GIS use in education, as mentioned above.
Other subcategories on the teacher side are ‘training’, ‘workload’, and ‘psychological’ ‘barriers’. The subcategory ‘training’ draws attention to the lack of training and practice of teachers in the topic of GIS. This lack of training is also related to the subcategory of ‘psychological barriers’ as, prevailingly due to the lack of training and practice, teachers have a lack of self-confidence in teaching with GIS or are even afraid of using GIS. The subcategory ‘workload’ is divided into limits caused by ‘time-consuming preparation’ and ‘teachers’ general lack of time’. ‘Time-consuming preparation’ is also related to ‘lack of teachers’ training’ or problems with accessibility or the sharing of existing materials but is classified separately as it can have many other causes.
The third and last subcategory of the ‘human’ category is ‘technical support’, the lack of technical support or insufficient skills and knowledge, on the side of both administrative and technical staff in schools. ‘Technical support’ is even more necessary if the teacher is not sure about GIS technology and its use.
The interconnectedness of both the subcategories of the proposed categorisation and the individual limits of GIS use is discussed in greater detail not only from the viewpoint of their content but also of their causes and implications in Section 5.1.
3.2.2. The Frequency of the Identified Limits
The 68 limits were found a total of 225 times in the reviewed studies (for frequency calculation, see Section 2.2). The proportion between the two main categories is almost even (‘human’—112 vs. ‘resources’—113; see Figure 6). Nevertheless, the variability in the frequencies on the lower levels of the categorisation is substantial. Considering the limit categories’ cooccurrence in the reviewed studies, the limits were more often studied together with ones from the same category (most frequently from hardware and software categories). The most frequent inter-categories’ cooccurrence were hardware and software, hardware and teacher training, and software and teacher training (see Appendix B).
Focusing on the highest subcategories (‘price’, ‘technology’, ‘curriculum’, ‘technical support’, ‘teacher’, ‘learner’), the most frequent (78) were limits related to teachers. In addition, the subcategory ‘teachers’ contains 24 specific limits, the most of any subcategory. This indicates not only the importance of limits on the teacher’s side but also their diversity. These limits were mostly (52) found in the studies with quantitative methodological approaches and whose participants were teachers (71). The frequency of the limits identified in studies where participants were learners was much lower (6).
The high frequency of this ‘teacher’ subcategory is given mainly by the limits connected with ‘teachers’ training’ (20), their ‘knowledge and skills’ (25), and the lack of teachers’ time/their ‘high workload’ (16). The subcategory ‘teachers’ training’ includes the specific limit with the second highest overall frequency, i.e., ‘lack of teachers’ GIS training’ (identified in 15 studies). This limit is substantial not only because of its frequency but also due to its connection to other limits such as ‘teachers psychological barriers’ (e.g., “fear of using GIS software” [60] or “not comfortable teaching with technology“ [50]), ‘time-consuming preparation’ (e.g., [27,29]), or ‘teachers’ lack of technological skills’ (e.g., [57,62]).
The dominance of the ‘teacher’ subcategory in terms of both the frequency and number of specific limits is probably caused by the leading role of teachers in planning lessons and teaching with GIS and the dominant focus of the identified studies on teachers’ points of view.
The other subcategory of limits, which relates to the direct actors of education, is ‘learner’. Compared with the subcategory ‘teacher’, most limit frequencies for the ‘learner’ subcategory were identified using qualitative or mixed methodological approaches (13 from the 22) and with participants were learners. The frequency of the subcategory ‘learner’ is dominated by the limits related to ‘learners’ knowledge and skills’ (16). As in the case of ‘teachers’ knowledge and skills’, this subcategory includes limits that are mostly related to learners’ technological skills. Yet in contrast to the subcategory ‘teacher’, where this subcategory is supplemented by limits associated with ‘pedagogical knowledge and skills’ (e.g., “the biggest challenge during the instruction was managing the class” [66]), in the case of learners it is supplemented by limits associated with ‘content knowledge and skills’ (e.g., “lack of geographical skill among students” [51]).
From the perspective of the frequency, the most frequent highest-level subcategory, ‘teacher’, is followed by the subcategory ‘technology’ (frequency 70). The high frequency of this subcategory is mainly caused by frequently identified limits related to ‘hardware’ and ‘software’. These two subcategories were found to be important due to not only their frequency but also the number of different specific limits that they include (see Figure 6).
The frequency of ‘hardware’-related limits was mostly found in studies focused on teachers (27 times out of 30). The subcategory ‘hardware’ was divided into ‘hardware availability’ (respectively (suitable) hardware unavailability), ‘internet connection problems’, and ‘uncharged devices‘. Of these categories, ‘hardware availability’ dominates both in frequency (26 from 30) and in number of different limits. As with the ‘hardware’ subcategory, the frequency of ‘software’-related limits was mostly found in the studies focused on teachers (21 times out of 27). Only six limits were identified in the studies with learners as participants, and these were only limits dealing with ‘software complexity’ [6,19,59,60,64]. The reason for most of the frequencies of the ‘hardware’ and ‘software’ subcategories being identified by studies examining teachers is probably the opportunity of introducing GIS to subject learners in the lessons is available only if hardware and software of sufficient quality are available.
The third most frequent highest-level subcategory (after ‘teachers’ and ‘technology’) is ‘curriculum’ (36). This subcategory is dominated by limits related to lack of time, particularly to ‘time-consuming preparation for teachers’ (8), ‘timing of lesson’ (6), and ‘number of lesson’ (4) (see Figure 6 and Appendix A). It is closely related to the other frequent subcategory, ‘teachers’ high workload’ (frequency 16). Particularly, these limits show the interconnectedness of the main categories, i.e., ‘human’ and ‘resources’, since they were identified in both.
While the most frequent highest-level subcategory belonged to the category ‘human’, the most frequently identified specific limit was the ‘hardware unavailability’ from ‘resources’. This limit was identified in 18 of the 34 studies. In addition, the third and fourth most frequent specific limits, i.e., ‘software complexity’ (11) and ‘software unavailability’ (10), are also connected to ‘resources’. As a result, three of the four most frequently identified specific limits are related to ‘technology’ and more concretely to its unavailability and complexity. These results support the assumption raised in Section 1.1 that not every study included had taken a broad perspective on GIS. If the term GIS was seen from the broad perspective (by both the study authors and the respondents), the perceived importance of these limits would have probably been lower, thus their frequencies as well.
Concretely, the ‘unavailability of suitable hardware’ might be, especially in the case of the recent studies, related to the narrow perspective of respondents on GIS (mainly teachers). Professional desktop GIS software is often very demanding in terms of PC requirements. Related to the narrow perspective on the term GIS might also be the software usability (complexity). Professional desktop GIS software (such as ArcGIS) is often unnecessarily complex for both teachers and learners [50]. However, different perceptions of the term GIS may not only be associated with limits falling under resources. Other subcategories at least partially caused by the perception of GIS may be related to teachers and learners, specifically the above-mentioned ‘teachers’ and ‘learners’ lack of technological skills’, as working with specialised, more developed software is more complicated, and advanced technological skills are necessary [74].
3.3. What Are the Temporal Trends in the Identified Limits and Their Structure?
For the evaluation of the variability in the identified limits over time, the designated time periods were utilised (Figure 3) and for each of these periods, a schema visualising the frequency in the limits’ categories was created (see Figure 7). For better clarity, specific limits were not visualised.
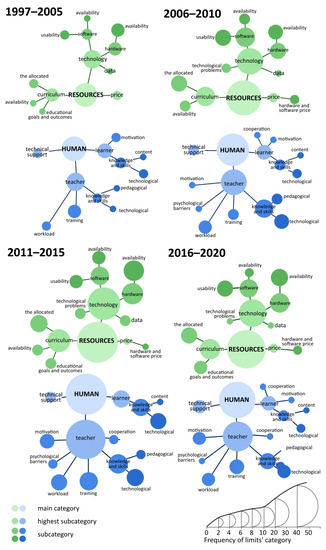
Figure 7.
Temporal trends in the frequency of the identified limits’ categories.
Given the development of technology, its higher availability, and the lower costs of both hardware and software, as well as the support for technology implementation in education [70,71], a general decreasing frequency of identified limits was expected. For these reasons, the change in proportions between limits on the human and the resources sides was expected at the same time.
However, this expectation was not confirmed (see Figure 7). The proportion between the main categories ‘resources’ and ‘human’ stayed similar in all periods. The largest difference (although still mild) between the frequencies of these two main categories was four and was observed in the second period. In addition, higher overall frequencies of the identified specific limits were identified on the resources rather than on the human side in the last period (Figure 7), which contradicts the expectation as well.
When focusing on the highest subcategory, the most frequent during all four analysed periods were ‘teacher’ and ‘technology’. Specifically, in two periods, the highest frequency had the subcategory ‘teacher’ (third period and fourth period), and only in the second period was the subcategory ‘technology’ the most frequent. The dominant position of the subcategory ‘teacher’ in all periods is consistent with the results of Section 3.2.2, where ‘teacher’ came out as the subcategory with the highest frequency overall.
The high frequency of the subcategories ‘teachers’ and ‘technology’ corresponds to the lowest visualised subcategories in Figure 7. The three most frequent lower subcategories in all time periods were ‘teachers’ training’, ‘software usability’, and ‘hardware availability’. The front position of these subcategories could be a consequence of the different stages of GIS implementation in education in different countries. In other words, attempts to use GIS in education and implement GIS in curriculum documents started at different times in different countries [23,81].
However, when analysing the country with the highest number of studies (USA), the dominant position of these subcategories was confirmed since hardware availability and software complexity played a key role in all four periods [27,48,53,66]. For example, Osborne et al. [48] (pp. 19–20) found that the “limiting factor to the implementation of geospatial technologies was the cost and availability of the various technologies” and emphasise “professional training, which focuses on free or low-cost geospatial technology”.
Another explanation may be that most studies work with questionnaires where already defined lists of limits are handed out to the respondents. These lists often include previously identified limits [48,49], and although respondents may rate a limit as less serious, it could still be relevant to them.
From the ‘human’ side, apart from the ‘teacher’, the proportion of ‘learner’ to other categories at the same level decreased during the analysed time in general. For example, when comparing ‘teacher’ versus ‘learner’, ‘teacher’ dominance increased from 62% (teachers—8, learners—5) in the 1st period to more than 80% in the 3rd (teachers—32, learners—7) and 4th (teachers—21, learners—5) periods, with the average ratio between these highest subcategories being 78% (‘teacher’) to 22% (‘learner’). This could be due to the different number of studies focusing on teachers and learners.
However, it should be stated that almost all subcategories were present in all time periods except ‘material availability’ (unavailability of GIS educational materials), ‘education goals’ and ‘outcomes’, ‘teachers’ and ‘learners’ motivation’, ‘psychological barriers’, and ‘learners’ and teachers’ cooperations’ (Figure 7). The limits related to the lack of ‘teachers’ motivation’ and their ‘psychological barriers’ were not found in the first period and only sporadically in the second, and their occurrence increased in the last two periods.
Conversely, the subcategory ‘material availability’ was present in all time periods except the last one, which may indicate the disappearance of the limits concerning the lack of sample lessons and teaching materials that can make both the teachers’ preparation of GIS lessons and the course of these lessons easier. Despite the apparent upsurge of good practice articles that supports this assumption (e.g., [84,85,86]), the need for designing and publishing examples of successfully realised lessons in which learners’ content knowledge and skills were efficiently developed through GIS use is still relevant. Since not all the good practice articles fulfil everything mentioned above, many topics which could be efficiently taught through GIS are not covered, and in many cases, the published teaching materials are not helping teachers with the systematic use of GIS in lessons or even indirectly encouraging its sporadic and random use.
4. Limitations
As with any review or research in general, there are limitations that should be stated. Concerning the literature base of this review, despite a relatively high number of empirical studies being identified and analysed, it is possible that other relevant studies missed the criteria of the literature search and were therefore not included. This is mainly a result of the number of terms that are used to express various geographic information systems and the existence of multiple GIS applications and software whose name can be used in the title or the abstract of the article instead of “GIS”.
Moreover, focusing only on articles written in English and, similarly, on articles that were peer-reviewed, might slightly influence the number of identified limits and their frequency. However, it was already necessary to go through almost 3000 abstracts and over 200 full texts due to the impossibility of including the key term “limit” and its synonyms in the search command. Hence, the inclusion of more literature databases or conference papers, for example, would have made the process almost unrealisable.
Furthermore, studies that primarily focussed on other topics related to GIS in education rather than the limits of its implementation and use, e.g., the efficiency of GIS lessons from the perspective of learners’ knowledge and skills, were not eventually included in this review despite marginally paying attention to the limits of GIS use as well (e.g., [87,88]). The inclusion of these articles was not possible as it was often difficult to differentiate between limits that were empirically identified and ones that were only mentioned by authors to interpret the results, i.e., represented their subjective view and were not supported by empirical research. In addition, a relatively high number of studies investigating the effects of GIS use might skew both the relative and absolute frequency of specific limits, given that their design predetermines which limits can be identified.
Considering the analysis of acquired data from the studies, the importance of the found limits of GIS use in education can be only indirectly derived from the number of included studies in which they were identified. It was not possible to evaluate the limits’ importance more directly as the studies vary substantially in their chosen methodological approach and methods of data collection/analysis, the sample size, and how detailed the presentation of the results is. For these reasons, it was also not possible to conduct a meta-analysis of the reviewed studies and calculate average effect sizes of the specific limits identified.
The evaluation of specific limits’ importance based on their frequency needs to be carried out with caution since the calculation of the limits’ frequency did not take into account how many respondents/participants each study had (1 vs. more than 300) or the ratio of the respondents/participants from the whole sample who stated the given limit or in whom the limit was identified. Moreover, since a few articles focused on the limits of specific uses of GIS applications in education [54,59,78], it might be questionable to what extent their results are generalisable and transferable. Notwithstanding, it is apparent from Appendix A that almost all the identified limits might be valid for any GIS and that only several of them are relevant for some GIS applications (e.g., software price, internet connection problems, school browser filtering).
Lastly, there are many other aspects of and possible perspectives on the issue of GIS implementation and use in education and their limits that this systematic review does not cover. For that reason, suggestions for future research were formulated.
5. Implications and Future Research
Despite the stated limitations above, this review provides several important findings and conclusions, thanks to which it is possible to propose suggestions for educational and geoinformatics practice and recommendations for further empirical studies focusing on this issue.
5.1. Suggestions for Practice
The key question to which all stakeholders that are in favour of GIS use in education would like to know the correct answer is most likely “How can all limits that can potentially hinder GIS use or make the education through GIS inefficient be eliminated?”. The results of this systematic review prove that answering this question is never going to be easy and that there is probably no single correct answer for all countries, schools, teachers, learners, etc.
To make the GIS implementation and use in education less problematic, the primary goal might be to eliminate the limits that seem to be easily eliminable such as learners’ uncharged devices, school browser filtering, software price (using freeware instead), or data price (using freely available data or collecting own data). It is apparent that there are not many limits that can be considered easily removable, including the most frequently identified limits. Therefore, the more appropriate approach might be to focus on a single limit whose elimination can lead to the elimination of many other limits and above that of the limits that were frequently identified.
Concretely, attention should be paid to the absence/lack of teacher training in GIS. Obligatory university GIS courses for preservice teachers should be established, and regular GIS workshops for in-service teachers should be organised by universities, ministries of education, or other organisations focusing on education or digital technologies. Both the university courses and lifelong-learning workshops must be well suited for the needs of their participants, i.e., they should substantially differ from GIS courses or workshops for cartographers, spatial planners, etc. Specifically, the courses and workshops for teachers with no prior experience with GIS should explain well the importance of GIS for learners (in terms of their personal and future professional life) and the concrete potential that GIS use has for the school subjects that they teach. They should also be introduced to various GIS applications, mainly for which the schools have appropriate equipment, and the advantages and disadvantages of their use. Finally, the participants should not only learn how to use the chosen GIS applications but also how to practically incorporate them and teach not only about them but mainly through them so that the use of GIS will not take extra time that many teachers lack [17,29,50]. The follow-up workshops should then also focus on specific issues that teachers encountered during their lessons and show them how to successfully deal with them.
The above-mentioned way of eliminating the limits related to teachers’ lack or even absence of GIS training could lead to the elimination of other identified limits, namely the limits related to teachers’ motivation, psychological barriers, and technological and pedagogical knowledge and skills and the limits related to the curriculum, e.g., difficulty with integrating GIS into the lessons and gap between GIS and the school curriculum. Moreover, when the training shows teachers the broad perspective of GIS, they will probably stop perceiving the availability, usability, and price of software as key limits of GIS use in their lessons.
For the elimination of limits related to technology and price of the resources, another suggested solution, based on the review results, is to fill the gap in the geographic information software market by developing a simplified freeware desktop GIS software appropriate for both learners’ and teachers’ needs. For big international GIS companies or even enterprises that need many employees experienced in GIS, the development of such software might be favourable.
This software should not be too demanding on hardware requirements and should ideally fully function without an internet connection (the reason a desktop version is needed); above all, it should be user friendly, meaning not too complex, so that both teachers and learners can easily learn how to use it and the learners will not be overwhelmed and confused during its use. Notwithstanding these needs, the resemblance to professional GIS desktop software should be preserved (e.g., possibility to upload both freely available and own data, to visualise them using different methods, analyse them, and create maps of sufficient cartographic quality from them and the results of their analysis).
This can be accomplished with basic software versions containing only several functions and options and the possibility of installing various extensions when needed. Moreover, for its worldwide use and dissemination across schools of all educational levels, it is essential to make it available in many languages, preferably in the learners’ native language.
Even though GIS software that meets many of these characteristics is coming to the fore (e.g., ArcGIS MapViewer and StoryMaps; [54,59,89,90]), we are not aware of any existing software that would fulfil all of them. Specifically, in the case of ESRI, the global market leader in GIS software, that today makes efforts to target not only the professionals who need to use GIS in their job but also the wider public and to make GIS software appropriate for everyday use, the price remains the main limit for its use in education. Though in some countries, ESRI provides free licences of its software for primary and secondary education, it does not apply worldwide [82], and for that reason, its applications do not fulfil the key prerequisite for eliminating the identified limits of GIS implementation in education. As for various freeware GIS tools that have been developed since 1990s, such as MapMaker, MyWorld GIS, and Kobotoolbox, and that in most cases have not seen wider use in education yet, there are many identified limits that were not eliminated and that might explain their relatively low success. Most of them are available only in English or a few international languages; the promotion, technical support, and continual development towards software highly suitable for education use is limited compared with commercial software; and their narrow focus (e.g., only on thematic map making) is decreasing their potential to be used systematically during a whole school year.
5.2. Recommendations for Future Research
Despite identifying 30 articles investigating the limits of GIS use in education in which 68 limits were found, the results of this systematic review indicated existing gaps in the research.
Firstly, there is currently a lack of studies investigating the view of preservice teachers on this issue even though they are key actors in education and have substantial impact on the direction in which education will go in the near future. The preservice teachers’ changing views on the limits of GIS use during their university studies and their gradual acquisition of experience with their own lesson preparation and teaching would be beneficial for the state of the art as well. Moreover, valuable findings would be reached if the perspective of preservice teachers were compared with the perspectives of both in-service teachers and their pupils in a given country.
Secondly, in most of the countries, this research topic seems to be one-off and mainly investigated during the first efforts to implement GIS into education on the national level (e.g., in Norway, GIS was introduced to curricula in 2006, and the article focusing on the limits of GIS use was published in 2010 [2]). Given that, the knowledge about how the limits of GIS use in education evolve through time and how teachers and learners adapt to them is limited. Similar to education research in general [26], it would be highly valuable to conduct longitudinal studies that would enable researchers to identify how the limits and the individual educational stakeholders’ perceptions of them change over time. The results of these longitudinal studies would be beneficial either with or without targeted educational intervention. In case of the intervention, it might be appropriate to also investigate the effectiveness of various interventions (e.g., focused primarily on different limits identified).
Thirdly, the majority of the included studies did not directly identify the limits of GIS use in education but rather the subjective perception of them. Specifically, the results of questionnaire surveys might be skewed by the point of view of the individuals and their ideas about what the researcher wants to find out [91]. These indirect methods should be thus complemented by other methods of data collection such as lesson observation or a Delphi study. This would also lead to higher numbers of research studies using the mixed-research designs that are still insufficiently present in the educational disciplines despite the merits it brings to the investigated topic [92].
Finally, given the interdisciplinary nature of GIS, the need for interdisciplinary research is apparent. Therefore, the didactics of various school subjects should cooperate and investigate how the limits of GIS use coincides/differs across these subjects; in particular, they should try to identify the generally applicable strategies for the limits’ elimination. Not only interdisciplinary but also international research cooperation would be of great value for the current state of the art and an effective solution for its fragmentation and potential repetitiveness with no added value.
6. Conclusions
The systematic review was carried out with the purpose of the systematisation of knowledge in the field of GIS implementation limits with specific attention paid to the research methodology, identified limits and their categorisations, and time-sensitive analysis, as specified in the research questions.
The findings, among other things, reveal the dominant use of the quantitative method of data collecting (especially questionnaires) from research samples dominated by in-service teachers. Therefore, there is a gap in the research on students and preservice teachers, specifically using qualitative or mixed research methodology.
The expected high variability in GIS implementation limits was confirmed by 68 identified limits classified into the complex and comprehensive categorisation, enabling more systematic analysis. Unsurprisingly, the most frequent (in all observed periods) and the most variable category of limits was teachers, which can potentially strongly influence limits from other categories. On the other hand, the frequency of the learner limits decreased over time. In contrast with expectations, the hardware and software limits did not diminish in influence over time.
It can be concluded that many limits affect the implementation of GIS in lessons, and most of them cannot be considered easily removable. Then, there is a need for continuous and increased efforts from GIS experts, educators, heads of schools, and, primarily, teachers to support GIS use in lessons and enable students to benefit from its educational potential.
Author Contributions
Conceptualization, Veronika Bernhäuserová, Lenka Havelková and Martin Hanus; methodology, Lenka Havelková, Veronika Bernhäuserová, Kateřina Hátlová and Martin Hanus; analysis, Veronika Bernhäuserová, Lenka Havelková and Kateřina Hátlová; writing—original draft preparation, Veronika Bernhäuserová, Lenka Havelková and Martin Hanus; writing—review and editing, Veronika Bernhäuserová, Lenka Havelková and Martin Hanus; visualization, Veronika Bernhäuserová and Kateřina Hátlová; supervision, Martin Hanus and Lenka Havelková. All authors have read and agreed to the published version of the manuscript.
Funding
This study has been supported by Charles University Grant Agency, project GA UK No.383721 “Principles and limits of GIS implementation in geography lessons from the perspective of teachers” and by Charles University Research Centre program, project no. UNCE/HUM/024.
Institutional Review Board Statement
Not applicable.
Informed Consent Statement
Not applicable.
Data Availability Statement
The data presented in this study are available on request from the corresponding author. The data are not publicly available due to privacy.
Conflicts of Interest
The authors declare no conflict of interest. The funders had no role in the design of the study; in the collection, analyses, or interpretation of data; in the writing of the manuscript; or in the decision to publish the results.
Appendix A. The List of Identified Limits and Their Frequency
| Frequency | ||||||
| The Identified Limit | Time Period | |||||
| Total | 1st | 2nd | 3rd | 4th | ||
| RESOURCES | (suitable) hardware unavailability | 1 | 1 | 0 | 0 | 0 |
| data price | 1 | 1 | 0 | 0 | 0 | |
| gap between GIS and school curriculum | 4 | 0 | 0 | 2 | 2 | |
| GIS language mutation unavailability | 2 | 0 | 1 | 1 | 0 | |
| hardware and software price | 1 | 0 | 0 | 0 | 1 | |
| hardware unavailability | 18 | 2 | 3 | 8 | 5 | |
| hardware unavailability at learners’ homes | 1 | 0 | 0 | 0 | 1 | |
| insufficient time devoted to learners’ GIS training | 1 | 0 | 1 | 0 | 0 | |
| internet connection problems | 3 | 0 | 1 | 1 | 1 | |
| irregular use of GIS | 2 | 0 | 1 | 0 | 1 | |
| lack of interdisciplinary GIS cooperation | 1 | 0 | 0 | 1 | 0 | |
| learners’ confusion about GIS software | 1 | 0 | 0 | 0 | 1 | |
| learners’ distraction by GIS environment | 2 | 0 | 1 | 0 | 1 | |
| learners’ perception of GIS lesson as time-consuming | 1 | 1 | 0 | 0 | 0 | |
| learners’ uncharged devices | 1 | 0 | 0 | 0 | 1 | |
| lesson efficiency measuring difficulties | 2 | 0 | 0 | 0 | 2 | |
| measured inefficiency of GIS lessons for learners | 1 | 1 | 0 | 0 | 0 | |
| number of lessons | 4 | 1 | 0 | 2 | 1 | |
| school browser filtering | 1 | 0 | 0 | 1 | 0 | |
| software complexity | 11 | 2 | 3 | 3 | 3 | |
| softwares’ high cognitive demands | 1 | 0 | 1 | 0 | 0 | |
| software price | 4 | 0 | 2 | 1 | 1 | |
| software unavailability | 10 | 1 | 3 | 4 | 2 | |
| start-up price | 1 | 1 | 0 | 0 | 0 | |
| steep learning curve | 1 | 0 | 0 | 0 | 1 | |
| suitable hardware unavailability | 6 | 1 | 2 | 2 | 1 | |
| teachers’ difficulty with integrating GIS into the lessons | 5 | 1 | 0 | 1 | 3 | |
| technical difficulties | 5 | 0 | 2 | 2 | 1 | |
| time-consuming instructions | 2 | 0 | 1 | 1 | 0 | |
| timing of lesson | 6 | 0 | 2 | 3 | 1 | |
| unavailability of digital data | 6 | 1 | 1 | 3 | 1 | |
| unavailability of GIS educational materials | 7 | 1 | 3 | 3 | 0 | |
| HUMAN | ability to manage a class | 1 | 0 | 1 | 0 | 0 |
| absence of learners’ interest in GIS | 2 | 1 | 0 | 0 | 1 | |
| absence of teachers’ interest in GIS | 1 | 0 | 0 | 1 | 0 | |
| absence of suitable technical staff | 2 | 0 | 1 | 0 | 1 | |
| absence of university GIS course | 1 | 0 | 0 | 0 | 1 | |
| general variability of learners’ proficiency level | 3 | 0 | 1 | 1 | 1 | |
| lack of administrative support | 7 | 1 | 1 | 2 | 3 | |
| lack of cooperation with other teachers | 3 | 0 | 0 | 2 | 1 | |
| lack of regular training for teachers | 1 | 0 | 0 | 1 | 0 | |
| lack of teachers’ GIS knowledge | 7 | 1 | 2 | 3 | 1 | |
| lack of teachers’ GIS practice | 1 | 0 | 0 | 1 | 0 | |
| lack of teachers’ self-confidence | 3 | 0 | 1 | 1 | 1 | |
| lack of technical support | 2 | 1 | 0 | 1 | 0 | |
| learners’ (mis)understanding of GIS potential | 2 | 1 | 1 | 0 | 0 | |
| HUMAN | learners’ difficulties in higher-order thinking | 1 | 0 | 1 | 0 | 0 |
| learners’ difficulty with groupwork | 2 | 0 | 1 | 0 | 1 | |
| learners’ lack of technology skills | 6 | 1 | 1 | 3 | 1 | |
| learners’ low level of geographic skills | 3 | 1 | 0 | 1 | 1 | |
| learners’ low level of map design skills | 1 | 1 | 0 | 0 | 0 | |
| learners’ need of contingent scaffolding | 1 | 0 | 0 | 1 | 0 | |
| learning about GIS | 2 | 1 | 0 | 0 | 1 | |
| no GIS competence of teachers | 1 | 0 | 0 | 1 | 0 | |
| school staff’s lack of technology skills | 1 | 0 | 1 | 0 | 0 | |
| teachers’ (mis)understanding of GIS potential | 6 | 0 | 1 | 2 | 3 | |
| teachers’ disbelief of GIS use necessity | 2 | 0 | 0 | 1 | 1 | |
| teachers’ fear of using GIS | 1 | 0 | 0 | 1 | 0 | |
| teachers’ high workload | 2 | 0 | 1 | 1 | 0 | |
| teachers’ inability to create own materials and data | 3 | 0 | 1 | 1 | 1 | |
| teachers’ lack of GIS training | 15 | 3 | 3 | 6 | 3 | |
| teachers’ lack of technology skills | 6 | 0 | 2 | 2 | 2 | |
| teachers’ lack of time | 6 | 1 | 0 | 3 | 2 | |
| teachers’ low media literacy | 1 | 0 | 0 | 1 | 0 | |
| teachers’ need of training | 1 | 1 | 0 | 0 | 0 | |
| teachers’ perception of GIS lesson inefficiency | 1 | 0 | 0 | 1 | 0 | |
| teachers’ perception of GIS use difficulty | 2 | 0 | 1 | 0 | 1 | |
| teachers’ unfamiliarity with educational materials | 1 | 0 | 0 | 0 | 1 | |
| time-consuming preparation for teachers | 8 | 1 | 3 | 2 | 2 | |
| unsuitable teaching approaches | 2 | 0 | 1 | 1 | 0 | |
| variability in learners’ level of technological skills | 1 | 0 | 0 | 1 | 0 | |
Appendix B. Matrix of Limit Categories Co-Occurrence in the Reviewed Studies
| Cooperation (in Lesson) | Cooperation (with Other Teachers) | Curriculum | Data | Educational Goals and Outcomes | Hardware | Learners’ Knowledge and Skills | Learners’ Motivation | Price | Psychological Barriers | Software | Teachers’ Knowledge and Skills | Teachers’ Motivation | Teachers’ Training | Teachers’ Workload | Technical Support | Technological Problems | Time Allocated | |
| cooperation (in lesson) | 2 | 0 | 0 | 0 | 0 | 1 | 2 | 0 | 0 | 1 | 1 | 0 | 1 | 1 | 1 | 0 | 0 | 1 |
| cooperation (with other teachers) | 3 | 1 | 1 | 2 | 2 | 0 | 0 | 0 | 0 | 1 | 2 | 1 | 2 | 3 | 1 | 2 | 2 | |
| curriculum | 7 | 3 | 1 | 5 | 1 | 0 | 3 | 1 | 6 | 5 | 1 | 7 | 3 | 3 | 3 | 3 | ||
| data | 6 | 2 | 6 | 3 | 0 | 4 | 2 | 6 | 4 | 3 | 4 | 3 | 3 | 0 | 4 | |||
| educational goals and outcomes | 6 | 3 | 2 | 1 | 0 | 0 | 3 | 4 | 2 | 2 | 5 | 3 | 1 | 3 | ||||
| hardware | 22 | 8 | 3 | 5 | 3 | 14 | 12 | 5 | 13 | 11 | 9 | 2 | 11 | |||||
| learners’ knowledge and skills | 10 | 2 | 2 | 2 | 7 | 4 | 2 | 4 | 4 | 5 | 1 | 6 | ||||||
| learners’ motivation | 5 | 0 | 0 | 3 | 3 | 2 | 2 | 1 | 2 | 0 | 2 | |||||||
| price | 6 | 2 | 5 | 3 | 2 | 4 | 3 | 4 | 1 | 4 | ||||||||
| psychological barriers | 4 | 3 | 1 | 2 | 2 | 3 | 1 | 0 | 4 | |||||||||
| software | 20 | 11 | 5 | 13 | 8 | 7 | 3 | 10 | ||||||||||
| teachers’ knowledge and skills | 16 | 6 | 11 | 8 | 6 | 4 | 8 | |||||||||||
| teachers’ motivation | 8 | 4 | 4 | 3 | 0 | 5 | ||||||||||||
| teachers’ training | 16 | 7 | 6 | 4 | 8 | |||||||||||||
| teachers’ workload | 15 | 5 | 3 | 11 | ||||||||||||||
| technical support | 12 | 2 | 6 | |||||||||||||||
| technological problems | 6 | 2 | ||||||||||||||||
| time allocated | 15 |
References
- Burrough, P.A. Principles of Geographical Information Systems for Land Resources Assessment. Geocarto Int. 1986, 1, 54. [Google Scholar] [CrossRef]
- Rød, J.K.; Larsen, W.; Nilsen, E. Learning Geography with GIS: Integrating GIS into Upper Secondary School Geography Curricula. Nor. Geogr. Tidsskr. 2010, 64, 21–35. [Google Scholar] [CrossRef]
- Baker, T.R.; Kerski, J.; Huynh, N.T.; Viehrig, K.; Bednarz, S.W. A Call for an Agenda and Center for GIS Education Research. Rev. Int. Geogr. Educ. Online 2012, 2, 254–288. [Google Scholar]
- West, B.A. Student Attitudes and the Impact of GIS on Thinking Skills and Motivation. J. Geogr. 2003, 102, 267–274. [Google Scholar] [CrossRef]
- Kemp, K.; Goodchild, M. Developing a Curriculum in Geographic Information Systems: The National Center for Geographic Information and Analysis Core Curriculum Project. J. Geogr. High. Educ. 1991, 15, 123–134. [Google Scholar] [CrossRef]
- Liu, Y.; Laxman, K. GIS Enabled PBl Pedagogy: The Effects on Students’ Learning in the Classroom. J. Sch. Educ. Technol. 2009, 5, 15–27. [Google Scholar] [CrossRef]
- Wiegand, P. Geographical Information Systems (GIS) in Education. Int. Res. Geogr. Environ. Educ. 2001, 10, 68–71. [Google Scholar] [CrossRef]
- Sui, D.Z. A Pedagogic Framework to Link GIS to the Intellectual Core of Geography. J. Geogr. 1995, 94, 578–591. [Google Scholar] [CrossRef]
- Bednarz, S. Geographic Information Systems: A Tool to Support Geography and Environmental Education? GeoJournal 2004, 60, 191–199. [Google Scholar] [CrossRef]
- Liben, L.S.; Myers, L.J.; Kastens, K.A. Locating Oneself on a Map in Relation to Personal Qualities and Map Characteristics. In Spatial Cognition VI: Learning, Reasoning and Talking about Space; Freksa, C., Newcombe, N.S., Gärdenfors, P., Wölfl, S., Eds.; Springer-Verlag: Berlin/Heidelberg, Germany, 2008; pp. 171–187. [Google Scholar]
- Uttal, D.H. Spatial Symbols and Spatial Thought: Cross-Cultural, Developmental, and Historical Perspectives on the Relation Between Map Use and Spatial Cognition. In Symbol Use and Symbolic Representation: Developmental and Comparative Perspectives; Namy, L.L., Ed.; Lawrence Erlbaum Associates Publishers: Hillsdale, NJ, USA, 2005; pp. 3–23. [Google Scholar]
- Baker, T.R.; Battersby, S.; Bednarz, S.W.; Bodzin, A.M.; Kolvoord, B.; Moore, S.; Sinton, D.; Uttal, D. A Research Agenda for Geospatial Technologies and Learning. J. Geogr. 2015, 114, 118–130. [Google Scholar] [CrossRef]
- Bednarz, S.W.; Bednarz, R. Spatial Thinking: The Key to Success in Using Geospatial Technologies in the Social Studies Classroom. In Digital Geography: Geospatial Technologies in the Social Studies Classroom; Milson, A., Alibrandi, M., Eds.; Information Age Publishing: Charlotte, NC, USA, 2008; pp. 249–270. [Google Scholar]
- Doering, A. GIS in Education: An Examination of Pedagogy—ProQuest. Ph.D. Dissertation, University of Minnesota, Minneapolis, MI, USA, 2002. [Google Scholar]
- Demirci, A.; Karaburun, A.; Ünlü, M. Implementation and Effectiveness of GIS-Based Projects in Secondary Schools. J. Geogr. 2013, 112, 214–228. [Google Scholar] [CrossRef]
- Favier, T.; van der Schee, J. Learning to Think Geographically by Working with GIS. In Learning with Geoinformation IV; Jekel, T., Koller, A., Donert, K., Vogler, R., Eds.; Wichmann: Berlin/Heidelberg, Germany, 2009; pp. 135–145. [Google Scholar]
- Höhnle, S.; Schubert, J.C.; Uphues, R. What Are the Constraints to GIS Usage? Selected Results of a Teacher Survey about Constraints in the School Context. Int. Res. Geogr. Environ. Educ. 2013, 22, 226–240. [Google Scholar] [CrossRef]
- Nielsen, C.P.; Oberle, A.; Sugumaran, R. Implementing a High School Level Geospatial Technologies and Spatial Thinking Course. J. Geogr. 2011, 110, 60–69. [Google Scholar] [CrossRef]
- Meyer, J.W.; Butterick, J.; Olkin, M.; Zack, G. GIS in the K-12 Curriculum: A Cautionary Note. Prof. Geogr. 1999, 51, 571–578. [Google Scholar] [CrossRef]
- Green, D.R. GIS in School Education: An Introduction. In GIS: A Sourcebook for Schools; Green, D.R., Ed.; Taylor and Francis: London, UK, 2001; pp. 1–25. [Google Scholar]
- Höhnle, S.; Mehren, R.; Schubert, J. Teachers’ Perspectives on Teacher Training for Better Implementation of GIS in the Geography Classroom. GI_Forum—J. Geogr. Inf. Sci. 2015, 1, 363–372. [Google Scholar] [CrossRef][Green Version]
- Kerski, J. The Implementation and Effectiveness of GIS in Secondary Education. Geographic Information Systems in Education; VDM: Saarbrücken, Germany, 2009; ISBN 978-3-639-17769-5. [Google Scholar]
- Lam, C.-C.; Lai, E.; Wong, J. Implementation of Geographic Information System (GIS) in Secondary Geography Curriculum in Hong Kong: Current Situations and Future Directions. Int. Res. Geogr. Environ. Educ. 2009, 18, 57–74. [Google Scholar] [CrossRef]
- Harte, W. Preparing Preservice Teachers to Incorporate Geospatial Technologies in Geography Teaching. J. Geogr. 2017, 116, 226–236. [Google Scholar] [CrossRef]
- Tarr, J.E.; Reys, R.E.; Reys, B.J.; Chávez, Ó.; Shih, J.; Osterlind, S.J. The Impact of Middle-Grades Mathematics Curricula and the Classroom Learning Environment on Student Achievement. J. Res. Math. Educ. 2008, 39, 247–280. [Google Scholar]
- Bednarz, S.W.; Heffron, S.; Huynh, N.T. (Eds.) A Road Map for 21st Century Geography Education: Geography Education Research; Association of American Geographers: Washington, DC, USA, 2013. [Google Scholar]
- Baker, T.; Palmer, A.; Kerski, J. A National Survey to Examine Teacher Professional Development and Implementation of Desktop GIS. J. Geogr. 2009, 108, 174–185. [Google Scholar] [CrossRef]
- Wheeler, P.; Gordon-Brown, L.; Peterson, J.; Ward, M. Geographical Information Systems in Victorian Secondary Schools: Current Constraints and Opportunities. Int. Res. Geogr. Environ. Educ. 2010, 19, 155–170. [Google Scholar] [CrossRef]
- Yap, L.Y.; Tan, G.C.I.; Zhu, X.; Wettasinghe, M.C. An Assessment of the Use of Geographical Information Systems (GIS) in Teaching Geography in Singapore Schools. J. Geogr. 2008, 107, 52–60. [Google Scholar] [CrossRef]
- Moher, D.; Liberati, A.; Tetzlaff, J.; Altman, D. Preferred Reporting Items for Systematic Reviews and Meta-Analyses: The PRISMA Statement. Br. Med. J. 2009, 8, 336–341. [Google Scholar] [CrossRef]
- Maguire, D.J. An Overview and Definition of GIS. In Geographical Information Systems: Principles and Applications; Longman Scientific & Technical: New York, NY, USA, 1991; Volume 1, pp. 9–20. [Google Scholar]
- Liu, S.; Zhu, X. Designing a Structured and Interactive Learning Environment Based on GIS for Secondary Geography Education. J. Geogr. 2008, 107, 12–19. [Google Scholar] [CrossRef]
- Höhnle, S.; Schubert, J.C.; Uphues, R. Barriers to GI(S) Use in Schools—A Comparison of International Empirical Results. Learn. GI 2011, 124–133. [Google Scholar]
- Patterson, T.C. Google Earth as a (Not Just) Geography Education Tool. J. Geogr. 2007, 106, 145–152. [Google Scholar] [CrossRef]
- Mukherjee, F. Exploring Cultural Geography Field Course Using Story Maps. J. Geogr. High. Educ. 2019, 43, 201–223. [Google Scholar] [CrossRef]
- Phantuwongraj, S.; Chenrai, P.; Assawincharoenkij, T. Pilot Study Using ArcGIS Online to Enhance Students’ Learning Experience in Fieldwork. Geosciences 2021, 11, 357. [Google Scholar] [CrossRef]
- Petsch, C.; Velho, L.F.; da Rosa, K.K. Use of Data Platforms and Google Earth Engine in Criosphere Education and Climate Change. Geosaberes 2019, 10, 36–48. [Google Scholar] [CrossRef]
- Carrera, C.C.; Pérez, J.L.S.; De La Torre Cantero, J.; González, A.M.M. Engineers’ Spatial Orientation Ability Development at the European Space for Higher Education. Eur. J. Eng. Educ. 2011, 36, 505–512. [Google Scholar] [CrossRef]
- Bernhäuserová, V.; Havelková, L. Geoportály Do Výuky Geografie Snadno a Rychle. Geogr. Rozhl. 2019, 28, 20–23. [Google Scholar]
- Uuemaa, E.; Liiber, Ü. The Experience of Using Geoportal in National Geography Olympiad in Estonia. In Proceedings of the GI_Forum 2014—Geospatial Innovation for Society; Austrian Academy of Sciences Press: Salzburg, Austria, 2015; pp. 328–331. [Google Scholar]
- Page, M.; Mckenzie, J.; Bossuyt, P.; Boutron, I.; Hoffmann, T.; Mulrow, C.; Shamseer, L.; Tetzlaff, J.; Akl, E.; Brennan, S.; et al. The PRISMA 2020 Statement: An Updated Guideline for Reporting Systematic Reviews. BMJ 2021, 372, 89. [Google Scholar] [CrossRef]
- Havelková, L.; Hanus, M. Map Skills in Education: A Systematic Review of Terminology, Methodology, and Influencing Factors. Rev. Int. Geogr. Educ. Online 2019, 9, 361–401. [Google Scholar] [CrossRef]
- Barrot, J.S. Research on Education in Southeast Asia (1996–2019): A Bibliometric Review. Educ. Rev. 2021, 0, 1–21. [Google Scholar] [CrossRef]
- Elsevier Scopus Content. Available online: https://www.elsevier.com/solutions/scopus/how-scopus-works/content (accessed on 17 October 2022).
- ERIC FAQ—Whas Is ERIC? Available online: https://eric.ed.gov/?faq (accessed on 11 August 2022).
- Krippendorff, K. Computing Krippendorff’s Alpha-Reliability. Available online: https://repository.upenn.edu/asc_papers/43 (accessed on 2 February 2022).
- Ercan, S.; Bozkurt Altan, E.; Taştan, B.; Dağ, I. Integrating GIS into Science Classes to Handle STEM Education. J. Turk. Sci. Educ. 2016, 13, 30–43. [Google Scholar] [CrossRef]
- Osborne, Z.M.; van de Gevel, S.L.; Eck, M.A.; Sugg, M. An Assessment of Geospatial Technology Integration in K–12 Education. J. Geogr. 2020, 119, 12–21. [Google Scholar] [CrossRef]
- Muniandy, V. Geographic Information System (GIS) Awareness and Perception among Kuala Muda District Geography Teachers. UbiquitousLearn. Int. J. 2013, 5, 1–11. [Google Scholar]
- Collins, L.; Mitchell, J.T. Teacher Training in GIS: What Is Needed for Long-Term Success? Int. Res. Geogr. Environ. Educ. 2019, 28, 118–135. [Google Scholar] [CrossRef]
- Wang, Y.; Chen, J. GIS Education in Taiwanese Senior High Schools: A National Survey Among Geography Teachers. J. Geogr. 2013, 112, 75–84. [Google Scholar] [CrossRef]
- Li, P.; Knox, L.W.; Wright, R. Geography Education in Rural Tennessee Counties: Upper Cumberland Geography Teacher Survey. Geography 2003, 88, 63–74. [Google Scholar]
- Audet, R.H.; Paris, J. GIS Implementation Model for Schools: Assessing the Critical Concerns. J. Geogr. 1997, 96, 293–300. [Google Scholar] [CrossRef]
- Strachan, C.; Mitchell, J. Teachers’ Perceptions of Esri Story Maps as Effective Teaching Tools. Rev. Int. Geogr. Educ. Online 2014, 4, 195–220. [Google Scholar]
- Akinyemi, F. Technology Use in Rwandan Secondary Schools: An Assessment of Teachers’ Attitudes towards Geographic Information Systems (GIS). Int. Res. Geogr. Environ. Educ. 2015, 25, 20–35. [Google Scholar] [CrossRef]
- Akinyemi, F. An Assessment of GIS Use for Teaching in Rwandan Secondary Schools. Geogr. Teach. 2015, 12, 27–40. [Google Scholar] [CrossRef]
- Roulston, S. GIS in Northern Ireland Secondary Schools: Mapping Where We Are Now. Int. Res. Geogr. Environ. Educ. 2013, 22, 41–56. [Google Scholar] [CrossRef]
- Hong, J.E. Promoting Teacher Adoption of GIS Using Teacher-Centered and Teacher-Friendly Design. J. Geogr. 2014, 113, 139–150. [Google Scholar] [CrossRef]
- Egiebor, E.E.; Foster, E.J. Students’ Perceptions of Their Engagement Using GIS-Story Maps. J. Geogr. 2019, 118, 51–65. [Google Scholar] [CrossRef]
- Fleischmann, E.M.-L.; van der Westhuizen, C.P.; Cilliers, D. Interactive-GIS-Tutor (IGIST) Integration: Creating a Digital Space Gateway within a Textbook-Bound South African Geography Class. Int. J. Educ. Dev. Using ICT 2015, 11, 23–38. [Google Scholar]
- Degirmenci, Y. Use of Geographic Information Systems (GIS) in Geography Lessons According to Teachers’ Opinion. World J. Educ. Technol. Curr. Issues 2018, 10, 186–196. [Google Scholar] [CrossRef]
- Aladağ, E. The Effects of GIS on Students’ Academic Achievement and Motivation in Seventh-Grade Social Studies Lessons in Turkey. Int. Res. Geogr. Environ. Educ. 2010, 19, 11–23. [Google Scholar] [CrossRef]
- Zalles, D.R.; Manitakos, J. Strategizing Teacher Professional Development for Classroom Uses of Geospatial Data and Tools. Contemp. Issues Technol. Teach. Educ. 2016, 16, 286–309. [Google Scholar]
- Mkhongi, F.; Musakwa, W. Perspectives of GIS Education in High Schools: An Evaluation of UMgungundlovu District, KwaZulu-Natal, South Africa. Educ. Sci. 2020, 10, 131. [Google Scholar] [CrossRef]
- Rubino-Hare, L.A.; Whitworth, B.A.; Bloom, N.E.; Claesgens, J.M.; Fredrickson, K.M.; Sample, J.C. Persistent Teaching Practices after Geospatial Technology Professional Development. Contemp. Issues Technol. Teach. Educ. 2016, 16, 208–285. [Google Scholar]
- Shin, E.-K. Using Geographic Information System (GIS) to Improve Fourth Graders’ Geographic Content Knowledge and Map Skills. J. Geogr. 2006, 105, 109–120. [Google Scholar] [CrossRef]
- Fielding, G.J. Computer—Assisted Instruction in Geography. J. Geogr. 1968, 67, 474–483. [Google Scholar] [CrossRef]
- Meyer, J.M.W. Map Skills Instruction and the Child’s Developing Cognitive Abilities. J. Geogr. 1973, 72, 27–35. [Google Scholar] [CrossRef]
- Schneider, D.O. The Performance of Elementary Teachers and Students on a Test of Map and Globe Skills. J. Geogr. 1976, 75, 326–332. [Google Scholar] [CrossRef]
- Moser, F.Z. Faculty Adoption of Educational Technology. EQ 2007, 30, 66–69. [Google Scholar]
- Ungerleider, C.; Burns, T. Information and Communication Technologies in Elementary and Secondary Education: A State of the Art Review. Int. J. Educ. Policy Res. Pract. 2002, 3, 2–28. [Google Scholar]
- Anunti, H.; Vuopala, E.; Rusanen, J. A Portfolio Model for the Teaching and Learning of GIS Competencies in an Upper Secondary School: A Case Study from a Finnish Geomedia Course. Rev. Int. Geogr. Educ. Online 2020, 10, 262–282. [Google Scholar] [CrossRef]
- Dékány, K. GIS in Secondary Education in Hungary—Experiences in Lessons and in a Study Group. In Geospatial Technologies in Geography Education; Key Challenges in Geography; de Miguel González, R., Donert, K., Koutsopoulos, K., Eds.; Springer International Publishing: Cham, Switzerland, 2019; pp. 201–219. ISBN 978-3-030-17783-6. [Google Scholar]
- González, R.D.M.; Torres, M.L.D.L. WebGIS Implementation and Effectiveness in Secondary Education Using the Digital Atlas for Schools. J. Geogr. 2020, 119, 74–85. [Google Scholar] [CrossRef]
- Donnay, J.-P. Les « systèmes d’information géographiques » (SIG). Préliminaires à un usage de l’enseignement. Bull. Société Géographique Liège 2005, 45, 45–52. [Google Scholar]
- Zadrozny, J.; McClure, C.; Lee, J.; Jo, I. Designs, Techniques, and Reporting Strategies in Geography Education: A Review of Research Methods. Rev. Int. Geogr. Educ. Online 2016, 6, 216–233. [Google Scholar]
- Jackson, K.M. A Review of Research Methods Trends in Educational Leadership Journals. Educ. Leadersh. Rev. 2019, 20, 119–132. [Google Scholar]
- Fleischmann, E.M.-L.; van der Westhuizen, C.P. The Interactive-GIS-Tutor (IGIST): An Option for GIS Teaching in Resource-Poor South African Schools. S. Afr. Geogr. J 2017, 99, 68–85. [Google Scholar] [CrossRef]
- Shin, E.-K. Using Geographic Information System (GIS) Technology to Enhance Elementary Students’ Geographic Understanding. Theory Res. Soc. Educ. 2007, 35, 231–255. [Google Scholar] [CrossRef]
- Oates, C.; Riaz, N. Accessing the Field: Methodological Difficulties of Research in Schools. Educ. North 2016, 23, 53–74. [Google Scholar]
- Kholoshyn, I.; Nazarenko, T.; Bondarenko, O.; Hanchuk, O.; Varfolomyeyeva, I. The Application of Geographic Information Systems in Schools around the World: A Retrospective Analysis. J. Phys. Conf. Ser. 2021, 1840, 012017. [Google Scholar] [CrossRef]
- Mzuza, M.K.; Van Der Westhuizen, C.P. Review on the State of GIS Application in Secondary Schools in the Southern African Region. S. Afr. Geogr. J 2019, 101, 175–191. [Google Scholar] [CrossRef]
- Hewlett Packard. The Education-Specific Intranet Consultancy Study: Need Analysis Report. Unpublished Consultancy Paper; Hewlett Packard: Hong Kong, China, 1999. [Google Scholar]
- Kerski, J.J. Teaching Demography and Population Change Using Web GIS Tools and Data. Geogr. Teach. 2019, 16, 126–132. [Google Scholar] [CrossRef]
- Grubbs, M.R. Explaining Global Women’s Empowerment Using Geographic Inquiry. Geogr. Teach. 2018, 15, 39–42. [Google Scholar] [CrossRef]
- Perry, J. Using GIS to Explore the Consequences of Agricultural Practices in the Amazon Rainforest. Geogr. Teach. 2022, 19, 80–84. [Google Scholar] [CrossRef]
- Ratinen, I.; Keinonen, T. Student-Teachers’ Use of Google Earth in Problem-Based Geology Learning. Int. Res. Geogr. Environ. Educ. 2011, 20, 345–358. [Google Scholar] [CrossRef]
- Liu, Y.; Bui, E.N.; Chang, C.-H.; Lossman, H.G. PBL-GIS in Secondary Geography Education: Does It Result in Higher-Order Learning Outcomes? J. Geogr. 2010, 109, 150–158. [Google Scholar] [CrossRef]
- Lee, D.-M. Cultivating Preservice Geography Teachers’ Awareness of Geography Using Story Maps. J. Geogr. High. Educ. 2020, 44, 387–405. [Google Scholar] [CrossRef]
- Kerski, J.J. Innovative Instruction Using Field Surveys, Interactive Maps, Dashboards, and Infographics. Geogr. Teach. 2021, 18, 45–54. [Google Scholar] [CrossRef]
- Champion, R. Surveys and Questionnaires Have Their Pluses–and Their Pitfalls. J. Staff. Dev. 2006, 27, 61–64. [Google Scholar]
- Treagust, D.F.; Won, M.; Duit, R. Paradigms in Science Education Research. In Handbook of Research on Science Education; Lederman, N.G., Abell, S.K., Eds.; Routledge Handbooks Online: New York, NY, USA, 2014; pp. 3–17. ISBN 978-0-415-62937-9. [Google Scholar]
Publisher’s Note: MDPI stays neutral with regard to jurisdictional claims in published maps and institutional affiliations. |
© 2022 by the authors. Licensee MDPI, Basel, Switzerland. This article is an open access article distributed under the terms and conditions of the Creative Commons Attribution (CC BY) license (https://creativecommons.org/licenses/by/4.0/).