Article

Quantify the Potential Spatial Reshaping Utility of Urban Growth Boundary (UGB): Evidence from the Constrained Scenario Simulation Model

School of Architecture and Urban Planning, Guangdong University of Technology, Guangzhou 510090, China
*
Author to whom correspondence should be addressed.
ISPRS Int. J. Geo-Inf. 2022, 11(10), 511; https://doi.org/10.3390/ijgi11100511
Submission received: 18 August 2022 / Revised: 22 September 2022 / Accepted: 25 September 2022 / Published: 30 September 2022

Abstract

:
Many countries, including China, have implemented the spatial government policy widely known as urban growth boundary (UGB) for managing future urban growth. However, few studies have asked why we need UGB, especially pre-evaluating the utility of UGB for reshaping the future spatial patterns of cities. In this research, we proposed a constrained urban growth simulation model (CUGSM) which coupled Markov chain (MC), random forest (RF), and patch growth based cellular automata (Patch-CA) to simulate urban growth. The regulatory effect of UGB was coupled with CUGSM based on a random probability game method. Guangzhou city, a metropolitan area located in the Peral River Delta of China, was taken as a case study. Historical urban growth from 1995 to 2005 and random forests were used to calibrate the conversion rules of Patch-CA, and the urban patterns simulated and observed in 2015 were used to identify the simulation accuracy. The results showed that the Kappa and figure of merit (FOM) indices of the unconstrained Patch-CA were just 0.7914 and 0.1930, respectively, which indicated that the actual urban growth was reshaped by some force beyond what Patch-CA has learned. We further compared the simulation scenarios in 2035 with and without considering the UGB constraint, and the difference between them is as high as 21.14%, which demonstrates that UGB plays an important role in the spatial reshaping of future urban growth. Specifically, the newly added urban land outside the UGB has decreased from 25.13% to 16.86% after considering the UGB constraint; particularly, the occupation of agricultural space and ecological space has been dramatically reduced. This research has demonstrated that the utility of UGB for reshaping future urban growth is pronounced, and it is necessary for the Chinese government to further strengthen UGB policy to promote sustainable urban growth.

1. Introduction

Urban growth has been a worldwide phenomenon in the past decades, especially in developing countries such as China [1]. It is foreseeable that this phenomenon will continue in the next decades [2,3]. Urban growth is strongly affected by human activities, which is also the main reason for regional or global land use/cover change [4]. Usually, urban growth has occupied a lot of cultivated land which greatly threatens food security [5]. Moreover, the occupation of forests, waters, and some other ecological spaces have also cut down ecological service [6]. Unreasonable urban expansion will inevitably affect urban sustainable development, so the government expects to restrain unreasonable urban growth through spatial planning [7,8], especially through the urban growth boundary (UGB), which has been recognized as the most important planning regulation tool for managing urban growth [9].
With the Chinese government increasingly strengthening the planning regulation of the UGB, the UGB has become a popular research subject [10,11,12,13,14]. Since the main planning task of the UGB is to scientifically control future urban growth, it has always been the focus of research to support future urban-scenario simulations by developing a spatial planning model [15,16]. As we all know, a city is a typical self-organizing system, and urban growth is a spatial-temporal dynamic process [17]. Therefore, bottom-up models, such as cellular automata (CA), have been widely applied for simulation of urban growth [18]. Actually, CA is just a spatially and temporally discrete dynamical system, which can not only be used to predict future urban growth according to historical conversion rules [19,20] but also can help with multi-scenario simulations by setting up various conditions [21,22,23]. Thus far, CA modelling has made substantial progress in state conversion rules calibration, neighborhood sensitivity, and various simulation applications [24,25].
According to their objective, CA-based models can be classified into three categories: descriptive, predictive, and prescriptive [26]. As for predictive CA modeling, it is generally recognized that better simulation rules contribute to predicting future urban growth better and better, and mining the transformation rules is often considered as the core step of CA modelling [27]. From classic logistic regression to the top-rated deep learning, almost every method proposed is being currently used for CA modeling [28,29,30]. However, urbanization is a coupled human–natural system process, and no city always remains unchanged forever in its historical growth [31]. In practice, urban growth is often intervened and reconstructed by human activities, e.g., a new spatial development strategy or policy set up by the governments could change the law [32]. Although it is critical to develop predictive CA models, we should not neglect the spatial reshaping effect caused by human activities. Therefore, the prescriptive CA models that consider a variety of constraints for scenario simulation are also very attractive, which is usually described as constraint cellular automata (CCA).
The CCA model provides an interface to consider the active intervention of human activities, which is better used to discuss spatial planning problems [33]. For example, planners usually use the CCA model to generate multi urban growth scenarios to support decision-making in planning [34,35]. In addition, in the context of current policies to improve ecosystem services and control carbon emissions, the new constraint factors such as ecosystem services and carbon emissions have also attracted many researchers [36,37]. Undoubtedly, CCA provides an excellent simulation tool for studying the evolution of urban growth. However, compared with numerous studies that generate scenarios with CCA to support spatial planning, there are few studies have applied CCA to pre-evaluate the existing spatial planning schemes [25]. Actually, using CCA to evaluate existing spatial planning schemes is feasible, and it is also of great significance for planners to reflect on their own planning schemes [38]. Although assessing existing spatial planning policies with CCA has attracted some scientists, more in-depth discussion should be further promoted.
UGB has been viewed as playing an important role in territorial spatial planning since China started the reform of spatial planning after the 19th National Congress of the Communist Party [39]. However, why should China implement UGB policy to manage urban growth? Is it bad for cities to grow freely? Existing studies have evaluated the regulation effectiveness of UGB by using historical urban expansion [20,40], but few studies have pre-evaluated the spatial reshaping effect of UGB on future urban growth, particularly discussing the utility of the UGB that was planned by the professional agency. The only way to answer the necessity of delimiting UGB for regulation of future urban growth is to develop CCA-based scenario simulation models to demonstrate the difference between future urban areas that grow completely free and those with constraint control.
According to the issues discussed above, this research aims to develop a constraint urban growth simulation (CUGSM) model based on the framework of CCA to pre-evaluate the utility of UGB. To deliberate the impact of planned UGB on future urban growth, Markov chain-based quantity prediction, random forest-based suitability evaluation, patch growth based cellular automata, and random probability-based game were coupled in a CUGSM. Taking the Guangzhou metropolitan area of China as a case study, we applied the proposed model to simulate the urban growth scenario from 2015 to 2035, and then, this simulation scenario was compared with another not considering the constraints of UGB. This study will help local authorities to assess the historical urban growth process, to decide whether to implement UGB policies, and to explore the areas where tighter controls are needed to prevent illegal development. This research could not only answer the utility of UGB but also clarify why China has started implementing the UGB policy to manage future urban growth.

2. Methodology

2.1. Framework of Modelling Procedure

We proposed a constrained urban growth simulation model (CUGSM) which coupled Markov chain (MC), random forest (RF), and patch growth based cellular automata (Patch-CA) to evaluate the utility of UGB for reshaping future urban growth. The modelling procedure of CUGSM is shown in Figure 1. First, we must prepare the spatial data for modelling. For example, we could use remote sensing (RS) such as Landsat imagery to observe a series of historical urban growth. Two of these images were used to initiate the parameters of predictive CA, and one of them was used to validate the simulation accuracy. Moreover, we should also collect or preprocess some spatial environmental factors such as regional landform, the official urban growth boundary, and so on. Second, we predict the quantity of urban land for future growth with the Markov chain (MC). Although there are a lot of methods for predicting this quantity, studies usually coupled MC into CA because it not only uses less reference data but also has relatively good prediction accuracy [41,42]. Third, the random forest (RF) method was applied to calibrate the transition rules of CA which are usually defined as suitability. Existing studies have evaluated the performance of a variety of machine learning methods, and comparison studies revealed that the RF algorithm outperforms most of the selected algorithms [43,44]. Fourth, a seed-based patch growth strategy was defined to update the status of CA. Traditional CA modeling is usually a raster-based procedure, but studies have shown that patches are a more natural form of representing actual land use change [45,46]. Next, a random probability-based game method was used to consider the influence of UGB on patch growth-based CA. Finally, the scenarios with and without UGB constraints were compared to evaluate the simulation accuracy and the reshaping ability of UGB for future urban growth. The CUGSM integrates advantages of all the methods that have been discussed in previous literature and fits the needs of the aim of this study very well.

2.2. Constrained Urban Growth Simulation Model (CUGSM)

2.2.1. Basic Framework of CA

CA is undoubtedly the core model for urban growth simulation. Until now, though there are a variety of ways of modelling, a basic CA model framework mainly includes the following parts: (1) a quantity module to determine when the simulation process stops, which is usually predicted by Markov chain as well as some other methods that could analyze the social and economic demand of humans; (2) a spatial module to explore the initial probability for urban growth on cells, which is usually estimated with a variety of data mining methods such as logistic regression, random forest, and some other algorithms; (3) an iterative module to determine where cells could be converted into urban land, which is usually considering neighborhood interaction and updating its status according to the integrated probability. We formulate the basic urban growth simulation model as:
C A = p i j t = f ( S i j , Ω i j t , Ψ i j ) U i j t = g ( p i j t , Q t )
where p i j t represents the integrated urban growth probability, which is calculated using urban growth suitability S i j , neighborhood interaction Ω i j t and prohibited development conditions Ψ i j with the integration function f ; S i j is estimated from historical urban growth using the random forest (RF) method; Ω i j t is a dynamic variable calculated using a moving window such as Moore and so on; Ψ i j is usually defined by the ecological or basic farm land conserved areas. U i j t is the status of cell i j ( i = 1 , 2 , , I ; j = 1 , 2 , , J ) ; whether cell i j could be converted into urban land is determined by its integrated probability p i j t and newly-added urban land quantity Q t predicted with the MC method; g is a function used to determine when the iteration of CA should be stopped.

2.2.2. Patch Growth-Based Strategy for CA Updating (Patch-CA)

In most previous research, whether the cells in CA could be urbanized is determined by a threshold value. This means that if the integrated urban growth probability ( p i j t ) is bigger than the threshold value ( p t h d ), then the status of cell i j is converted into urban land. There is no doubt that this updating mechanism is scientific in theory, but it will encounter great challenges in practical application. Actually, urban growth is not developed cell by cell, other than plot and plot. The isolation effect will be more conspicuous when the cell size of CA is smaller, e.g., from 100 m × 100 m to 10 m × 10 m. After recognizing the limitation of classical CA, scholars proposed the strategy of patch growth [45,46]. The most important step for patch growth is to select the seeds and define the patch growth template. Which cell could be selected as a seed is mainly determined by the urban growth probability ( p i j t ). It is usually selected by using a roulette strategy. The patch growth template can be extracted from historical urban growth with an appropriate window like 1000 m × 1000 m. The patch growth-based update strategy is seed-centered expansion, which is very much like using a clone stamp in Photoshop. Therefore, the updating step in Formula (1) can be revised as:
U i j t = g ( h ( p i j t ) , M w , Q t )
where h is a roulette strategy function to determine which cell can be selected as the seed according to the integrated urban growth probability ( p i j t ); M is a template library collected from historical urban growth by an appropriate window w .

2.2.3. Applying Spatial Constraints of UGB to Patch-CA

The essence of the constrained urban growth simulation model is to consider the spatial management of UGB for future urban growth. Though UGB is just a planning line, urban space is mainly located within UGB; agriculture and ecological space are mainly outside UGB. Hence, when applying the spatial constraints of UGB to Patch-CA, the spatial management features should be considered. In order to better match the probability characteristics of the Patch-CA model, we used the quantitative value ranging from 0 to 1 to represent different types of development requirements. Generally speaking, urban space that is located in centralized development zones (CDZ) is significant to urban growth, we can mark it as 1. The flexible development zone (FDZ) is also located in UGB, but its aim is to deal with the uncertainty of development. Therefore, we can mark it as the mid-value 0.5, which is neither encouraged nor restricted. The agricultural space outside UGB normally only allows major infrastructure projects while the ecological space is commonly not permitted for any built, so we can mark it as 0.3 (it is an empirical value used to control the possibility of farmland encroachment. In principle, it is greater than 0 but should be less than 0.5) and 0, respectively. Next, we used a random probability-based game model to couple the influence of UGB into Patch-CA, and the seed selection is shown as Formula (3):
if   p i j t λ i j , i j = Seed otherwise , i j
where p i j t is the integrated urban growth probability, if it is smaller than λ i j ; then, this cell can be selected as the seed; otherwise, Patch-CA model should move to next cell.

3. Case Study Area and Data Materials

3.1. Study Area

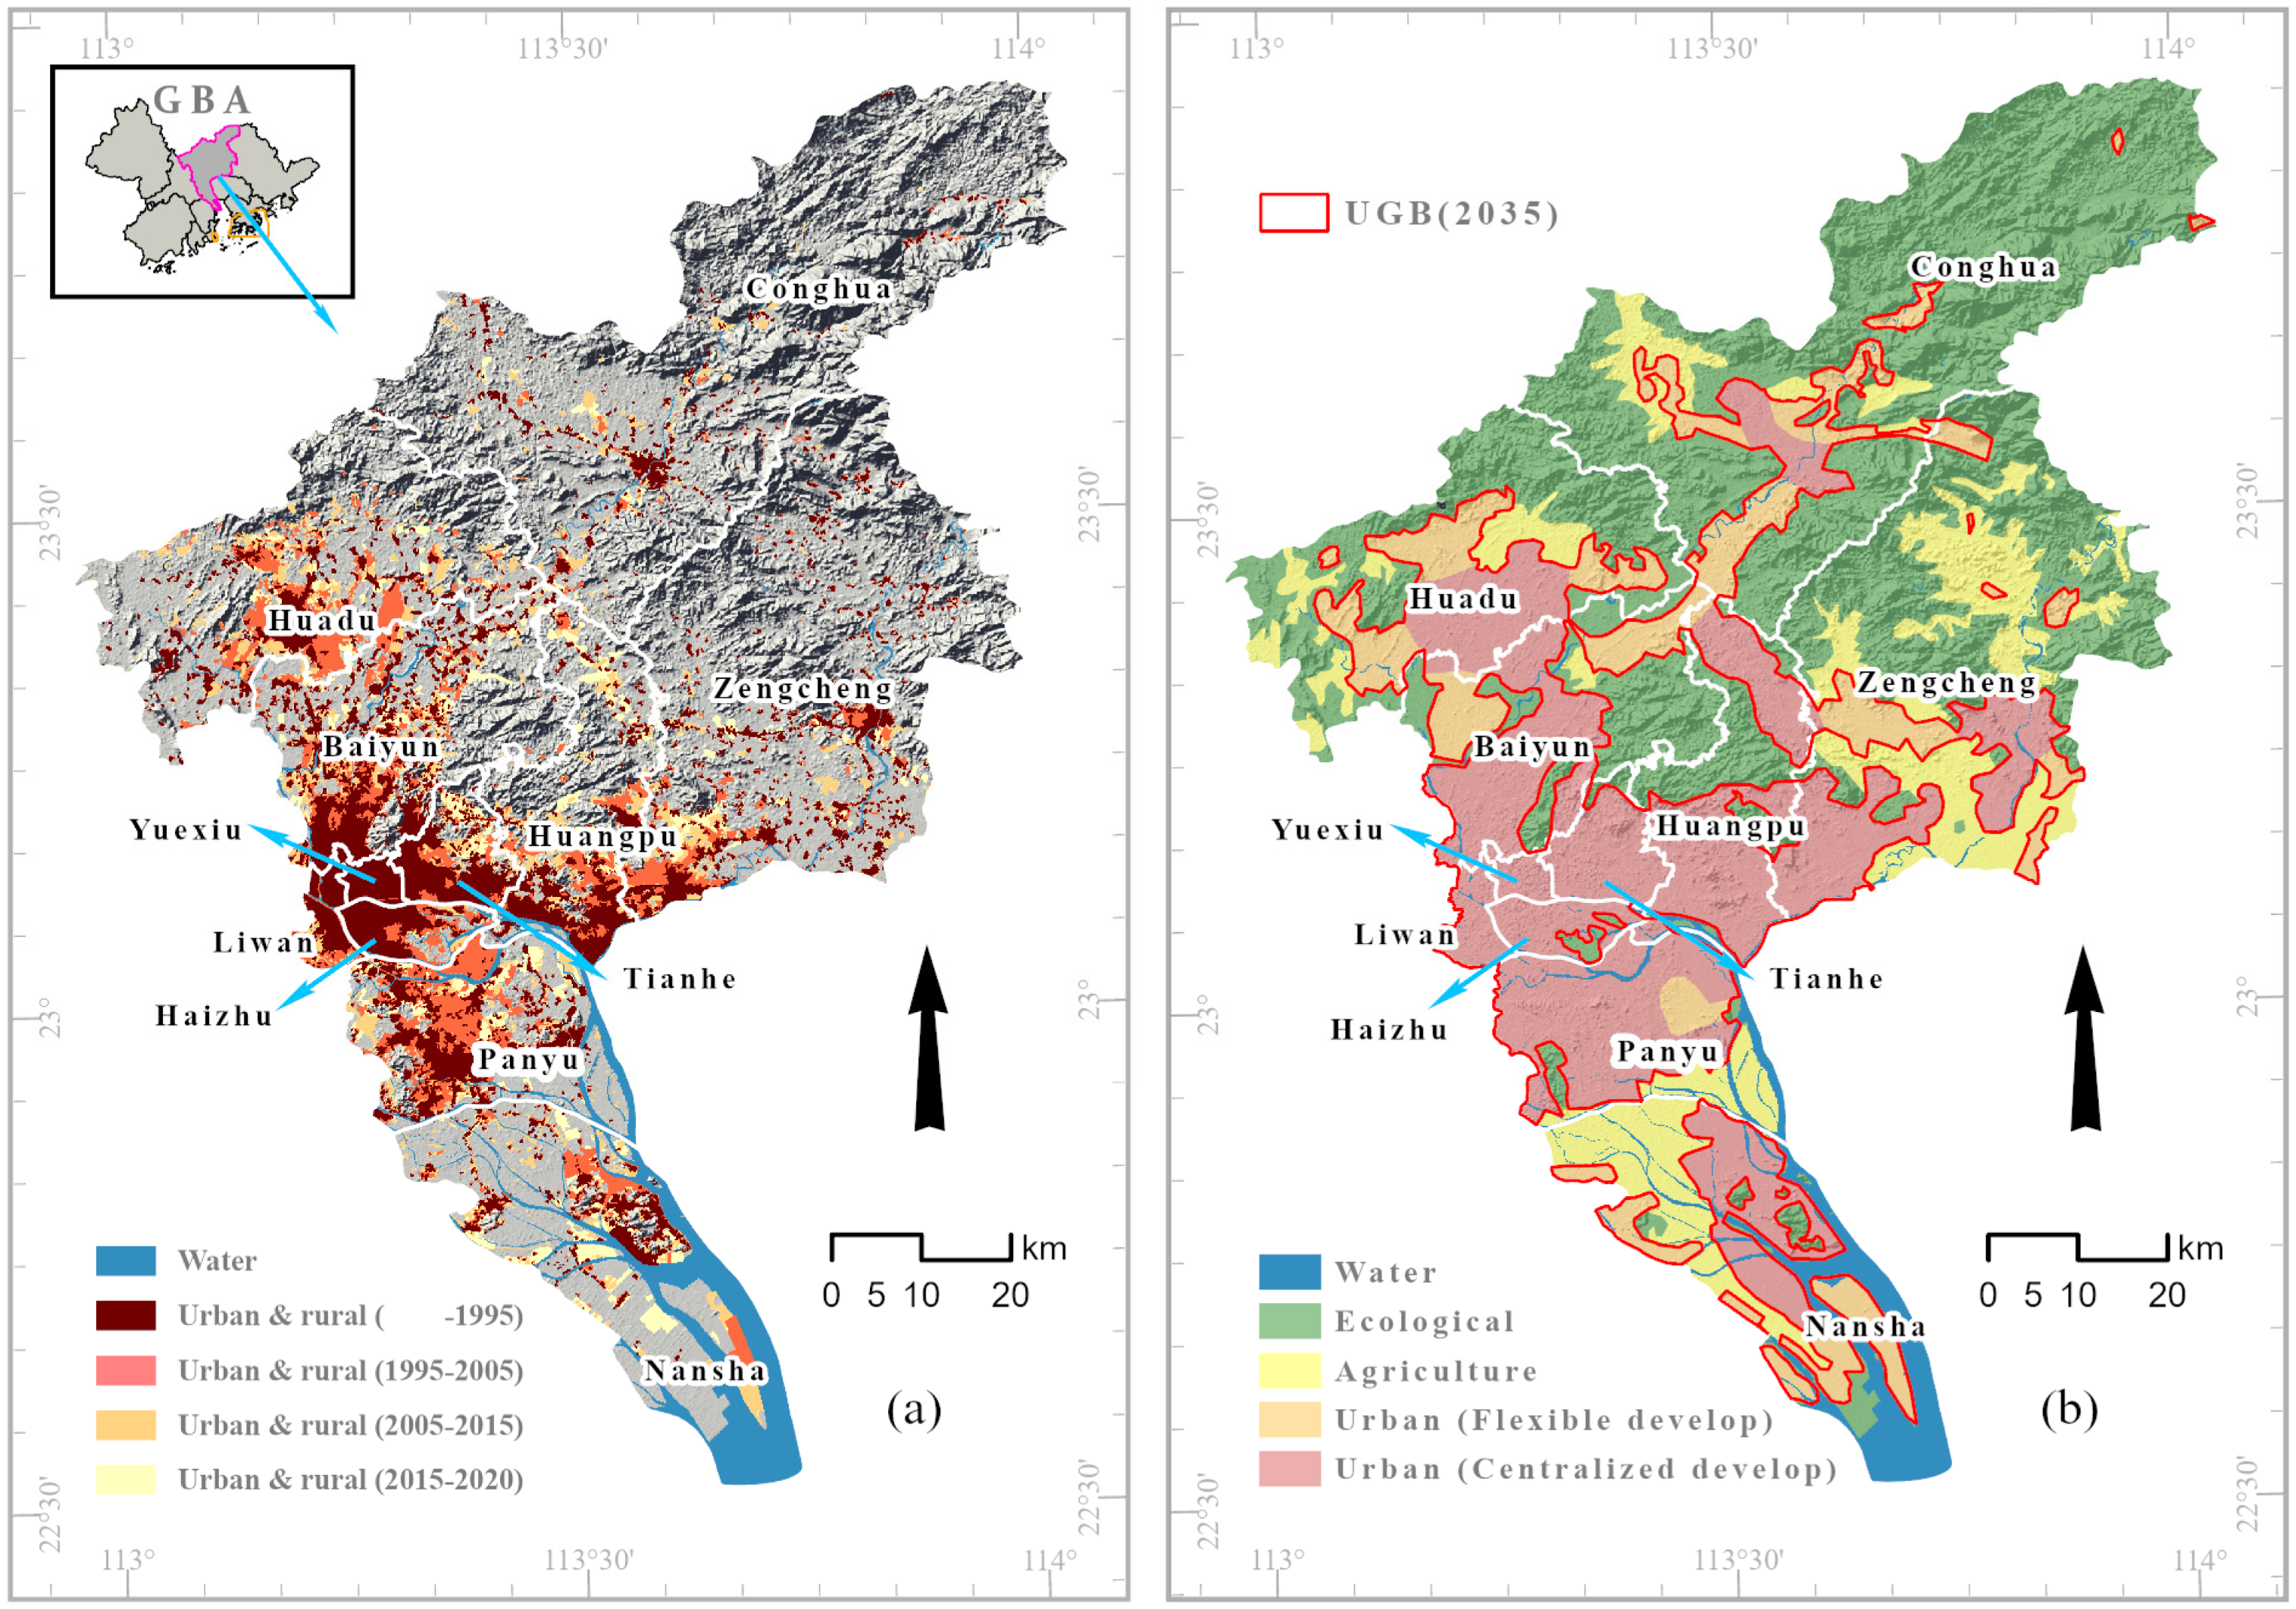
We selected Guangzhou city in China to examine the utility of UGB. Guangzhou is an international metropolis undergoing rapid development, located in the Peral River Delta of China (22°26′–23°56′ N, 112°57′–114°03′ E). Guangzhou covers an area of 7434.4 km2, including 11 districts (Figure 2a). By the end of 2020, the permanent resident population and GDP has already exceeded 18.7 million and 2.5 trillion CNY, respectively [47]. According to its newly spatial development strategy, Guangzhou will mainly develop its northern, eastern, and southern parts due to the high development density of its central part. However, we need to pay special attention to the Nansha district regarding this development strategy. Nansha is located in the geometric center of Guangdong-Hong Kong-Macao Greater Bay Area (GBA), and it has been set as a sub-center by the government of Guangzhou city. Therefore, there is no way around the fact that Guangzhou’s future urban growth will not completely follow the historical growth rule. It is a very typical city to discuss the utility of UGB for reshaping the future urban growth.

3.2. Data Materials

The data used in this study mainly include Landsat satellite images, Digital Elevation Model (DEM), road network, administrative division data, and so on. Historical urban growth in 1995, 2005, 2015, and 2020 were classified and visually interpreted from Landsat satellite images (122-044), which are collected from the public service platform Geospatial Data Cloud. Sampling analysis shows that the average accuracy of data classification is higher than 85%, which meets the needs of research and application [38]. According to the monitoring, the urban and rural area in 1995, 2005, 2015, and 2020 was 865.64, 1359.45, 1685.98, and 1915.25 km2, respectively (Figure 2a). China formally implemented the UGB policy after its spatial planning reform in 2017 [39], so the historical urban growth from 1995 to 2005 was used to calibrate the prescriptive CA model, and land use in 2015 was used to evaluate the simulation accuracy. To further illustrate that the implementation of UGB has changed the existing urban growth law, we further employ land use in 2020 to illustrate the spatial reshaping effectiveness of UGB.
Since the government institutional reform in 2017, the Chinese government has proposed a new uniformly named territorial spatial plan to support the sustainable development of urbanization until 2035. We collected the new version of the territorial spatial plan (2018–2035) of Guangzhou city from the Guangzhou Municipal Bureau of Planning and Natural Resources (Figure 2b). According to the spatial government rules of China, territorial space is usually divided into three main space types, including urban, agriculture and ecological [48]. Generally speaking, urban space should be located in UGB, while agriculture and ecological areas should be outside UGB. According to the development time and urban growth demands, areas located in UGB can also be divided into CDZ, FDZ, and special development zone (SDZ) [49]. CDZ is the priority area for urban growth while FDZ is reserved for the uncertainty of urban growth, e.g., if real estate developers do not want to develop CDZ for some reason, then we can adjust the newly added land into FDZ. Special zones are mainly forest parks, culture heritage, and some others that are located in UGB; all of them usually focus on producing ecological products. Because special zones are usually small and sporadic, we do not discuss this type in this research.
According to previous studies, variables such as points, lines, and areas in CA modelling are usually used to mine the relationship between historical urban growth and spatial environment [28,43]. In this study, a total of 9 spatial variables (Figure 3) were used for modeling, including (a) Digital elevation model (DEM), (b) Slope, (c) Proximity to river, (d) Proximity to highway, (e) Proximity to subway, (f) Proximity to port, (g) Proximity to municipal development center, (h) Proximity to district development center, and (i) Proximity to town development center. In this study, we ignore the dynamic characteristics of these proximate variables. All the datasets like terrain and road network for generating spatial environment variables were collected from open sources like OpenStreetMap, and all of them are preprocessed within ArcGIS.

4. Results

4.1. Pattern of Future Urban Growth Scenarios

For future urban growth in 2035, we simulated two scenarios: one is simulated with the spatial UGB constraint (Figure 4a) and another is simulated without UGB constraint (Figure 4c). By comparing the two simulated scenarios, we can analyze whether the UGB will play a great role in shaping the future urban growth process. In general, under the control of UGB, the future urban growth process will be relatively compact, while the urban growth process without the consideration of UGB control will be relatively scattered. Moreover, the UGB constraint represents the government’s expectation of future urban growth, and in particular helps to adjust some urban growth trends that are not in line with sustainable development. In order to illustrate the necessity of UGB for reshaping future urban growth, we selected two typical cases for demonstration. Zone A is an experimental area named China-Singapore Guangzhou Knowledge City, which has been developed since 2010. Over the past decade, co-development has been limited in a small region. However, with the approval of the China-Singapore Guangzhou Knowledge City Master Development Plan (2020–2035) by the Chinese government in 2020, a major development opportunity has emerged in this region. Obviously, simulation scenarios without UGB constraint cannot respond to this developmental planning. In other words, the development pattern of China-Singapore Guangzhou Knowledge City cannot be reasonably predicted by only considering the historical growth tendency. Another typical area is Nansha new area (zone B), which has been updated as the sub-center of Guangzhou city since 2018. From the historical urban growth probability, the development of Nansha to the north can be integrated with the central urban area. However, the new development strategy of Nanshan is to develop towards the south because the south is closer to the sea and more connected to the GBA center (See Figure 2). As can be seen from the comparison in Figure 4a,c, if the spatial UGB constraint is not considered, urban growth mainly happens to the north, but after introducing the UGB constraint, urban growth is mainly oriented to the south. Since the implementation of the new spatial development strategy in 2018, the growth hotspots of Guangzhou have shifted. By comparing Figure 4a–c in Zones A and B, we can see that there were many land-use plots that had been developed by the year 2020, but they were not presented in the simulation scenario without UGB constraint. Obviously, the historical urban growth law has been reshaped by UGB. Therefore, for better simulation of future urban growth, we should not only consider the historical dynamic mechanism but also include the relevant requirements of future spatial control, which are the advantages of CUGSM.

4.2. The Utility of UGB for Reshaping Future Urban Growth

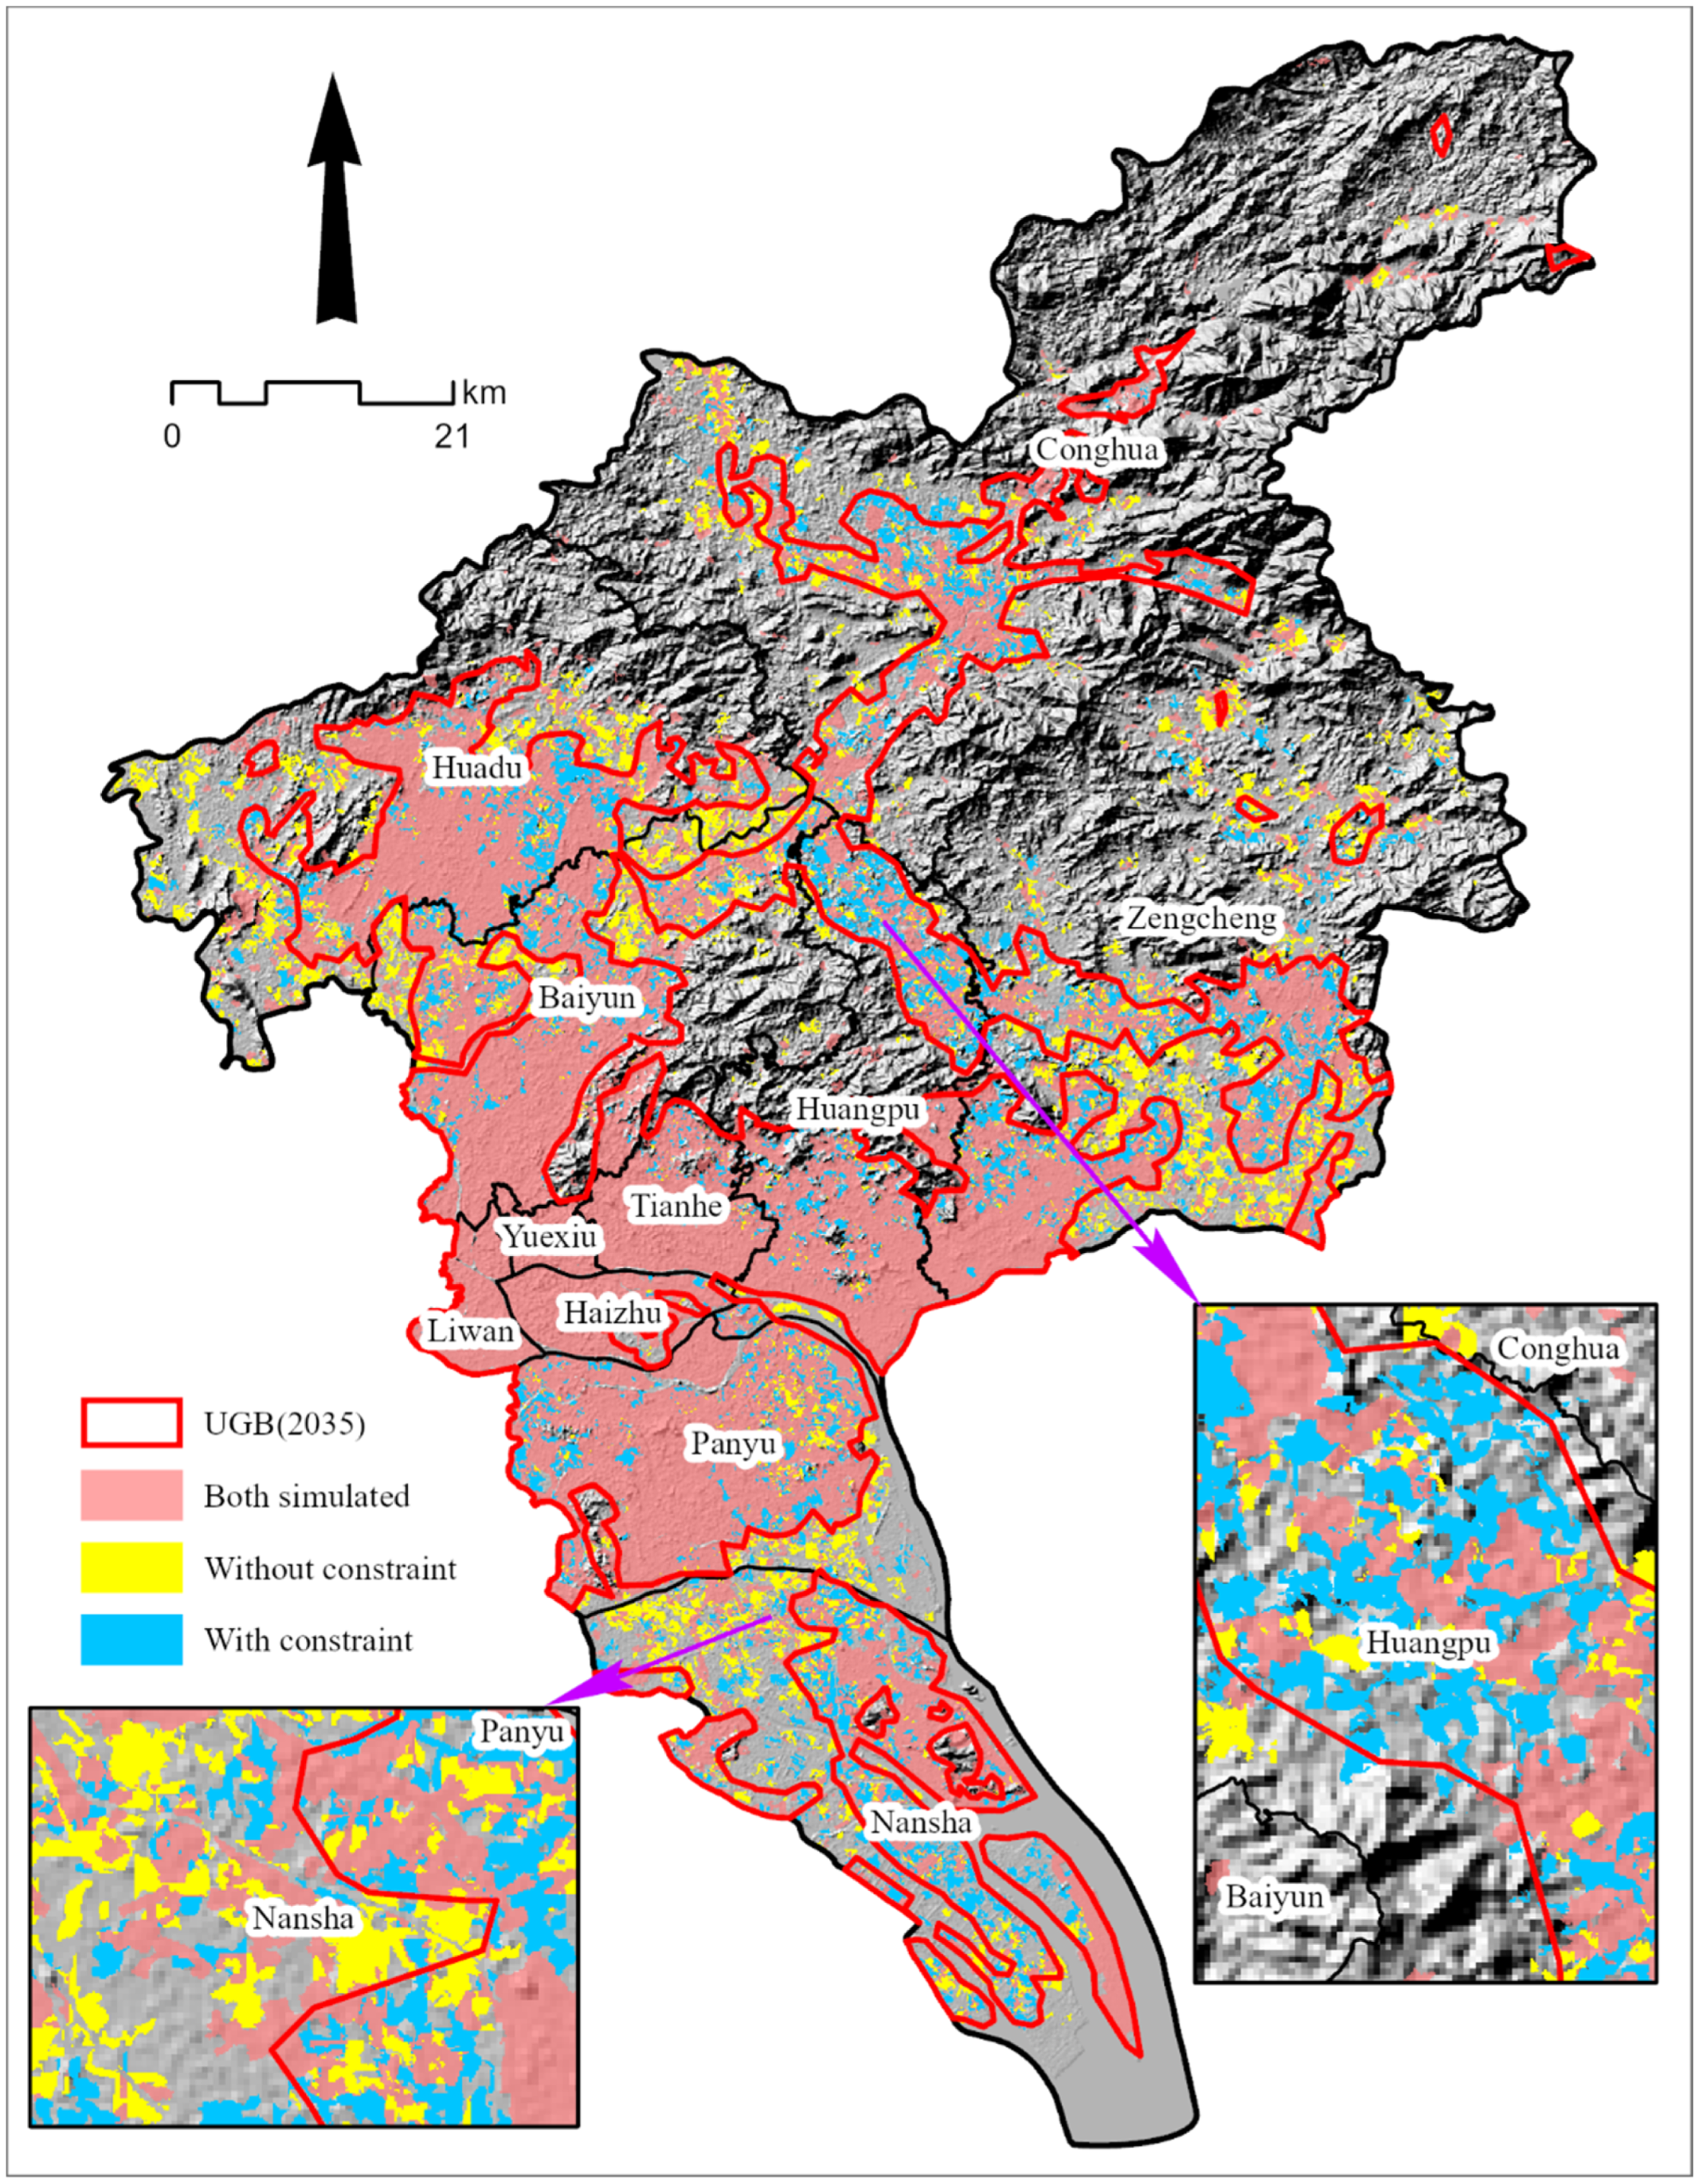
By comparing the constrained scenario with the unconstrained scenario in 2035, we can evaluate the utility of the UGB for reshaping future urban growth (Figure 5). Through overlay analysis, we can find that the spatial difference between the constrained growth scenario and the unconstrained growth scenario is as high as 21.14%, and the actual area is about 418.84 km2. Therefore, the intervention of UGB can reconstruct the space pattern to a certain degree. In addition to directly comparing the differences between the two simulated scenarios, we also need to investigate the spatial relationship between the two simulated scenarios and UGB, and the spatial distribution structure is shown as Table 1. If the future urban growth is constrained by UGB, 83.14% of growth units are located within UGB and 16.86% of those are located outside UGB, but this proportion is converted into 74.87% and 25.13% when there are no UGB constraints. It can be seen that the intervention of UGB management further standardized the order of urban growth, and the spatial reshaping efficiency directly reached 8.27%. Further analysis shows that the urban growth trend reconstructed by UGB is mainly located in agricultural and ecological space. For example, after considering UGB constraints, urban growth ratio in agricultural space decreases from 13.39 to 9.37%, and urban growth ratio in ecological space decreases from 11.75% to 7.48%. In terms of spatial management rules, agricultural and ecological spaces are not absolutely prohibited (such as major infrastructure projects can be built), but large-scale conversion of land to urban space is usually strictly controlled in these areas.
This study has proved through the random-games method that UGB’s reconstruction utility is very significant. Actually, if more strict spatial control measures are implemented, the areas outside UGB will not be developed at all, and the utility of UGB for reshaping future urban growth will be more obvious. However, the management of UGB is an artificial control process, and if the control measures are strong, the reconstruction effect will be high. On the contrary, if the control effect of UGB is weak, the city will grow spontaneously, and the spatial reconstruction effect of urban growth will also be naturally weakened. In general, as UGB represents a spatial expectation of future urban growth, it is usually the result of comprehensive consideration of multiple objectives and is a relatively spatial optimal scheme. Therefore, strengthening the control effect of UGB is actually more conducive to sustainable urban growth.

5. Discussion

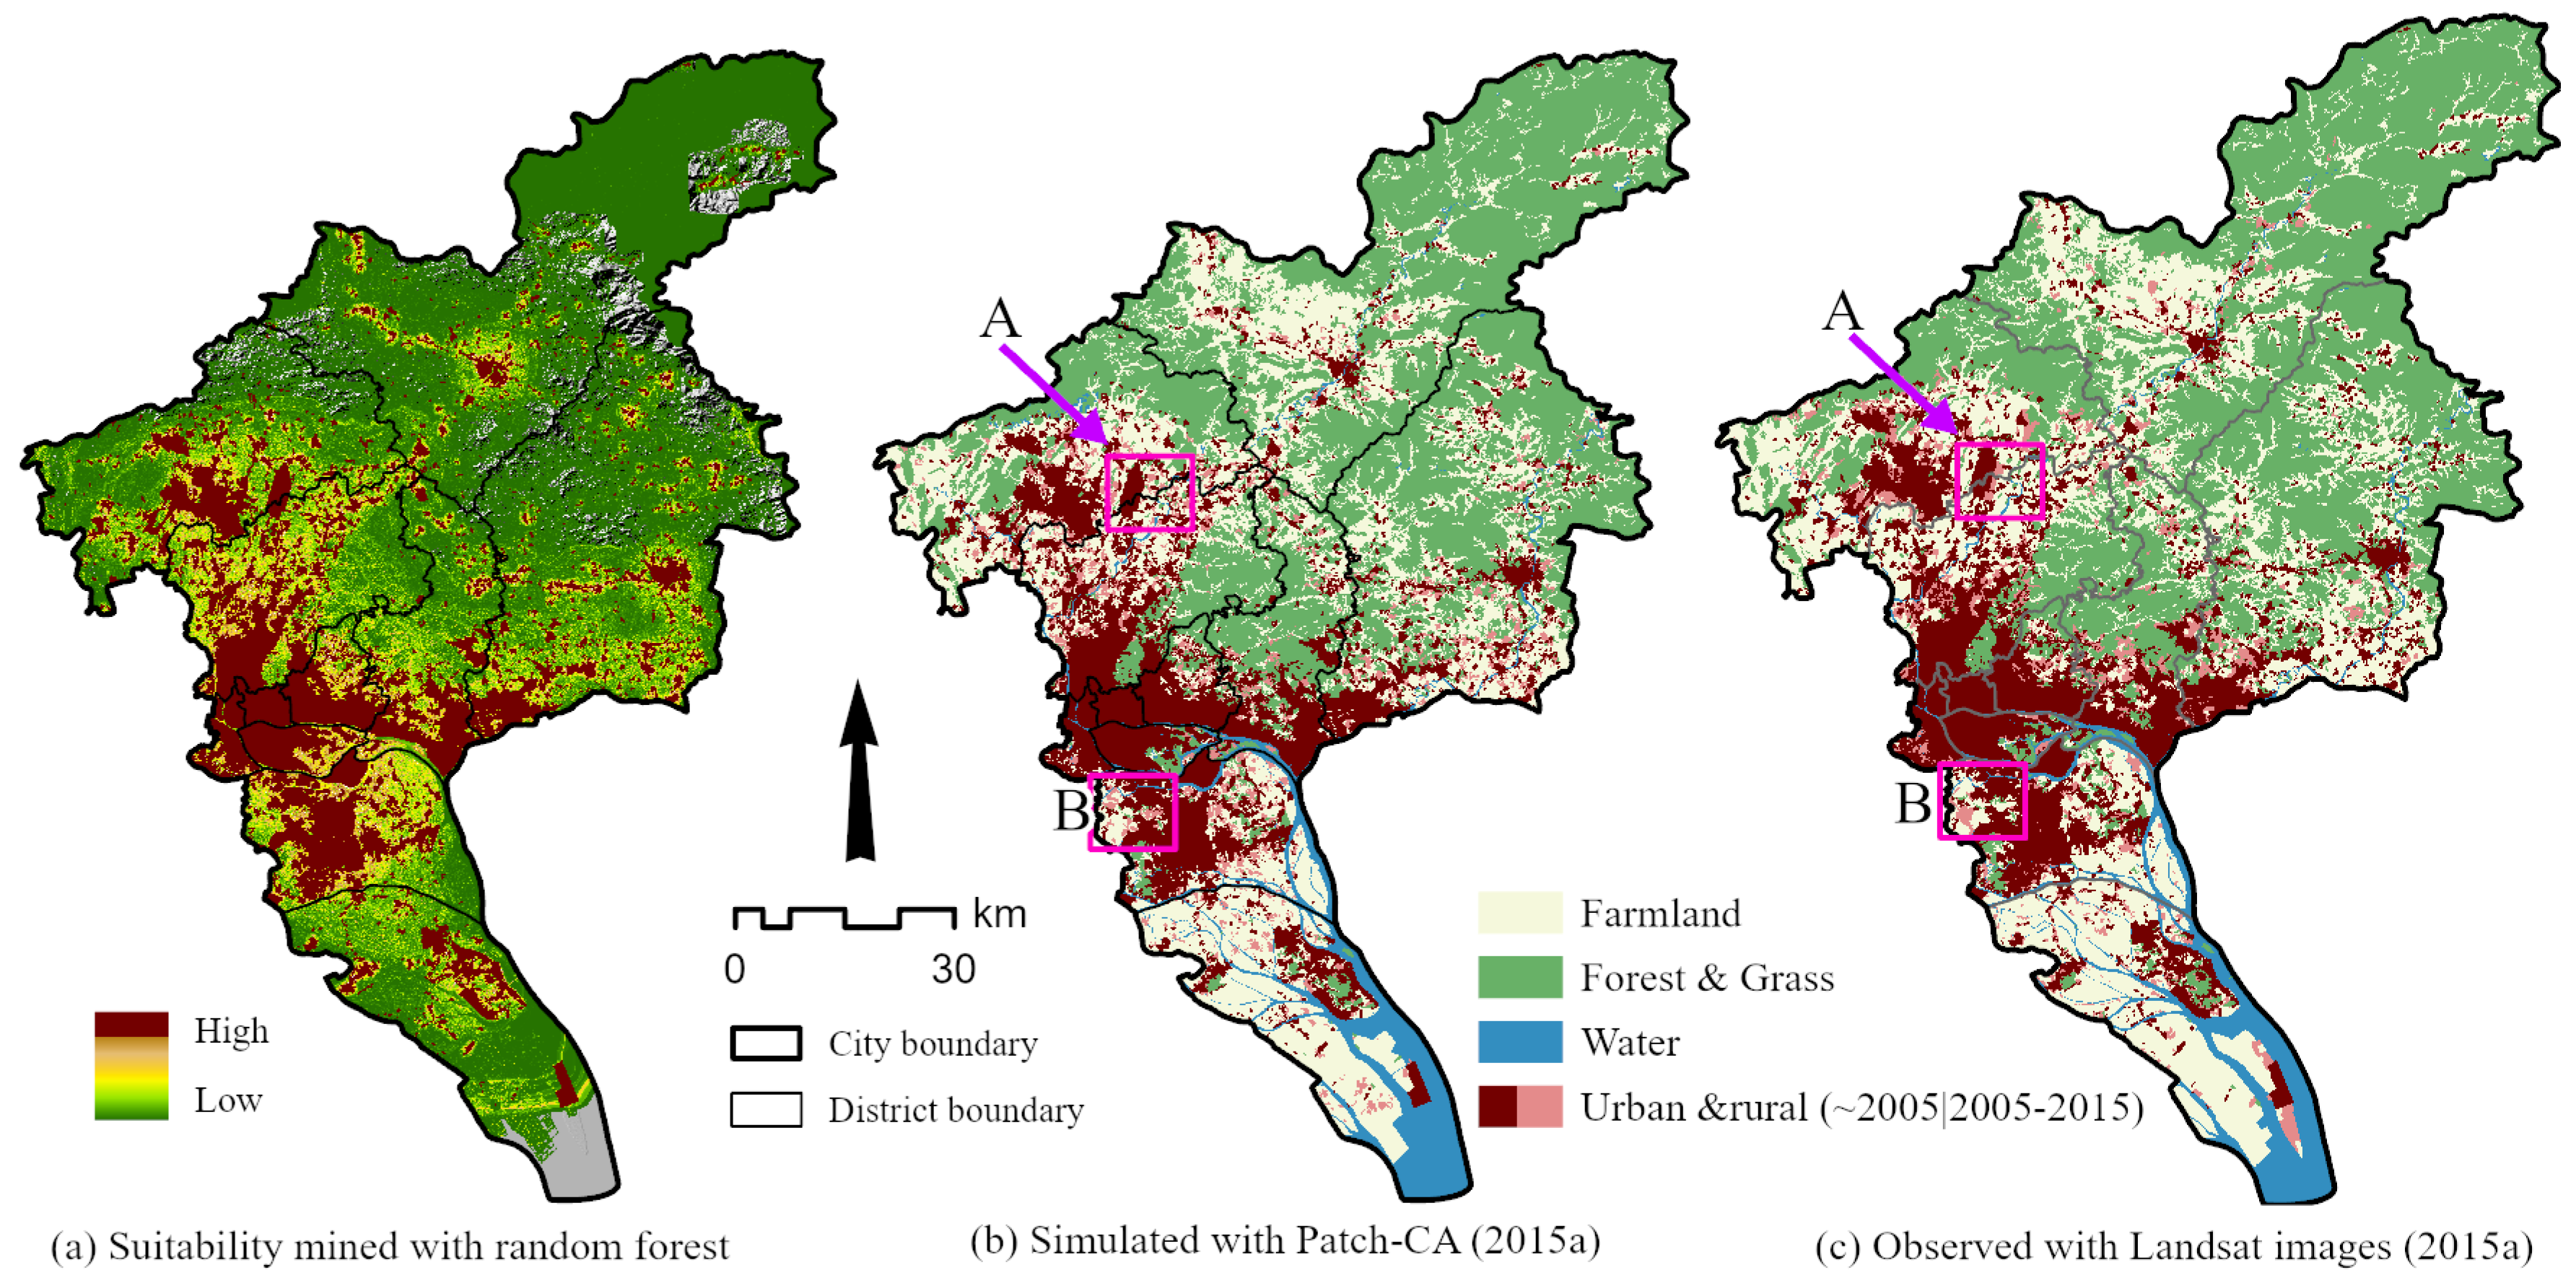
The Patch-CA model that learns from the historical urban growth process (classified as predictive CA) is widely used to predict future urban growth, but its simulation accuracy tested by Kappa and FOM indexes was usually not very high [50]. Therefore, there is a good reason to believe that there must be a force driving urban evolution that cannot be learned from historical processes through machine learning algorithms. In this study, the urban growth from 1995 to 2005 was taken as the dependent variable, and nine spatial factors were set as independent variables. The urban growth suitability map estimated with random forest is shown in Figure 6a. Based on the urban pattern in 2005, the Patch-CA model without UGB constraint was used to simulate the urban pattern in 2015 (Figure 6b), which was compared with the actual pattern observed by Landsat remote sensing images (Figure 6c). Through comparison, the Kappa and FOM indexes were 0.7914 and 0.1930, respectively. From the perspective of simulation accuracy, the urban growth predicted by Patch-CA was not high, but it was close to the accuracy reported in previous literature [46]. Through the accuracy evaluation, we can find that there seems to be no predictive CA able to improve the prediction accuracy to 100% because the city may evolve new development patterns through time. Therefore, it is only theoretically valid to predict future cities by looking for rules from the historical process, but there are obvious weaknesses in applying them to spatial planning decisions. For China, a country with strong planning intervention, future urban development is affected by various spatial structure regulations, and its urban growth is not completely the continuation of bottom-up historical process. For example, Zone A and Zone B in Figure 6 are the airport and high-speed rail stations, respectively, which obviously cannot be simulated with the predictive CA model, but they will cause a mass of urban growth in the future. By overlaying the simulation scenario of 2015 with UGB, we can find that only 81.18% of them are located in UGB. If we continue to project the 2035 growth scenario using this model, more units will be developed outside the UGB, which is clearly not in line with the Chinese government’s planning policy of land use control. Therefore, it is necessary to consider the spatial regulation effect of UGB when simulating future urban growth.
According to the model mechanism of predictive CA, future urban growth simulation is just a continuation of the historical urban growth process. There is no doubt that this model framework is scientifically modeled, but the problem is that using this model to simulate the future always presents several areas that cannot be simulated correctly. Obviously, this shows that there are natural defects in the assumptions established by the predictive CA model. In order to further analyze the cause of simulation failure, we analyzed the spatial relationship between UGB and the urban growth simulated by the Patch-CA model but not observed using remote sensing images (shown as Figure 7). The cells simulated with Patch-CA but not observed using remote sensing images are classified into two types and marked as magenta (within UGB) and blue (outside UGB), respectively. According to statistical analysis, the cells within UGB and those outside UGB account for 38.69% and 61.31%. Although the magenta cells were not observed by the remote sensing image in 2015, they are very likely to be observed in 2016 or other adjacent years. Therefore, we could believe that the cells located within UGB are not affected by UGB regulation. Of the cells predicted by Patch-CA without constraints, 61.31% lie outside UGB. If the management of UGB is strongly implemented, it is highly likely that these cells will not be developed, which also indicates that Patch-CA without any spatial constraints has natural defects, and failure of prediction using CA is inevitable.

6. Conclusions

Since the spatial planning reform of China in 2017, delimiting the UGB has been set up as one of the most important tasks in territorial spatial planning by the government. To evaluate the necessity of delineating UGB in territorial spatial planning, we developed a CUGSM model which integrated the advantages of Markov chain, random forest, patch growth-based cellular automata, and random probability-based game to demonstrate the utility of UGB for reshaping future urban spatial growth.
The main conclusions can be concluded as follows: (1) The simulation scenario with the UGB constraint is more in accordance with the actual development trend or development planning, and UGB can efficiently reconstruct the spatial pattern of urban growth with the analysis of case studies. (2) UGB regulation reduces the encroachment on agricultural and ecological space, and the urban space outside UGB is greatly reduced in the simulation scenario with the UGB constraint. (3) The proposed CUGSM model is effective to pre-evaluate the utility of UGB for reshaping future urban growth. The comparison of simulation scenarios indicates that we can also use the CUGSM model to find potential illegal hotspots that may appear following historic development trend. Therefore, our research demonstrates that it is necessary for the Chinese government to further strengthen the UGB policy to promote sustainable urban growth.
Moreover, detail discussion shows that there are still some defects in the CUGSM model proposed in this study. For example, due to the lack of long-time evaluation data on the implementation effect of UGB, we just adopted a random game model to simulate the management and control effectiveness of UGB. However, the actual management and control of UGB is definitely not a process of random games. With the further implementation of UGB in China, we can accumulate more actual urban growth data after UGB implementation. Then we can enhance the parameters of the CUGSM and upgrade the pre-evaluation ability to support territorial spatial planning.

Author Contributions

Conceptualization, Shifa Ma and Yunnan Cai; Formal analysis, Haiyan Jiang and Xiwen Zhang; Funding acquisition, Shifa Ma and Xiwen Zhang; Methodology, Shifa Ma and Guanwei Wang; Resources, Guanwei Wang; Supervision, Dixiang Xie and Yunnan Cai; Visualization, Haiyan Jiang and Yabo Zhao; Writing—original draft, Shifa Ma and Xiwen Zhang; Writing—review & editing, Dixiang Xie, Yunnan Cai and Yabo Zhao. All authors have read and agreed to the published version of the manuscript.

Funding

This research was supported by National Natural Science Foundation of China (Grant No. 41901311, 42101273), Guangdong Basic and Applied Basic Research Foundation (Grant No. 2020A1515011225).

Data Availability Statement

Not applicable.

Acknowledgments

The authors would like to thank the anonymous reviewers and editors for their suggestions and comments that have helped improve this paper substantially.

Conflicts of Interest

The authors declare no conflict of interest.

References

  1. Liu, X.; Hu, G.; Chen, Y.; Li, X.; Xu, X.; Li, S.; Pei, F.; Wang, S. High-resolution multi-temporal map-ping of global urban land using Landsat images based on the Google Earth Engine Platform. Remote Sens. Environ. 2018, 209, 227–239. [Google Scholar] [CrossRef]
  2. Angel, S.; Parent, J.; Civco, D.L.; Blei, A.; Potere, D. The dimensions of global urban expansion: Estimates and projections for all countries, 2000–2050. Prog. Plan. 2011, 75, 53–107. [Google Scholar] [CrossRef]
  3. Chen, G.; Li, X.; Liu, X.; Chen, Y.; Liang, X.; Leng, J.; Xu, X.; Liao, W.; Qiu, Y.A.; Wu, Q.; et al. Global projections of future urban land expansion under shared socioeconomic pathways. Nat. Commun. 2020, 11, 537. [Google Scholar] [CrossRef] [PubMed]
  4. Seto, K.C.; Güneralp, B.; Hutyra, L.R. Global forecasts of urban expansion to 2030 and direct im-pacts on biodiversity and carbon pools. Proc. Natl. Acad. Sci. USA 2012, 109, 16083–16088. [Google Scholar] [CrossRef]
  5. Follmann, A.; Willkomm, M.; Dannenberg, P. As the city grows, what do farmers do? A systematic review of urban and peri-urban agriculture under rapid urban growth across the Global South. Landsc. Urban Plan. 2021, 215, 104186. [Google Scholar] [CrossRef]
  6. Zhu, Z.; He, Q. Spatio-temporal evaluation of the urban agglomeration expansion in the middle reaches of the Yangtze River and its impact on ecological lands. Sci. Total Environ. 2021, 790, 148150. [Google Scholar]
  7. Huang, L.; Cao, W.; Xu, X.; Fan, J.; Wang, J. Linking the benefits of ecosystem services to sustainable spatial planning of ecological conservation strategies. J. Environ. Manag. 2018, 222, 385–395. [Google Scholar] [CrossRef]
  8. Staiano, L.; Sans, G.H.C.; Baldassini, P.; Gallego, F.; Texeira, M.A.; Paruelo, J.M. Putting the Ecosystem Services idea at work: Applications on impact assessment and territorial planning. Environ. Dev. 2020, 38, 100570. [Google Scholar] [CrossRef]
  9. Abbott, C.; Margheim, J. Imagining Portland’s urban growth boundary: Planning regulation as cultural icon. J. Am. Plan. Assoc. 2008, 74, 196–208. [Google Scholar] [CrossRef]
  10. Long, Y.; Han, H.; Lai, S.-K.; Mao, Q. Urban growth boundaries of the Beijing Metropolitan Area: Comparison of simulation and artwork. Cities 2013, 31, 337–348. [Google Scholar] [CrossRef]
  11. Liang, X.; Liu, X.; Li, X.; Chen, Y.; Tian, H.; Yao, Y. Delineating multi-scenario urban growth boundaries with a CA-based FLUS model and morphological method. Landsc. Urban Plan. 2018, 177, 47–63. [Google Scholar] [CrossRef]
  12. Liu, J.; Zhang, G.; Zhuang, Z.; Cheng, Q.; Gao, Y.; Chen, T.; Huang, Q.; Xu, L.; Chen, D. A new perspective for urban development boundary delineation based on SLEUTH-InVEST model. Habitat Int. 2017, 70, 13–23. [Google Scholar] [CrossRef]
  13. Ma, S.; Li, X.; Cai, Y. Delimiting the urban growth boundaries with a modified ant colony optimization model. Comput. Environ. Urban Syst. 2017, 62, 146–155. [Google Scholar] [CrossRef]
  14. Zhang, D.; Liu, X.; Lin, Z.; Zhang, X.; Zhang, H. The delineation of urban growth boundaries in complex ecological environment areas by using cellular automata and a dual-environmental evaluation. J. Clean. Prod. 2020, 256, 120361. [Google Scholar] [CrossRef]
  15. De Meyer, A.; Estrella, R.; Jacxsens, P.; Deckers, J.; Van Rompaey, A.; Van Orshoven, J. A conceptual framework and its software implementation to generate spatial decision support systems for land use planning. Land Use Policy 2013, 35, 271–282. [Google Scholar] [CrossRef]
  16. Maleki, J.; Masoumi, Z.; Hakimpour, F.; Coello, C.A.C. A spatial land-use planning support system based on game theory. Land Use Policy 2020, 99, 105013. [Google Scholar] [CrossRef]
  17. Liu, G.; Li, J.; Nie, P. Tracking the history of urban expansion in Guangzhou (China) during 1665–2017: Evidence from historical maps and remote sensing images. Land Use Policy 2021, 112, 105773. [Google Scholar] [CrossRef]
  18. Aburas, M.M.; Ho, Y.M.; Ramli, M.F.; Ash Aari, Z.H. The simulation and prediction of spatio-temporal urban growth trends using cellular automata models: A review. Int. J. Appl. Earth Obs. Geoinf. 2016, 52, 380–389. [Google Scholar] [CrossRef]
  19. Shafizadeh-Moghadam, H. Improving spatial accuracy of urban growth simulation models using ensemble forecasting approaches. Comput. Environ. Urban Syst. 2019, 76, 91–100. [Google Scholar] [CrossRef]
  20. Wang, H.; Guo, J.; Zhang, B.; Zeng, H. Simulating urban land growth by incorporating historical information into a cellular automata model. Landsc. Urban Plan. 2021, 214, 104168. [Google Scholar] [CrossRef]
  21. Deng, Y.; Liu, Y.; Fu, B. Urban growth simulation guided by ecological constraints in Beijing city: Methods and implications for spatial planning. J. Environ. Manag. 2019, 243, 402–410. [Google Scholar]
  22. Domingo, D.; Palka, G.; Hersperger, A.M. Effect of zoning plans on urban land-use change: A multi-scenario simulation for supporting sustainable urban growth. Sustain. Cities Soc. 2021, 69, 102833. [Google Scholar] [CrossRef]
  23. Zhang, Y.; Xia, C.; Liu, Y.; Lu, Y.; Wang, Y.; Liu, Y. Urban expansion simulation under constraint of multiple ecosystem services (MESs) based on cellular automata (CA)-Markov model: Scenario analysis and policy implications. Land Use Policy 2021, 108, 105667. [Google Scholar] [CrossRef]
  24. Ghosh, P.; Mukhopadhyay, A.; Chanda, A.; Mondal, P.; Akhand, A.; Mukherjee, S.; Nayak, S.K.; Ghosh, S.; Mitra, D.; Ghosh, T.; et al. Application of Cellular automata and Markov-chain model in geospatial environmental modeling—A review. Remote Sens. Appl. Soc. Environ. 2017, 5, 64–77. [Google Scholar] [CrossRef]
  25. Wang, R.; Murayama, Y.; Morimoto, T. Scenario simulation studies of urban development using remote sensing and GIS: Review. Remote Sens. Appl. Soc. Environ. 2021, 22, 100474. [Google Scholar] [CrossRef]
  26. Santé, I.; García, A.M.; Miranda, D.; Crecente, R. Cellular automata models for the simulation of real-world urban processes: A review and analysis. Landsc. Urban Plan. 2010, 96, 108–122. [Google Scholar] [CrossRef]
  27. Batty, M. Geosimulation and urban modeling. In International Encyclopedia of Human Geography, 2nd ed.; Kobayashi, A., Ed.; Elsevier: Amsterdam, The Netherlands, 2020; pp. 119–125. [Google Scholar]
  28. Li, Q.; Feng, Y.; Tong, X.; Zhou, Y.; Wu, P.; Xie, H.; Jin, Y.; Chen, P.; Liu, S.; Xv, X.; et al. Firefly algorithm-based cellular automata for reproducing urban growth and predicting future scenarios. Sustain. Cities Soc. 2022, 76, 103444. [Google Scholar] [CrossRef]
  29. Okwuashi, O.; Ndehedehe, C.E. Integrating machine learning with Markov chain and cellular automata models for modelling urban land use change. Remote Sens. Appl. Soc. Environ. 2020, 21, 100461. [Google Scholar] [CrossRef]
  30. Shafizadeh-Moghadam, H.; Minaei, M.; Pontius, R.G., Jr.; Asghari, A.; Dadashpoor, H. Integrating a Forward Feature Selection algorithm, Random Forest, and Cellular Automata to extrapolate urban growth in the Tehran-Karaj Region of Iran. Comput. Environ. Urban Syst. 2021, 87, 101595. [Google Scholar] [CrossRef]
  31. An, L. Modeling human decisions in coupled human and natural systems: Review of agent-based models. Ecol. Model. 2012, 229, 25–36. [Google Scholar] [CrossRef]
  32. Agyemang, F.S.K.; Silva, E. Simulating the urban growth of a predominantly informal Ghanaian city-region with a cellular automata model: Implications for urban planning and policy. Appl. Geogr. 2019, 105, 15–24. [Google Scholar] [CrossRef]
  33. Guzman, L.A.; Escobar, F.; Peña, J.; Cardona, R. A cellular automata-based land-use model as an integrated spatial decision support system for urban planning in developing cities: The case of the Bogotá region. Land Use Policy 2019, 92, 104445. [Google Scholar] [CrossRef]
  34. Gounaridis, D.; Chorianopoulos, I.; Koukoulas, S. Exploring prospective urban growth trends under different economic outlooks and land-use planning scenarios: The case of Athens. Appl. Geogr. 2018, 90, 134–144. [Google Scholar] [CrossRef]
  35. Zhou, L.; Dang, X.; Sun, Q.; Wang, S. Multi-scenario simulation of urban land change in Shanghai by random forest and CA-Markov model. Sustain. Cities Soc. 2020, 55, 102045. [Google Scholar] [CrossRef]
  36. Liao, J.; Shao, G.; Wang, C.; Tang, L.; Huang, Q.; Qiu, Q. Urban sprawl scenario simulations based on cellular automata and ordered weighted averaging ecological constraints. Ecol. Indic. 2019, 107, 105572. [Google Scholar] [CrossRef]
  37. Zhang, Y.; Liu, Y.; Wang, Y.; Liu, D.; Xia, C.; Wang, Z.; Wang, H.; Liu, Y. Urban expansion simulation towards low-carbon development: A case study of Wuhan, China. Sustain. Cities Soc. 2020, 63, 102455. [Google Scholar] [CrossRef]
  38. Tong, X.; Feng, Y. How current and future urban patterns respond to urban planning? An integrated cellular automata modeling approach. Cities 2019, 92, 247–260. [Google Scholar] [CrossRef]
  39. Liu, Y.; Zhou, Y. Territory spatial planning and national governance system in China. Land Use Policy 2021, 102, 105288. [Google Scholar] [CrossRef]
  40. Gennaio, M.-P.; Hersperger, A.; Bürgi, M. Containing urban sprawl—Evaluating effectiveness of urban growth boundaries set by the Swiss Land Use Plan. Land Use Policy 2009, 26, 224–232. [Google Scholar] [CrossRef]
  41. Rahnama, M.R. Forecasting land-use changes in Mashhad Metropolitan area using Cellular Automata and Markov chain model for 2016–2030. Sustain. Cities Soc. 2020, 64, 102548. [Google Scholar] [CrossRef]
  42. Yu, J.; Hagen-Zanker, A.; Santitissadeekorn, N.; Hughes, S. Calibration of cellular automata urban growth models from urban genesis onwards—A novel application of Markov chain Monte Carlo approximate Bayesian computation. Comput. Environ. Urban Syst. 2021, 90, 101689. [Google Scholar] [CrossRef]
  43. Andreas, R.; Ahmed, M.; Leonie, K.; Claudia, L. Modeling urban regions: Comparing random forest and support vector machines for cellular automata. Trans. GIS 2021, 25, 1625–1645. [Google Scholar]
  44. Hagenauer, J.; Omrani, H.; Helbich, M. Assessing the performance of 38 machine learning models: The case of land consumption rates in Bavaria, Germany. Int. J. Geogr. Inf. Sci. 2019, 33, 1399–1419. [Google Scholar] [CrossRef] [Green Version]
  45. Chen, Y. An extended patch-based cellular automaton to simulate horizontal and vertical urban growth under the shared socioeconomic pathways. Comput. Environ. Urban Syst. 2021, 91, 101727. [Google Scholar] [CrossRef]
  46. Yang, J.; Gong, J.; Tang, W.; Liu, C. Patch-based cellular automata model of urban growth simulation: Integrating feedback between quantitative composition and spatial configuration. Comput. Environ. Urban Syst. 2019, 79, 101402. [Google Scholar] [CrossRef]
  47. Guangzhou Statistics Bureau. Guangzhou Statistical Yearbook 2021; China Statistics Press: Beijing, China, 2021. [Google Scholar]
  48. Zhou, X.; Lu, X.; Lian, H.; Chen, Y.; Wu, Y. Construction of a Spatial Planning system at city-level: Case study of “integration of multi-planning” in Yulin City, China. Habitat Int. 2017, 65, 32–48. [Google Scholar] [CrossRef]
  49. Guide to the Compilation of Municipal Territorial Space General Planning (Trial); Ministry of Natural Resources: Beijing, China, 2022.
  50. Pontius, R.G.; Boersma, W.; Castella, J.-C.; Clarke, K.; de Nijs, T.; Dietzel, C.; Duan, Z.; Fotsing, E.; Goldstein, N.; Kok, K.; et al. Comparing the input, output, and validation maps for several models of land change. Ann. Reg. Sci. 2008, 42, 11–37. [Google Scholar] [CrossRef] [Green Version]
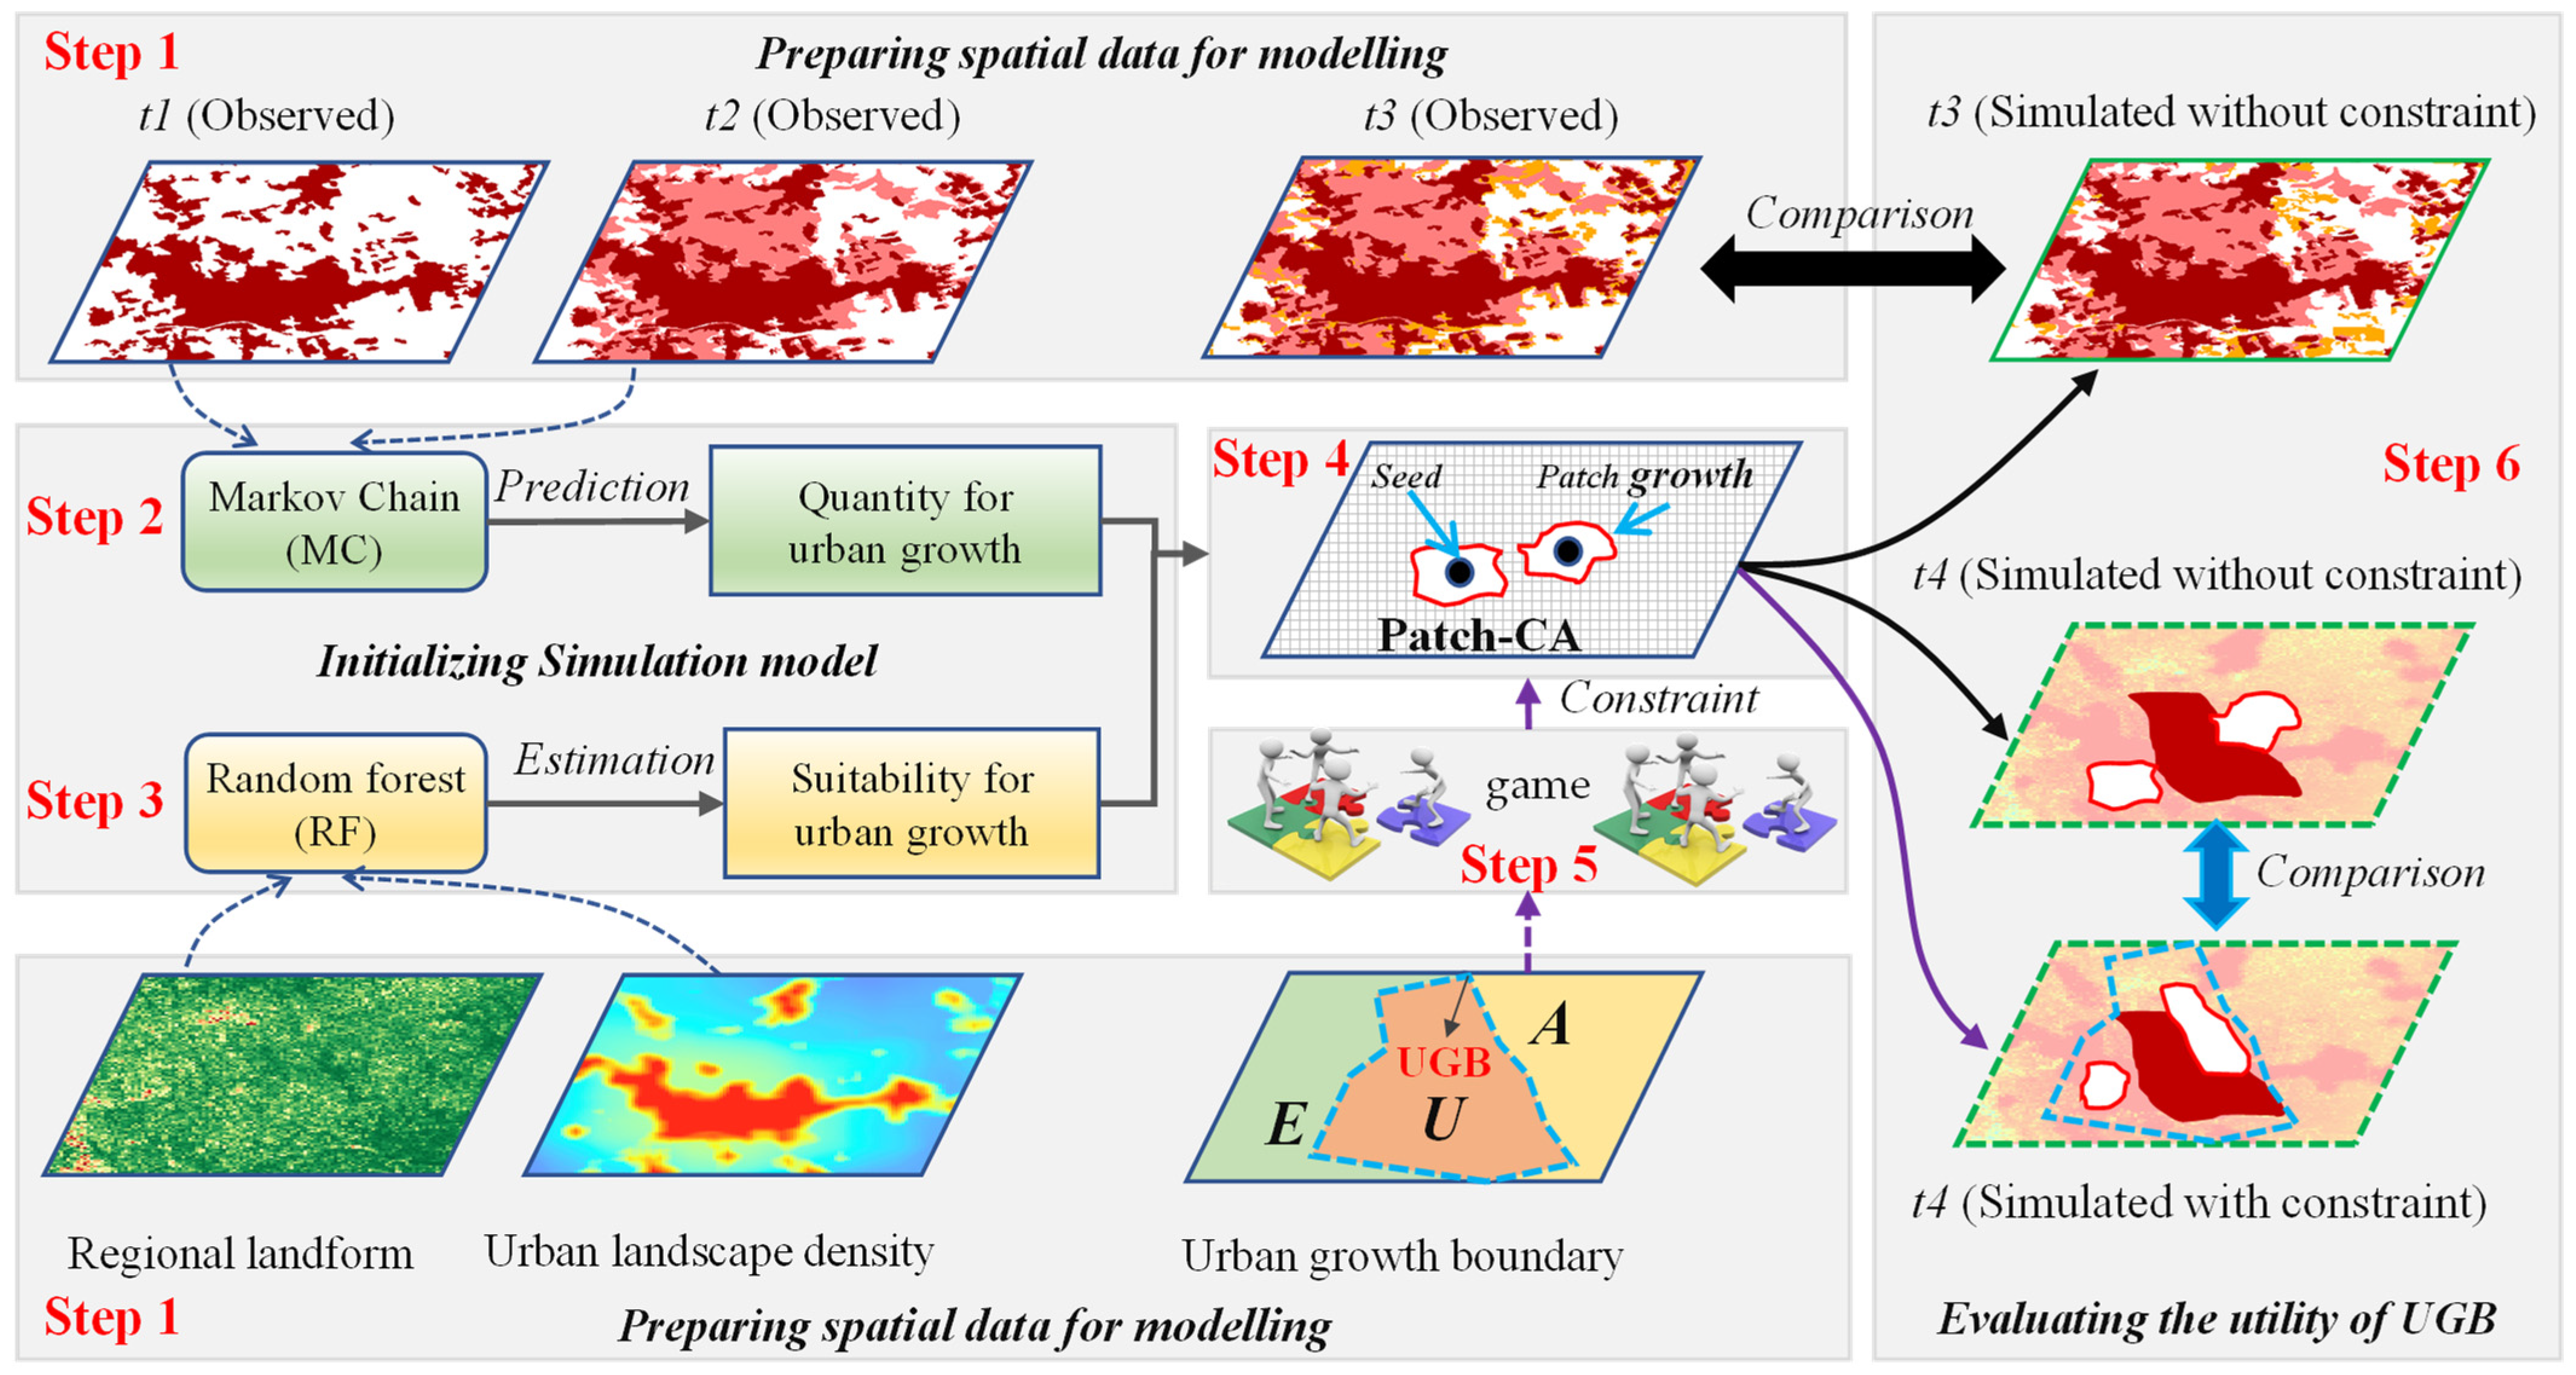
Figure 1. Procedure for evaluating the utility of UGB with CUGSM.
Ijgi 11 00511 g001
Figure 2. Location of study area and planned UGB for modelling: (a) location of Guangzhou and urban growth from 1995–2020; (b) urban, agriculture and ecological space planned by agency.
Ijgi 11 00511 g002
Figure 3. Maps reflecting the spatial environment for driving urban growth from 1995 to 2015 in Guangzhou. (a) Digital elevation model (DEM), (b) Slope, (c) Proximity to river, (d) Proximity to highway, (e) Proximity to subway, (f) Proximity to port, (g) Proximity to municipal development center, (h) Proximity to district development center, and (i) Proximity to town development center.
Ijgi 11 00511 g003
Figure 4. Comparison of urban growth patterns under different scenarios.
Ijgi 11 00511 g004
Figure 5. Comparison the simulation scenario with or without UGB.
Ijgi 11 00511 g005
Figure 6. Simulation accuracy analysis: (a) suitability mined with random forest; (b) urban growth scenario in 2015 simulated with Patch-CA; (c) urban growth pattern in 2015 observed with Landsat images).
Ijgi 11 00511 g006
Figure 7. Analysis of the relationship between UGB and the cells simulated with Patch-CA but not observed with remote sensing images.
Ijgi 11 00511 g007
Table 1. Spatial analysis of the two simulation scenarios with UGB.
Urban Growth TypeUGBConstrained (km2, %)Unconstrained (km2, %)
Urban space (CDZ)Within1603.0866.801412.0158.83
Urban space (FDZ)392.3616.35384.8416.03
Encroachment of Agriculture spaceOutside224.989.37321.2713.39
Encroachment of Ecological space179.587.48281.8911.75
Publisher’s Note: MDPI stays neutral with regard to jurisdictional claims in published maps and institutional affiliations.