1. Introduction
The process of urbanization is affecting the whole world on an unprecedented scale, leading to constant pressure on urban planners and local governments to deal with the problems it creates: network infrastructure, transportation, risks, disaster prevention and intervention, investment planning and so on.
Since urbanization is a continuously developing process, and one of its main pillars is a fast-developing transportation network, planners are becoming more interested in balancing sustainable development with sustainable transportation. A sustainable transport system has been defined by the European Conference of Ministers of Transportation as one which is accessible, safe, environmentally-friendly and affordable [
1].
Other studies [
2,
3] consider that a sustainable transport system should:
be affordable, efficient and offer various choices of transportation and at the same time to support a vibrant economy,
should allow the achievement of basic access needs of individuals and societies in a manner consistent with human and ecosystem health,
to be environmentally sustainable by limiting emissions, waste, consumption of non-renewable resources [
2].
The sustainable transport goals were described in a different way by different authors, but in the study
Well Measured—Developing Indicators for Sustainable and Livable Transport Planning, [
3] the main ones were considered to be:
Transport system diversity—where travelers are given the option to choose from various modes of transportation;
System integration—in which public transportation is integrated with other components such as pedestrian and cycling;
Affordability—transport is accessible even for low-income households;
Resource and operational efficiency—consideration that the policies used in transport planning are encouraging the energy and land efficiency;
Efficient pricing and prioritization—consideration that all elements influencing the transportation within a specific area (mainly road, parking and fuel) are priced to ensure efficiency and to encourage more efficient means of transportation;
Land use accessibility (smart growth)—integrates accessibility and transportation with the urban development plans to ensure mixed, connected and multi-modal land use developments;
Operational efficiency—at the level of transport providers, travel agencies and facility managers in order to maximize the service quality at an affordable cost;
Comprehensive and inclusive planning—involving all stakeholders at the level of the affected community.
A certain element to be taken into consideration while defining sustainable traffic systems is where the system will be implemented: urban/rural areas, large/small communities, traffic hubs, type and location of different functional areas within the community (residential, cultural, educational, business and so on), local traditions, developed/undeveloped communities [
4].
One of the main effects of urbanization is the increase in traffic and the problems it causes: congestion, traffic jams, increasing numbers of accidents, increasing travel time, increasing pollution and the direct and indirect costs it causes [
5,
6].
As a result, congestion in urban areas has become a common phenomenon nowadays. The city’s main arteries become congested during peak hours or when there are additional constraints, such as traffic accidents and road works, so that residents are increasingly faced with slowing down on certain stretches of road, which is implicitly accompanied by an increase in the time needed to move around [
7].
Due to the fact that traffic congestion is a problem that affects cities in direct proportion to the urban population, and the global urban population is constantly growing and cities have a higher population density, traffic congestion has a deep impact on people’s daily life, the environment and the development of the social economy. The main impact over the social economy is brought by lost economic efficiency, increased transportation costs, increased pollution and negative influences on social cohesion. Therefore, many studies have been conducted using different approaches to analyze urban traffic and congestion. Some researchers believe that the topology of the road network within the city is a major factor in causing traffic congestion [
8]. Others believe that the increased number of bottlenecks is mainly due to the fact that the roads are too small compared to the traffic density and that the intersections do not take into account the restrictions on traffic flow [
7,
9].
Congestion can occur also from different reasons, such as incidents, defective/inefficient traffic signals, excess demand, work zones, weather related or even special sport or cultural events, trade shows, fairs and markets [
10]. It is also important to analyze if the road traffic congestions are recurring or nonrecurring [
11].
Recurring congestions are those which are occurring every day during peak hours and are influenced by road capacity, inadequate traffic controllers (poor coordinated traffic lights, stop signs, parking places or speed reduction zones), bottlenecks in narrow streets, concentration of business or administrative and educational functions in a certain area of the city [
11,
12].
The nonrecurring congestion is generally linked with unpredictable events:
accidents, traffic incidents, vehicle crashes or breakdowns blocking traffic lanes [
13,
14],
work zones which are causing the reduction of speed, traffic diversion, reduction of lanes or temporary road closure [
10,
11],
weather such as heavy rain, snow, heavy winds or ice which can cause the traffic to slow down, reduce visibility and affect driver behavior [
10],
other special events: sport or cultural events, concerts, trade shows, fairs or markets which can cause a high number of persons to travel in a certain area of the city at the same time and create congestions.
Several congestion control strategies have also been formulated, such as congestion control method, traffic signal control at urban intersections and signal timing control to optimize traffic flow [
15,
16]. The impact analysis of the public transport on traffic and its optimization methods to discourage private transport and relieve traffic congestion has also been studied by many researchers [
6,
17,
18,
19]. The topic of short and medium-term estimation of traffic volume in road networks and identification of traffic patterns has received much attention in recent decades [
20,
21]. There has also been a lot of research on how to use information collected from mobile devices, including crowdsourcing and volunteered geographic information (VGI), to analyze traffic congestion based on road flow, but also to design and plan road infrastructure [
22,
23]. With the growing number of vehicles, urban traffic is increasing, and it is observed that some roads/streets are prone to congestion while others are not.
Some scientists highlight the fact that, since investments in enhancing transport infrastructure extension alone cannot solve the traffic problems, the focus should be transferred from development of future transport towards traffic management and the usage of IT systems to manage and control it [
24].
It is obvious that traffic jams as well as urban traffic itself are influenced by multiple factors represented by complex geospatial data and the spatial relationships between them. Mapping all these factors using geographic information systems can expand the possibilities of analysis and management of local, regional and national traffic. Nevertheless, it is clear that traffic congestion has a direct negative impact not only on people’s daily lives, but also on the environment and regional economy, as it imposes additional costs that makes life more expensive and hinder local development. One of the main factors that can have a direct and indirect influence on traffic is urban and regional public transportation.
The general trend in Europe is to discourage personal transport in favor of implicit public transport and to take the necessary measures to make it more attractive. Therefore, public transport contributes significantly to overall human mobility and passenger volumes.
The optimization of the urban public transport system represents one of the most important socio-economic and environmental issues in recent decades. The complexity of the problem actually arises from the mutual influence between the choice of passengers’ transport strategy and changes in the urban transport system. The selection of a certain method of transportation by the population is an important element in estimating and simulating traffic [
25].
In several studies was highlighted the fact that traffic management is influencing both the supply of traffic and also the demand for transport by implementing a set of procedures which have the final goal to optimize the positive and negative impacts of traffic and transport [
24]. The main goals for implementing a public transport strategy are considered to be mobility needs, traffic safety, environmental protection and economic efficiency [
24].
Other studies are making an interesting comparison between mobility-based versus accessibility-based transport sustainable planning [
3]. The classical transport planning is based mainly on mobility using indicators such as traffic speed and cost, therefore concentrating in investment in big road infrastructural projects, usually ignoring accessibility and improvement options. More sustainable planning is the accessibility-based planning that is focused on identifying other solutions concentrated on improvement to mobility substitutes, accessible land use patterns, alternative modes and resource-efficient solutions [
3].
Several authors insist that in order to ensure a sustainable and resilient transportation system and in order to reduce the congestion, the first step is to analyze the current transportation system in a certain area and afterwards to build and manage an efficient traffic control system, which can help the decision makers take multi-disciplinary mitigation actions [
10,
26,
27,
28,
29,
30,
31,
32,
33].
In Europe and worldwide, the trend is to discourage individual transport in favour of public transportation; therefore, the main objectives of this paper are the following:
To represent the street network and public transportation in Oradea using GIS, in order to identify the areas without easy access to public transport.
To estimate the cost for commuting by car or by public transportation in Oradea Metropolitan Area, in order to understand how the residents are choosing the method of transportation to commute and to be able to optimize public transport based on their demands.
Integration of mathematical models and analysis with simulation procedures in order to assess the public transportation in Oradea and its impact on urban traffic.
2. Geographic Information Systems and Traffic
Climate change, socio-economic problems, uncontrolled urbanization and population growth or decline can have disastrous effects on the sustainable development of cities and regions. Due to the high complexity of urban development issues, information technologies and geographic information systems have become fundamental tools not only for managing urban infrastructure but also for formulating local development strategies.
2.1. Geographic Information Systems
One of the main effects of urbanization is the increase of traffic; the analysis and optimization of urban traffic is one of the essential elements of sustainable development of localities. While half a century ago GIS software was only used to automate the process of map production without having too many analytical functions, today, geographic information systems integrate various spatial and non-spatial information with decision support systems and expert systems. By integrating traffic information into geographic information systems, movements, flows and road closures including accidents or congestion can be monitored in real time. Furthermore, by analyzing historical data, the system should be able to identify patterns and highlight problem areas where congestion occurs at certain times and their possible causes. Therefore, specialists in the field of urban planning and transportation are increasingly integrating traditional methods of transportation research with spatial analysis, offering various specific applications for both traditional transportation and various transportation activities [
34].
The road cadaster or road information system is a subsystem for the record and inventory of land plots, structures, facilities and conditions of the road network from a technical and economic point of view, with the aim of creating a road database, but also its recording in technical documents of the cadaster and real estate advertising. The road cadaster includes all public roads of which they are an integral part: bridges, culverts, tunnels, cycle tracks, viaducts, pavements, etc.
The main road elements included in the topographic map and implicit in the geospatial database related to the road cadaster are:
Road axis—the imaginary line defined as the geometric location of points equidistant from the road edges.
Plan geometry of the road.
Vertical geometry of the road to highlight the transverse profiles.
Roadway including the definition of the number of lanes and special lanes: acceleration, deceleration, left turn, etc.
Elements located outside the roadway: sidewalks, greenways, bike lanes, sidewalks, gutters, etc.
Road safety facilities: traffic signs, markings, etc.
Many studies highlight the use of GIS to create a comprehensive spatial database containing all integrated road cadastral data with traffic information, such as speed data, road geometry, traffic flow, friction points, etc. [
22,
35,
36,
37]. Geographic information systems facilitate users to integrate a variety of spatial information related to data transport and traffic, such as road category, width, types of pavements, number of lanes, roads and intersection capacity, speed limits, sign inventory traffic restrictions and restrictions imposed by them, temporary or semi-permanent traffic jams, incidents, vehicles, etc [
38].
In
Figure 1, you can see a map of Oradea with various spatial objects related to traffic: roads, green areas, parking lots, traffic signs (black dots), traffic lights (red dots), lanes(arrows) and various markings related to traffic [
22].
The applicability of geographic information systems in the field of traffic originates not only from the spatial and distributed nature of transport data but also from the need for various types of network-level analysis, statistical analysis and spatial analysis. Moreover, systems based on GIS technology allow the integration of socio-economic data with geospatial data of the transportation network for a wide variety of planning functions [
37,
39].
2.2. Geographic Transport Information Systems (GIS-T)
The many advantages of GIS make it an attractive option to be used in modeling and solving traffic problems, especially due to its ability to cope with the large volume of geospatial data. Accordingly, GIS systems have evolved beyond the initial stages of data management and mapping and have advanced to modeling and analysis, thus facilitating spatial decision-making. There have been several attempts to integrate various GIS models and combine them with the development of intelligent transport systems. Using such a merger is likely to meet the growing demand for improved GIS functionality in solving transportation problems. As descried in [
35,
37], Geographic Transport Information Systems (GIS-T) represents the integration of the Transport Information System (TIS) with GIS. The main advantage of GIS-T is given by the potential integration of all types of geospatial and alphanumeric data. Highlighting the interaction between the transport system and its environment makes geographic information systems the ideal technology for route design, risk analysis and decision making [
37].
Due to the multiple advantages, the use of geographic information systems for transport (GIS-T) is now more widespread, the most common applications being route planning, tracking and tracing of road maintenance works, traffic modeling, accident analysis and impact assessment.
GIS-T can also be integrated with sophisticated mathematical models and analysis and simulation procedures designed to study different planning options and management policies. In this article, GIS-T capabilities have been widely used to identify areas in Oradea inaccessible to public transport and to highlight the dysfunctions that generate the option to overuse the personal car and not public transport.
3. Materials and Methods
In order to fulfill the proposed analysis, different type of spatial analyses, network analysis and mathematic modeling were used as it is described in this section.
3.1. Spatial Analysis
The main advantage of geographic information systems lies in the ability to perform a detailed analysis of all managed data, both those with geometric characteristics and non-geometric/alphanumeric.
Spatial analysis is a process by which processes can be modeled by spatially assessing the feasibility of interventions/investments for a given location, estimating and predicting results, interpreting and understanding changes, detecting patterns and more. It integrates the spatial perspective with statistical and alphanumeric information through a process of analysis and exploration of geospatial data [
40,
41].
In most cases quantitative studies of distribution analysis is presented as a homogeneous phenomenon because it is easy to generalize. Therefore, in socio-economic analyses, it is considered that the phenomenon or entities analyzed are homogeneous across an administrative territory. For example, the value of an indicator in an administrative territory is calculated as the total of the indicators in the region [
40].
where,
n represents the number of entities in the region, and
ind can be any economic or financial indicator. In GIS, such an indicator is calculated with a spatial aggregation function.
This type of spatial aggregation, similar to other generalization-based analyzes, ignores the details of the original data and does not take into account the spatial heterogeneity of geographic reality. Therefore, it is necessary to perform other types of analysis to obtain a correct result.
3.2. Network Analysis
Proximity analyses are used to determine entities in the vicinity of an entity, not necessarily adjacent to it. The most usual method for proximity analysis represents the determination of buffer zones. However, buffer zones are regular spatial fields—polygonal or spherical, at a specified distance, around and based on a geometric object.
Figure 2 below shows the buffer zones within 500 m of each public transport stop in Oradea. In this figure, the city bus stop is shown in green, the tram stop in red and the regional bus stop in blue.
As can be noticed, the accessibility is considered in areal distance; therefore, in the case of traffic modelling and GIS-T application, the buffer zones are not relevant, so it is necessary to use network analyses.
Network Analyst allows you to perform analyses on network or graph data sets. These analyses can include finding the shortest route, identifying the minimum cost route, identifying accessible areas, identifying the nearest facilities, choosing the best location or finding the best routes for a fleet of vehicles. Service area analysis is one important function included in ArcGis Network Analyst.
The service area is a function based on Dijkstra’s algorithm to traverse the network, with the goal to return a set of connected edges within a specified distance or cost. Service area analysis makes possible determining the area accessible from or to a point, but unlike buffer zones, it takes into consideration the structure of the road network and barriers in the traffic. The result of the analysis is a polygonal area that can be reached within a time period or within a distance [
42].
To create a service analysis, you need to specify the points of interest, the type of trip (e.g., walking, driving, etc.), the distance of the trip or the cost of the trip in minutes.
3.3. Mathematical Modelling of Traffic Method Selection
Compared to road transport, public transport relies on rolling infrastructure, uses a well-defined network of stations and runs according to a timetable. As a result, not all places are directly accessible by public transport, and those that are accessible may not be accessible at all times. The population chooses the method of travel, and thus implicitly the choice of public transportation, taking into account mainly geographical aspects such as the proximity of transport stations to the point of departure and destination, but also aspects such as frequency, duration of travel, congestion and quality of service.
All models of traffic forecasting, transport planning or public transport services depend heavily on human mobility and the preferred options of the population. According to the model of urban economic, defined by Fujita and Ogawa, usually the population are choosing their places of accommodation, their jobs and type of commuting in order to minimize costs [
43]. Based on this assumption, Verbavatz and Barthelemy simplified the Fujita and Ogawa model, thus people choose the mode of travel that is minimizing the costs of their commuting [
17]. The costs to commute include not only the cost of tickets in case of public transport, or gas and parking costs in case of traveling by car, but also the queuing time and schedule delay (time early or late for work).
In order to get a better picture of what influences traffic, mathematicians Verbavatz and Barthelemy have built up a simple schematic model that would capture the simplest elements of the interaction between traffic and public transport [
17]. Their goal was to get the basic relationship between the two key variables, first the people in a city who choose to drive, rather than take public transport, and secondly the population of a city that has easy access to public transportation and are also choosing this method.
If p
a is the total population living “close” to public transport, P is the total population and T is the fraction of people preferring to use cars as a means of commute instead of public transport, the model defined by Verbavatz and Barthelemy provides a striking prediction for the simple equation presented below:
The model proposed by Verbavatz and Barthelemy starts with the hypothesis that, usually a city is polycentric, and in all these centers of municipalities, public transportation is accessible for the majority of possible destinations; but in the case of Oradea, this is not valid. Therefore, the model was modified by adding a third situation, as shown in the figure below:
Those areas for which both departure and arrival do not have easy access to public transport, so they have to use the personal car to commute (
Figure 3a),
Situation where one end point, departure or arrival has easy access to public transportation, but the other is located at a distance of more than 1 km from any public transportation station (
Figure 3b),
Situation where both endpoint departure and arrival are located in an acceptable neighborhood by public transport (
Figure 3c).
Therefore, it was proposed the modification of the model defined by Verbavatz and Barthelemy to replace
Pa with
Pc, where
Pc <
Pa and
Pc represent the total population for which both the point of departure and point of arrival are located in an acceptable neighborhood for public transportation.
One of the main criteria in choosing the means of locomotion is the time required to travel from the point of departure p to the point of arrival s.
The time required to travel from point p to point s in the case of driving is:
where:
tm: the time required to travel by car,
dist (s,p) is the distance required to drive from p to s,
vm: average speed of cars.
Since the average speed to cover the distance depends on the degree of intra-urban congestion, the time estimation function was modified by a congestion-dependent coefficient, calculated according to the traffic index. The
ti was calculated
, as a ratio between the total number of cars in traffic and the capacity of the streets, raised to the power
μ representing the traffic sensitivity.
The traffic index,
ti, is calculated by TomTom for the big cities of the world [
44], but for smaller cities as in our case, the traffic index was estimated based on usual traffic reported by Google Maps and Waze.
Thus, for the calculation of the time required for travel by car is given by the formula below:
where:
For cities such as Oradea, without high-speed public transportation, the speed of the public transport is calculated also with the Equation (6). In this situation, the time required to travel from point p to point s in the case of travel by public transport (PT) is a sum of the walking time from departure to the nearest public transport, walking time to destination from the nearest station, traveling time and waiting time, as it is presented in the Equation (7):
where:
dist(p,sp) represents the distance from the starting point p to the nearest public transport station sp;
dist(s,ss) is the distance necessary to travel from point of arrival to the nearest public transport stop ss;
dist(ss,sp) is the distance required to travel by public transport from the nearest public transport point of departure to the nearest public transport point of arrival;
is the average speed of public transport between sp and ss by applying the correction factor, given by the traffic index, ti.
Therefore, if the time required to travel by car is faster than the time required to travel by public transport, tm < tPT, and the probability of selecting the personal car as a method of locomotion is in the detriment of public transport increases.
In conclusion, fewer people driving to work will help reduce traffic. In order to reduce the number of cars on the road, and thus the number of people driving, the time taken to travel by public transport should be reduced so that tm becomes much smaller than tPT. This can be achieved by improving public transport, making it more accessible to a greater number of people and reducing waiting times.
3.4. Metodology
In order to fulfill the proposed analysis, we used spatial databases that include the network of streets in Oradea, the street plot and the axis of the street, since these are public information and can be downloaded from the city hall web page.
The additional traffic information was collected by the authors from the field or from other public documents such as Oradea Master Plan, public transport maps and information published on Open Street and Google Maps. All the information collected were integrated in a spatial database created by the authors.
The
Figure 4 was highlighted a schematic representation of the methodology used in the present research.
The identification and detailed parametrization of the significant street network was made:
the street network was defined as graph and database for the mathematical modeling of the traffic. These represent the base map and presentation support for the simulated traffic;
the public transportation network and stations were defined as graphs and represented on the base map;
the identification the main traffic generating objectives (administration, education and health institutions, shopping and service centers/areas, industrial areas, leisure and recreation areas, so on);
traffic censuses data and traffic data from Oradea Master Plan were also integrated in the database and represent the base map.
The traffic data collected were integrated in Arcgis Online with real-time traffic data World Traffic Services, provided by Esri through Living Atlas. Esri Living Atlas is a collection of spatial data and maps provided by Esri and partners. They are accessible to anyone and can be integrated with users’ own data to create maps, perform analyses or develop strategies. Esri Living Atlas Traffic Service contains traffic information and historical and timely data updated every 5 min [
42].
Also, it was adapted the mathematical model defined by Verbavatz and Barthelemy, as it was presented in
Section 3.3. and was applied on the traffic census data for Oradea in order to model and simulate the traveling choice of the population of the city and of the surrounding villages.
Based on the network analysis, traffic analysis and on the traveling simulation, it can be easily determined the elements generating traffic congestion in the inner city.
4. Results
4.1. Oradea Road Network
The proposed analysis was carried out for Oradea Municipality and Oradea Metropolitan Area to study the impact of public transport on urban traffic. Oradea is a city located in the northwestern part of Romania with more than 220,000 inhabitants. Oradea, together with the neighboring municipalities (11 communes), forms the Oradea Metropolitan Area with an area of about 125 square kilometers and a population of more than 350,000 inhabitants.
At this moment, the road network of Oradea consists of 879 streets with a total length of 432 kilometers that occupy an area of 8.346 square km (approximately 10% of the urban area). The street network is very dense, but many of them have reduced traffic capacity, especially on streets in historic neighborhoods and in residential neighborhoods with collective housing. Additionally, some streets have reduced capacity due to allocation parts of the road to parking areas. Another weak point of the street network is the excessive regulation of one-way traffic due to the need of parking space and the insufficient number of bridges over the natural barrier, the Crișul Repede River, and over artificial barriers, railways.
The international and national transit traffic has a major impact on the municipality of Oradea and its metropolitan area due to the location of the city at the intersection of the national and European roads 9 km from Borș national border crossing. The Transylvania Highway, once built and connected to the highway network in Hungary, will take over a good part of the transit traffic (especially the cargo vehicles). Now, the ring road fully channels the transit traffic of freight vehicles from four of five major penetration directions (DN 79–Arad, DN 76–Deva, DN 1–Cluj and DN 1–Borș), but the traffic of transit for passengers is only partially channeled on it. For the fifth direction, DN 19–Satu Mare, all transit vehicles must cross residential and service area of Episcopia Bihor neighborhood. On the direction DN 19–Satu Mare, the cargo traffic recently has been increased because of the new border crossing, Borș II, on the Transylvania Highway linked with the M3 Hungarian highway.
Also, a part of the transit traffic of passenger vehicles on the East–West axis (Cluj-Bors) and North–South/West (Deva-Satu Mare) is made through the inner street network of the municipality, the major impact is manifesting itself in the area of downtown Oradea.
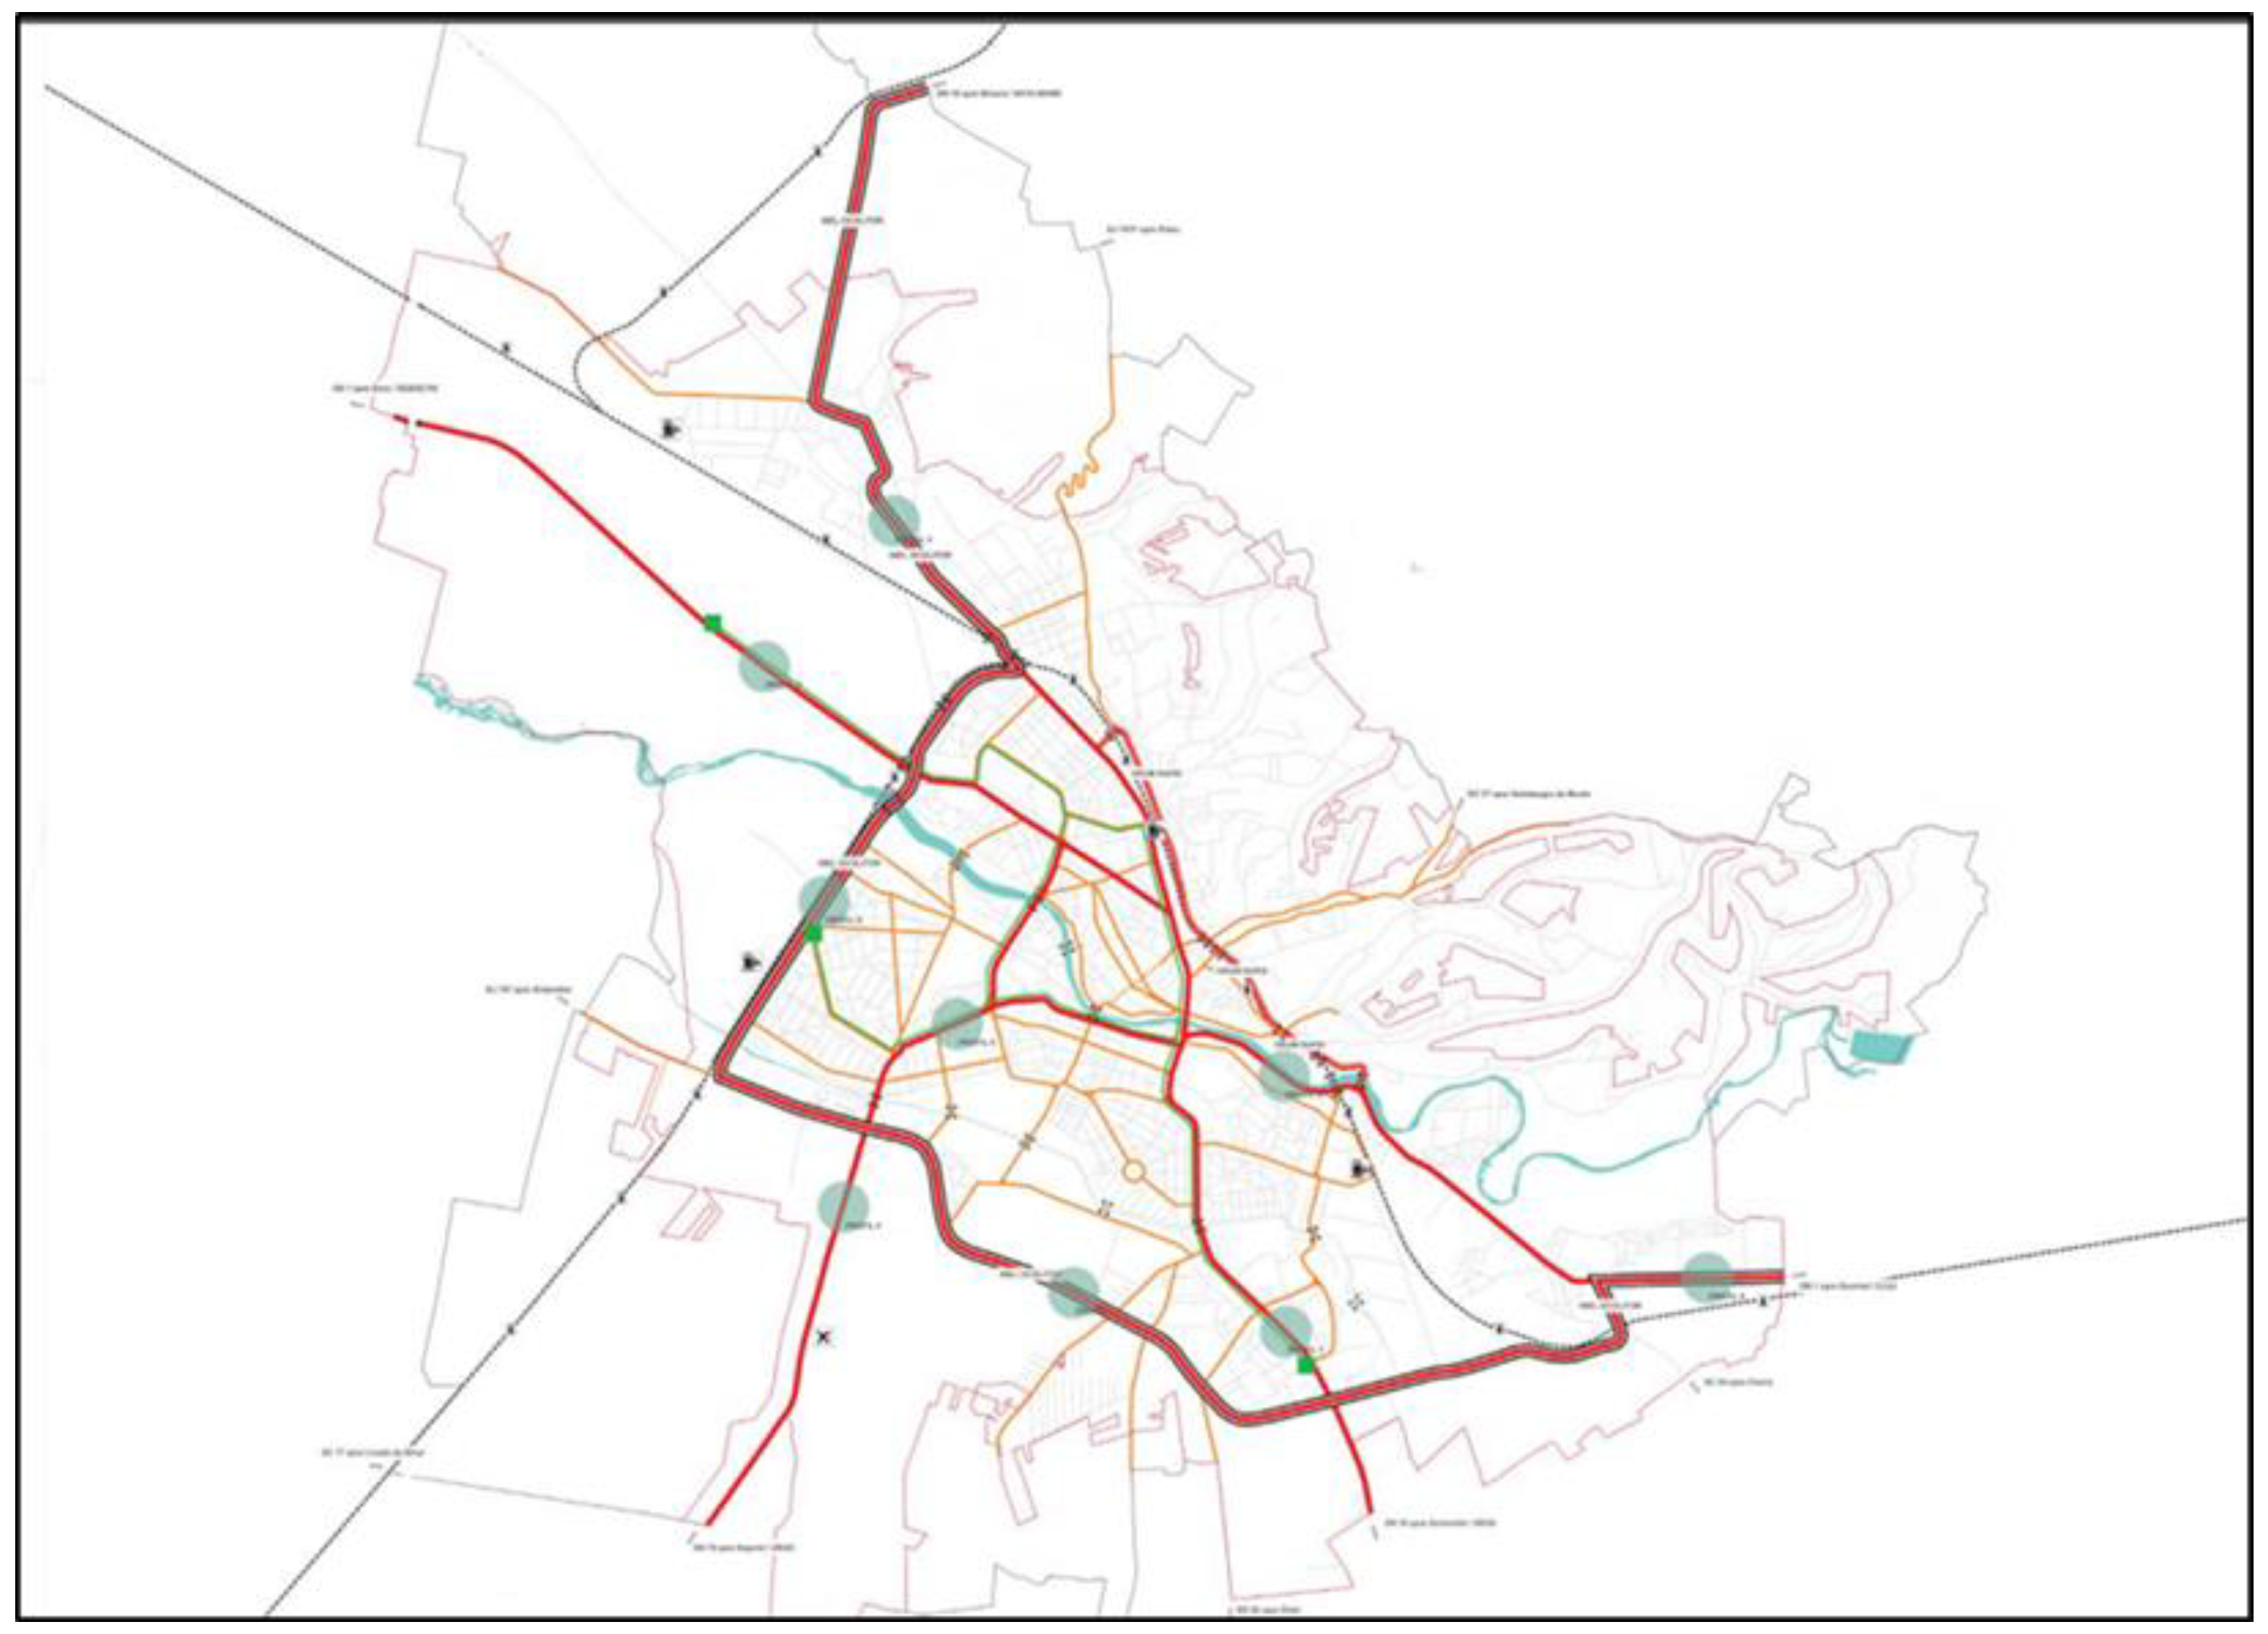
The
Figure 5 shows the main street network of Oradea according to the General Urban Plan of Oradea.
Therefore, the metropolitan area of Oradea and Oradea itself, in the latest years, experienced an increasing number of traffic problems due to:
An increasing number of transit vehicles,
An increasing number of cars,
Narrow streets in the historical center,
Mainly one-way streets in center of the street,
The city is divided in two by the river Crișul Repede with 7 bridges, but only 4 of them on main streets;
Tram line overlaying with traffic lane is causing traffic jam in rush hours;
Infrastructure works for rehabilitation of existing pipelines and infrastructure works or installation of gas networks in different areas of the city.
4.2. The Public Transportation Service in Oradea and Oradea Metropolitan Area
The public transportation service, in Oradea and the metropolitan area, is provided by the Oradea Local Transport S.A. (O.T.L.) and is performed by trams and buses between 5:00 and 24:00. The timetable and number of means of transportation put into operation vary during the day depending on the number of passengers, the peak hours being between 5:00 and 08:30 and 13:00 and 17:00.
The bus transport network is made of 27 lines (10–35) covering the entire area of Oradea, including the newly built residential neighborhoods.
The trams run on five main lines, 1N, 1R, 2, 3N and 3R, plus an extension line that serves the Calea Borșului industrial area. An extensive investment is currently underway to extend the tram lines in order to introduce tram NO. 8.
Compared with road traffic, public transport can only run according to a timetable and use preset stations infrastructure. The
Figure 6 presents the current transport routes in Oradea, provided by O.T.L.
4.3. Analysis Regarding the Influence of Public Transport on Urban Traffic
A fundamental goal of many local governments is to achieve sustainable citizen mobility. Smooth traffic flow can drastically reduce time spent in traffic, but also has other positive effects on people and the environment. Our goal in this paper is to understand people’s mobility patterns in order to identify the reasons for the continuous decline in interest in public transport despite increasing investment in new buses and trams.
By analysing statistical data provided by O.T.L. and Oradea City Hall, it can be noticed that starting with 2012, there was a decrease in the number of passengers by local means of transport. In 2012, on an average working day, approximately 120,000 passengers used public transportation, of which almost 2/3 was by tram. Regarding the frequency of use of the public transportation system, in 2012, it was used daily by 37% of the population of the municipality; 20% used it often (1-4 times a week), 27% rarely and 16% did not use it at all. Nowadays, less than 30% of the population uses the public transportation on daily base, 18% use it often (1–4 times a week), 32% rarely and 20% do not use it at all. The
Figure 7 shows the frequency of public transport use based on data provided by OTL.
The general opinion, presented in the mass-media, by the Oradea local administration is that the main reason for the decreasing number of passengers using public transportation is caused by the increasing number of cars registered in the city and Metropolitan Area.
This study tried to analyze every aspect of the public transportation that are influences the traffic. First, it analyzed the distribution of public transportation stations in the Oradea municipality by using spatial aggregation. As, presented in the previous section, spatial aggregation encapsulates several objects, in our case the public transportation stations, into a single object, based on their location in an established neighborhood. The incapsulated value was calculated with the Formula (1) and for the spatial representation of the resulted analyses, a gradient color palette representing higher values with darker shades was used. The
Figure 8 represent the density of bus/tram stops for each neighborhood.
As can be seen in the figure below, public transport lines have been extended in the new residential areas, but they cover only a very small area. This aspect, combined with the fact that many transport lines are served by only two vehicles, with an hourly frequency of 60 min or 30 min, shows the clear motivation of the population to find alternative methods to public transport.
Another important aspect in the choice of transport mode is the distance to the nearest public transport station. As presented before, the accessibility for the public transport stations cannot be determined with the buffer zone because in this case, the service area is considered to be in areal distance without taking in consideration the road network and traffic barriers; see in
Figure 2. Therefore, in order to evaluate the coverage of public transport, a service area analysis was made in order to determine the area accessible from a public transport station or to a public transport station. The network analysis was made by taking into consideration the following parameters: travel by walking and time of travel 10 minutes. The result of the analysis is a polygon area that can be reached within a time period of ten minutes to a public transport station. The areas generated were merged in order to unify the results.
The
Figure 9 highlights the accessible areas within 10 minutes’ walk to and from a public transport station.
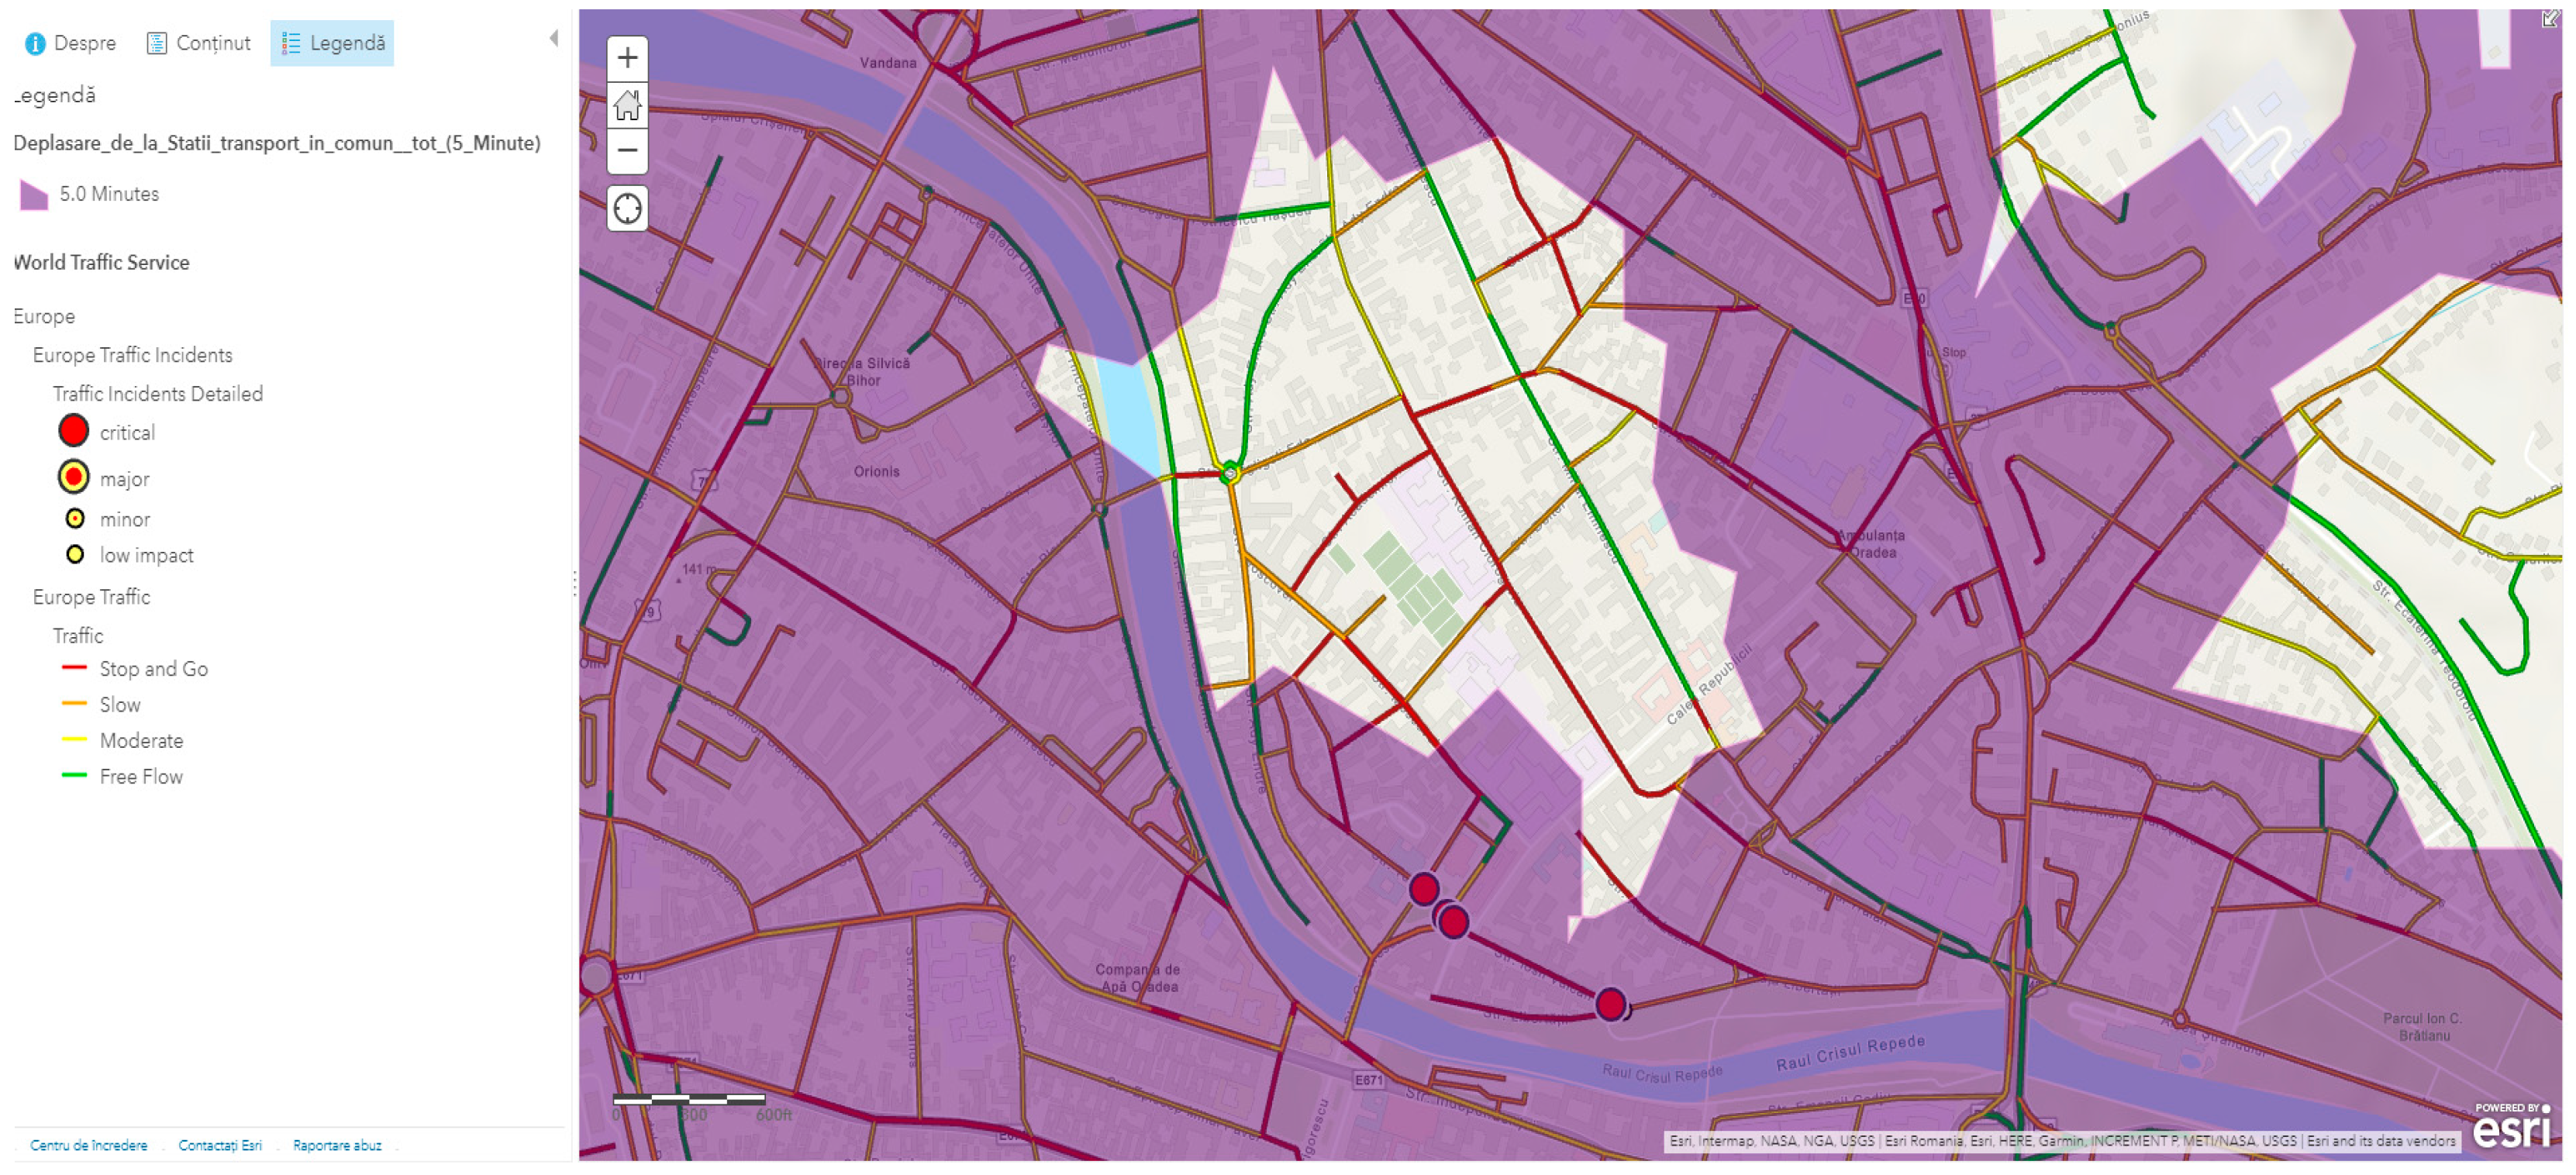
In 2020, the local transport company introduced real-time monitored public transport as a result of an agreement concluded with Google Maps. Using the Google application, all the routes served by the O.T.L. and the transport schedule can be followed, so that the population can optimize their travel times. However, this highlighted the fact that many areas are not adequately covered by public transportation, including the central area, shown in the
Figure 10. The main problem is caused by the existence in the area of four schools with no school buses: George Coşbuc Primary and Gymnasia School, Mihai Eminescu National College, Ady Endre National College and Special Technological High School No. 1. All the streets in this area are one-way, and blockages caused by these aspects extend throughout the day, the highest level being met before 8 am and around 2 pm.
By overlaying the map created for the accessibility of the public transport with the with real time traffic data, provided by Esri through Living Atlas World Traffic Services, it can noticed the extended traffic congestions in the central area of the town, an area without public transportation.
The following figure, represents the graphical representation of traffic, with real time traffic data, which emphasized the traffic jams in the center of the city due to the unavailability of public transportation.
In summary, the results of analyzing the public transport system using spatial analysis methods and GIS applications reveal some existing deficiencies in the public transport network:
4.4. Mathematical Modeling for Traveling Choice
Figure 9 and
Figure 10 emphasized the areas without easy access to public transportation and also the existence of usual traffic congestion in these areas and in the adjacent streets. The choice of travel is given not only by accessibility of public transportation but also by the cost of commute, especially for parents who need to take children to school before going to work.
As it was presented in the previous section, the time required to travel by car is given by Equation (6).
Considering the fact that for Oradea the traffic index of TomTom is not calculated, ti was calculated, depending on the typical morning traffic estimated by Google Maps: 55% for Oradea and 45% for the Oradea Metropolitan Area.
The average speed during the morning congestion is about 25 km/h, and the average distance of commuting for Oradea residents is 6 km; for the Oradea Metropolitan Area residents, it is 15 km.
Substituting these values in Equation (6), it was obtained an average traveling time, during rush hours, of 23 min for a distance of around 6 km in Oradea.
The time required to travel from point p to point s in the case of travel by public transport (PT) is given by Equation (7).
It was estimated that both points of departure and arrival are located in an acceptable neighborhood by public transport, with an average walking time of 10 min from each point to the closest station and an average waiting time for 10 min. Waiting time during rush hour was estimated at 10 min for Oradea and 25 min for the urban area. In this case it can be estimated:
For Oradea Municipality = 30 min.
For Oradea Metropolitan Area
= 45 min.
In
Table 1 it is presented the analysis of the time required for travel in Oradea and in its metropolitan area by car or by public transportation.
As can be seen in the table above, the time required to travel by car during the peak period represents half of the time required to travel by public transport both in the metropolitan area and in Oradea, even if both points of departure and arrival are located in an acceptable neighborhood.
We tried to estimate the costs of commute by each means of transportation. For cars we take into consideration the average wage per hour for the time of commute and the daily cost of the car, gas and parking, and in the case of public transport, we are taking into consideration wage per hour for the time of commute and the cost of tickets.
In emerging or developing countries, low-income residents usually prefer public transportation because using their own cars reduces travel time while increasing the cost of travel. In Oradea, the cost of public transport is much higher compared to owning a car due to the large difference in travel time. Therefore, it is obvious that the majority of the population chooses own car as a means of transportation, which leads to an increase in traffic congestion.
The general opinion, also held by the Municipality of Oradea, that the traffic volume is mainly determined by the population density and the lack of parking spaces, is refuted by the analysis carried out. The result of the analysis assumes that the creation of an efficient public transport network has a decisive influence on the reduction of the number of cars in traffic.
5. Conclusions
The future of cities depends on the capacity for innovation and the ability to harness the socio-economic and cultural resources of all the actors involved in the development of urban society. The dynamics of urban development require a series of strategic, flexible and creative redefinitions through multi- and transdisciplinary approaches to urban issues. Public transportation and traffic control can be used as an instrument of urban management towards a sustainable urban development.
As it was pointed out in the previous section, in order to reduce the number of cars on the road and thus the number of people driving them, it is essential to reduce the time taken to travel by public transport so that tPT becomes much smaller than tm, which can be achieved by:
Increasing the number of people who have easy access to public transportation by extending transit lines to both new neighborhoods and the metropolitan area as well as downtown,
Reducing waiting times by increasing the number of public transport vehicles on each line,
Introducing additional lines to avoid transfers to other means of public transport.
Optimizing the public transport has a multiplier effect on reducing pollution and on sustainable urban development. A lower number of cars leads to better traffic flow, which drastically reduces the time travelers spend in traffic, but also has other positive effects on individuals and the environment. Road transport is one of the main sources when it comes to air pollution, and less congestion led to less fuel consumption.
The main advantage in using the proposed methodology, spatial analysis, simulations and modeling performed within this research are:
- -
It can be applied for any urban agglomeration, and it can be further extended on similar cities and regions.
- -
It can be used in order to decongest the traffic and prioritize public transport.
- -
It can be used to analyze the improvability of ecological efficiency.
- -
It can be used as a basis for the economic analysis.
The main weakness of the model consists in the fact that it does not include subjective transport decisions taken by local authorities and social traffic patterns which are affecting the inhabitants and businesses in both direct and indirect ways, and therefore their inputs should be included in the planning process.
The authors are preparing another larger study extending the area and the scope of this article to other similar historical cities. In that study a simulation will be performed regarding the decongestion of traffic by the extension of public transport in the central areas, proposal of relocation of existing stations and restriction of car traffic; it will also be analyzing the social and economic benefits. The future study will also be comparing different empirical models in order to assess further the economic impact of congestion and decongestion.


