
Exploring the Factors of Intercity Ridesplitting Based on Observed and GIS Data: A Case Study in China


Abstract
:1. Introduction
2. Literature Review
2.1. Existing Studies on Sidesourcing
2.2. Existing Studies on Ridesplitting
3. Data
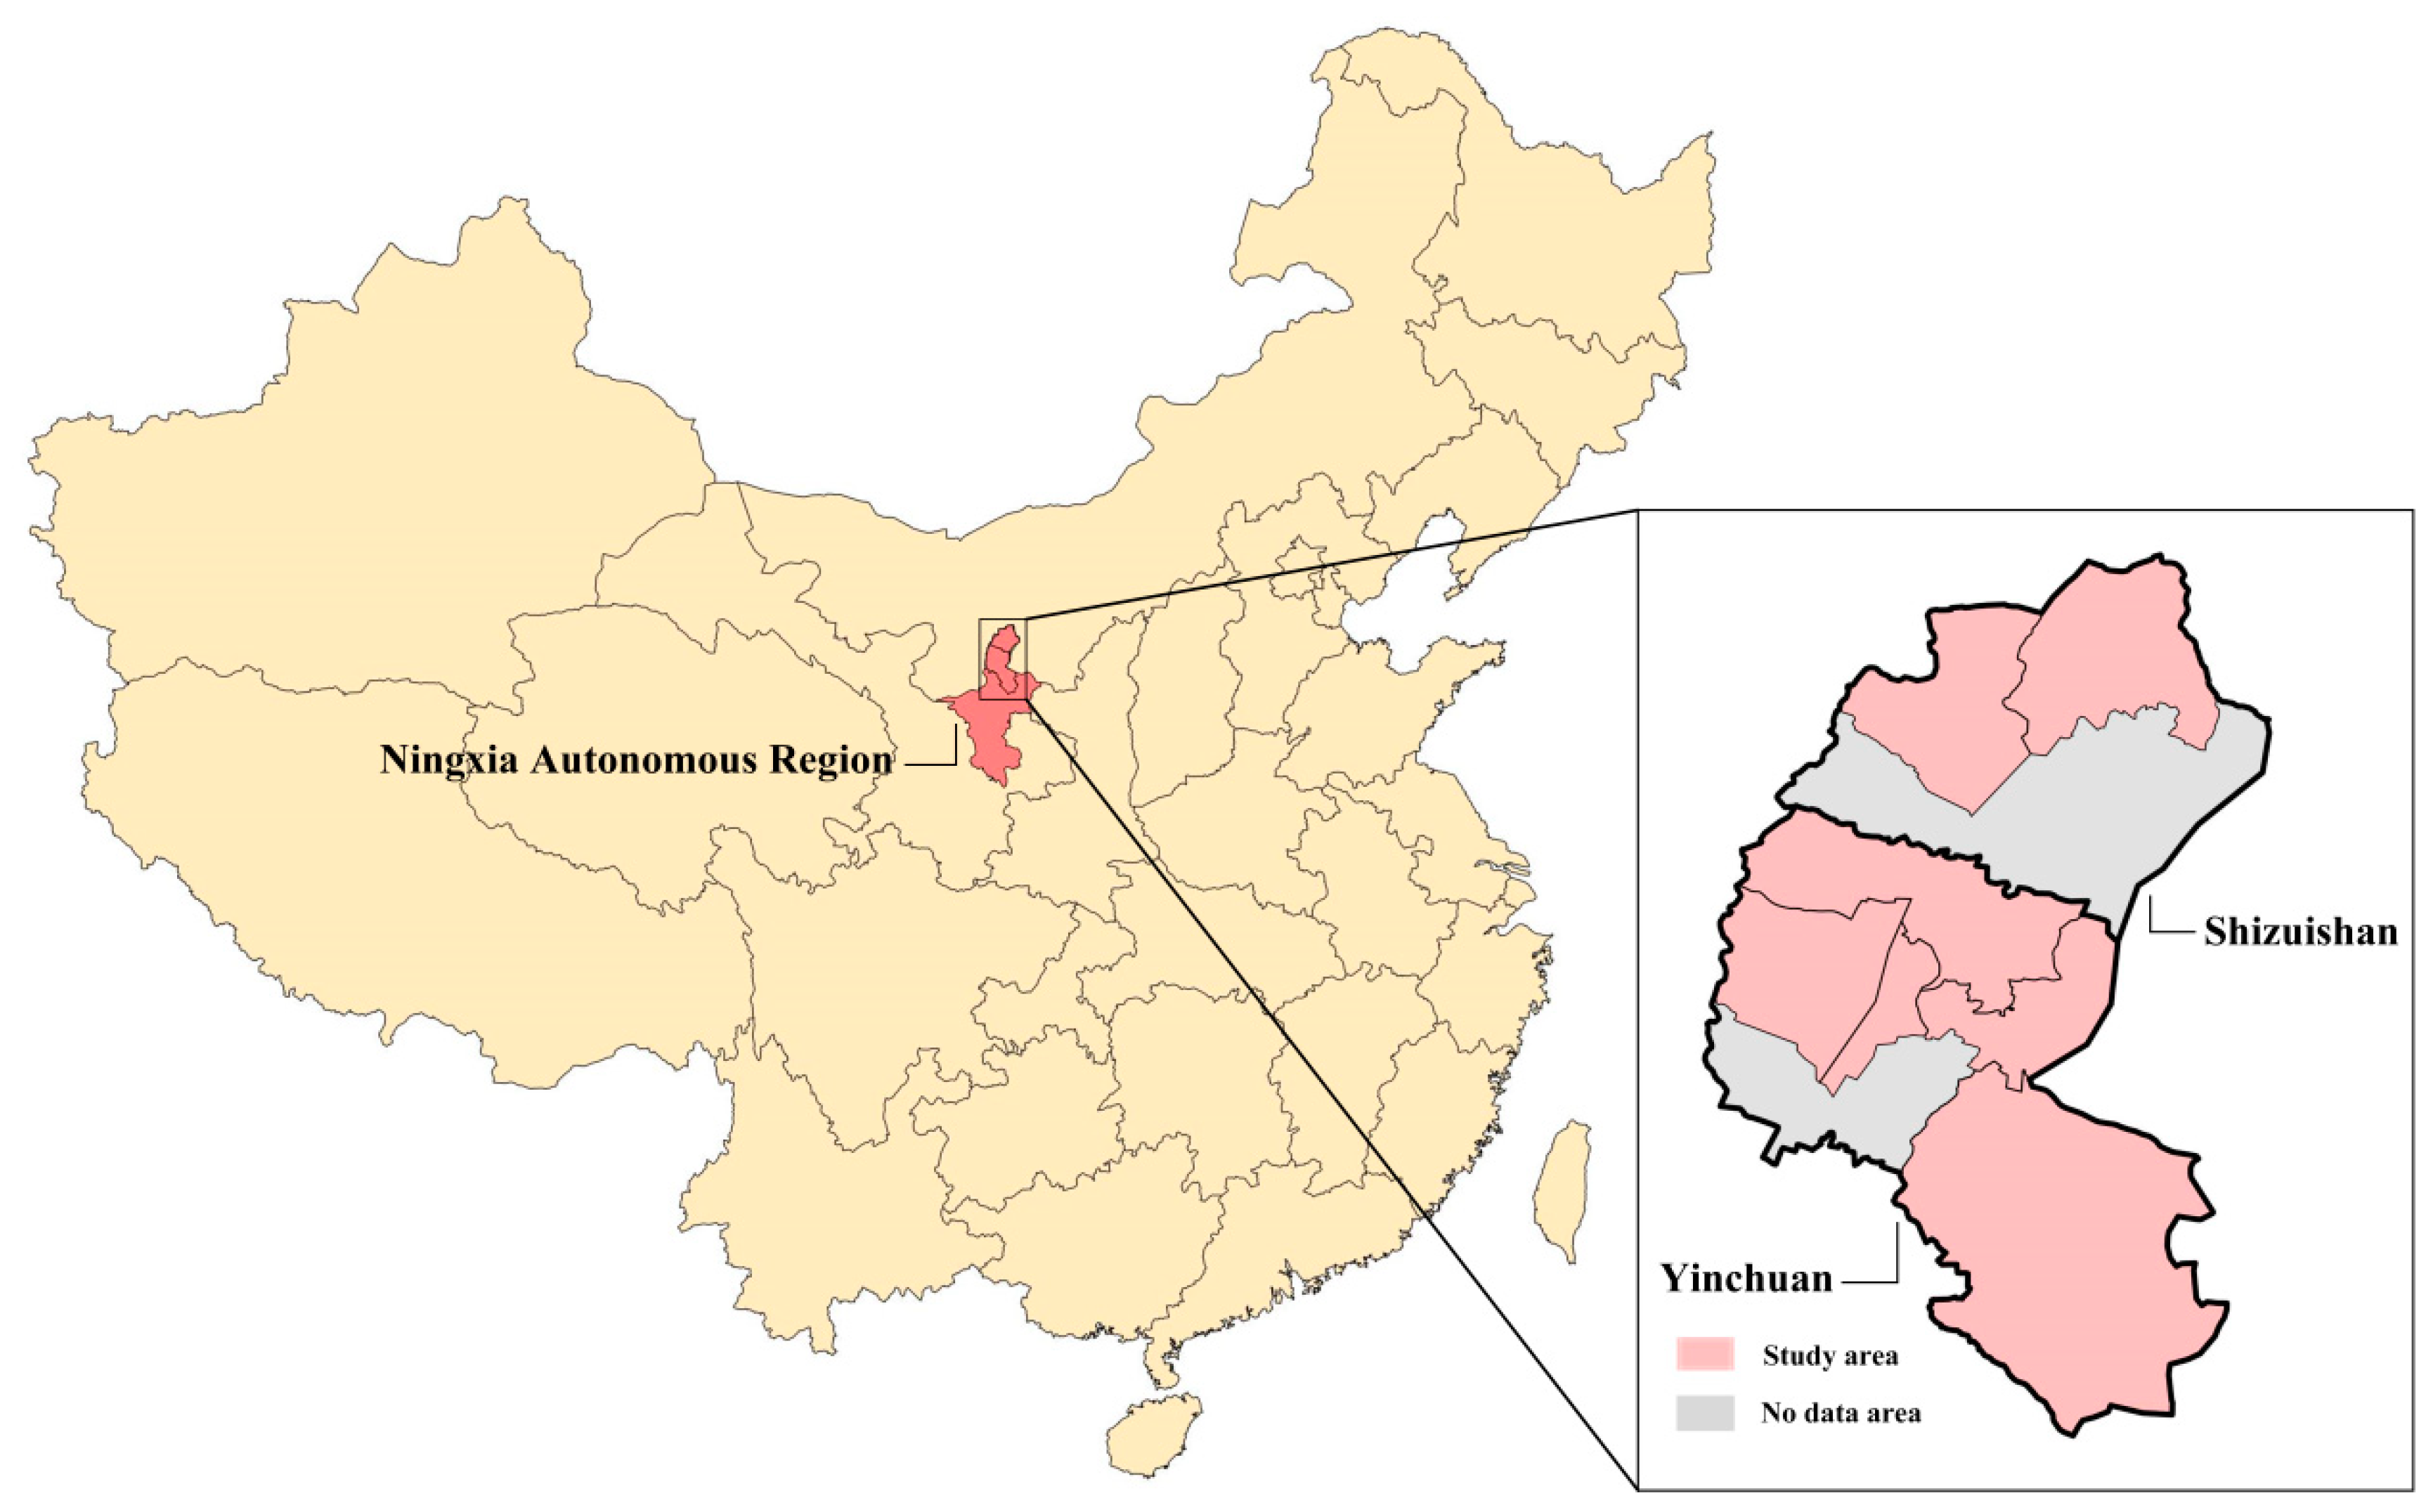
3.1. Data Source
3.2. Scale Analysis of the Intercity Ridesplitting Data
3.3. Comparative Analysis of Intercity Ridesplitting Rides and Single Rides
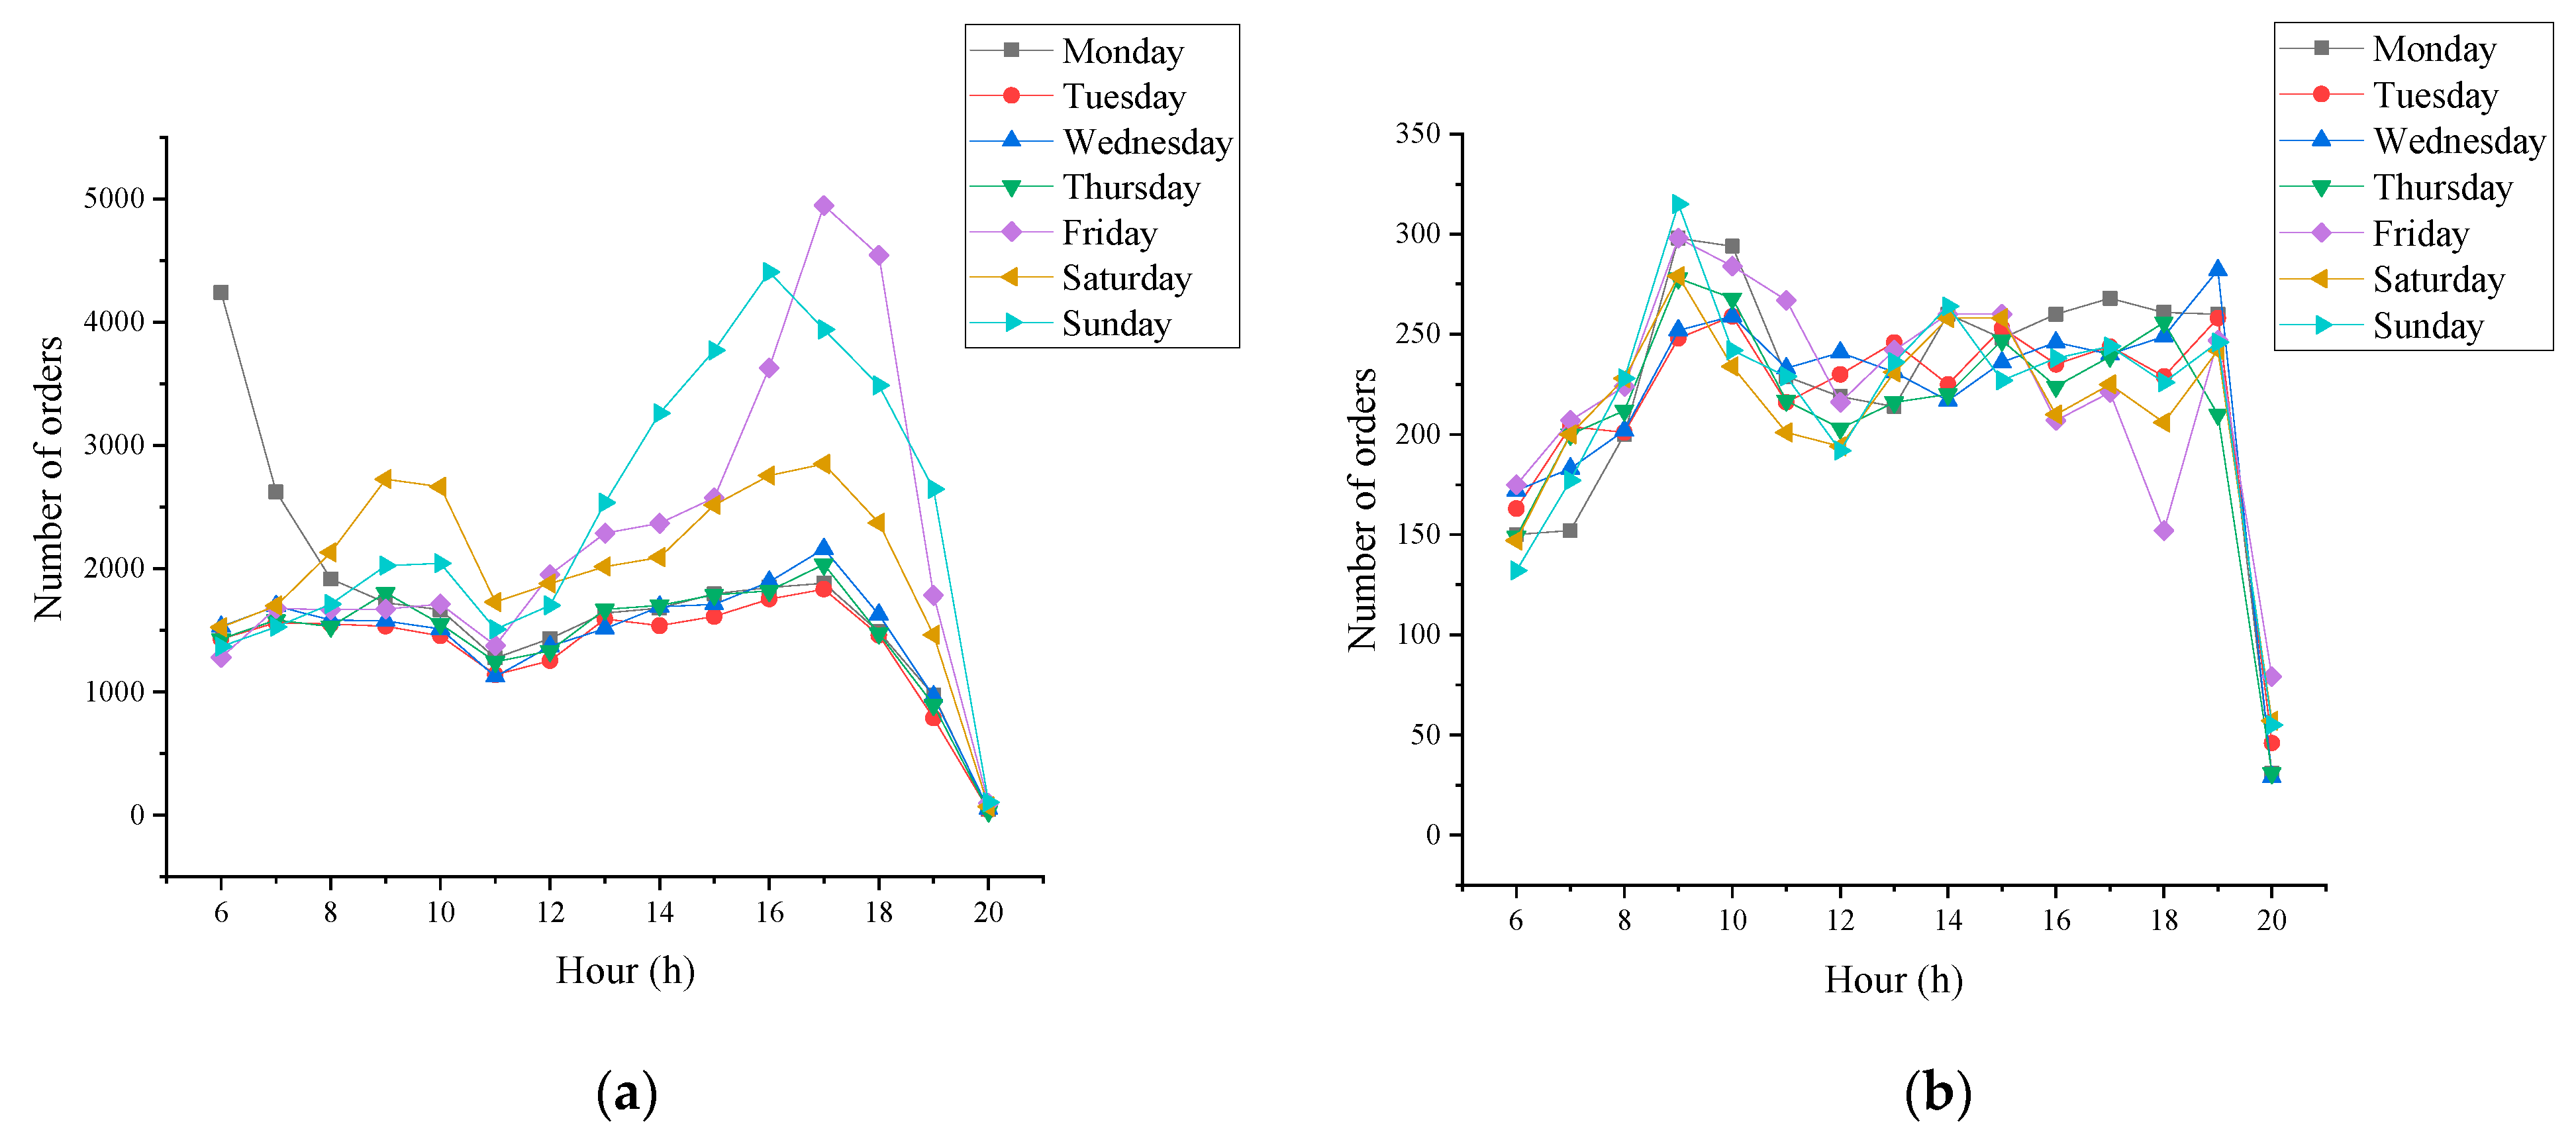
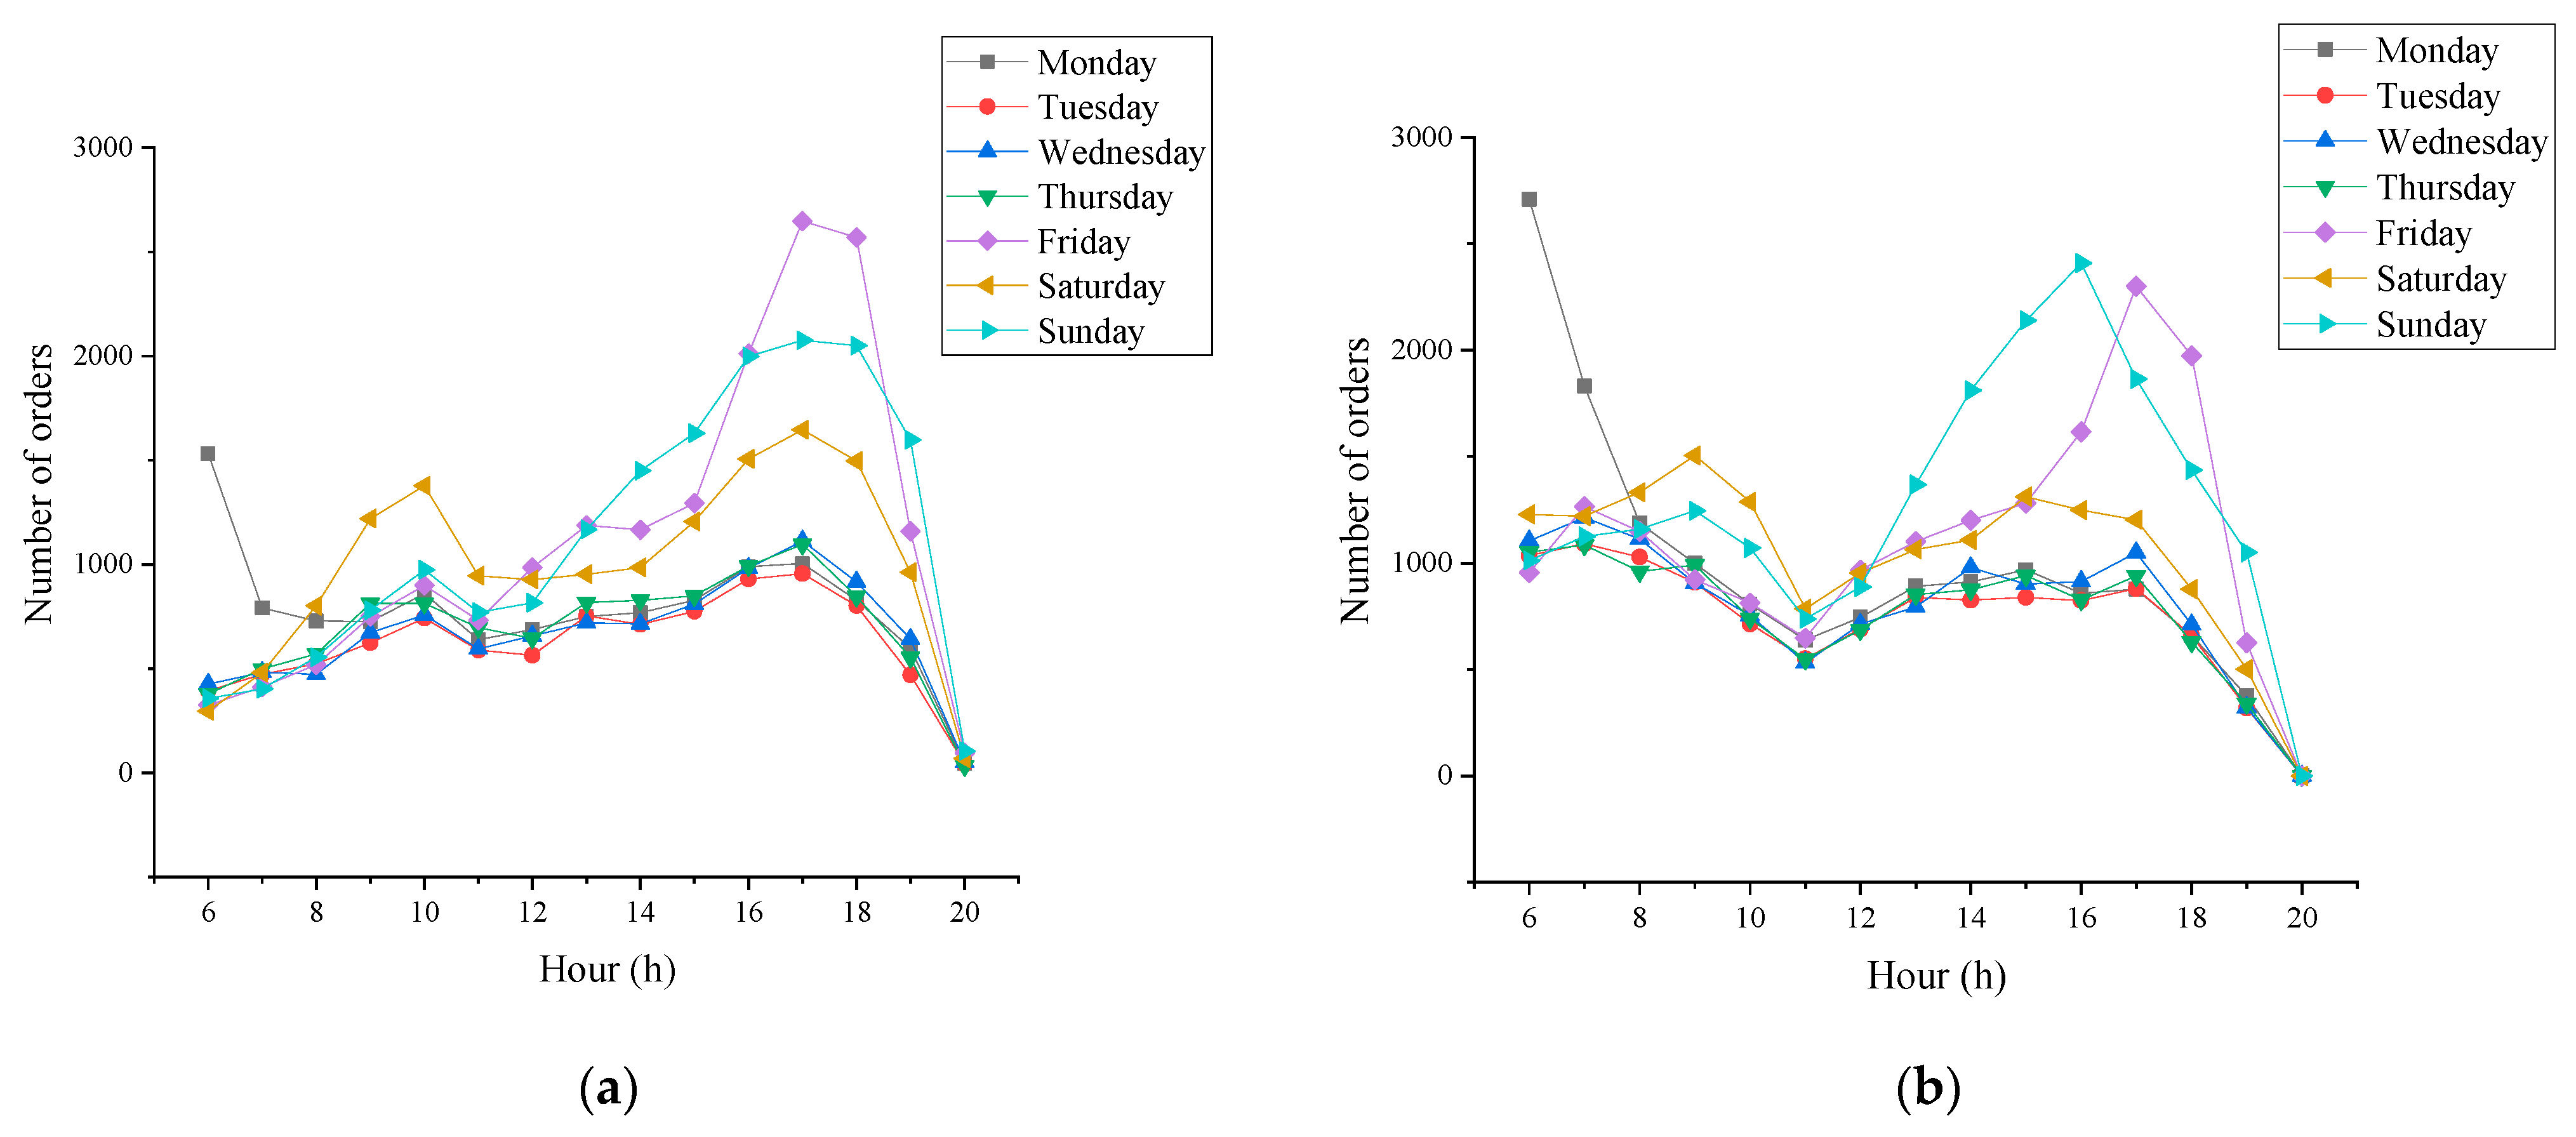
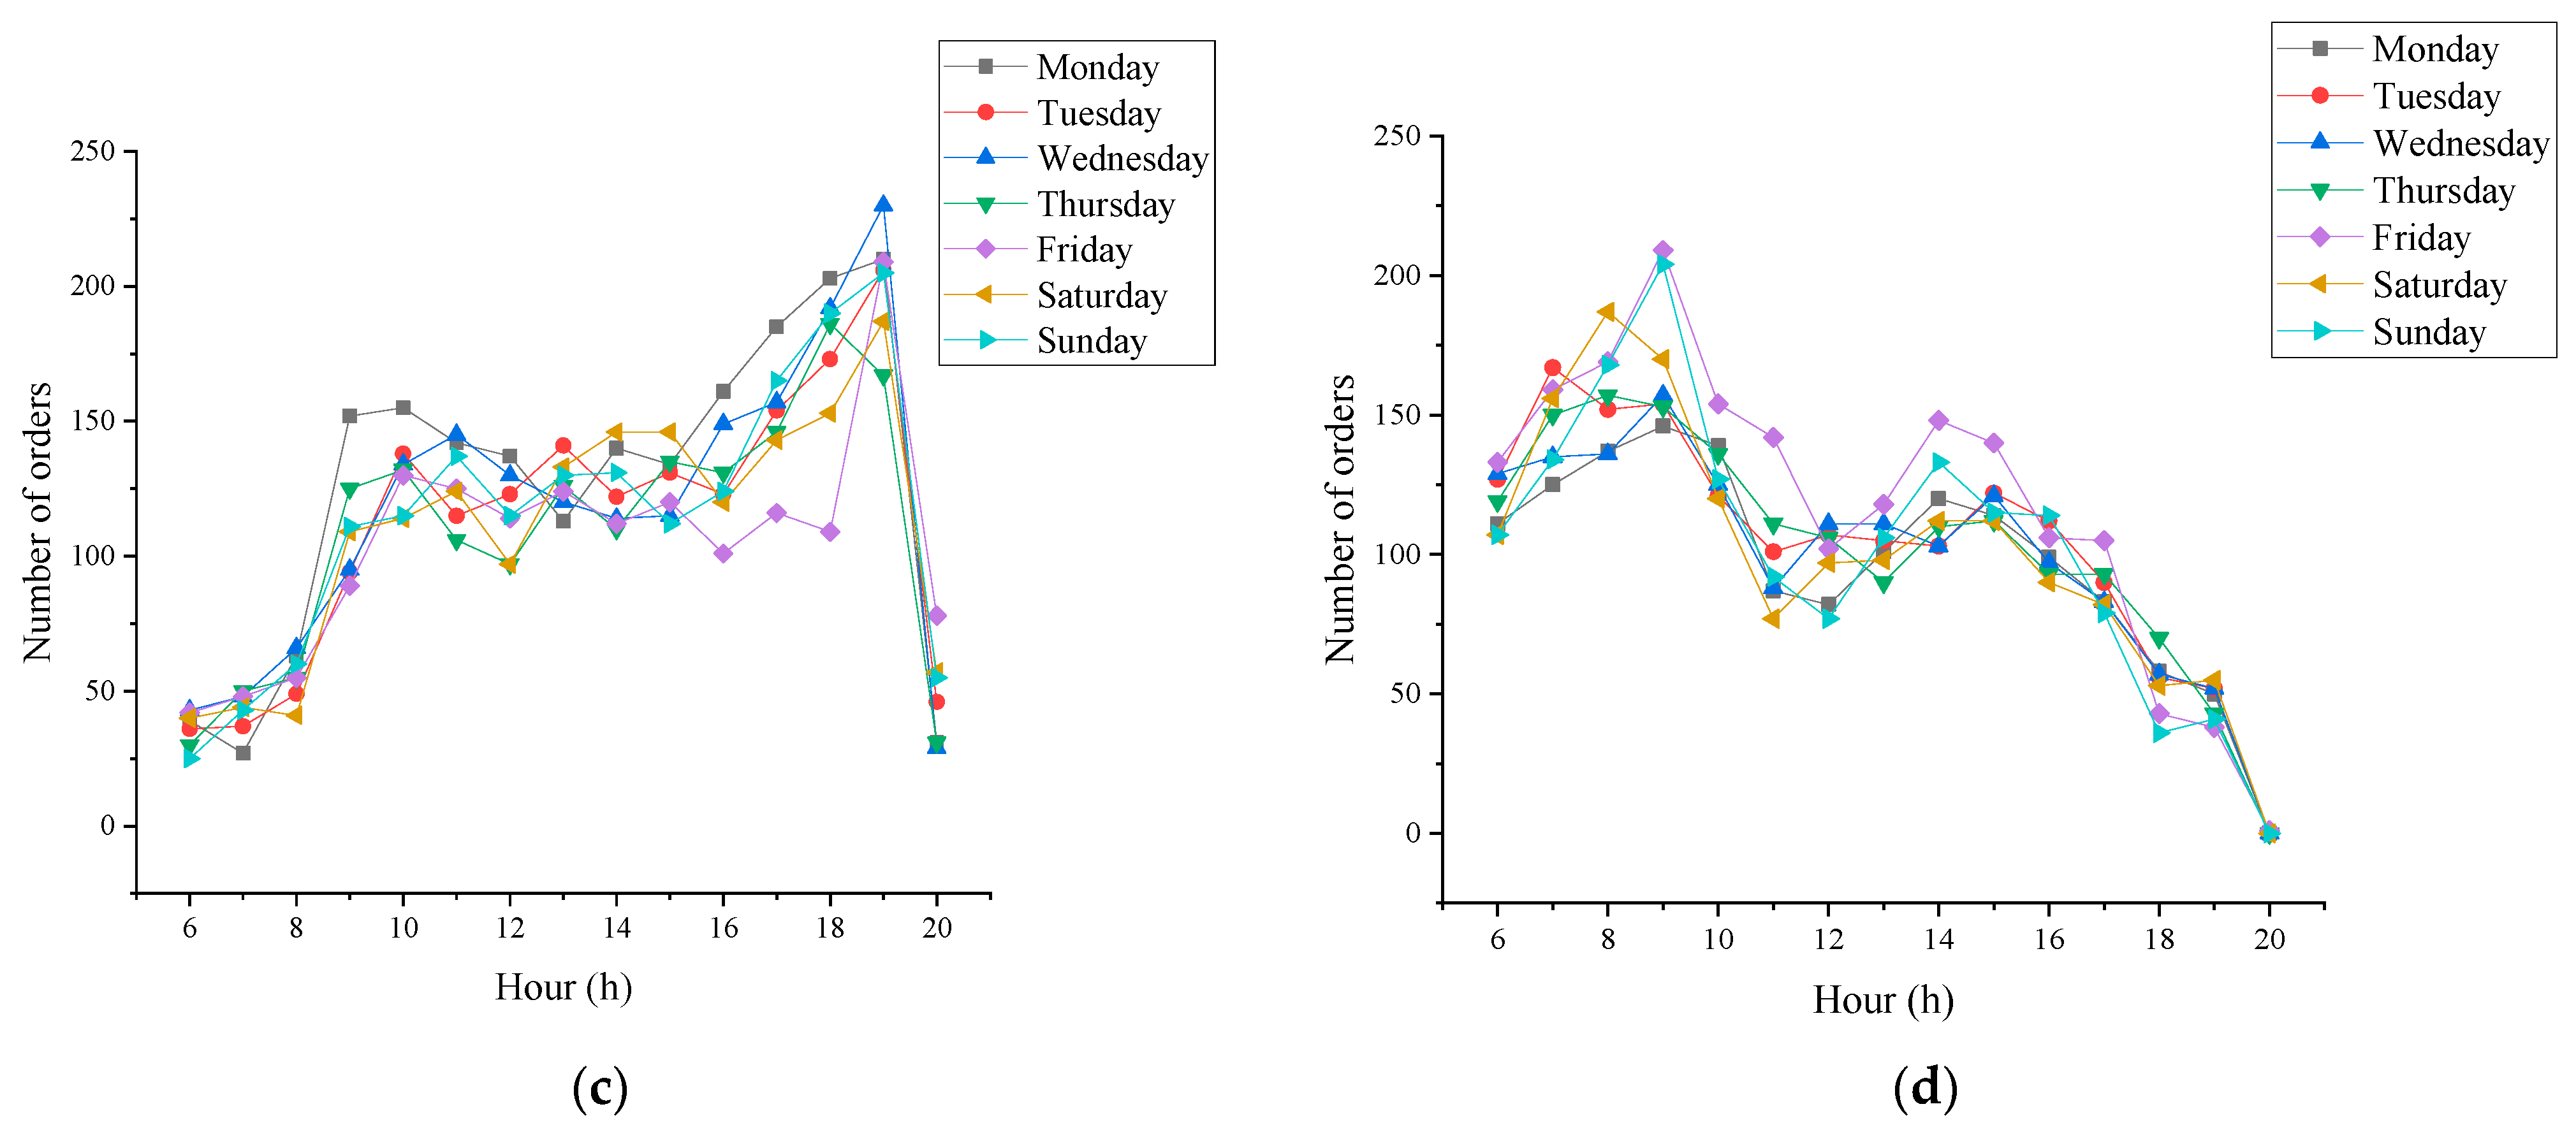
3.3.1. Temporal Factors Analysis
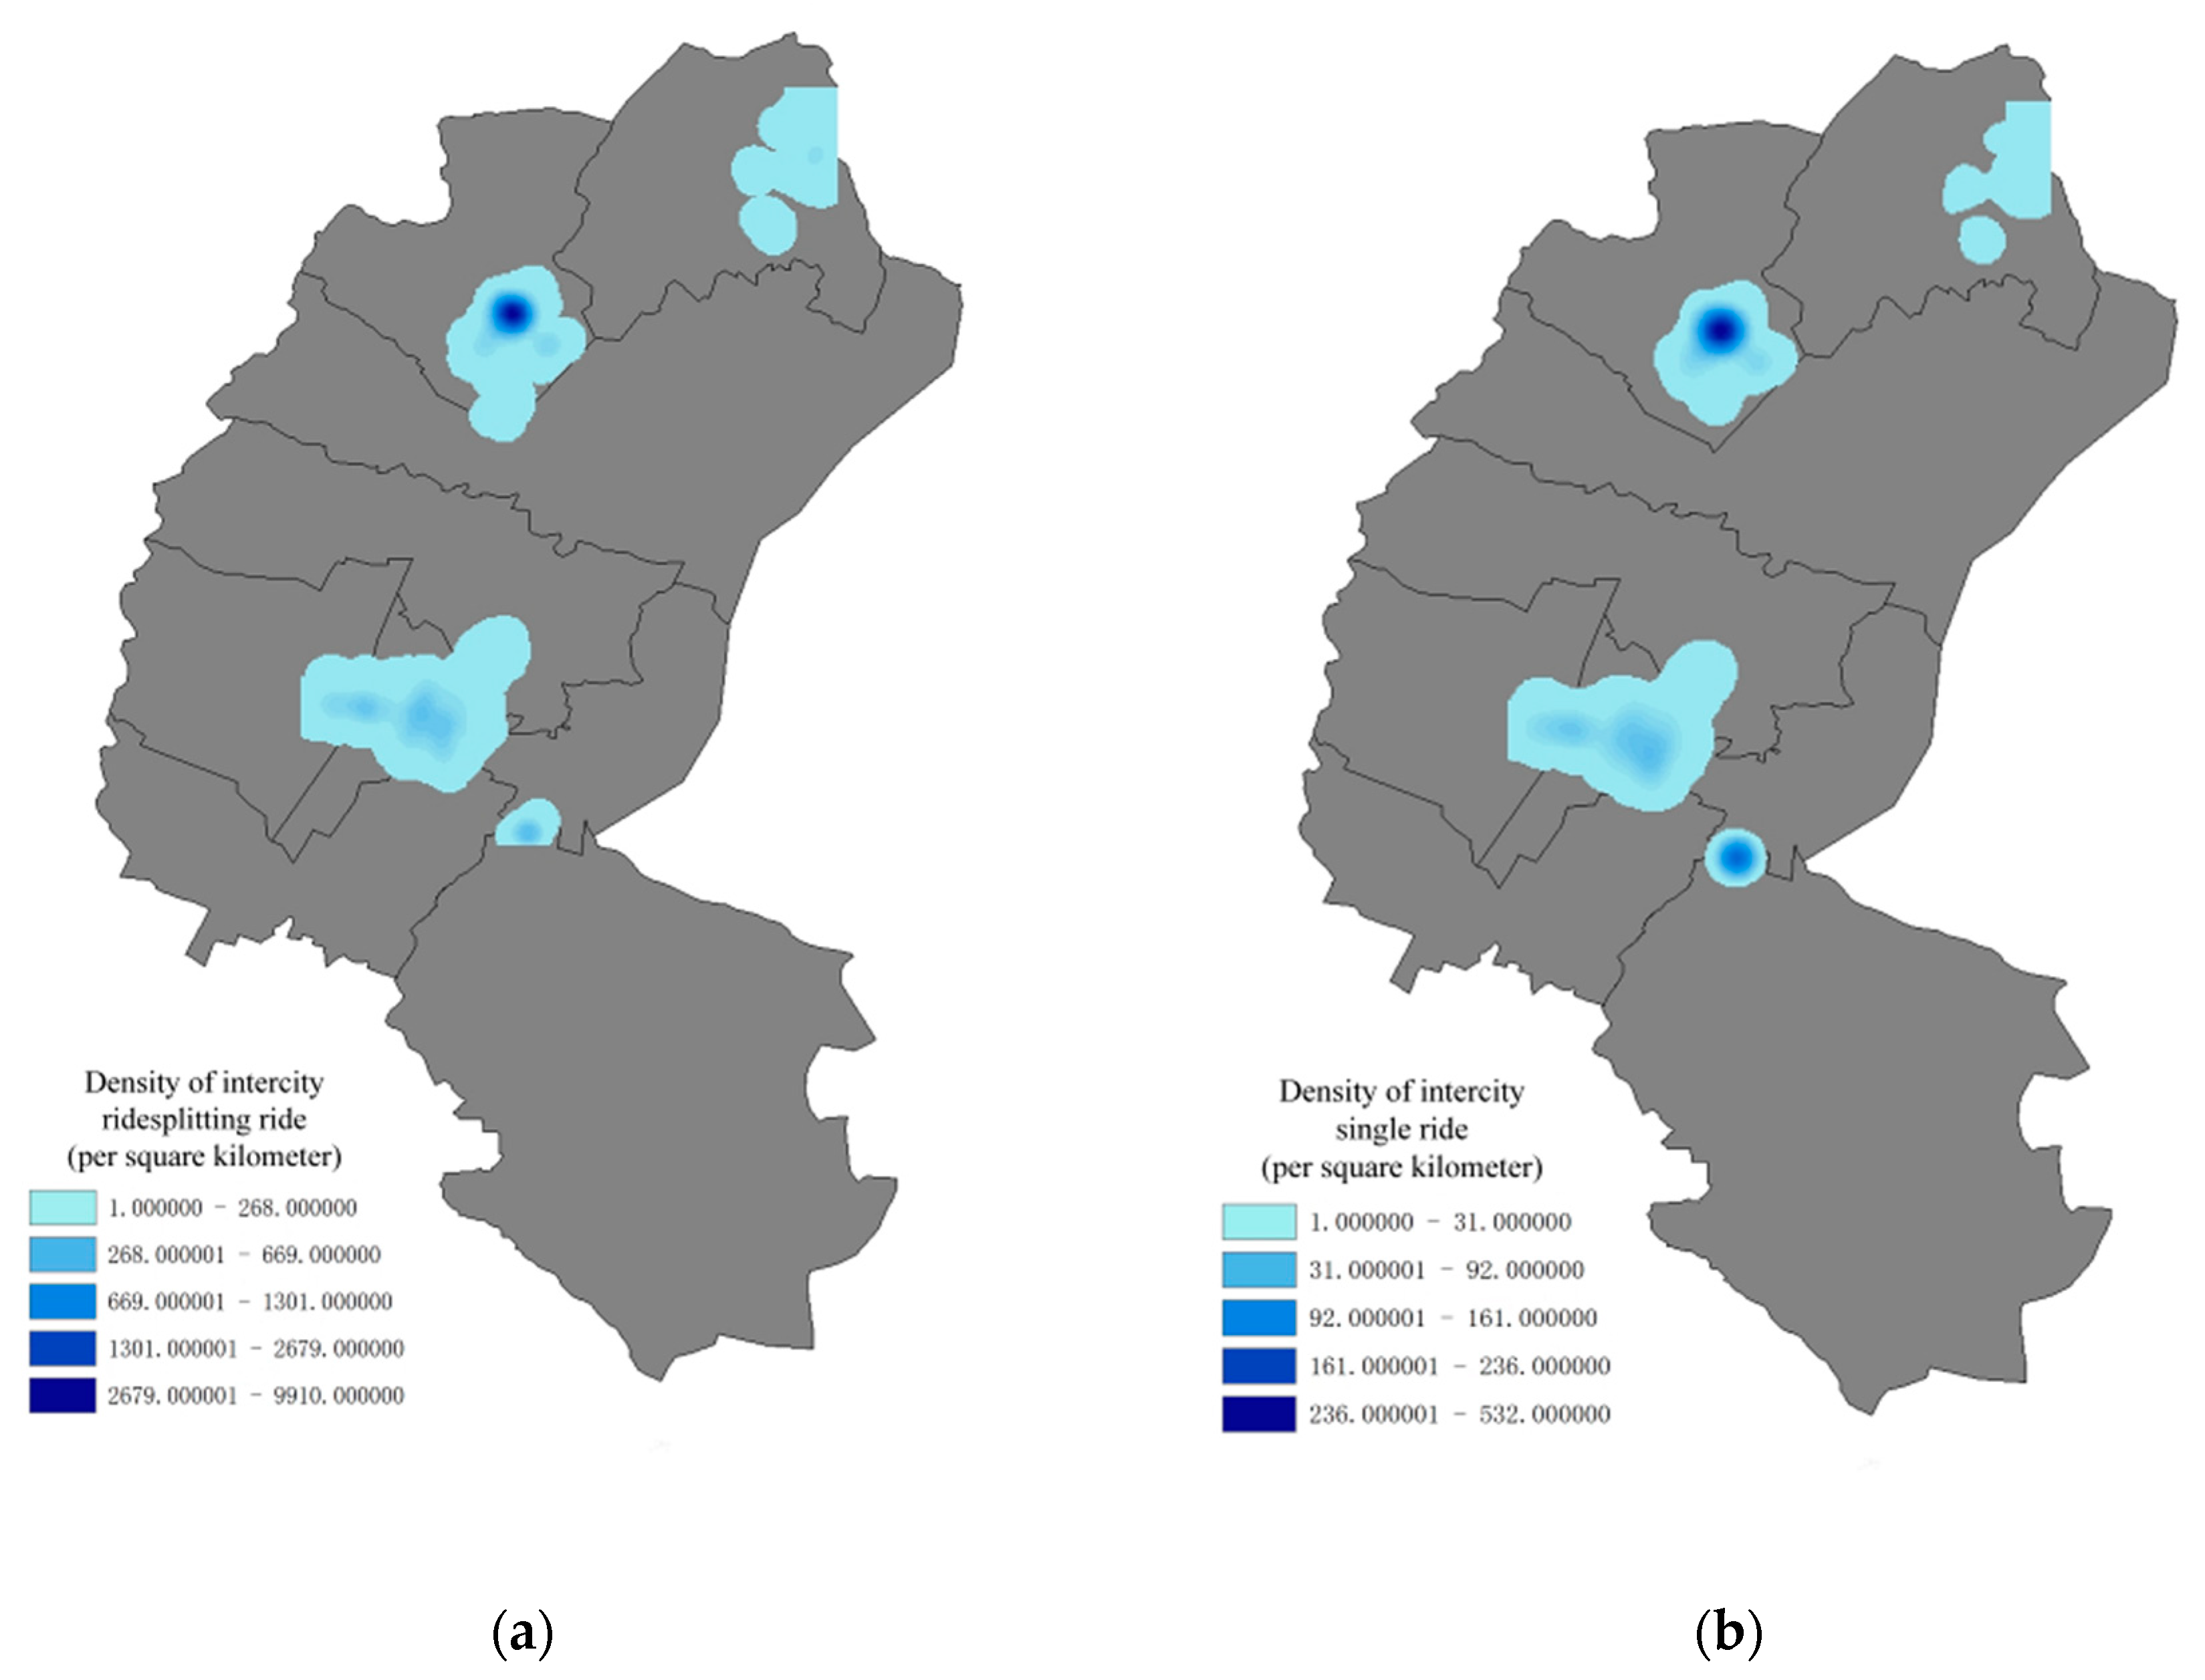
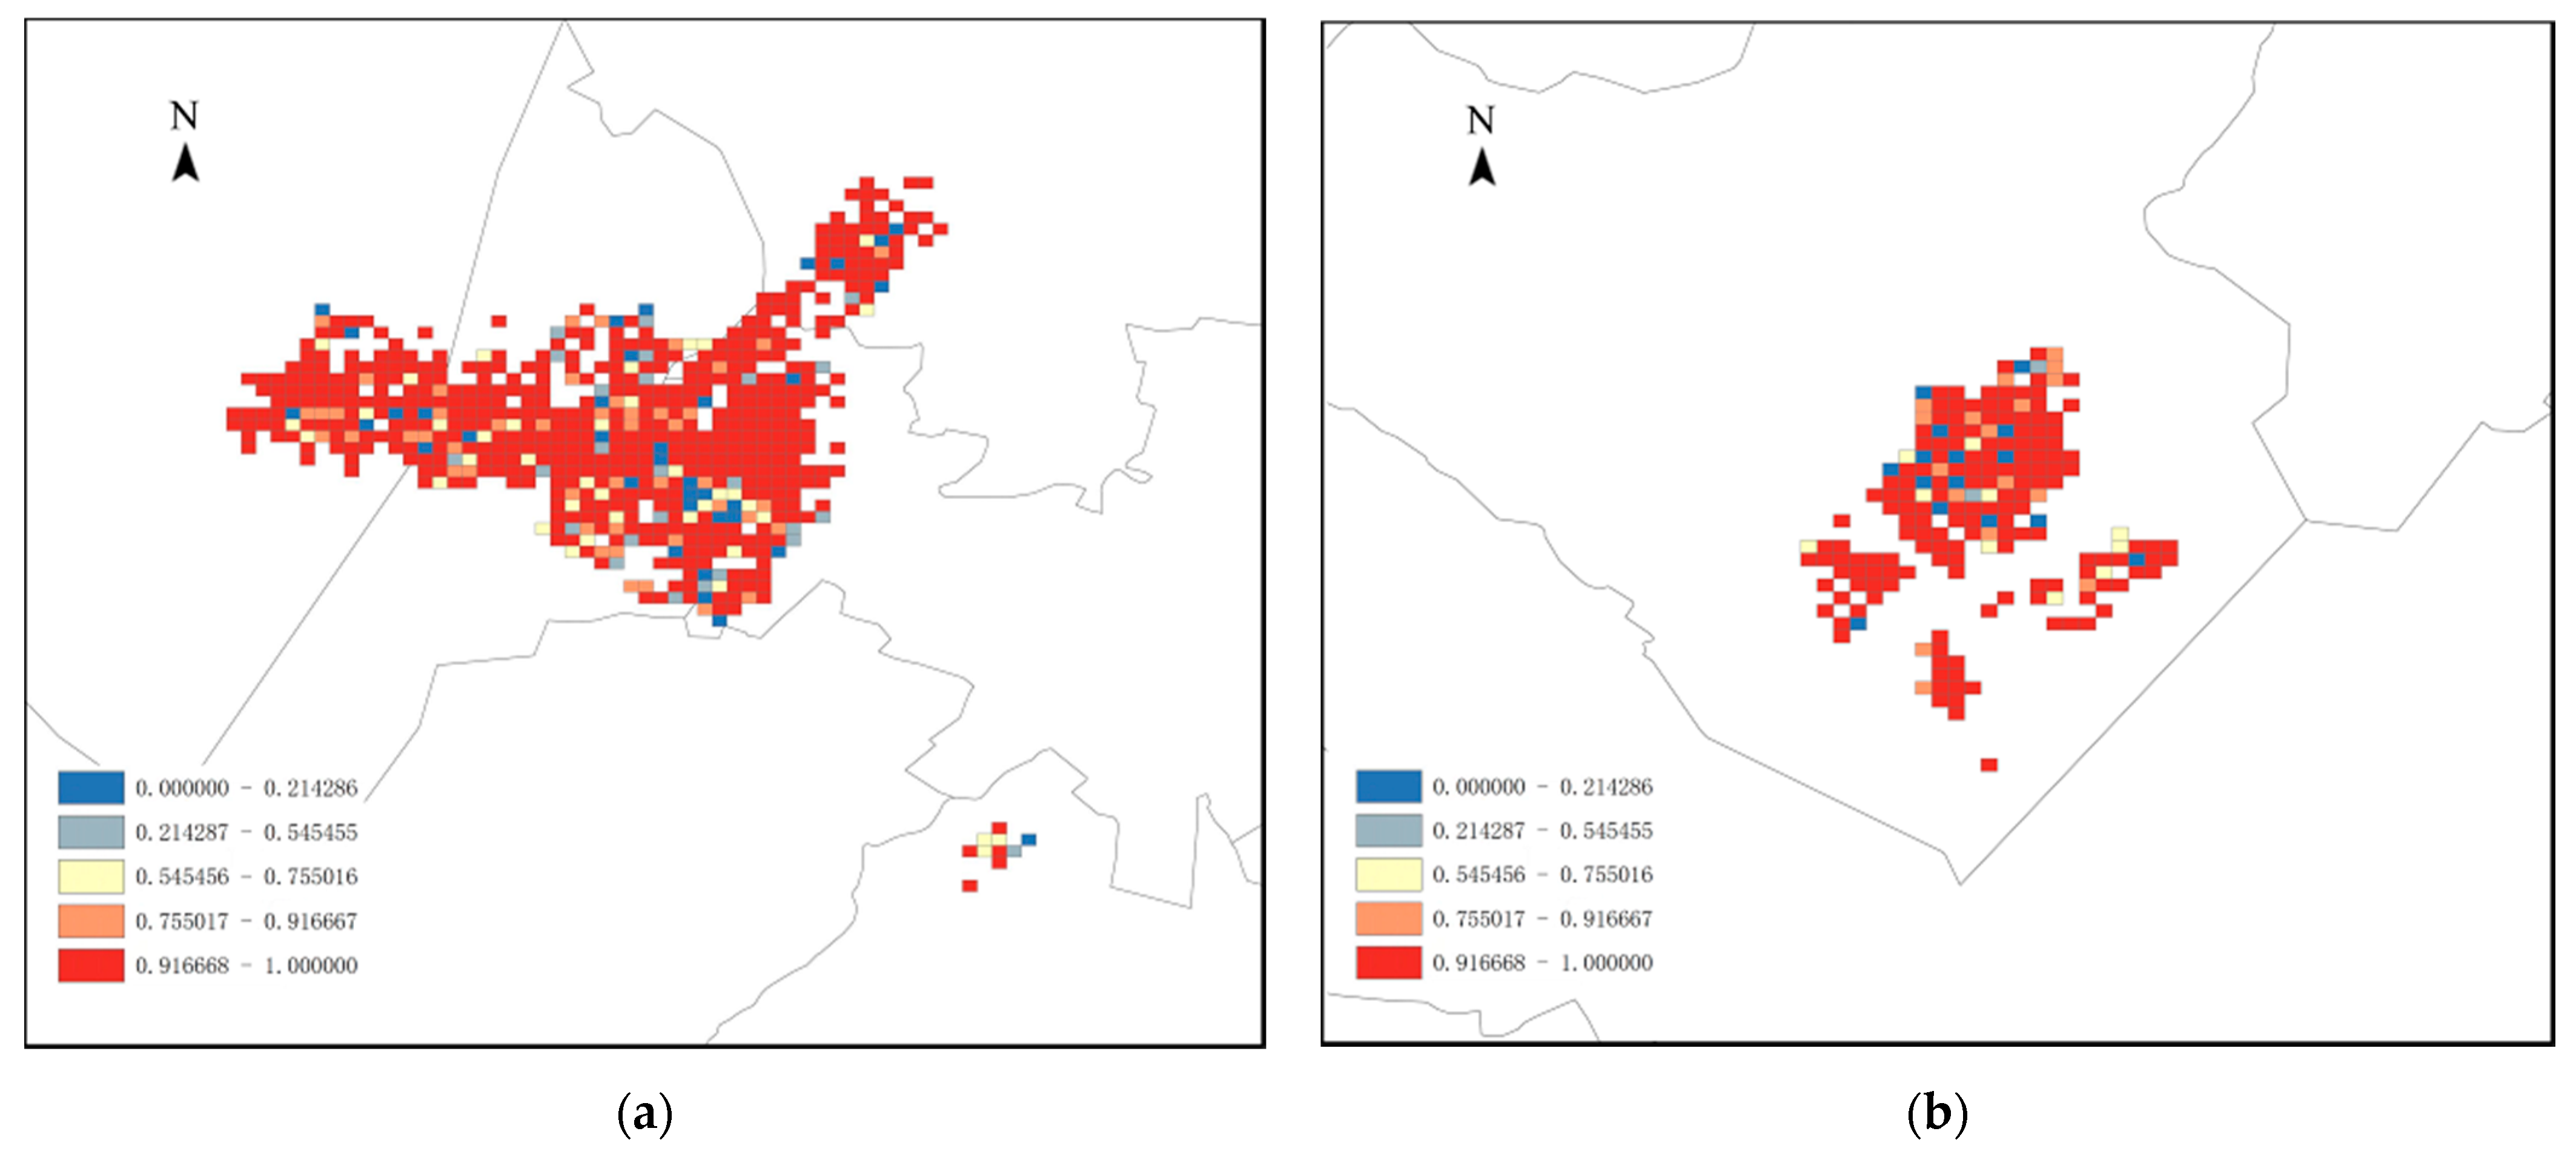
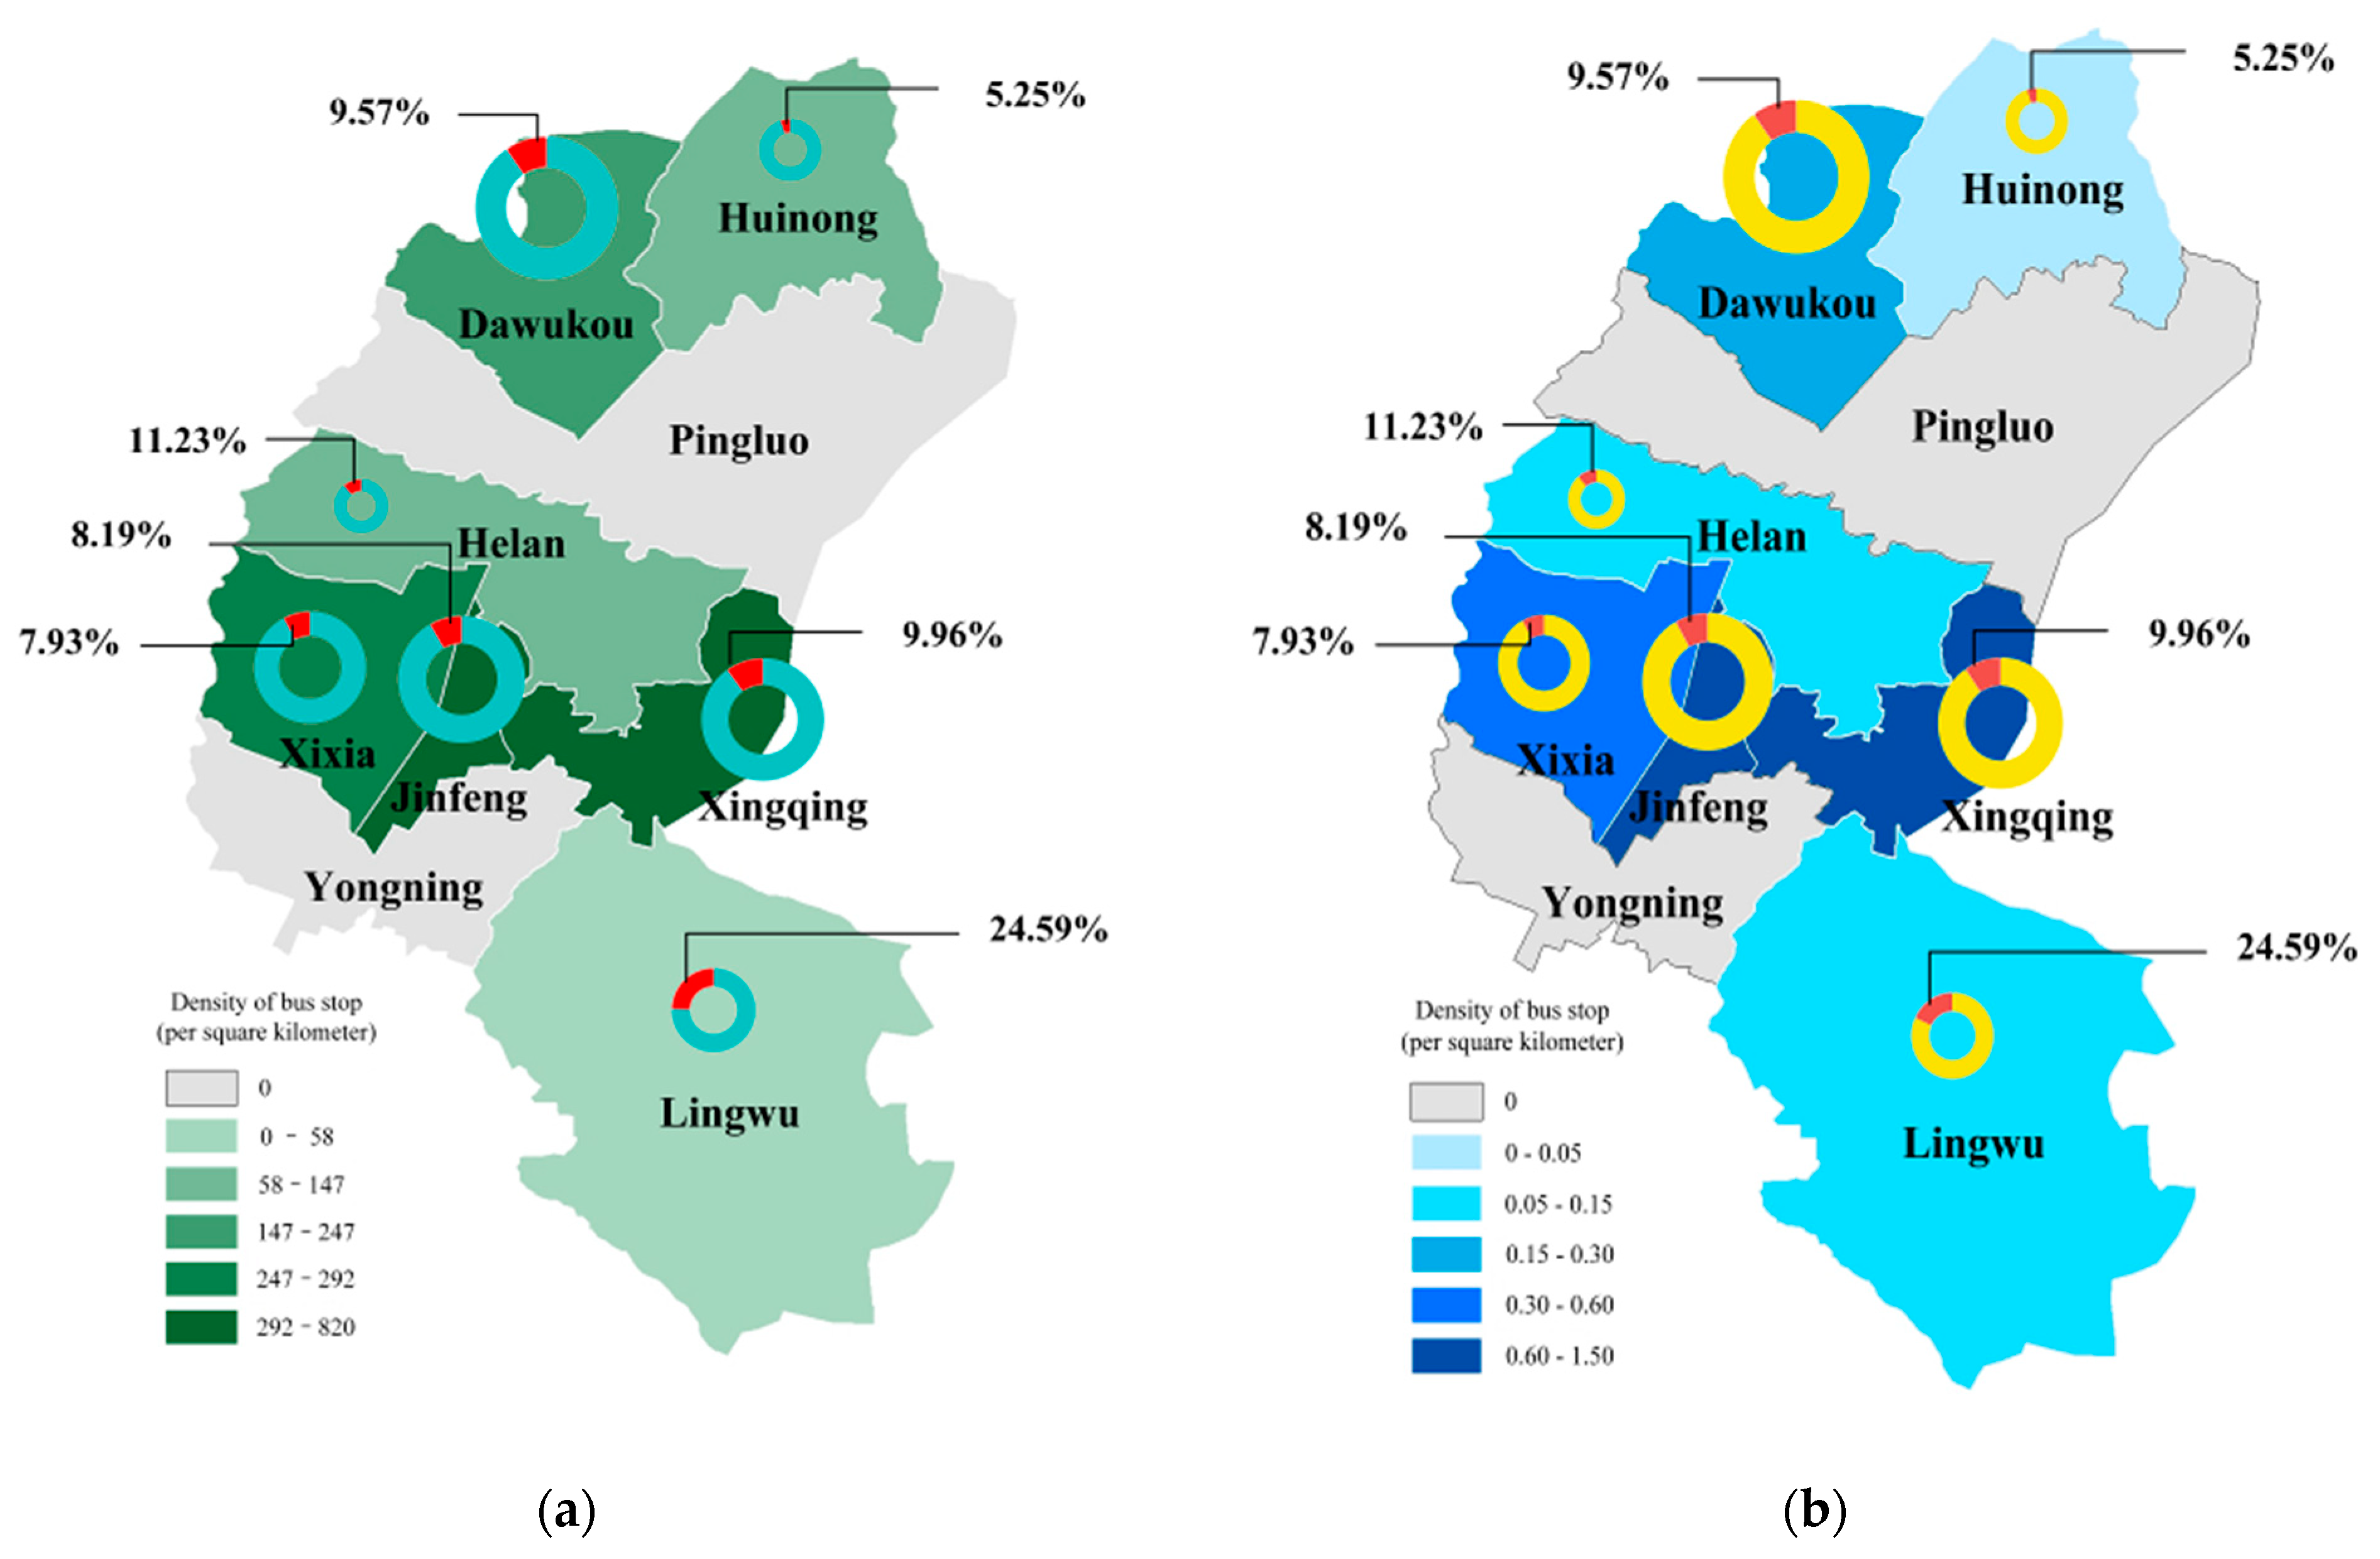
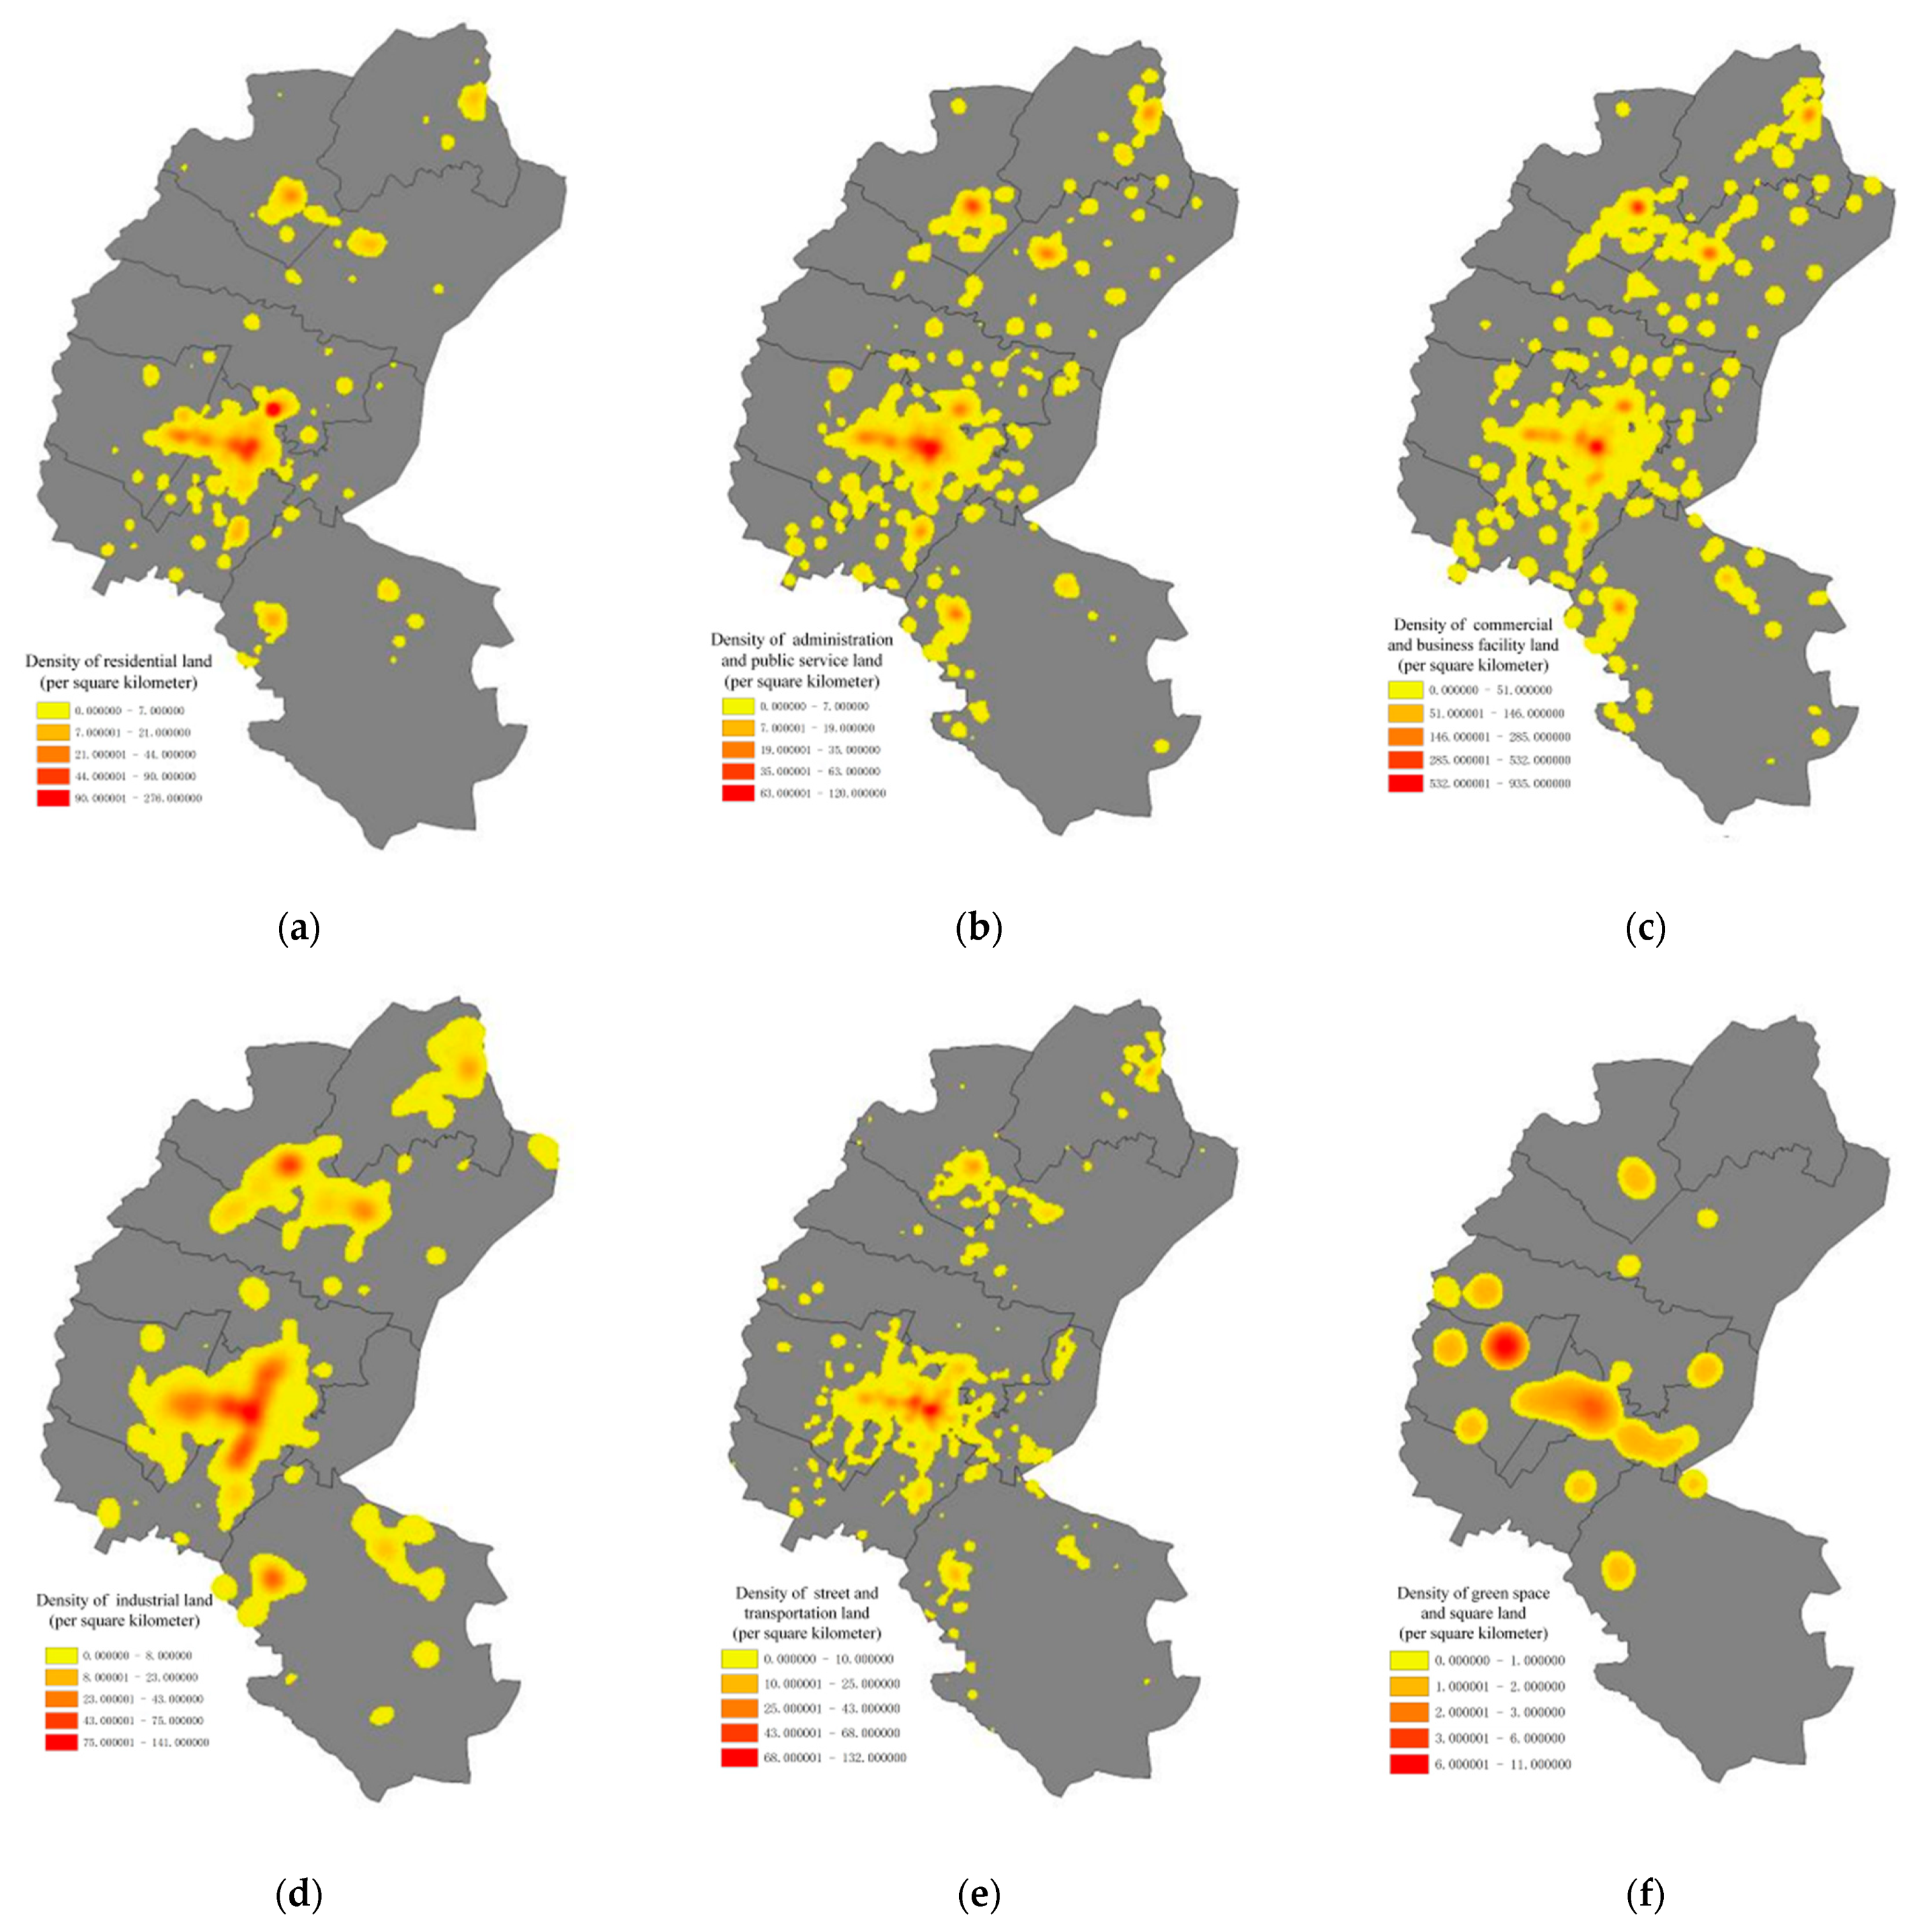
3.3.2. Spatial Factors Analysis
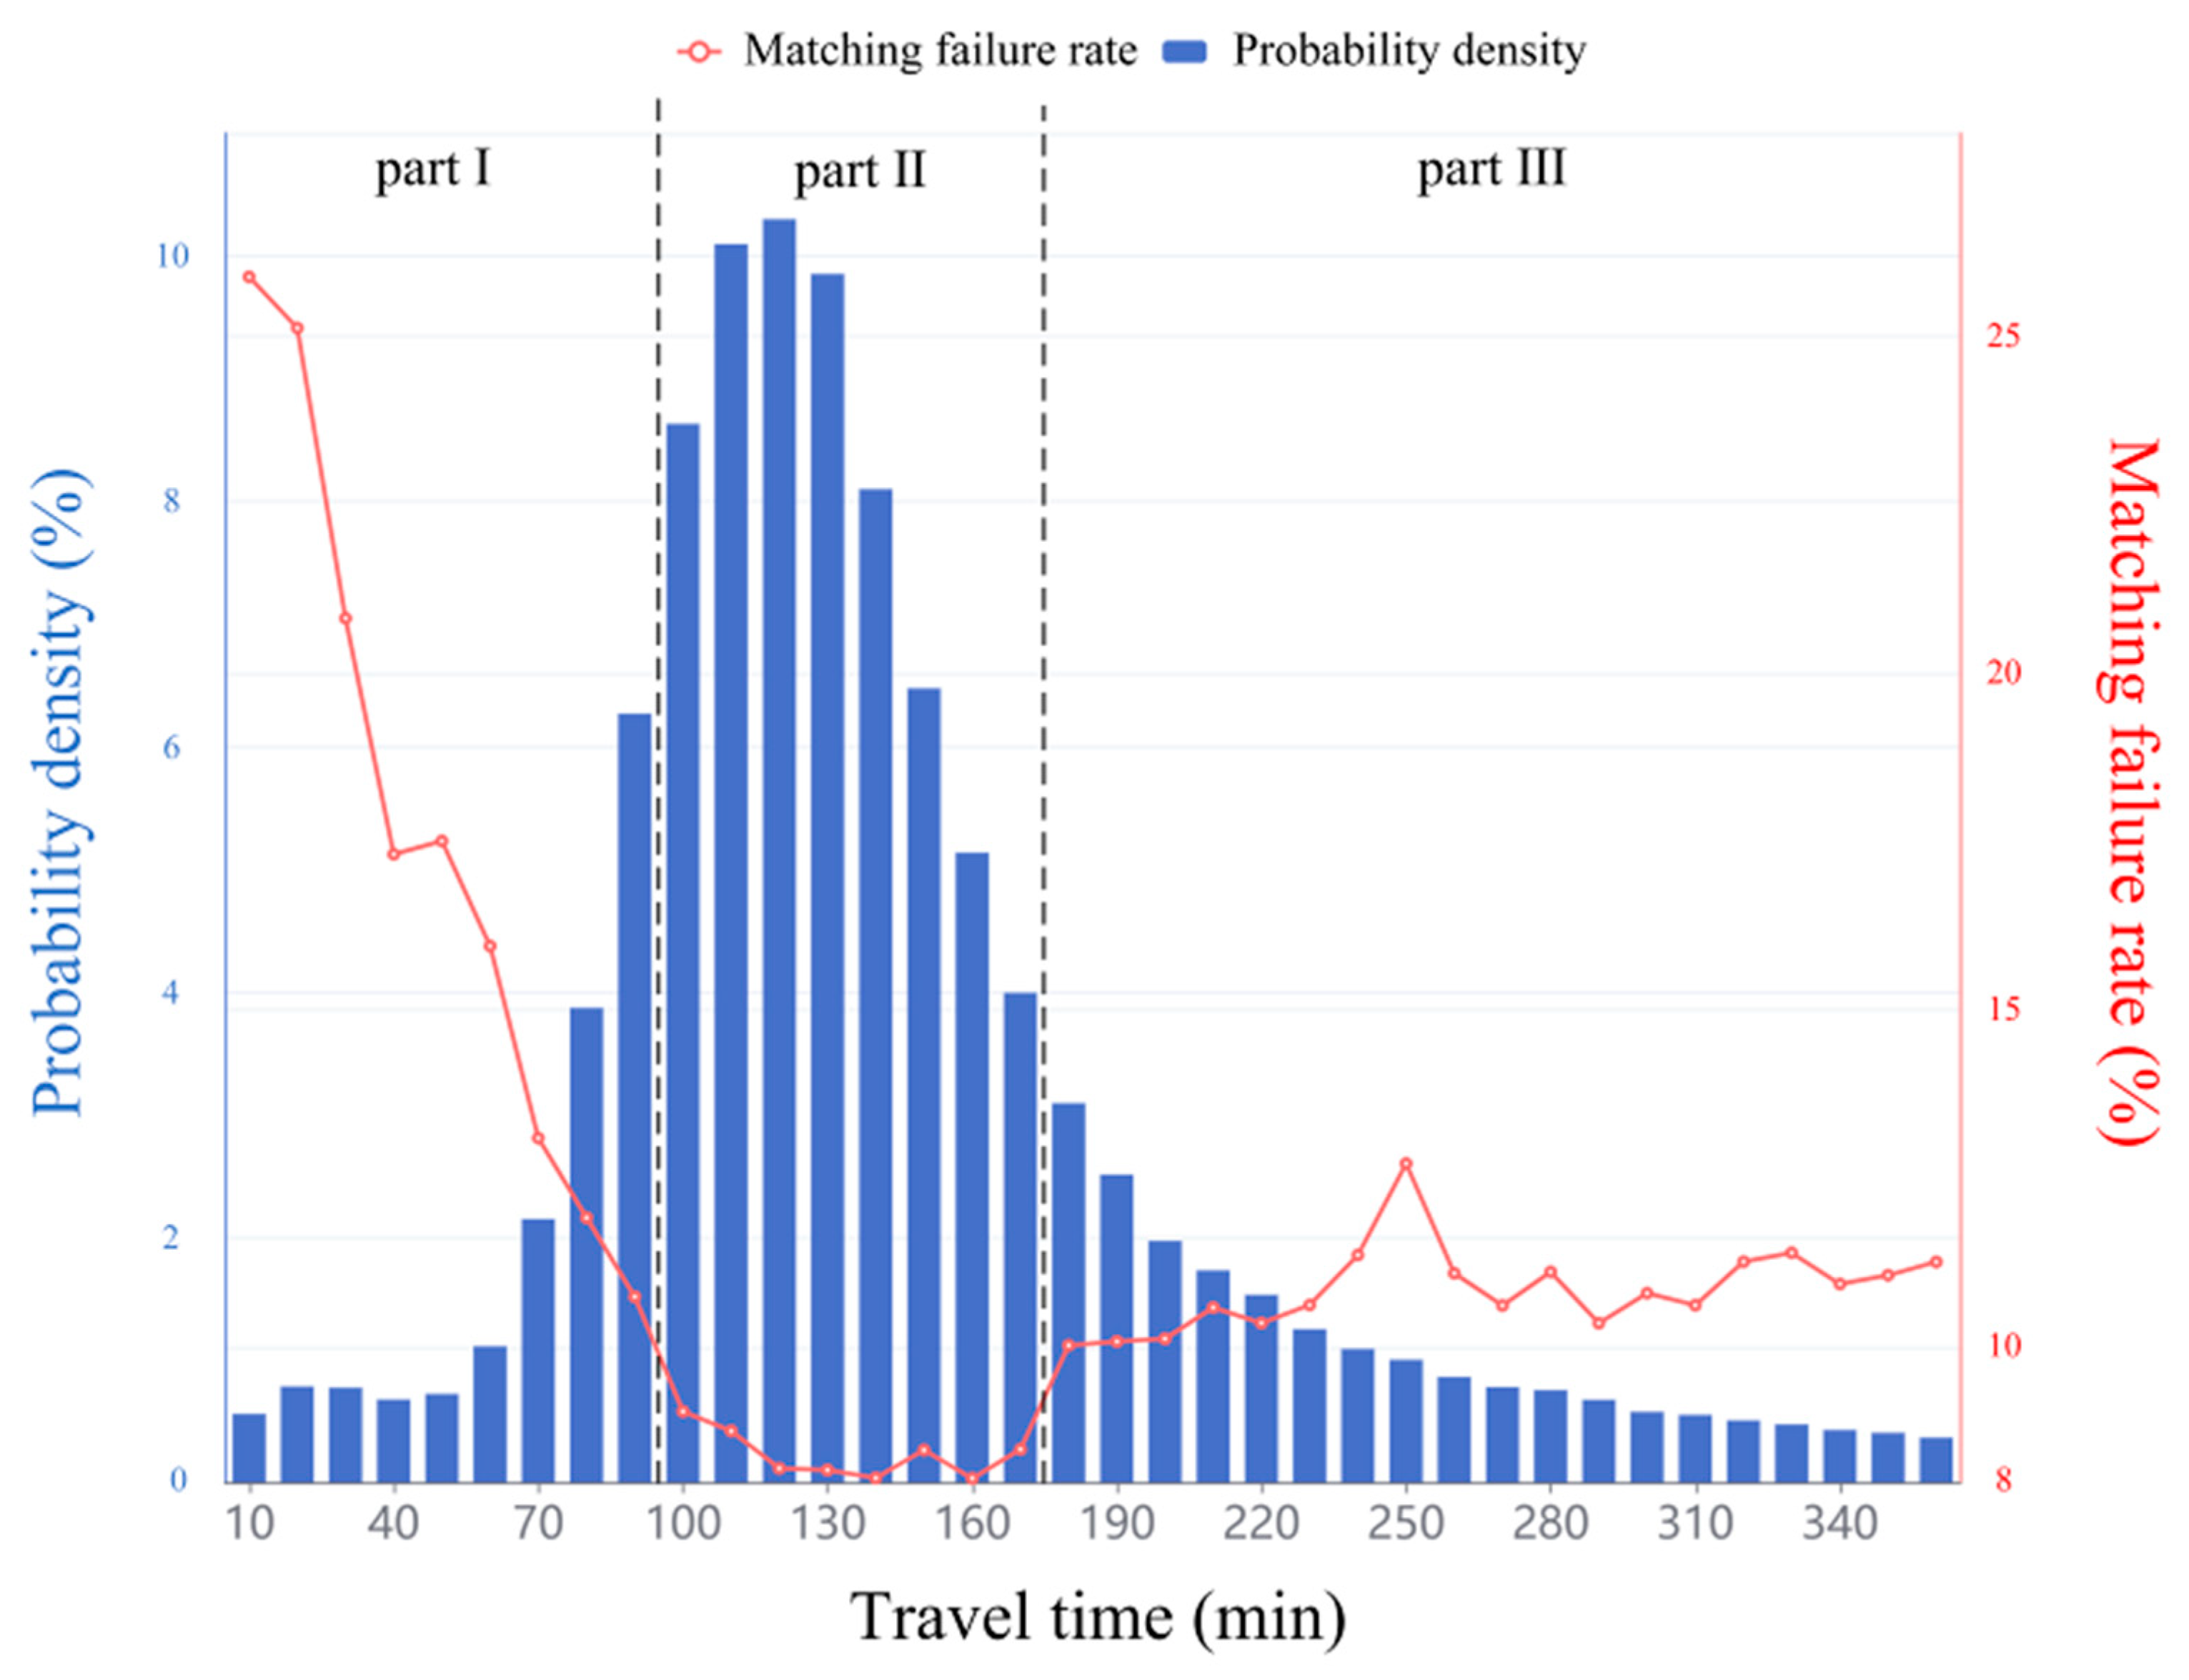
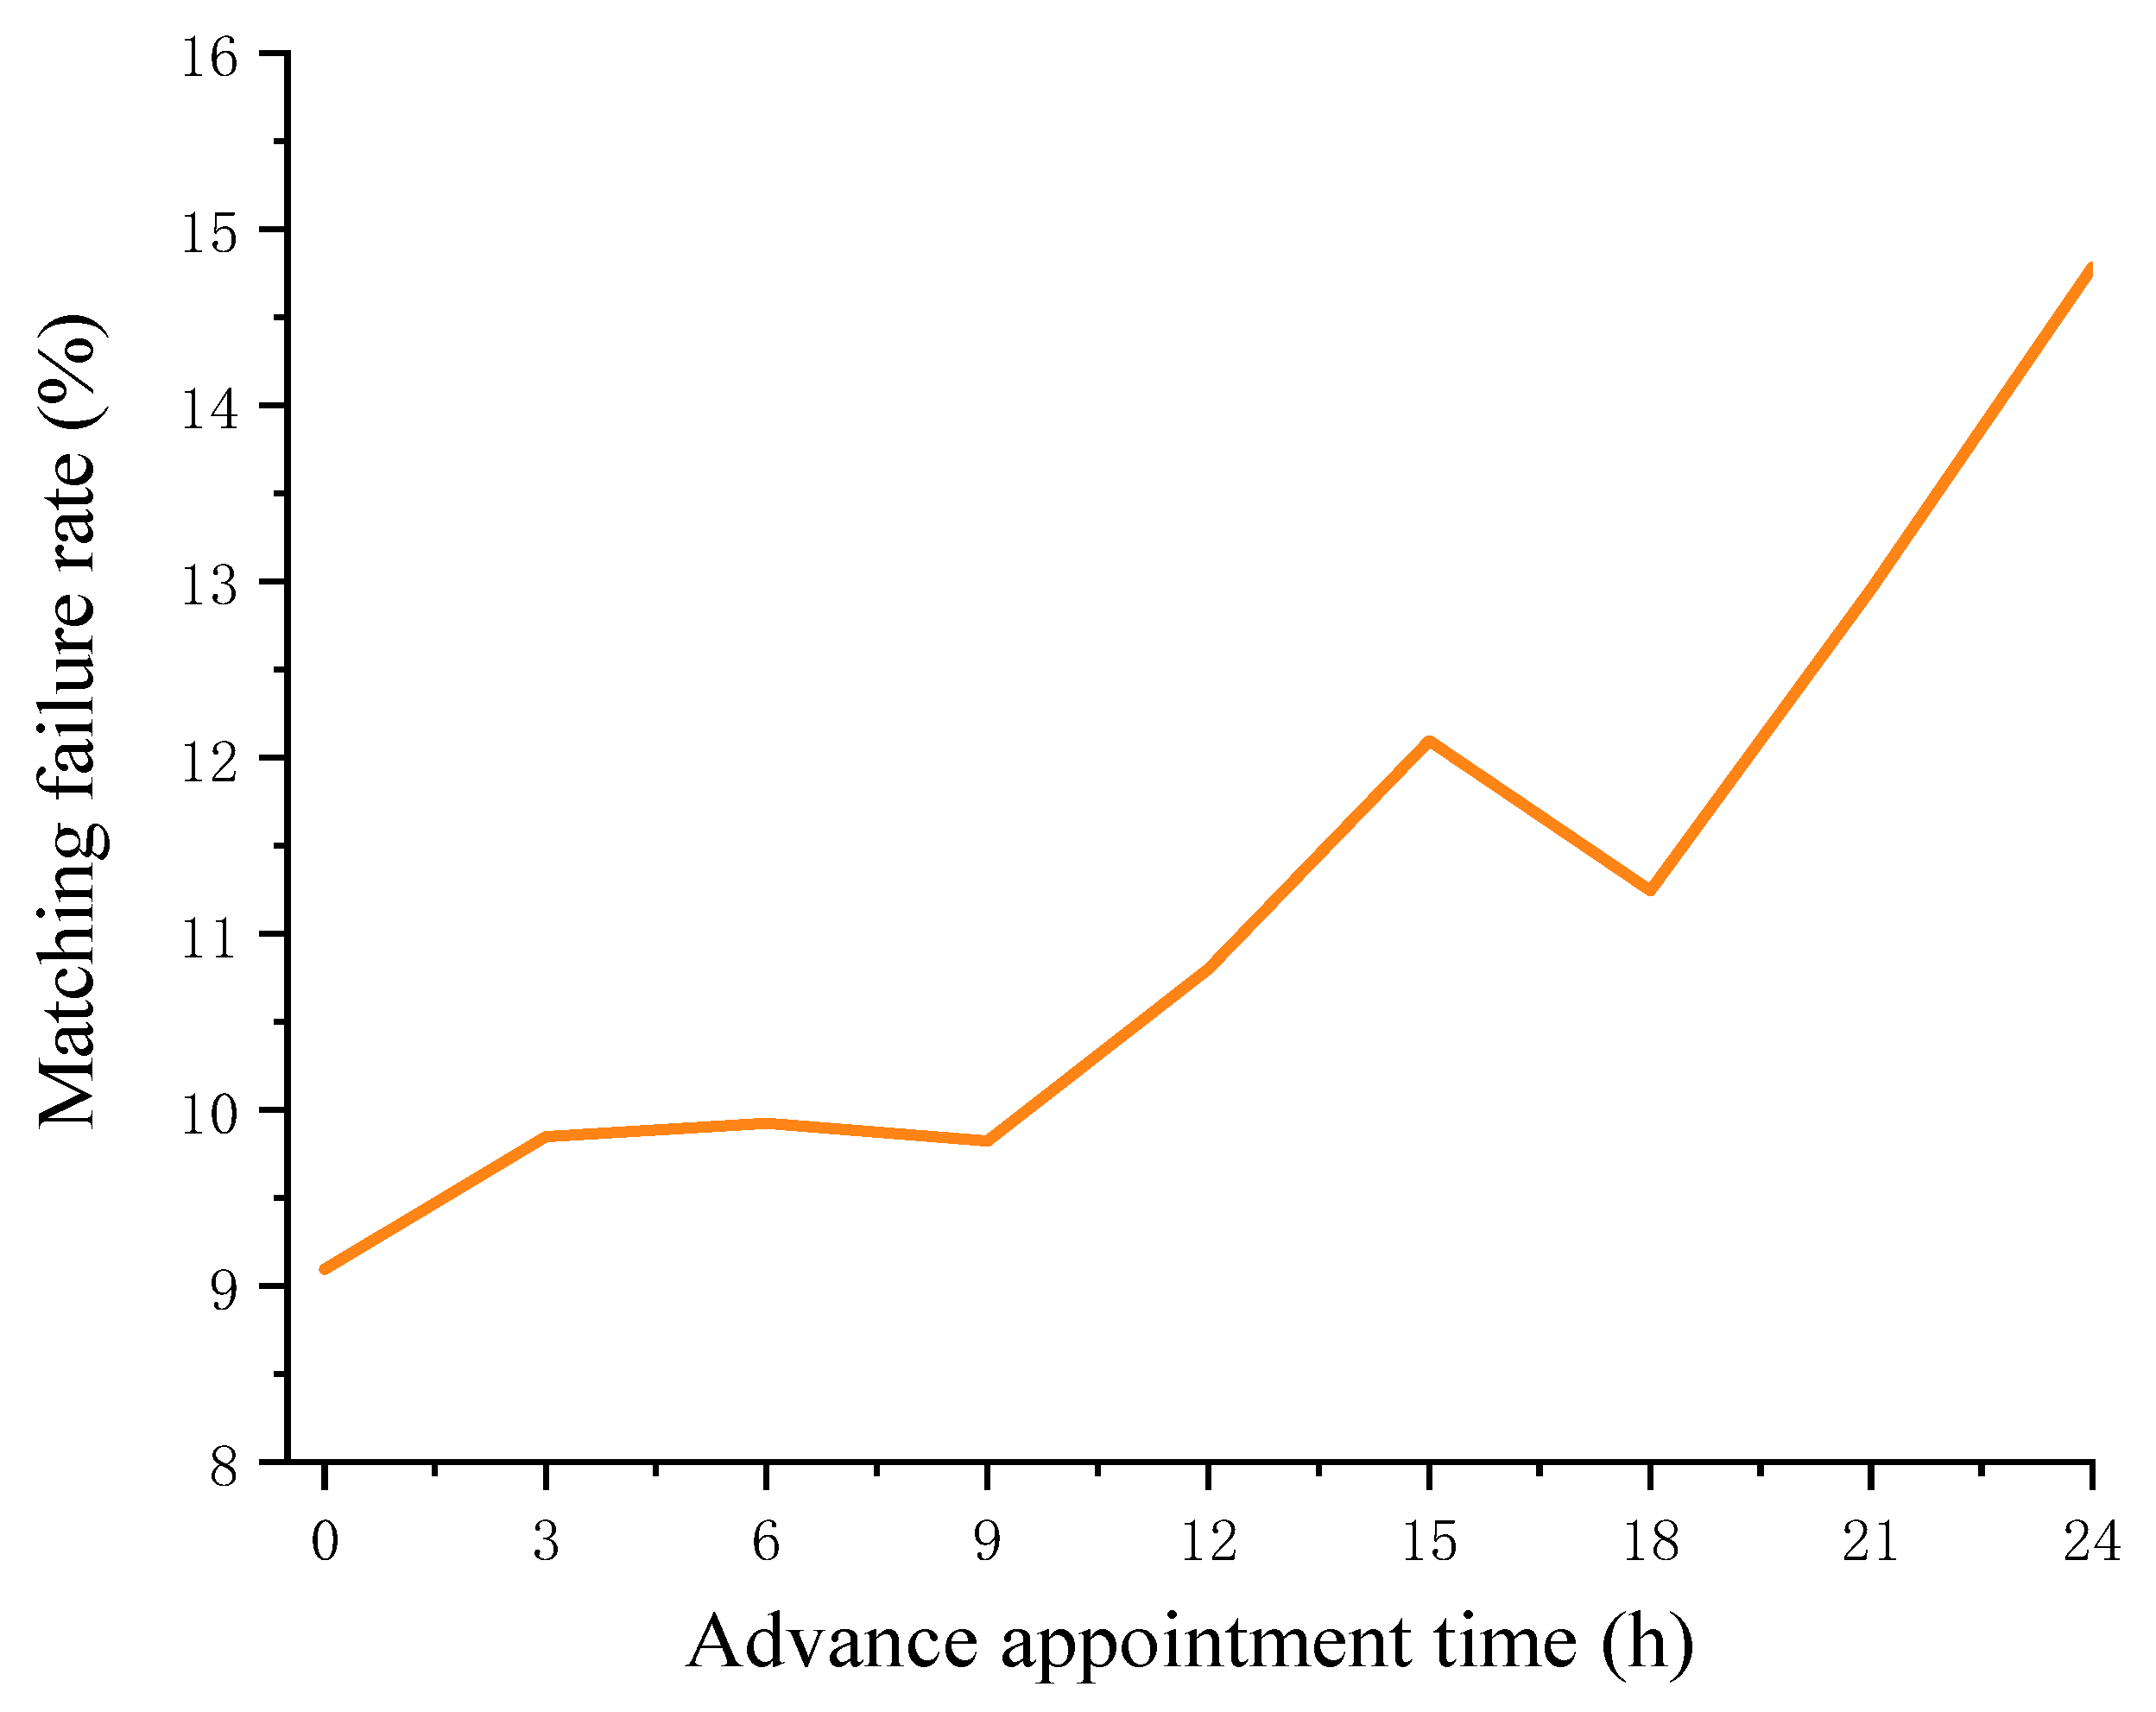
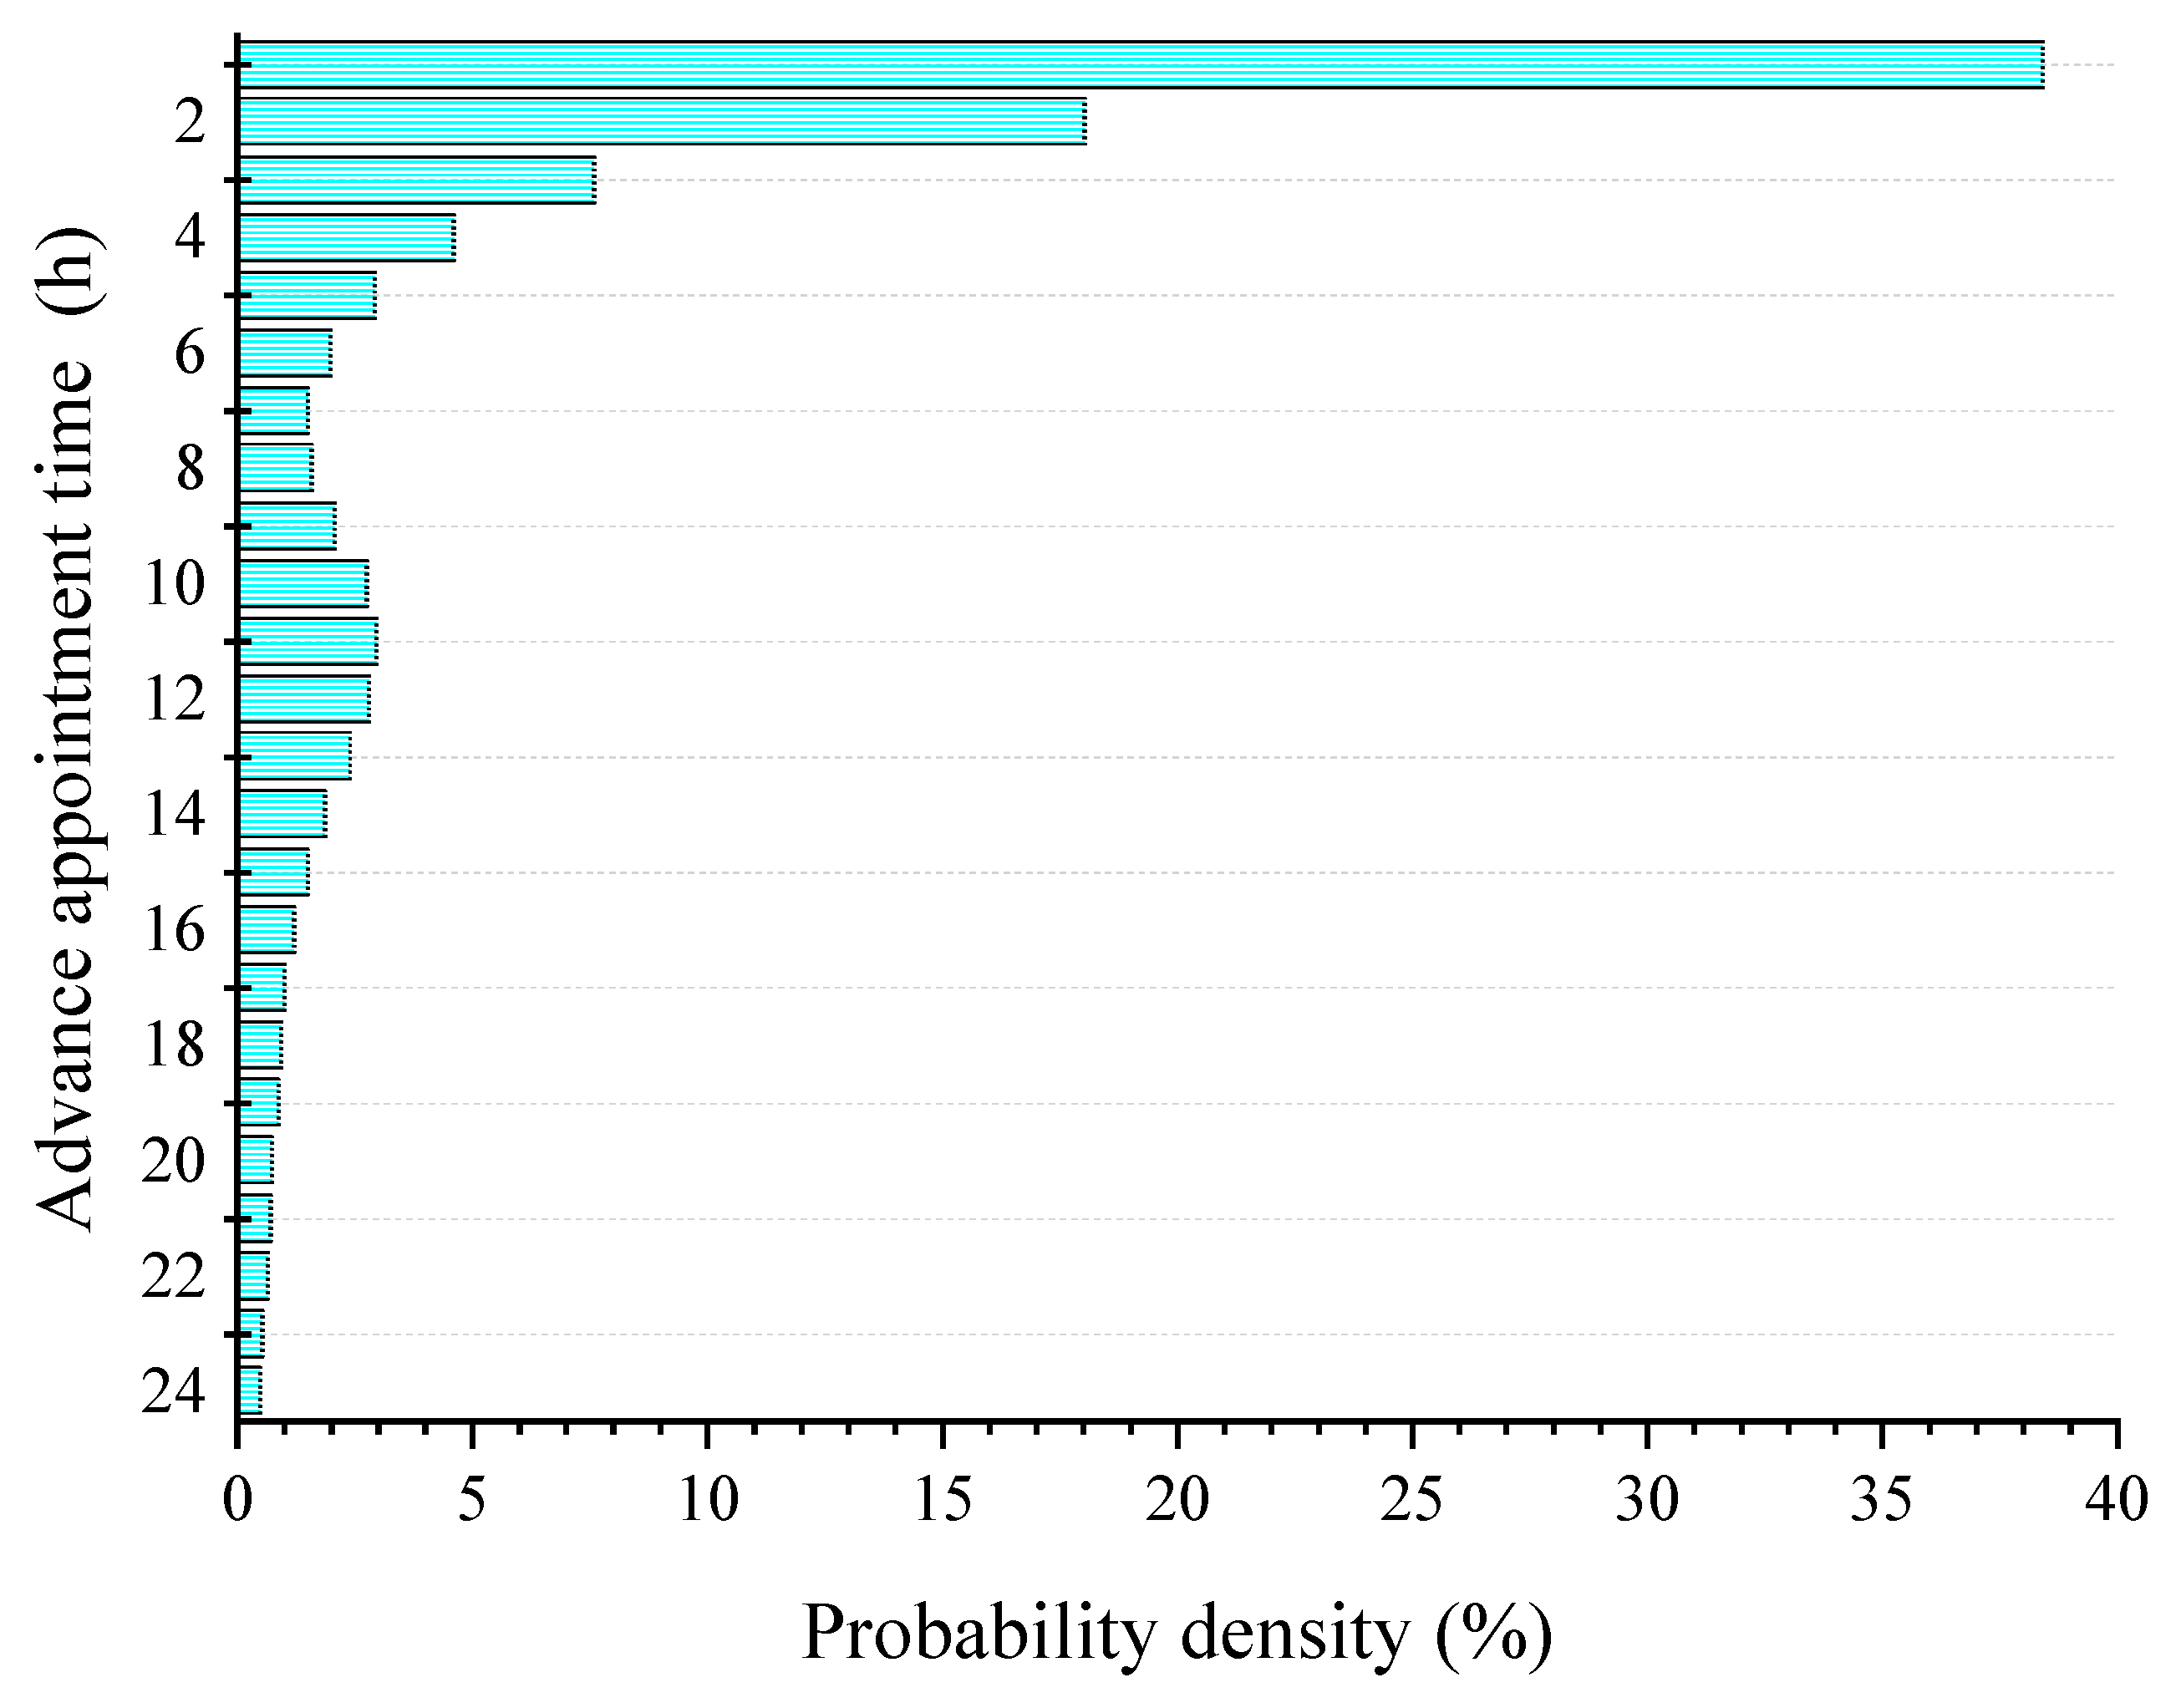
3.3.3. Travel Factors Analysis
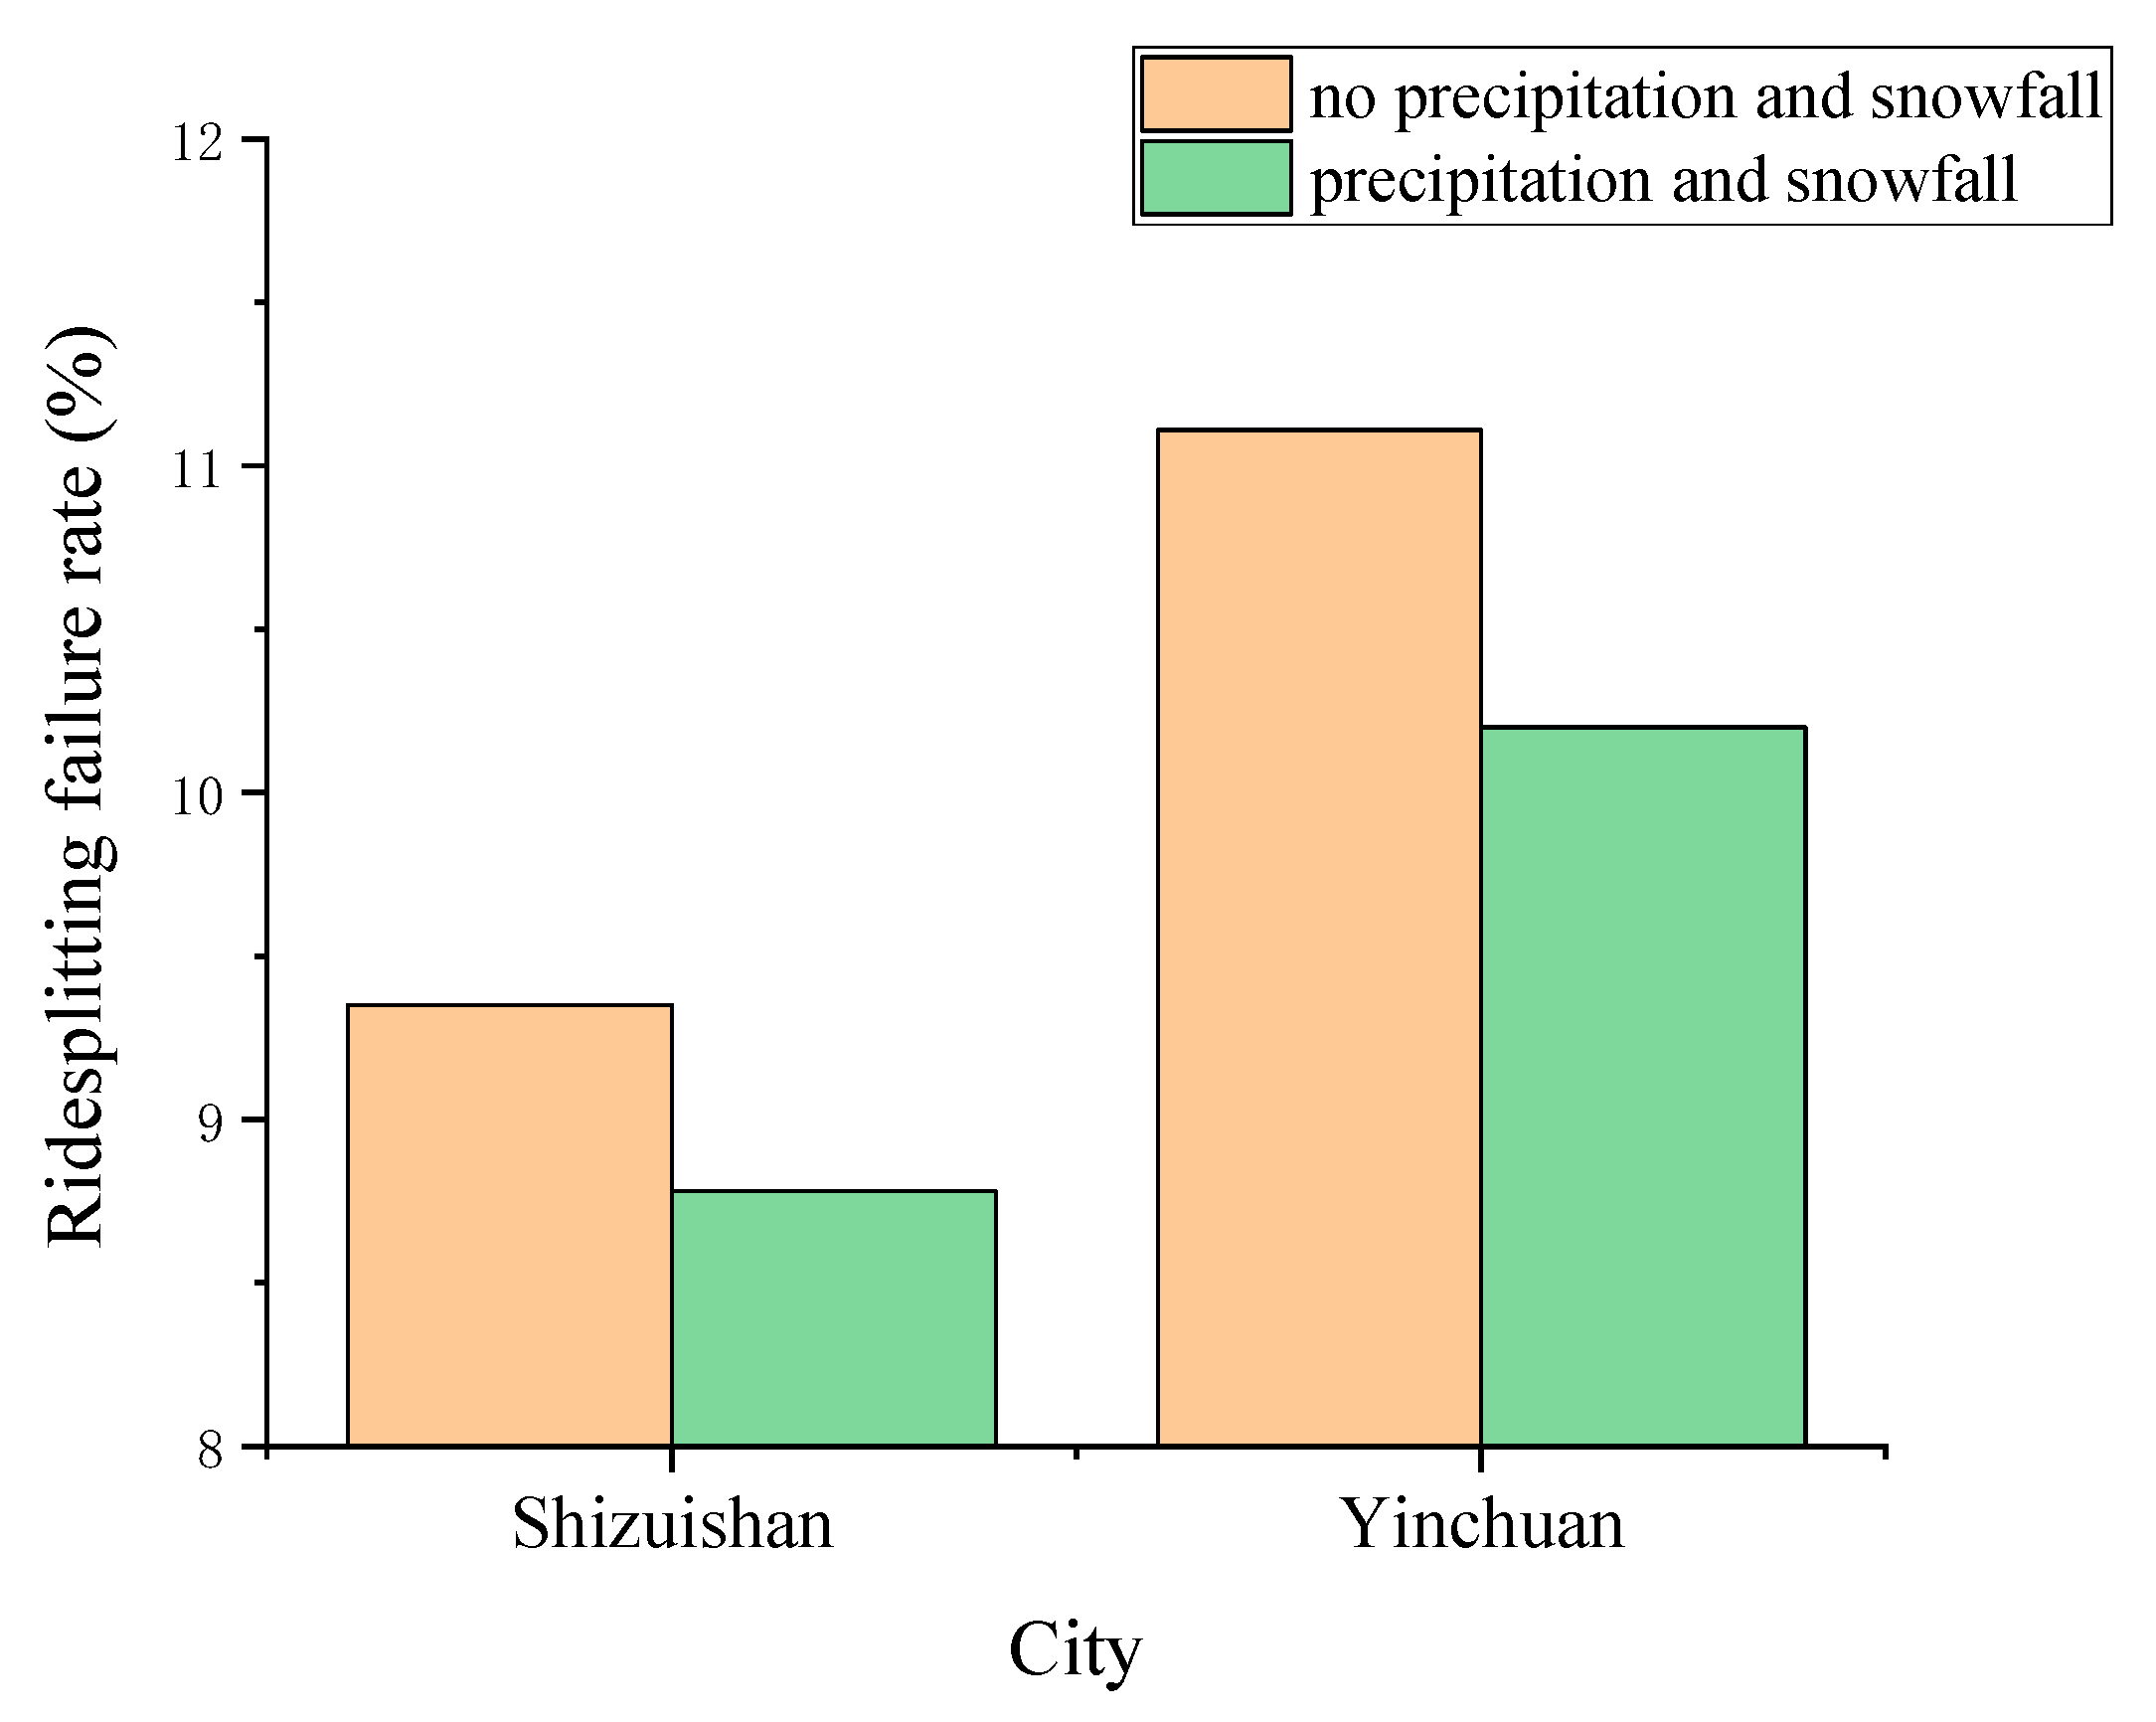
3.3.4. Weather Factors Analysis
4. Methodology
4.1. Binary Logistic Regression
4.2. Variable Descriptions
5. Results and Discussion
5.1. Significant Factors Influencing the Intercity Ridesplitting Matching Success Rate
5.2. Prediction Results
Author Contributions
Funding
Institutional Review Board Statement
Informed Consent Statement
Data Availability Statement
Conflicts of Interest
References
- Bi, H.; Ye, Z. Exploring ridesourcing trip patterns by fusing multi-source data: A big data approach. Sustain. Cities Soc. 2021, 64, 102499. [Google Scholar] [CrossRef]
- Sun, D.J.; Ding, X. Spatiotemporal evolution of ridesourcing markets under the new restriction policy: A case study in Shanghai. Transp. Res. Part A Policy Pract. 2019, 130, 227–239. [Google Scholar] [CrossRef]
- Jiang, W.; Zhang, L. The impact of the transportation network companies on the taxi industry: Evidence from Beijing’s GPS taxi trajectory data. IEEE Access 2018, 6, 12438–12450. [Google Scholar] [CrossRef]
- Shaheen, S.; Cohen, A.; Zohdy, I. Shared Mobility: Current Practices and Guiding Principles. U. S. Fed. Highw. Adm. 2016. [Google Scholar]
- Yu, B.; Ma, Y.; Xue, M.; Tang, B.; Wang, B.; Yan, J.; Wei, Y.-M. Environmental benefits from ridesharing: A case of Beijing. Appl. Energy 2017, 191, 141–152. [Google Scholar] [CrossRef]
- Xu, Y.; Yan, X.; Liu, X.; Zhao, X. Identifying key factors associated with ridesplitting adoption rate and modeling their nonlinear relationships. Transp. Res. Part A Policy Pract. 2021, 144, 170–188. [Google Scholar] [CrossRef]
- Chuxing, D. 2020 Green Travel White Paper on Didi Platform. Available online: http://doc.baige.me/view/U3I (accessed on 5 May 2021).
- Monchambert, G. Why do (or don’t) people carpool for long distance trips? A discrete choice experiment in France. Transp. Res. Part A Policy Pract. 2020, 132, 911–931. [Google Scholar] [CrossRef]
- Kong, H.; Zhang, X.; Zhao, J. How does ridesourcing substitute for public transit? A geospatial perspective in Chengdu, China. J. Transp. Geogr. 2020, 86, 102769. [Google Scholar] [CrossRef]
- Wang, Z.; Chen, X.; Chen, X.M. Ridesplitting is shaping young people’s travel behavior: Evidence from comparative survey via ride-sourcing platform. Transp. Res. Part D Transp. Environ. 2019, 75, 57–71. [Google Scholar] [CrossRef]
- Li, W.; Pu, Z.; Li, Y.; Ban, X. Characterization of ridesplitting based on observed data: A case study of Chengdu, China. Transp. Res. Part C Emerg. Technol. 2019, 100, 330–353. [Google Scholar] [CrossRef]
- Chen, X.; Zheng, H.; Wang, Z.; Chen, X. Exploring impacts of on-demand ridesplitting on mobility via real-world ridesourcing data and questionnaires. Transportation 2021, 48, 1541–1561. [Google Scholar] [CrossRef]
- Chen, X.M.; Zahiri, M.; Zhang, S. Understanding ridesplitting behavior of on-demand ride services: An ensemble learning approach. Transp. Res. Part C Emerg. Technol. 2017, 76, 51–70. [Google Scholar] [CrossRef]
- Tu, M.; Li, W.; Orfila, O.; Li, Y.; Gruyer, D. Exploring nonlinear effects of the built environment on ridesplitting: Evidence from Chengdu. Transp. Res. Part D Transp. Environ. 2021, 93, 102776. [Google Scholar] [CrossRef]
- Fang, C.L. Progress and the future direction of research into urban agglomeration in China. Acta Geogr. Sin. 2014, 69, 1130–1144. [Google Scholar]
- Dawes, M. Perspectives on the Ridesourcing Revolution: Surveying Individual Attitudes toward Uber and Lyft to Inform Urban Transportation Policymaking; Massachusetts Institute of Technology: Cambridge, MA, USA, 2016. [Google Scholar]
- Kong, H.; Zhang, X.; Zhao, J. Is ridesourcing more efficient than taxis? Appl. Geogr. 2020, 125, 102301. [Google Scholar] [CrossRef]
- Rayle, L.; Dai, D.; Chan, N.; Cervero, R.; Shaheen, S. Just a better taxi? A survey-based comparison of taxis, transit, and ridesourcing services in San Francisco. Transp. Policy 2016, 45, 168–178. [Google Scholar] [CrossRef] [Green Version]
- Zhen, C. Impact of Ride-Sourcing Services on Travel Habits and Transportation Planning; University of Pittsburgh: Pittsburgh, PA, USA, 2015. [Google Scholar]
- Lavieri, P.S.; Dias, F.F.; Juri, N.R.; Kuhr, J.; Bhat, C.R. A model of ridesourcing demand generation and distribution. Transp. Res. Rec. 2018, 2672, 31–40. [Google Scholar] [CrossRef] [Green Version]
- Wang, X.; Liu, W.; Yang, H.; Wang, D.; Ye, J. Customer behavioural modelling of order cancellation in coupled ride-sourcing and taxi markets. Transp. Res. Part B Methodol. 2020, 132, 358–378. [Google Scholar] [CrossRef]
- Yu, H.; Peng, Z.R. Exploring the spatial variation of ridesourcing demand and its relationship to built environment and socioeconomic factors with the geographically weighted Poisson regression. J. Transp. Geogr. 2019, 75, 147–163. [Google Scholar] [CrossRef]
- Yan, X.; Levine, J.; Zhao, X. Integrating ridesourcing services with public transit: An evaluation of traveler responses combining revealed and stated preference data. Transp. Res. Part C Emerg. Technol. 2019, 105, 683–696. [Google Scholar] [CrossRef]
- Ghaffar, A.; Mitra, S.; Hyland, M. Modeling determinants of ridesourcing usage: A census tract-level analysis of Chicago. Transp. Res. Part C Emerg. Technol. 2020, 119, 102769. [Google Scholar] [CrossRef]
- Dias, F.F.; Lavieri, P.S.; Garikapati, V.M.; Astroza, S.; Pendyala, R.M.; Bhat, C.R. A behavioral choice model of the use of car-sharing and ride-sourcing services. Transportation 2017, 44, 1307–1323. [Google Scholar] [CrossRef]
- Bao, J.; Liu, P.; Blythe, P.; Wu, J. Exploring contributing factors to the usage of ridesourcing and regular taxi services with high-resolution GPS data set. In Proceedings of the Transportation Research Board 97th Annual Meeting, Washington, DC, USA, 7–11 January 2018. [Google Scholar]
- Yang, H.; Liang, Y.; Yang, L. Equitable? Exploring ridesourcing waiting time and its determinants. Transp. Res. Part D Transp. Environ. 2021, 93, 102774. [Google Scholar] [CrossRef]
- Hoffmann, K.; Ipeirotis, P.; Sundararajan, A. Ridesharing and the use of public transportation. Int. Conf. Inf. Syst. 2016. [Google Scholar]
- Henao, A. Impacts of Ridesourcing-Lyft and Uber-on Transportation Including VMT, Mode Replacement, Parking, and Travel Behavior; University of Colorado at Denver: Denver, CO, USA, 2017. [Google Scholar]
- Feigon, S.; Murphy, C. Shared Mobility and the Transformation of Public Transit; TCRP Research Report 188; The National Academy Press: Washington, DC, USA, 2016. [Google Scholar]
- Nie, Y.M. How can the taxi industry survive the tide of ridesourcing? Evidence from Shenzhen, China. Transp. Res. Part C Emerg. Technol. 2017, 79, 242–256. [Google Scholar] [CrossRef]
- Di, X.; Ma, R.; Liu, H.X.; Ban, X. A link-node reformulation of ridesharing user equilibrium with network design. Transp. Res. Part B Methodol. 2018, 112, 230–255. [Google Scholar] [CrossRef]
- Ma, J.; Xu, M.; Meng, Q.; Cheng, L. Ridesharing user equilibrium problem under OD-based surge pricing strategy. Transp. Res. Part B Methodol. 2020, 134, 1–24. [Google Scholar] [CrossRef]
- Xu, H.; Pang, J.S.; Ordóñez, F.; Dessouky, M. Complementarity models for traffic equilibrium with ridesharing. Transp. Res. Part B Methodol. 2015, 81, 161–182. [Google Scholar] [CrossRef]
- Tu, M.; Li, Y.; Li, W.; Tu, M.; Orfila, O.; Gruyer, D.; Ban, X. Improving ridesplitting services using optimization procedures on a shareability network: A case study of Chengdu. Technol. Forecast. Soc. Chang. 2019, 149, 119733. [Google Scholar] [CrossRef]
- Zhu, Z.; Qin, X.; Ke, J.; Zheng, Z.; Yang, H. Analysis of multi-modal commute behavior with feeding and competing ridesplitting services. Transp. Res. Part A Policy Pract. 2020, 132, 713–727. [Google Scholar] [CrossRef]
- Ning Xia Statistical Yearbook 2020. Available online: http://nxdata.com.cn/files_nx_pub/html/tjnj/2020/indexfiles/indexch.htm (accessed on 5 May 2021).
- Baidu Map. Available online: https://lbsyun.baidu.com/index.php?title=webapi/guide/webservice-placeapi (accessed on 5 May 2021).
- Menard, S. Applied Logistic Regression Analysis; Sage: Newcastle upon Tyne, UK, 2002; Volume 106. [Google Scholar]
- Yang, J.; Liu, A.A.; Qin, P.; Linn, J. The effect of vehicle ownership restrictions on travel behavior: Evidence from the Beijing license plate lottery. J. Environ. Econ. Manag. 2020, 99, 102269. [Google Scholar] [CrossRef]
- Sui, Y.; Zhang, H.; Shang, W.; Sun, R.; Wang, C.; Ji, J.; Song, X.; Shao, F. Mining urban sustainable performance: Spatio-temporal emission potential changes of urban transit buses in post-COVID-19 future. Appl. Energy 2020, 280, 115966. [Google Scholar] [CrossRef] [PubMed]
- Shu, B.; Zhang, H.; Li, Y.; Qu, Y.; Chen, L. Spatiotemporal variation analysis of driving forces of urban land spatial expansion using logistic regression: A case study of port towns in Taicang City, China. Habitat Int. 2014, 43, 181–190. [Google Scholar] [CrossRef]


| Field | Type | Sample | Comment |
|---|---|---|---|
| Order ID | String | 4654168 | Anonymized |
| Driver ID | String | 10685 | Anonymized |
| Longitude | String | 106.17115 | GCJ-02 coordinate system |
| Latitude | String | 38.466655 | GCJ-02 coordinate system |
| Price | String | 30 | Unit: yuan |
| Departure time | String | 1577586696040 | Unix timestamp, in seconds |
| Arrival time | String | 1577587009611 | Unix timestamp, in seconds |
| Creation time | String | 157758667054 | Unix timestamp, in seconds |
| Weather | String | Light rain | From local media |
| Independent Factors | B | Exp(B) | Sig. |
|---|---|---|---|
| Weekends * | 1.021 | 2.775 | 0.000 |
| Morning peak * | 0.045 | 1.046 | 0.000 |
| Evening peak * | 0.329 | 1.390 | 0.000 |
| Residential land * | −0.067 | 0.935 | 0.000 |
| Administration and public service land | 0.002 | 1.002 | 0.119 |
| Commercial and business facility land * | 0.008 | 1.008 | 0.000 |
| Industrial land * | −0.121 | 0.886 | 0.000 |
| Street and transportation land * | 0.021 | 1.022 | 0.000 |
| Green space and square land | −0.017 | 0.983 | 0.284 |
| Population density | −0.003 | 0.997 | 0.412 |
| Bus stop density * | 0.004 | 1.004 | 0.000 |
| Travel time * | 0.005 | 1.005 | 0.000 |
| Advance appointment time * | −0.005 | 0.995 | 0.000 |
| Precipitation and snowfall | 0.012 | 1.012 | 0.764 |
| Average temperature * | −0.012 | 0.988 | 0.000 |
| Constant | −0.148 | 0.863 |
| Independent Factors | B | Exp(B) | Sig. |
|---|---|---|---|
| Weekend * | 1.174 | 3.236 | 0.000 |
| Morning peak * | −0.482 | 0.618 | 0.000 |
| Evening peak * | 0.320 | 1.377 | 0.000 |
| Residential land * | −0.396 | 0.673 | 0.000 |
| Administration and public service land | −0.001 | 0.999 | 0.663 |
| Commercial and business facility land * | 0.001 | 1.001 | 0.002 |
| Industrial land * | −0.131 | 0.877 | 0.000 |
| Street and transportation land * | 0.442 | 1.556 | 0.000 |
| Green space and square land * | −0.348 | 0.706 | 0.000 |
| Population density * | 0.133 | 1.142 | 0.000 |
| Bus stop density * | 0.006 | 1.006 | 0.000 |
| Travel time * | 0.003 | 1.003 | 0.000 |
| Advance appointment time * | −0.020 | 0.980 | 0.003 |
| Precipitation and snowfall | −0.040 | 0.996 | 0.928 |
| Average temperature * | −0.022 | 0.978 | 0.000 |
| Constant | −1.262 | 0.283 |
| Actual Measurement | Prediction Accuracy |
|---|---|
| Matching failed intercity ridesplitting (Y = 0) | 63.7% |
| Matching successful intercity ridesplitting (Y = 1) | 89.1% |
| Average prediction accuracy | 78.7% |
| Actual Measurement | Prediction Accuracy |
|---|---|
| Matching failed intercity ridesplitting (Y = 0) | 70.1% |
| Matching successful intercity ridesplitting (Y = 1) | 85.7% |
| Average prediction accuracy | 79.9% |
Publisher’s Note: MDPI stays neutral with regard to jurisdictional claims in published maps and institutional affiliations. |
© 2021 by the authors. Licensee MDPI, Basel, Switzerland. This article is an open access article distributed under the terms and conditions of the Creative Commons Attribution (CC BY) license (https://creativecommons.org/licenses/by/4.0/).
Share and Cite
Wang, J.; Wu, Q.; Chen, Z.; Ren, Y.; Gao, Y. Exploring the Factors of Intercity Ridesplitting Based on Observed and GIS Data: A Case Study in China. ISPRS Int. J. Geo-Inf. 2021, 10, 622. https://doi.org/10.3390/ijgi10090622
Wang J, Wu Q, Chen Z, Ren Y, Gao Y. Exploring the Factors of Intercity Ridesplitting Based on Observed and GIS Data: A Case Study in China. ISPRS International Journal of Geo-Information. 2021; 10(9):622. https://doi.org/10.3390/ijgi10090622
Chicago/Turabian StyleWang, Jincheng, Qunqi Wu, Zilin Chen, Yilong Ren, and Yaqun Gao. 2021. "Exploring the Factors of Intercity Ridesplitting Based on Observed and GIS Data: A Case Study in China" ISPRS International Journal of Geo-Information 10, no. 9: 622. https://doi.org/10.3390/ijgi10090622
APA StyleWang, J., Wu, Q., Chen, Z., Ren, Y., & Gao, Y. (2021). Exploring the Factors of Intercity Ridesplitting Based on Observed and GIS Data: A Case Study in China. ISPRS International Journal of Geo-Information, 10(9), 622. https://doi.org/10.3390/ijgi10090622