1. Introduction
Since the beginning of the 21st century, industrialization and urbanization in China have accelerated. The urbanization level of China reached 59.58% in 2018. Rapid urbanization is accompanied by a series of deteriorations of the urban environment, which may lead to the degradation of the ecological quality of the city and surrounding areas. Therefore, the relationship between urbanization and the ecological environment will become an urgent problem in China in the future, and it will also become a focal point among scholars [
1,
2,
3]. In the terrestrial ecosystems affected by urbanization, vegetation plays a significant role in reflecting the influences of urbanization over time and across a region [
4]. Therefore, the study of vegetation changes in the process of urbanization can fully realize the potential correlation between vegetation changes and urbanization, which is indispensable for the sustainable development of cities [
5].
As an important part of the ecosystem, vegetation plays an irreplaceable role in the living environment of human beings, and it has always received extensive attention from academia [
6,
7,
8]. Currently, there are many types of indices for measuring vegetation cover [
9,
10]. The normalized difference vegetation index (NDVI), which indicates vegetation cover or vegetation restoration, has the advantages of a wide coverage and a continuous time series [
11] and has widely influenced other studies [
12,
13,
14,
15,
16,
17]. Spatiotemporal variations in vegetation cover are characterized by spatial heterogeneity and temporal periodicity. Investigations of the driving factors of vegetation cover are affected by natural and human factors. Natural factors include temperature, precipitation, and solar irradiation. Human factors include agricultural irrigation, deforestation, returning farmland to forests, and urbanization [
18,
19,
20,
21].
In recent years, some studies have explored the relationship between urbanization and vegetation activities at different scales and during different stages of urbanization [
19,
22]. However, the relationship is uncertain due to differences in the scale, stage of development, and speed of development of the study areas and other natural and human factors that influence vegetation changes. Therefore, it is necessary to investigate the relative variation in the trends of urbanization and vegetation activities to clarify the dynamic relationship between the two. These studies can provide scientific support to optimize land use and promote ecosystem protection.
The mountainous areas of southwest China have been set aside by the Chinese government for eco-environmental construction. Since 2000, the process of urbanization in southwest China has accelerated. Therefore, focusing on the response of vegetation dynamics to urbanization in this region is of great significance to realize the coordinated development of economic growth and ecological protection. Considering the needs for urbanization studies, this study used administrative units as the analysis unit to highlight the influences of human factors. In addition, the mountainous areas of southwest China were taken as the study area, and 410 counties were selected as the study units. The relationship between vegetation dynamics and urbanization in the study area from 2000 to 2015 was analyzed using trend analysis, bivariate spatial autocorrelation analysis, and stepwise multivariate regression analysis. In addition, the factors influencing this relationship were explored.
2. Theoretical Framework and Hypothesis
Grossman and Krueger [
23] proposed the environmental Kuznets curve theory based on their research. This theory mainly focuses on the relationship between environmental quality and economic development. We assume that the relationship between urbanization and ecological restoration is similar to that between economic growth and environmental pollution; i.e., the relationship between urbanization and vegetation dynamics follows an inverted-U-shaped curve. Furthermore, Peng et al. [
24] studied ecosystem services and urbanization in Beijing and found a nonlinear relationship of regression discontinuity between the two. In fact, this relationship may be a deformed version of the inverted-U-shaped relationship. In addition, because urbanization is a regional dynamic variable with saturability (up to 100%), we believe that the rate of urbanization level change (RULC) (in absolute value) may be more suitable to characterize urbanization dynamics. This is the key difference between our study and previous studies. In summary, in this study, we first assumed an inverted-U-shaped relationship between the RULC and the Slope−NDVI and then used a regression model to test this hypothesis. In addition to urbanization, we also considered natural and human variables, including topography, temperature, precipitation, population density, land-use change, and economic growth, as control variables [
25,
26,
27,
28] to fully reveal the mechanism of vegetation dynamics (
Figure 1). In the specific measurement process, we adopted the multiple linear stepwise regression model. After verifying the establishment of the inverted U-shaped curve, we further analyzed its inflection point and proposed relevant policy implications.
3. Materials and Methods
3.1. Study Area
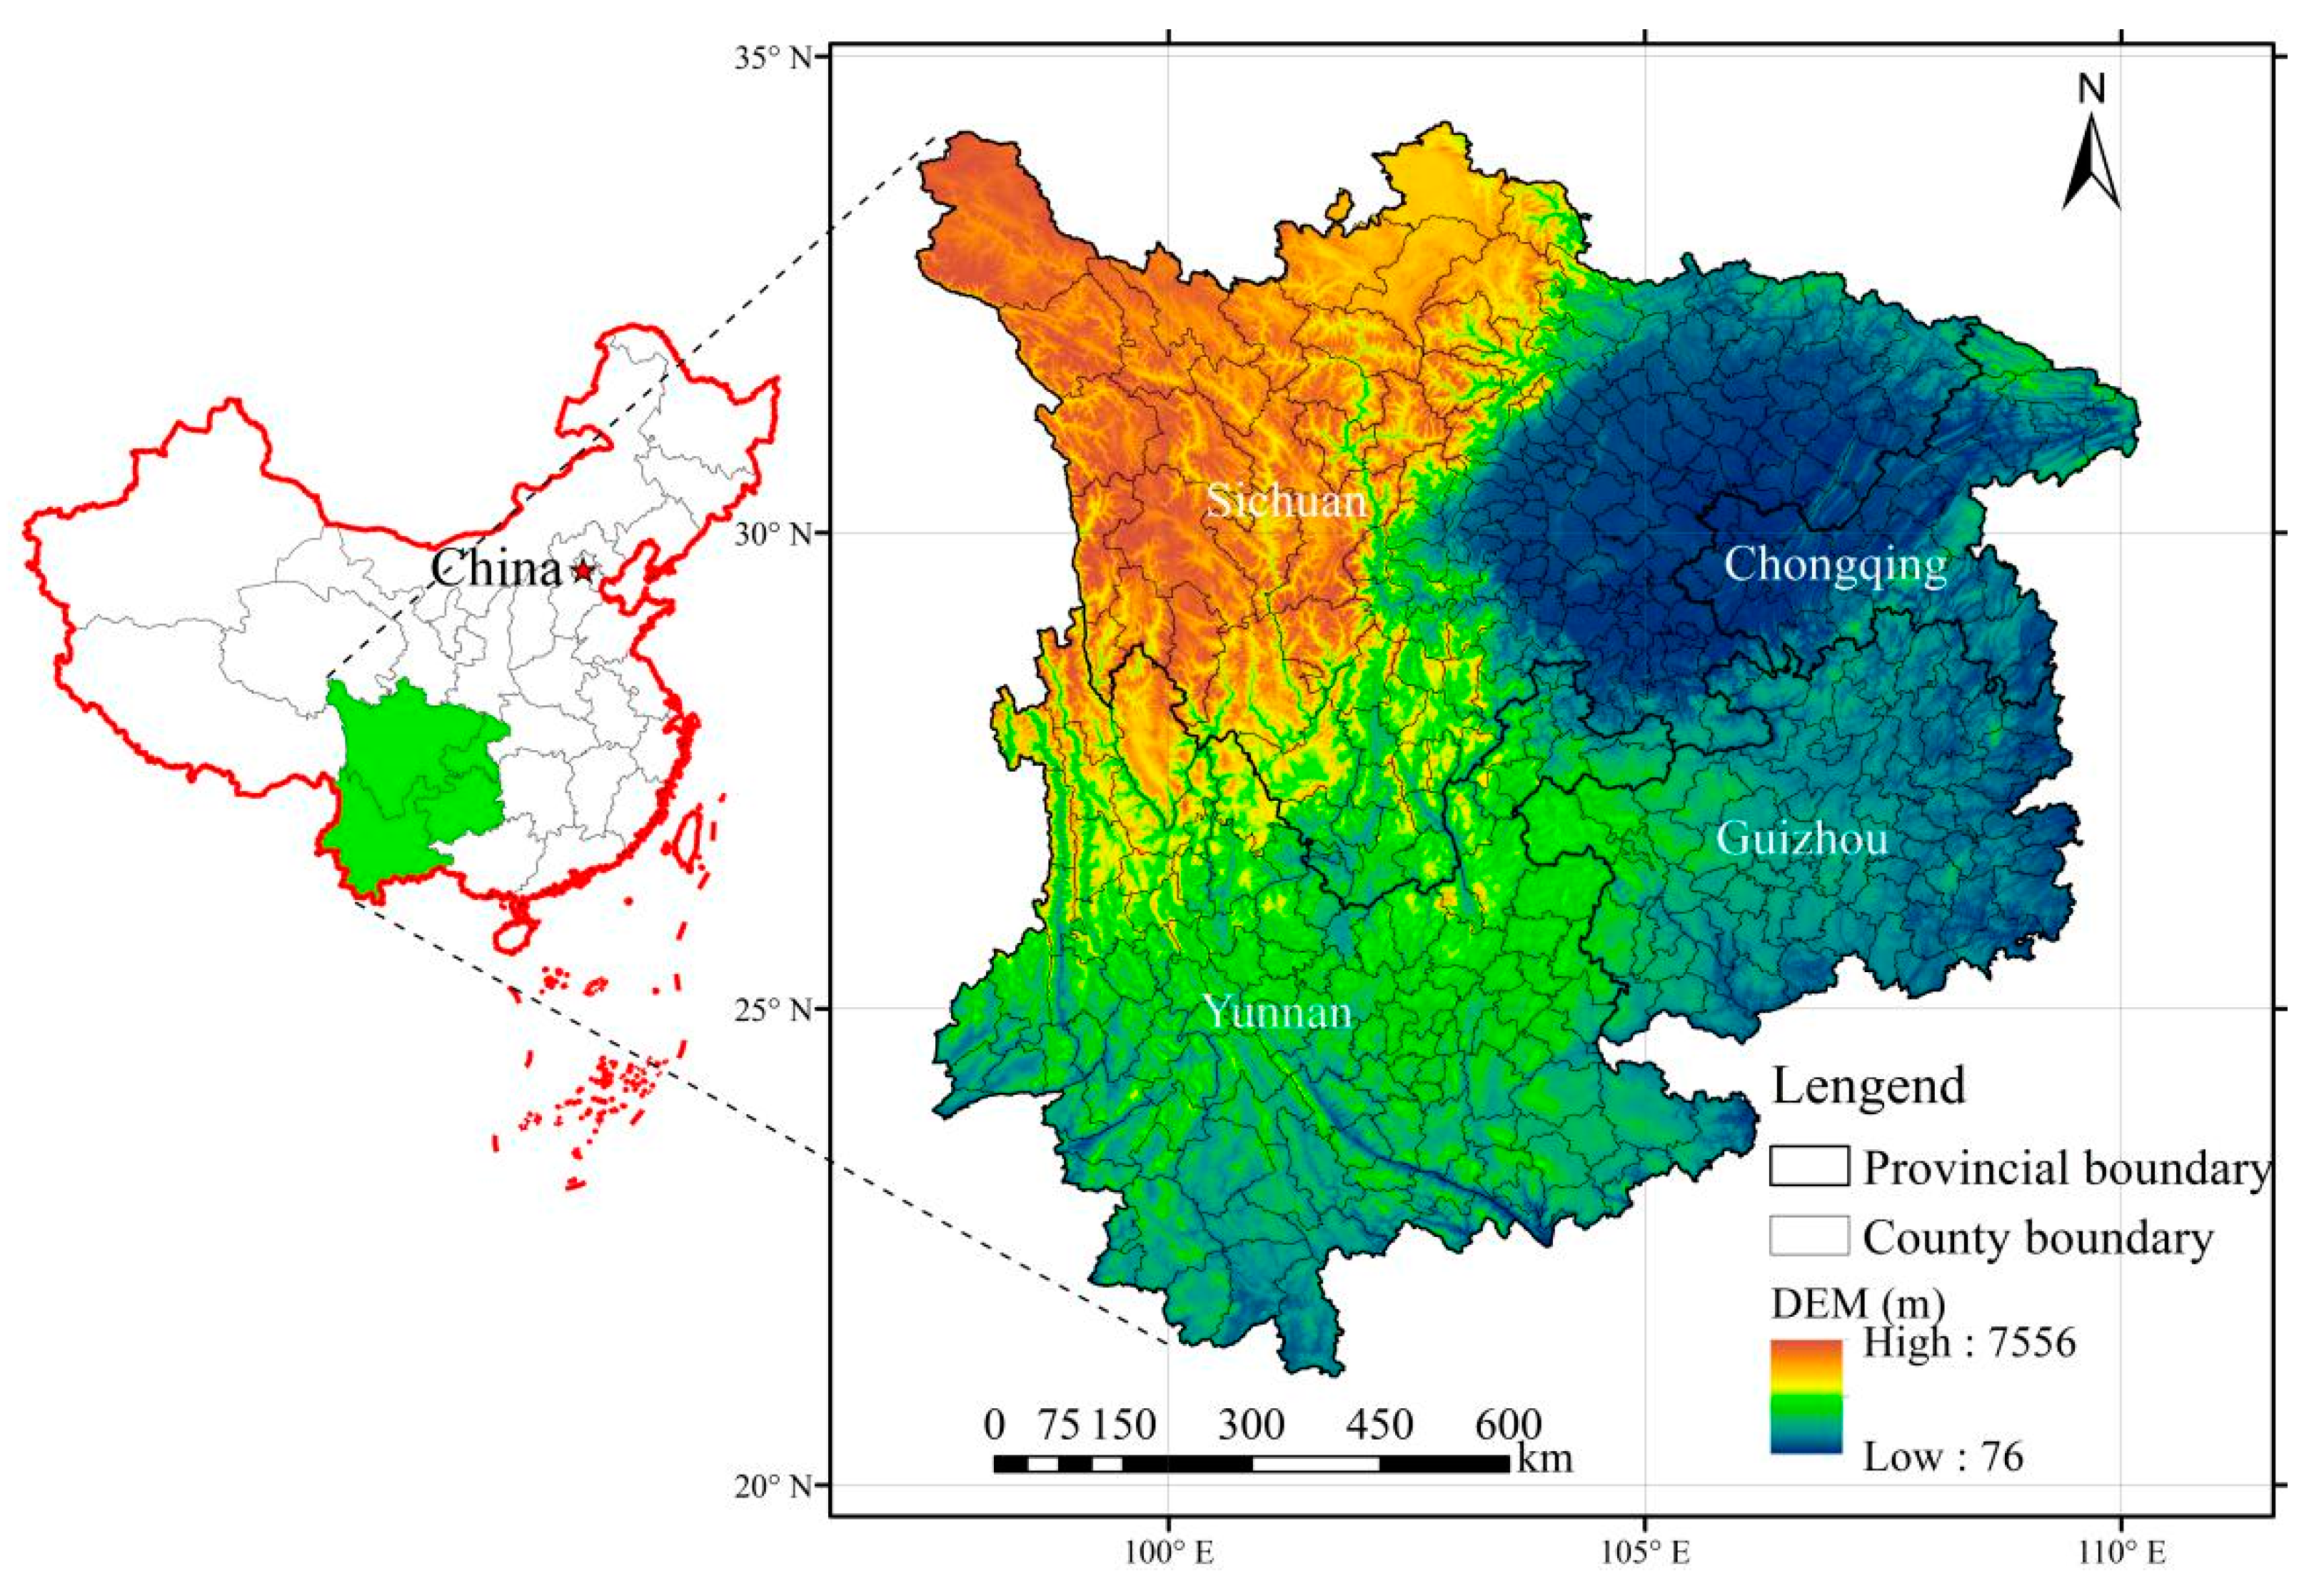
The mountainous areas of southwest China are between 97°3′–110°11′ E and 21°8′–34°19′ N (
Figure 2) and include parts of Yunnan, Sichuan, Chongqing, and Guizhou Provinces (435 counties). The total area is 1,138,570 km
2, of which 89.54% are mountainous (statistical units at the county level). As of 2015, the total population was 194.9185 million, and the mean urbanization level was 42.09%. The overall level of urbanization was relatively low, but the process of urbanization was gradually accelerating; the average urbanization level increased from 24.61% in 2000 to 42.09% in 2015, and the population became rapidly concentrated in cities and towns. The ecological value of the study area is important because it is the key area of ecosystem services in China and an important component of the crucial ecological security shelter of the Yangtze River [
29].
3.2. Dataset and Preprocessing
The NDVI data used in this study were obtained from the International Scientific and Technical Data Mirror Site, Computer Network Information Center, Chinese Academy of Science (CAS) (
http://datamirror.csdb.cn/ (accessed on 14 December 2020)), with a spatial resolution of 1 × 1 km and a temporal resolution of 1 month. The annual NDVI dataset was generated using the maximum-value composite procedure. The urbanization level, population density, and county-level gross domestic product (GDP) data were obtained from the statistical yearbooks of counties, cities, and provinces in China in 2000 and 2015. Meteorological data, including precipitation and temperature data, were obtained from the National Meteorological Information Center of the China Meteorological Administration (
http://data.cma.cn/ (accessed on 10 January 2019)). The spatial resolution of the precipitation and temperature data was 1 km, and the time period considered was from 2000–2015, for a total of 16 years of data. The relief degree of the land surface (RDLS) was based on digital elevation model (DEM) data and computed using ArcGIS software. The land-use data for 2000 and 2015 were obtained from the Global Change Research Data Publishing and Repository (
http://www.geodoi.ac.cn/WebCn/ (accessed on 14 April 2020)), and the spatial resolution was 30 × 30 m. The landcover type was divided into six level I classes (arable land, forestland, grassland, waters, residential land, and unused land) and 25 level II classes.
The urbanization levels of provincial capital cities and some individual districts and counties with rapid development reached 100% before 2015. Therefore, the main urban areas of four provincial capital cities and the city of Panzhihua were excluded from the actual measurement. Eventually, 410 sample points were obtained, and a 410 × 2 database was created.
3.3. Methods
3.3.1. Trend Analysis of NDVI and Meteorological Data
Trend analysis can reflect the interannual variabilities in the NDVI and temperature. We used the slope of change to study the degree of change in the NDVI and the annual mean temperature. Here, the following NDVI is presented as an example to introduce the calculation process for this method [
26]:
where
Slope−NDVI is the slope of the NDVI change;
m is the fixed number of years of the study, which was 16 in this study; and NDVI
j is the NDVI of the
jth year. When
Slope−NDVI < 0, the NDVI decreases during the study period; otherwise, it increases.
The coefficient of variation can express the degree of fluctuation of geographic data and is thus used to measure the degree of variation of precipitation in a time series and reflect precipitation fluctuations. The annual mean precipitation is calculated as follows:
where
PF is the coefficient of variation of precipitation, which represents the precipitation fluctuation;
i is the time period;
is the mean annual precipitation in the
ith year;
μ is the mean annual precipitation from 2000 to 2015; and
n is the number of samples.
3.3.2. Calculation of the Rate of Urbanization Level Change (RULC)
The value of urbanization level change can reflect the changing trend of urbanization. The calculation formula is as follows:
where
UL2000 and
UL2015 are the urbanization levels in 2000 and 2015, respectively; and the urbanization level here refers to the proportion of permanent residents in a city to the total population.
3.3.3. Calculation of Land-Use Intensity (LUI)
According to methods proposed in previous studies [
30,
31], the land-use intensity (LUI) can be divided into the following four grades: grade 1, unused land, which contains saline-alkali land, marsh land, and sandy land, as well as bare land and other unused or almost unused land, such as mountain deserts and tundra; grade 2, forest/grass/water land, including woodland, grassland, and water; grade 3, agricultural land, including cultivated land, gardens, and artificial grassland; and grade 4, urban residential land, including urban land, residential land, industrial land, and transportation land. Higher LUI indicated higher land use intensity. Additionally, CLUI is the value obtained by subtracting LUI at two different points in time. A comprehensive LUI index can be calculated from the following formula, with a value range between 100 and 400 [
26]:
where
Ai is the grading index of the grade
i LUI;
Ci is the proportion of the area of the grade
i LUI classification; and l is the LUI grading index.
3.3.4. Establishment of the Stepwise Multivariate Regression Model
To analyze the relationship between urbanization and vegetation change, we used a stepwise multivariate regression method. The explanatory variables include natural factors and factors related to human activity. The model can be represented as follows:
where
Slope−NDVI is the rate of NDVI change (%/year);
RULC is the rate of urbanization level change (%/year);
SRULC is the square of the RULC (%
2/year
2), which can indicate the presence of an inverted-U-shaped relationship between
RULC and
Slope−NDVI;
Xj represents the control variables, including the change in the LUI (
CLUI),
PF, RDLS, the GDP change rate (
GDPCR),) and the slope of the temperature change (
Slope−T);
β0 is the intercept;
β1,
β2, and
βj are regression coefficients; and
is the error term caused by unobservable factors.
3.3.5. Spatial Autocorrelation
Spatial autocorrelation is an assessment of the correlation of a variable with reference to the spatial location of the variable. Moran’s I is a popular test statistic for spatial autocorrelation. The global Moran’s I examines the existence of spatial correlation over an entire region, and is calculated as follows:
where
n is the number of observations for an entire region;
xi and
xj are the observations at locations of
i and
j;
is the mean of
x; and
wij, an element of the spatial weights’ matrix
w, is the spatial weight between locations of
i and
j. The local Moran’s I is a local test statistic for spatial autocorrelation that is used to identify the locations of spatial clusters and spatial outliers. It is computed as follows:
The variables in Equation (7) are the same as those used in Equation (6), but the corresponding values are from the local neighboring region. For the local Moran’s I, five categories of local spatial autocorrelation can be distinguished. Two of these categories are spatial cluster types, including high values surrounded by high values (High–high) and low values surrounded by low values (Low–low). Two of these categories are spatial outlier types, including high values surrounded by low values (High–low) and low values surrounded by high values (Low–high). The last type is spatial randomness without significant spatial patterns in the corresponding weight matrix.
4. Results
4.1. Dynamic Variation in NDVI and Urbanization
Overall, the spatial distribution of the NDVI values (
Figure 3a,b) in 2000 and 2015 was geographically heterogeneous. The regions with high NDVIs were mainly located in the undulating hilly areas, which were mainly covered with forest vegetation. The regions with low NDVI values were mainly located in the western plateau region, a portion of the plain region, the urban areas, and some of these regions were in hilly areas where agricultural cultivation dominated. By calculating the change in the NDVI from 2000 to 2015, the average growth rate over these 15 years was 0.58%/a (
p < 0.05).
Figure 4a,b show the spatial distribution of urbanization levels in the mountainous area of southwest China in 2000 and 2015, respectively. The urbanization levels in the mountainous areas of southwest China in 2000 and 2015 followed a center–periphery spatial distribution pattern: the regions with high urbanization levels were mainly located in the provincial capital cities and their surrounding areas, and the urbanization levels gradually decreased toward the peripheral regions.
Figure 5a shows that the NDVI increased in most areas, while it decreased in some areas, indicating that the vegetation in the study area improved year by year. As shown by the RULC trend from 2000 to 2015 (
Figure 5b), the urbanization level in the study area gradually increased over time. Overall, the RULC showed a geographical pattern of high in the east and low in the west. The increase in the urbanization level was significant in the regions with high initial urbanization levels, such as the Cheng-Yu Urban Agglomeration, the central Yunnan Urban Agglomeration, and the central Guizhou Urban Agglomeration.
The bivariate spatial autocorrelation analysis of the RULC and the Slope−NDVI (
Figure 6a) showed that the Moran’s I index was negative, indicating that the RULC and the Slope−NDVI had a negative spatial correlation and significant agglomeration characteristics in their spatial distribution. A local indicator of spatial association (LISA) agglomeration map for bivariate local spatial autocorrelation (
Figure 6b) was used to further investigate the spatial correlation types and the distributions of the RULC and the Slope−NDVI for different county units.
Figure 6a,b show that the correlation between the two variables was nonsignificant in most of the counties, and the High–High, Low–Low, High–Low, and Low–High type agglomeration areas were relatively concentrated. Overall, the spatial distributions of the RULC and the Slope−NDVI were significantly negatively correlated, but in some regions, they were significantly positively correlated. In other words, the interaction between the RULC and the Slope−NDVI was not completely consistent in the study area. Therefore, it was impossible to describe an overall influencing pattern from the spatial perspective, and it was necessary to include a series of control variables to characterize the influences of this relationship.
4.2. Econometric Model Results
According to the theoretical analysis framework established in
Figure 1, a regression model was used to test the hypothesis of the inverted-U-shaped relationship between the RULC and the Slope−NDVI. Before the model estimation, a multicollinearity diagnostic was performed on the selected factors. The population density change showed a characteristic root of approximately 0, indicating its multicollinearity with other indices; therefore, it was excluded. Finally, the RULC and its quadratic term, the SRULC, were taken as the main explanatory variables, and the GDPCR, the PF, the Slope−T, the CLUI, and the RDLS were used as control variables for the stepwise regression. The results show that the normalized residuals of the regression followed a normal distribution, indicating that the model satisfies the assumption that the random error terms follow a normal distribution.
Table 1 shows the influence of the RULC on the Slope−NDVI in the mountainous areas of southwest China. Based on the table, the model passes the significance test in the 95% confidence interval (
p = 0.005 < 0.05), and all the evaluation indices in the model pass the significance test. The standardized regression coefficient can reflect the degree of impact of an evaluation index on the Slope−NDVI. The results show that the impact of the indices on the Slope−NDVI follows the descending order of SRULC > RULC > RDLS > CLUI > Slope−T > GDPCR > PF. When we separated the factors into human and natural factors, the human factors had a total standardized coefficient of 1.4806, accounting for 68.02% of the influence of all the factors, while the natural factors had a relatively small total standardized coefficient, accounting for 31.98%. In addition, the results show that the RULC and the SRULC were both significant.
4.2.1. Impact of the RULC on Vegetation Dynamics
The influence coefficients of the RULC and the SRULC on the Slope−NDVI are 0.491 and −0.603, respectively, indicating an inverted-U-shaped relationship between the RULC and the Slope−NDVI that starts with positive values and then turns negative; that is, there is an inflection point for the impact of the RULC on the vegetation dynamics. To clearly express the relationship between the urbanization process and the vegetation dynamics, the following three scenarios were defined by controlling the values of other control variables (
Figure 7a): most conducive to vegetation restoration (best), moderately conducive to vegetation restoration (average), and least conducive to vegetation restoration (worst).
In the three scenarios, the curves representing the relationship between the RULC and the Slope−NDVI have the same shape but different intercepts. The intercepts reflect the contributions of the other control variables. Based on the statistical relationship between the RULC and the Slope−NDVI, the RULC at the inflection point was calculated to be 0.206, and the mean annual optimal RULC was 1.37%, indicating that when the RULC is less than 0.206, the Slope−NDVI increases as the RULC increases. In this case, the urbanization process has a promoting effect on vegetation restoration. When the RULC is greater than 0.206, the Slope−NDVI decreases as the RULC increases, and the urbanization process still has a positive influence on vegetation restoration, but its degree of influence gradually declines;, i.e., the marginal utility gradually decreases. In extreme cases, an extremely rapid increase in the rate of urbanization may negatively influence vegetation restoration. There are a total of 129 counties on the left side of the inflection point in
Figure 7b, with a total area of 479,800 km
2 (43% of the total area), and a total of 281 counties on the right side of the inflection point, with a total area of 636,800 km
2 (57% of the total area). In addition, the annual mean RULC of the counties in the mountainous areas of southwest China in 2000–2015 was 0.245, and the median RULC was 0.251, both of which exceed the optimal RULC. These results indicate that as urbanization has accelerated, the speed of improvement in vegetation activities has decreased.
4.2.2. Impact of Other Control Variables on Vegetation Dynamics
The influence coefficient of the GDPCR on the vegetation dynamics was 0.137, which passes the significance test at the level of 1%. This indicates that the GDPCR has had a positive influence on vegetation changes.
Figure 8a shows that the regions with a high GDPCR were sporadically distributed near provincial borders and along the Yangtze River.
The PF was significantly negatively correlated with vegetation changes. From 2000 to 2015, the PF was the most intense in the Hengduan Mountains region, followed by southeastern Guizhou Province and parts of northern Sichuan Province (
Figure 8b). Precipitation is an important climatic factor that affects vegetation growth. Generally, vegetation growth in arid regions is significantly positively affected by precipitation [
32,
33]. However, the influence of precipitation on vegetation varies in humid areas [
10,
34,
35]. The mountainous areas of southwest China are mostly humid, and the overall restriction of precipitation on vegetation growth is small. Unlike most studies that have directly used precipitation as an influencing factor, this study measured the PF as an influencing factor because it reflects precipitation fluctuations. For the mountainous areas of southwest China alone, the interannual fluctuation of precipitation is not indicative of an improved vegetation cover. In other words, a more stable interannual change may be more effective in improving the vegetation cover.
The Slope−T was significantly correlated with vegetation changes, and its influence coefficient on the Slope−NDVI was 0.157. The temperatures in the central southern regions of the study area and the Sichuan Basin were relatively high. As shown by the temperature change in the study area from 2000 to 2015 (
Figure 8c), the temperature in the study area increased overall. Temperature is another important factor that restricts vegetation restoration. The impact of the air temperature on vegetation activities varies by region. As shown by the model results, the marginal utility of climate change in the study area is conducive to improvements in the vegetation conditions;, i.e., significant temperature changes can increase the rate of improvement in the vegetation conditions.
The significant negative correlation between the CLUI and the Slope−NDVI found in this study is consistent with the results of most relevant studies from China [
36,
37]. The changes in the regional environment and human activities caused by land-use change restrict regional vegetation dynamics [
38,
39]. From 2000 to 2015, the land use in the mountainous areas of southwest China changed drastically (
Figure 8d). For instance, the area of construction land increased by 91.63%.
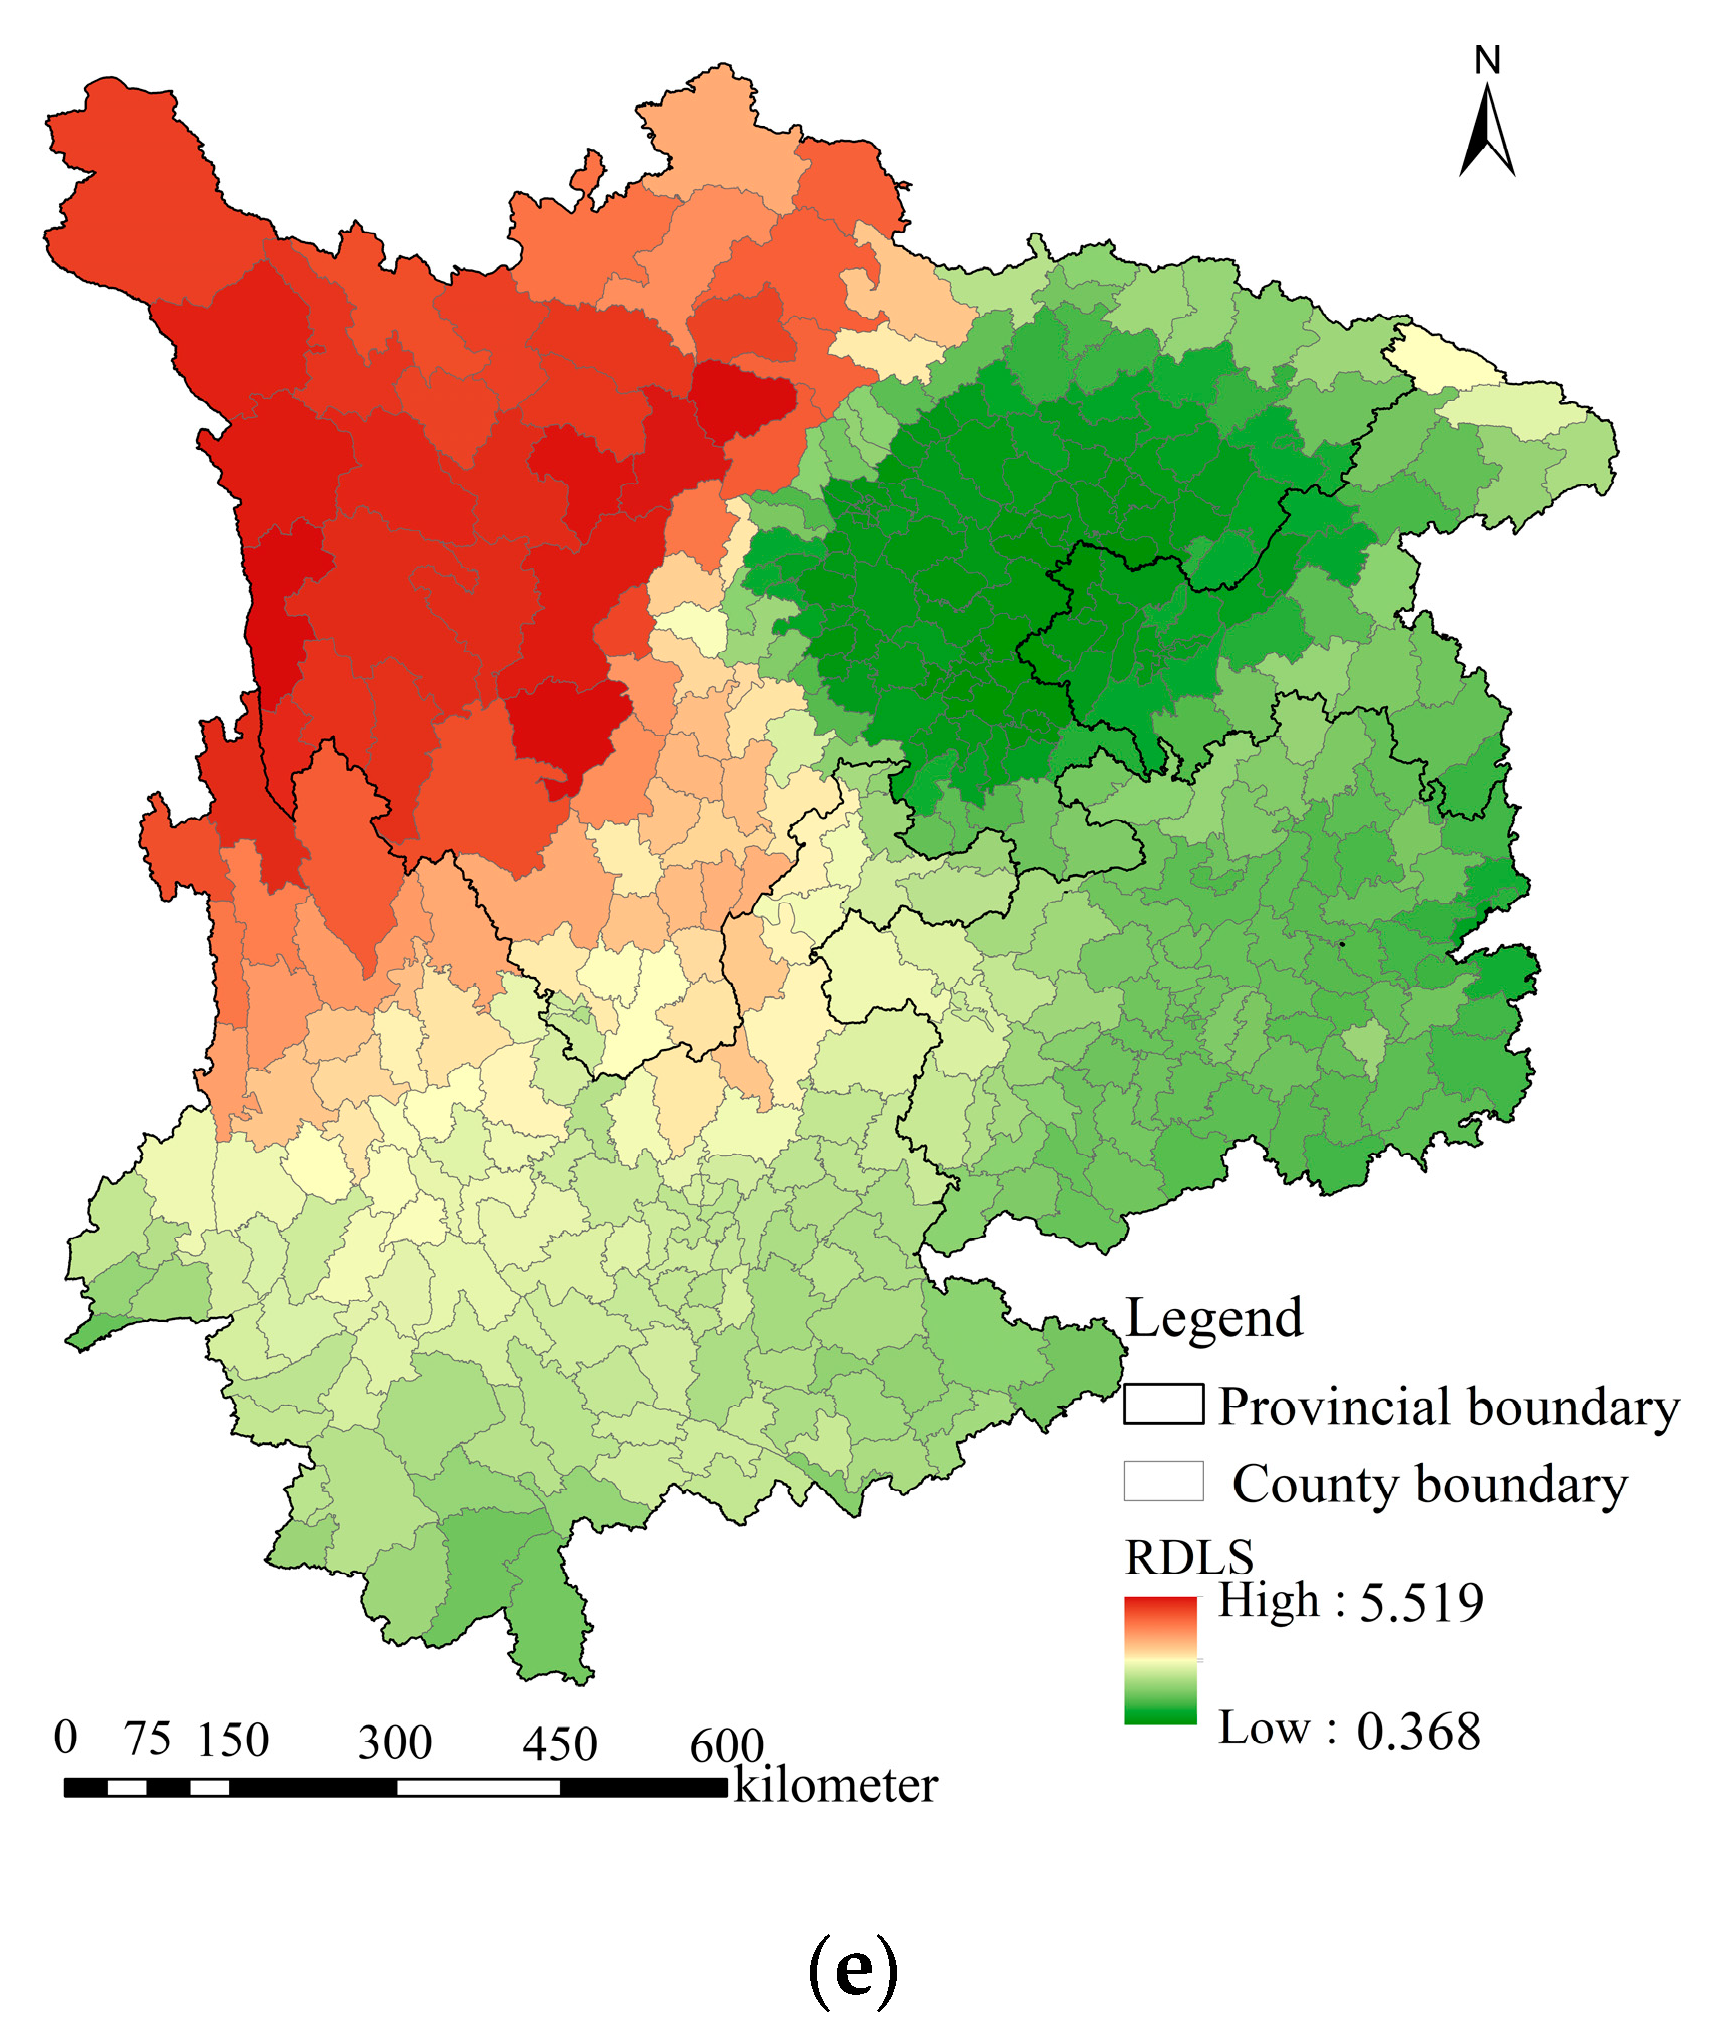
The RDLS and the Slope−NDVI were significantly positively correlated;, i.e., the regions with a mountainous topography and the largest RDLS showed the highest level of improvement in vegetation cover. The RDLS of the mountainous areas of southwest China decreased from the northwest to the southeast (
Figure 8e). According to previous studies, topographical variations can lead to significant regional differences in water, soil, and climate conditions and thus influence vegetation dynamics, and an improvement in vegetation activities is more significant in areas with a larger topographic relief [
40,
41]. As shown by the results of this study, regions with a large RDLS are usually located in areas with a high Slope−NDVI, and these regions have also been the main target regions of vegetation restoration and ecological protection in recent years.
5. Discussion
Theoretically, due to differences in study subjects and regional geographical environments, the relationship between urbanization and improvements in the vegetation cover shows scale differences and spatial divergence. Based on the inverted-U-shaped relationship found in this study, we can see that in most cases, the dynamic urbanization process has had a positive influence on vegetation restoration; therefore, urbanization and ecological restoration are not contradictory. However, after the inflection point, an excessively high RULC may lead to a marginal decline in the rate of improvement in the regional vegetation conditions. The marginal decline refers not to the deterioration of vegetation but to the decline in the rate of improvement in the vegetation conditions. It is true that in extreme cases, the Slope−NDVI may be negative when the speed of urbanization is excessively fast, which is evident in the inverted-U-shaped curve. Compared with China’s national target for new urbanization in 2020 (60%), the urbanization level still needs to be improved in most of the mountainous areas of southwest China. However, the goals, routes, and methods of future urbanization should be different. The goals, guidelines, and policy implementation of each county should be based on their own resource advantages to realize tailored management.
Unlike many studies, this study used the RULC rather than the urbanization level. The RULC reflects the growth rate of urbanization and characterizes the speed of the dynamic process of urbanization. Therefore, this study did not characterize the relationship between urbanization and vegetation but rather revealed the changes in vegetation during the dynamic process of urbanization. From the perspective of the research design, the RULC can better reflect the ability of urbanization to drive vegetation dynamics.
Through analysis, we found that the RDLS, the CLUI, the Slope−T, the GDPCR, the PF, and other factors have different effects on vegetation dynamics. Therefore, various factors, including human factors and natural factors, should be considered in the formulation and implementation of ecological management planning in urbanized areas. For example, the changes in the regional environment and human activities caused by land-use change can restrict regional vegetation dynamics. Therefore, the relevant government departments should scientifically optimize the structure and spatial layout of land use. Precipitation, temperature, and terrain will also affect vegetation dynamics, and there are differences in the degree of impact in different geographical environments. Therefore, in ecological restoration, measures suitable to local conditions should be adopted, various factors should be comprehensively considered, and corresponding restoration measures should be formulated based on the actual situation of the region.
Human activities directly affect both urban development and ecological restoration, which are two ends of the spectrum of environmental preservation. Referring to major function-oriented zone planning, most mountainous counties in southwest China are development-restricted zones that are significant for safeguarding ecological and food security. However, in recent years, the economy of this area has developed rapidly, and the process of urbanization has accelerated. Therefore, local governments should address the complex relationship between urbanization and vegetation dynamics by restricting urbanization to protect vegetation. In addition, the funds that have been accumulated in the process of urbanization can be applied to ecological restoration in the later stage of urbanization, including the implementation of ecological projects such as returning farmland to forest (grass) and the corresponding ecological compensation measures, to promote regional ecosystem recovery and improve the quality of the environmental and the carrying capacity of the regional ecological environment.
6. Conclusions
This study focused on the vegetation dynamics during the process of urbanization in the mountainous areas of southwest China and hypothesized an inverted-U-shaped relationship between the RULC and the Slope−NDVI to investigate the dynamic driving force of vegetation dynamics. We drew the following conclusions based on the results of this study: (1) From 2000 to 2015, the Slope−NDVI of the study area increased overall, and only a few urban areas had a decreasing Slope−NDVI. (2) The relationship between the RULC and the vegetation dynamics in the mountainous areas of southwest China can be characterized by an inverted-U-shaped curve that first increases and then decreases;, i.e., there is an inflection point for the impact of the urbanization process on vegetation changes. When the RULC is extremely high, the Slope−NDVI may be negative. The inflection points of the U-shaped curves of the RULC and the Slope−NDVI (0.206, 57.60) indicate that the optimal mean annual RULC is 1.37% in all the mountainous areas of southwest China. (3) The control variables, including the RDLS, the CLUI, the Slope−T, the GDPCR, and the PF, were significantly correlated with the Slope−NDVI. The CLUI and the PF were negatively correlated with the Slope−NDVI, while the RDLS, the GDPCR, and the Slope−T were positively correlated with the Slope−NDVI. Overall, the total standardized coefficient of human factors accounted for 68.02% of the influence of all the factors, while the total standardized coefficient of natural factors accounted for 31.98%, indicating that the human factors had a greater impact on the vegetation dynamics.
In this study, the interaction mechanism between urbanization and the ecological environment as well as the influencing factors of vegetation dynamics in southwest China were summarized and analyzed. The results of this study have theoretical value and practical significance for the construction of regional ecological security barriers and the adjustment of urban agglomeration development models. Different regions have different geographic environments, and the inverted-U-shaped relationship between the RULC and vegetation dynamics awaits verification in different regions. In addition, for counties with low urbanization levels, how to promote the coordinated interaction between urbanization and ecological restoration is a topic that needs to be explored in the future.


