
Semantic Enhancement of Human Urban Activity Chain Construction Using Mobile Phone Signaling Data


Abstract
1. Introduction
2. Methodology
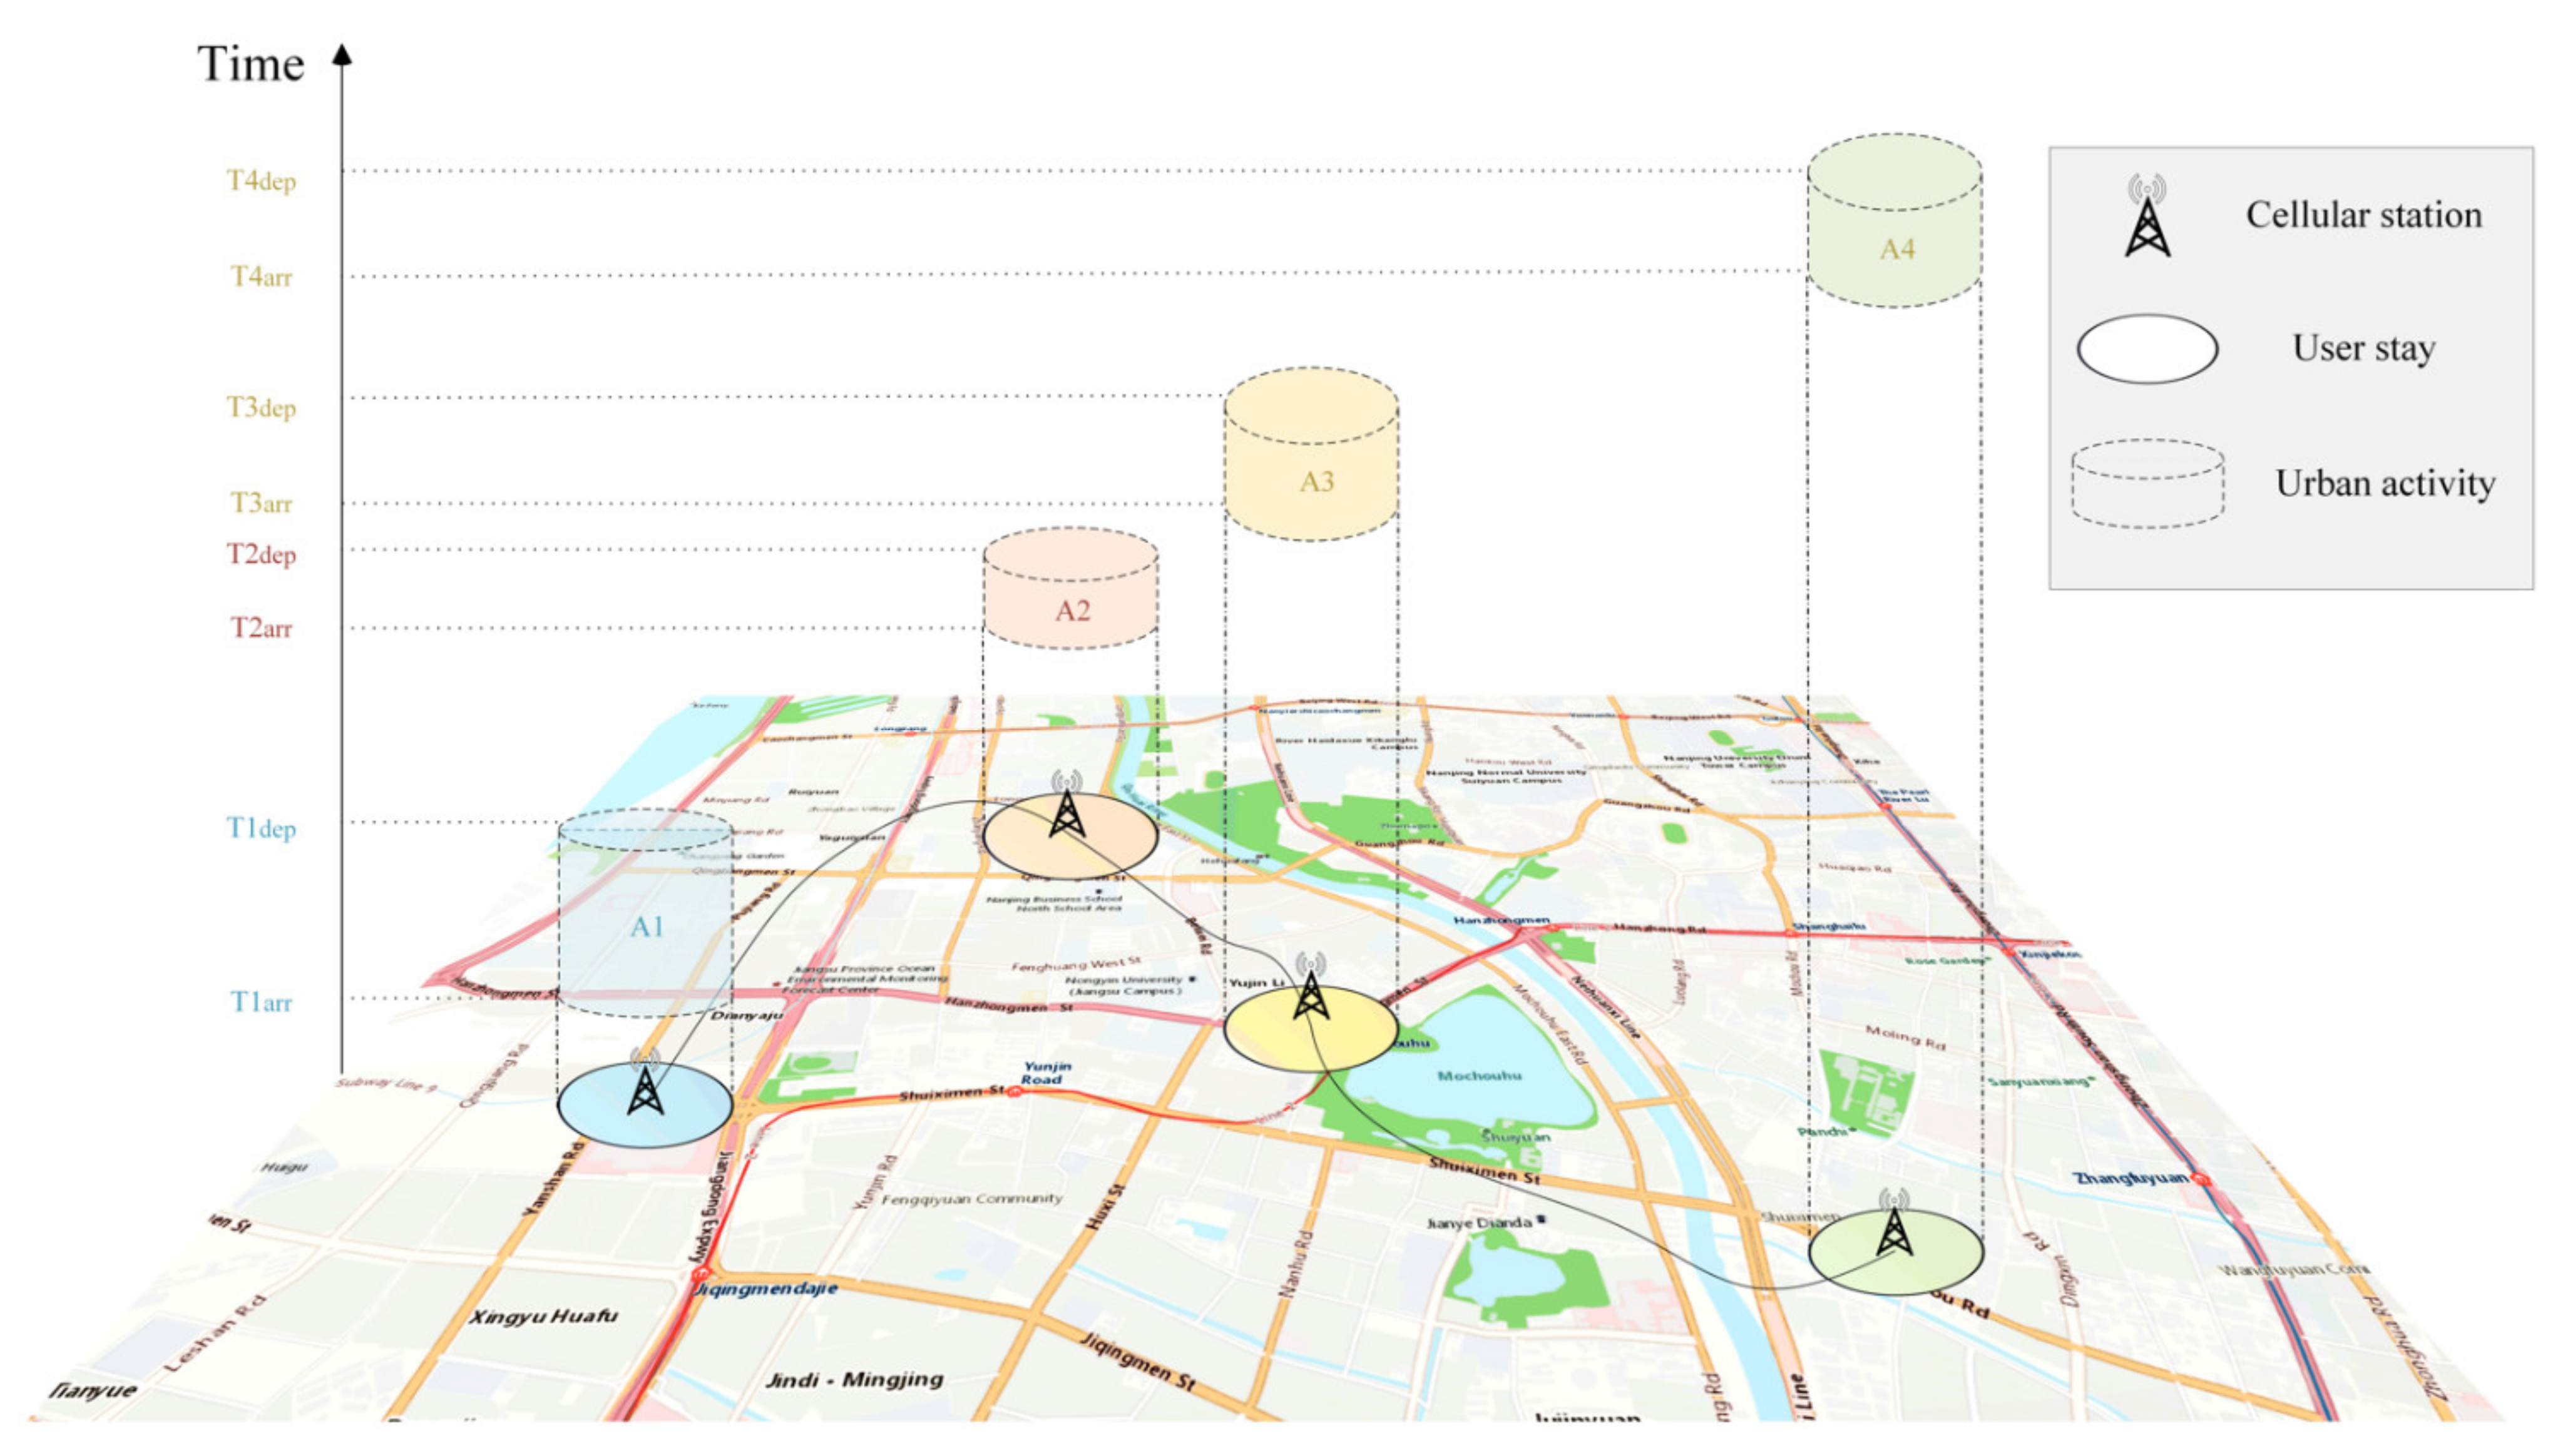
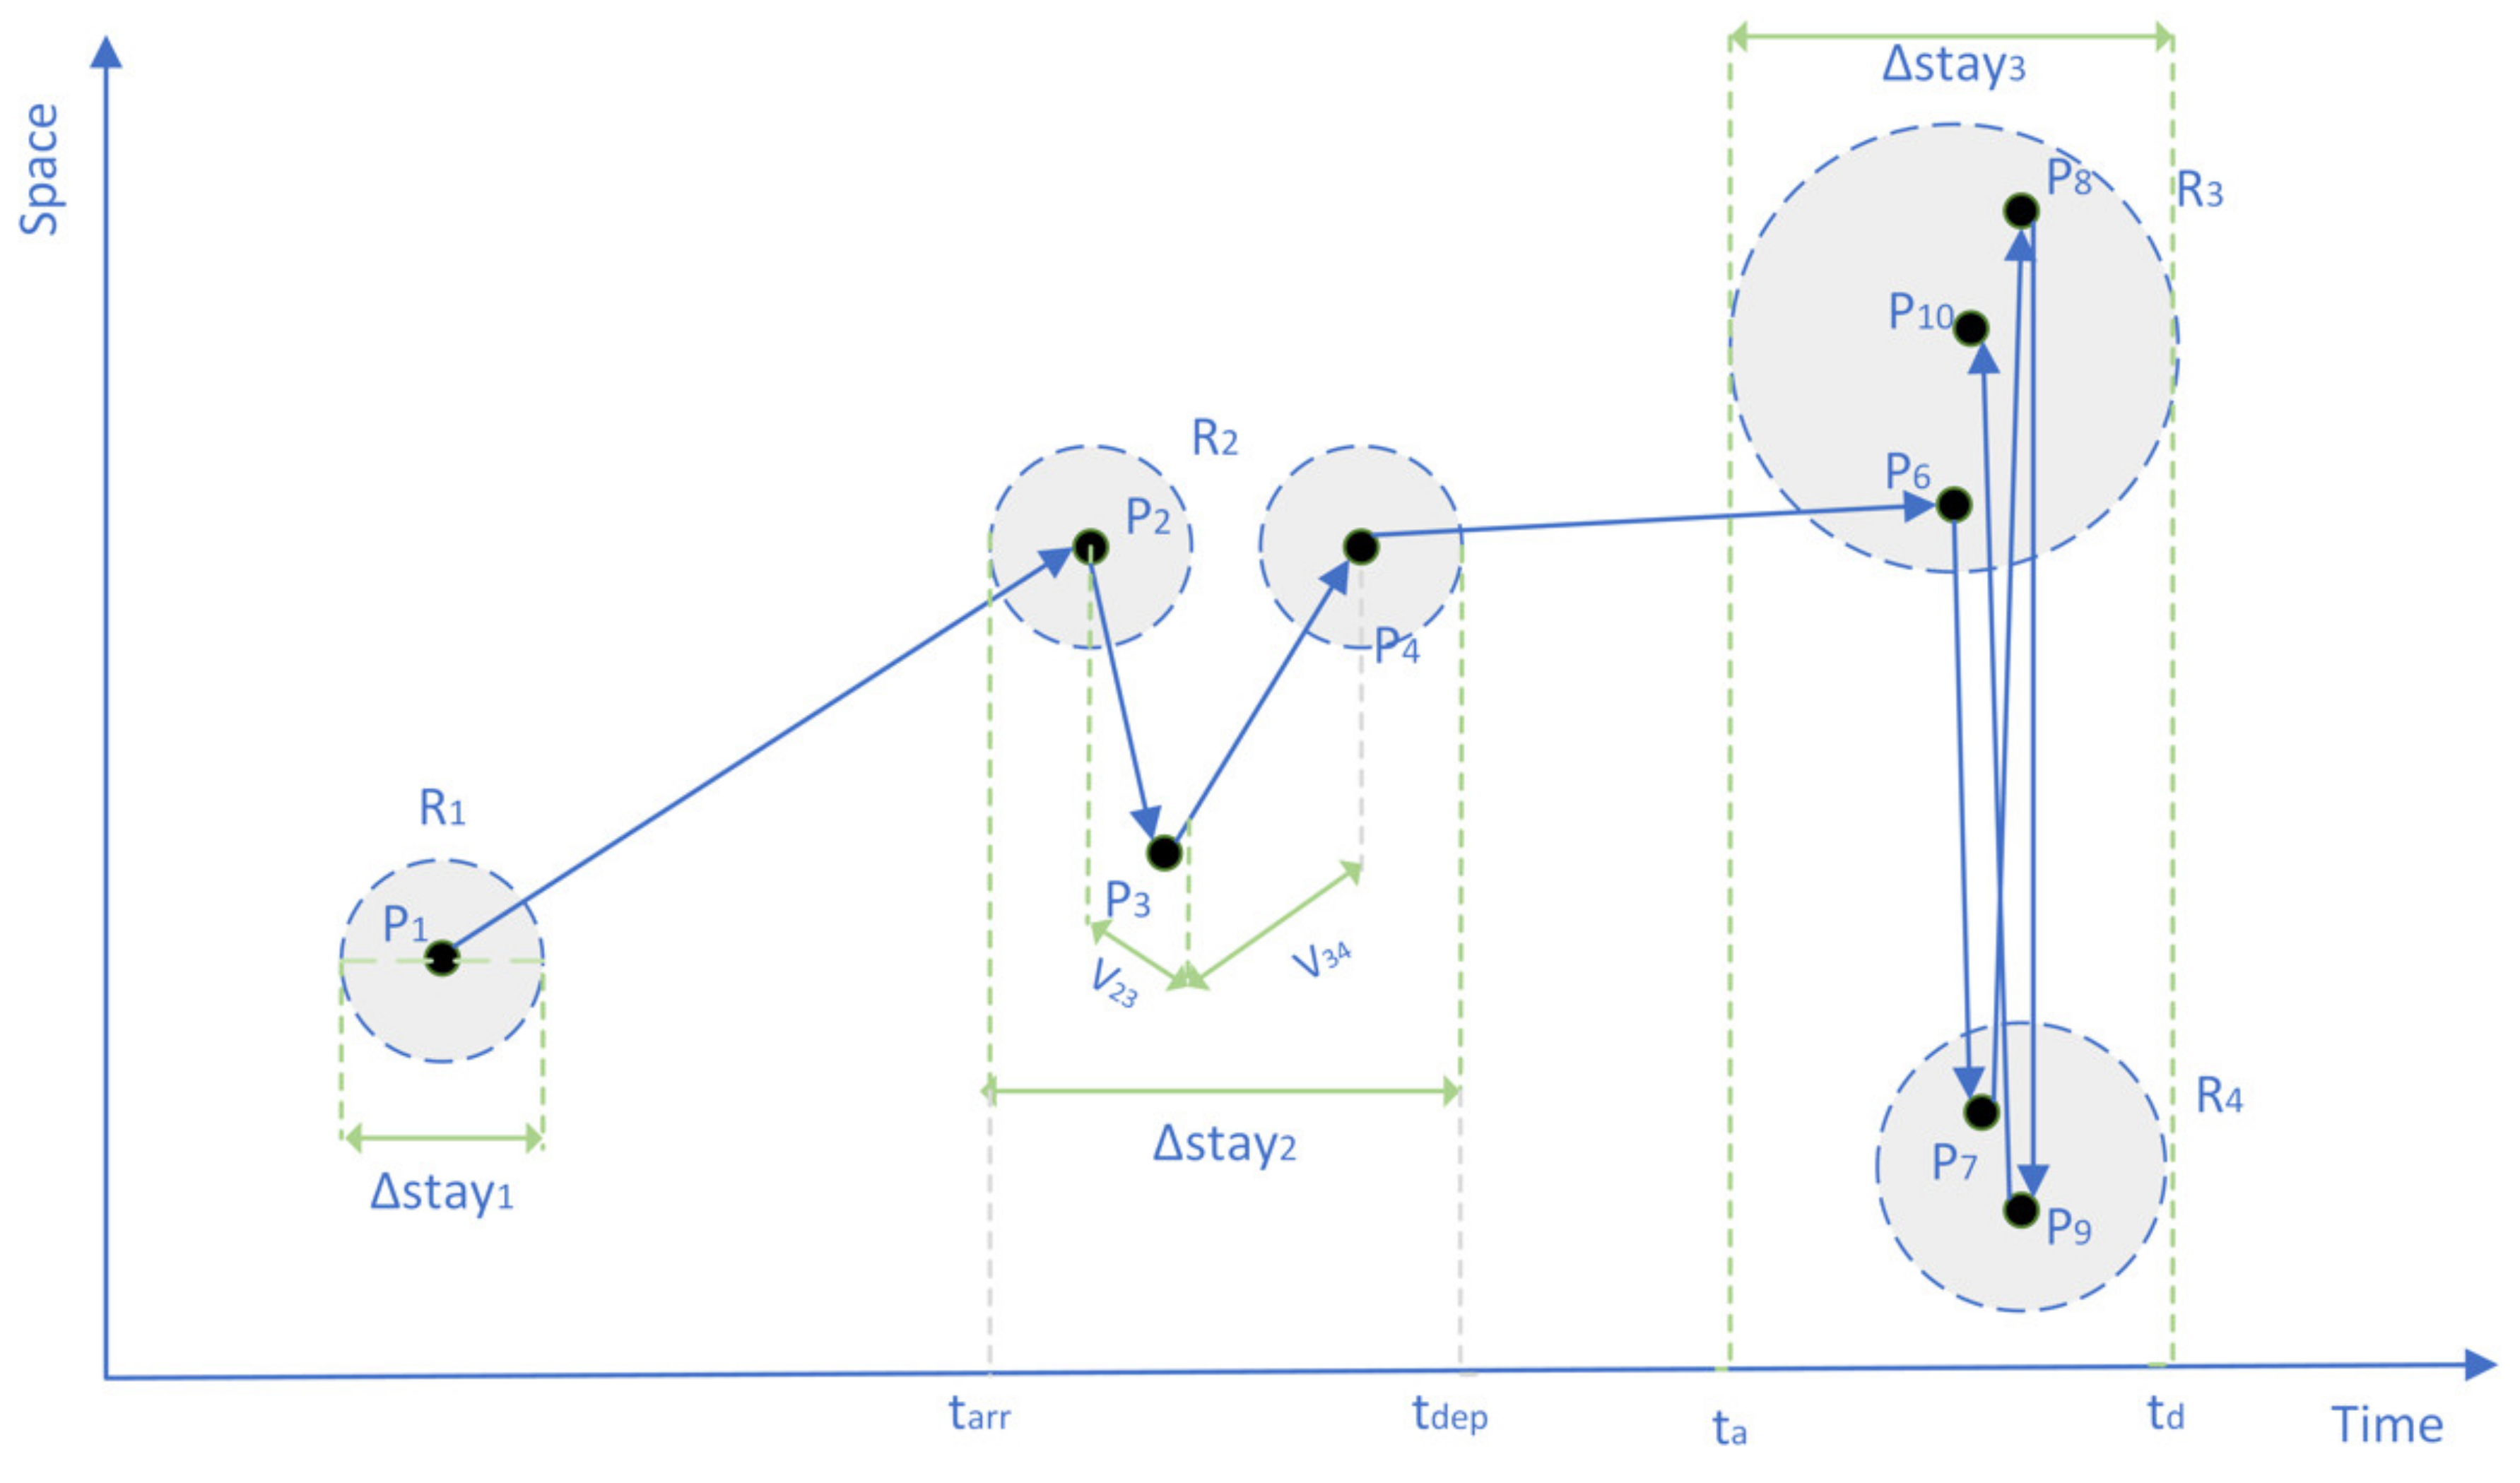
2.1. Recognition of Stay and Construction of User Daily Activity Semantic Stay Chain
2.2. Annotating Home and Work Activities for Different User Groups
- The total length of stay in each activity region during the daytime (09:00~17:00) and late-night (00:00~07:00) for each person were counted, respectively.
- Places with the longest cumulative duration of stay are identified as locals’ workplaces or residences.
- The surrounding land is used to determine the above places’ activity type with the longest cumulative stay (refer to Table A2). If the main land use in the area is residential, it is determined to be the user’s home location. Otherwise, it is the user’s workplace.
- Places with the longest cumulative duration of stay are identified as visitors’ residences (hotels or friends’ residences).
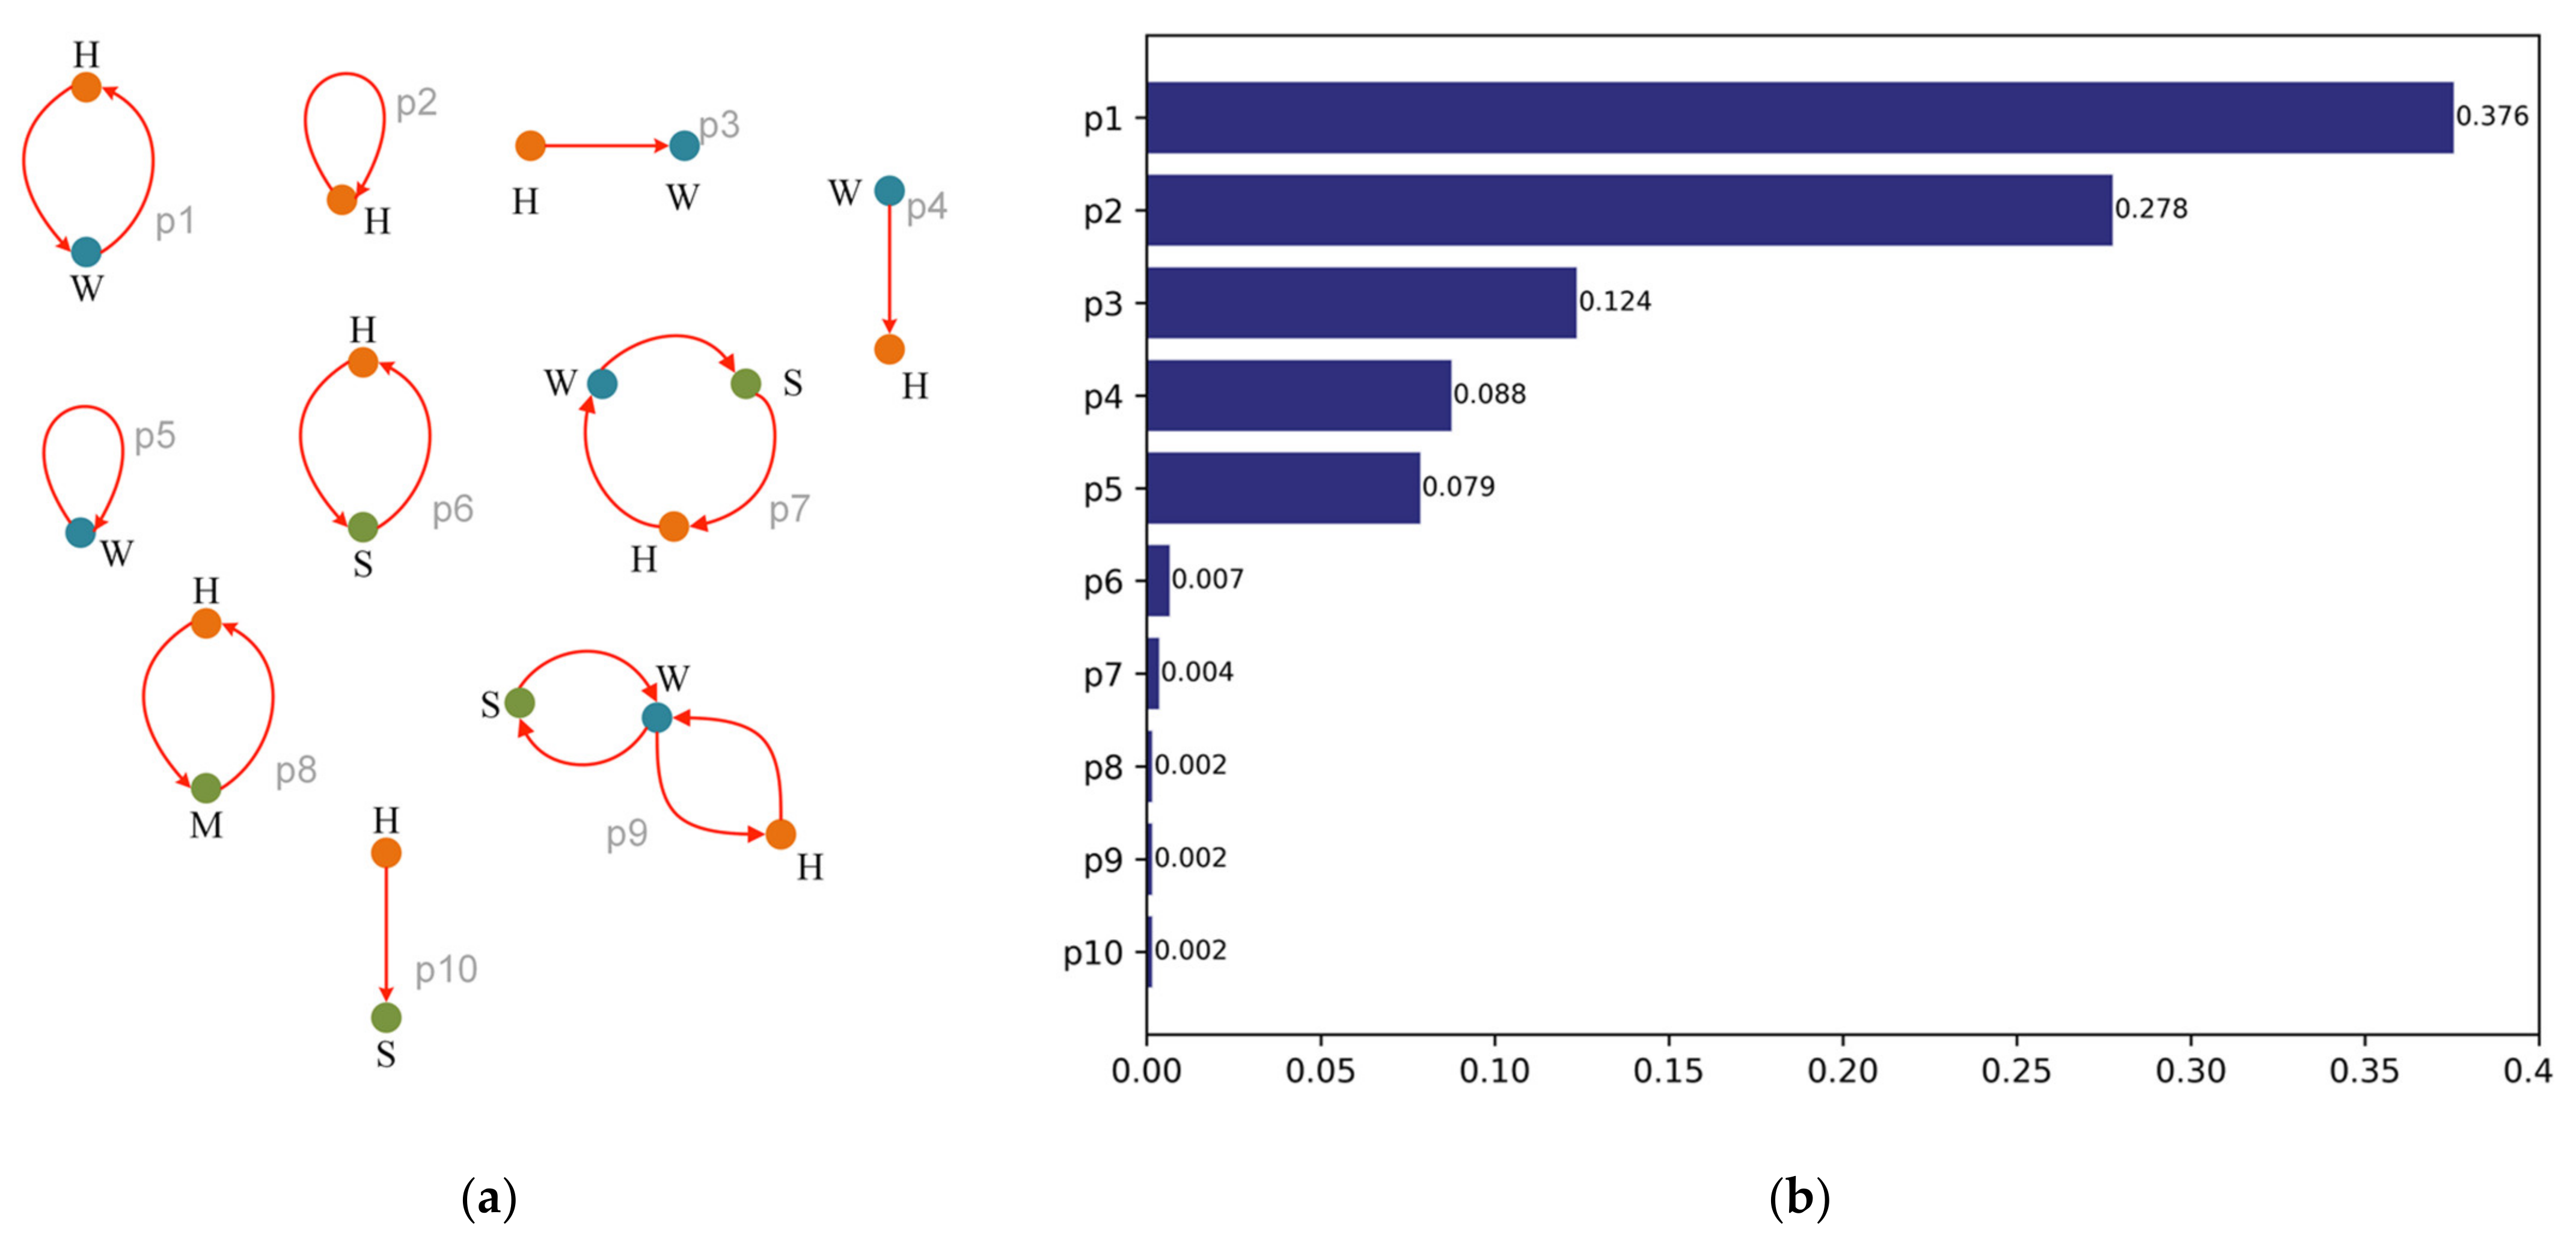
- Label the user’s daily activity chain with the corresponding activity type for stays occurring at home and workplace. Due to the existence of night shift or no workgroups, all possible combinations of day and night activity types are limited to “H-W”, “W-H”, or “H-H”.
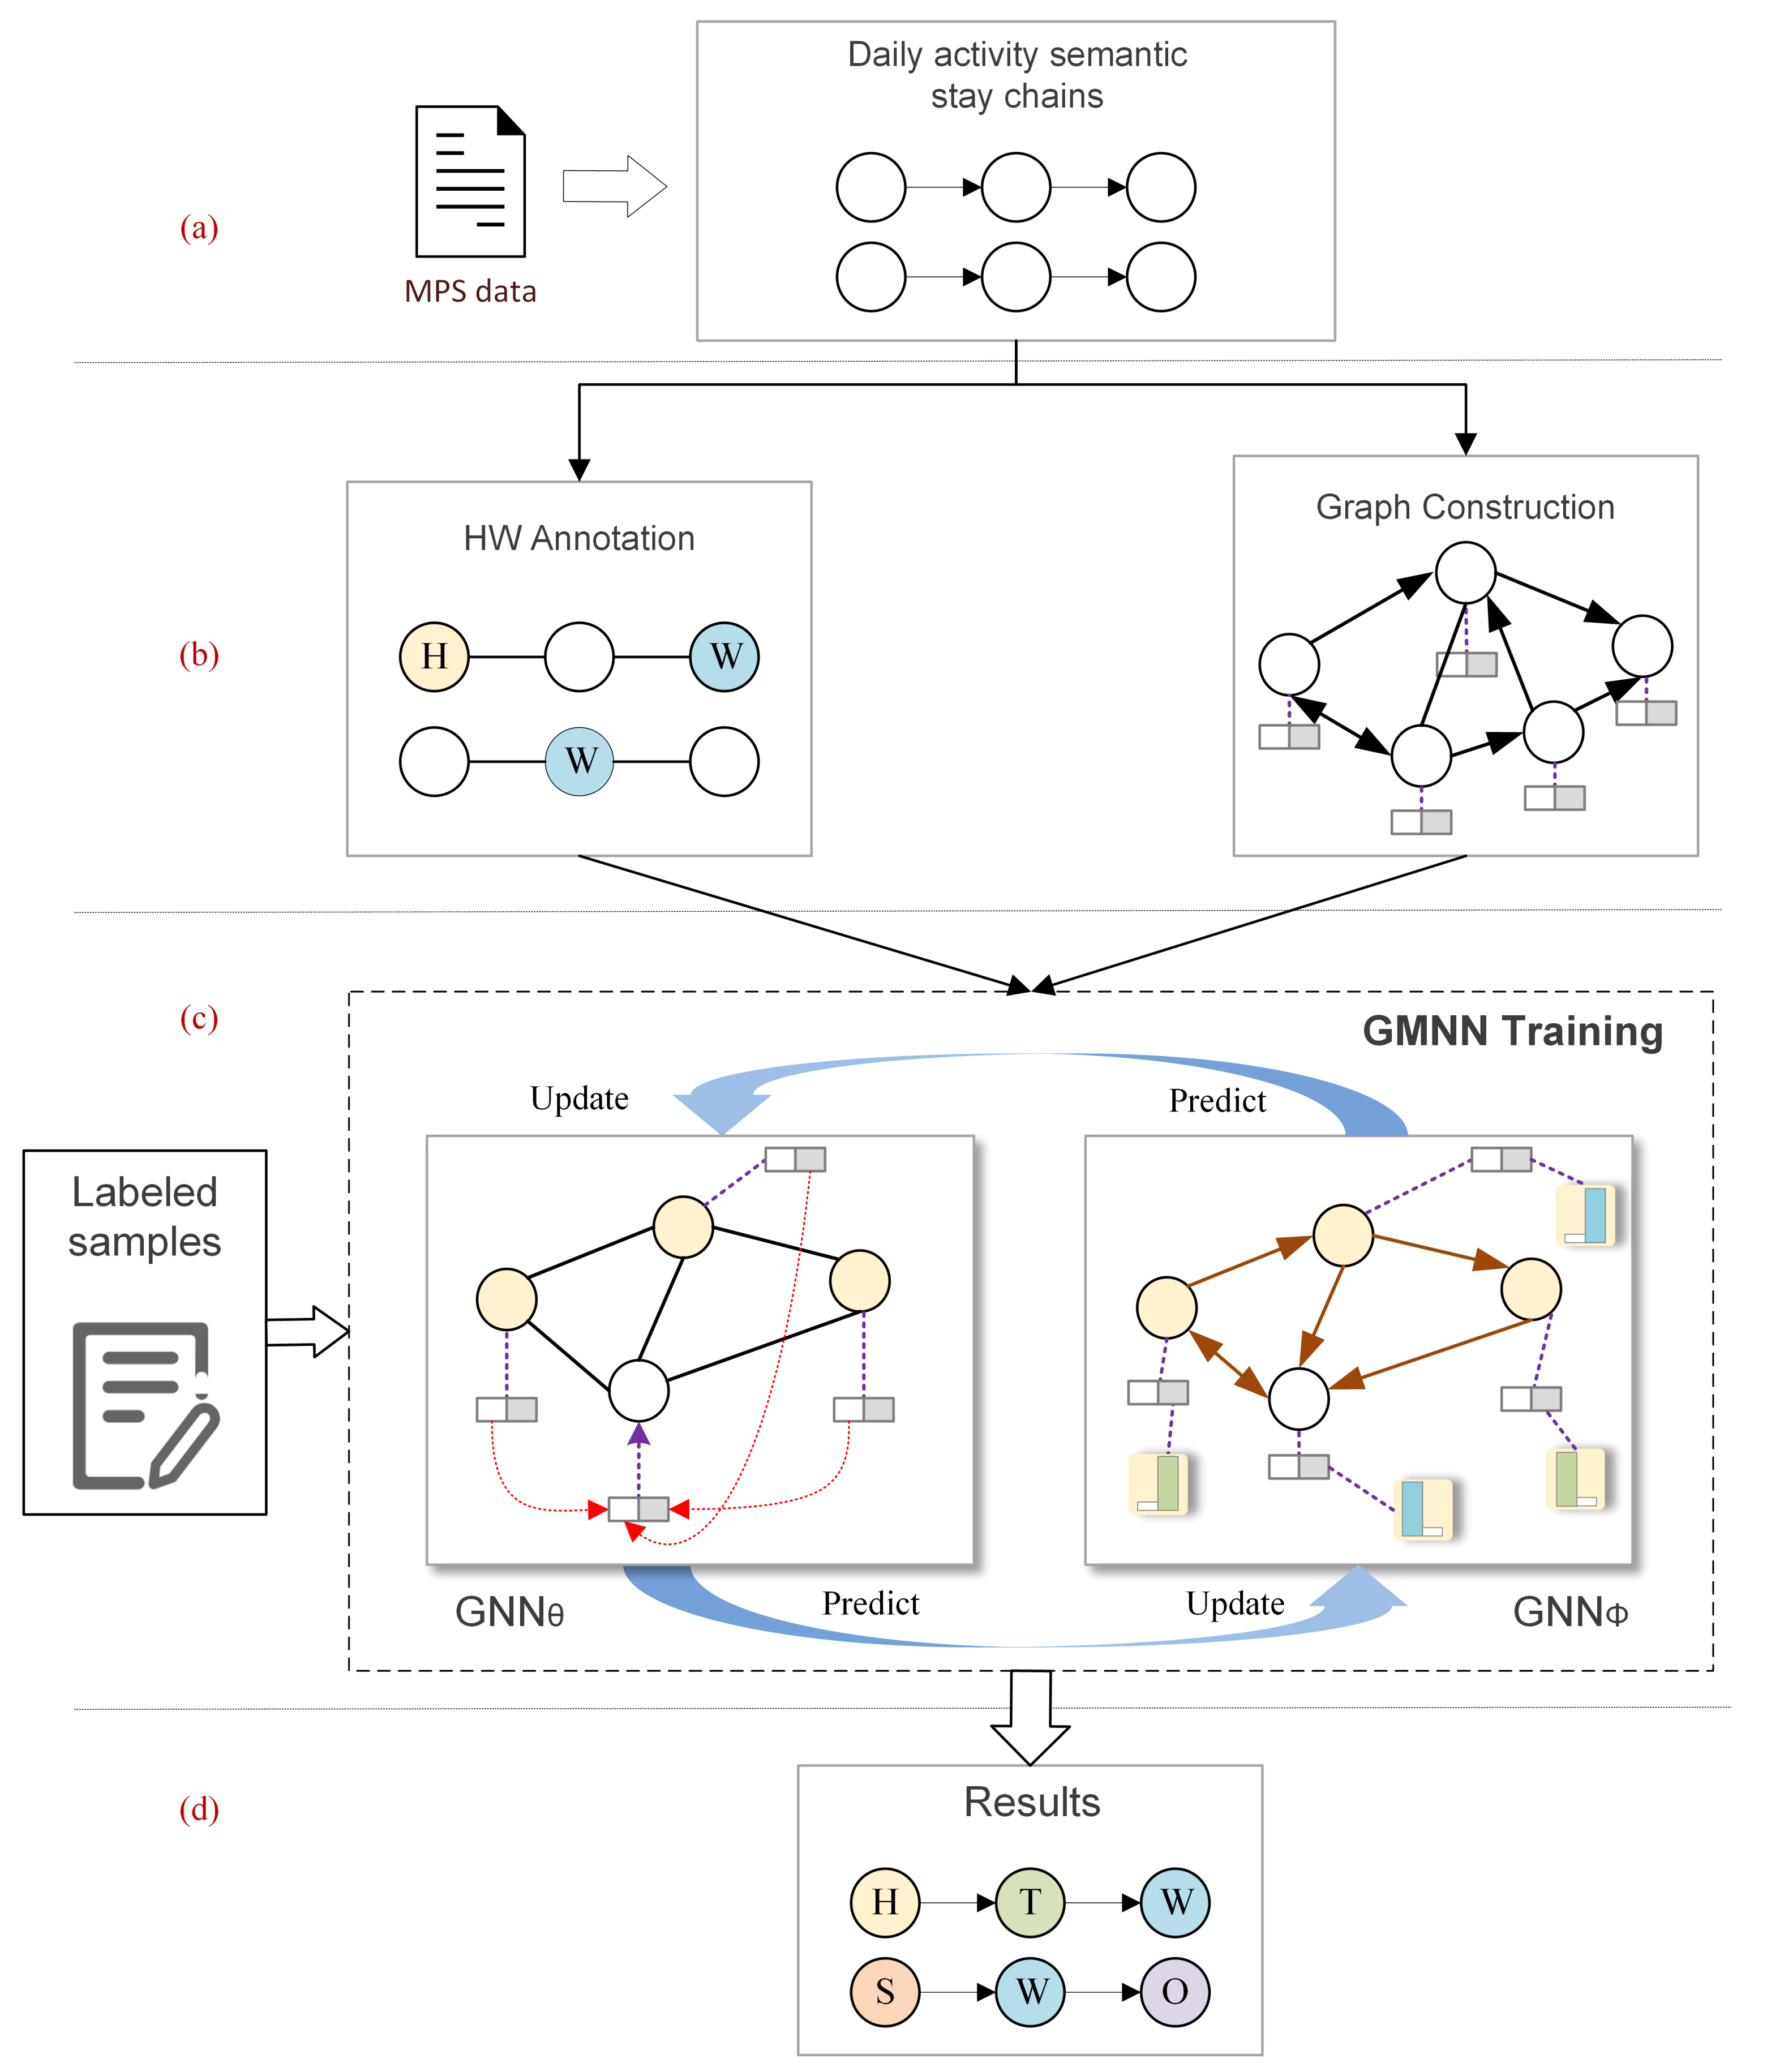
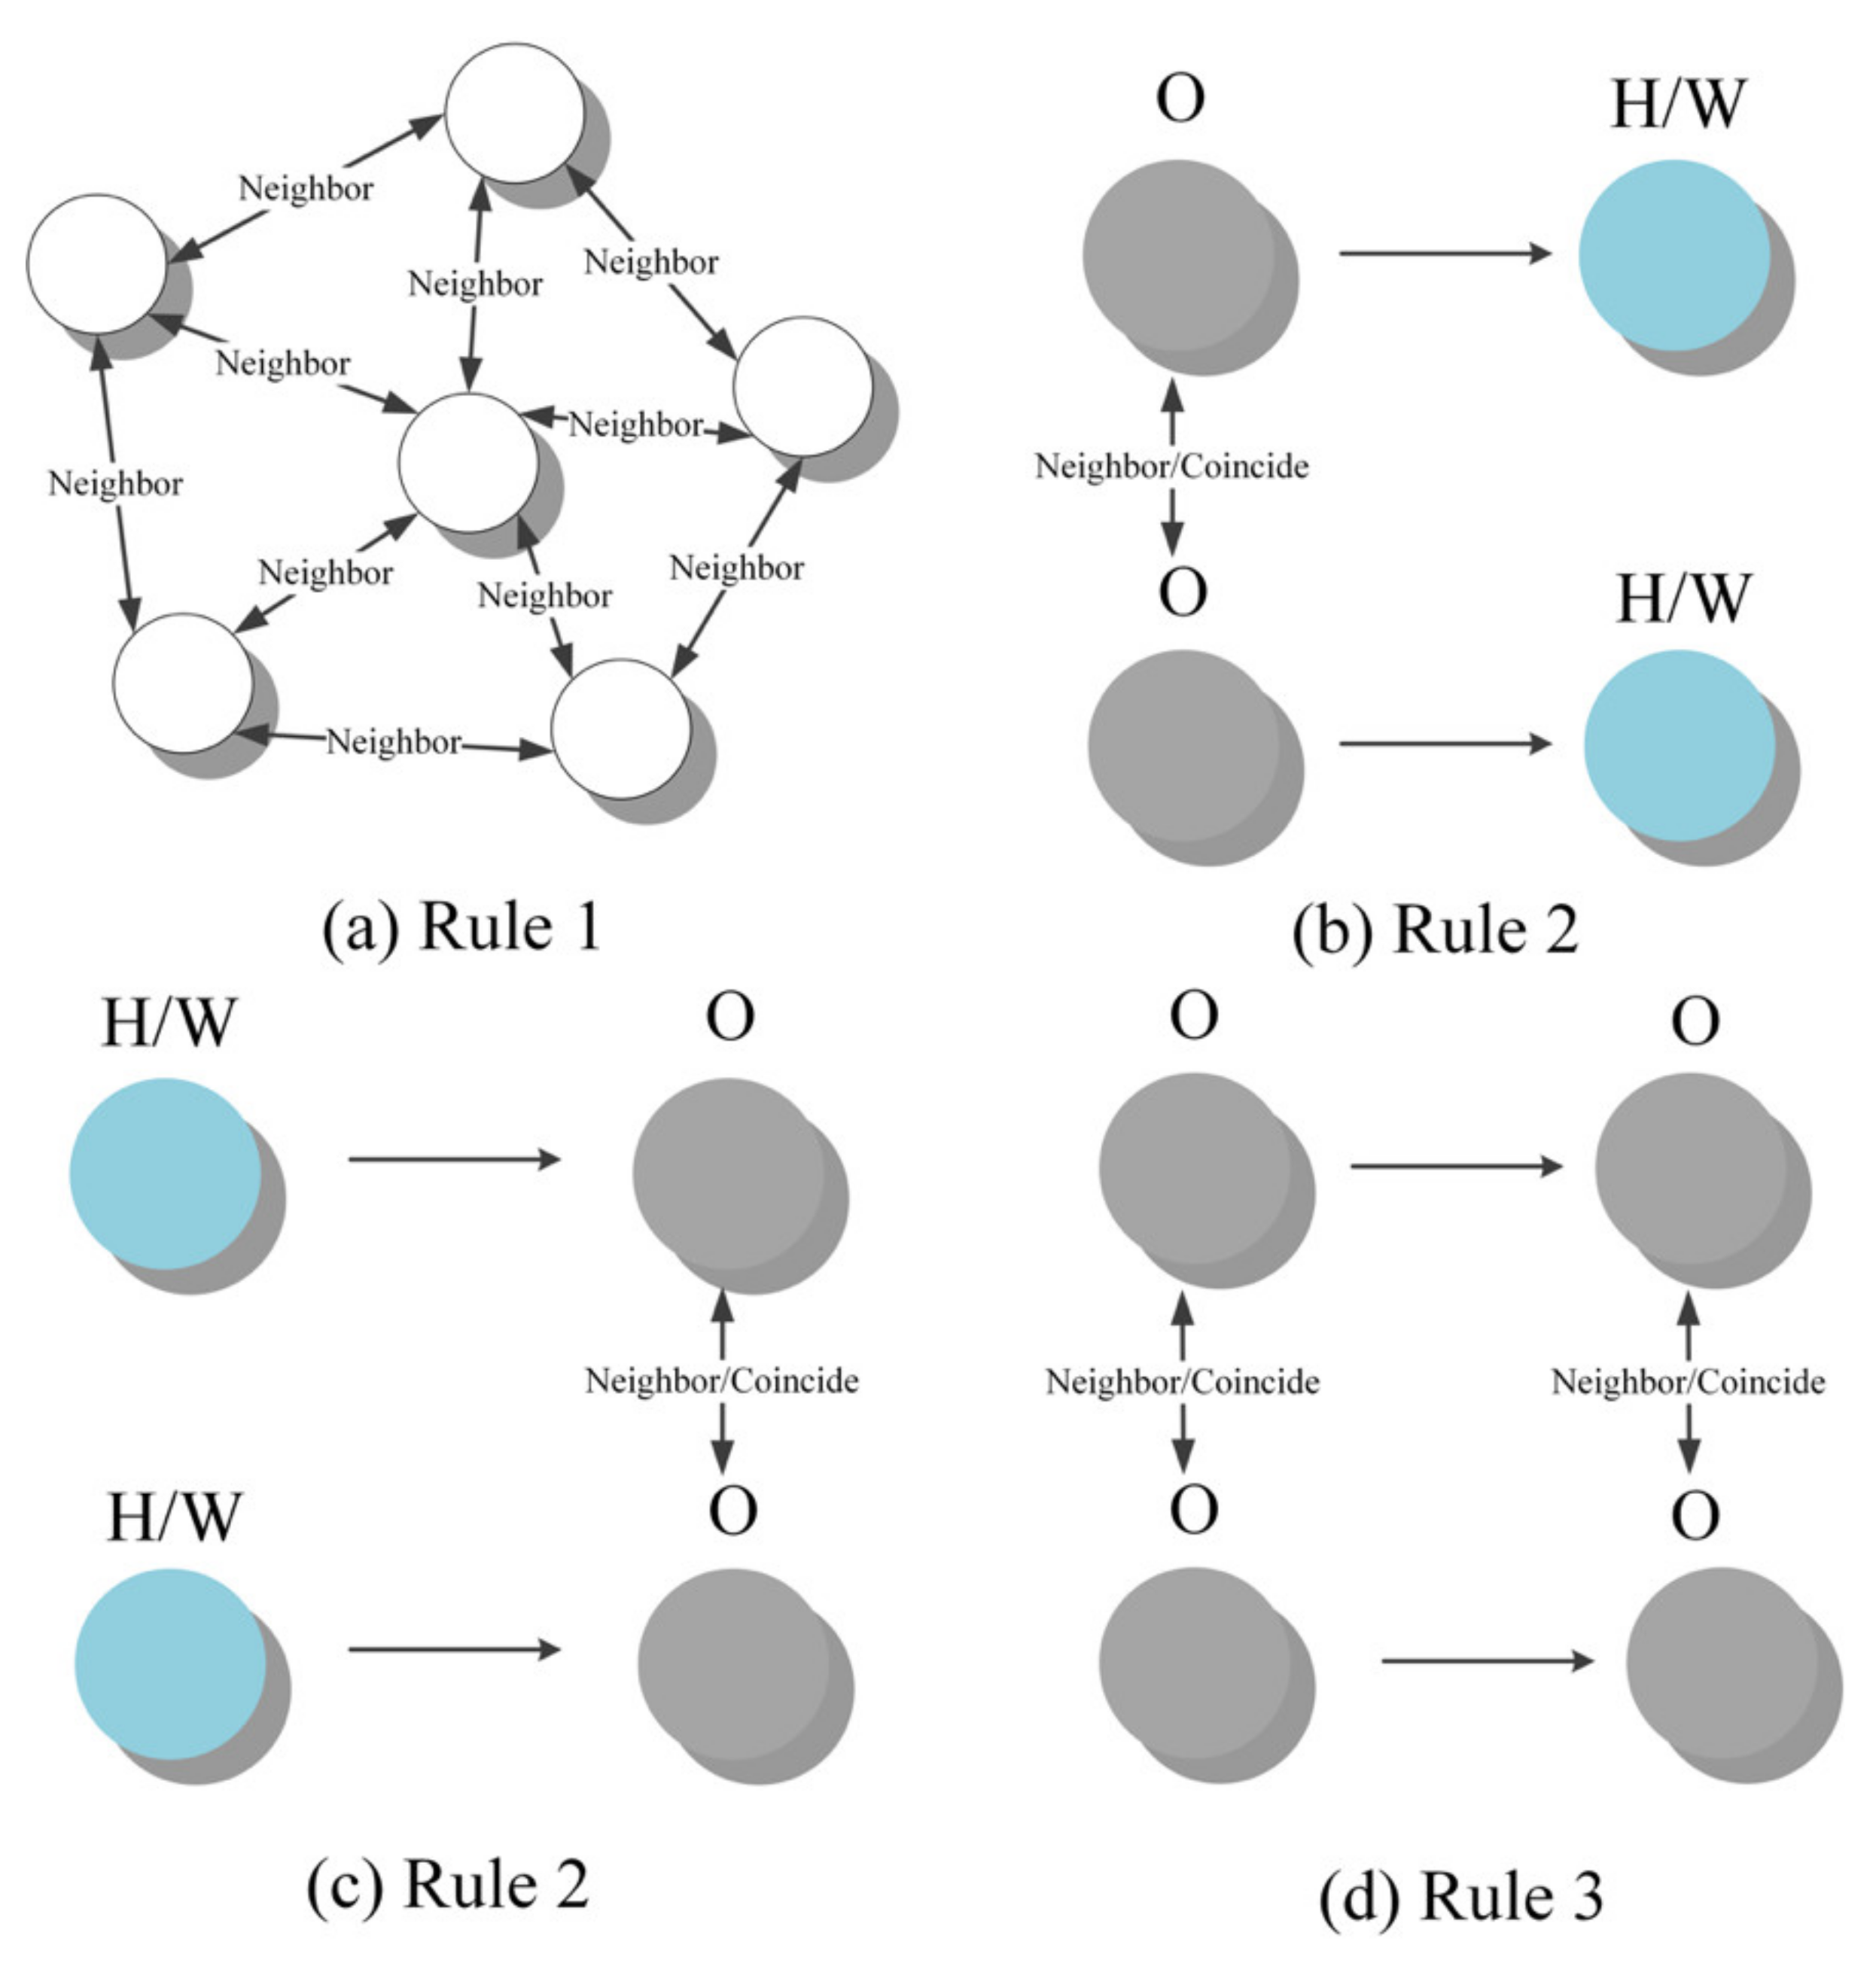
2.3. Urban Activity Inference Model (UAIM) for Annotating Urban Activities
- Excludes users with only contain ‘H’ and ‘W’ activities.
- The activity chains covering various areas of the city are randomly selected.
- All urban land types should be covered within the selected activity areas.
- The activity chain data of 2, 3, 4, 5, and more than five stays were selected at a ratio of about 20%.
3. Model Training and Comparison Experiments
3.1. Data Description
3.2. Model Parameter Setting
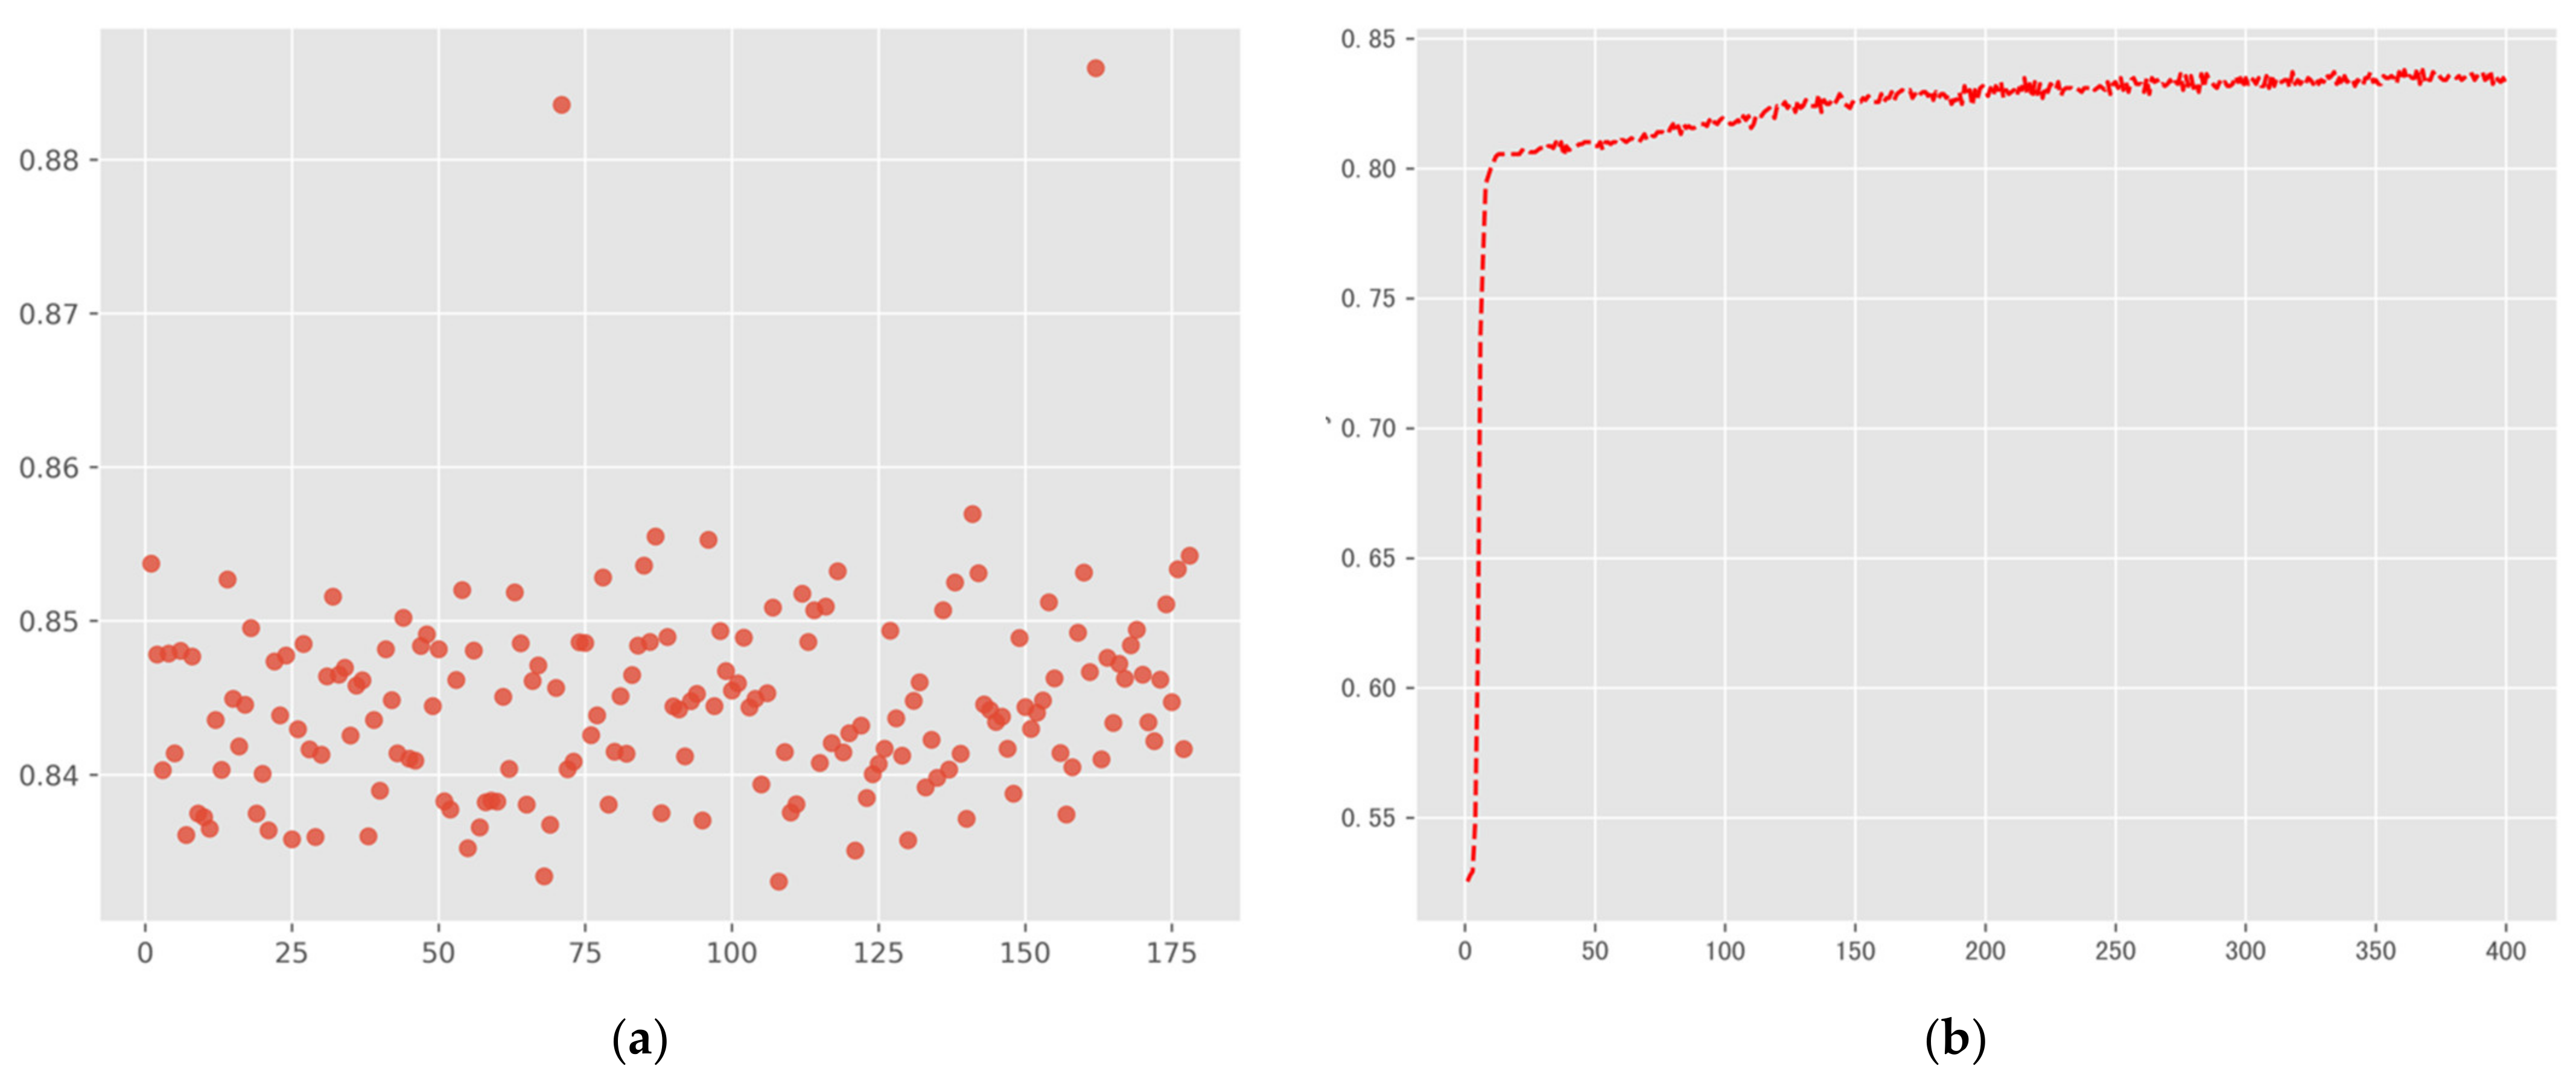
3.3. Model Training and Result Accuracy
3.4. Comparing with RMNs-Based Model
4. Results and Discussion
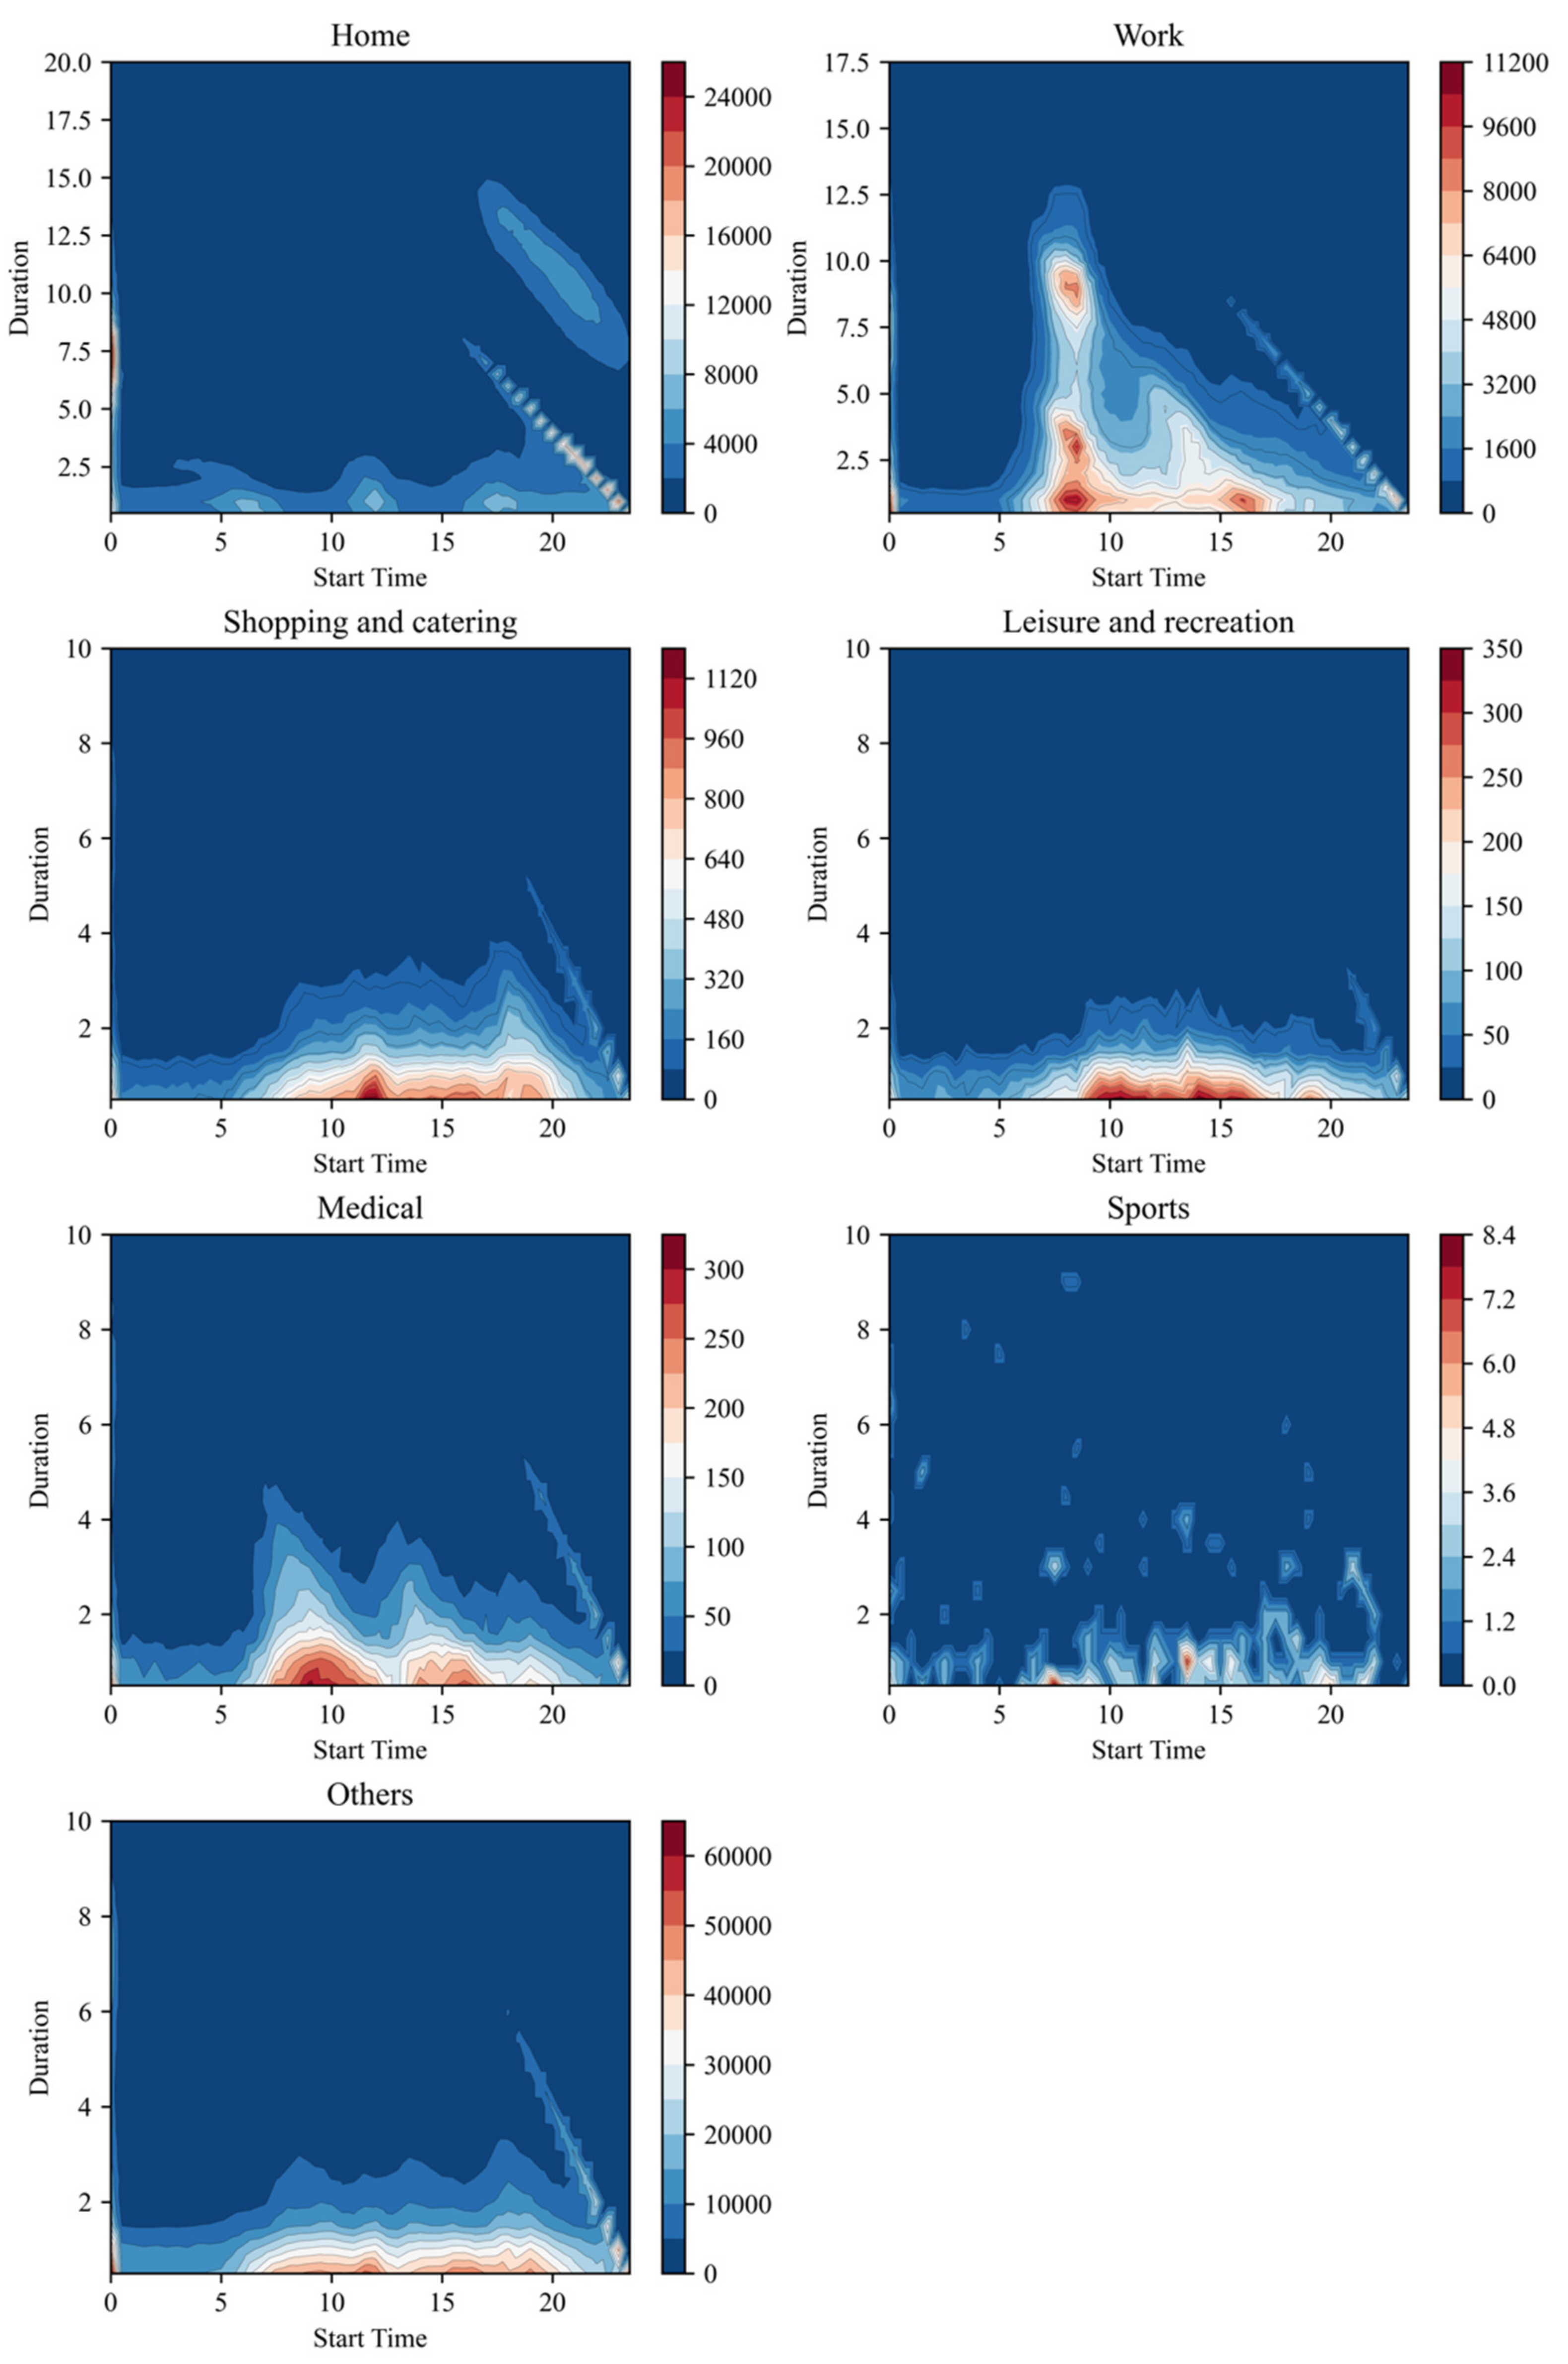
4.1. Temporal Dynamics of Urban Activities
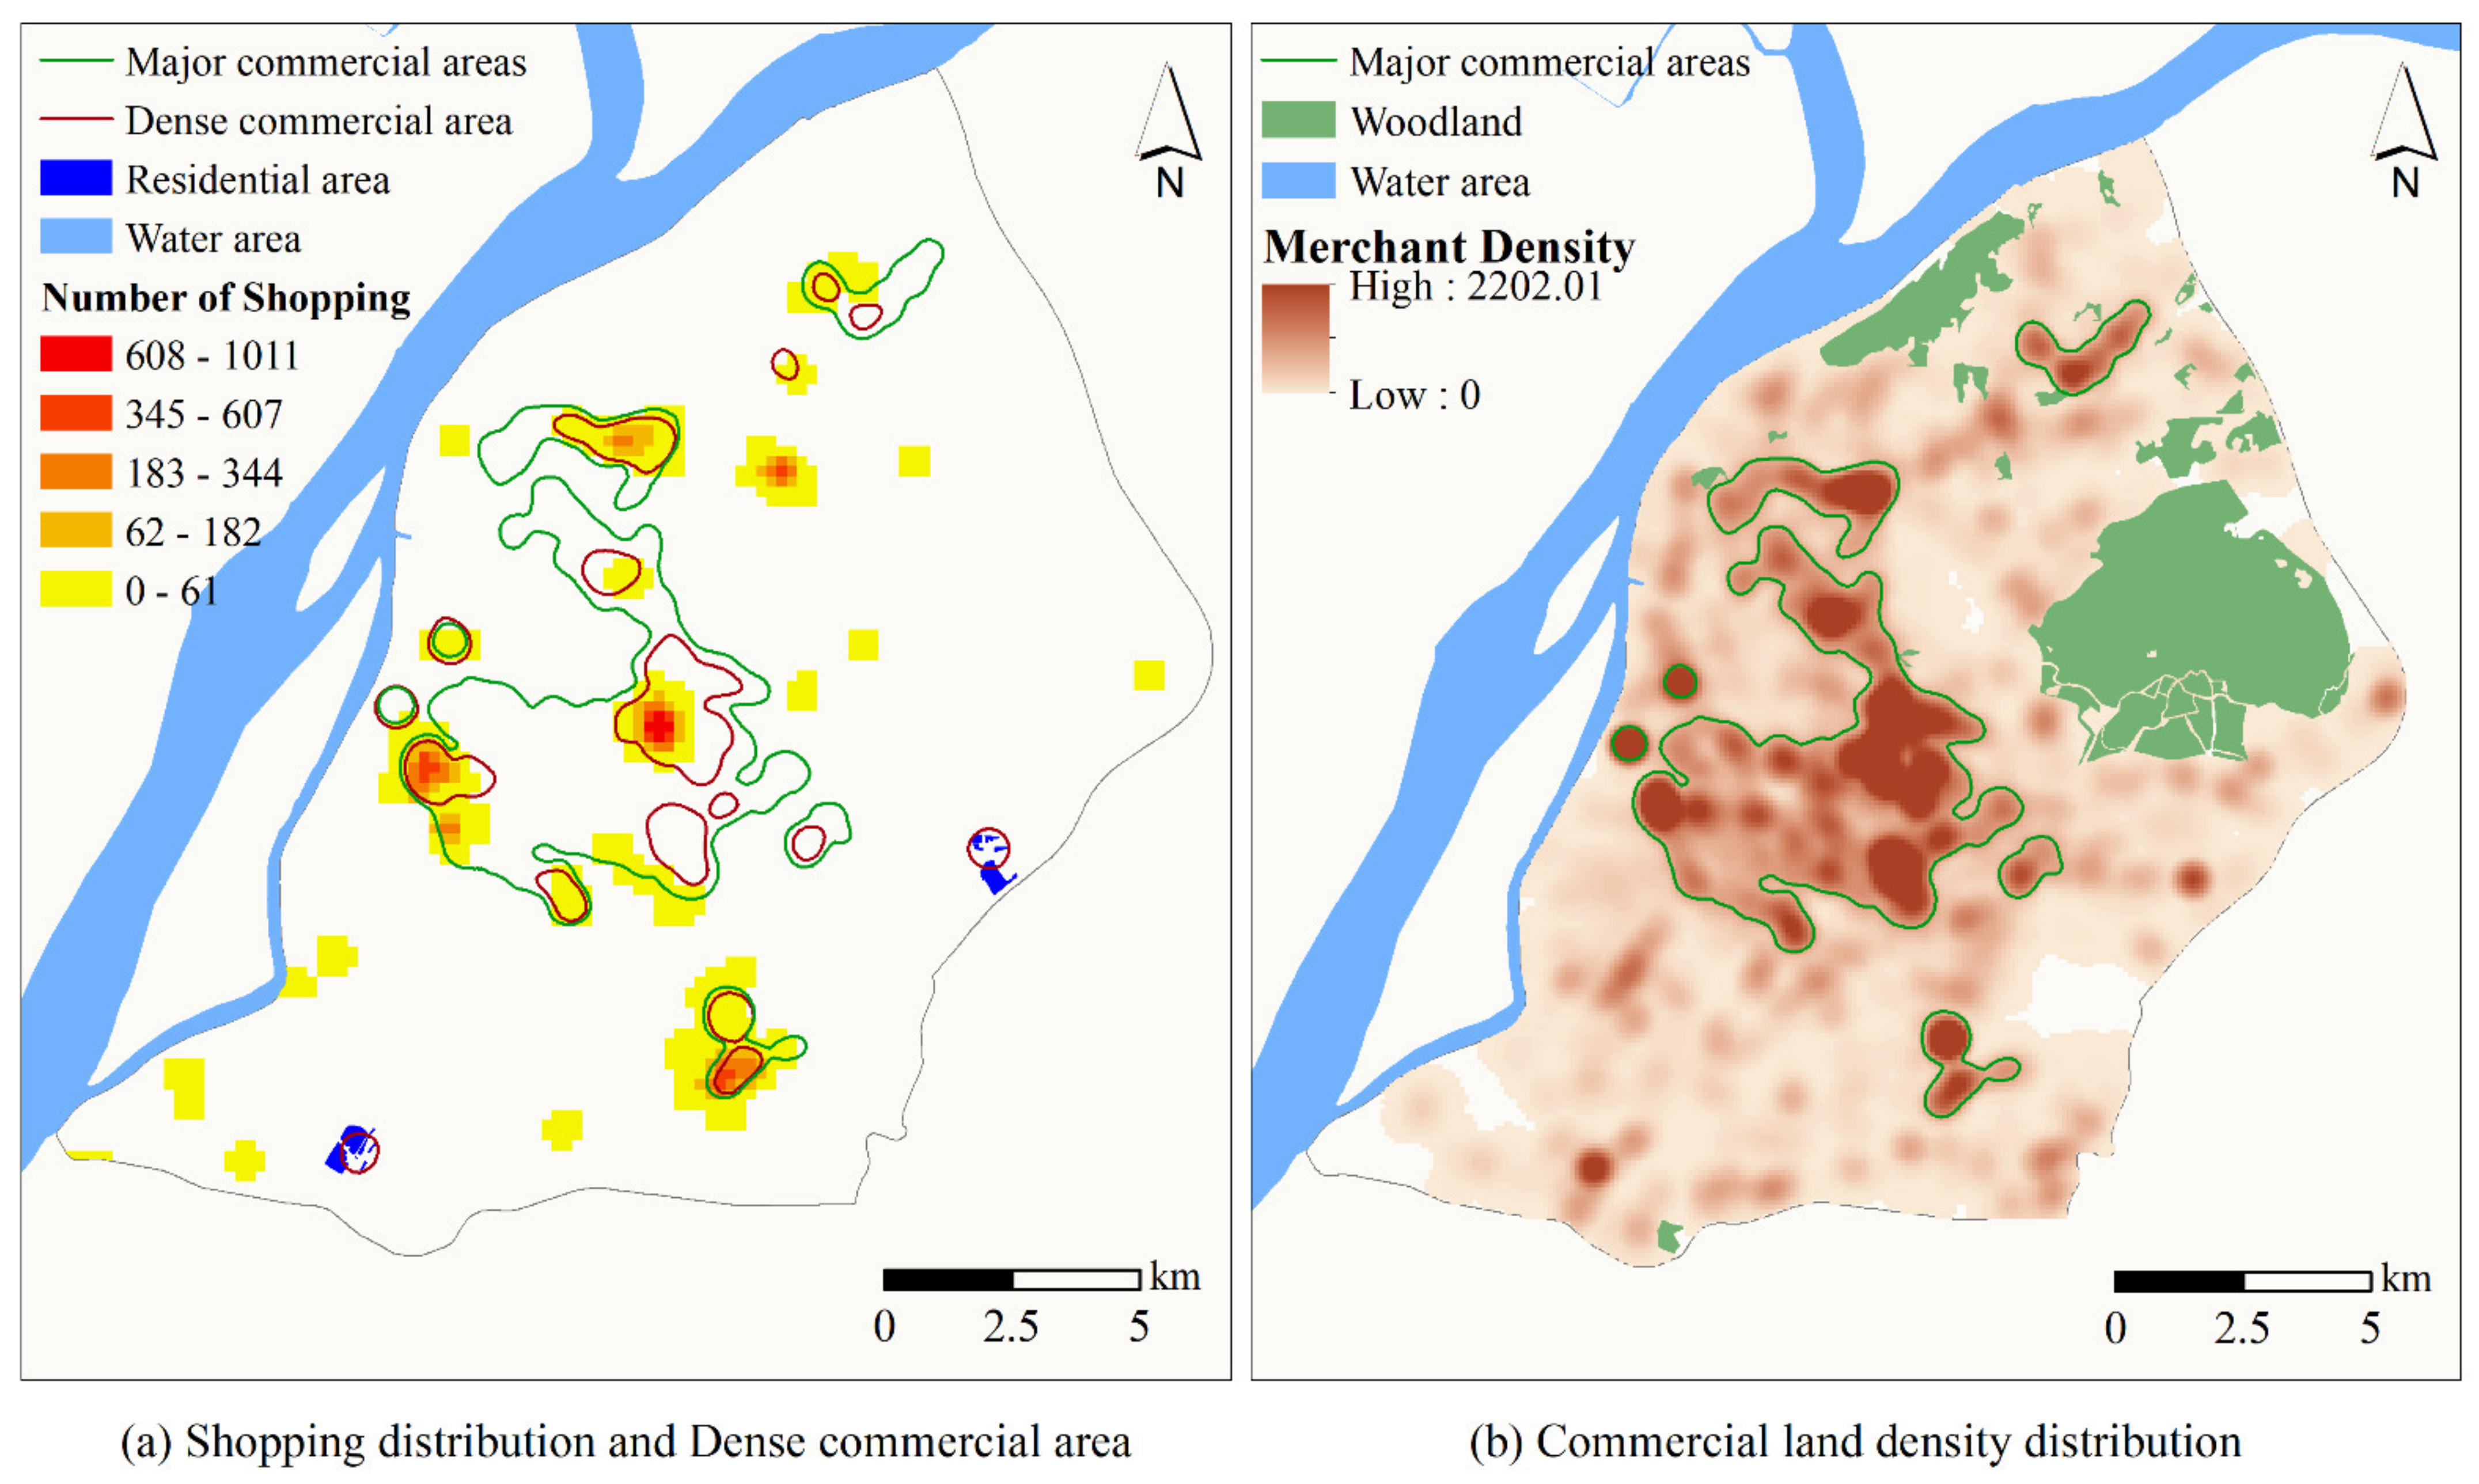
4.2. Verification of Urban Activity Spatial Distribution with Ground Truth
5. Conclusions and Future Research
Author Contributions
Funding
Institutional Review Board Statement
Informed Consent Statement
Data Availability Statement
Conflicts of Interest
Appendix A

| Category Number | Classification of Activities | Activity Description |
|---|---|---|
| 1 | Home (H) | Homelife, rest, recreation, and other activities |
| 2 | Working (W) | Work activities in factories, government agencies, enterprises, and institutions as well as education and research activities in primary and secondary schools, universities, and research institutes |
| 3 | Shopping and catering (S) | Shopping and dining out activities |
| 4 | Leisure and recreation (T) | Visits, leisure, and sightseeing activities in tourist attractions, playgrounds, parks, zoos, and other areas; as well as entertainment activities in bars, KTVs, theaters, and other related places |
| 5 | Sports (G) | Track and field, playing ball, swimming, and other exercise or fitness activities |
| 6 | Medical (M) | Medical treatment activities |
| 7 | Others (O) | Except for the above urban activities, such as transportation, religious activities, etc. |
Appendix B
| Land-Use Type | Code | Description |
|---|---|---|
| Residential land | R | Residential construction land, including residential areas, apartments, student and staff dormitories, hotels, etc. |
| Commercial service land | B | All kinds of commercial, business, and entertainment facilities, including shopping malls, supermarkets, restaurants, agricultural products sales, wholesale markets, furniture markets, etc. |
| Office space | M | Industrial construction land used for production, technological innovation, industrial parks, factory workshops, government offices, etc. |
| Land for Education and Research | E | Places for the construction of education and scientific research, including universities, primary and secondary schools, scientific research institutes, etc. |
| Sightseeing Land | T | Areas providing leisure and recreation services for the public, including parks, squares, entertainment grounds, tourist attractions, museums, cultural centers, heritage sites, etc. |
| Sports and Recreation Land | S | Land for all kinds of entertainment and health facilities, including theatres, cinemas, stadiums, golf courses, fishing gardens, etc. |
| Medical and health use | H | Places that provide medical treatment, health care, sanitation, epidemic prevention, and rehabilitation services to the public, including general hospitals, specialized hospitals, community health service stations, and epidemic prevention stations. |
| Other lands | U | Including transportation facilities, public service facilities (fire, power supply, communication, etc.), natural waters, green space, and other areas. |
References
- Melnikov, V.R.; Krzhizhanovskaya, V.V.; Lees, M.H.; Boukhanovsky, A.V. Data-driven travel demand modelling and agent-based traffic simulation in Amsterdam urban area. Procedia Comput. Sci. 2016, 80, 2030–2041. [Google Scholar] [CrossRef][Green Version]
- McKercher, B.; Shoval, N.; Ng, E.; Birenboim, A. First and repeat visitor behaviour: GPS tracking and GIS analysis in Hong Kong. Tour. Geogr. 2012, 14, 147–161. [Google Scholar] [CrossRef]
- Caldeira, A.M.; Kastenholz, E. Spatiotemporal tourist behaviour in urban destinations: A framework of analysis. Tour. Geogr. 2020, 22, 22–50. [Google Scholar] [CrossRef]
- Jiang, S.; Ferreira, J.; González, M.C. Discovering urban spatial-temporal structure from human activity patterns. In Proceedings of the ACM SIGKDD International Workshop on Urban Computing (UrbComp’12), Beijing, China, 12 August 2012; ACM: New York, NY, USA, 2012; pp. 95–102. [Google Scholar] [CrossRef]
- Zhong, C.; Huang, X.; Müller Arisona, S.; Schmitt, G.; Batty, M. Inferring building functions from a probabilistic model using public transportation data. Comput. Environ. Urban Syst. 2014, 48, 124–137. [Google Scholar] [CrossRef]
- Shi, Y.; Yang, J.; Shen, P. Revealing the Correlation between Population Density and the Spatial Distribution of Urban Public Service Facilities with Mobile Phone Data. ISPRS Int. J. Geo. Inf. 2020, 9, 38. [Google Scholar] [CrossRef]
- Hashem, I.A.T.; Chang, V.; Anuar, N.B.; Adewole, K.; Yaqoob, I.; Gani, A.; Ahmed, E.; Chiroma, H. The role of big data in smart city. Int. J. Inf. Manage. 2016, 36, 748–758. [Google Scholar] [CrossRef]
- Chen, B.Y.; Wang, Y.; Wang, D.; Li, Q.; Lam, W.H.K.; Shaw, S.-L. Understanding the impacts of human mobility on accessibility using massive mobile phone tracking data. Ann. Am. Assoc. Geogr. 2018, 108, 1115–1133. [Google Scholar] [CrossRef]
- Liu, L.; Biderman, A.; Ratti, C. Urban Mobility Landscape: Real Time Monitoring of Urban Mobility Patterns. In Proceedings of the International Conference on Computers in Urban Planning and Urban Management, Hong Kong, China, 16–18 June 2009. [Google Scholar]
- Ahas, R.; Aasa, A.; Yuan, Y.; Raubal, M.; Smoreda, Z.; Liu, Y.; Ziemlicki, C.; Tiru, M.; Zook, M. Everyday space–time geographies: Using mobile phone-based sensor data to monitor urban activity in Harbin, Paris, and Tallinn. Int. J. Geogr. Inf. Sci. 2015, 29, 2017–2039. [Google Scholar] [CrossRef]
- Calabrese, F.; Diao, M.; Di Lorenzo, G.; Ferreira, J.; Ratti, C. Understanding individual mobility patterns from urban sensing data: A mobile phone trace example. Transp. Res. Part C Emerg. Technol. 2013, 26, 301–313. [Google Scholar] [CrossRef]
- Fang, Z.; Yang, X.; Xu, Y.; Shaw, S.L.; Yin, L. Spatiotemporal model for assessing the stability of urban human convergence and divergence patterns. Int. J. Geogr. Inf. Sci. 2017, 31, 2119–2141. [Google Scholar] [CrossRef]
- Zhong, C.; Manley, E.; Müller Arisona, S.; Batty, M.; Schmitt, G. Measuring variability of mobility patterns from multiday smart-card data. J. Comput. Sci. 2015, 9, 125–130. [Google Scholar] [CrossRef]
- Singh, P.; Oh, K.; Jung, J.-Y. Flow Orientation Analysis for Major Activity Regions Based on Smart Card Transit Data. ISPRS Int. J. Geo. Inf. 2017, 6, 318. [Google Scholar] [CrossRef]
- Siła-Nowicka, K.; Vandrol, J.; Oshan, T.; Long, J.A.; Demšar, U.; Fotheringham, A.S. Analysis of human mobility patterns from GPS trajectories and contextual information. Int. J. Geogr. Inf. Sci. 2016, 30, 881–906. [Google Scholar] [CrossRef]
- Xu, Y.; Shaw, S.L.; Zhao, Z.; Yin, L.; Fang, Z.; Li, Q. Understanding aggregate human mobility patterns using passive mobile phone location data: A home-based approach. Transportation 2015, 42, 625–646. [Google Scholar] [CrossRef]
- García-Palomares, J.C.; Salas-Olmedo, M.H.; Moya-Gómez, B.; Condeço-Melhorado, A.; Gutiérrez, J. City dynamics through Twitter: Relationships between land use and spatiotemporal demographics. Cities 2018, 72, 310–319. [Google Scholar] [CrossRef]
- Chua, A.; Servillo, L.; Marcheggiani, E.; Moere, A. Vande Mapping Cilento: Using geotagged social media data to characterize tourist flows in southern Italy. Tour. Manag. 2016, 57, 295–310. [Google Scholar] [CrossRef]
- Xie, K.; Xia, C.; Grinberg, N.; Schwartz, R.; Naaman, M. Robust detection of hyper-local events from geotagged social media data. In Proceedings of the Thirteenth International Workshop on Multimedia Data Mining, Chicago, IL, USA, 11 August 2013; pp. 1–9. [Google Scholar]
- Long, Y.; Thill, J.C. Combining smart card data and household travel survey to analyze jobs-housing relationships in Beijing. Comput. Environ. Urban Syst. 2015, 53, 19–35. [Google Scholar] [CrossRef]
- Deng, Z.; Ji, M. Deriving rules for trip purpose identification from GPS travel survey data and land use data: A machine learning approach. In Proceedings of the 7th International Conference on Traffic and Transportation Studies, Kuming, China, 3–5 August 2010; pp. 768–777. [Google Scholar]
- Sun, X.; Wilmot, C.G.; Kasturi, T. Household travel, household characteristics, and land use: An empirical study from the 1994 Portland activity-based travel survey. Transp. Res. Rec. 1998, 1617, 10–17. [Google Scholar] [CrossRef]
- Jurdak, R.; Zhao, K.; Liu, J.; AbouJaoude, M.; Cameron, M.; Newth, D. Understanding human mobility from Twitter. PLoS ONE 2015, 10, e0131469. [Google Scholar] [CrossRef]
- Malik, M.M.; Lamba, H.; Nakos, C.; Pfeffer, J. Population bias in geotagged tweets. In Proceedings of the 2015 ICWSM Workshop on Standards and Practices in Large-scale Social Media Research, Oxford, UK, 26–29 May 2015; Volume 1, pp. 18–27. [Google Scholar]
- Chen, S.; Yuan, X.; Wang, Z.; Guo, C.; Liang, J.; Wang, Z.; Zhang, X.; Zhang, J. Interactive visual discovering of movement patterns from sparsely sampled geo-tagged social media data. IEEE Trans. Vis. Comput. Graph. 2015, 22, 270–279. [Google Scholar] [CrossRef]
- Järv, O.; Tenkanen, H.; Toivonen, T. Enhancing spatial accuracy of mobile phone data using multi-temporal dasymetric interpolation. Int. J. Geogr. Inf. Sci. 2017, 31, 1630–1651. [Google Scholar] [CrossRef]
- Chen, J.; Pei, T.; Shaw, S.L.; Lu, F.; Li, M.; Cheng, S.; Liu, X.; Zhang, H. Fine-grained prediction of urban population using mobile phone location data. Int. J. Geogr. Inf. Sci. 2018, 32, 1770–1786. [Google Scholar] [CrossRef]
- Kubíček, P.; Konečný, M.; Stachoň, Z.; Shen, J.; Herman, L.; Řezník, T.; Staněk, K.; Štampach, R.; Leitgeb, Š. Population distribution modelling at fine spatio-temporal scale based on mobile phone data. Int. J. Digit. Earth 2019, 12, 1319–1340. [Google Scholar] [CrossRef]
- Calabrese, F.; Colonna, M.; Lovisolo, P.; Parata, D.; Ratti, C. Real-time urban monitoring using cell phones: A case study in Rome. IEEE Trans. Intell. Transp. Syst. 2011, 12, 141–151. [Google Scholar] [CrossRef]
- Calabrese, F.; Ferrari, L.; Blondel, V.D. Urban Sensing Using Mobile Phone Network Data: A Survey of Research. ACM Comput. Surv. 2014, 47, 1–20. [Google Scholar] [CrossRef]
- Sagl, G.; Blaschke, T.; Beinat, E.; Resch, B. Ubiquitous geo-sensing for context-aware analysis: Exploring relationships between environmental and human dynamics. Sensors 2012, 12, 9800–9822. [Google Scholar] [CrossRef]
- Yuan, Y.; Raubal, M. Extracting dynamic urban mobility patterns from mobile phone data. In Geographic Information Science; Xiao, N., Kwan, M.P., Goodchild, M.F., Shekhar, S., Eds.; Springer: Berlin/Heidelberg, Germany, 2012; pp. 354–367. [Google Scholar]
- Deville, P.; Linard, C.; Martin, S.; Gilbert, M.; Stevens, F.R.; Gaughan, A.E.; Blondel, V.D.; Tatem, A.J. Dynamic population mapping using mobile phone data. Proc. Natl. Acad. Sci. USA 2014, 111, 15888–15893. [Google Scholar] [CrossRef] [PubMed]
- Calafiore, A.; Palmer, G.; Comber, S.; Arribas-Bel, D.; Singleton, A. A geographic data science framework for the functional and contextual analysis of human dynamics within global cities. Comput. Environ. Urban Syst. 2021, 85, 101539. [Google Scholar] [CrossRef]
- Schneider, C.M.; Belik, V.; Couronné, T.; Smoreda, Z.; González, M.C. Unravelling daily human mobility motifs. J. R. Soc. Interface 2013, 10, 20130246. [Google Scholar] [CrossRef]
- Jiang, S.; Ferreira, J.; Gonzalez, M.C. Activity-Based Human Mobility Patterns Inferred from Mobile Phone Data: A Case Study of Singapore. IEEE Trans. Big Data 2017, 3, 208–219. [Google Scholar] [CrossRef]
- Jiang, S.; Fiore, G.A.; Yang, Y.; Ferreira, J.; Frazzoli, E.; González, M.C. A review of urban computing for mobile phone traces: Current methods, challenges and opportunities. In Proceedings of the ACM SIGKDD International Conference on Knowledge Discovery and Data Mining, Chicago, IL, USA, 11–14 August 2013. [Google Scholar]
- Widhalm, P.; Yang, Y.; Ulm, M.; Athavale, S.; González, M.C. Discovering urban activity patterns in cell phone data. Transportation 2015, 42, 597–623. [Google Scholar] [CrossRef]
- Yang, Y.; Widhalm, P.; Athavale, S.; González, M.C. Mobility sequence extraction and labeling using sparse cell phone data. In Proceedings of the 30th AAAI Conference on Artificial Intelligence (AAAI 2016), Phoenix, AZ, USA, 12–17 February 2018; pp. 4276–4277. [Google Scholar]
- Phithakkitnukoon, S.; Horanont, T.; Di Lorenzo, G.; Shibasaki, R.; Ratti, C. Activity-aware map: Identifying human daily activity pattern using mobile phone data. In Human Behavior Understanding; Salah, A., Gevers, T., Sebe, N., Vinciarelli, A., Eds.; Springer: Berlin/Heidelberg, Germany, 2010; Volume 6219, pp. 14–25. [Google Scholar]
- Liu, F.; Janssens, D.; Wets, G.; Cools, M. Annotating mobile phone location data with activity purposes using machine learning algorithms. Expert Syst. Appl. 2013, 40, 3299–3311. [Google Scholar] [CrossRef]
- Noulas, A.; Mascolo, C.; Frias-Martinez, E. Exploiting foursquare and cellular data to infer user activity in urban environments. In Proceedings of the—IEEE International Conference on Mobile Data Management, Milan, Italy, 3–6 June 2013; Volume 1, pp. 167–176. [Google Scholar]
- Tu, W.; Cao, J.; Yue, Y.; Shaw, S.L.; Zhou, M.; Wang, Z.; Chang, X.; Xu, Y.; Li, Q. Coupling mobile phone and social media data: A new approach to understanding urban functions and diurnal patterns. Int. J. Geogr. Inf. Sci. 2017, 31, 2331–2358. [Google Scholar] [CrossRef]
- Diao, M.; Zhu, Y.; Ferreira, J.; Ratti, C. Inferring individual daily activities from mobile phone traces: A Boston example. Environ. Plan. B Plan. Des. 2016, 43, 920–940. [Google Scholar] [CrossRef]
- Dalcanale, F. Polymer Derived Ceramics Process in Biomedical Applications: Pacemaker Electrode; ETH Zurich: Zürich, Switzerland, 2017; p. 147. [Google Scholar]
- Gov.UK. National Travel Survey. Available online: https://www.gov.uk/government/collections/national-travel-survey-statistics#latest-national-travel-survey-statistics (accessed on 9 August 2021).
- Ulm, M.; Widhalm, P.; Brändle, N. Characterization of mobile phone localization errors with OpenCellID data. In Proceedings of the IEEE International Conference on Advanced Logistics and Transport, Valenciennes, France, 20–22 May 2015; pp. 100–104. [Google Scholar]
- Zhong, G.; Wan, X.; Zhang, J.; Yin, T.; Ran, B. Characterizing passenger flow for a transportation hub based on mobile phone data. IEEE Trans. Intell. Transp. Syst. 2016, 18, 1507–1518. [Google Scholar] [CrossRef]
- Lin, H.-P.; Juang, R.-T.; Lin, D.-B. Validation of an improved location-based handover algorithm using GSM measurement data. IEEE Trans. Mob. Comput. 2005, 4, 530–536. [Google Scholar]
- Horn, C.; Klampfl, S.; Cik, M.; Reiter, T. Detecting outliers in cell phone data. Transp. Res. Rec. 2014, 2405, 49–56. [Google Scholar] [CrossRef]
- Benamira, A.; Devillers, B.; Lesot, E.; Ray, A.K.; Saadi, M.; Malliaros, F.D. Semi-supervised learning and graph neural networks for fake news detection. In Proceedings of the 2019 IEEE/ACM International Conference on Advances in Social Networks Analysis and Mining (ASONAM), Vancouver, BC, Canada, 27–30 August 2019; pp. 568–569. [Google Scholar]
- Ahas, R.; Aasa, A.; Silm, S.; Tiru, M. Daily rhythms of suburban commuters’ movements in the Tallinn metropolitan area: Case study with mobile positioning data. Transp. Res. Part C Emerg. Technol. 2010, 18, 45–54. [Google Scholar] [CrossRef]
- Qu, M.; Bengio, Y.; Tang, J. GMNN: Graph markov neural networks. arXiv 2019, arXiv:1905.06214. [Google Scholar]
- Xu, B.; Huang, J.; Hou, L.; Shen, H.; Gao, J.; Cheng, X. Label-Consistency based Graph Neural Networks for Semi-supervised Node Classification. In Proceedings of the 43rd International ACM SIGIR Conference on Research and Development in Information Retrieval, Xi’an, China, 25–30 July 2020; pp. 1897–1900. [Google Scholar]
- Tobler, W.R. A Computer Movie Simulating Urban Growth in the Detroit Region. Econ. Geogr. 1970, 46, 234. [Google Scholar] [CrossRef]
- Aspelin, K.; Carey, N. Establishing Pedestrian Walking Speeds. Project Report, Portland State University, ITE Student Chapter. 2005, pp. 5–25. Available online: https://www.google.rs/url?sa=t&rct=j&q=&esrc=s&source=web&cd=&ved=2ahUKEwiVkdavkqvyAhVNgf0HHcWdBjgQFnoECAQQAQ&url=https%3A%2F%2Fwww.westernite.org%2Fdatacollectionfund%2F2005%2Fpsu_ped_summary.pdf&usg=AOvVaw1HWxPDg8rfHi0wmweJys6Y (accessed on 9 August 2021).
- Hasan, S.; Zhan, X.; Ukkusuri, S.V. Understanding urban human activity and mobility patterns using large-Scale location-based data from online social media. In Proceedings of the 2nd ACM SIGKDD International Workshop on Urban Computing, Chicago Sheraton, Chicago, IL, USA, 11–14 August 2013; pp. 1–8. [Google Scholar]
- Toole, J.L.; Ulm, M.; González, M.C.; Bauer, D. Inferring land use from mobile phone activity. In Proceedings of the ACM SIGKDD International Workshop on Urban Computing—UrbComp’12, Beijing, China, 12 August 2012; ACM: New York, NY, USA, 2012; pp. 1–8. [Google Scholar]
- Liu, X.; Kang, C.; Gong, L.; Liu, Y. Incorporating spatial interaction patterns in classifying and understanding urban land use. Int. J. Geogr. Inf. Sci. 2016, 30, 334–350. [Google Scholar] [CrossRef]
- Maat, K.; Van Wee, B.; Stead, D. Land use and travel behaviour: Expected effects from the perspective of utility theory and activity-based theories. Environ. Plan. B Plan. Des. 2005, 32, 33–46. [Google Scholar] [CrossRef]
- Zhao, Z.; Shaw, S.-L.; Xu, Y.; Lu, F.; Chen, J.; Yin, L. Understanding the bias of call detail records in human mobility research. Int. J. Geogr. Inf. Sci. 2016, 30, 1738–1762. [Google Scholar] [CrossRef]
- China Academy of Urban Planning and Design. Land (GB50137-2011); The Ministry of Housing and Urban-Rural Development of the People’s Republic of China: Beijing, China, 2012; Volume 36, pp. 42–48. [Google Scholar]


| Data Set | Type | Scale | Memory Medium | Data Organization |
|---|---|---|---|---|
| Mobile location data | Original data | 150 GB | HDFS | User ID, time, Cell ID, latitude, and longitude of a base station |
| AOI data | GIS data | 8861 | GDB | Shape, name, land use type, area |
| Activity chains | Intermediate data | 2.6 GB | HDFS | User ID, daily activity chain (each node is composed of stop area ID, arrival time, and stay duration) |
| Manually annotate dataset | Sample data | 1759 user chains 1 | TXT | Same as above |
| Network Relationship Data Sets (Edges) | Graph relational data | 49.009 million records | TXT | The ID of a stay node, the ID of the associated node |
| Activity Feature Data Set (Nodes) | Feature vector data | 13.678 million records | TXT | The ID of a stay node, time-dimensional feature (144 entries), space-dimensional feature (8 entries) |
| Parameter | Values | Illustration |
|---|---|---|
| 4.96 ft/s | Maximum average pedestrian walking speed of young people [56] | |
| Neuronal activation function | ReLU (Rectified linear unit) | Piecewise linear function with one-sided suppression |
| Hidden dimension | 16 | Multi-level abstraction of input features |
| Dropout | 0.5 | At this time, the randomly generated network structure is the most |
| Iteration | 10 | Number of iterations |
| Epochs | 200 | Training times |
| Draw | Max-pooling | Pooling method |
| optimizer | RMSprop | Optimizer algorithm |
| Lr | 0.01 | Learning rate |
| Lr decay | 5 × 10⁻⁴ | Learning rate attenuation rate |
| Model | Accuracy | Recall |
|---|---|---|
| UAIM | 87.4228% | 100% |
| RMNs-based Neural Network Model | 65.6133% | 79% |
| Activities | H (Home) | W (Work) | S (Shopping and Catering) | T (Leisure and Recreation) | M (Medical) | G (Sports) |
|---|---|---|---|---|---|---|
| Number (thousand) | 3974.114 | 2482.625 | 84.042 | 20.756 | 25.584 | 0.274 |
| Ratio | 60.329% | 37.688% | 1.276% | 0.315% | 0.388% | 0.004% |
Publisher’s Note: MDPI stays neutral with regard to jurisdictional claims in published maps and institutional affiliations. |
© 2021 by the authors. Licensee MDPI, Basel, Switzerland. This article is an open access article distributed under the terms and conditions of the Creative Commons Attribution (CC BY) license (https://creativecommons.org/licenses/by/4.0/).
Share and Cite
Liu, S.; Long, Y.; Zhang, L.; Liu, H. Semantic Enhancement of Human Urban Activity Chain Construction Using Mobile Phone Signaling Data. ISPRS Int. J. Geo-Inf. 2021, 10, 545. https://doi.org/10.3390/ijgi10080545
Liu S, Long Y, Zhang L, Liu H. Semantic Enhancement of Human Urban Activity Chain Construction Using Mobile Phone Signaling Data. ISPRS International Journal of Geo-Information. 2021; 10(8):545. https://doi.org/10.3390/ijgi10080545
Chicago/Turabian StyleLiu, Shaojun, Yi Long, Ling Zhang, and Hao Liu. 2021. "Semantic Enhancement of Human Urban Activity Chain Construction Using Mobile Phone Signaling Data" ISPRS International Journal of Geo-Information 10, no. 8: 545. https://doi.org/10.3390/ijgi10080545
APA StyleLiu, S., Long, Y., Zhang, L., & Liu, H. (2021). Semantic Enhancement of Human Urban Activity Chain Construction Using Mobile Phone Signaling Data. ISPRS International Journal of Geo-Information, 10(8), 545. https://doi.org/10.3390/ijgi10080545