
Analysis of the Temporal Changes of Inland Ramsar Sites in Turkey Using Google Earth Engine

Abstract
:1. Introduction
2. Materials and Methods
2.1. Materials
2.2. Methods
3. Results
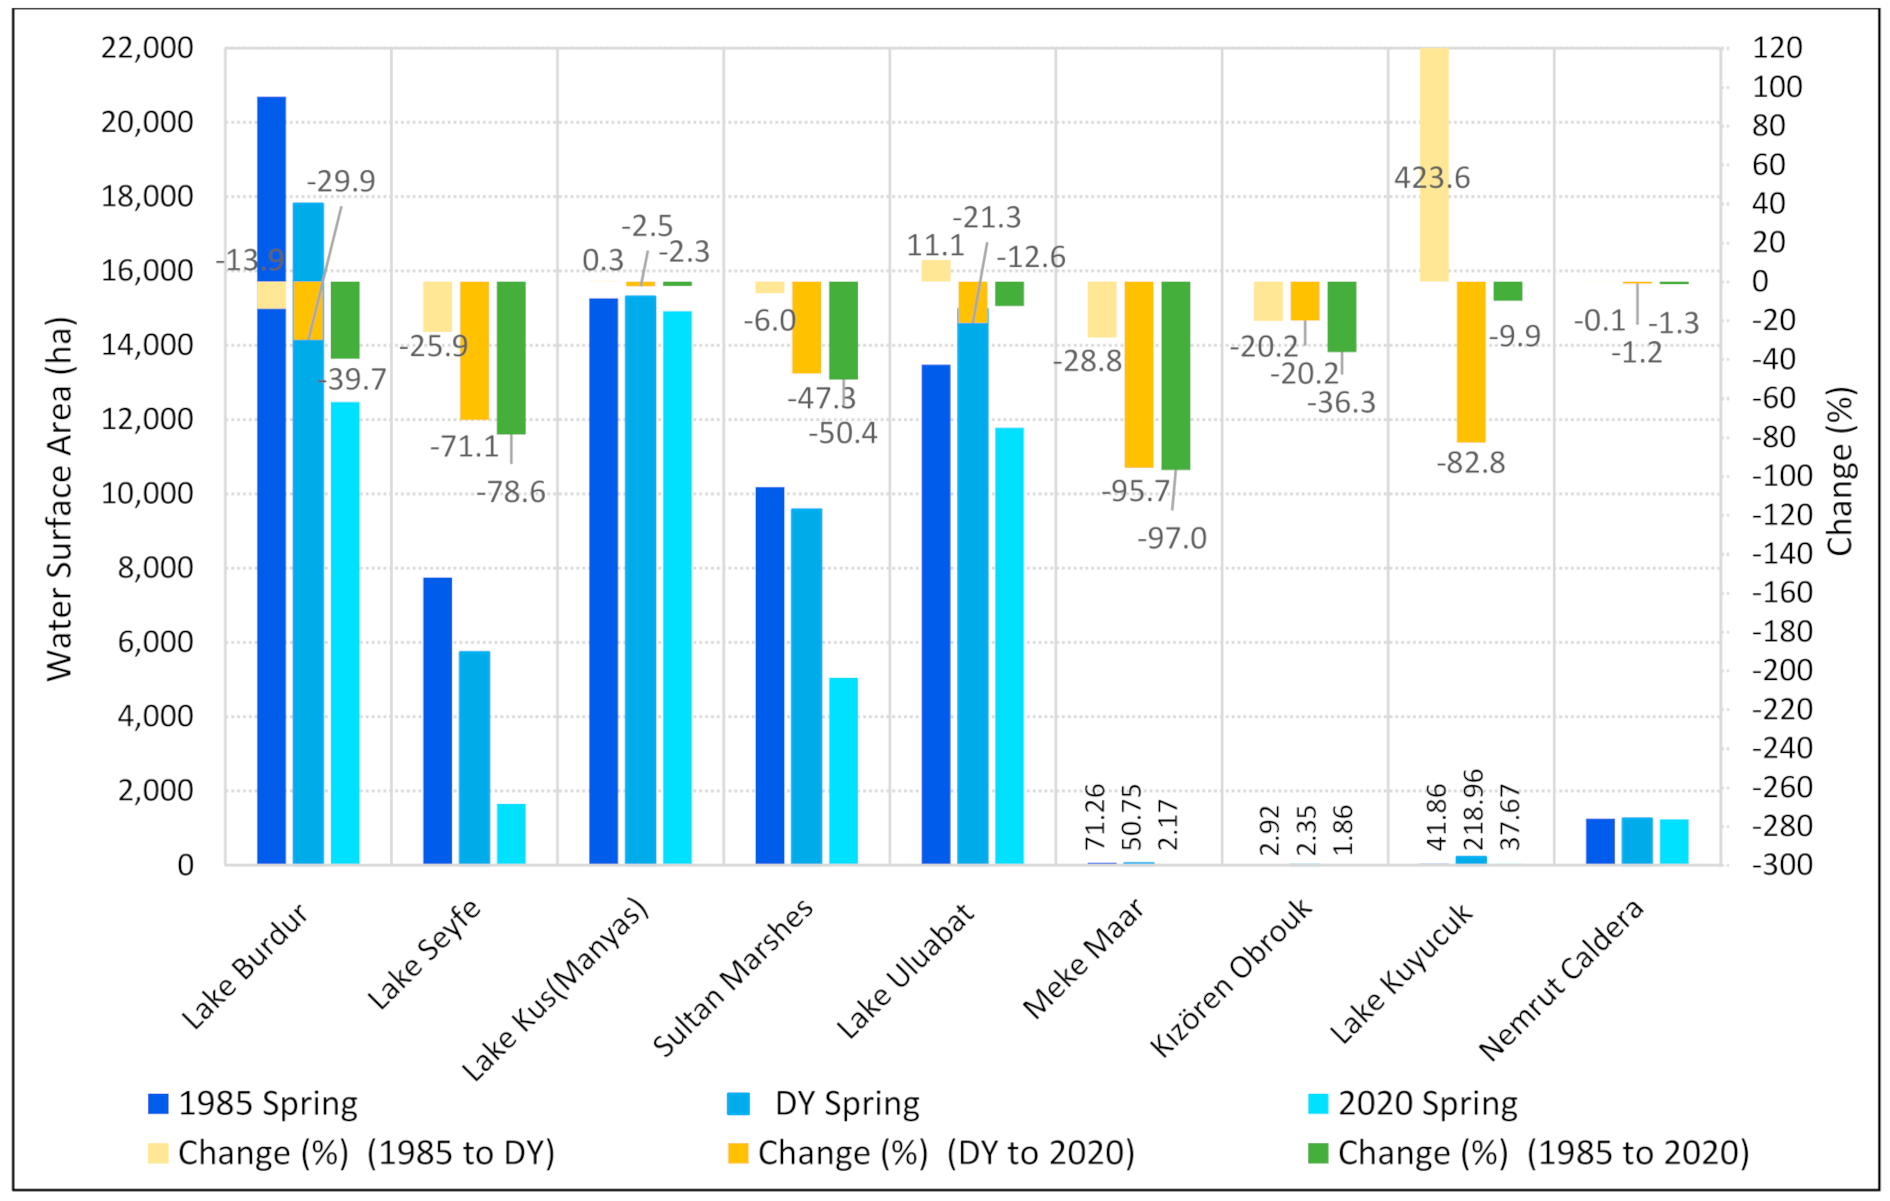
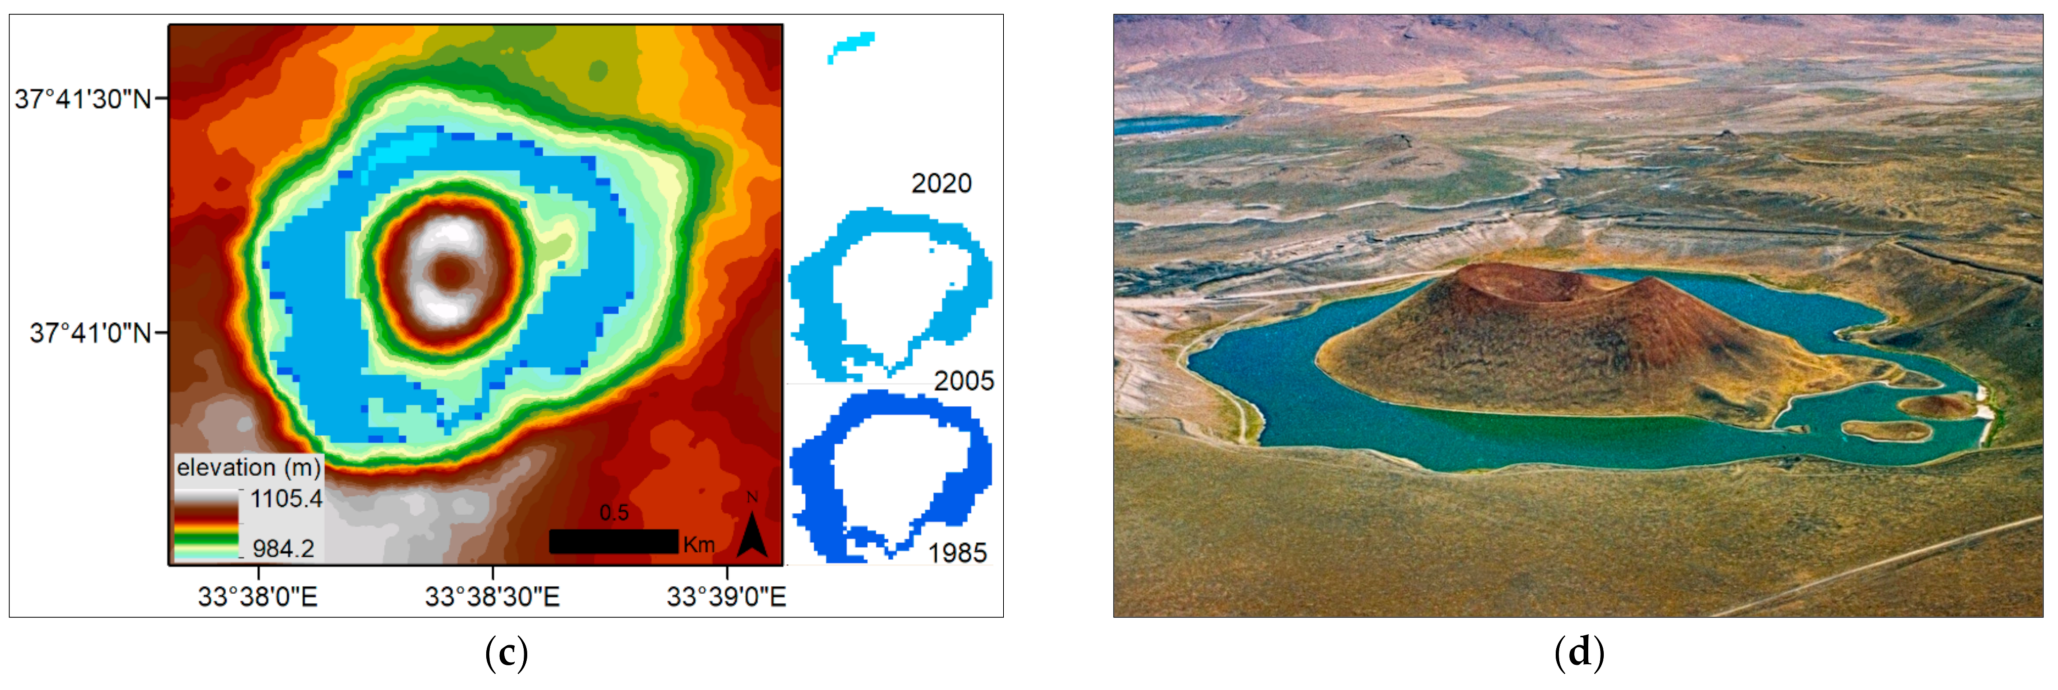
- The total water surface area in the inland Ramsar sites was 68,744.83 ha in 1985, and decreased to 47,173.83 ha in 2020. The change was 31.38% with a loss of 21,571.0 ha. When the changes from 1985 to 2020 were examined, the biggest change in spatial terms occurred in Lake Burdur, with 8214.93 ha. The maximum percent change occurred in Meke Maar with 96.95%.
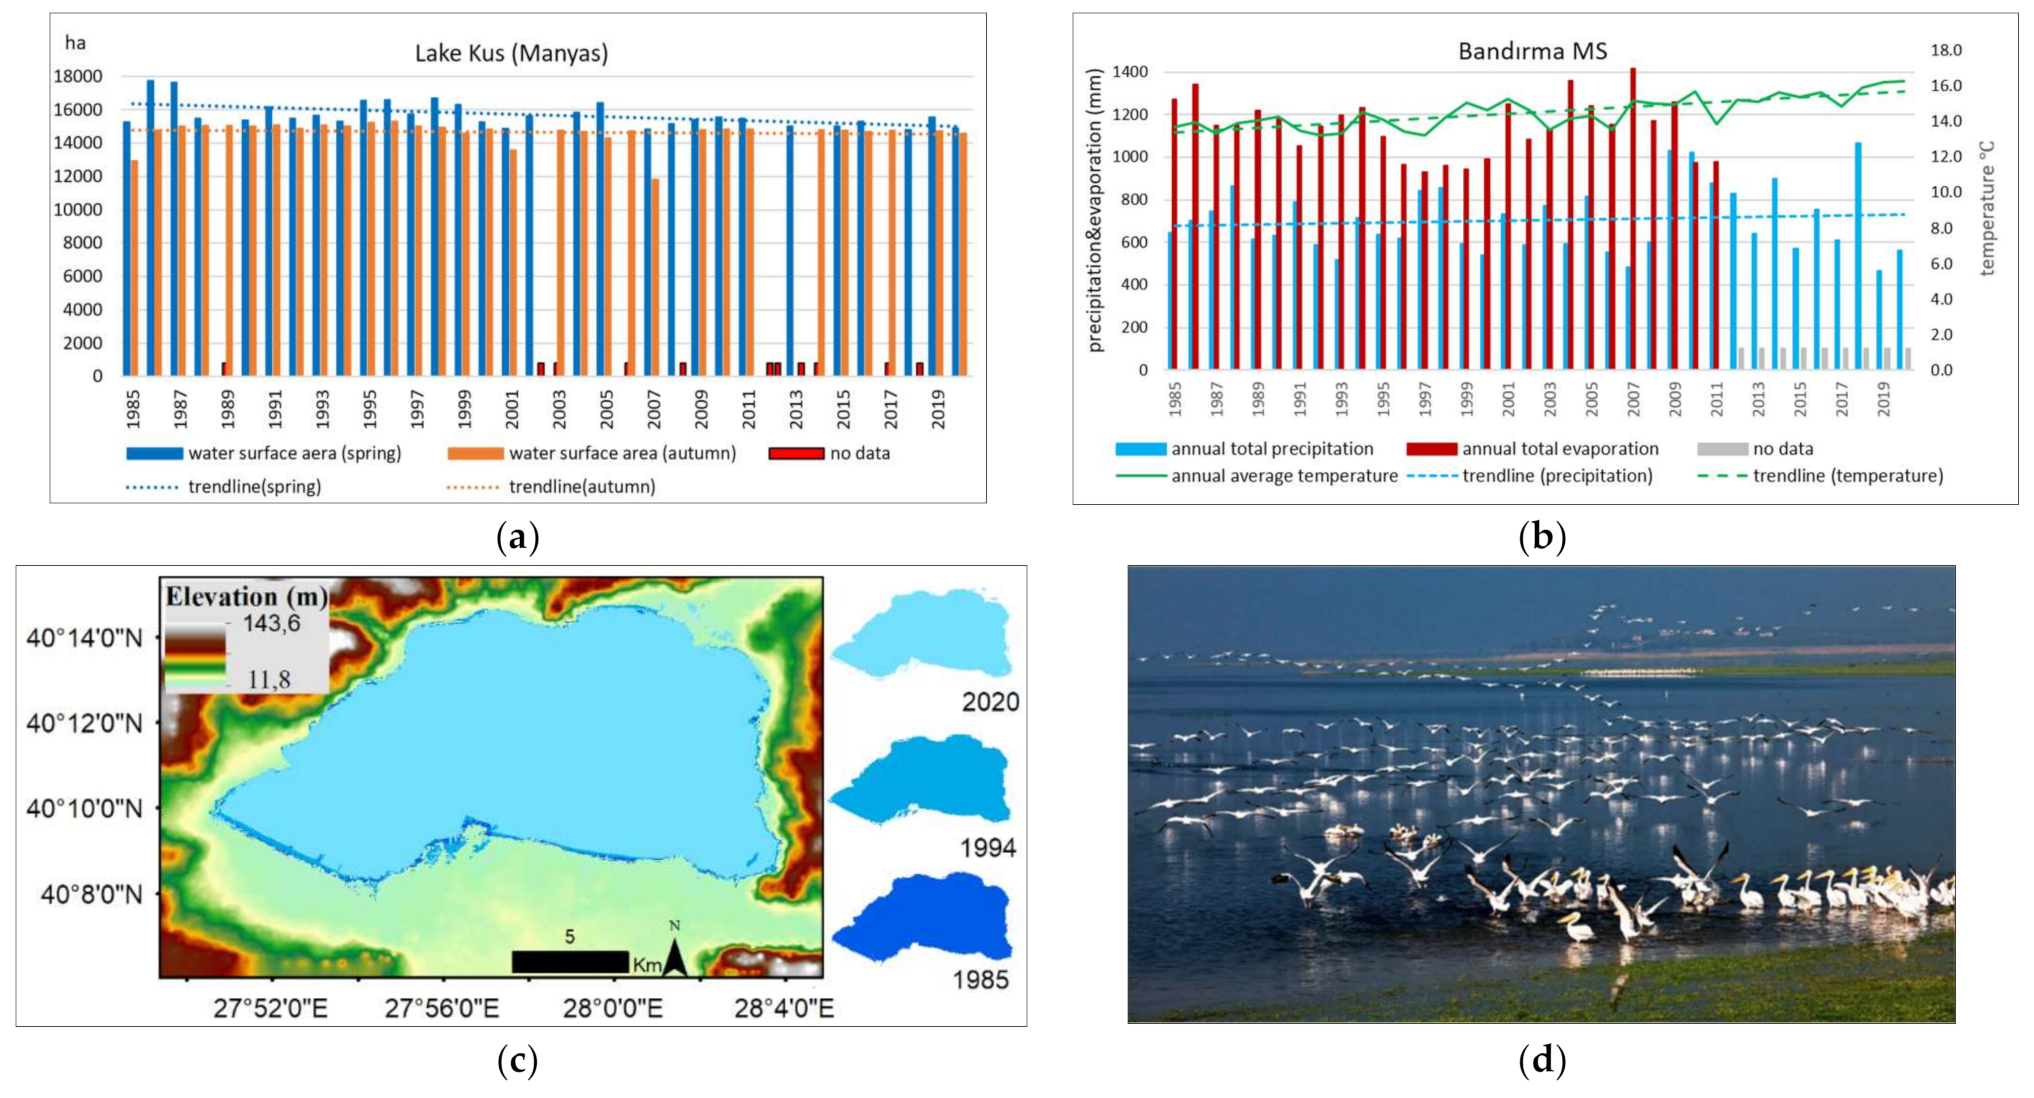
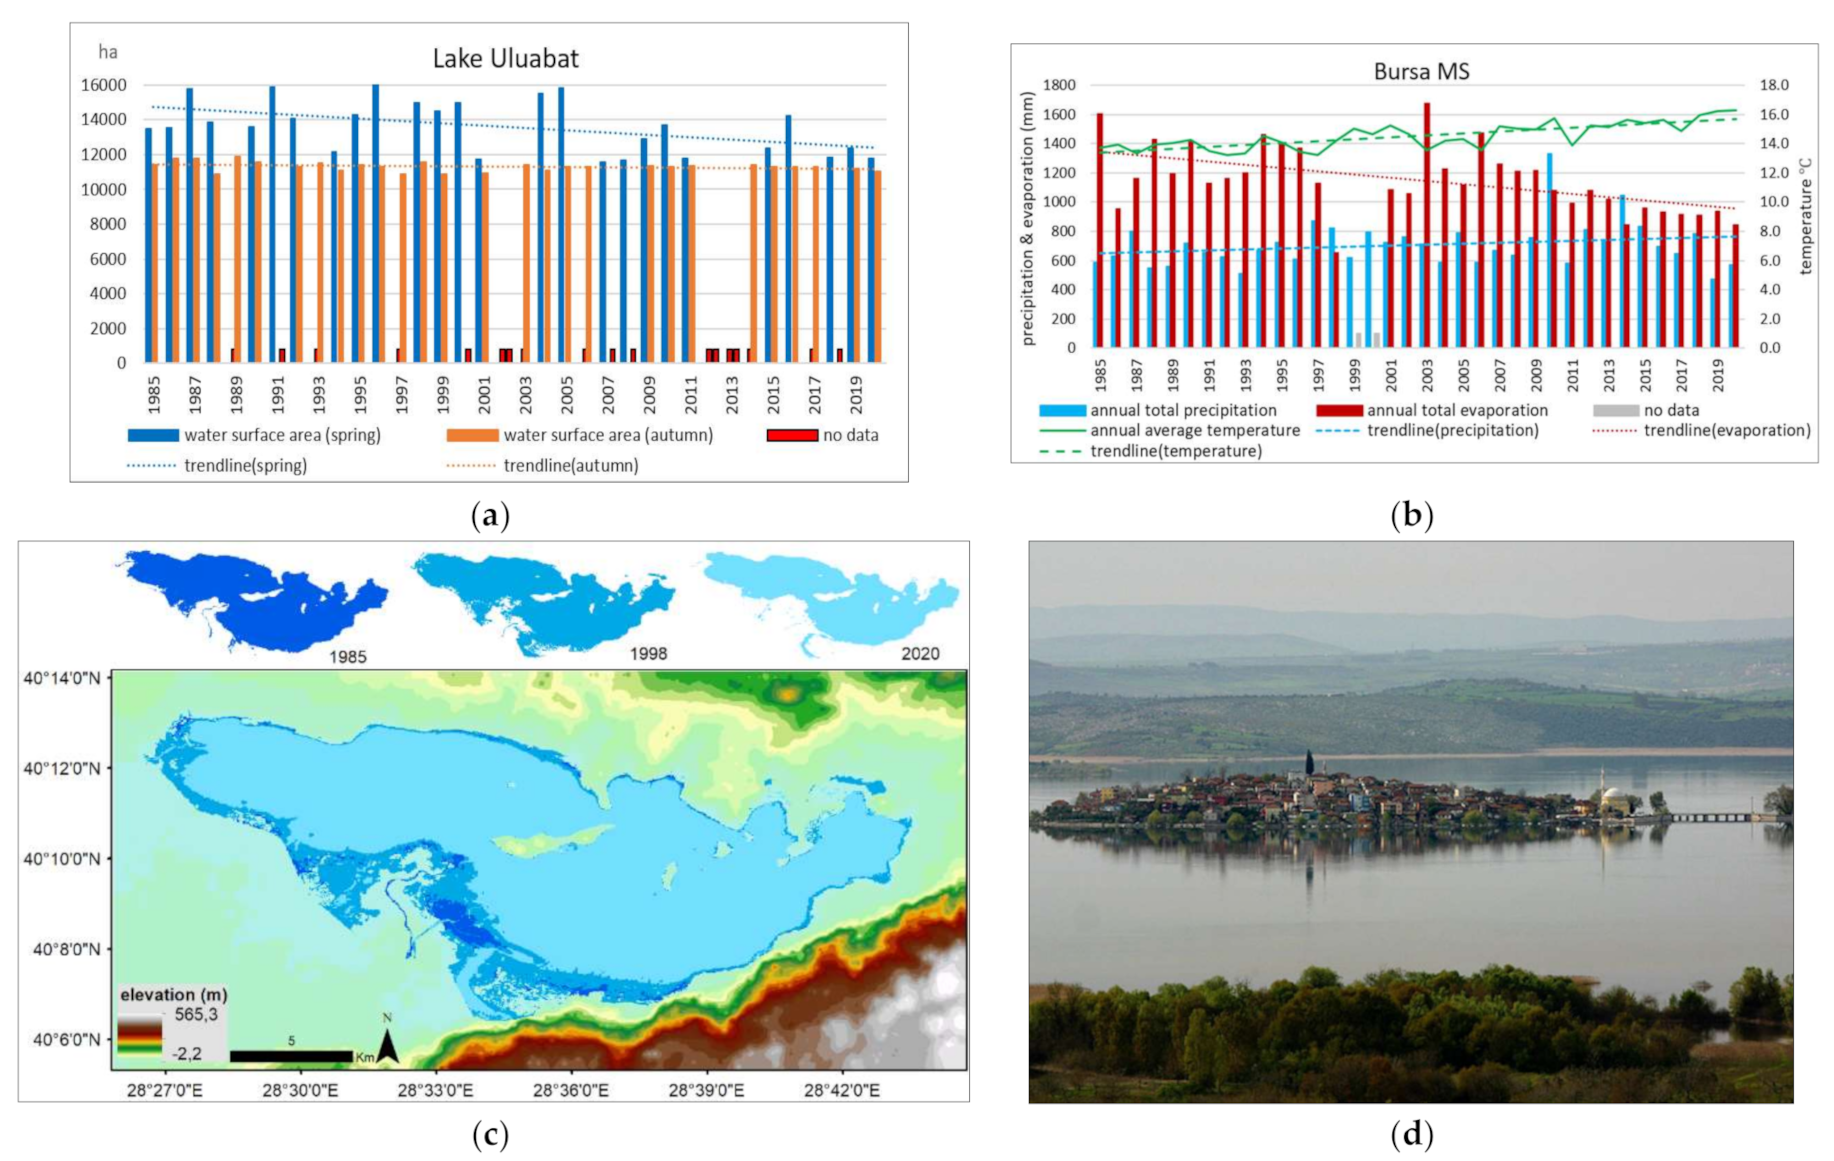
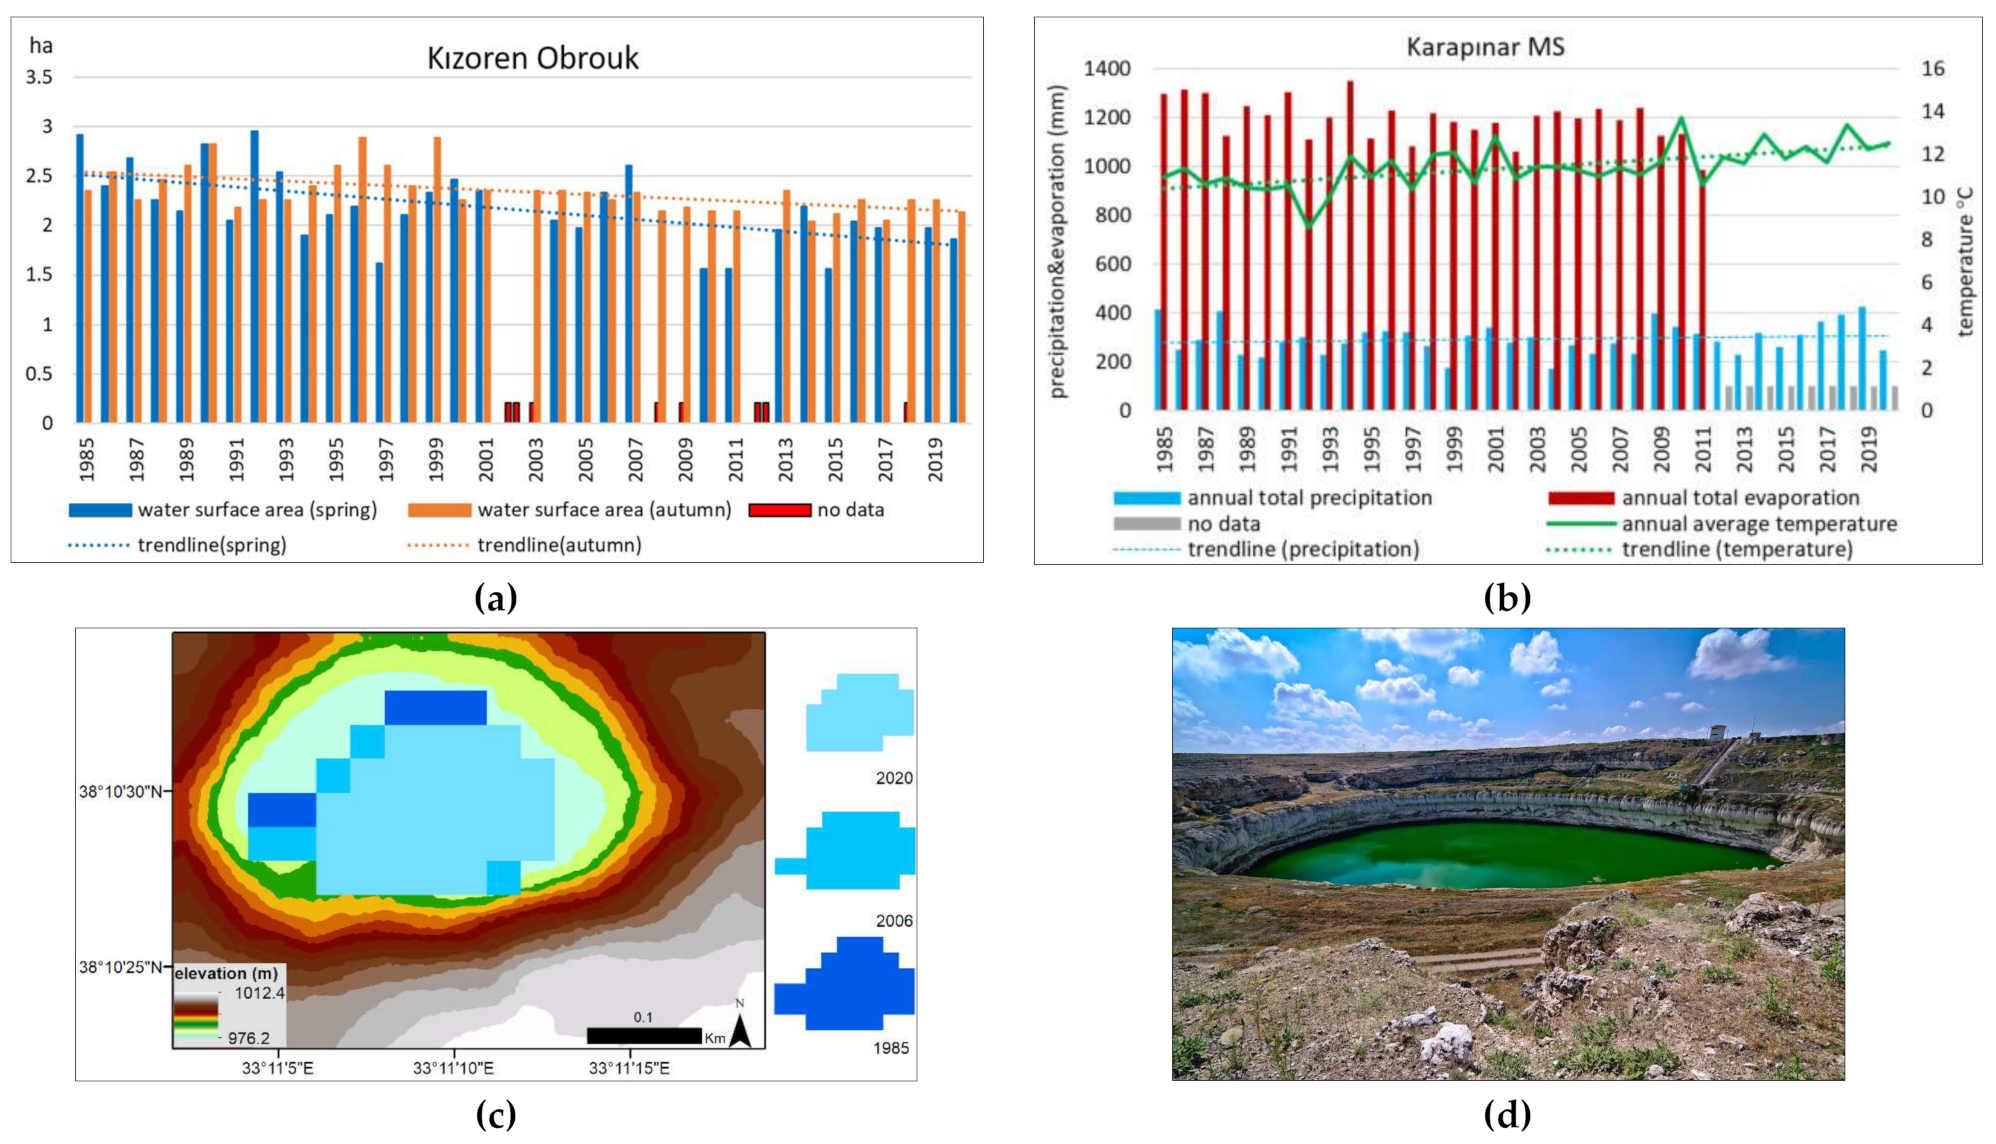
- 1985 to DY, which are given in Table 7, were examined, and the total change rate in all inland Ramsar sites was 5.55% with 3812.15 ha. From 1985 to DY, there was a decrease in different rates in Lake Burdur, Lake Seyfe, Sultan Marshes, Meke maar, and Kızoren Obrouk, while there were different rates of increases in Lake Uluabat and Lake Kuyucuk. There was almost no change in Nemrut Caldera and Lake Kus (Manyas).
- The largest spatial change occurred in Lake Burdur, with a loss of 2884.34 ha from 1985 to 1994. The largest percent change occurred in Lake Kuyucuk with a gain of 423.58% in the period 1985 to 2009.
- The total change from DY to 2020 was 27.35% with a loss of 17,758.90 ha. Reductions in the range of 0.01% to 100.00% occurred in all inland Ramsar sites. The largest areal loss occurred in Lake Burdur (5330.59 ha) from 1994 to 2020 and percent loss in Meke Maar (95.72%).
- When the inland wetlands from 1985 to DY were examined, there was an increase of 16.10% (208.2.8 ha) in Lake Kus (Manyas), 1.57% (179.28 ha) in Lake Uluabat, 0.17% (2.15 ha) in Nemrut Caldera, and 2140.05% (84.96 ha) in Lake Kuyucuk. There was a decrease in the other sites.
- The change from DY to 2020 was 19.91% with a loss of 10,137.04 ha, there were spatial losses at different rates, and Lake Burdur ranked first with an area of 5142.85 ha.
4. Discussion
5. Conclusions
Funding
Data Availability Statement
Acknowledgments
Conflicts of Interest
References
- Brander, L.; Schuyt, K. The Economic Values of the World’s Wetlands; WWF International: Amsterdam, The Netherlands, 2004; Available online: https://www.cbd.int/financial/values/g-value-wetlands.pdf (accessed on 20 January 2021).
- Ramsar.org. Available online: https://www.ramsar.org/sites/default/files/documents/library/factsheet3_global_disappearing_act_0.pdf (accessed on 20 January 2021).
- Davidson, N.C. Ramsar convention on wetlands: Scope and implementation. In The Wetland Book I: Structure and Function, Management, and Methods; Springer: Berlin/Heidelberg, Germany, 2018; pp. 451–458. [Google Scholar]
- Ramsar.org. Available online: https://www.ramsar.org/about/international-cooperation (accessed on 20 January 2021).
- Ramsar.org. Available online: https://www.ramsar.org/sites/default/files/documents/library/ramsarsites_criteria_eng.pdf (accessed on 15 January 2021).
- Doğanyiğit, R. Tabi Göller ve Sulak Alanlar Konusunda Yürütülen Çalışmalar; Su Yönetimi Genel Müdürlüğü: Ankara, Turkey, 2016. [Google Scholar]
- Ramsar.org. Available online: https://rsis.ramsar.org/ (accessed on 10 February 2021).
- WWF.org.tr. Evaluation Report Ramsar Site in Turkey. Istanbul, Turkey. 2008. Available online: http://awsassets.wwftr.panda.org/downloads/wwf_turkiye_ramsar_alanlari_degerlendirme_raporu.pdf (accessed on 5 January 2021).
- Dugan, P.J. Wetland Conservation: A Review of Current Issues and Required Action. Gland, Switzerland. 1990. Available online: https://portals.iucn.org/library/node/6048 (accessed on 1 March 2021).
- Dogadernegi.org. Available online: https://www.dogadernegi.org/wp-content/uploads/2015/08/T%C3%BCrkiyenin-Ramsar-Alanlar%C4%B1nda-Sulak-Alan-Y%C3%B6netim-Planlar%C4%B1-De%C4%9Ferlendirme-Raporu_Bask%C4%B1.pdf (accessed on 2 February 2021).
- WWF.org.tr. Available online: https://wwftr.awsassets.panda.org/downloads/2subatbilginotu.pdf?1401/sulakalanarimizinkorunmasi (accessed on 2 April 2021).
- Goksu Delta Management Plan; General Directorate of Nature Conservation and National Parks of the Ministry of Agriculture and Forestry: Ankara, Turkey, 2008.
- Kus Lake (Manyas) Management Plan; General Directorate of Nature Conservation and National Parks of the Ministry of Agriculture and Forestry: Ankara, Turkey, 2018.
- Lake Uluabat Managemet Plan; General Directorate of Nature Conservation and National Parks of the Ministry of Agriculture and Forestry: Ankara, Turkey, 2015.
- Gediz Delta Management Plan (2019–2023); General Directorate of Nature Conservation and National Parks of the Ministry of Agriculture and Forestry: Ankara, Turkey, 2019.
- Kızılırmak Delta Management Plan; General Directorate of Nature Conservation and National Parks of the Ministry of Agriculture and Forestry: Ankara, Turkey, 2015.
- Sultan Marshes Management Plan; General Directorate of Nature Conservation and National Parks of the Ministry of Agriculture and Forestry: Ankara, Turkey, 2007.
- Yumurtalık Lagoons Management Plan; General Directorate of Nature Conservation and National Parks of the Ministry of Agriculture and Forestry: Ankara, Turkey, 2007.
- Burdur Lake Management Plan; General Directorate of Nature Conservation and National Parks of the Ministry of Agriculture and Forestry: Ankara, Turkey, 2018.
- Lake Seyfe Management Plan; General Directorate of Nature Conservation and National Parks of the Ministry of Agriculture and Forestry: Ankara, Turkey, 2017.
- Kuyucuk Lake Management Plan; General Directorate of Nature Conservation and National Parks of the Ministry of Agriculture and Forestry: Ankara, Turkey, 2017.
- Akyatan Lagoon 2018 Management Plan; General Directorate of Nature Conservation and National Parks of the Ministry of Agriculture and Forestry: Ankara, Turkey, 2018.
- Nasa.gov. Available online: https://landsat.gsfc.nasa.gov/landsat-1-3/landsat-1 (accessed on 20 January 2021).
- Johnston, R.M.; Barson, M.M. Remote sensing of Australian wetlands: An evaluation of Landsat TM data for inventory and classification. Mar. Freshw. Res. 1993, 44, 235–252. [Google Scholar] [CrossRef]
- Frohn, R.C.; Reif, M.; Lane, C.; Autrey, B. Satellite remote sensing of isolated wetlands using object-oriented classification of Landsat-7 data. Wetlands 2009, 29, 931–941. [Google Scholar] [CrossRef]
- Baker, C.; Lawrence, R.L.; Montagne, C.; Patten, D. Change detection of wetland ecosystems using Landsat imagery and change vector analysis. Wetlands 2007, 27, 610–619. [Google Scholar] [CrossRef]
- De Roeck, E.R.; Verhoest, N.E.; Miya, M.H.; Lievens, H.; Batelaan, O.; Thomas, A.; Brendonck, L. Remote sensing and wetland ecology: A South African case study. Sensors 2008, 8, 3542–3556. [Google Scholar]
- Kayastha, N.; Thomas, V.; Galbraith, J.; Banskota, A. Monitoring wetland change using inter-annual landsat time-series data. Wetlands 2012, 32, 1149–1162. [Google Scholar] [CrossRef]
- Verpoorter, C.; Kutser, T.; Tranvik, L. Automated mapping of water bodies using Landsat multispectral data. Limnol. Oceanogr. Methods 2012, 10, 1037–1050. [Google Scholar] [CrossRef]
- Tulbure, M.G.; Broich, M. Spatiotemporal dynamic of surface water bodies using Landsat time-series data from 1999 to 2011. ISPRS J. Photogramm. Remote Sens. 2013, 79, 44–52. [Google Scholar] [CrossRef]
- Dong, Z.; Wang, Z.; Liu, D.; Song, K.; Li, L.; Jia, M.; Ding, Z. Mapping wetland areas using Landsat-derived NDVI and LSWI: A case study of West Songnen plain, Northeast China. J. Indian Soc. Remote Sens. 2014, 42, 569–576. [Google Scholar] [CrossRef]
- Jones, J.W. Efficient wetland surface water detection and monitoring via landsat: Comparison with in situ data from the everglades depth estimation network. Remote Sens. 2015, 7, 12503–12538. [Google Scholar] [CrossRef] [Green Version]
- Han, X.; Chen, X.; Feng, L. Four decades of winter wetland changes in Poyang Lake based on Landsat observations between 1973 and 2013. Remote Sens. Environ. 2015, 156, 426–437. [Google Scholar] [CrossRef]
- Banerjee, B.P.; Raval, S.; Timms, W. Evaluation of rainfall and wetland water area variability at Thirlmere Lakes using Landsat time-series data. Int. J. Environ. Sci. Technol. 2016, 13, 1781–1792. [Google Scholar] [CrossRef] [Green Version]
- Xie, H.; Luo, X.; Xu, X.; Pan, H.; Tong, X. Evaluation of Landsat 8 OLI imagery for unsupervised inland water extraction. Int. J. Remote Sens. 2016, 37, 1826–1844. [Google Scholar] [CrossRef]
- Dervisoglu, A.; Dervisoglu, A.; Musaoglu, N.; Tanik, A.; Seker, D.Z.; Kaya, S. Satellite-based temporal assessment of a dried lake: Case study of Akgol Wetland. Fresenius Environ. Bull 2017, 26, 352–359. [Google Scholar]
- Yagmur, N.; Bilgilioglu, B.B.; Dervisoglu, A.; Musaoglu, N.; Tanik, A. Long and short-term assessment of surface area changes in saline and freshwater lakes via remote sensing. Water Environ. J. 2021, 35, 107–122. [Google Scholar] [CrossRef]
- Jin, H.; Huang, C.; Lang, M.W.; Yeo, I.Y.; Stehman, S.V. Monitoring of wetland inundation dynamics in the Delmarva Peninsula using Landsat time-series imagery from 1985 to 2011. Remote Sens. Environ. 2017, 190, 26–41. [Google Scholar] [CrossRef] [Green Version]
- Schaffer-Smith, D.; Swenson, J.J.; Barbaree, B.; Reiter, M.E. Three decades of Landsat-derived spring surface water dynamics in an agricultural wetland mosaic; Implications for migratory shorebirds. Remote Sens. Environ. 2017, 193, 180–192.2020. [Google Scholar] [CrossRef] [Green Version]
- Mejia Ávila, D.; Soto Barrera, V.C.; Martínez Lara, Z. Spatio-temporal modelling of wetland ecosystems using Landsat time series: Case of the Bajo Sinú Wetlands Complex (BSWC)–Córdoba–Colombia. Ann. GIS 2019, 25, 231–245. [Google Scholar] [CrossRef] [Green Version]
- Yang, L.; Wang, L.; Yu, D.; Yao, R.; He, Q.; Wang, S.; Wang, L. Four decades of wetland changes in Dongting Lake using Landsat observations during 1978–2018. J. Hydrol. 2020, 587, 124954. [Google Scholar] [CrossRef]
- Mao, D.; Wang, Z.; Du, B.; Li, L.; Tian, Y.; Jia, M.; Zeng, Y.; Song, K.; Jiang, M.; Wang, Y. National wetland mapping in China: A new product resulting from object-based and hierarchical classification of L8 OLI images. ISPRS J. Photogramm. Remote Sens. 2020, 164, 11–25. [Google Scholar] [CrossRef]
- Li, Z.; Sun, W.; Chen, H.; Xue, B.; Yu, J.; Tian, Z. Interannual and Seasonal Variations of Hydrological Connectivity in a Large Shallow Wetland of North China Estimated from Landsat 8 Images. Remote Sens. 2021, 13, 1214. [Google Scholar] [CrossRef]
- Wang, X.; Xiao, X.; Zou, Z.; Hou, L.; Qin, Y.; Dong, J.; Doughty, R.B.; Chen, B.; Zhang, X.; Chen, Y.; et al. Mapping coastal wetlands of China using time-series Landsat images in 2018 and Google Earth Engine. ISPRS J. Photogramm. Remote Sens. 2020, 163, 312–326. [Google Scholar] [CrossRef] [PubMed]
- Gorelick, N.; Hancher, M.; Dixon, M.; Ilyushchenko, S.; Thau, D.; Moore, R. Google Earth Engine: Planetary-scale geospatial analysis for everyone. Remote Sens. Environ. 2017, 202, 18–27. [Google Scholar] [CrossRef]
- Pekel, J.F.; Cottam, A.; Gorelick, N.; Belward, A.S. High-resolution mapping of global surface water and its long-term changes. Nature 2016, 540, 418–422. [Google Scholar] [CrossRef] [PubMed]
- Wang, R.; Xia, H.; Qin, Y.; Niu, W.; Pan, L.; Li, R.; Zhao, X.; Bian, X.; Fu, P. Dynamic Monitoring of Surface Water Area during 1989–2019 in the Hetao Plain Using Landsat Data in Google Earth Engine. Water 2020, 12, 3010. [Google Scholar] [CrossRef]
- Chen, J.; Kang, T.; Yang, S.; Bu, J.; Cao, K.; Gao, Y. Open-Surface Water Bodies Dynamics Analysis in the Tarim River Basin (North-Western China), Based on Google Earth Engine Cloud Platform. Water 2020, 12, 2822. [Google Scholar] [CrossRef]
- Wang, C.; Jia, M.; Chen, N.; Wang, W. Long-term surface water dynamics analysis based on Landsat imagery and the Google Earth Engine platform: A case study in the middle Yangtze river basin. Remote Sens. 2018, 10, 1635. [Google Scholar] [CrossRef] [Green Version]
- Deng, Y.; Jiang, W.; Tang, Z.; Ling, Z.; Wu, Z. Long-Term Changes of Open-Surface Water Bodies in the Yangtze River Basin Based on the Google Earth Engine Cloud Platform. Remote Sens. 2019, 11, 2213. [Google Scholar] [CrossRef] [Green Version]
- Aksoy, E.; Özsoy, G. Investigation of multi-temporal land use/cover and shoreline changes of the Uluabat Lake Ramsar Site using RS and GIS. In Proceedings of the International Conference on Sustainable Land Use and Management, Canakkale, Turkey, 13 October 2002; pp. 73–79. [Google Scholar]
- Reis, S.; Yilmaz, H.M. Temporal monitoring of water level changes in Seyfe Lake using remote sensing. Hydrol. Process. An Int. J. 2008, 22, 4448–4454. [Google Scholar] [CrossRef]
- Dadaser-Celik, F.; Bauer, M.E.; Brezonik, P.L.; Stefan, H.G. Changes in the Sultan Marshes ecosystem (Turkey) in satellite images 1980–2003. Wetlands 2008, 28, 852–865. [Google Scholar] [CrossRef]
- Sertel, E.; Findik, N.; Kaya, S.; Seker, D.Z.; Samsunlu, A. Assessment of landscape changes in the Kizilirmak Delta, Turkey, using remotely sensed data and GIS. Environ. Eng. Sci. 2008, 25, 353–362. [Google Scholar] [CrossRef]
- Dirim, M.S.; Aksoy, E.; Özsoy, G. Remote Sensing and Gis Applications for Monitoring Multi-temporal Changes of Natural Resources in Bursa-Turkey. J. Biol. Environ. Sci. 2009, 3, 53–59. [Google Scholar]
- Yıldırım, U.; Uysal, M. Changes in the Coastline of the Burdur Lake between 1975 and 2010. In Proceedings of the International Symposium on Environmental Protection and Planning: Geographic Information Systems (GIS) and Remote Sensing (RS) Applications (ISEPP), Izmir, Turkey, 28–29 June 2011; pp. 28–29. [Google Scholar]
- Kuleli, T.; Guneroglu, A.; Karsli, F.; Dihkan, M. Automatic detection of shoreline change on coastal Ramsar wetlands of Turkey. Ocean. Eng. 2011, 38, 1141–1149. [Google Scholar] [CrossRef]
- Bolca, M.; Özen, F.; Güneş, A. Land use changes in Gediz Delta (Turkey) and their negative impacts on wetland habitats. J. Coast. Res. 2014, 30, 756–764. [Google Scholar]
- Ozturk, D.; Beyazit, I.; Kilic, F. Spatiotemporal analysis of shoreline changes of the Kizilirmak Delta. J. Coast. Res. 2015, 31, 1389–1402. [Google Scholar] [CrossRef]
- Durmaz, F.; Karakaya, N.; Evrendilek, F. Spatiotemporal change detection analysis of Turkish lake water surface area in response to anthropogenic ecosystem disturbances using Long-Term Landsat TM/ETM+ Data. J. Ecosys. Ecograph 2016, 6, 2. [Google Scholar]
- Temiz, F.; Bozdag, A.; Durduran, S.S.; & Gumus, M.G. Monitoring coastline change using remote sensing and GIS technology: A case study of Burdur Lake, Turkey. Fresenius Environ. Bull. 2017, 26, 7235–7242. [Google Scholar] [CrossRef] [Green Version]
- Sarp, G.; Ozcelik, M. Water body extraction and change detection using time series: A case study of Lake Burdur, Turkey. J. Taibah Univ. Sci. 2017, 11, 381–391. [Google Scholar] [CrossRef] [Green Version]
- Kaplan, G.; Avdan, Z.Y.; Avdan, U. Mapping and monitoring wetland dynamics using thermal, optical, and SAR remote sensing data. In Book Wetland Manegemet-Asssessing Risk and Sustainable Solutions; Intech Open: London, UK, 2019. [Google Scholar] [CrossRef] [Green Version]
- Ciritci, D.; Türk, T. Automatic detection of shoreline change by geographical information system (GIS) and remote sensing in the Göksu Delta, Turkey. J. Indian Soc. Remote Sens. 2019, 47, 233–243. [Google Scholar] [CrossRef]
- Ataol, M.; Kale, M.M.; Tekkanat, İ.S. Assessment of the changes in shoreline using digital shoreline analysis system: A case study of Kızılırmak Delta in northern Turkey from 1951 to 2017. Environ. Earth Sci. 2019, 78, 579. [Google Scholar] [CrossRef]
- Yagmur, N.; Musaoglu, N. Temporal Analysis of Ramsar Sites via Remote Sensing Techniques–A Case Study of Meke Maar. In IOP Conference Series: Materials Science and Engineering, Proceedings of the 4th International Conference on Buildings, Construction and Environmental Engineering, Istanbul, Turkey, 7–9 October 2019; IOP Publishing: Bristol, UK, 2020; Volume 737, p. 012248. [Google Scholar] [CrossRef]
- Sabuncu, A. Burdur Gölü Kıyı Şeridindeki Değişiminin Uzaktan Algılama ile Haritalanması. Afyon Kocatepe Üniv. Fen Ve Mühendislik Bilimleri Derg. 2020, 20, 623–633. [Google Scholar]
- Hepdeniz, K. Determination of Burdur Lake’s areal change in upcoming years using geographic information systems and the artificial neural network method. Arab. J. Geosci. 2020, 13, 1143. [Google Scholar] [CrossRef]
- Tercan, E.; Atasever, U.H. Effectiveness of autoencoder for lake area extraction from high-resolution RGB imagery: An experimental study. Environ. Sci. Pollut. Res. 2021, 24, 31084–31096. [Google Scholar] [CrossRef]
- Dervisoglu, A.; Bilgilioglu, B.B.; Yagmur, N.; Musaoglu, N.; Tanik, A. Temporal assessment of natural wetlands via remotely sensed data: A case study from Turkey. FEB-Fresenius Environ. Bull. 2019, 28, 1005. [Google Scholar]
- Nasa.gov. Available online: https://landsat.gsfc.nasa.gov/landsat-4-5 (accessed on 10 April 2021).
- Nasa.gov. Available online: https://landsat.gsfc.nasa.gov/landsat-8 (accessed on 10 April 2021).
- Temperature and Precipitation Assessment in River Basins According to Climate Projections, Turkish State Meteorological Service; Report; Ankara, Turkey, 2014. (In Turkish)
- Feyisa, G.L.; Meilby, H.; Fensholt, R.; Proud, S.R. Automated Water Extraction Index: A new technique for surface water mapping using Landsat imagery. Remote Sens. Environ. 2014, 140, 23–35. [Google Scholar] [CrossRef]
- McFeeters, S.K. The use of the Normalized Difference Water Index (NDWI) in the delineation of open water features. Int. J. Remote Sens. 1996, 17, 1425–1432. [Google Scholar] [CrossRef]
- Rokni, K.; Ahmad, A.; Selamat, A.; Hazini, S. Water feature extraction and change detection using multitemporal Landsat imagery. Remote Sens. 2014, 6, 4173–4189. [Google Scholar] [CrossRef] [Green Version]
- Zhou, Y.; Dong, J.; Xiao, X.; Xiao, T.; Yang, Z.; Zhao, G.; Zou, Z.; Qin, Y. Open surface water mapping algorithms: A comparison of water-related spectral indices. Water 2017, 9, 256. [Google Scholar] [CrossRef]
- Acharya, T.D.; Subedi, A.; Lee, D.H. Evaluation of water indices for surface water extraction in a Landsat 8 scene of Nepal. Sensors 2018, 18, 2580. [Google Scholar] [CrossRef] [Green Version]
- Zhang, J.; Ding, J.; Wu, P.; Tan, J.; Huang, S.; Teng, D.; Cao, X.; Wang, J.; Chen, W. Assessing arid Inland Lake Watershed Area and Vegetation Response to Multiple Temporal Scales of Drought Across the Ebinur Lake Watershed. Sci. Rep. 2020, 10, 1354. [Google Scholar] [CrossRef]
- Turkiyesulakalanlari.com. Available online: http://www.turkiyesulakalanlari.com/meke-maari-konya/ (accessed on 1 April 2021).
- Milliyet.com.tr. Available online: https://www.milliyet.com.tr/tatil/meke-golu-konya-ilinde-nerede-golun-ozellikleri-olusumu-ve-tarihcesi-6314044 (accessed on 5 April 2021).
- Ensonhaber.com. Available online: https://www.ensonhaber.com/ic-haber/seyfe-golu-kuraklikla-mucadele-ediyor (accessed on 5 April 2021).
- Sozcu.com.tr. Available online: https://www.sozcu.com.tr/hayatim/seyahat/burdur-golunun-son-konuklari-flamingolar/ (accessed on 5 April 2021).
- Iha.com.tr. Available online: https://www.lha.com.tr/dogu-anadolunun-kus-cenneti-kuyucuk-golu-3399h.htm (accessed on 5 April 2021).
- Aa.com.tr. Available online: https://www.aa.com.tr/tr/turkiye/kars-baraji-tarima-can-suyu-olacak/1256621 (accessed on 5 April 2021).
- Odatv4.com. Available online: https://odatv4.com/beton-skandalina-sorusturma-16082043.html (accessed on 6 April 2021).
- Turkiyesulakalanlari.com. Available online: http://www.turkiyesulakalanlari.com/nemrut-krater-golu-bitlis/ (accessed on 5 April 2021).
- Atlasdergisi.com. Available online: https://www.atlasdergisi.com/kesfet/doga-cografya-haberleri/cennetin-kanatlari.html (accessed on 6 May 2021).
- Turkiyesulakalanlari.com. Available online: http://www.turkiyesulakalanlari.com/ulubat-golu-bursa/ (accessed on 6 May 2021).
- Ferdaaydar.com. Available online: http://www.ferdaaydar.com/turkiye-seyahat-rehberi/bursanin-sirin-beldeleri-golyazi-ve-uluabat-golu-apollont/ (accessed on 6 May 2021).
- Facebook.com. Available online: https://www.facebook.com/trtavaz/photos/pcb.717109958357208/717109295023941/ (accessed on 6 May 2021).
- Neredenegezilir.com. Available online: http://neredenegezilir.blogspot.com/2014/12/kzoren-obrugu.html (accessed on 5 June 2021).
- Ensonhaber.com. Available online: https://www.ensonhaber.com/yasam/konyada-obruk-golundeki-su-28-metre-azaldi (accessed on 6 June 2021).


| Criteria. | Explanation |
|---|---|
| 1 | A wetland should be considered internationally important if it contains a representative, rare, or unique example of a natural or near-natural wetland type found within the appropriate biogeographic region. |
| 2 | A wetland should be considered internationally important if it supports vulnerable, endangered, or critically endangered species or threatened ecological communities. |
| 3 | A wetland should be considered internationally important if it supports populations of plant and/or animal species important for maintaining the biological diversity of a particular biogeographic region. |
| 4 | A wetland should be considered internationally important if it supports plant and/or animal species at a critical stage in their life cycles, or provides refuge during adverse conditions. Specific criteria are based on water birds. |
| 5 | A wetland should be considered internationally important if it regularly supports 20,000 or more water birds. |
| 6 | A wetland should be considered internationally important if it regularly supports 1% of the individuals in a population of one species or subspecies of water bird. |
| 7 | A wetland should be considered internationally important if it supports a significant proportion of indigenous fish subspecies, species, or families; life-history stages; species interactions; and/or populations that are representative of wetland benefits and/or values, and thereby contributes to global biological diversity. |
| 8 | A wetland should be considered internationally important if it is an important source of food for fish, spawning grounds, nurseries, and/or migration paths on which fish stocks, either within the wetland or elsewhere, depend. |
| 9 | A wetland should be considered internationally important if it regularly supports 1% of the individuals in a population of one species or subspecies of wetland-dependent nonavian animal species. |
| Ramsar Site | Ramsar # | Wetland Type * | Ramsar Criteria | Coordinates | Protection Area (ha) | Designation Date |
|---|---|---|---|---|---|---|
| Goksu Delta | 657 | M/C | 2,3,4 | 36°17’ N 33°59’ E | 15,000 | 1994-07-13 |
| Lake Burdur | 658 | I | 2,3,4,5,6 | 37°44’ N 30°12’ E | 24,800 | 1994-07-13 |
| Lake Seyfe | 659 | I | 2,4,5 | 39°11’ N 34°25’ E | 10,700 | 1994-07-13 |
| Lake Kus (Manyas) | 660 | I | 2,3,4,5,8 | 40°11’ N 27°58’ E | 20,400 | 1994-07-13 |
| Sultan Marshes | 661 | I | 2,3,4,5,6 | 38°19’ N 35°15’ E | 17,200 | 1994-07-13 |
| Kızılırmak Delta | 942 | M/C | 1,2,3,5,6,7,8 | 41°38’ N 35°59’ E | 21,700 | 1998-04-15 |
| Akyatan Lagoon | 943 | M/C | 1,2,3,4.5,6,8 | 36°37’ N 35°15’ E | 14,700 | 1998-04-16 |
| Lake Uluabat | 944 | I | 2,4,5,8 | 40°10’ N 28°35’ E | 19,900 | 1998-06-12 |
| Gediz Delta | 945 | M/C | 2,3,4,5 | 38°31’ N 26°53’ E | 14,900 | 1998-04-15 |
| Meke Maar | 1618 | I | 1,2,3 | 37°41’ N 33°38’ E | 202 | 2005-07-21 |
| Yumurtalık Lagoons | 1619 | M/C | 1,2,3,4,5,6,8 | 36°42’ N 35°38’ E | 19,853 | 2005-07-21 |
| Kızoren Obrouk | 1620 | I | 1,2 | 38°10’ N 33°11’ E | 127 | 2006-05-02 |
| Lake Kuyucuk | 1890 | I | 1,2,3,4,5,6 | 40°45’ N 43°27’ E | 416 | 2009-08-28 |
| Nemrut Caldera | 2145 | I | 1 | 38°37’ N 42°14’ E | 2145 | 2013-04-17 |
| Threats # | Threats of Turkey’s Ramsar Sites |
|---|---|
| 1 | Overuse and/or unplanned use of water resources for feeding the wetland |
| 2 | Excessive use of groundwater for irrigation and/or domestic purposes |
| 3 | Building dams on the freshwater sources feeding the wetland |
| 4 | Water infrastructure projects affecting the wetland directly/indirectly |
| 5 | Unsustainable irrigation and drainage projects |
| 6 | Interventions to the water level by the official institutions |
| 7 | Discharge of domestic/urban/industrial zone/factories’ wastewater to the site without treatment |
| 8 | Pesticides pollution |
| 9 | Industrial pollution |
| 10 | Uncontrolled/illegal construction and expansion activities |
| 11 | Unplanned tourism/uncontrolled use of the recreational areas |
| 12 | Shallowing of lakes as a result of alluvium being carried to lakes through drainage channels |
| 13 | Coastal erosion |
| 14 | Wind erosion |
| 15 | Reed field fires to create agricultural land and excessive reed cutting |
| 16 | Unplanned and uncontrolled grazing |
| 17 | Sand removal from the area |
| 18 | Illegal hunting |
| 19 | Illegal/over-fishing and introducing alien fish species |
| 20 | Solid waste accumulation on the shores |
| 21 | Salinization of freshwater ecosystems and agricultural soils |
| 22 | Changes in the salinity of the area with freshwater carried by the drainage channels |
| 23 | Destruction of dunes and natural habitats to gain farmland |
| 24 | Superstructure projects (e.g., highway and power plants) |
| Ramsar Site | Implementation Year of the MP * | Other Protection Status | # Threats (Refer to Table 3) |
|---|---|---|---|
| Goksu Delta | 1999/RP*:2008 | Special Nature Conservation (1990) Area(1990) | 4, 7, 8, 10, 12, 13, 15, 18 |
| Wildlife Conservation Area (1990) | |||
| 1st Degree Natural/Historic Site(1996) | |||
| Lake Burdur | 2008/RP:2018 | Wildlife Conservation Area (1993) | 3, 7 |
| Lake Seyfe | 2011 | 1st Degree Natural/Historic Site (1989) | 2, 4 |
| RP:2016 | Nature Conservation Area (1990) | ||
| Lake Kus (Manyas) | 2003 | National Park (1959) | 6, 7, 15, 19 |
| RP:2018 | Wildlife Conservation Area (1996) | ||
| 1st Degree Natural/Historic Site(1981) | |||
| Sultan Marshes | 2008 | Wildlife Conservation Area (1971 and 1984) | 1, 4, 7, 10, 14, 15, 16 |
| Nature Conservation Area (1988) | |||
| 1st Degree Natural/Historic Site (1993) | |||
| National Park (2006) | |||
| Kızılırmak Delta | 2008 | Wildlife Conservation Area (1979) | 4, 5, 7, 10, 18 |
| RP:2016 | 1st Degree Natural/ Historic Site (1994) | ||
| Akyatan Lagoon | 2011 | Wildlife Protection and Reproduction Area(1987) | 7, 19, 20, 22, 23 |
| RP:2018 | 1st Degree Natural/Historic Site (1997) | ||
| Wildlife Con. and Development Area (2005) | |||
| Lake Uluabat | 2003/ RP:2015 | Living Lakes (2001) | 4, 6, 9, 11, 18, 19, 24 |
| Gediz Delta | 2007 | Wildlife Conservation Area (1982-2007) | 7, 9, 10, 18, 20, 21 |
| RP:2018 | 1st Degree Natural/Historic Site (1999) | ||
| Meke Maar | under preparation | 1st Degree Natural/Historic Site (1989) | 2,14 |
| Nature Monument Status | |||
| Yumurtalık Lagoons | 2008 | 1st Degree Natural/Historic Site (1993) | 1, 3, 8, 24, 17, 18 |
| Nature Conservation Area (1994) | |||
| Kızoren Obrouk | under preparation | - | 1,2 |
| Lake Kuyucuk | 2011 | Wildlife Conservation and Development Area(2005) | 1, 2, 3, 8, 16 |
| Nemrut Caldera | 2018 | National Park (1988) | 11 |
| 1st Degree Natural/Historic Site (2002) | |||
| Nature Monument Status (2003) |
| Satellite | Spectral Resolution (µm) | Spatial Resolution (m) | Radiometric Resolution (bit) | Temporal Resolution (day) | Number of Images Used | |
|---|---|---|---|---|---|---|
| Landsat 5 TM (1985–2011) | 7 Bands (0.45–2.35) | B1, B2, B3, B4, B5, B5, B7:30m, B6:120m | 8 | 16 | 1474 | |
| Landsat 8 OLI (2013–2020) | 9 Bands (0.43–2.51) | B1, B2, B3, B4, B5, B6, B7, B9:30m B8:15m, B10, B11:30m | 16 | 16 | 505 | |
| Ramsar Site | 1985–2020 Average Annual Evaporation (mm) | 1985–2020 Average Annual Precipitation (mm) | 1985–2020 Rate (Evaporation/Precipitation) | |
|---|---|---|---|---|
| Goksu Delta | 1253.54 | 617.93 | 2.02 | |
| Lake Burdur | 1245.44 | 418.74 | 2.97 | |
| Sultan Marshes | 1422.52 | 386.26 | 3.68 | |
| Lake Kus (Manyas) | 1141.87 | 704.16 | 1.62 | |
| Lake Seyfe | 1044.68 | 410.01 | 2.54 | |
| Kızılırmak Delta | 836.91 | 721.40 | 1.16 | |
| Akyatan Lagoon | 1561.91 | 558.26 | 2.70 | |
| Lake Uluabat | 1149.62 | 707.13 | 1.63 | |
| Gediz Delta | 1464.15 | 695.31 | 2.11 | |
| MekeMaar and Kızoren O. | 1192.77 | 293.13 | 4.07 | |
| Yumurtalık Lagoons | 1544.96 | 653.36 | 2.36 | |
| Nemrut Caldera | 1072.99 | 401.38 | 2.67 | |
| Lake Kuyucuk | 870.04 | 517.79 | 1.68 | |
| Ramsar Site | DY | 1985 Spring (ha) | DY Spring (ha) | 2020 Spring (ha) | Change (1985 to DY) (ha) | Change (DY to 2020) (ha) | Change (1985 to 2020) (ha) | |
|---|---|---|---|---|---|---|---|---|
| Lake Burdur | 1994 | 20,695.85 | 17,811.51 | 12,480.92 | (−)2884.34 | (−)5330.59 | (−)8214.93 | |
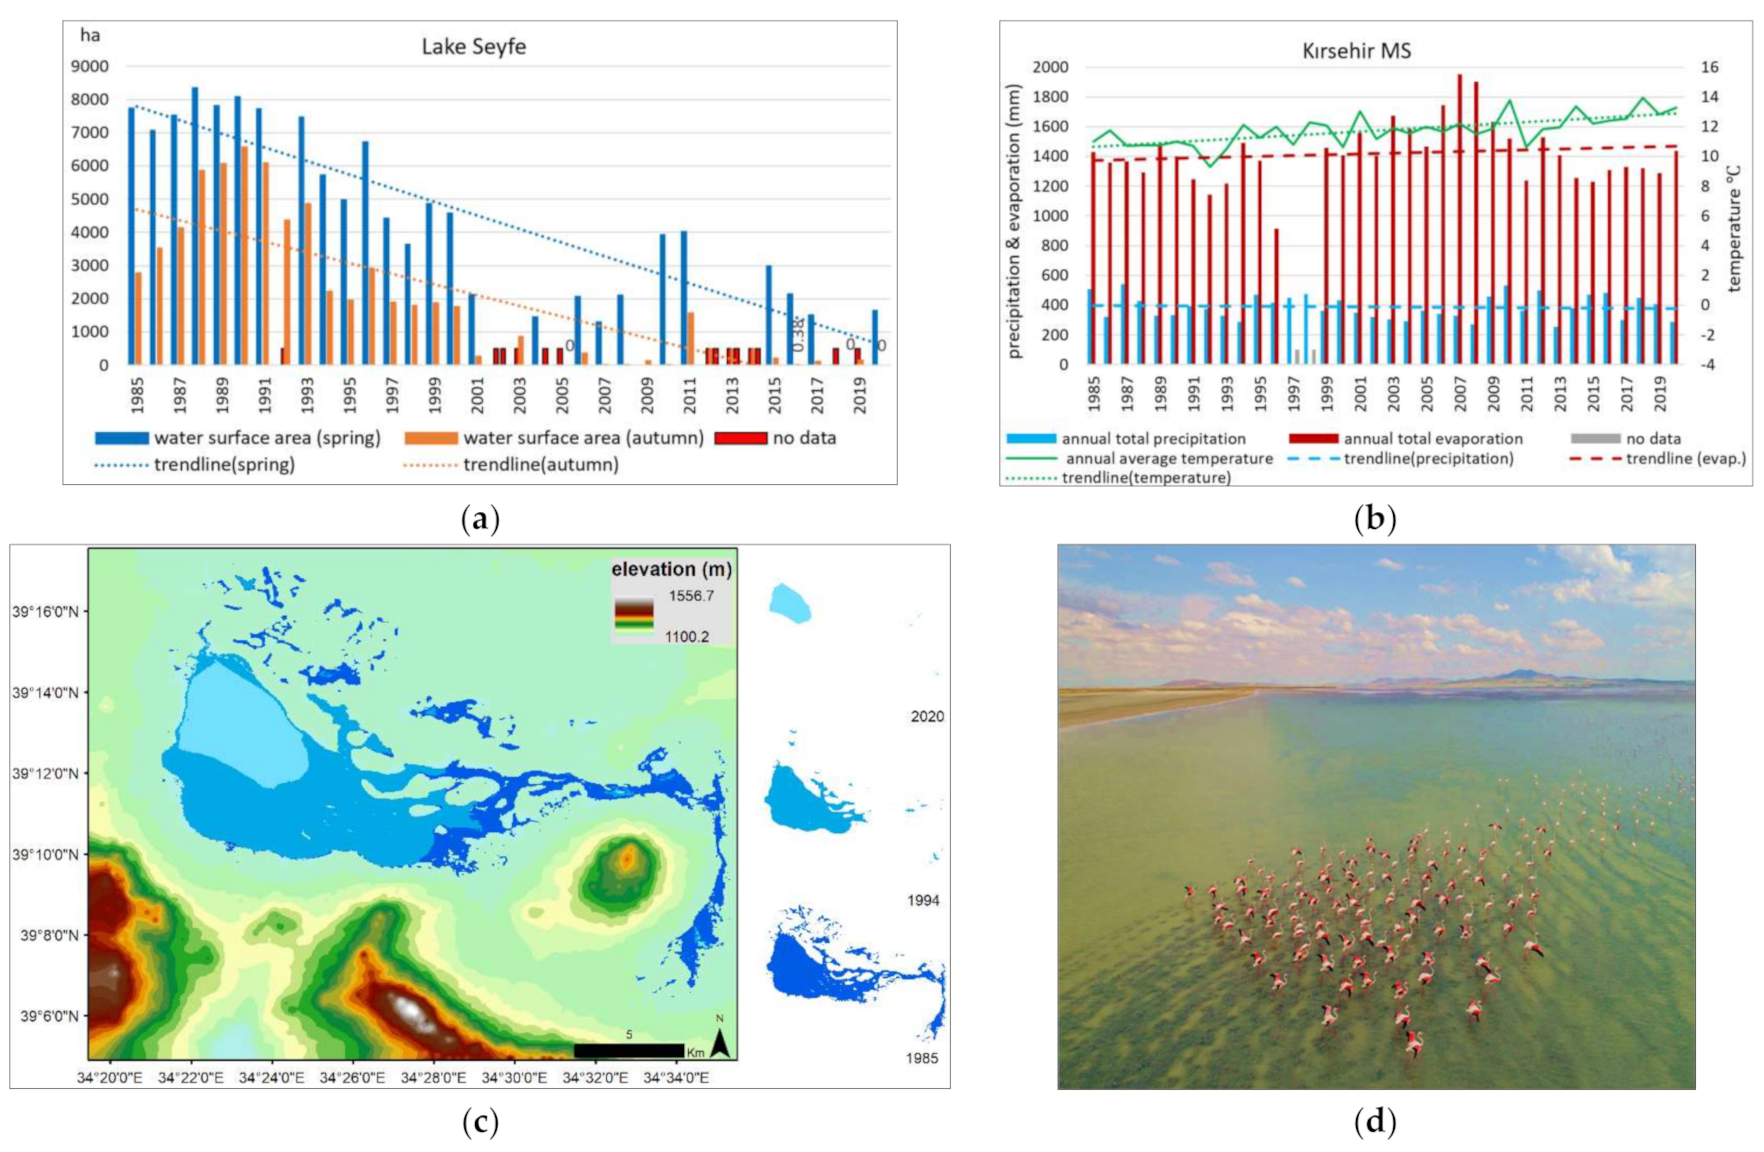
| Lake Seyfe | 1994 | 7743.39 | 5734.26 | 1656.87 | (−)2009.13 | (−)4077.39 | (−)6086.52 | |
| Lake Kus (Manyas) | 1994 | 15,269.35 | 15,308.37 | 14,919.41 | (+)39.02 | (−)388.96 | (−)349.94 | |
| Sultan Marshes | 1994 | 10,184.56 | 9577.84 | 5051.23 | (−)606.72 | (−)4526.61 | (−)5133.33 | |
| Lake Uluabat | 1998 | 13,479.7 | 14,974.43 | 11,784.49 | (+)1494.73 | (−)3189.94 | (−)1695.21 | |
| Meke Maar | 2005 | 71.26 | 50.75 | 2.17 | (−)20.51 | (−)48.58 | (−)69.09 | |
| Kızören Obrouk | 2006 | 2.92 | 2.33 | 1.86 | (−)0.59 | (−)0.47 | (−)1.06 | |
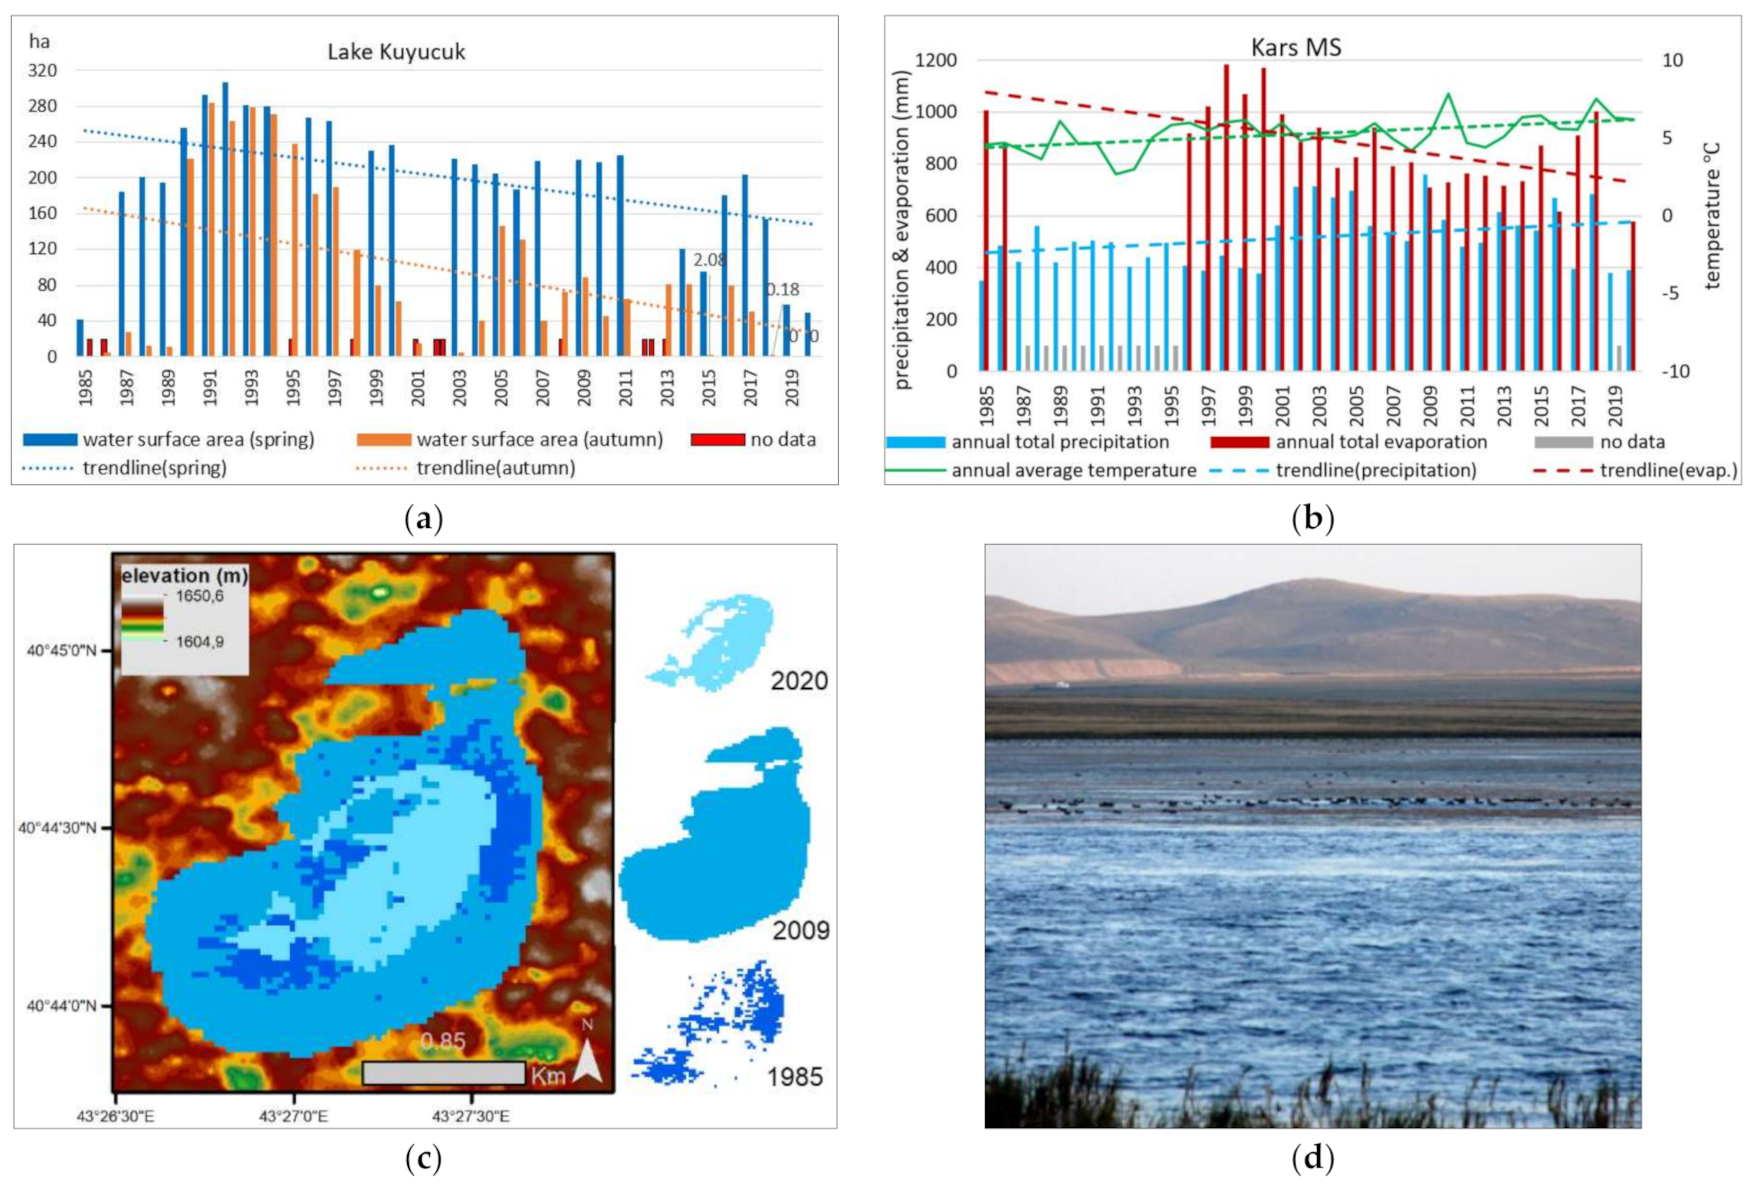
| Lake Kuyucuk | 2009 | 41.82 | 218.96 | 37.67 | (+)177.14 | (−)181.29 | (−)4.15 | |
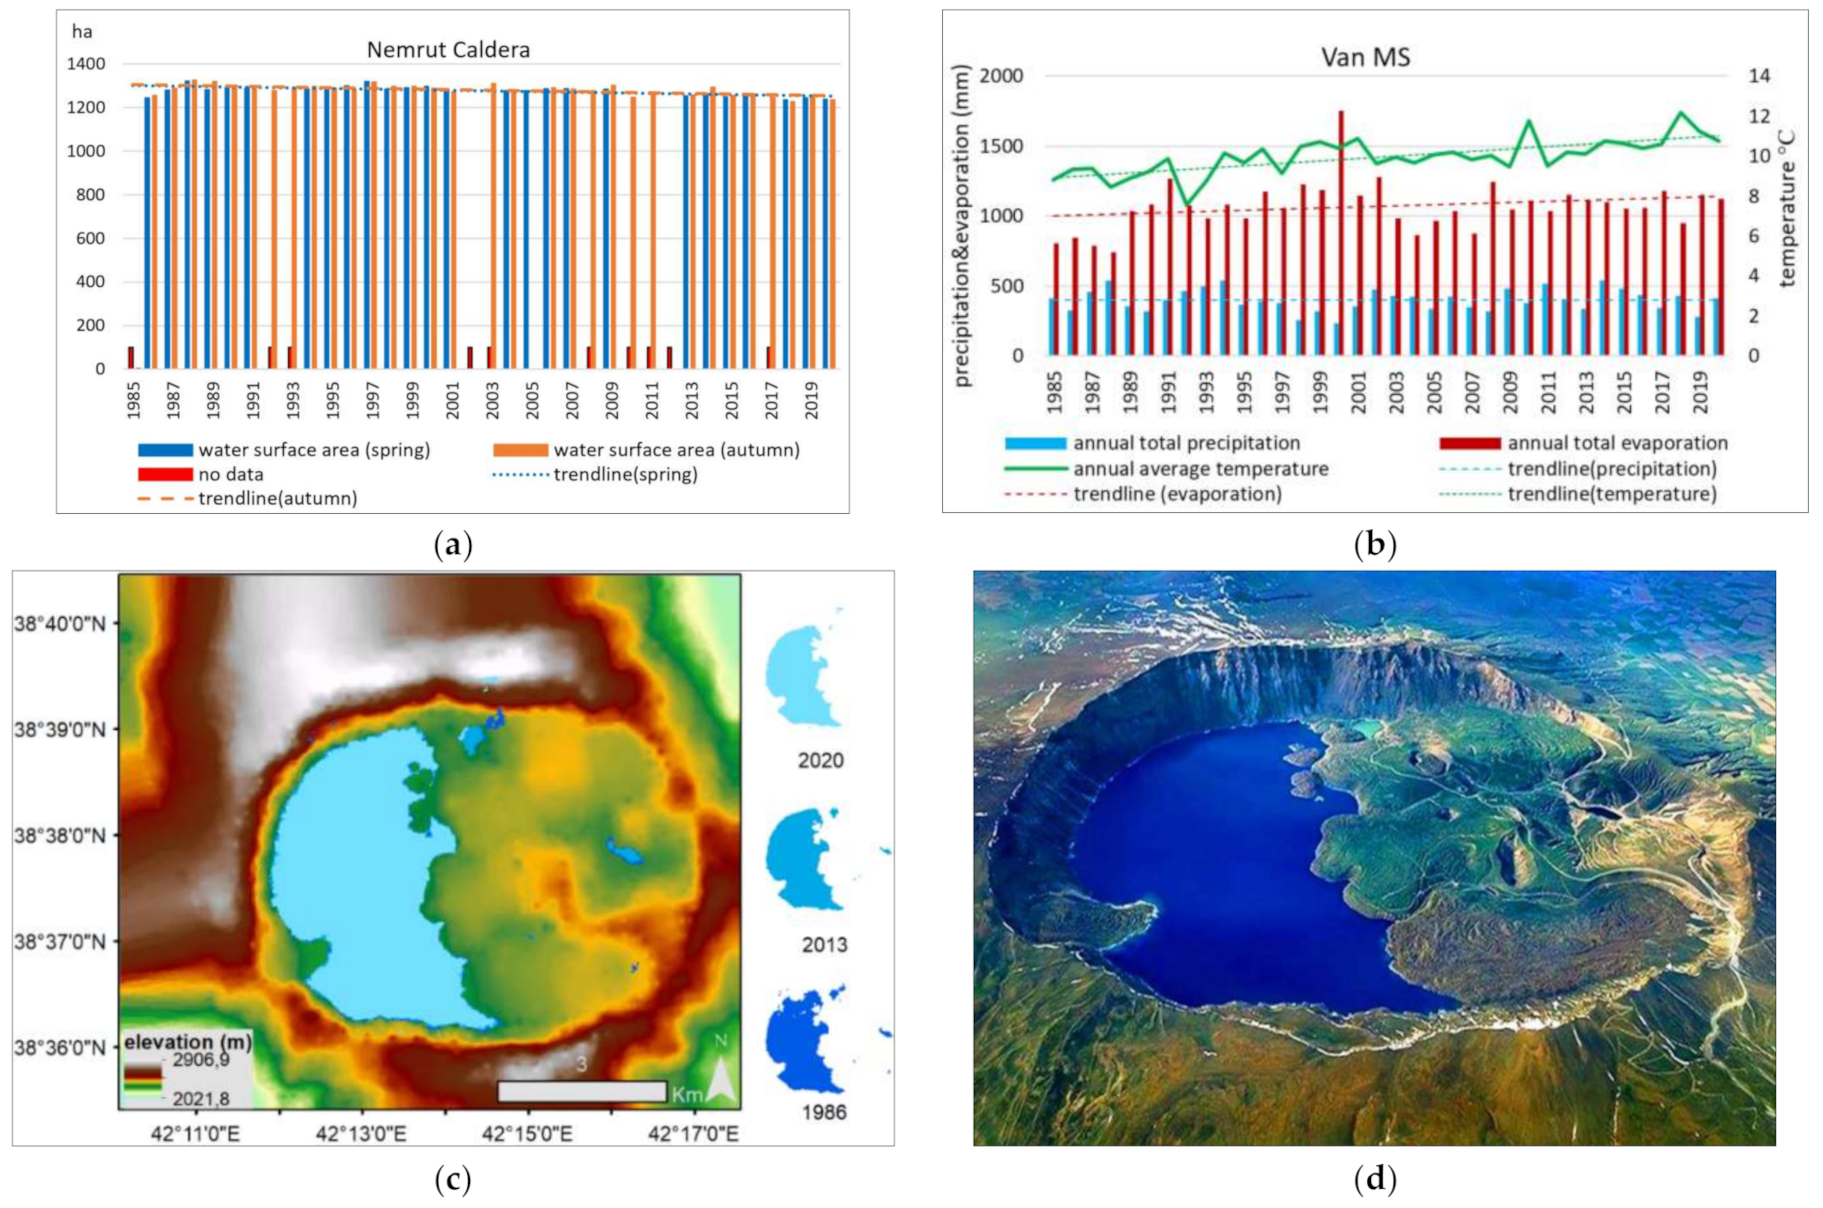
| Nemrut Caldera | 2013 | 1255.98 | 1254.23 | 1239.21 | (−)1.75 | (−)15.02 | (−)16.77 | |
| Total (ha) | 68,744.83 | 64,932.68 | 47,173.83 | (−)3812.15 | (−)17,758.90 | (−)21,571.00 | ||
| Total Percent Change (%) | (−)5.55 | (−)27.35 | (−)31.38 |
| Ramsar Site | DY | 1985 Autumn (ha) | DY Autumn (ha) | 2020 Autumn (ha) | Changes (1985 to DY) (ha) | Changes (DY to 2020) (ha) | Changes (1985 to 2020) (ha) |
|---|---|---|---|---|---|---|---|
| Lake Burdur | 1994 | 20,544.35 | 17,491.96 | 12,349.11 | (−)3052.39 | (−)5142.85 | (−)8195.24 |
| Lake Seyfe | 1994 | 2775.78 | 2220.03 | 0 | (−)555.75 | (−)2220.03 | (−)2775.78 |
| Lake Kus (Manyas) | 1994 | 12,939.21 | 15,022.01 | 14,569.03 | (+)2082.8 | (−)452.98 | (+)1629.82 |
| Sultan Marshes | 1994 | 3549.62 * | 3220.28 | 1602.01 | (−)329.34 | (−)1618.27 | (−)1947.61 |
| Lake Uluabat | 1998 | 11,394.02 | 11,573.3 | 11,029.75 | (+)179.28 | (−)543.55 | (−)364.27 |
| Meke Maar | 2005 | 55.17 | 47.39 | 0 | (−)7.78 | (−)47.39 | (−)55.17 |
| Kızoren Obrouk | 2006 | 2.55 | 2.26 | 2.14 | (−))0.29 | (−) 0.12 | (−)0.41 |
| Lake Kuyucuk | 2009 | 3.97 * | 88.93 | 0 | (+)84.96 | (−))88.93 | (−)3.97 |
| Nemrut Caldera | 2013 | 1255.98 * | 1258.13 | 1235.21 | (+)2.15 | (−))22.92 | (−)20.77 |
| Total (ha) | 52,520.65 | 50,924.29 | 40,787.25 | (−)1596.36 | (−)10,137.04 | (−)11,733.4 | |
| Total Percent Change (%) | (−)3.04 | (−)19.91 | (−)22.34 |
Publisher’s Note: MDPI stays neutral with regard to jurisdictional claims in published maps and institutional affiliations. |
© 2021 by the author. Licensee MDPI, Basel, Switzerland. This article is an open access article distributed under the terms and conditions of the Creative Commons Attribution (CC BY) license (https://creativecommons.org/licenses/by/4.0/).
Share and Cite
Dervisoglu, A. Analysis of the Temporal Changes of Inland Ramsar Sites in Turkey Using Google Earth Engine. ISPRS Int. J. Geo-Inf. 2021, 10, 521. https://doi.org/10.3390/ijgi10080521
Dervisoglu A. Analysis of the Temporal Changes of Inland Ramsar Sites in Turkey Using Google Earth Engine. ISPRS International Journal of Geo-Information. 2021; 10(8):521. https://doi.org/10.3390/ijgi10080521
Chicago/Turabian StyleDervisoglu, Adalet. 2021. "Analysis of the Temporal Changes of Inland Ramsar Sites in Turkey Using Google Earth Engine" ISPRS International Journal of Geo-Information 10, no. 8: 521. https://doi.org/10.3390/ijgi10080521
APA StyleDervisoglu, A. (2021). Analysis of the Temporal Changes of Inland Ramsar Sites in Turkey Using Google Earth Engine. ISPRS International Journal of Geo-Information, 10(8), 521. https://doi.org/10.3390/ijgi10080521