1. Introduction
Urban streets shape how people use space for both accessibility and mobility across a city. They facilitate or deter socioeconomic activity and environmental sustainability, such as job locations, commuting trips, and modal share. Therefore, the urban street’s intrinsic design influences how cities grow and their transportation needs over time [
1]. For instance, past urban planning policies optimized urban streets for motorized traffic while ill-treating pedestrians and cyclists by imposing constraints and exposing them to dangers. Conversely, current policies are now trying to move in a more sustainable direction by targeting transportation systems towards more efficient and sustainable solutions, focusing on providing safe, comfortable, and positive experiences for pedestrians and cyclists, since these users place a relatively high value on certain route characteristics [
2,
3].
The built environment has a notable effect on travel decisions, and so spatial context is vital [
2]. Analyzing the relationship between physical space, urban form, accessibility, and transportation becomes key to understanding how transportation systems can be adapted and improved to benefit everyone. Identifying how city areas and their street networks serve distinct transportation modes and how unbiased these networks are, is becoming key to providing spatial equity for the entire population. The use of the Gini coefficient and Lorenz curves can help drive policy towards such spatial inequity [
4]. Furthermore, studying travel mode choice and how routes can promote or deter the choice of a given mode becomes even more important when cities seek to promote more sustainable travel modes, such as cycling and walking.
Analyzing how urban streets perform, both in terms of efficiency (to meet some functioning target) and use (to satisfy demand) can help understand how to promote such positive experiences. We base our work on this assumption by using circuity (a measure of urban network efficiency [
5]), together with open data and tools, ultimately fostering the use of an easily repeatable methodology to analyze how streets are different for different transportation modes. Circuity (also called detour index or route factor [
6]) measures network distances’ ratio to straight-line distances. In short, circuity serves as a basis for measuring the attractiveness of routes, and it can serve as a starting point in the comparison of city areas, districts, or even whole cities from a network performance perspective. In our work, we measure and compare the circuity of three distinct networks: drivable, cyclable, and walkable street networks.
The thought of describing and analyzing how street networks impact cities’ liveability and enjoyment is not new [
7,
8]. Urban network analysis primarily arises from graph theory and how network topology can describe both structure and efficiency [
9]. Network characteristics and respective metrics, such as connectivity, density, and centrality, help to differentiate network designs and, therefore, expectable travel intensities [
8,
10]. The growing interest in understanding urban network structure has led to research on urban metrics such as completeness [
8], connectivity [
10], treeness [
10], centrality [
11], street density [
8], street bearings, and street orientation entropy [
12], among other things. Ultimately, by trying to quantify cities’ spatial structure of transportation networks, these metrics can support urban planning as they are tools to simulate different scenarios and compare different network systems [
7,
13]. In turn, this may enable planners and decision-makers to make faster and more accurate decisions on areas that may need intervention [
9,
11,
14].
Quantitative measures of the underlying network explore different transportation system’s performance (supply side), together with travel data (demand side) [
8]. Here, Reference [
8] notes that greater connectivity leads to less travel, and thus, quantitative measures should be considered when designing and planning new infrastructures. Similarly, ref. [
14] suggests how network indicators can evaluate transportation performance. In this case, average closeness centrality and road connectivity over average road circuity identify situations where one could ease road congestion.
In this work, although planning should analyze and combine different metrics, we focus only on circuity as it is a direct result of how networks are planned and built [
12], and, in comparison, street network configurations impact how people use street networks for both their accessibility (to reach the desired activity locations) and mobility (usage-intensity of a segment) [
15,
16]. Circuity, i.e., the traveled distance and straight-line distance ratio, can measure locations’ attractiveness because trips with lower circuity trips imply fewer detours and become more attractive in the distance traveled. Research has analyzed the relation between home locations and workplaces based on lower circuity values [
16] or exploring how circuity helps explaining transit accessibility to jobs and how it can significantly assist in explaining commuting mode share across different U.S. metropolitan cities [
5]. Similarly, Cubukcu [
6] uses circuity to examine the network efficiency of Paris. As noted, circuity varies with distance traveled, and it is not homogeneous across space, suggesting the hypothesis that different city districts have to be analyzed individually to evaluate its efficiency better.
Circuity has been studied before for different transportation modes: car [
6,
17,
18,
19], bicycle [
19], walking [
18,
19,
20,
21], and transit [
5]. Different transportation modes use different types of networks. For example, pedestrians may use sidewalks, whereas cars cannot, and vice versa, cars may use freeways while pedestrians cannot. Analyzing each transport network’s circuity separately is essential as each distinct transportation mode can be associated with a different network. Comparisons between different modes have also been studied in several U.S. cities [
18] and Thailand’s capital [
19], and statistical differences were found between driving, walking, and cycling. Results show that walking trips’ circuity is typically lower than cycling or driving. Nevertheless, Yen et al. [
19] and Cubukcu [
6] also note a distinction on how circuity measures vary from city district to city district, suggesting that we should analyze circuity at a city district level for a better comprehension of the network. However, circuity has not been evaluated longitudinally across time.
This paper’s main objectives are threefold:
- 1.
To present a methodology based on open data and tools for analyzing different transport modes’ circuity in urban street networks;
- 2.
To compare and analyze circuity based on two distinct sampling strategies that serve to understand urban street networks under two scenarios: isotropy (analyze the network as a whole) or anisotropy (analyze the network that people use); and
- 3.
To analyze the evolution of circuity across time and explore if (and how) infrastructure changes have influenced circuity in urban networks.
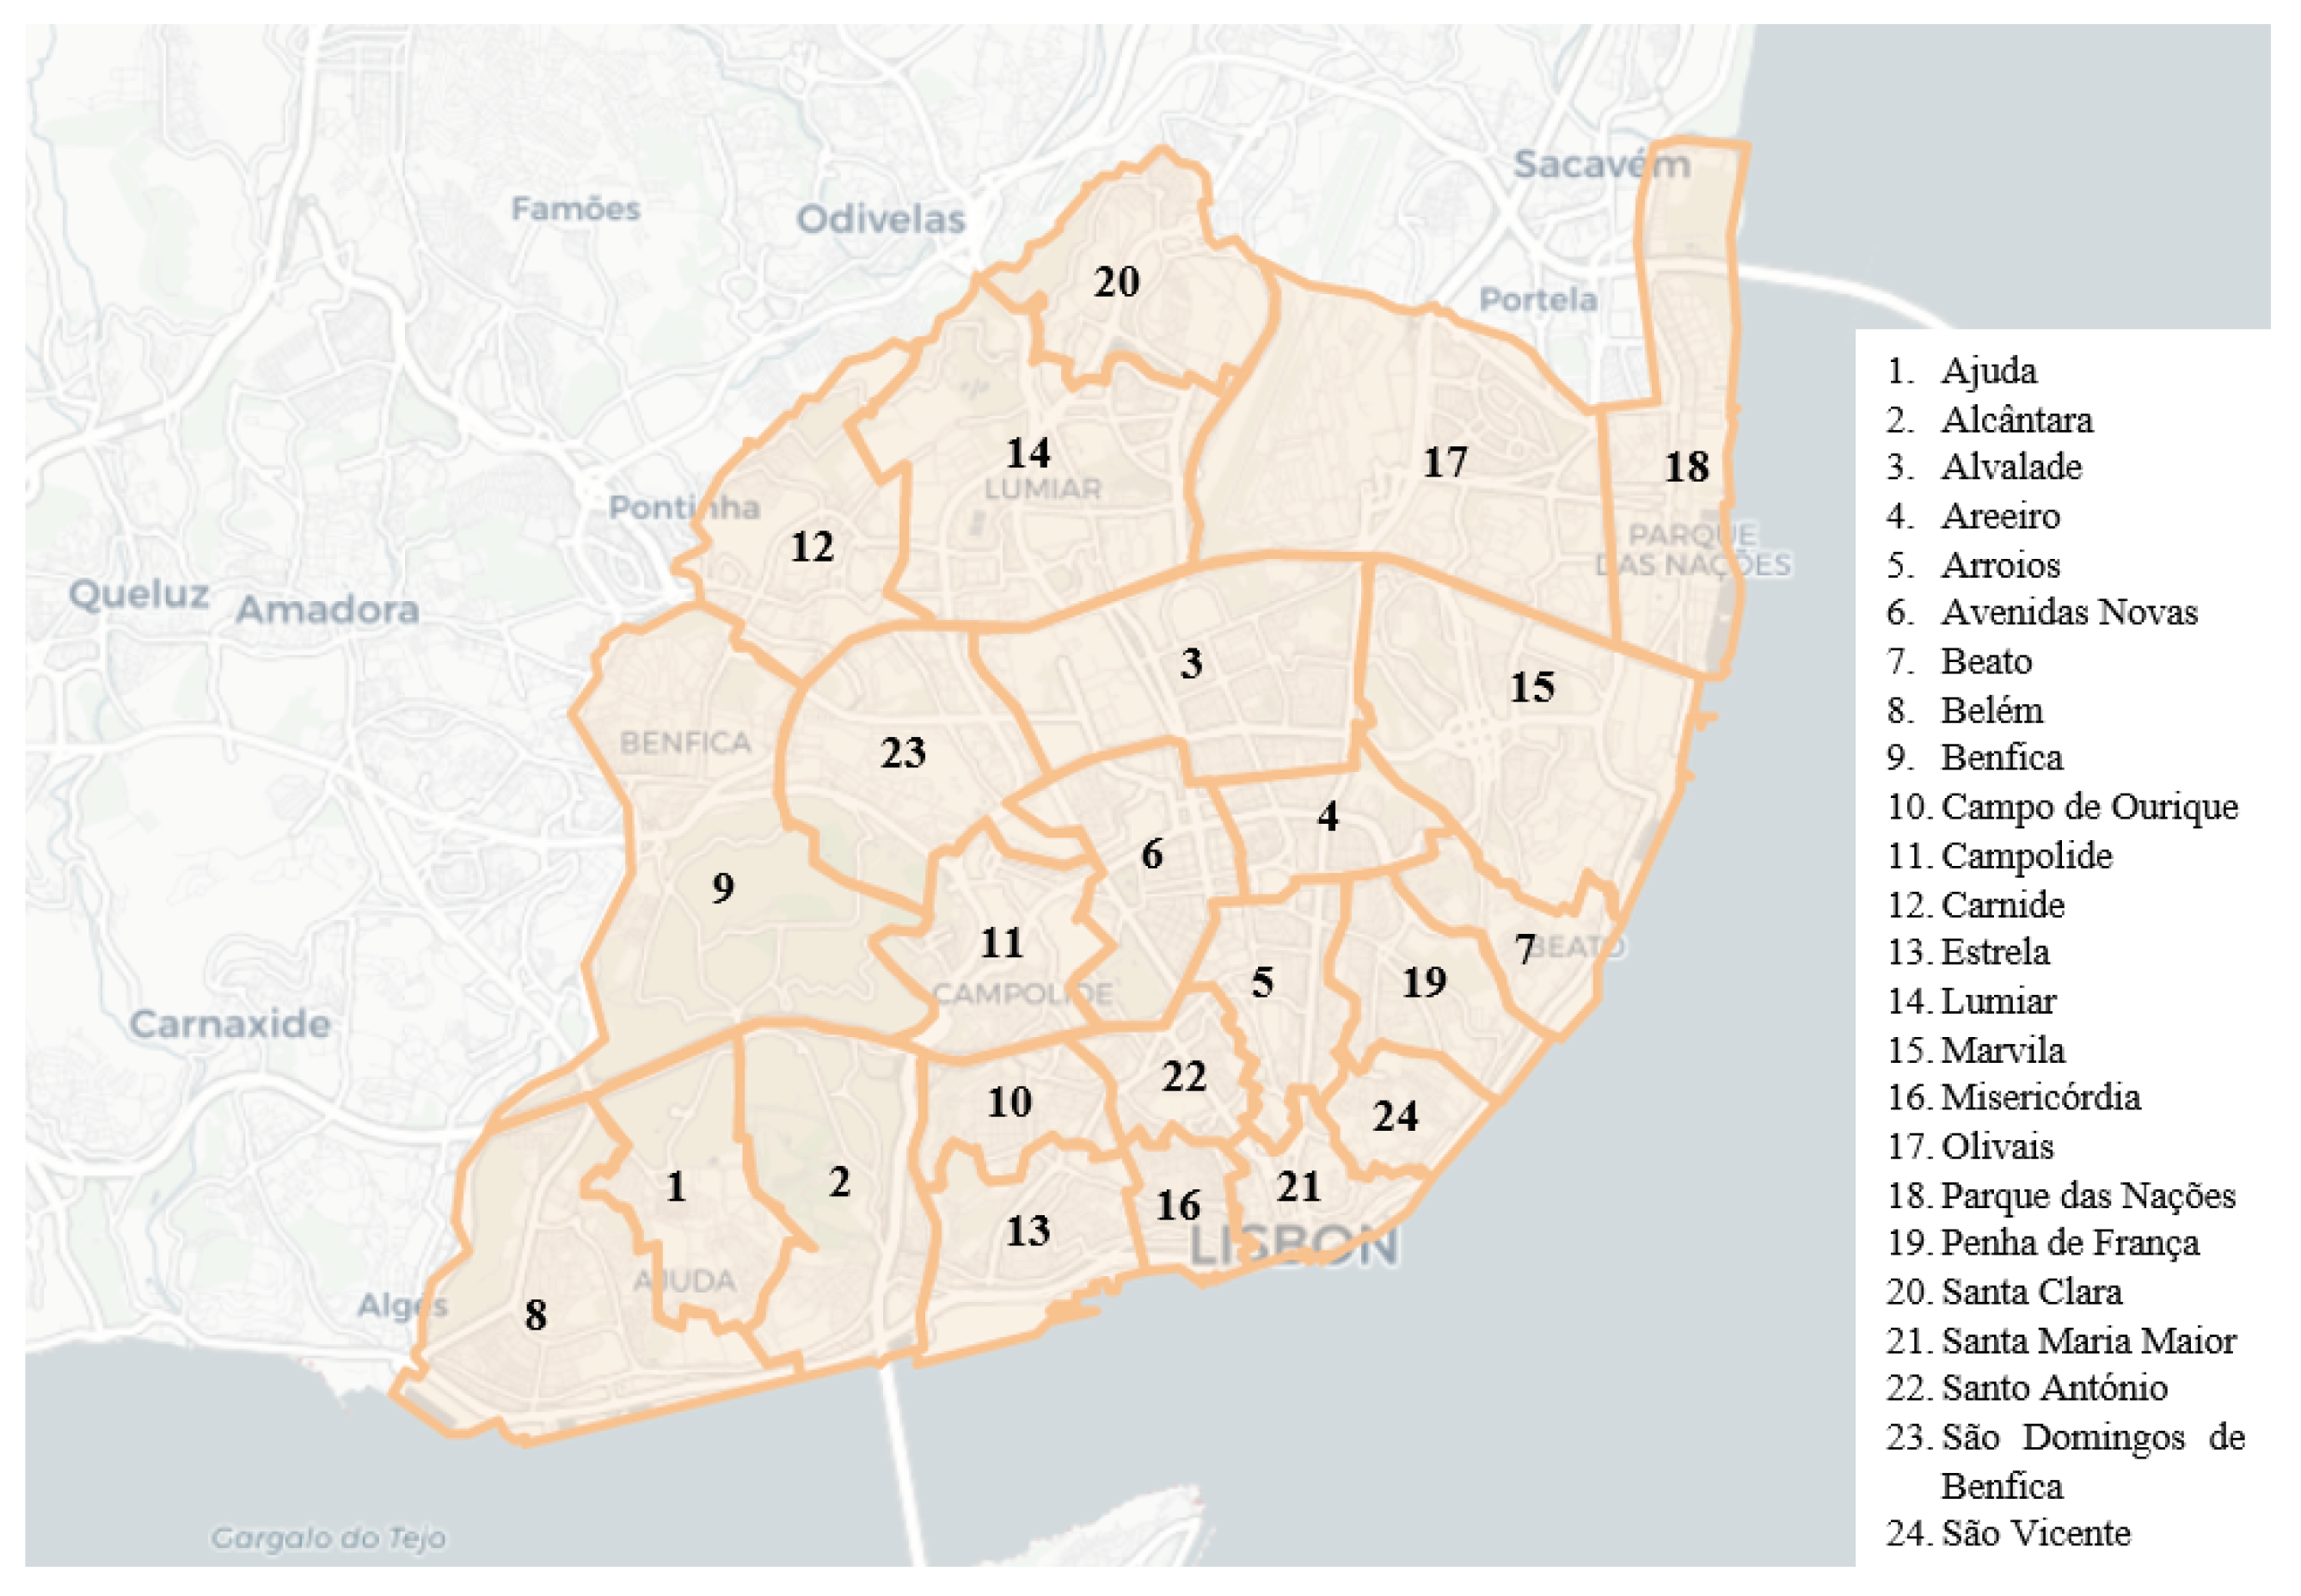
We use Lisbon, Portugal as a case study and analyze circuity for three urban street networks: drivable, walkable, and cyclable circulation. Lisbon has changed in recent years, with the municipality investing more in both cycling and walking infrastructures. We use the presented methodology to understand whether municipalities’ interventions have produced meaningful circuity changes for all users over time and whether these changes have resulted in better circuity for the network as a whole, or to the network that people actually use. We base our procedure on open data from OpenStreetMaps (OSM) to explore circuity for 2013–2020, easily replicable in any other region (mapped by OSM). These data include drivable, walkable, and cyclable networks, which we then use to simulate 4.8 million routes using OpenRouteService. Next, we compute circuity measures longitudinally across time (yearly analysis) and for the different modes. To the best of our knowledge, this isotropic vs. anisotropic and temporal analysis has not been performed in the past.
We organize the paper as follows: after this introductory section, we present the data, materials, and methodology used in
Section 2, including a brief description of Lisbon as our case study. Next, in
Section 3, results from our circuity calculations are enumerated and discussed further in the Discussion section. Finally, conclusions finalize the paper.
3. Results
Following the simulation of 100,000 trips for each sampling technique, we computed the circuity values for all three transport modes between 2013 and 2020. In total, we simulated 4.8 million routes and calculated the corresponding circuity. Next, we present a series of results that we found in our analysis. First, we show the evolution of the average circuity over time in Lisbon. We detail circuity for the three modes and point out how circuity differs for different traveled distances. Second, we show the main differences between the two sampling techniques: MSS and RS. Based on this analysis, we zoom in on our analyses at Lisbon’s parishes scale. Noticeably, parishes’ circuities are very distinct. More, we see how the cycling infrastructure expansion had a remarkable impact on cycling circuity values. Fourth, we take a more refined look at the types of roads (way types) used per trip mode. We could spot where each segment of each trip was made, allowing for a contextual inspection of trips. Finally, we use the Gini coefficient to diagnose any significant inequalities between drivable, cyclable, and walkable networks.
3.1. Average Circuity
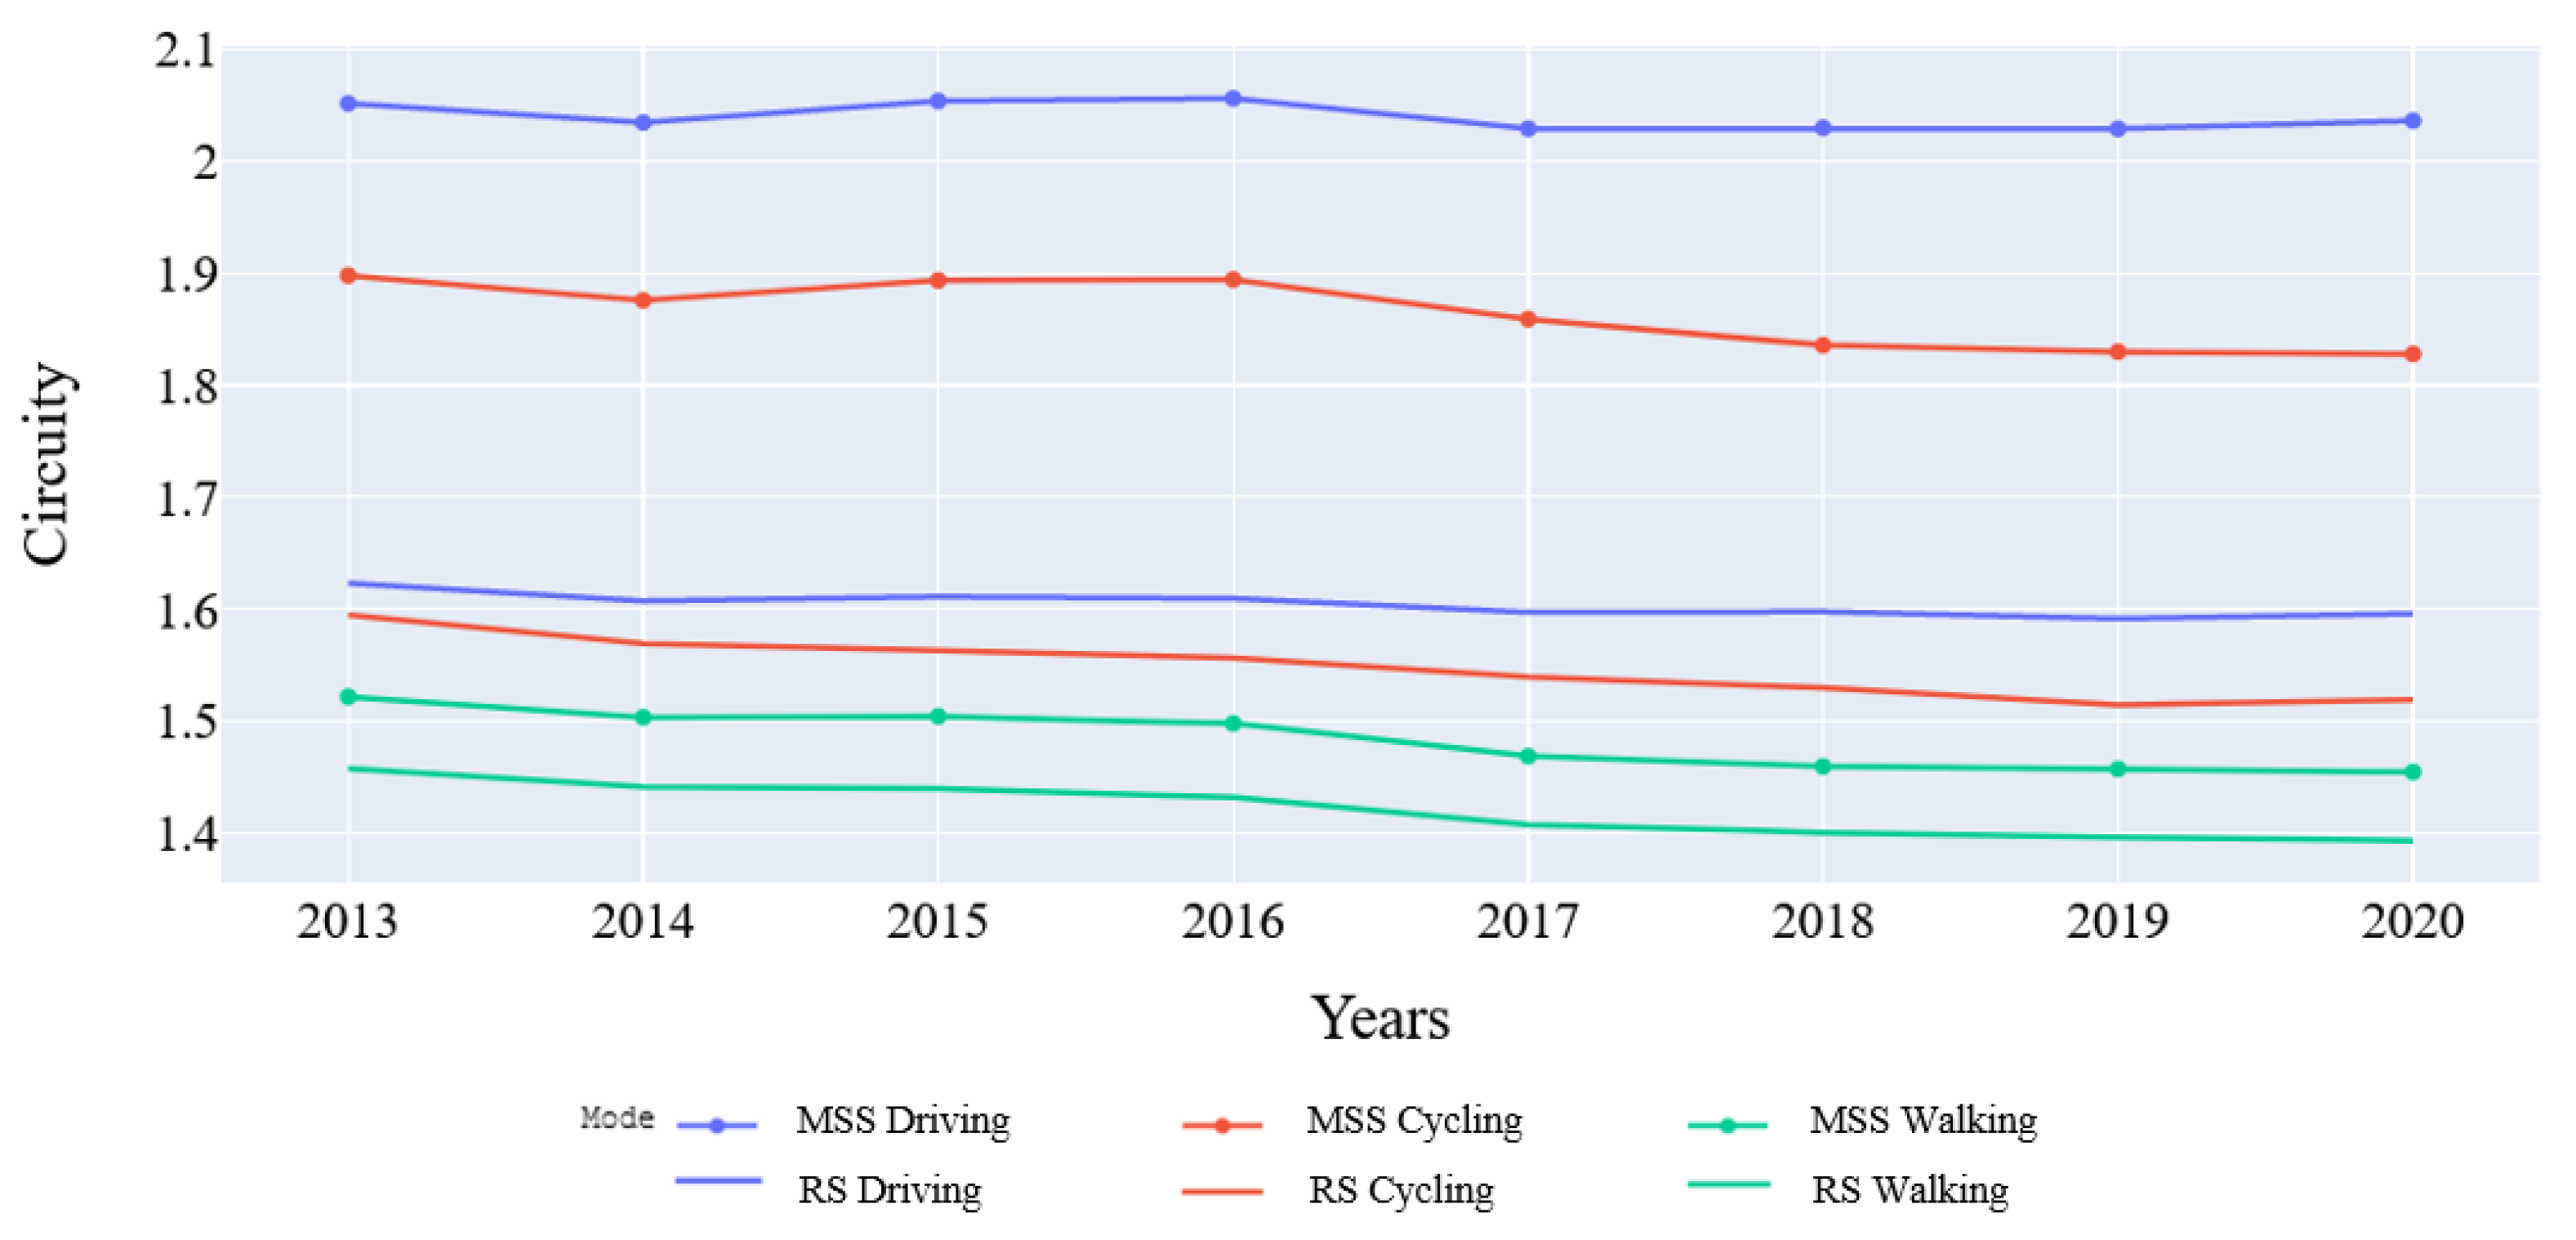
Figure 4 shows the average circuity for driving, cycling, and walking trips for the two sampling techniques (MSS and RS) between 2013 and 2020. We notice a decreasing trend in circuity values for cycling and walking, whereas such a trend is not evident for driving trips. In particular, 2016 appears to be a turning point for both active modes, which seems to match Lisbon’s greater expansion of the cycling network (cf.
Figure 3). Furthermore, driving trips are more circuitous than cycling trips, which are more circuitous than walking trips. Finally, we see that RS trips exhibit lower levels of circuity for all modes when compared to MSS.
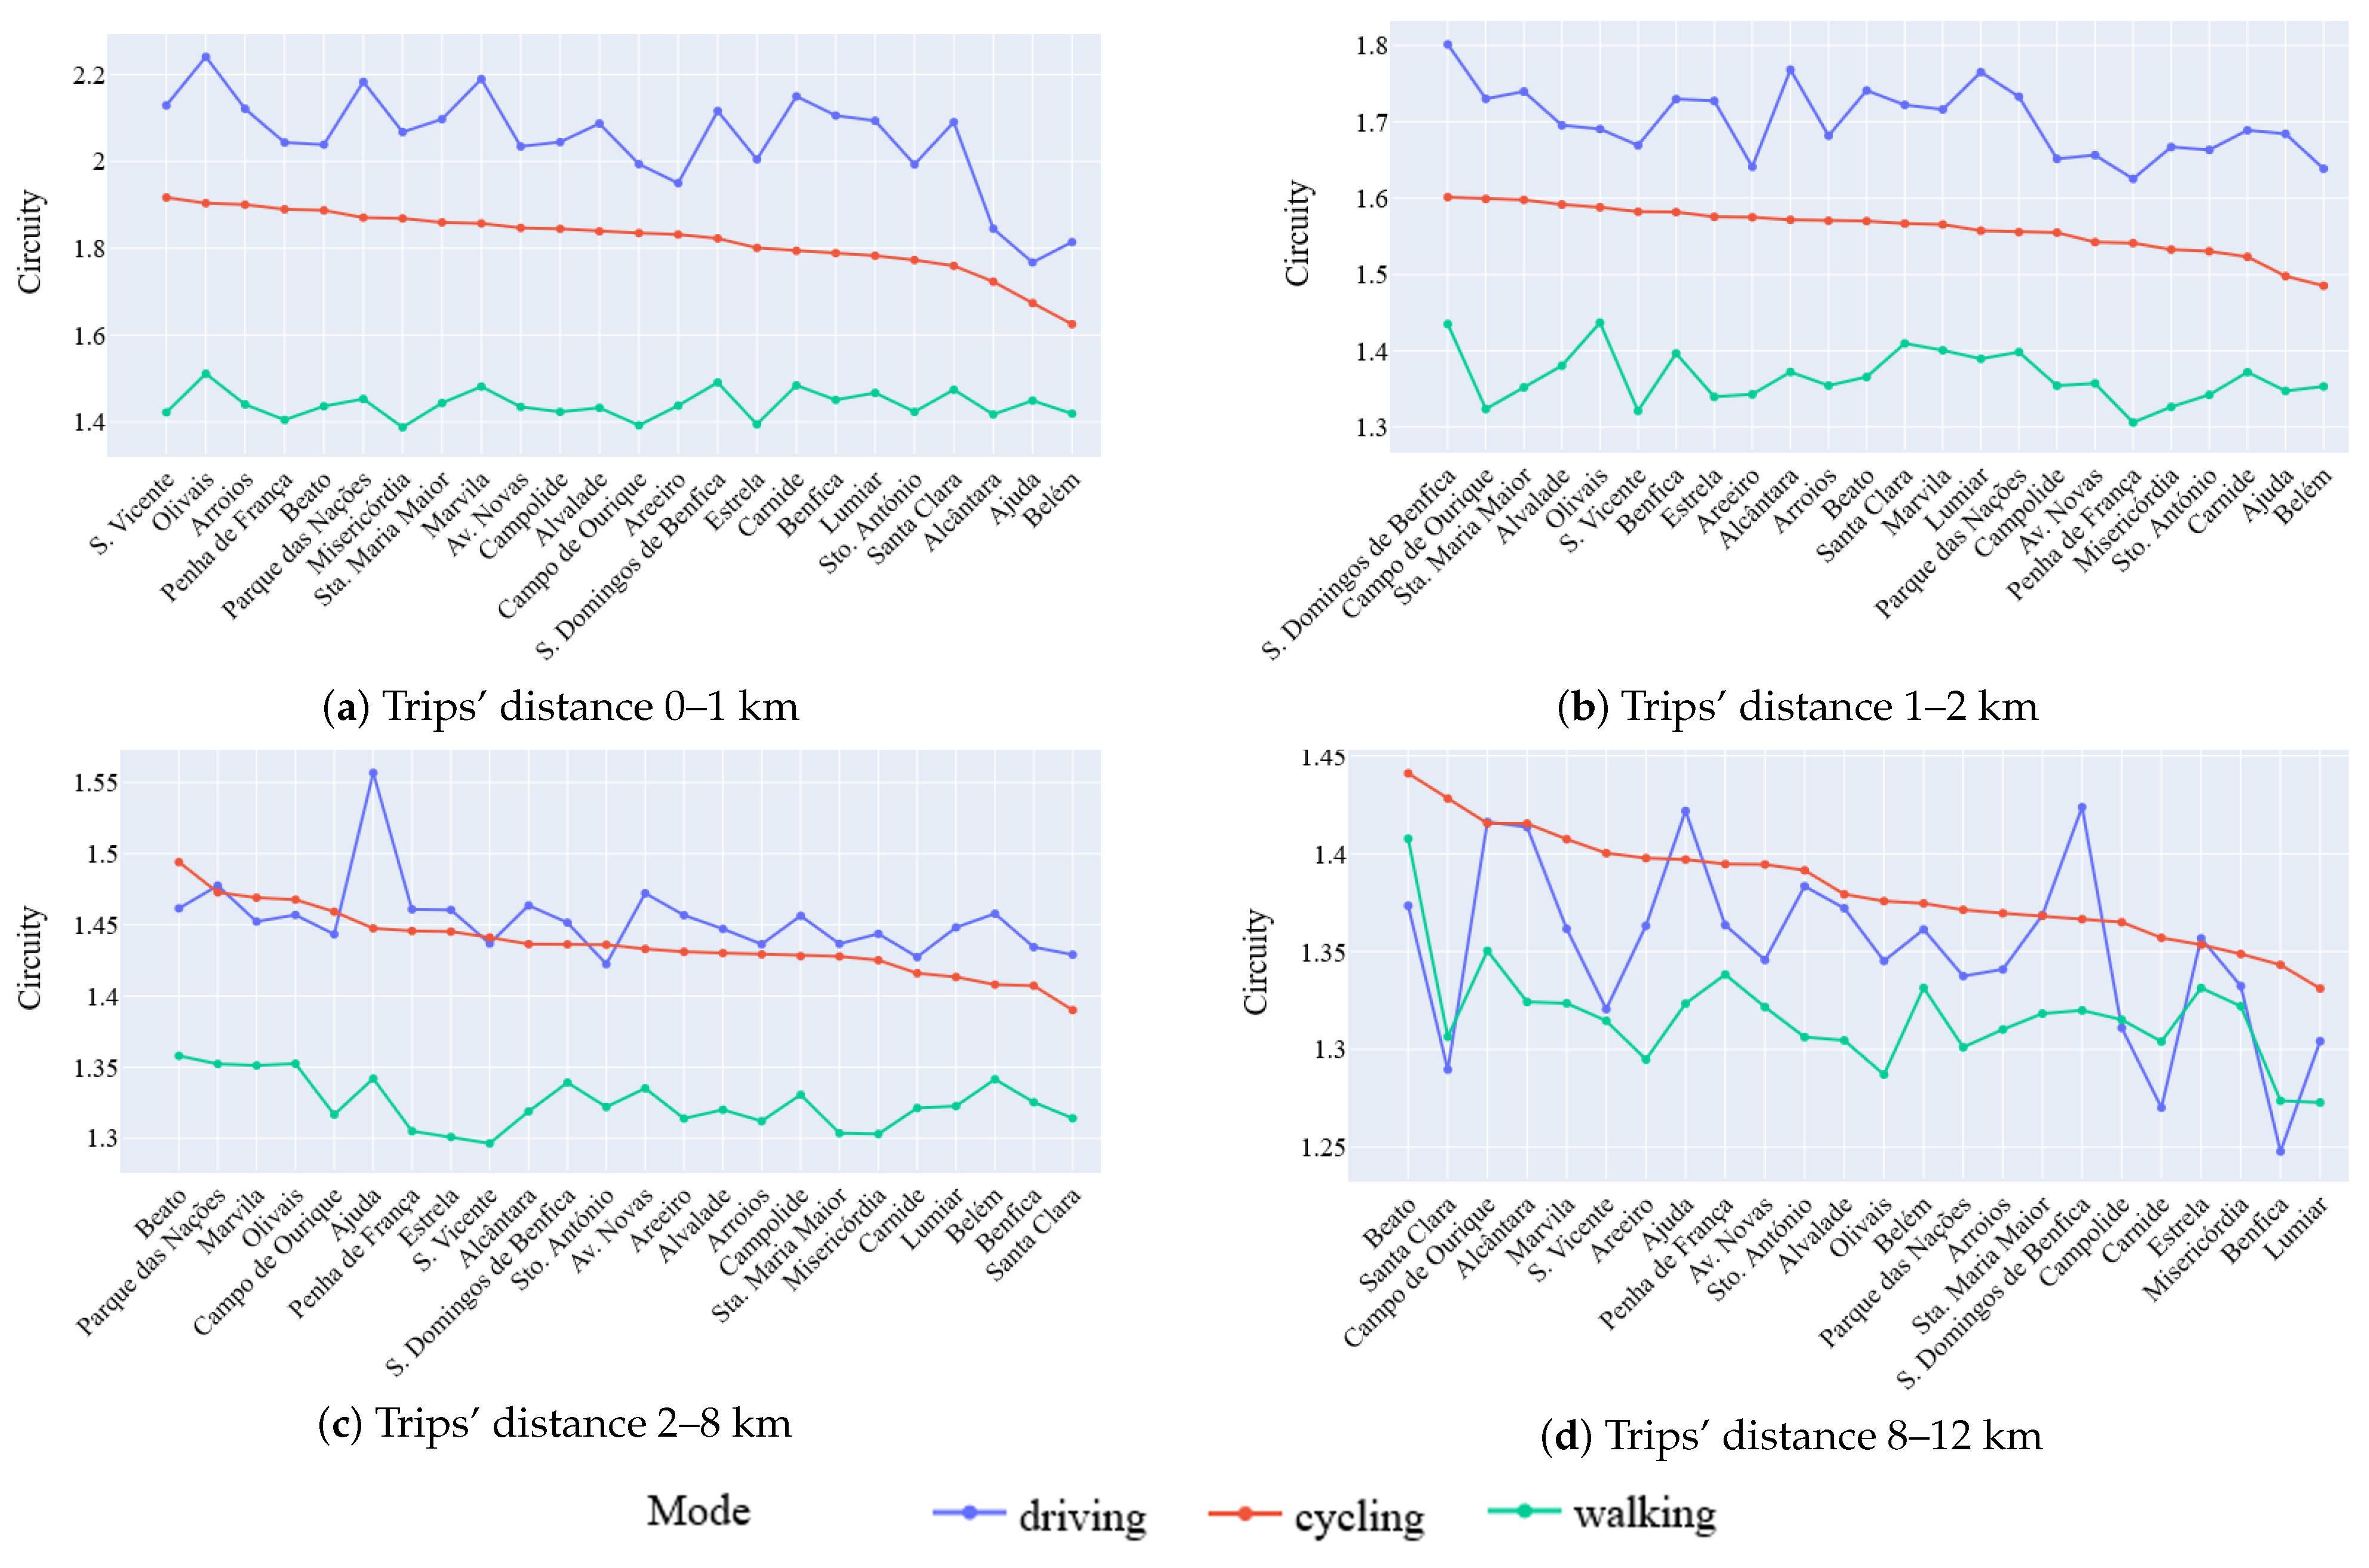
While mean circuity helps in a generalized analysis, a more detailed inspection can be performed if trips are categorized according to the distance traveled.
Figure 5 shows MSS and RS trips categorized across four distance intervals: 0–1 km, 1–2 km, 2–8 km, and 8–12 km. Again, circuity decreases as trip distance increases, with trips up to a kilometer being highly circuitous for cars and bicycles. Interestingly, for trips over a kilometer, RS trips become slightly more circuitous than MSS trips. Between 2 and 8 km, 2013–2014 car trips are as circuitous as bicycle trips. These became slightly less circuitous from 2015 onwards. For trips above 8 km, cycling becomes more circuitous than driving, regardless of the sampling technique. Cycling trips prefer to use cycling infrastructure. For greater trip distances, cyclists will route to more circuitous routes, increasing circuity levels. This shows that there is a lack of connectivity between distant regions in Lisbon.
Finally, we check to see the variation of cycling average circuity with the changes in total cycling lanes length in Lisbon. From 2013 to 2020, 55.4 km of cycleways were built in Lisbon, in which there was a reduction in the average cycling circuity of about 0.09. More noticeably, between 2016 and 2017, 23.15 km of cycleways were built, coinciding with the biggest decrease in circuity during the same period, as seen in
Figure 4 (about 50% of the total decrease for the period 2013–2020).
3.2. MSS vs. RS
Next, we compare the two sampling techniques: MSS and RS. Looking at the trips’ starting points and destination points, we note that despite OD points being spread through the city, RS and MSS only share the same origin and destination parishes in 3% of all trips, meaning that OD pairs are almost non-overlapping. This difference highlights the chosen OD points between the two sampling strategies, highlighting that MSS shows preferential trips made by its citizens.
Figure 6 illustrates the density of trips’ origins per Lisbon parishes’ area. As we can see, there are significant differences between the two sampling techniques. For one, RS density is approximately equal for all parishes. However, this is not the case for MSS, where density is higher for parishes near the CBD and its surroundings, such as Avenidas Novas, Arroios, Misericórdia, and Santo António. Results are similar if we ought to consider density per destination point. This result highlights the differences between the two techniques. While RS assumes an isotropic territory and thus selecting points from the entire city evenly, MSS assumes an anisotropic territory and captures locations that generate or attract people and trips. Such results emphasize the hypothesis that both sampling techniques should be used for different purposes: RS should be used for an isotropic analysis of the entire territory (e.g., as a proxy of the full territory’s potential mobility), and MSS ought to be used for analyzing citizen’s mobility needs and, therefore, their trips.
3.3. Lisbon’s Parishes Circuities
Figure 7 depicts the median circuity for trips that start and end on the same parish relative to different distance categories for the year 2020. We use 2020 as a case study and MSS as the sampling technique to better evaluate how the current network performs for intrazonal trips, i.e., trips that begin and end within the same parish. As we can see, there are significant differences in how driving, cycling, and walking perform for Lisbon’s 24 parishes. In general, for shorter trips (<2 km), driving is more circuitous than cycling, which is more circuitous than walking. For trips between 2 and 8 km, car trips are as circuitous as bicycle trips, except for the Ajuda parish. Lastly, for trips over 8 km, the car seems the best option compared to cycling and even walking in some cases. Considering Lisbonians’ average trip distance of 4.2 km, we can note that for this distance category (2–8 km), the car seems as attractive as cycling when it comes to the distance traveled, which may help to explain Lisbon’s car dominance but also suggests that there is a potential for cycling uptake.
Instead, if we consider our analysis’s entire period, we note some other particularities of how circuity has changed over time.
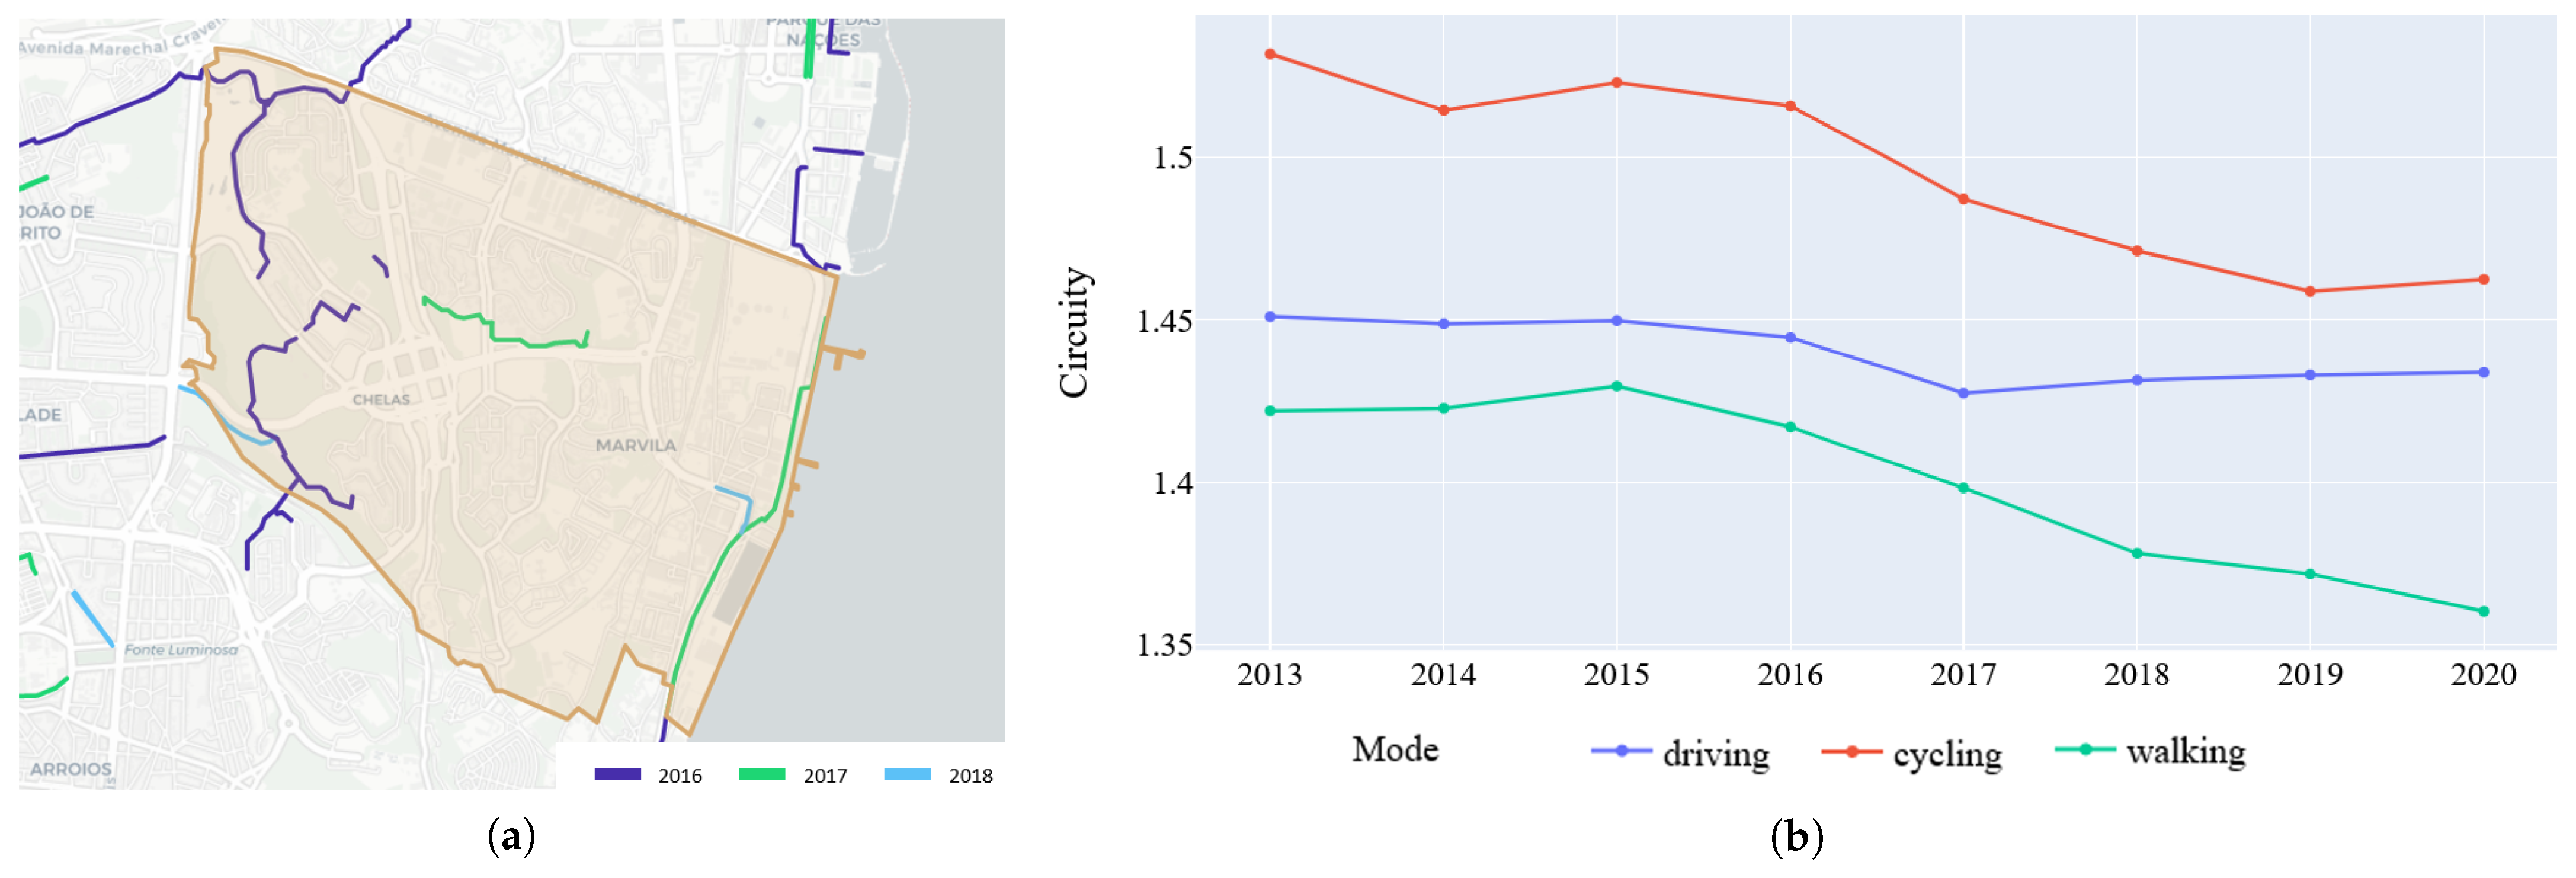
Figure 8 and
Figure 9 illustrate the evolution of the median circuity between 2013 and 2020 for trips between2 and 8 km using the MSS approach for two parishes in Lisbon: Marvila and Olivais. Both parishes had multiple infrastructure interventions with, amongst others, the construction of cycleways designed to link the CBD with these parishes better. In Marvila, cycling infrastructures increased near one of its core avenues and the riverbank from2016 to 2017, with a supplementary expansion in 2018. Since then, the network has remained unchanged. Similarly, between 2016 and 2018, we see a sharp decrease in cycling’s circuity, coinciding with the infrastructure changes. The same happened in Olivais. We noted a decreasing circuity from 2015 to 2019 and stagnation in 2019–2020. The parish also suffered infrastructure changes up until 2020. However, it appears that the infrastructure changes in 2020 did not produce any meaningful circuity changes, disputing its efficiency.
3.4. Waytypes
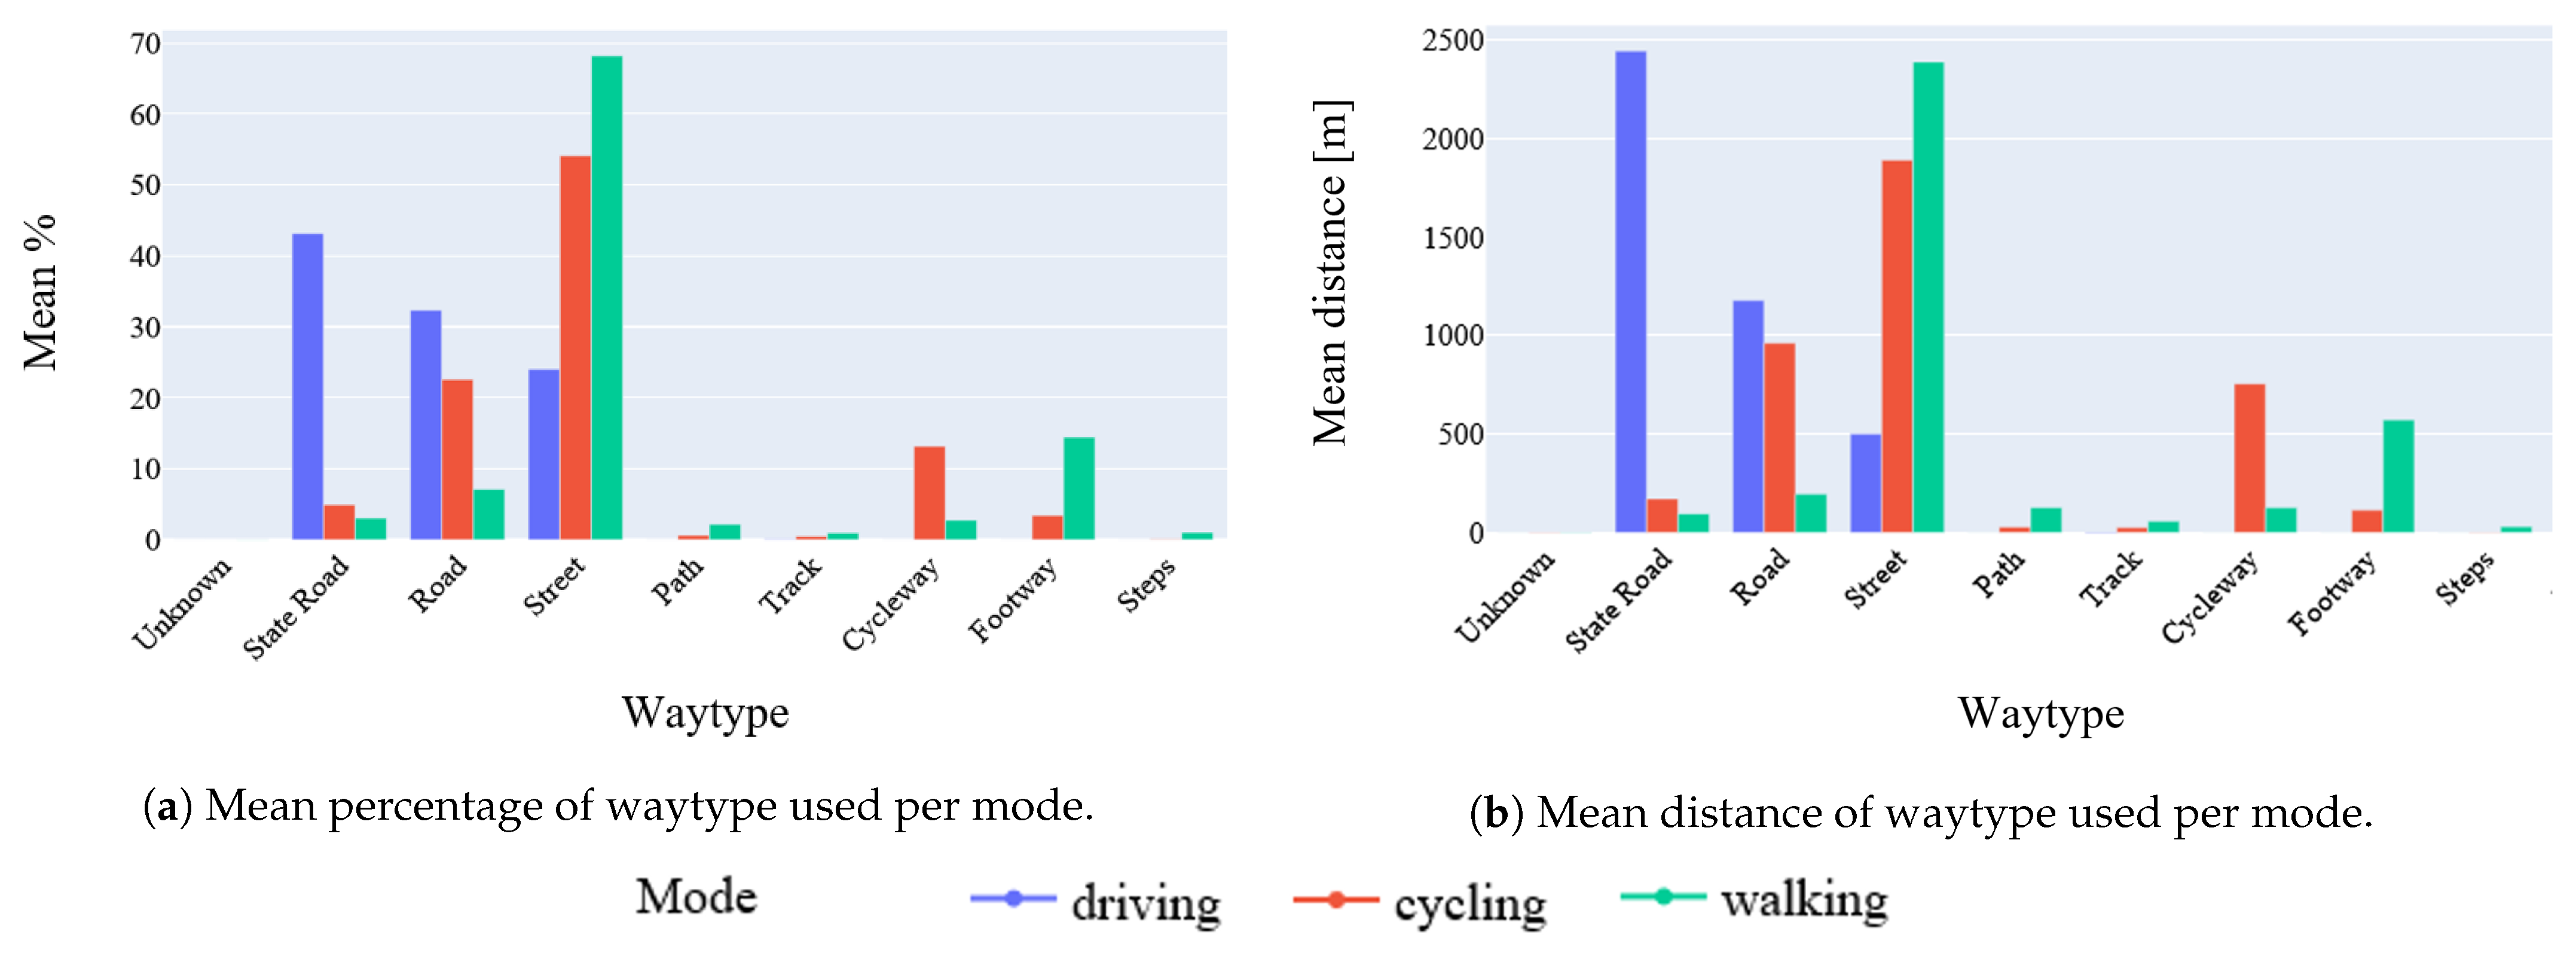
OpenRouteService classifies roads into several categories, including State Roads, Roads, Streets, Paths, Cycleways, Footways, and other less frequent types. Our subsequent analysis scrutinizes the typology of roads that each mode uses, particularly cyclists’ and pedestrians’ current infrastructure usage. From the simulated MSS routes for 2020, we can directly identify on a trip segment what road type is used. For example, one can see when a bike trip uses paths specifically designed for cycling or whether the trip shares the road carriageways (i.e., state road, road, or street).
Figure 10 indicates the average percentage and distance traveled on each road type per mode. As we can see, driving trips use the three appropriate road types: state road, road, and street. Cycling trips are routed using both roads, cycleways, and, to a minor degree, footways. On average, 13% of cycling trips use cycleways (with an average length of 755 m), while nearly 80% use road carriageways (with an average length of 3 km). Finally, walking trips use footways but mostly use the drivable network for routing (i.e., streets), which is due to the coding of the pedestrian networks that are almost nonexistent for many cities; for instance, pedestrian route planners (such as Google Maps) often resort to streets centerlines. Taking a closer look at cycling trips,
Figure 11 shows the distribution of trips per percentage of cycleway usage. As expected, all driving trips use no cycleways. Remarkably, approximately 55% of cycling trips use none to low (<1%) cycleways and only around 0.5% of trips use cycleways for the vast majority of their trip (>80%). This questions the cycling network’s efficiency because most cycling trips do not ride on existing dedicated cycling infrastructure.
These results are in line with other works, which also show that cycling trips are mostly performed in conjunction with road and cycleways. For example, Rupi and Schweizer [
33] found that 26% of the cycling trips in Bologna are conducted in cycle lanes, and Hood et al. [
34] estimate that 28% of trips in San Francisco was made in cycle lanes. These numbers contrast with our case, exhibiting a much lower average proportion of the trip being made in cycle lanes, which possibly indicates that the current dedicated cycling network is still insufficient.
3.5. Circuity Inequality
Finally, we look at the Gini coefficient of Lisbon’s parishes. Gini coefficient [
35] can be used to measure the inequality of a given frequency distribution. While it is typically applied to identify income or wealth inequalities, it also identifies other types of inequalities. Here, we employ the Gini coefficient to see how disparate circuity is across our case study’s three modes. Results close to zero indicate an equal distribution, while values similar to 1 indicate a highly unequal distribution. Our results indicate a Gini coefficient of 0.278 for driving, 0.223 for cycling, and 0.120 for walking trips, suggesting that circuity for walking is more equitable over the city than cycling and driving, in which circuity levels are more uneven across the city.
Figure 12 further shows Gini indexes across Lisbon’s parishes.
Figure 13 represents the MSS distribution of cycling circuity values for 2020. About 84% of trips’ circuity is below 2, 50% below 1.5, and only around 1% is below 1.1. Thus, in 50% of bike trips, cyclists have to cycle 50% more than a direct route, and only a marginal number of trips are somewhat direct (i.e., circuity close to 1). These results highlight that equality across circuity is very distinct between Lisbon’s parishes for both cycling and driving. Walking appears to be more equal across Lisbon. This inequality analysis can be used to identify city areas that have low accessibility for a certain mode when compared to other areas in the city.
4. Discussion
Circuity serves as a metric to measure trip routes’ attractiveness and is suited to analyze and compare cities and city regions. Our research uses circuity to compare two circuity computation approaches to analyze Lisbon and its regions. Our results show that circuity is decreasing, especially for cycling and walking, consistent with changes that occurred in Lisbon during the analyzed period. We highlight that circuity can have very different results using two distinct computation approaches. For one, circuity analyzed for a demand-isotropic network of the city is recognizably different from the network’s circuity used by existing demand (i.e., anisotropic). Thus, when using circuity as a measure of planning, the definition of the objective must be clear: either to improve the city as a whole by searching unraveled potential to satisfy demand or to prioritize the network used de facto.
Lisbon’s parishes showed different circuity trends. Some parishes had similar circuity patterns for driving, cycling, and walking, while others varied substantially among modes. As a whole, our results support Cubukcu [
6]’s and Yen et al. [
19]’s ideas that circuity must be analyzed at lower scales rather than at the city scale. Different areas of the city generated considerably different results. Categorizing trips into different lengths also enabled a more refined analysis. We noticed that as trip distance increases, circuity tends to decrease. Furthermore, comparing the two sampling approaches yields key differences on the simulated trips when split in trip distances. RS yields more medium-length distances (approximately 76% of all trips between 2 and 8 km) than the demand-driven MSS (where 2–8 km trips represent about 48% of all trips). This means that analyzing the average circuity of all trips versus categorized distance trips could misrepresent the actual circuity of trips and the analysis of urban networks. However, the MSS approach analyzes the origin–destination demand of citizens over the urban network, and while the simulated routes may not correspond to the true routes chosen by citizens, it allows for a general analysis of the topology of urban networks. Such analysis can be used to quickly analyze the impact of different possible interventions on the urban space. For trips from 2 to 8 km (which include the average trip distance in Lisbon [
26]), we noticed that driving circuity is, in some cases, lower than cycling and walking circuities. Thus, being the favorite mode by Lisbonians, private cars can be seen as the most attractive when it comes to distance traveled. If the municipality’s current goal is to promote more sustainable modes by replacing private motorized modes [
36], then a clear emphasis must be placed on increasing such sustainable modes’ attractiveness.
Looking at how circuity evolved over the years for Lisbon’s parishes, we also note interesting evidence of how circuity has changed for cycling trips. As shown, cycling circuity has changed considerably alongside many improvements and Lisbon’s cycling network extension. Notably, we highlight how circuity has changed for cycling trips and the impact that such infrastructure has had on individuals’ trips. However, in some cases, such infrastructures’ construction shows no apparent impact on circuity levels, suggesting that they are either not attractive in terms of distance traveled or that they are not appropriate for the trip. Another interesting fact relates to the length of existing cycle lanes, and their usage for trips inside the same parish. For example, cycling trips inside Avenidas Novas are 16.31% made in cycle lanes, with 16.65 km of existing cycles lane in Avenidas Novas. In Beato, which has only 1.26 km of cycle lanes, 23.72% of bicycle trips use cycle lanes. We hypothesize that Av. Novas’ infrastructure is pervasive and is the backbone of Lisbon’s cycling network, while it is not used for intra-parish trips, serving more to connect to other parts of the city. Meanwhile, in Beato’s case, the small yet meaningful infrastructure is vital for accommodating cycling local (intra-parish) trips. Such inspection allows for a more generalized analysis of any cities street networks to understand what infrastructures are being used, and by which user.
Looking at Lisbon’s circuity inequalities, we notice that circuity is more uneven for driving than cycling, and cycling is more uneven than walking. These results suggest that while walking circuity is more or less equal throughout the city, cycling, and driving circuities seem to vary significantly across Lisbon. Such results suggest that a more detailed analysis can be made to locate inequalities. Such understanding can better pinpoint any city’s location where changes ought to be made such that these spots do not suffer from being less accessible by a particular transport mode.
Finally, by analyzing road type allocation to trip routes, we can identify some other intriguing facts. Over half (55%) of the cycling trips use no cycling infrastructure, which is a crucial takeaway, since cycling uptake is dependent on adequate infrastructures [
31]. Lisbon’s municipality has shown serious commitment and effort in creating and expanding its cycling network, yet it seems that this network is still far from providing all citizens with a safe and comfortable environment to cycle through. Another significant upshot was the number of footways used when walking. Only 18.22% of walking trips are made on walkways, equating to an average of 571 m, while the vast majority of walking uses streets (66.82%), which include residential streets or living streets. In Lisbon, almost all urban streets have sidewalks on one or both sides of the road. A finer analysis of OpenStreetMaps evidenced that only a small fraction of Lisbon’s streets contain information regarding sidewalks’ existence. Although assumptions can be made that pedestrians use sidewalks of the streets, they were not routed through footways, which implies a lack of information on Lisbon’s existing walking network.
This study presented a methodology capable of efficiently computing and comparing circuity values for different transportation modes and different scale levels. Nevertheless, while on the one hand, it is based on open and volunteered geographic data, on the other hand, it is vastly based on the quality of such data. Our analysis of the data and results achieved highlight this. For example, walking trips would not use walkways, which points out the lack and quality of pedestrian infrastructure data. In Lisbon, the vast majority of streets have sidewalks, and the impact of such defective representation of the pedestrian network is not relevant. However, it may not be the case for other cities where similar analyses are made.
Additionally, one of our sampling techniques is based on origin-destination points that were collected in 2017. However, these OD pairs may change over time, depending on attracting or deterring factors, locations, and purposes of trips. IMob [
26] is the only survey in Lisbon that captured such mobility patterns and trends. Arguments may question the validity of such use of points over time, yet our goal was to assess the evolution and transformation of circuity over time, which was impossible without using such data in a more general timeframe.
Finally, we simulate trips based on the preferred route and not for the shortest distance trip. This choice in modeling reflects trips that people tend to make and may not always correspond to the shortest possible path. Calculating and comparing circuities over the shortest trips may have different results, possibly underscoring even more disparate results, leading to bigger differences per mode and distance traveled.
5. Conclusions
Circuity serves as a metric to measure the attractiveness of trip routes. It can be used to analyze and compare regions, cities, or even city districts. In this work, we use circuity to compare driving, cycling, and walking trips in Lisbon from 2013 to 2020. We use data from OpenStreetMaps and present a methodology that can be easily reproducible in other cities to simulate routes using different transport modes. We test two strategies to simulate routes and conclude that RS is appropriate to analyze the whole urban street network, considering a demand-isotropic network, while MSS should be used when there is a need to understand the network that citizens use.
Our results note that circuity decreases over time and identify many cases where this decrease is consistent with Lisbon’s synchronous infrastructure changes. We compare Lisbon’s parishes and identify several differences between them: how much inequality there is between the three sampled modes, how circuity changes for different trips’ distances, and what road types are used for each model. Using our analysis, we can identify significant differences between driving, cycling, and walking. We postulate that this analysis can then target planning opportunities or identify locations that need changes. Thus, circuity serves as a valuable objective metric to compare modes and networks.
For future work, we identify avenues that ought to require more investigation. First, a particular emphasis has been put on the analysis of Lisbon’s cycling circuity. Lisbon, a cycling starter city, should be compared to other cities whose focus and modal share are distinct, such as Copenhagen or Amsterdam, to see whether significant differences can be found between the two cities’ typologies. This study can be used to create a benchmark of circuity, possibly identifying good and bad examples of circuity values and identify feasible circuity levels that can be achieved. Second, an optimization tool could be developed to identify which streets’ infrastructures could change to achieve specific circuity and accessibility goals. While such a tool can improve circuity for a given mode, the impair or harm circuity for other modes may also lead to behavior changes and mode choices. Finally, public transportation and multimodal trips should also be considered.
Although this work only focused on three transport modes, public transportation should serve as a backbone to any city seeking sustainable mobility, and a circuity analysis should consider this. Additionally, trips using multiple modes should also be analyzed, as this mode choice is also significant and often the solution for better accessibility and mobility.


