
Understanding the Drivers of Mobility during the COVID-19 Pandemic in Florida, USA Using a Machine Learning Approach


Abstract
:1. Introduction
2. Related Work
3. Materials and Methods
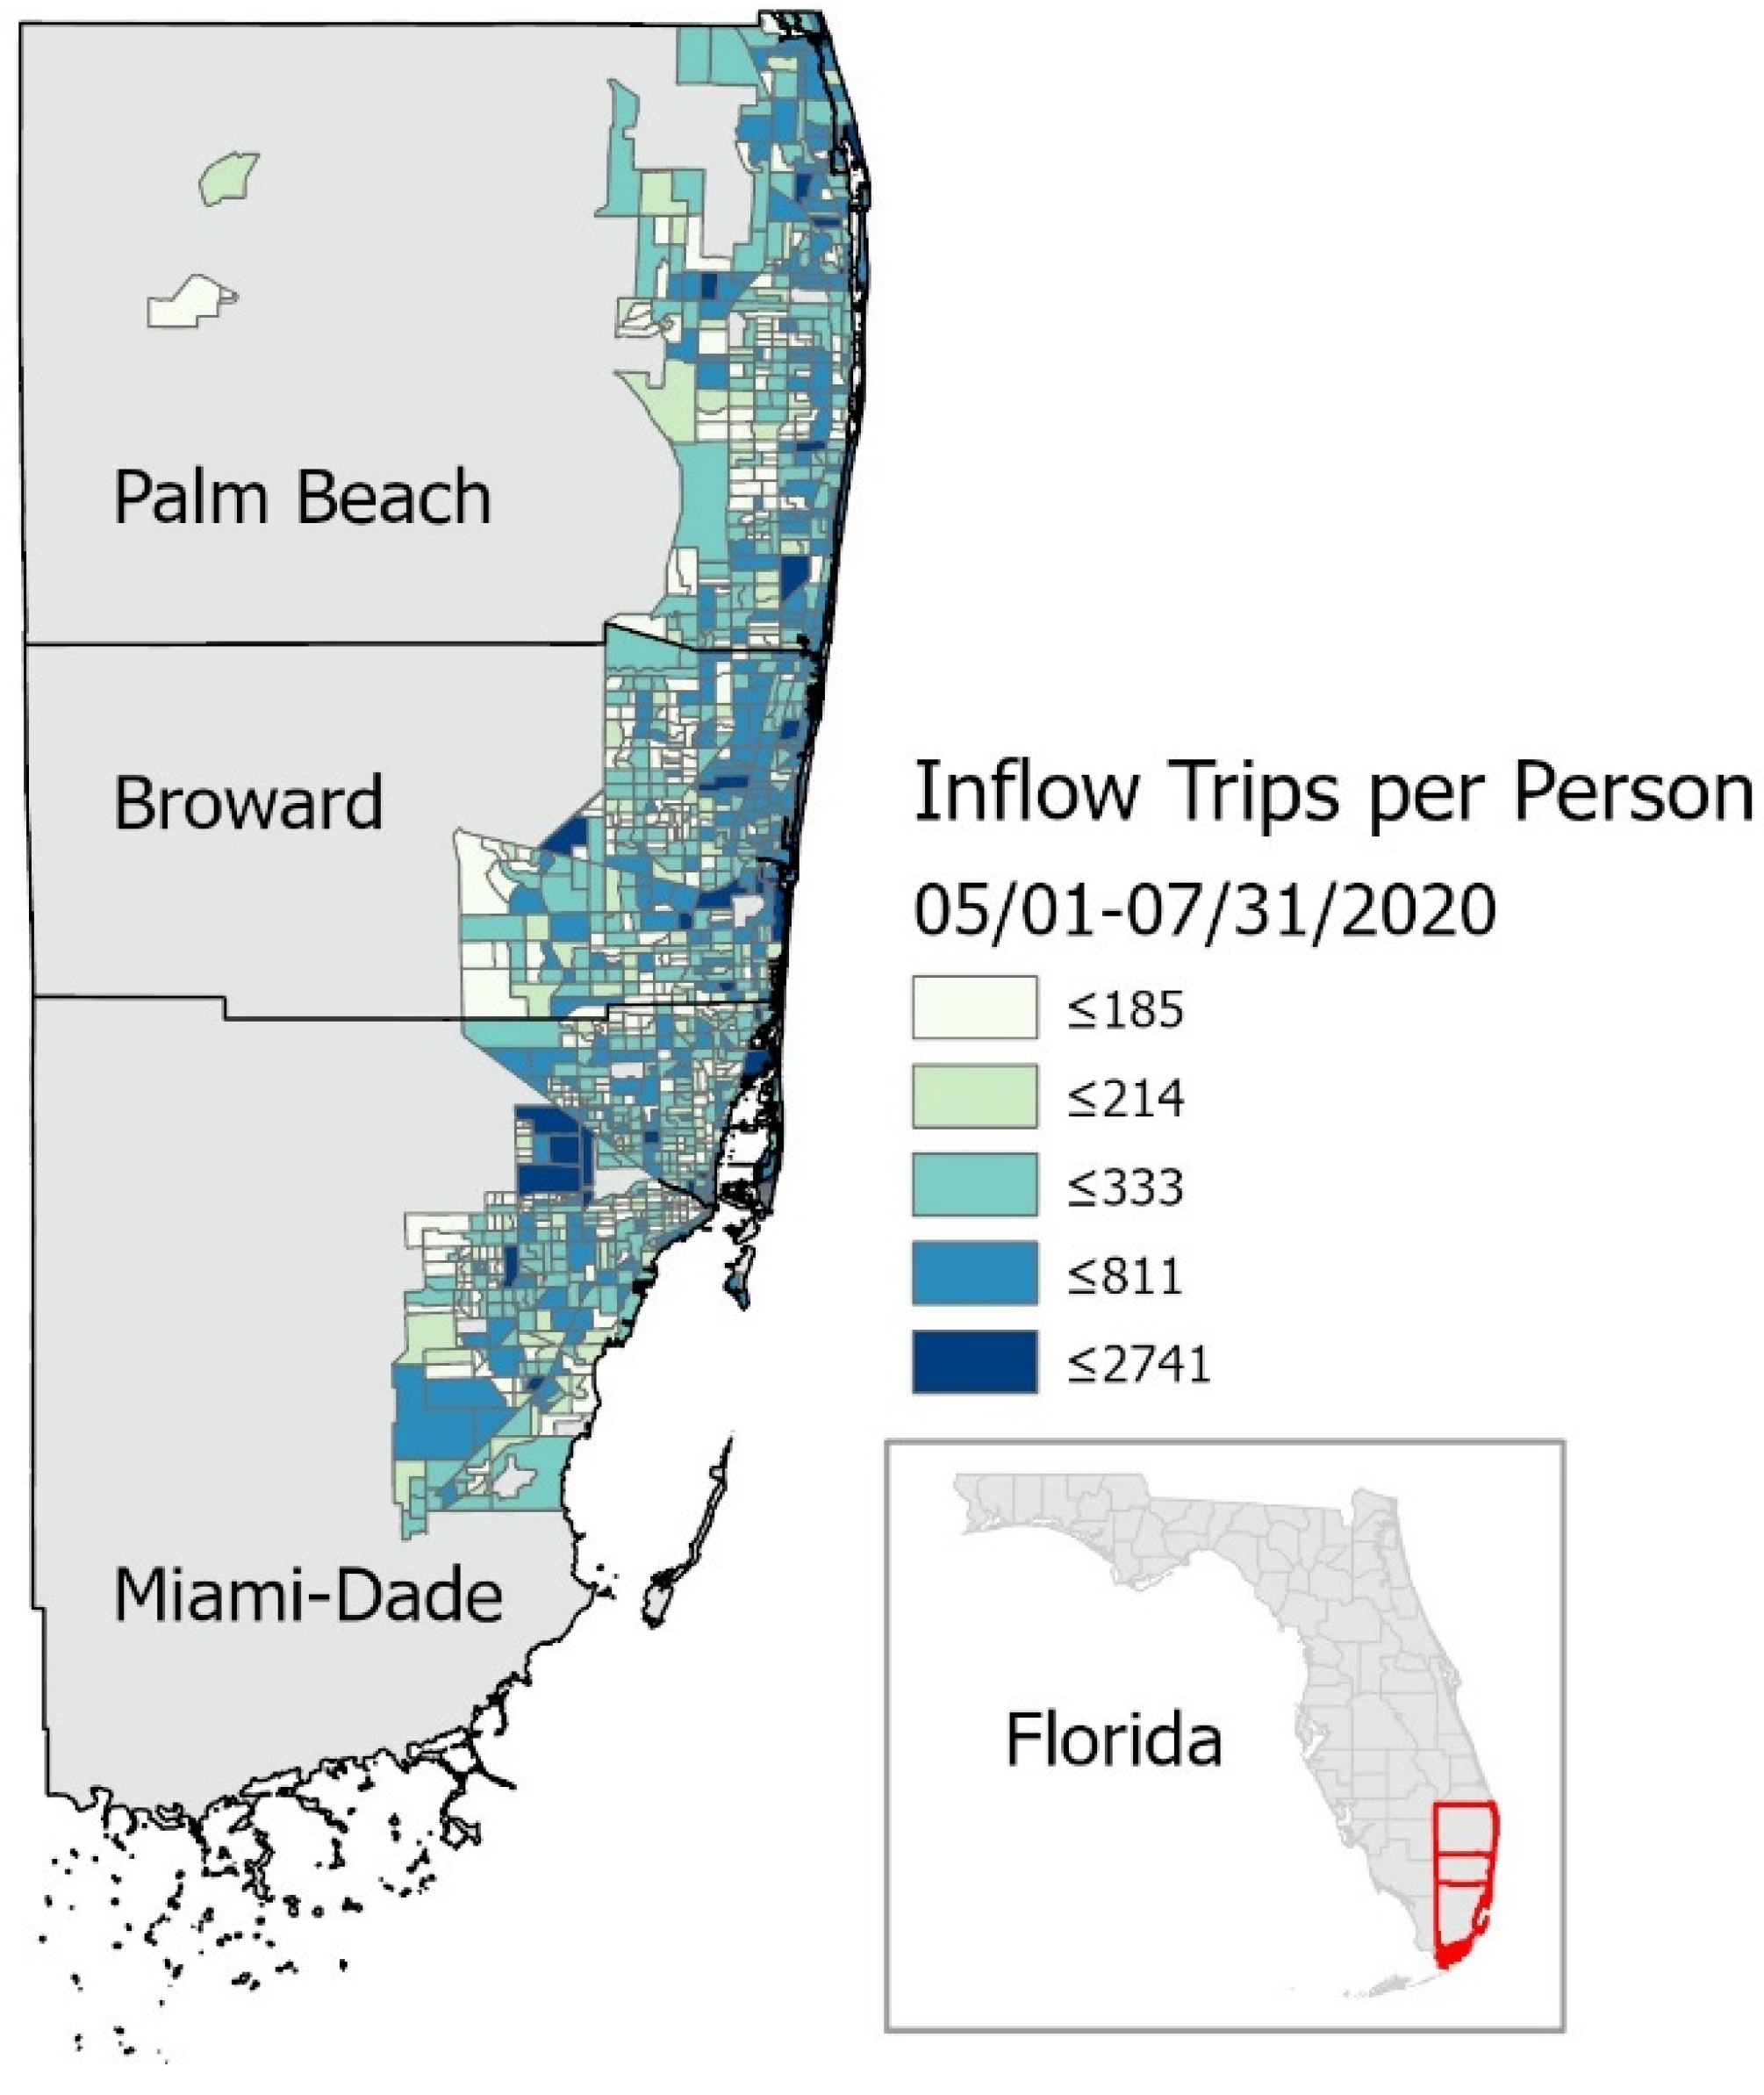
3.1. Data and Study Area
3.2. Random Forest Model
4. Results
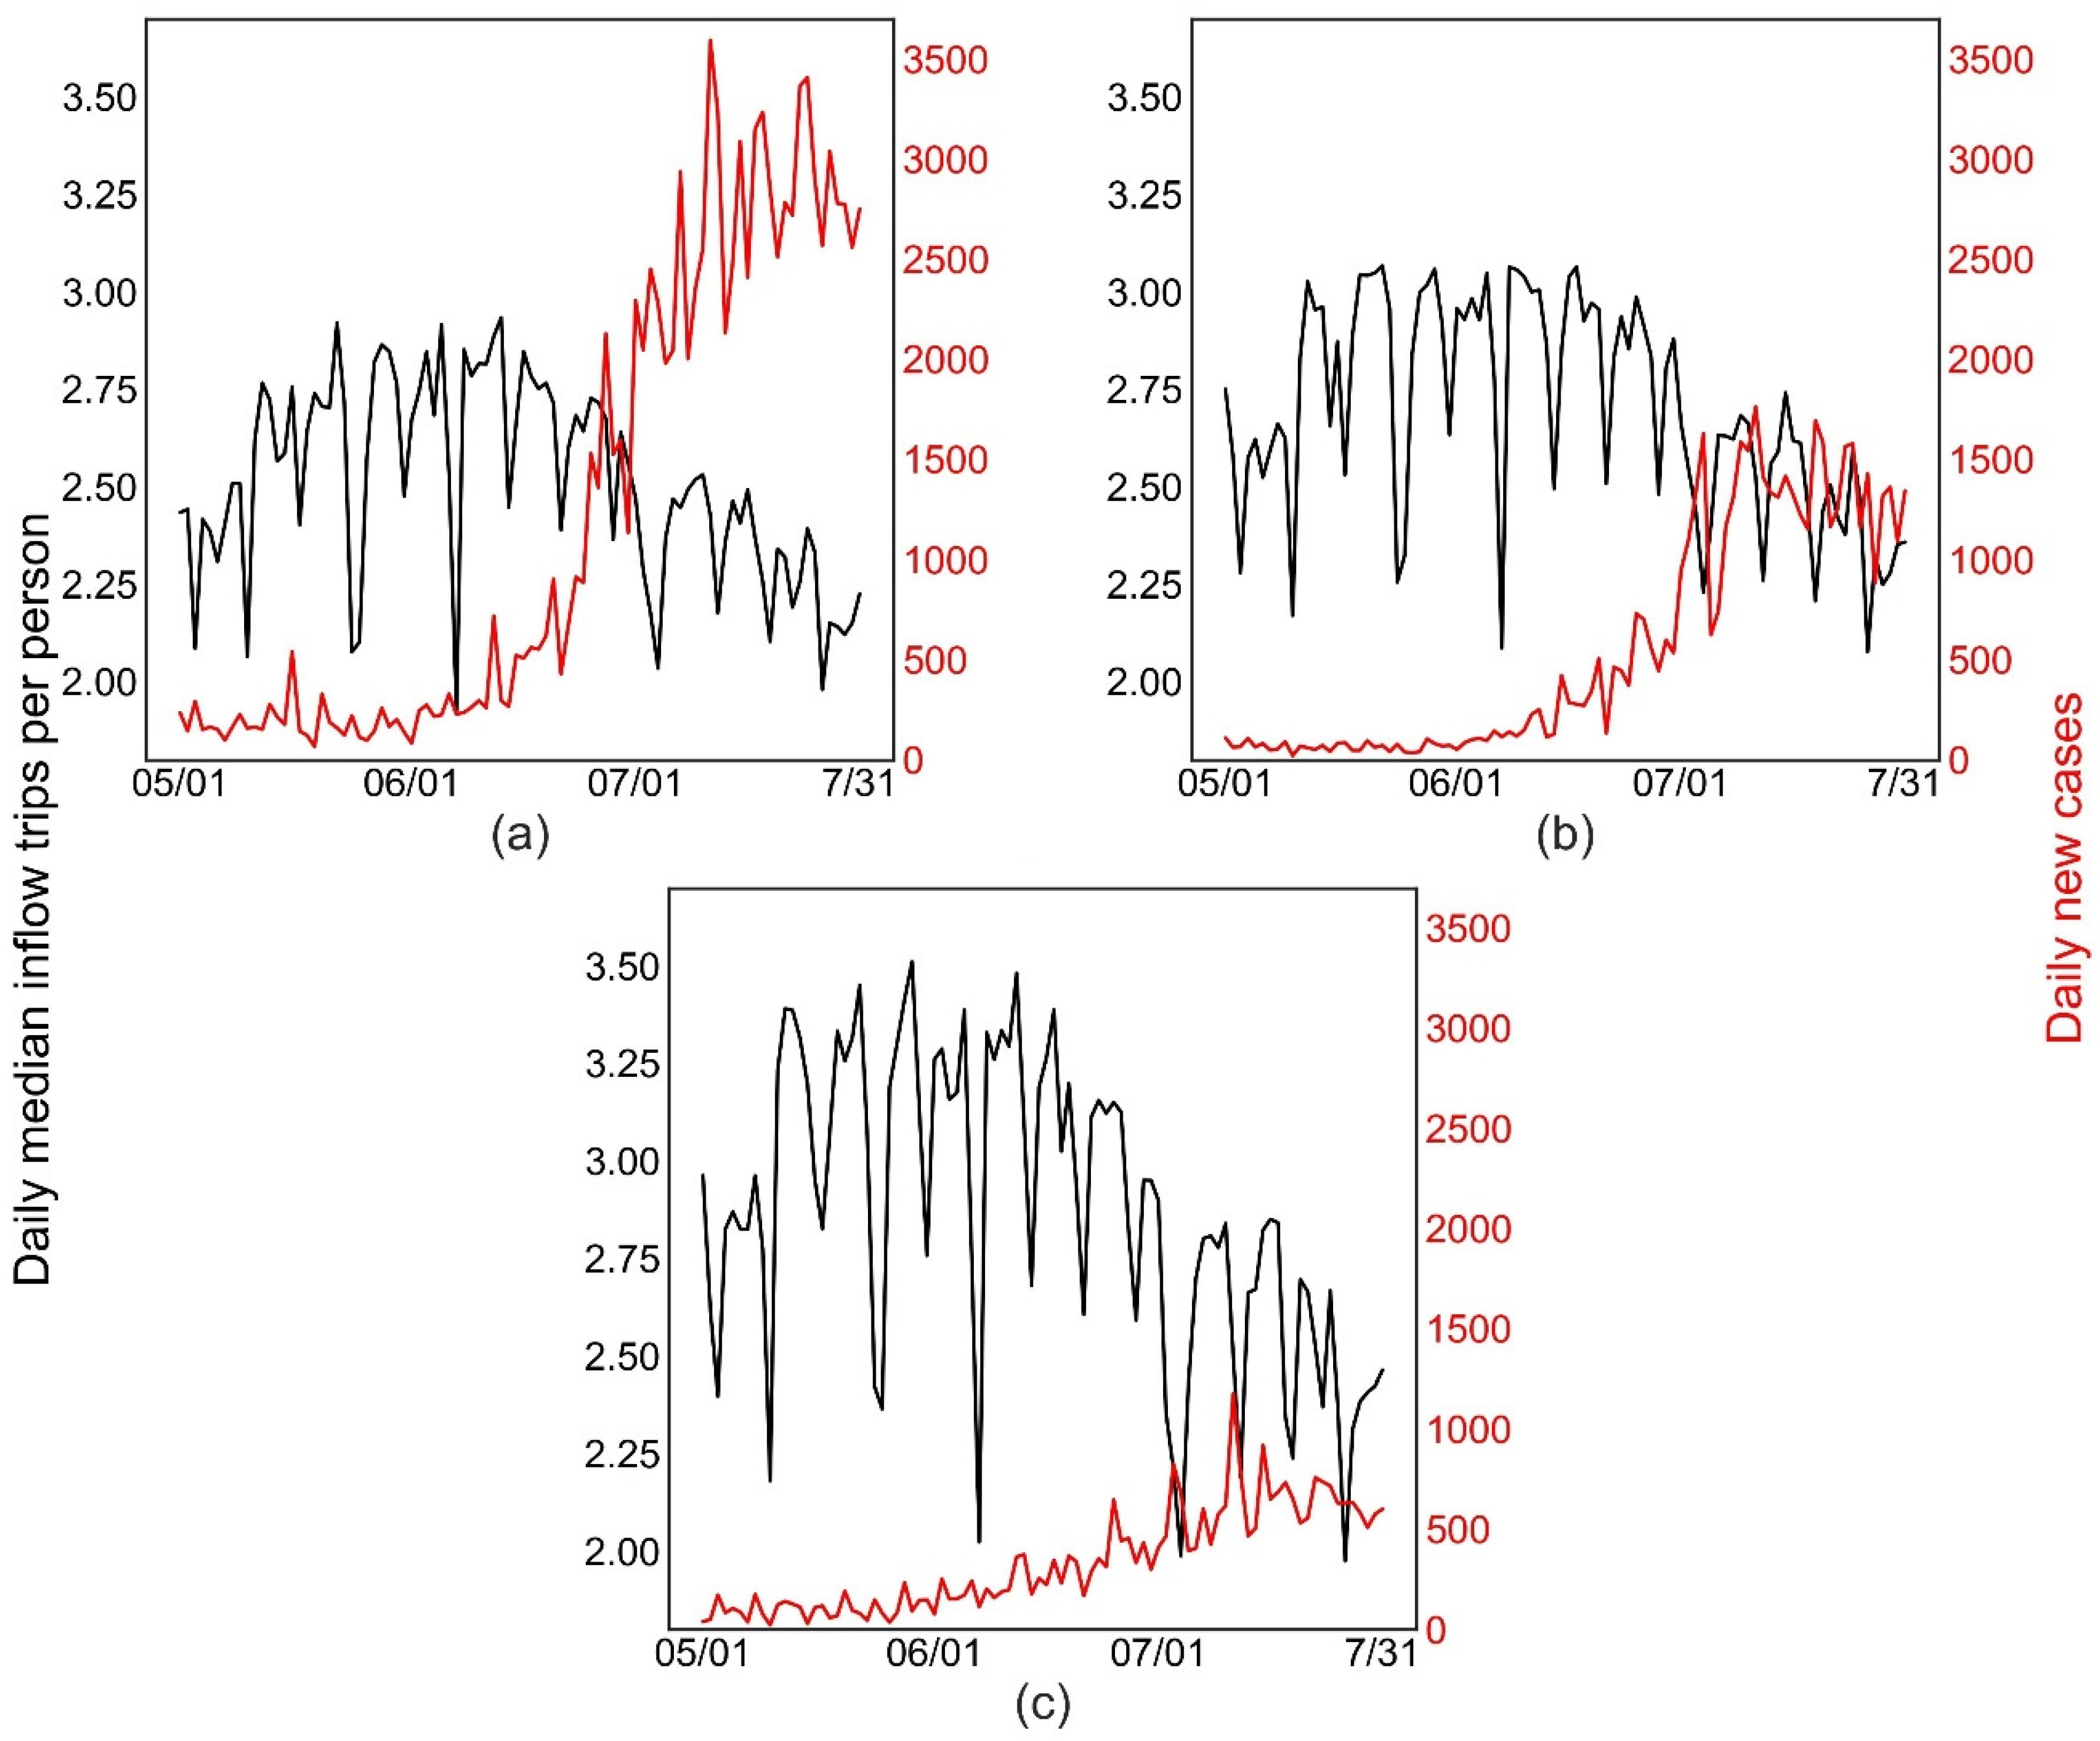
4.1. Mobility Patterns and Related Sociodemographic Factors in the Three Counties
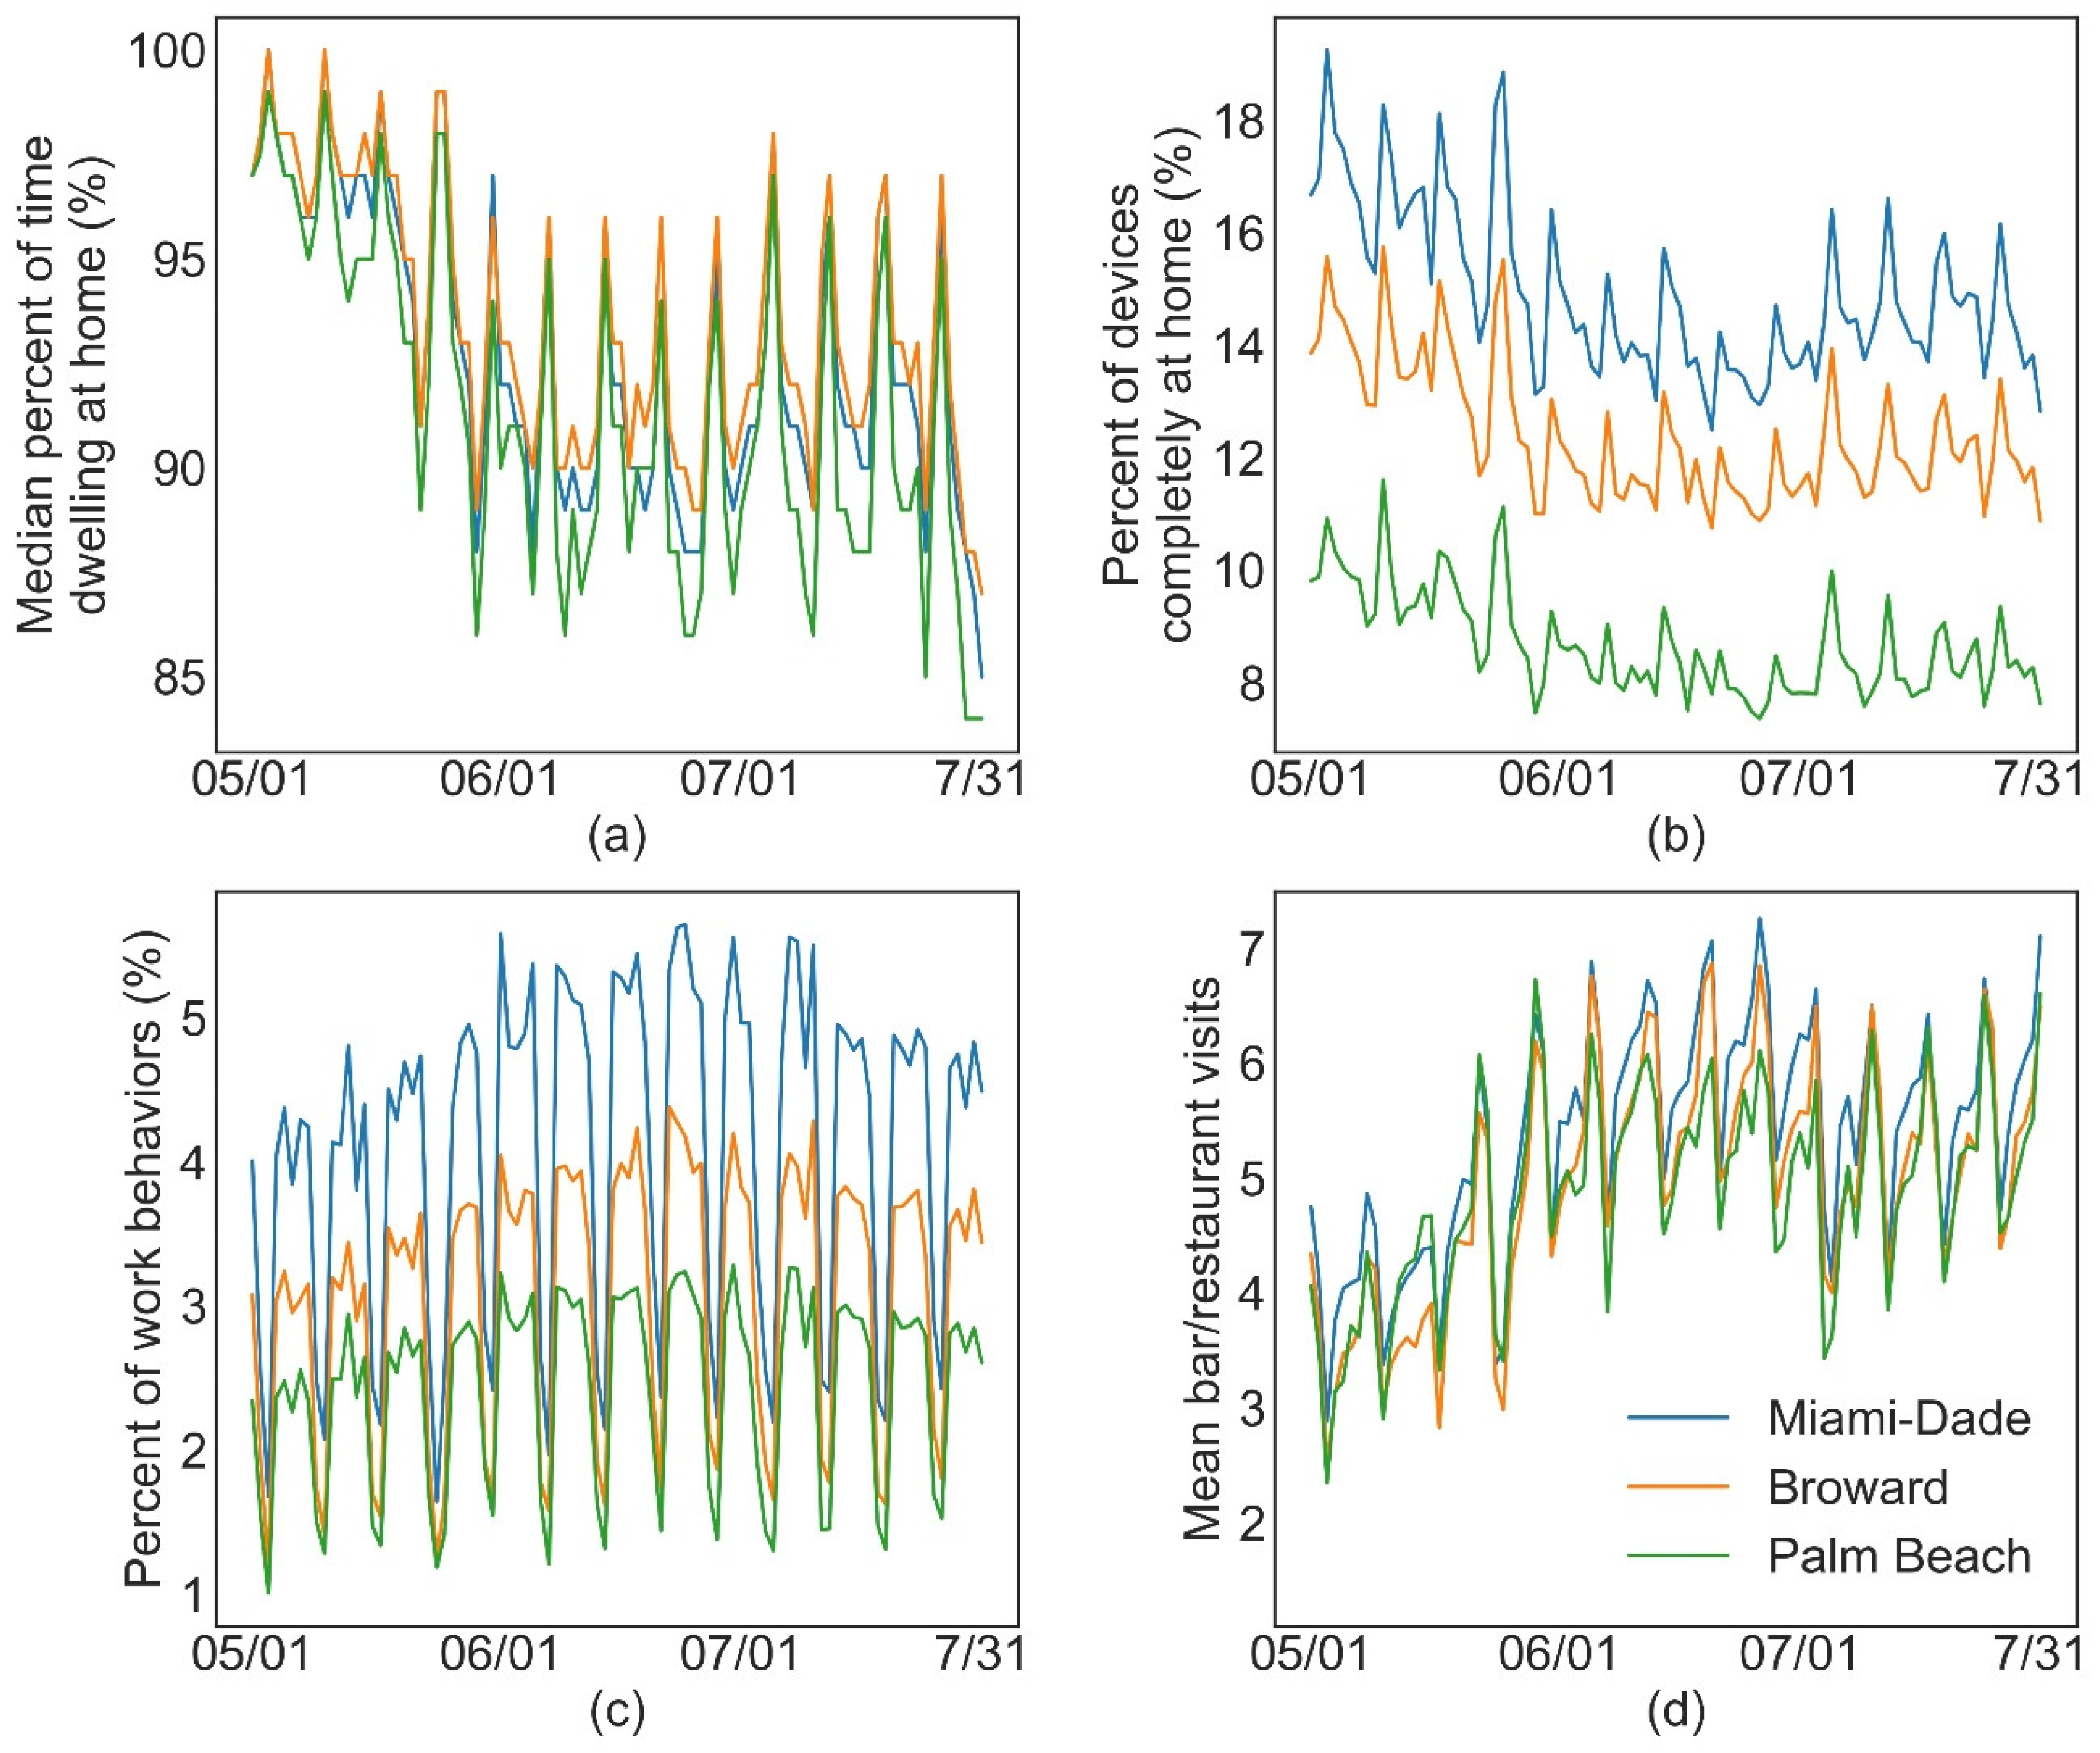
4.2. Mobility Patterns and Travel-Related Behaviors
4.3. Random Forest Models
4.3.1. Model Performance
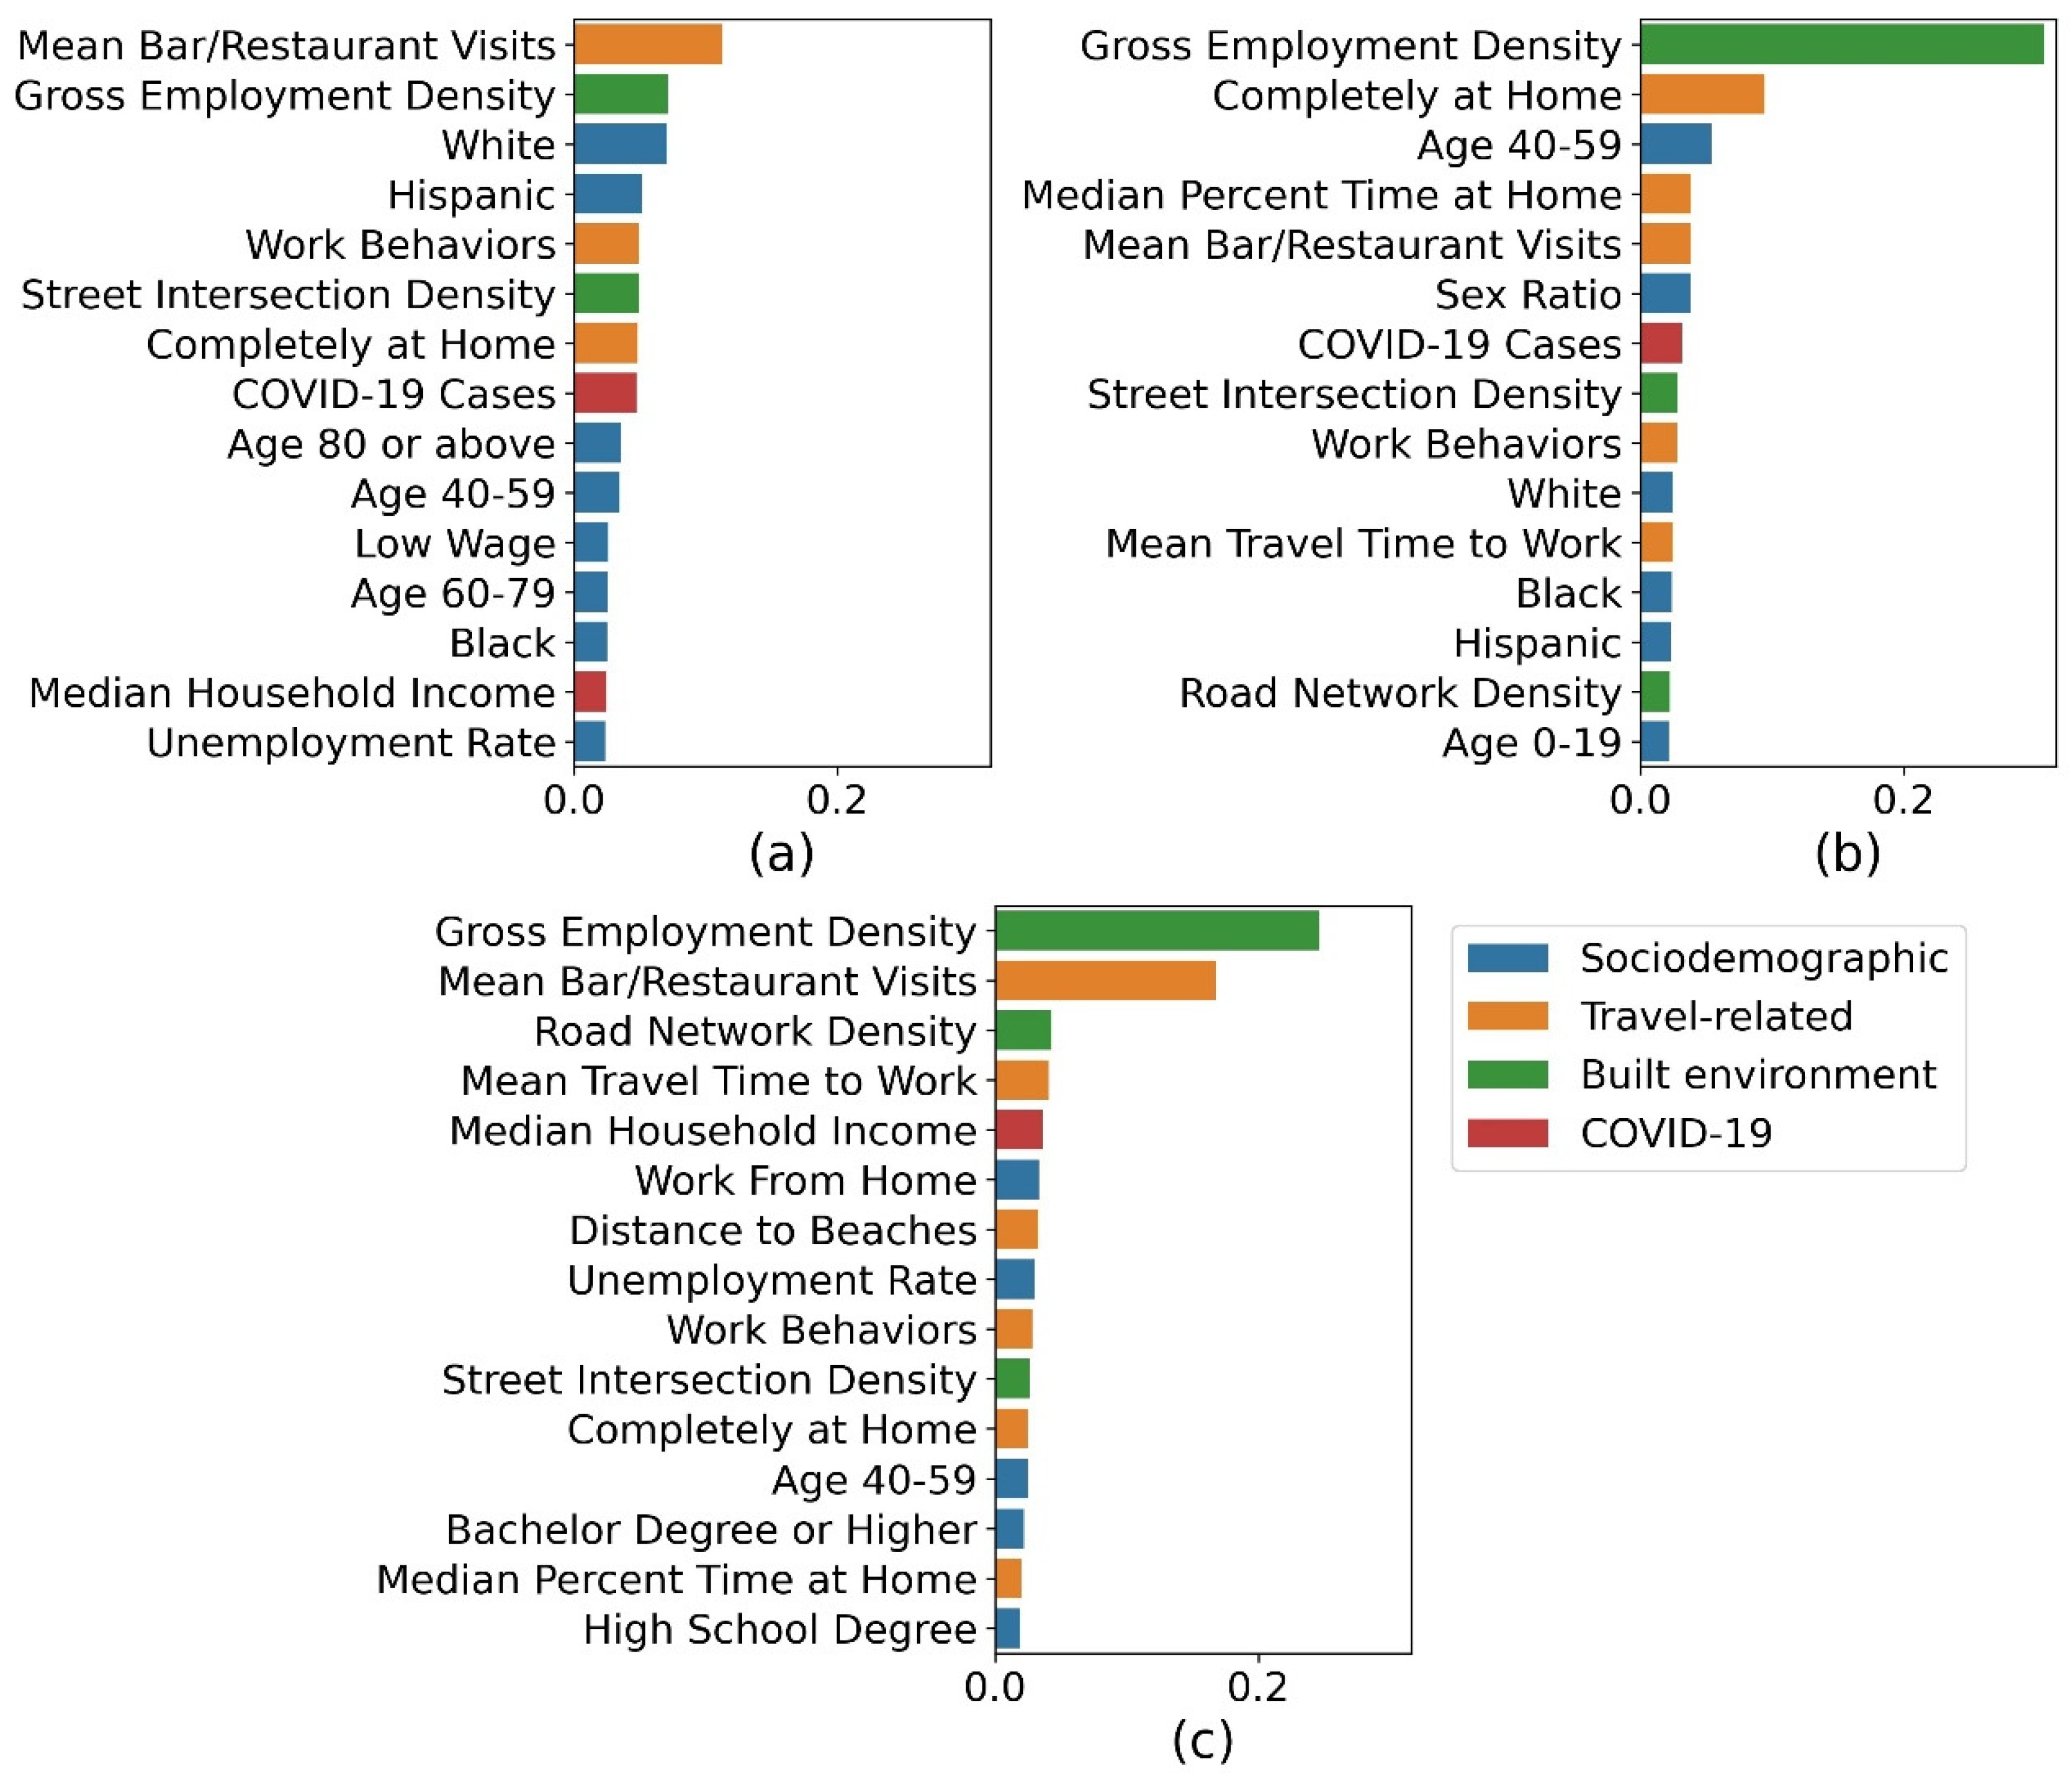
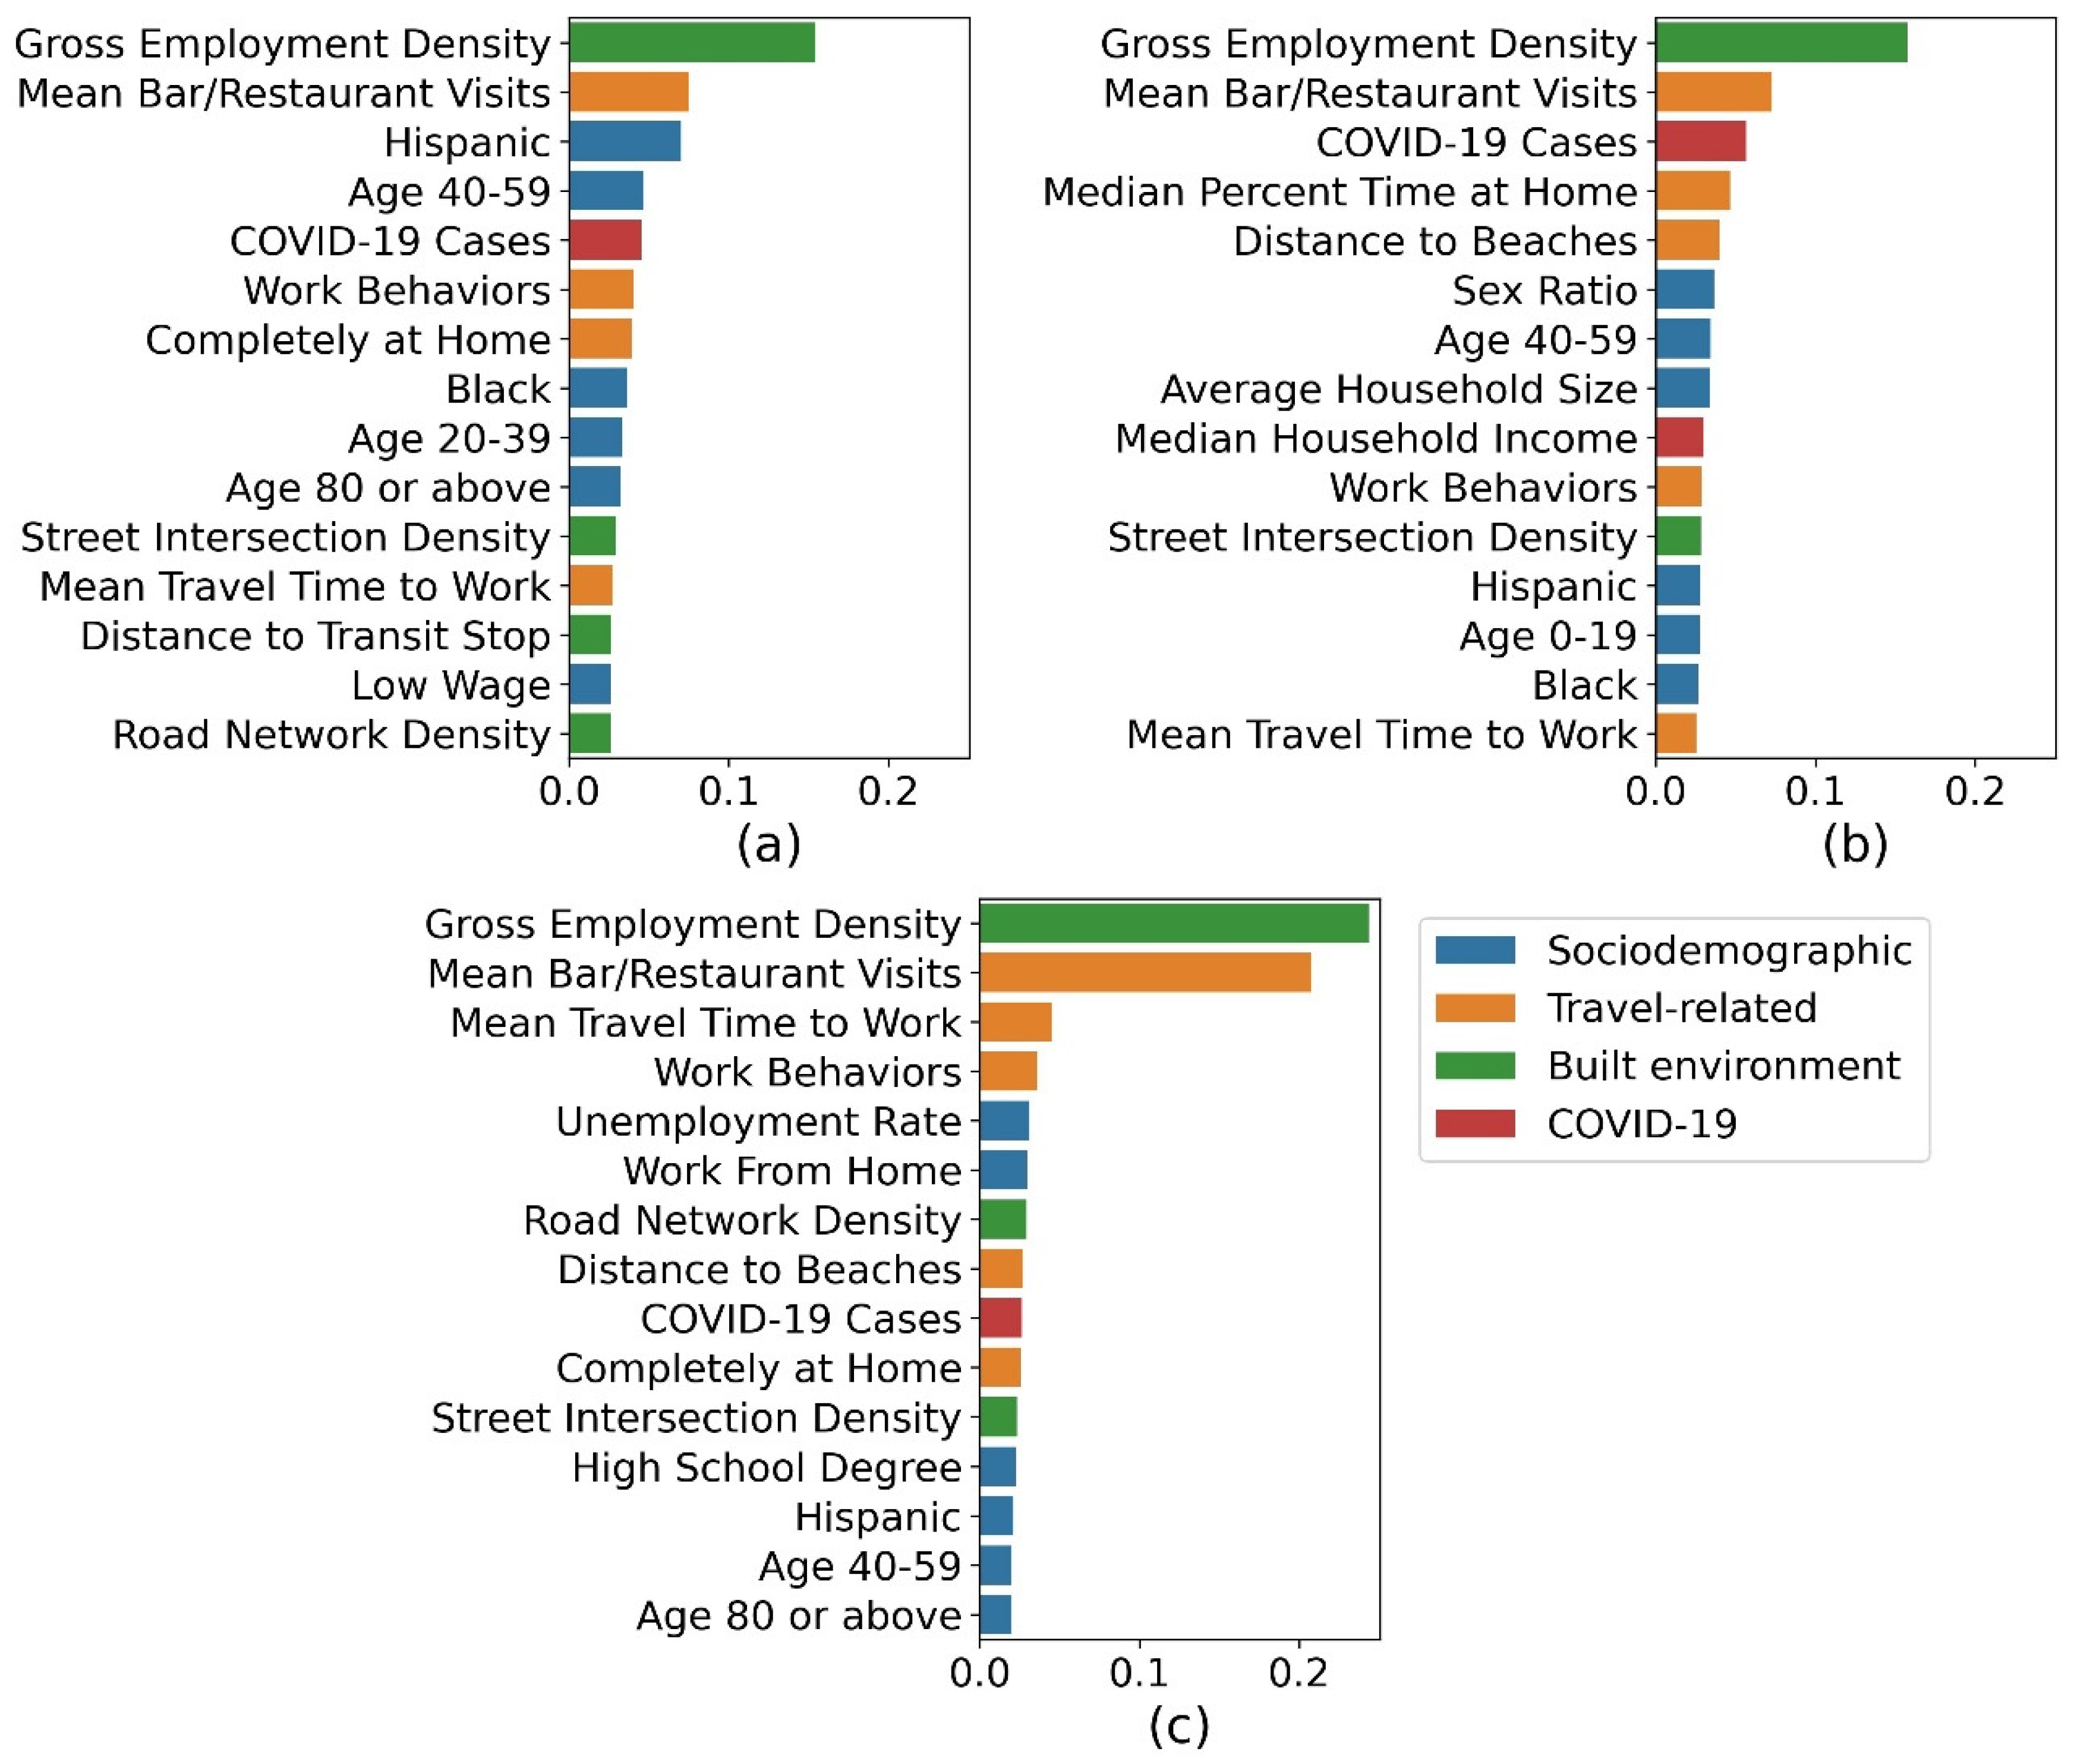
4.3.2. Feature Contributions for the Period Prior to the Rise in COVID-19 Cases
4.3.3. Feature Contributions for the Period Following the Rise in COVID-19 Cases
5. Discussion
6. Conclusions
Author Contributions
Funding
Conflicts of Interest
References
- Centers for Disease Control and Prevention CDC COVID Data Tracker. Available online: https://covid.cdc.gov/covid-data-tracker/#datatracker-home (accessed on 30 March 2021).
- Kraemer, M.U.G.; Yang, C.-H.; Gutierrez, B.; Wu, C.-H.; Klein, B.; Pigott, D.M.; du Plessis, L.; Faria, N.R.; Li, R.; Hanage, W.P.; et al. The effect of human mobility and control measures on the COVID-19 epidemic in China. Science 2020, 368, 493–497. [Google Scholar] [CrossRef] [Green Version]
- Nouvellet, P.; Bhatia, S.; Cori, A.; Ainslie, K.E.C.; Baguelin, M.; Bhatt, S.; Boonyasiri, A.; Brazeau, N.F.; Cattarino, L.; Cooper, L.V.; et al. Reduction in mobility and COVID-19 transmission. Nat. Commun. 2021, 12, 1–9. [Google Scholar] [CrossRef]
- Xiong, C.; Hu, S.; Yang, M.; Luo, W.; Zhang, L. Mobile device data reveal the dynamics in a positive relationship between human mobility and COVID-19 infections. Proc. Natl. Acad. Sci. USA 2020, 117, 27087–27089. [Google Scholar] [CrossRef] [PubMed]
- Kishore, N.; Kiang, M.; Engø-Monsen, K.; Vembar, N.; Balsari, S.; Buckee, C. Mobile phone data analysis guidelines: Applications to monitoring physical distancing and modeling COVID-19. OSF Prepr. 2020. [Google Scholar] [CrossRef]
- Gao, S.; Rao, J.; Kang, Y.; Liang, Y.; Kruse, J.; Dopfer, D.; Sethi, A.K.; Mandujano Reyes, J.F.; Yandell, B.S.; Patz, J.A. Association of Mobile Phone Location Data Indications of Travel and Stay-at-Home Mandates With COVID-19 Infection Rates in the US. JAMA Netw. Open 2020, 3, e2020485. [Google Scholar] [CrossRef]
- Mangrum, D.; Niekamp, P. College Student Contribution to Local COVID-19 Spread: Evidence from University Spring Break Timing. SSRN Electron. J. 2020. [Google Scholar] [CrossRef]
- Florida Department of Health Florida’s COVID-19 Data and Surveillance Dashboard. Available online: https://experience.arcgis.com/experience/96dd742462124fa0b38ddedb9b25e429 (accessed on 30 March 2021).
- Breiman, L. Random Forests. Mach. Learn. 2001, 45, 5–32. [Google Scholar] [CrossRef] [Green Version]
- Liaw, A.; Wiener, M. Classification and Regression by randomForest. R News 2002, 2, 18–22. [Google Scholar]
- Rasouli, S.; Timmermans, H.J.P. Using ensembles of decision trees to predict transport mode choice decisions: Effects on predictive success and uncertainty estimates. In Proceedings of the 17th International Conference of Hong Kong Society for Transportation Studies, HKSTS 2012: Transportation and Logistics Management, Hong Kong, China, 15–17 December 2012; Volume 14, pp. 515–522. [Google Scholar]
- Ghasri, M.; Hossein Rashidi, T.; Waller, S.T. Developing a disaggregate travel demand system of models using data mining techniques. Transp. Res. Part. A Policy Pract. 2017, 105, 138–153. [Google Scholar] [CrossRef]
- Santos, F.; Graw, V.; Bonilla, S. A Geographically Weighted Random Forest Approach for Evaluate Forest Change Drivers in the Northern Ecuadorian Amazon. PLoS ONE 2019, 14, e0226224. [Google Scholar] [CrossRef]
- Jahangiri, A.; Rakha, H.A. Transportation Mode Recognition Using Mobile Phone Sensor Data. IEEE Trans. Intell. Transp. Syst. 2015, 16, 2406–2417. [Google Scholar] [CrossRef]
- Hao, J.; Ho, T.K. Machine Learning Made Easy: A Review of Scikit-learn Package in Python Programming Language. J. Educ. Behav. Stat. 2019, 44, 348–361. [Google Scholar] [CrossRef]
- Chen, C.; Liaw, A.; Breiman, L. Using Random Forest to Learn Imbalanced Data. Discovery 2004, 666, 1–12. [Google Scholar]
- Rodriguez-Galiano, V.; Sanchez-Castillo, M.; Chica-Olmo, M.; Chica-Rivas, M. Machine learning predictive models for mineral prospectivity: An evaluation of neural networks, random forest, regression trees and support vector machines. Ore Geol. Rev. 2015, 71, 804–818. [Google Scholar] [CrossRef]
- Nguyen, K.A.; Chen, W.; Lin, B.-S.; Seeboonruang, U. Comparison of Ensemble Machine Learning Methods for Soil Erosion Pin Measurements. Isprs Int. J. Geo-Inf. 2021, 10, 42. [Google Scholar] [CrossRef]
- Hagenauer, J.; Omrani, H.; Helbich, M. Assessing the performance of 38 machine learning models: The case of land consumption rates in Bavaria, Germany. Int. J. Geogr. Inf. Sci. 2019, 33, 1399–1419. [Google Scholar] [CrossRef] [Green Version]
- Franch-Pardo, I.; Napoletano, B.M.; Rosete-Verges, F.; Billa, L. Spatial analysis and GIS in the study of COVID-19. A review. Sci. Total Environ. 2020, 739, 140033. [Google Scholar] [CrossRef]
- Kang, Y.; Gao, S.; Liang, Y.; Li, M.; Rao, J.; Kruse, J. Multiscale dynamic human mobility flow dataset in the U.S. during the COVID-19 epidemic. Sci. Data 2020, 7, 1–13. [Google Scholar] [CrossRef]
- Gao, S.; Rao, J.; Kang, Y.; Liang, Y.; Kruse, J. Mapping county-level mobility pattern changes in the United States in response to COVID-19. arXiv 2020, arXiv:2003.14228. [Google Scholar]
- Warren, M.S.; Skillman, S.W. Mobility Changes in Response to COVID-19. arXiv 2020, arXiv:2003.14228. [Google Scholar]
- Zhang, L.; Ghader, S.; Pack, M.L.; Xiong, C.; Darzi, A.; Yang, M.; Sun, Q.Q.; Kabiri, A.A.; Hu, S. An interactive COVID-19 mobility impact and social distancing analysis platform. medRxiv 2020, 1–14. [Google Scholar] [CrossRef]
- Kreuter, F.; Barkay, N.; Bilinski, A.; Bradford, A.; Chiu, S.; Eliat, R.; Fan, J.; Galili, T.; Haimovich, D.; Kim, B.; et al. Partnering with Facebook on a university-based rapid turn-around global survey. Surv. Res. Methods 2020, 14, 159–163. [Google Scholar] [CrossRef]
- Espinoza, B.; Castillo-Chavez, C.; Perrings, C. Mobility Restrictions for the Control of Epidemics: When Do They Work? Ssrn Electron. J. 2020, 1–14. [Google Scholar] [CrossRef] [Green Version]
- Chang, M.-C.; Kahn, R.; Li, Y.-A.; Lee, C.-S.; Buckee, C.O.; Chang, H.-H. Variation in human mobility and its impact on the risk of future COVID-19 outbreaks in Taiwan. medRxiv 2020. [Google Scholar] [CrossRef] [Green Version]
- Lee, M.; Zhao, J.; Sun, Q.; Pan, Y.; Zhou, W.; Xiong, C.; Zhang, L. Human mobility trends during the early stage of the COVID-19 pandemic in the United States. PLoS ONE 2020, 15, e0241468. [Google Scholar] [CrossRef]
- Huang, X.; Lu, J.; Gao, S.; Wang, S.; Liu, Z.; Wei, H. Staying at home is a privilege: Evidence from fine-grained mobile phone location data in the U.S. during the COVID-19 pandemic. Ann. Am. Assoc. Geogr. 2021. [Google Scholar] [CrossRef]
- Rahman, M.M.; Thill, J.-C.; Paul, K.C. COVID-19 Pandemic Severity, Lockdown Regimes, and People’s Mobility: Evidence from 88 Countries. SSRN Electron. J. 2020, 1–17. [Google Scholar] [CrossRef]
- Lamb, M.R.; Kandula, S.; Shaman, J. Differential COVID-19 case positivity in New York City neighborhoods: Socioeconomic factors and mobility. Influenza Other Respir. Viruses 2021, 15, 209–217. [Google Scholar] [CrossRef] [PubMed]
- Kabiri, A.; Darzi, A.; Zhou, W.; Sun, Q.; Zhang, L. How different age groups responded to the COVID-19 pandemic in terms of mobility behaviors: A case study of the United States. arXiv 2020, arXiv:2007.10436. [Google Scholar]
- Lou, J.; Shen, X.; Niemeier, D. Are stay-at-home orders more difficult to follow for low-income groups? J. Transp. Geogr. 2020, 89, 102894. [Google Scholar] [CrossRef] [PubMed]
- Sun, Q.; Zhou, W.; Kabiri, A.; Darzi, A.; Hu, S.; Younes, H.; Zhang, L. COVID-19 and Income Profile: How People in Different Income Groups Responded to Disease Outbreak, Case Study of the United States. arXiv 2020, arXiv:2007.02160. [Google Scholar]
- Mollalo, A.; Vahedi, B.; Rivera, K.M. GIS-based spatial modeling of COVID-19 incidence rate in the continental United States. Sci. Total Environ. 2020, 728, 138884. [Google Scholar] [CrossRef]
- Mollalo, A.; Rivera, K.M.; Vahedi, B. Artificial neural network modeling of novel coronavirus (COVID-19) incidence rates across the continental United States. Int. J. Environ. Res. Public Health 2020, 17, 4204. [Google Scholar] [CrossRef]
- 2019 American Community Survey Single-Year Estimates. Available online: https://www.census.gov/newsroom/press-kits/2020/acs-1year.html (accessed on 6 May 2021).
- Florida Department of Health Florida Department of Health Open Data. Available online: https://open-fdoh.hub.arcgis.com/ (accessed on 30 March 2021).
- United States Department of Housing HUD USPS ZIP CODE CROSSWALK FILES. Available online: https://www.huduser.gov/portal/datasets/usps_crosswalk.html (accessed on 30 March 2021).
- SafeGraph SafeGraph Social Distancing Metrics. Available online: https://docs.safegraph.com/v4.0/docs/social-distancing-metrics (accessed on 30 March 2021).
- Wellenius, G.A.; Vispute, S.; Espinosa, V.; Fabrikant, A.; Tsai, T.C.; Hennessy, J.; Dai, A.; Williams, B.; Gadepalli, K.; Boulanger, A.; et al. Impacts of US State-Level Social Distancing Policies on Population Mobility and COVID-19 Case Growth during the First Wave of the Pandemic. arXiv 2020, arXiv:2004.10172. [Google Scholar]
- United States Environmental Protection Agency Smart Location Database. Available online: https://www.epa.gov/smartgrowth/smart-location-mapping (accessed on 30 March 2021).
- Lemaitre, G.; Nogueira, F.; Aridas, C.K. Imbalanced-learn: A Python Toolbox to Tackle the Curse of Imbalanced Datasets in Machine Learning. J. Mach. Learn. Res. 2015, 40, 1–5. [Google Scholar]
- Branco, P.; Ribeiro, R.P.; Torgo, L.; Krawczyk, B.; Moniz, N. SMOGN: A Pre-processing Approach for Imbalanced Regression. Proc. Mach. Learn. Res. 2017, 74, 36–50. [Google Scholar]
- Breiman, L.; Friedman, J.; Stone, C.J.; Olshen, R.A. Classification and Regression Trees; CRC Press: Boca Raton, FL, USA, 1984. [Google Scholar]
- Badr, H.S.; Du, H.; Marshall, M.; Dong, E.; Squire, M.M.; Gardner, L.M. Association between mobility patterns and COVID-19 transmission in the USA: A mathematical modelling study. Lancet Infect. Dis. 2020, 20, 1247–1254. [Google Scholar] [CrossRef]
- Baud, D.; Qi, X.; Nielsen-Saines, K.; Musso, D.; Pomar, L.; Favre, G. Real estimates of mortality following COVID-19 infection. Lancet Infect. Dis. 2020, 20, 773. [Google Scholar] [CrossRef] [Green Version]
- Ji, Y.; Ma, Z.; Peppelenbosch, M.P.; Pan, Q. Potential association between COVID-19 mortality and health-care resource availability. Lancet Glob. Health 2020, 8, e480. [Google Scholar] [CrossRef] [Green Version]


| Miami-Dade | Broward | Palm Beach | ||||
|---|---|---|---|---|---|---|
| # of Census Tracts | 519 | 362 | 338 | |||
| Total population | 2,699,428 | 1,926,205 | 1,465,027 | |||
| Race and ethnicity | ||||||
| Black | 469,202 | 17.38% | 551,097 | 28.61% | 273,384 | 18.66% |
| White | 2,028,500 | 75.15% | 1,170,083 | 60.75% | 1,077,422 | 73.54% |
| Non-Hispanic | 850,503 | 31.51% | 1,351,916 | 70.19% | 1,137,087 | 77.62% |
| Black Non-Hispanic | 426,336 | 15.79% | 530,990 | 27.57% | 266,676 | 18.20% |
| White Non-Hispanic | 356,026 | 13.19% | 698,805 | 36.28% | 799,422 | 54.57% |
| Hispanic | 1,848,925 | 68.49% | 574,289 | 29.81% | 327,940 | 22.38% |
| Black Hispanic | 42,866 | 1.59% | 20,107 | 1.04% | 6,708 | 0.46% |
| White Hispanic | 1,672,474 | 61.96% | 471,278 | 24.47% | 278,000 | 18.98% |
| Gender | ||||||
| Male | 1,311,459 | 48.58% | 938,043 | 48.70% | 710,241 | 48.48% |
| Female | 1,387,969 | 51.42% | 988,162 | 51.30% | 754,786 | 51.52% |
| Median household income (USD) | 52,669 | 57,433 | 62,571 | |||
| Age group | ||||||
| 0–19 | 615,919 | 22.82% | 451,353 | 23.43% | 313,436 | 21.39% |
| 20–39 | 736,246 | 27.27% | 501,570 | 26.04% | 338,567 | 23.11% |
| 40–59 | 765,800 | 28.37% | 539,530 | 28.01% | 373,605 | 25.50% |
| 60–79 | 459,748 | 17.03% | 349,128 | 18.13% | 331,428 | 22.62% |
| 80 and above | 121,715 | 4.51% | 84,624 | 4.39% | 107,991 | 7.37% |
| POI | Miami-Dade | Broward | Palm Beach |
|---|---|---|---|
| Bars | 68 | 48 | 45 |
| Restaurants | 5609 | 3725 | 2605 |
| Category | Variables | Sources |
|---|---|---|
| Explanatory variables | ||
| Sociodemographic | Median household income Unemployment rate Average household size Percent of population with low, medium, and high wages Percent of population with high school degree Percent of population with bachelor’s degree or above Percent of the Black population Percent of the White population Percent of the Hispanic population Sex ratio (number of males per 100 females) Age groups 0–19, 20–39, 40–59, 60–79, 80+ Percent of the population working from home Percent of population defined as essential workers | 2019 ACS |
| Travel-related | Mean travel time to work Distance to beach Percent of time dwelling at home Percent of devices completely at home Percent of full-time and part-time work behaviors Mean bar/restaurant visits | 2019 ACS and SafeGraph |
| Built environment | Gross employment density Total road network density Street intersection density Distance from centroids to the nearest transit stop | Smart Location Database |
| COVID-19 | Cumulative COVID-19 positive cases (05/01–07/31/2020) per 10,000 people | Florida DOH |
| Dependent variable | ||
| Mobility | Inflow trips per person per census tract (05/01–07/31/2020) at census tract level | MTI |
| County | 05/01–06/15 | 06/16–07/31 | Change (%) |
|---|---|---|---|
| Miami-Dade | 388,724,381 | 365,125,529 | −6.07 |
| Broward | 280,165,073 | 262,556,430 | −6.29 |
| Palm Beach | 219,750,854 | 196,404,838 | −10.62 |
| Miami-Dade | Broward | Palm Beach | ||||
|---|---|---|---|---|---|---|
| 05/01–06/15 | 06/16–07/31 | 05/01–06/15 | 06/16–07/31 | 05/01–06/15 | 06/16–07/31 | |
| Income | 0.0957 * | −0.0268 | −0.0301 | −0.1097 * | 0.1570 ** | 0.0247 |
| Age group | ||||||
| 0–19 | −0.0701 | −0.0717 | −0.1742 *** | −0.1593 ** | 0.0379 | 0.0517 |
| 20–39 | 0.0576 | 0.1256 ** | −0.0069 | 0.0303 | 0.1434 ** | 0.1732 ** |
| 40–59 | −0.0965 * | −0.1566 *** | 0.1398 ** | 0.1146 * | 0.1296 * | 0.1262 * |
| 60–79 | 0.0344 | 0.0148 | 0.0652 | 0.0386 | −0.0993 | −0.1244 * |
| 80 or above | 0.0973 * | 0.0771 | 0.0081 | 0.0068 | −0.1338 * | −0.1404 ** |
| Miami-Dade | Broward | Palm Beach | ||||
|---|---|---|---|---|---|---|
| 05/01–06/15 | 06/16–07/31 | 05/01–06/15 | 06/16–07/31 | 05/01–06/15 | 06/16–07/31 | |
| 0.5104 | 0.6068 | 0.5496 | 0.6712 | 0.6781 | 0.6766 | |
| 0.2555 | 0.3549 | 0.2964 | 0.3666 | 0.4358 | 0.4415 | |
| 34.03 | 33.31 | 44.22 | 42.67 | 37.27 | 37.80 | |
| 27.21 | 26.64 | 36.61 | 35.48 | 31.14 | 28.89 | |
Publisher’s Note: MDPI stays neutral with regard to jurisdictional claims in published maps and institutional affiliations. |
© 2021 by the authors. Licensee MDPI, Basel, Switzerland. This article is an open access article distributed under the terms and conditions of the Creative Commons Attribution (CC BY) license (https://creativecommons.org/licenses/by/4.0/).
Share and Cite
Zhu, G.; Stewart, K.; Niemeier, D.; Fan, J. Understanding the Drivers of Mobility during the COVID-19 Pandemic in Florida, USA Using a Machine Learning Approach. ISPRS Int. J. Geo-Inf. 2021, 10, 440. https://doi.org/10.3390/ijgi10070440
Zhu G, Stewart K, Niemeier D, Fan J. Understanding the Drivers of Mobility during the COVID-19 Pandemic in Florida, USA Using a Machine Learning Approach. ISPRS International Journal of Geo-Information. 2021; 10(7):440. https://doi.org/10.3390/ijgi10070440
Chicago/Turabian StyleZhu, Guimin, Kathleen Stewart, Deb Niemeier, and Junchuan Fan. 2021. "Understanding the Drivers of Mobility during the COVID-19 Pandemic in Florida, USA Using a Machine Learning Approach" ISPRS International Journal of Geo-Information 10, no. 7: 440. https://doi.org/10.3390/ijgi10070440
APA StyleZhu, G., Stewart, K., Niemeier, D., & Fan, J. (2021). Understanding the Drivers of Mobility during the COVID-19 Pandemic in Florida, USA Using a Machine Learning Approach. ISPRS International Journal of Geo-Information, 10(7), 440. https://doi.org/10.3390/ijgi10070440