1. Introduction
Japan has numerous, massive, natural rock formations of extraordinary beauty that have considerable cultural and historical significance. Many of these formations are located just off the coast and are characterized by creating an impressive contrast between the sea and the rocks, which combine to form what many consider natural artworks.
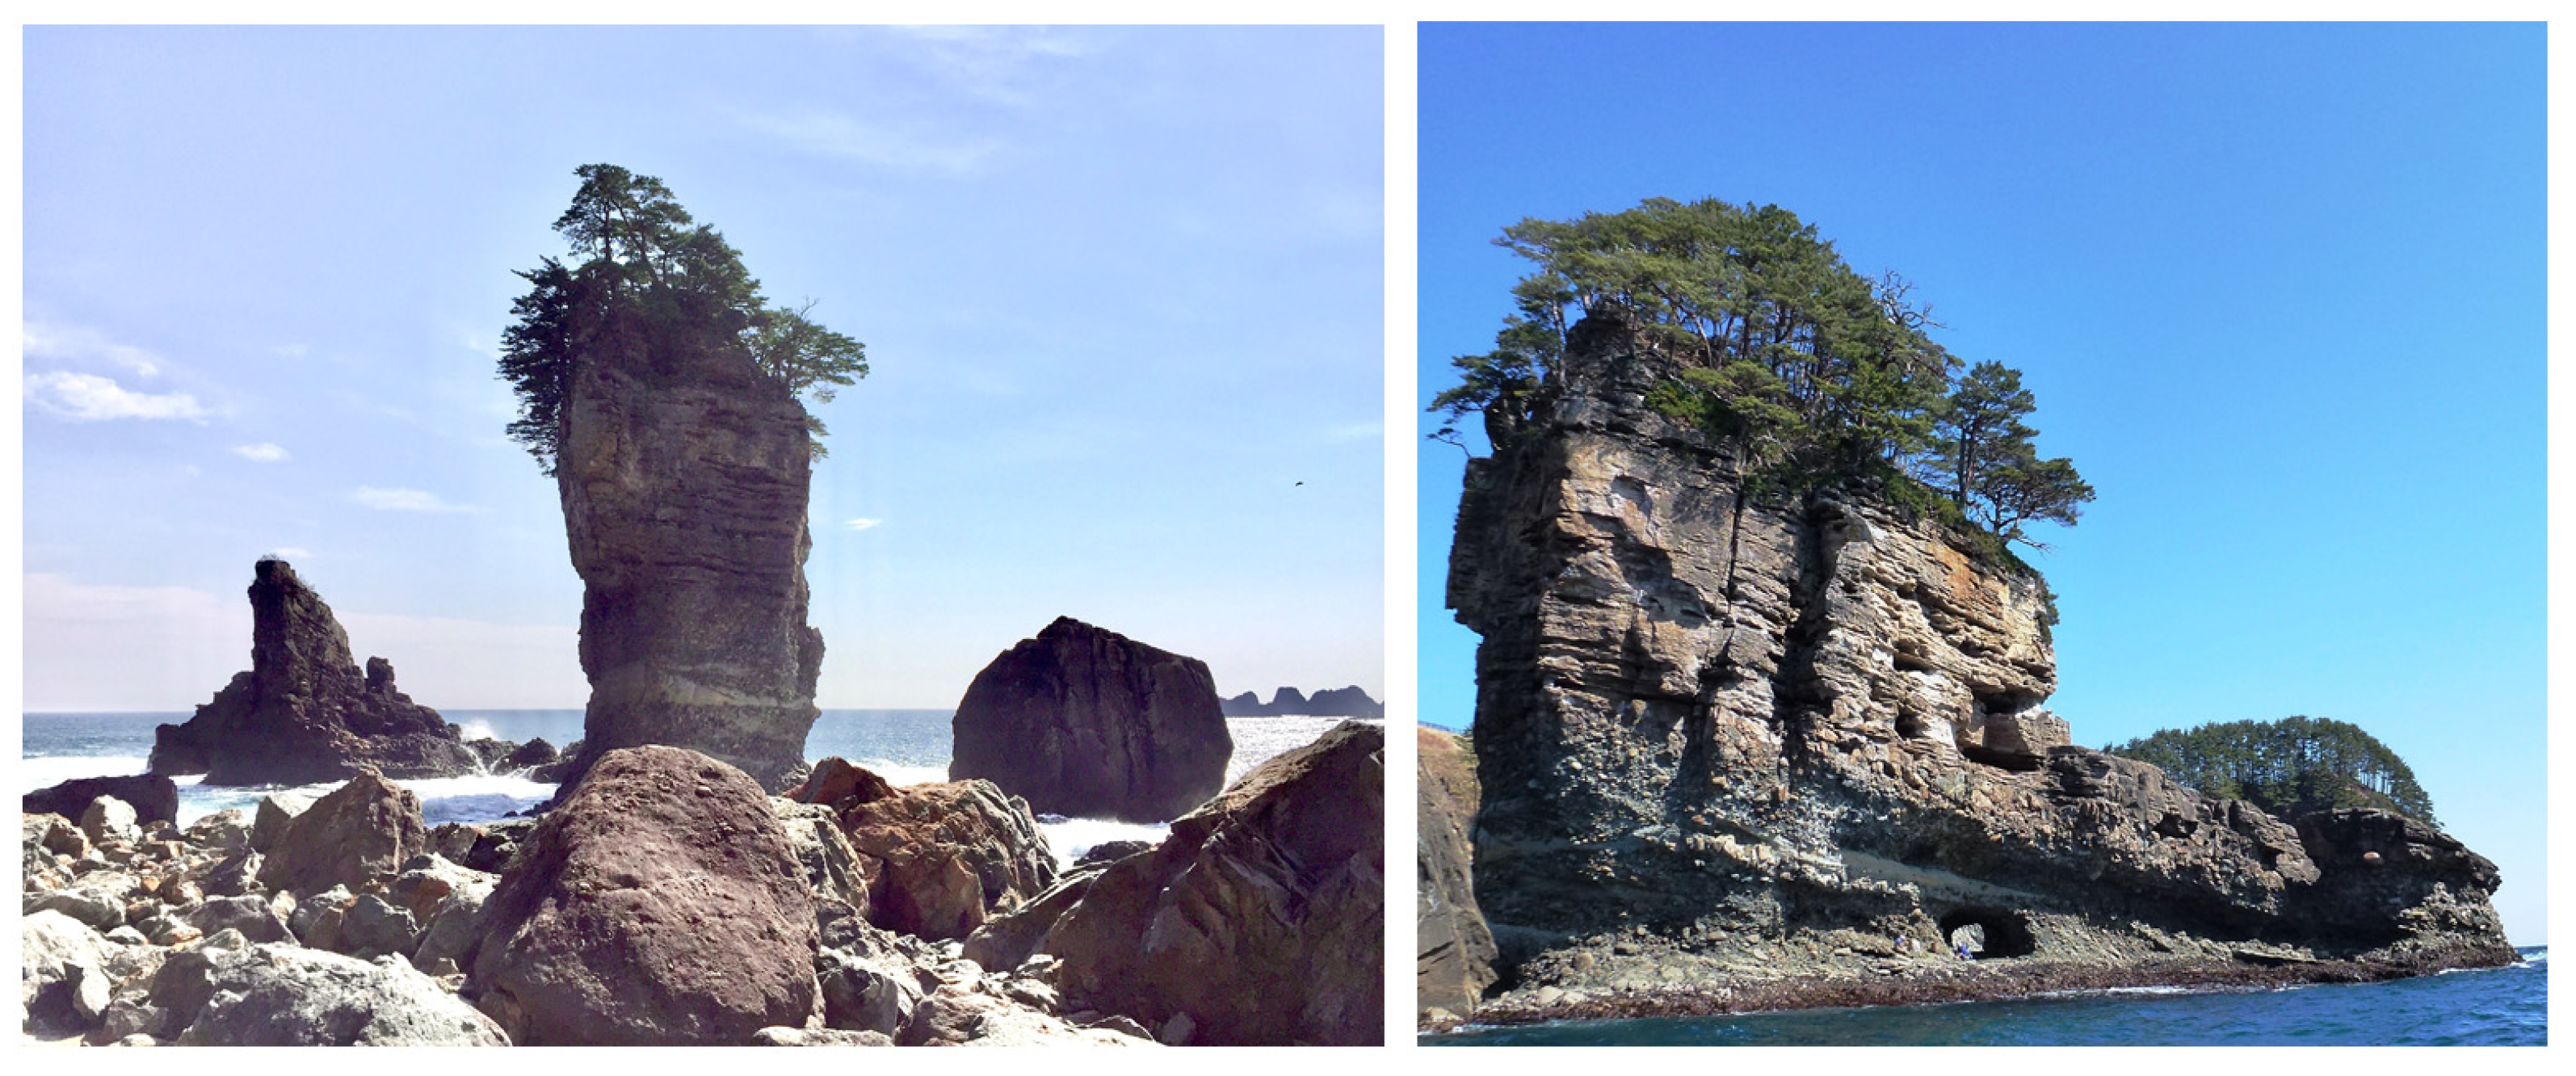
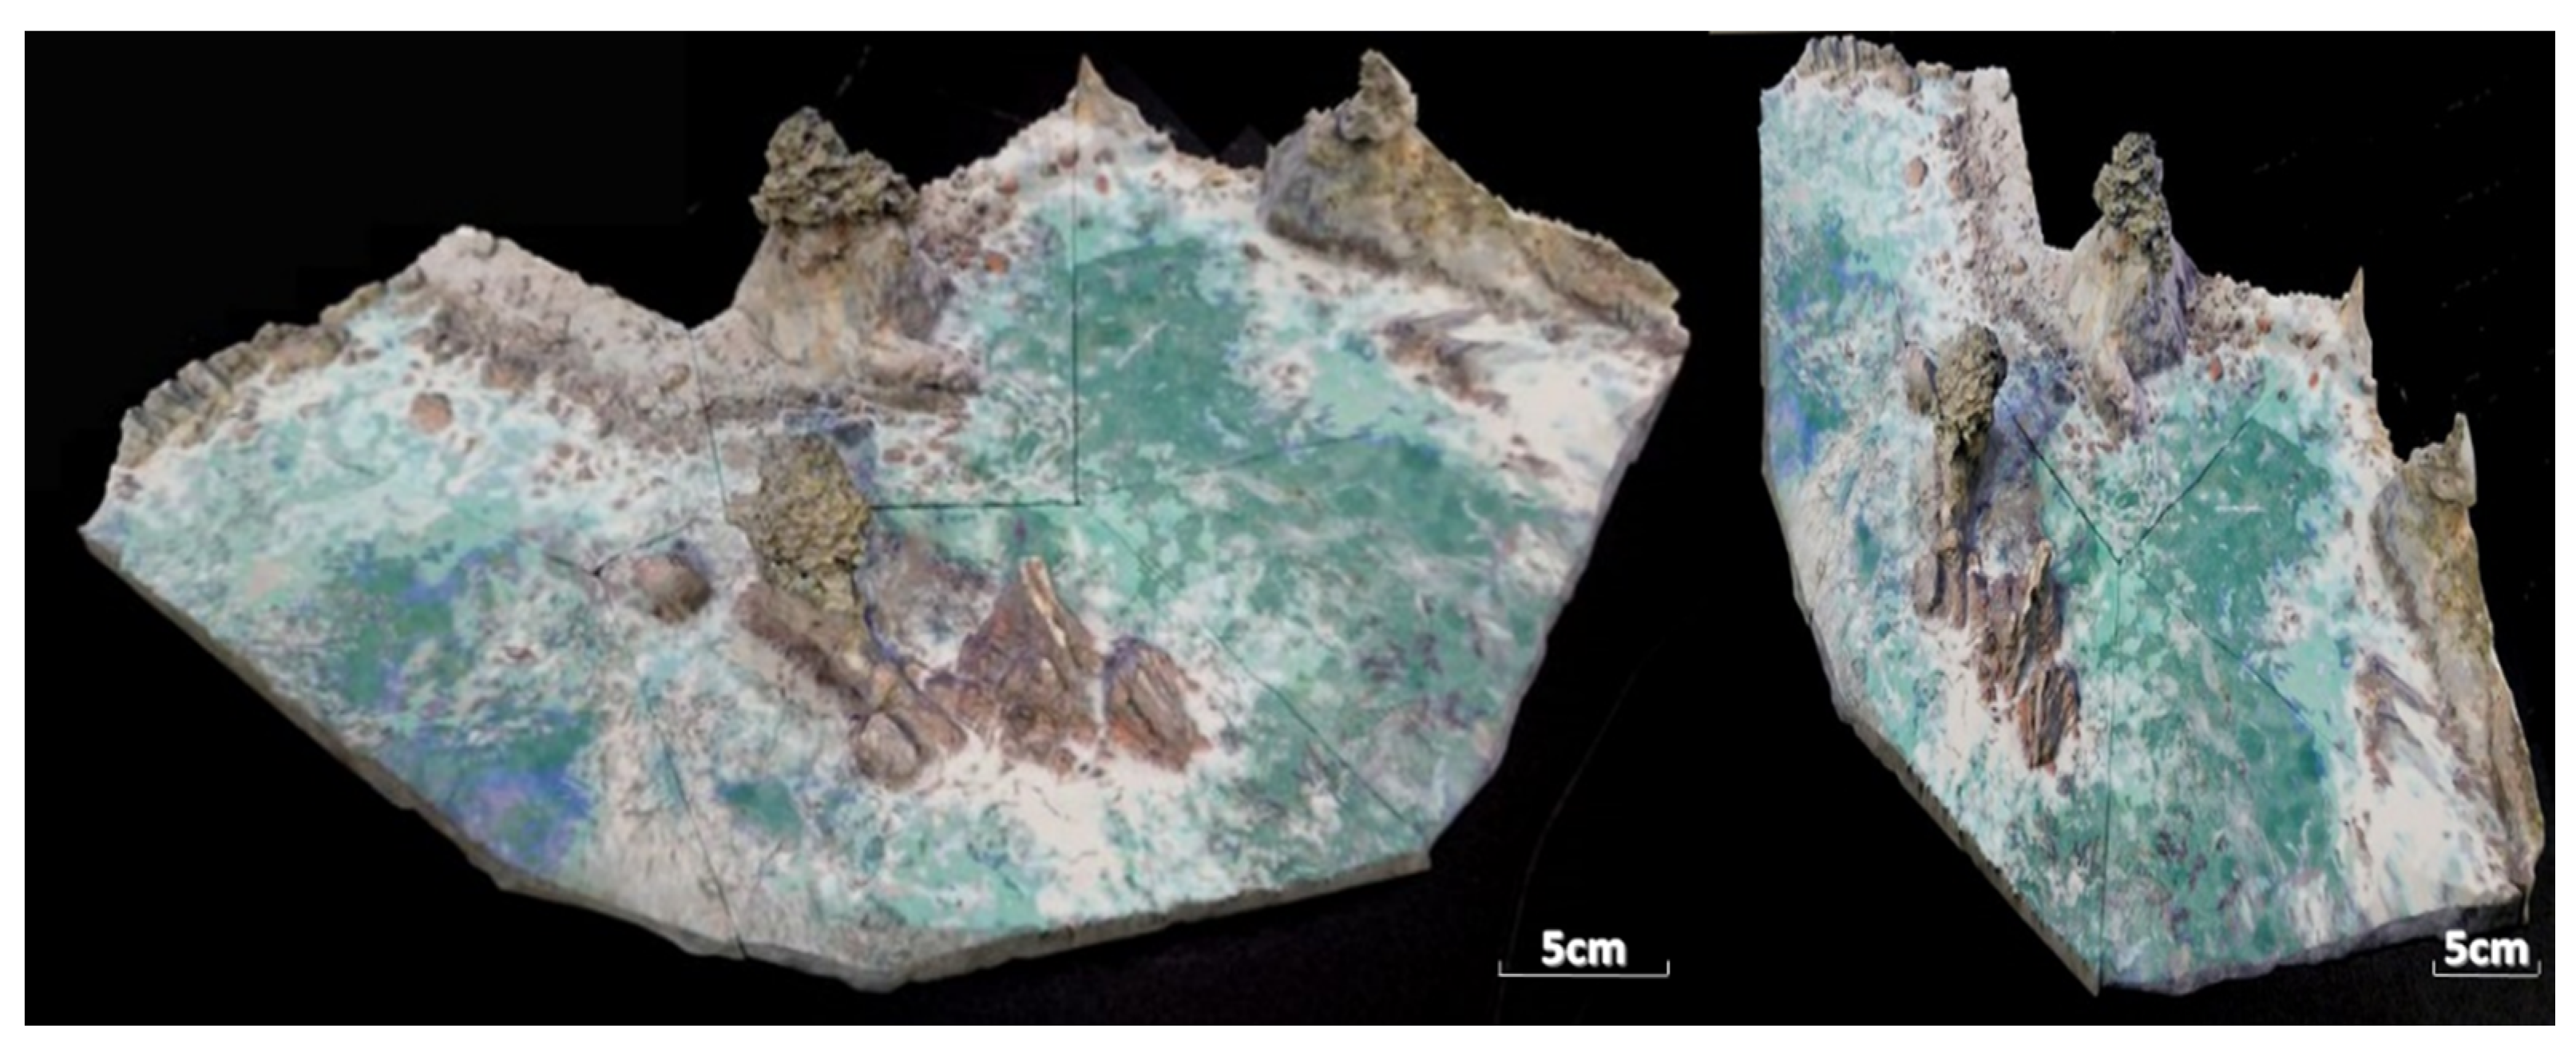
Figure 1 shows the Sanouiwa rock formation, which is a historic and scenic site along the Taro coast off Miyako City in Iwate Prefecture.
The figure on the left shows the 50 m high Otokoiwa (Male Rock) and the 23 m high Onnaiwa (Female Rock), while the figure on the right shows the 17 m high Taikoiwa (Taiko Drum Rock). These rocks were shaped by wave and wind action over a period of 100 million years. The horizontally striped sandstone surface and loose rubble combine to evoke scenes of the ancient Cretaceous period [
2]. These three rocks, which stand adjacent to one another, were listed as an Iwate Prefectural Natural Monument on 4 September 1992, and are now part of the Sanriku Fukko National Park. After the new designation, facilities for tourists and visitors, including a promenade, were constructed and have been maintained since.
Following the Great East Japan Earthquake of 2011, even though these famous rocks withstood the massive tsunami that struck the area, damage to the handrail and other portions of the promenade prompted prefectural authorities to prohibit entry to the rocks temporarily. It was also decided to digitally record the rock formation in its current state for posterity and to ensure that a record existed in the event of future damage to the monument.
To digitally archive these large coastal rocks, we used an unmanned aerial vehicle (UAV), or drone, and global navigation satellite system (GNSS) data. The drone, which was equipped with a remotely operated, high-resolution camera, was piloted above and around the rocks in order to capture 1015 high-resolution images. To prevent capturing blurry images and to improve measurement accuracy, images were captured with the drone maintained in a stationary position.
In order to unify the geographic coordinates of the obtained data, five georeference markers were placed near the beach and near the Sanouiwa rock formation. By ensuring that these markers were visible in the images captured by the drone-mounted camera, positional information could then be measured via the GNSS data with reference to each marker.
Using these high-resolution images, we then generated large point cloud datasets of the coastal rocks using three-dimensional (3D) shape reconstruction software. The 3D shape reconstruction software utilizes a structure-from-motion (SfM) method to generate the point cloud data. Since the point cloud data thus generated were very large and noisy, we cleaned up and reduced the number of points in the cloud data to facilitate analysis.
Finally, we constructed the 3D digital model based on the point cloud data by using 3D modeling software with a mesh generation function, and then produced physical 3D models using two different 3D printers. Our physical 3D models have been evaluated as being effective at many exhibitions and public information sessions [
3].
2. Three-Dimensional Measurements and Modeling of Giant Coastal Rocks
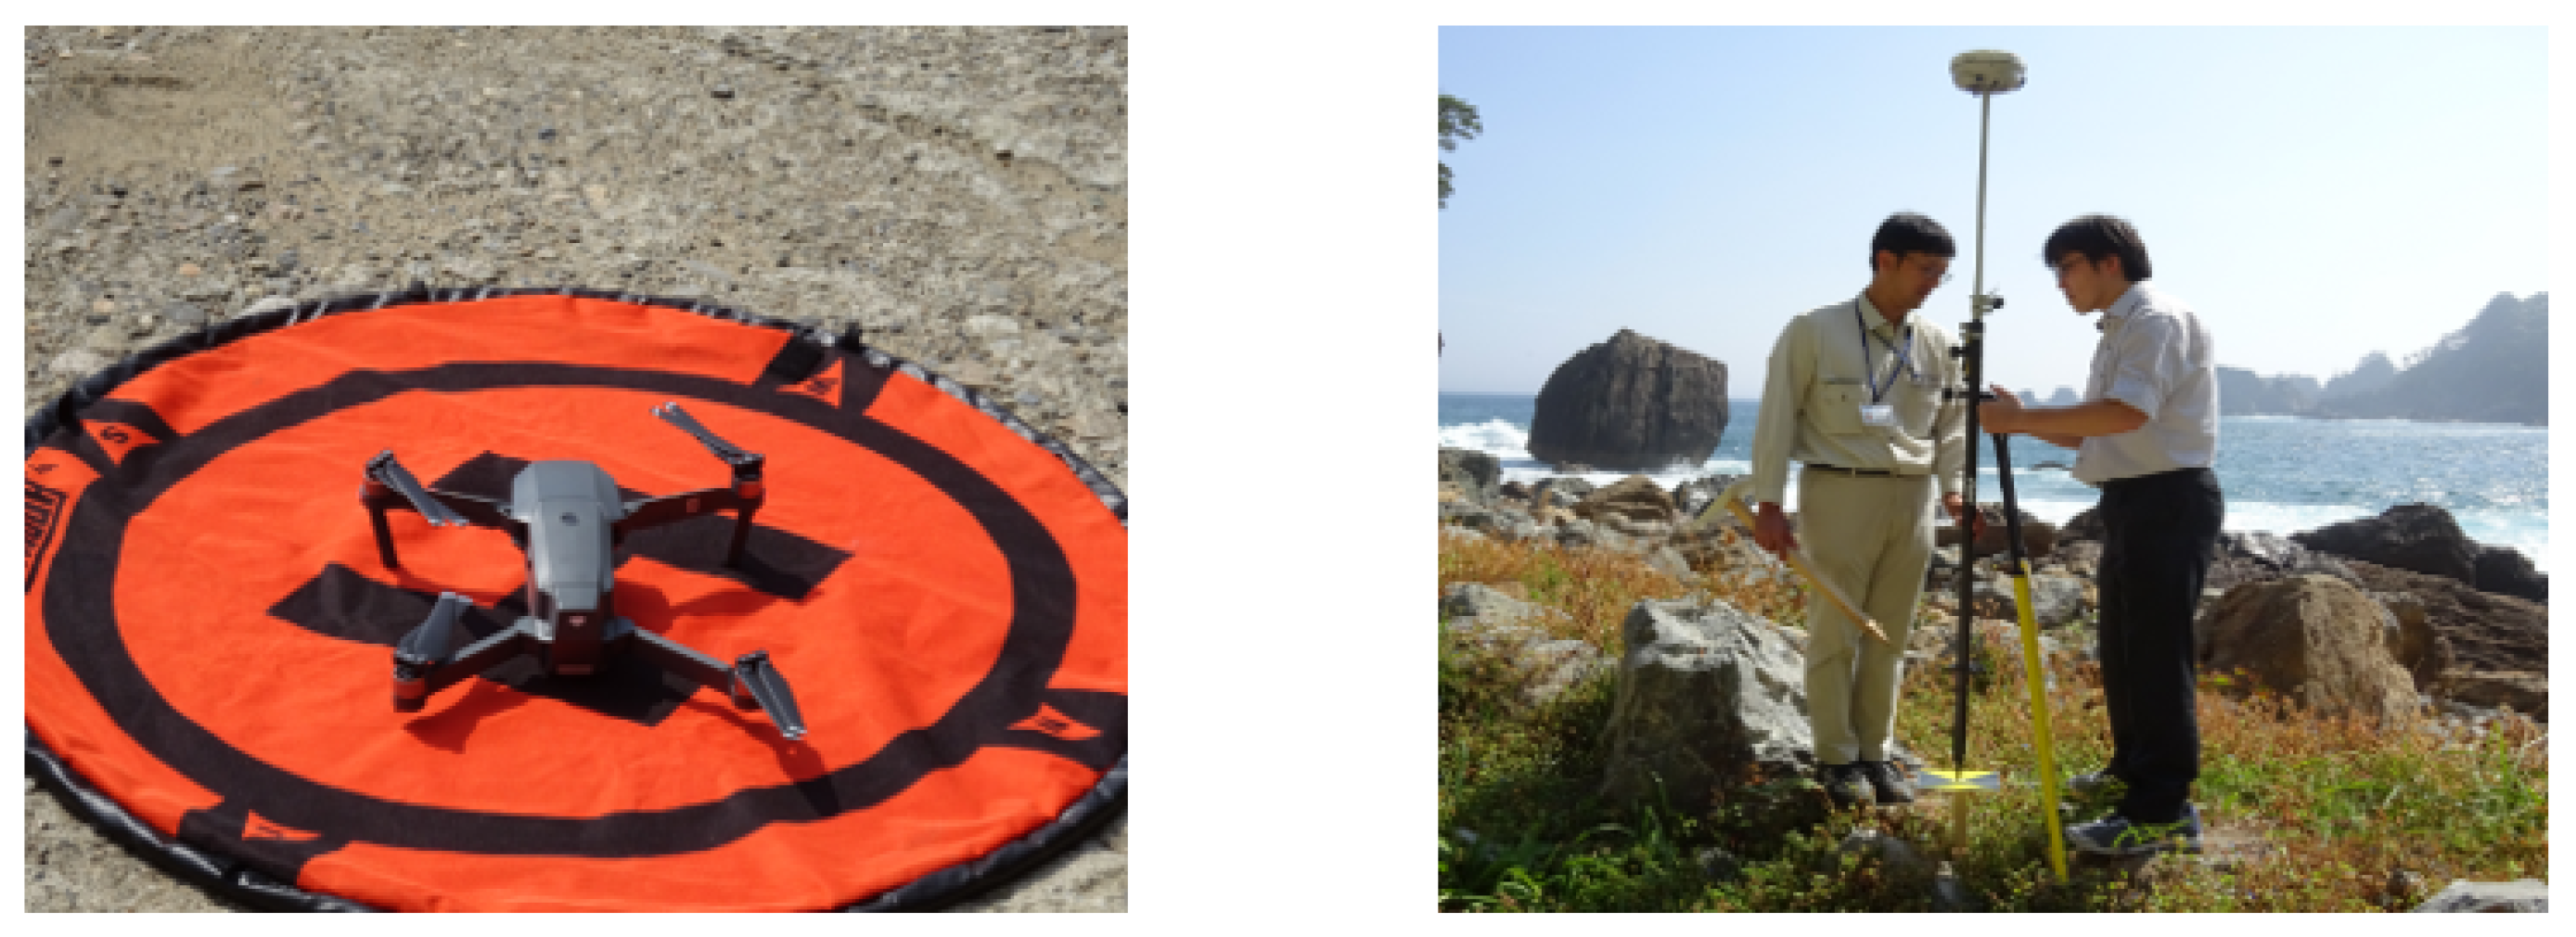
Since the terrain near the giant rocks being measured is a coastal cliff, and since the giant rock formation is located in the waters immediately offshore, it was decided that capturing the data using a static 3D laser scanner setup would be too difficult. Accordingly, we decided to use a drone to collect data from the air above and around the rock formation, and to georeference the precise location information obtained using a GNSS receiver device, as shown in
Figure 2.
2.1. Three-Dimensional Measurement Devices Used to Collect Data
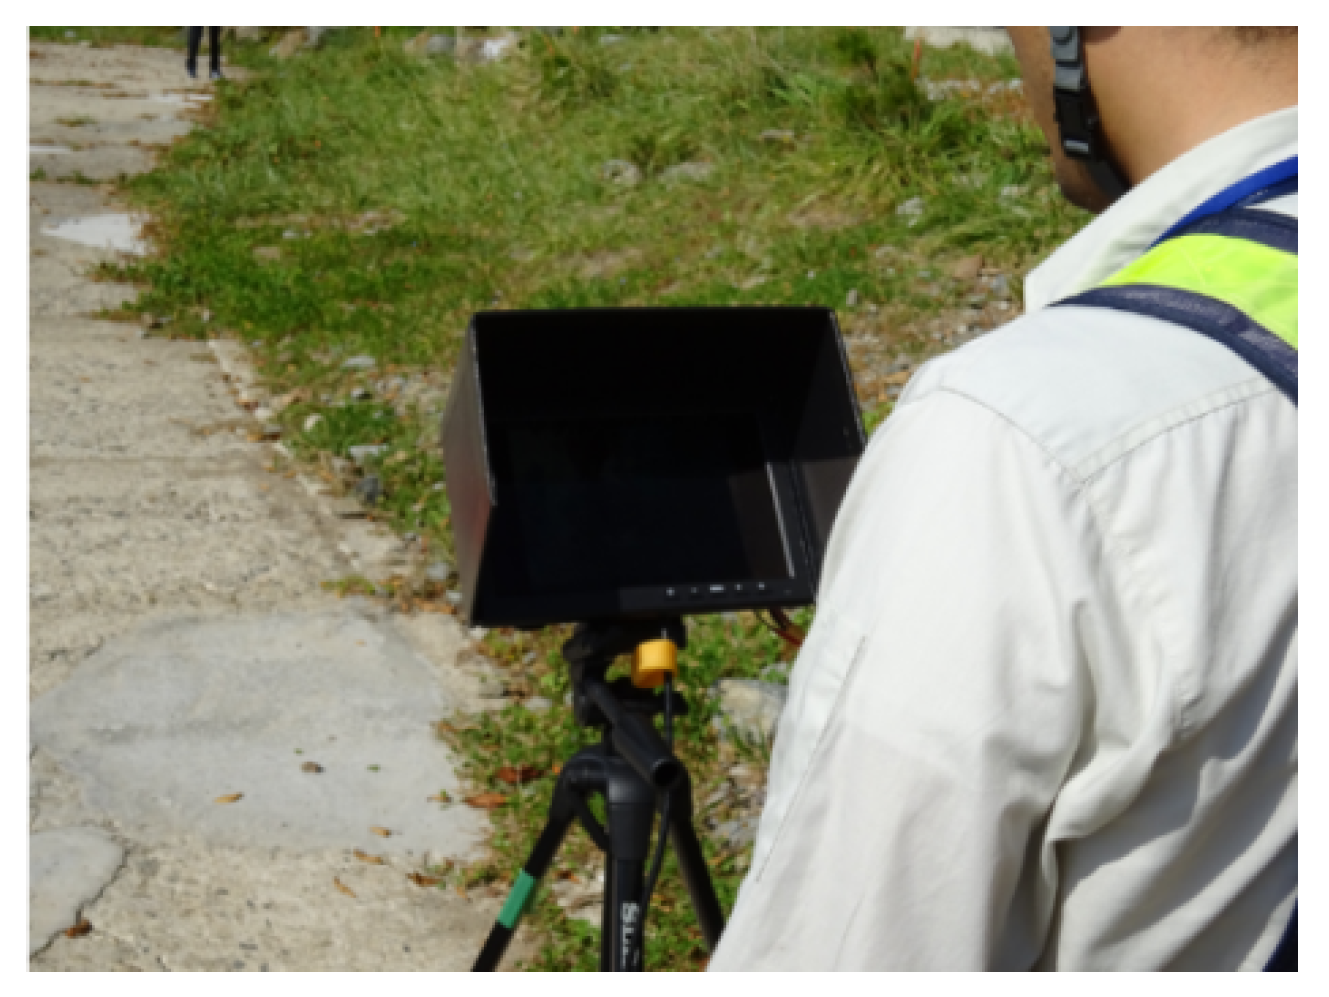
In this study, images were recorded using a Mavic Pro (DJI Ltd., Shenzhen, China) drone equipped with 4K video and high-resolution digital cameras (GPT 9005A, Topcon KK, Tokyo, Japan) that could be remotely controlled from an Apple iPad, as shown in
Figure 3. We also used a NetR5 Reference Station (Trimble Inc., Sunnyvale, CA, USA) for GNSS point measurement/verification. Measurements of the orientation and georeference points were carried out by the “network-type RTK method” [
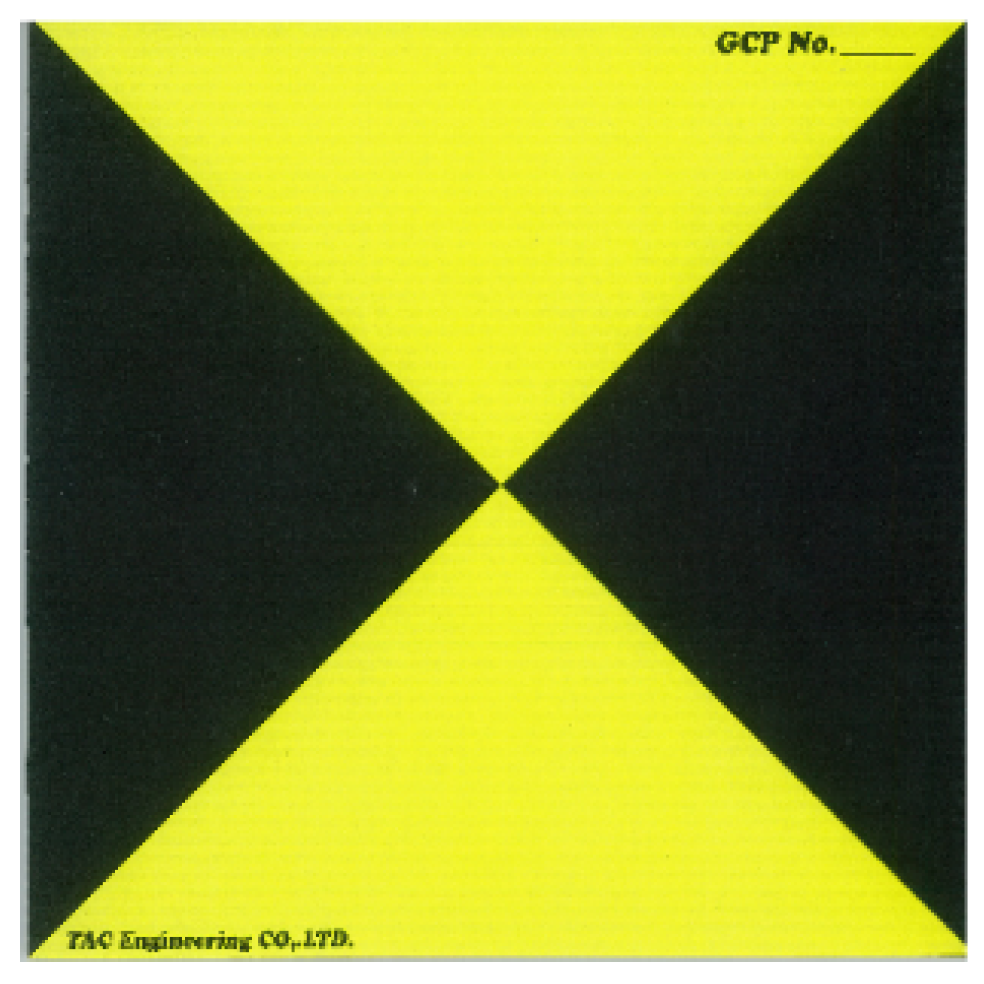
4]. The georeference markers were squares measuring 20 cm (5 pixels or more) on each side, and were colored and patterned as shown in
Figure 4.
As stated above, since it was too difficult to use 3D laser devices, such as LiDAR, to scan the Sanouiwa rock formation from the shore, we captured 1015 high-resolution photographs from positions above and around the rock formation using a drone-mounted camera. Next, 3D point cloud data were generated from the photographs using an SfM method. Using the Pix4Dmapper (Pix4D S.A., Prilly, Switzerland) software application for point group generation, 3D polygonal models were generated from the point cloud data using the ContextCapture (Bentley Systems, Exton, PA, USA) software application. Finally, we generated a 3D closed polygonal model for 3D printing using POLYGONAL meister (UEL Corp., Tokyo, Japan) software for the final step [
5].
2.2. Three-Dimensional Point Cloud Generation and 3D Modeling
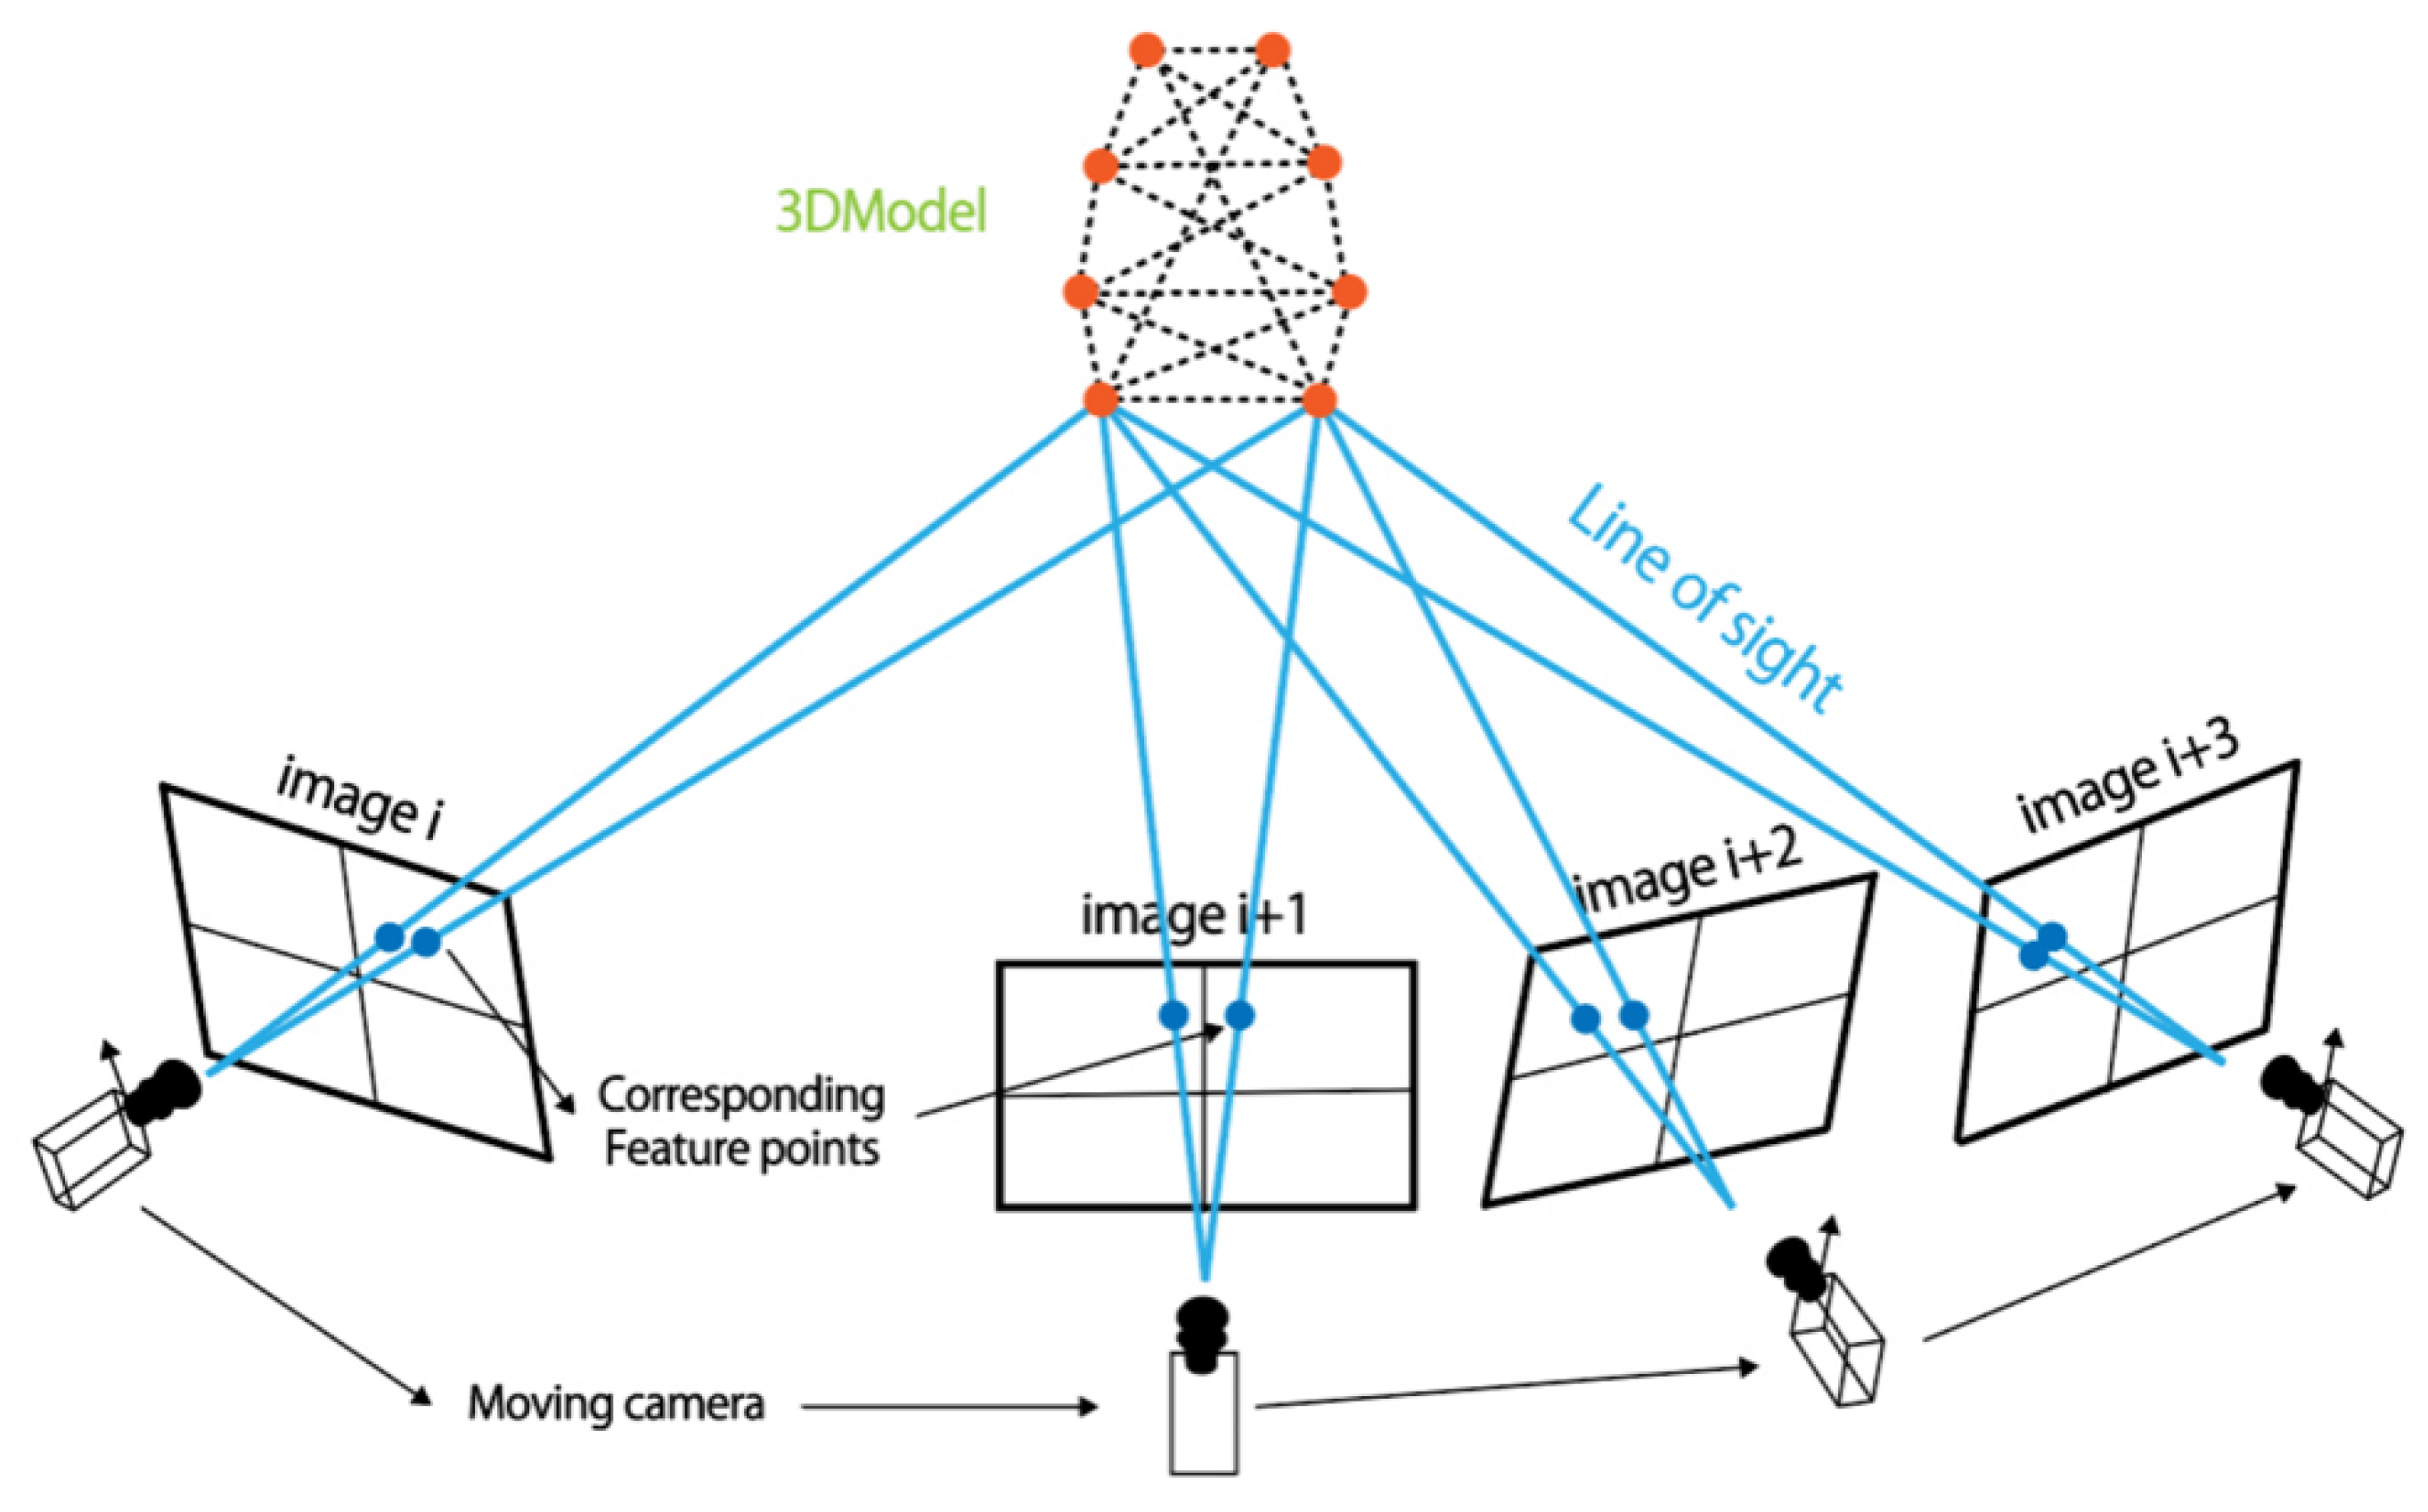
As explained above, SfM is an imaging technique for estimating 3D structures from two-dimensional (2D) image sequences in computer vision fields [
6]. As shown in
Figure 5, the SfM process first finds the object points of 3D structures and then calculates those point positions using the camera image positions [
7].
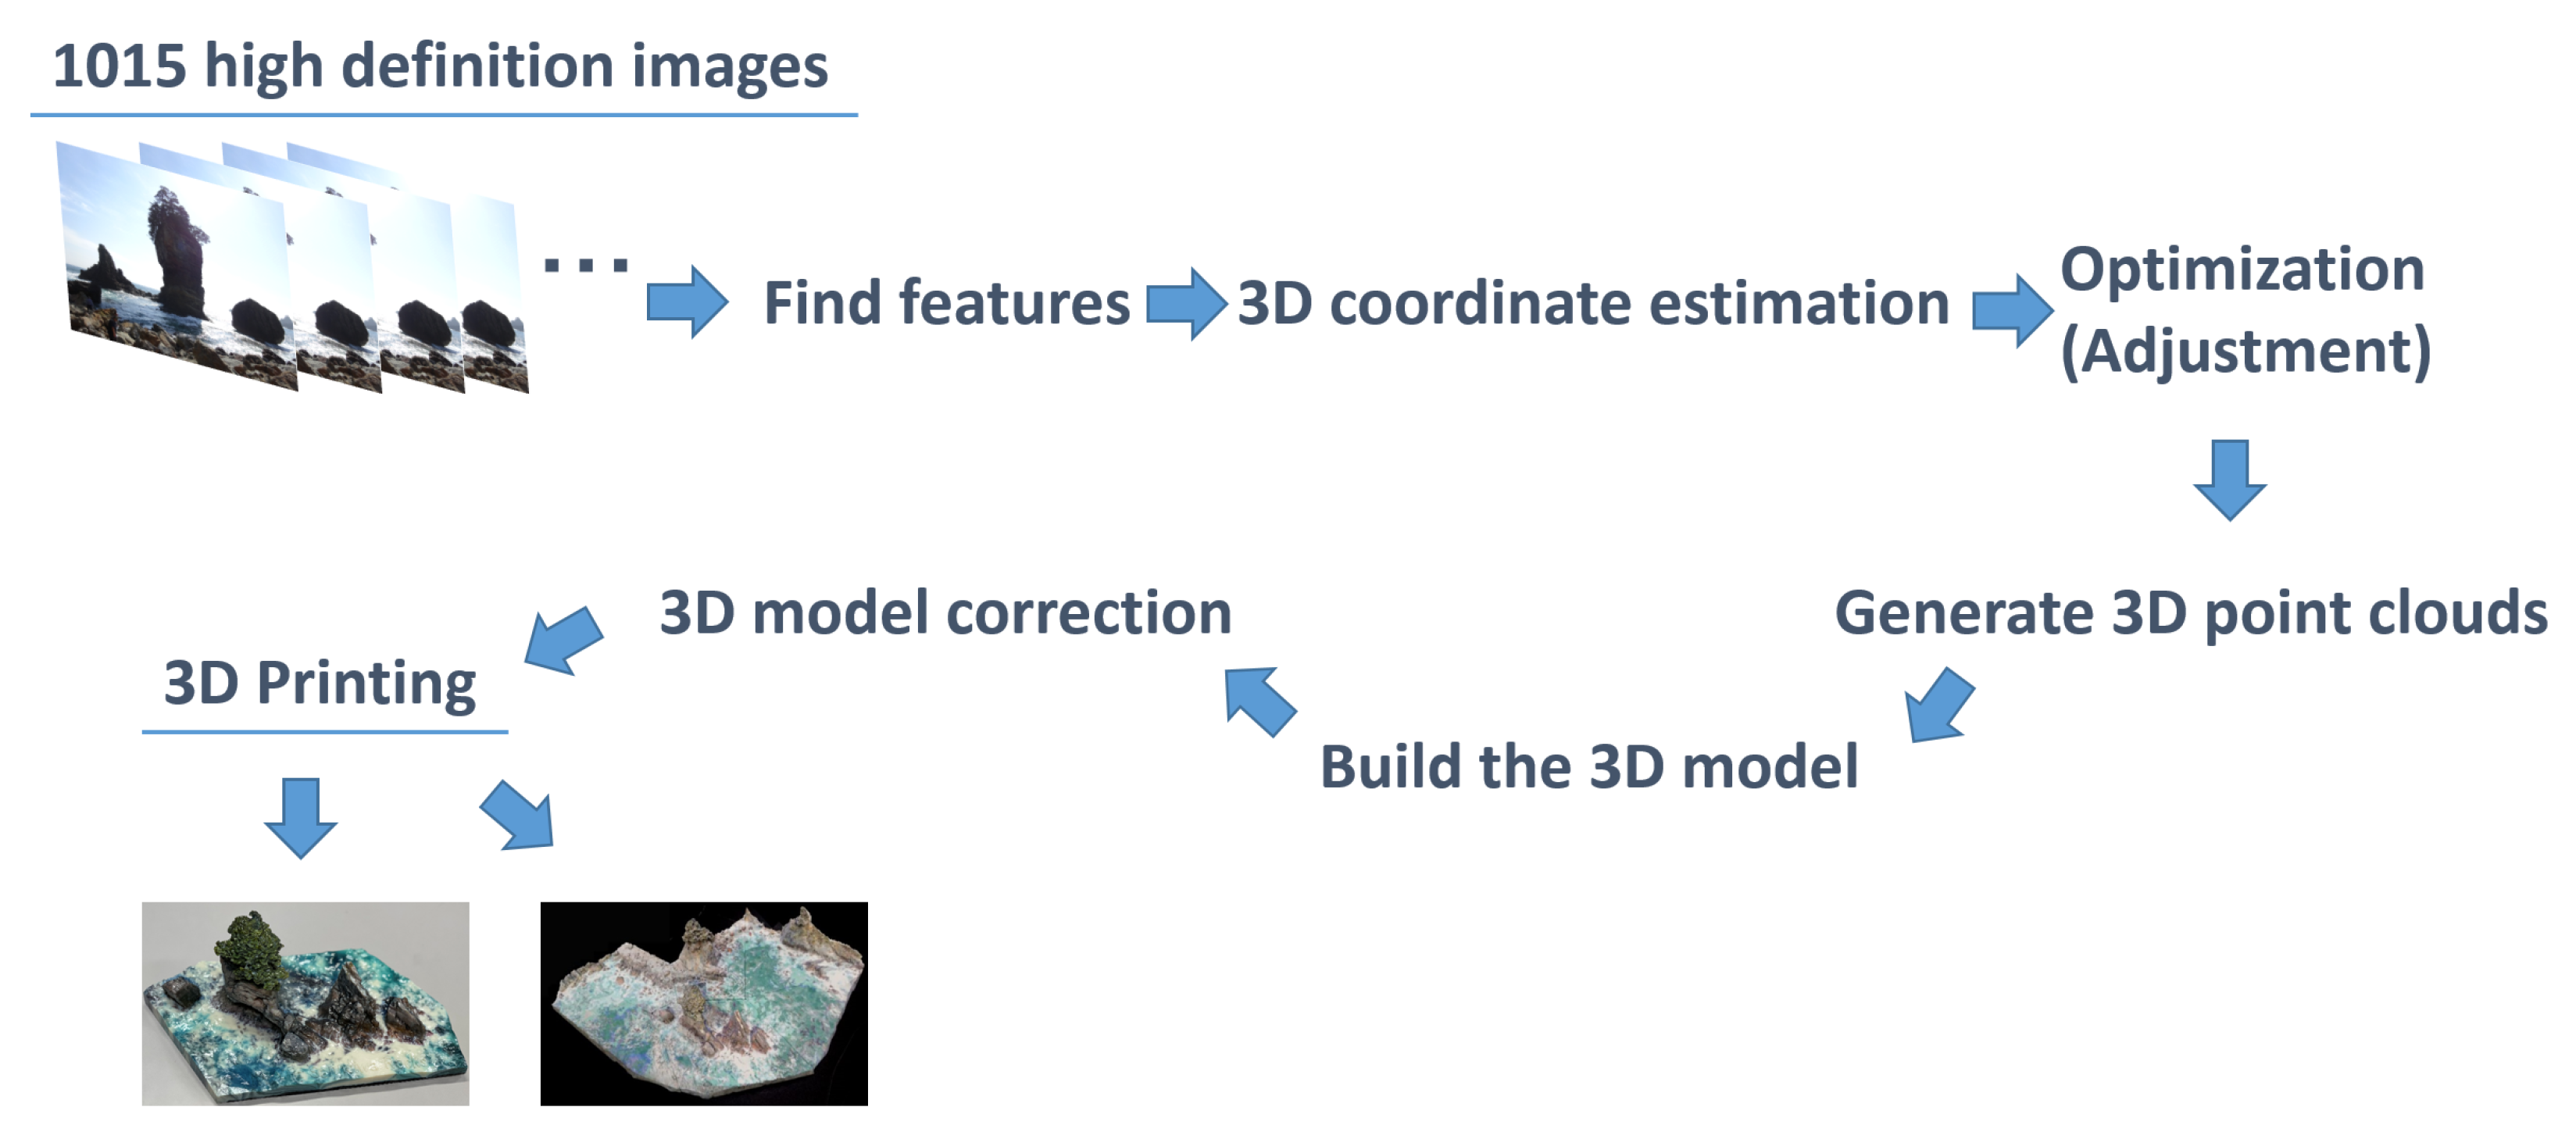
In our study, we used the 1015 high-definition images collected during the drone flights to identify parts of the same features from consecutive images, and then generated the initial 3D point cloud by calculating those same features [
8]. We then optimized the initial model using the GNSS location data before exporting and meshing the 3D point cloud data to generate the 3D model. Finally, we corrected the 3D model and printed the structure using 3D printers, a Z250 (Z Corp., Rock Hill, SC, USA) and a J750 (Stratasys, Ltd.; Eden Prairie, MN, USA), as shown in
Figure 6.
3. Results
3.1. Point Cloud Processing and Polygonal Modeling
Next, image analysis was performed without separating the photos taken from above the rock formation from those taken from the side. Although sky and side misidentification errors occurred naturally, this process allowed the Sanouiwa rock formation to be photographed from every angle, which reduced step shift and minimized holes in the 3D data. Additionally, by using the georeference markers, real coordinates and distance values could be generated.
The next step was an approximately two-day long process during which we generated the initial point group data using Pix4Dmapper software, which can extract feature points from continuous photographs and use them to generate the point cloud data model. However, it is difficult to fill polygons from point cloud data automatically because there are always some missing parts that need to be filled in and data noise that must be eliminated. As a result, it took approximately 2.5 days to completely generate the point cloud data for the Sanouiwa rock formation.
In order to create polygonal models from point cloud data using the ContextCapture software, we first employed the automatic triangulation function from the point data set to remove the unnecessary faces and fill in the polygons for the triangle model. Using this interactive process, it took approximately a week to generate the triangle model.
Data processing operations were performed on a Hewlett-Packard Z 840 work-station, equipped with a 2.10 Xeon central processing unit, 256 GB of random access memory (RAM), and a 12 GB-Video RAM NVIDIA Quadro M 6000 graphics processing unit.
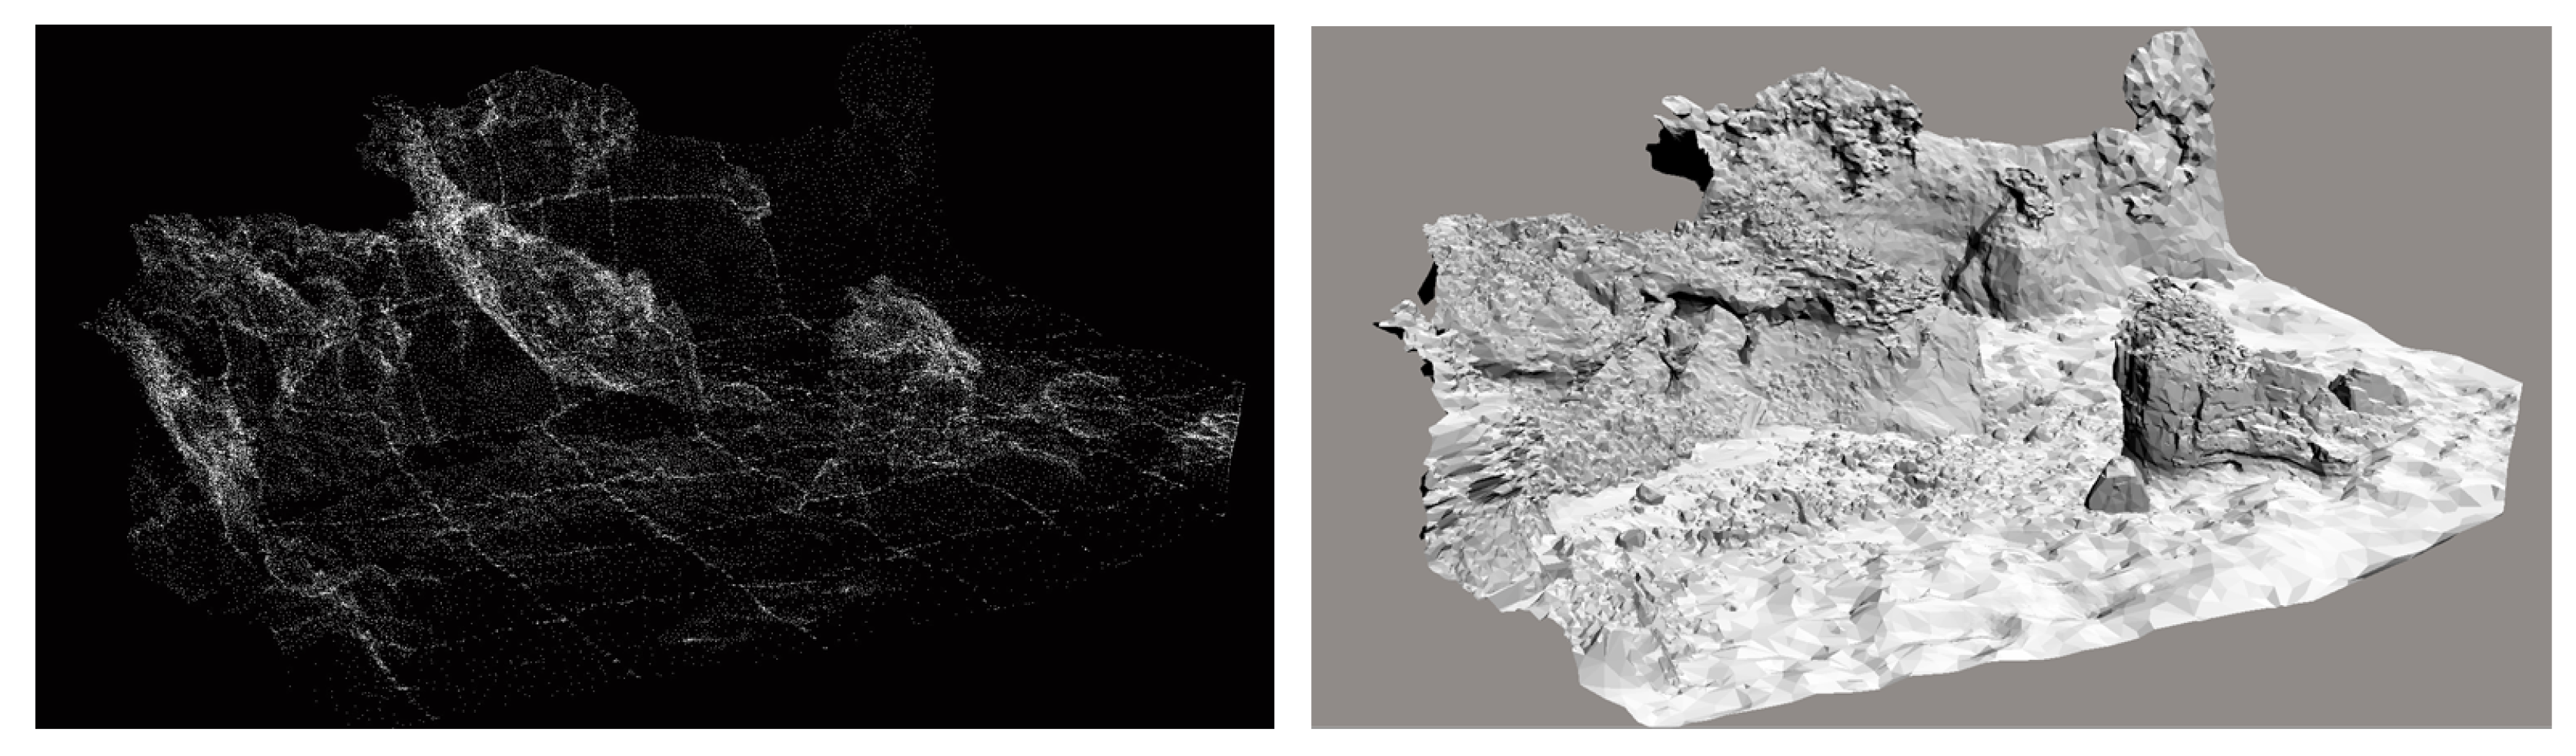
Figure 7 shows both point cloud data and the triangle model, while
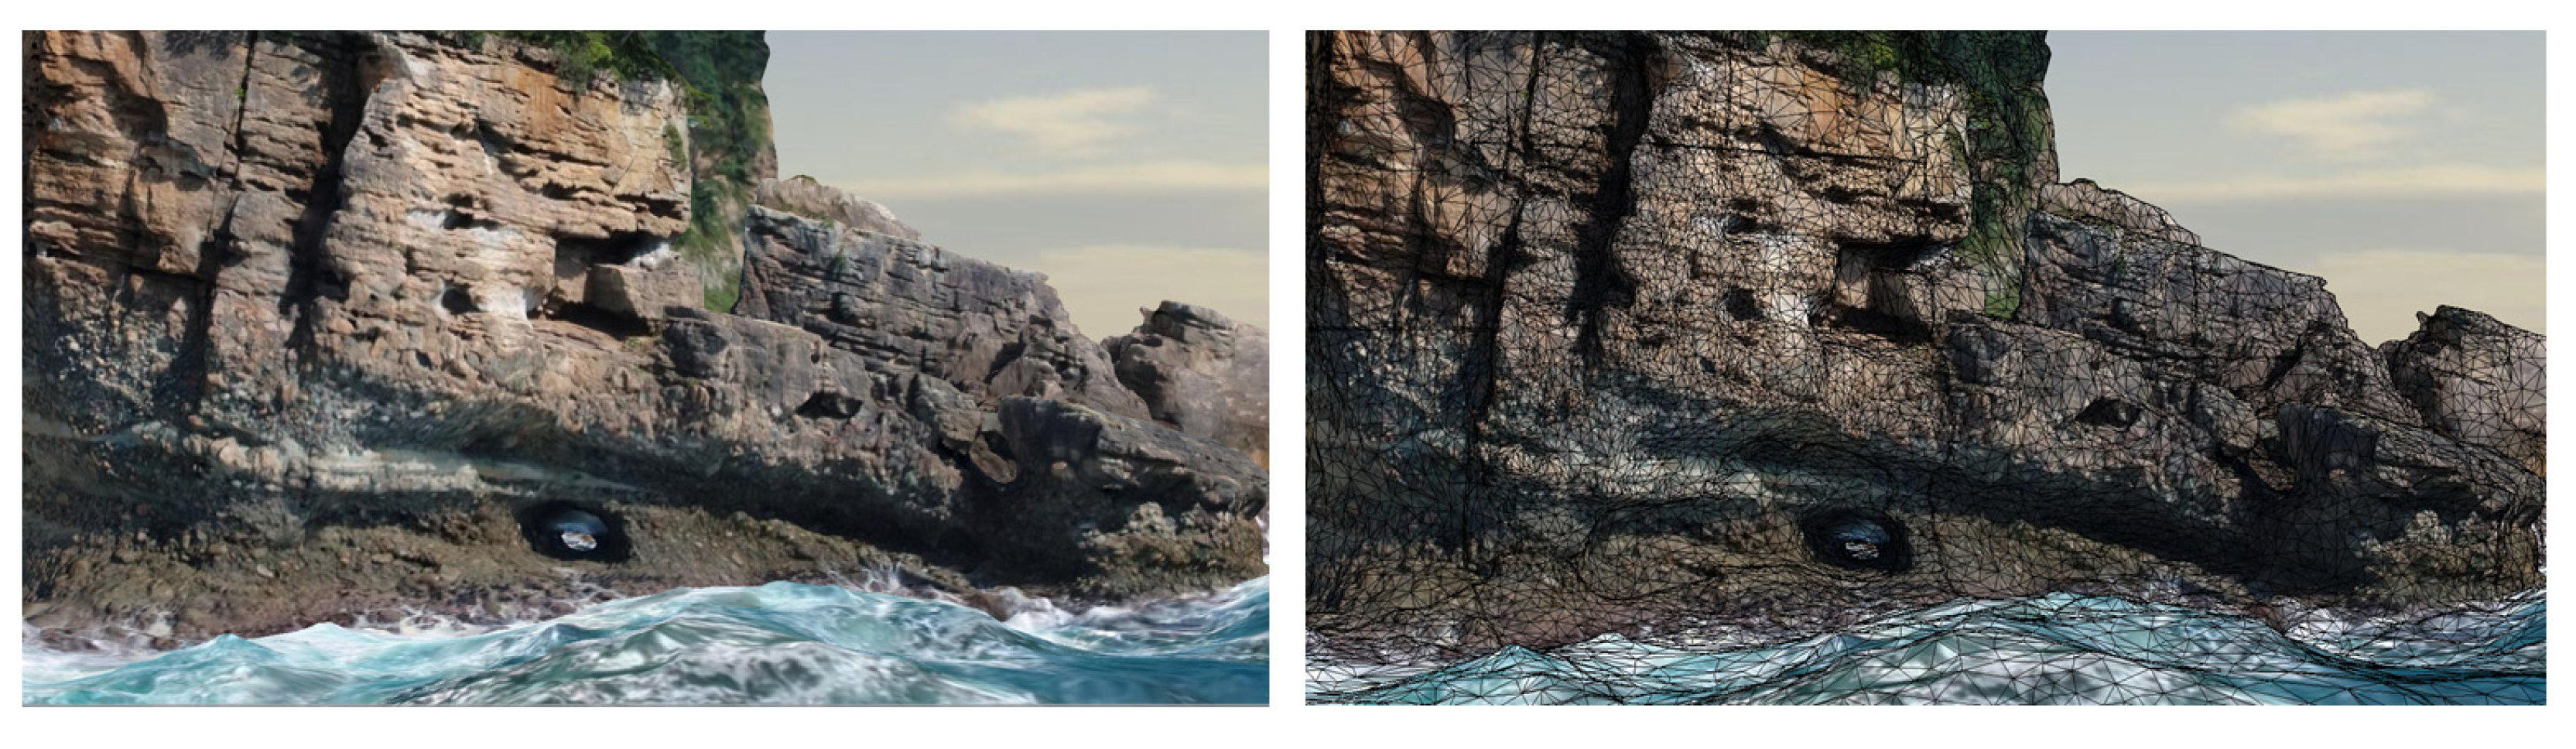
Figure 8 shows textured triangulate and wireframe overlay models.
Figure 9 shows the sides of the textured model, which confirmed that a famous cave had been modeled accurately. The wireframe display model is overlaid on the textured model in order to show the triangle size.This process, which used a Bentley Systems Acute 3D viewer, also performs texture map-ping and is capable of producing displays in close to real-time.
3.2. Modification and Segmentation for 3D Printing
The display model and the model used for 3D printing were somewhat different. For example, since 3D printing is not possible if there are holes on the model surface or if the mesh is inconsistent, it is necessary to convert the polygon model obtained from the point cloud data into a 3D printing model. In order to further refine the model, we used the Geomagic software suite: Geomagic Wrap, Geomagic Freeform Plus, and Geomagic Design X (3D Systems, Valencia, CA, USA). These applications were applied to optimize the five steps shown below:
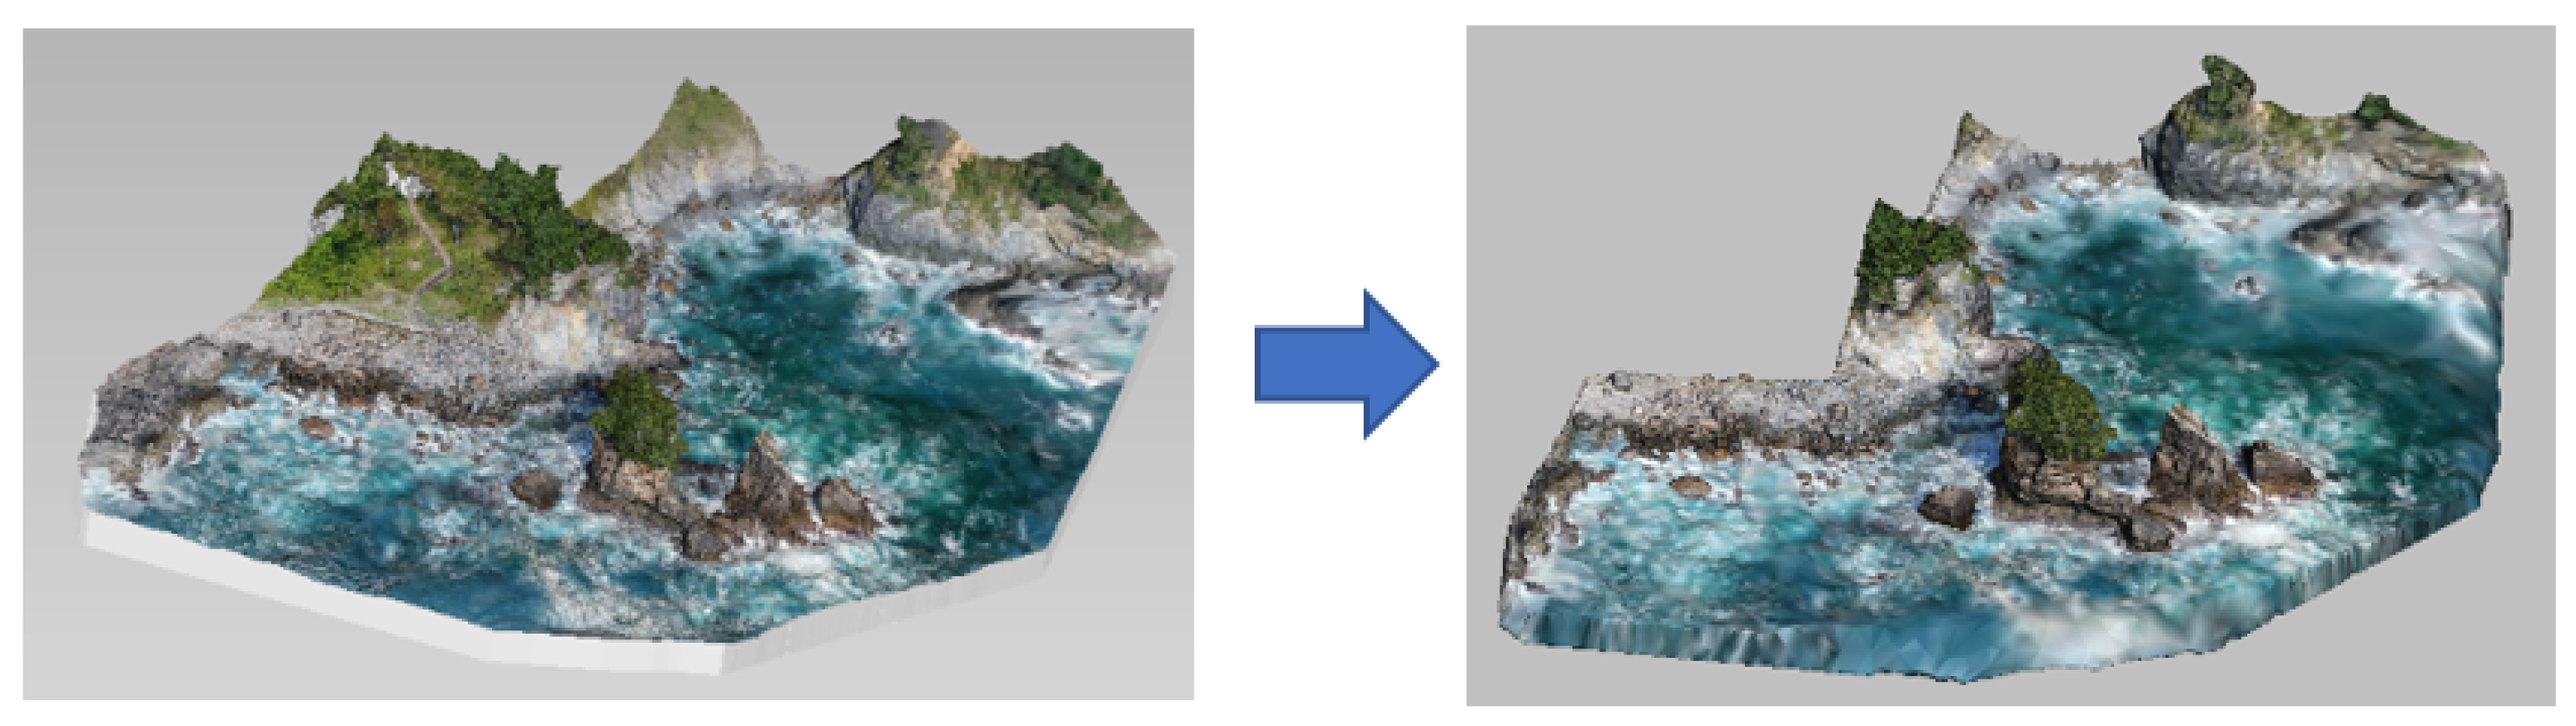
First, the Geomagic Wrap application is used to repair inconsistencies, such as internal intersections, zero-thickness areas, and holes, as shown by the red marked areas in
Figure 10. One of the most common errors encountered when performing 3D printing are STL files that have holes in the meshes—they are not “watertight”. A 3D printer cannot process such files because it cannot distinguish between outer and inner surfaces. It is therefore important that the 3D model used for 3D printing must be “watertight”, otherwise the printed model will contain errors.
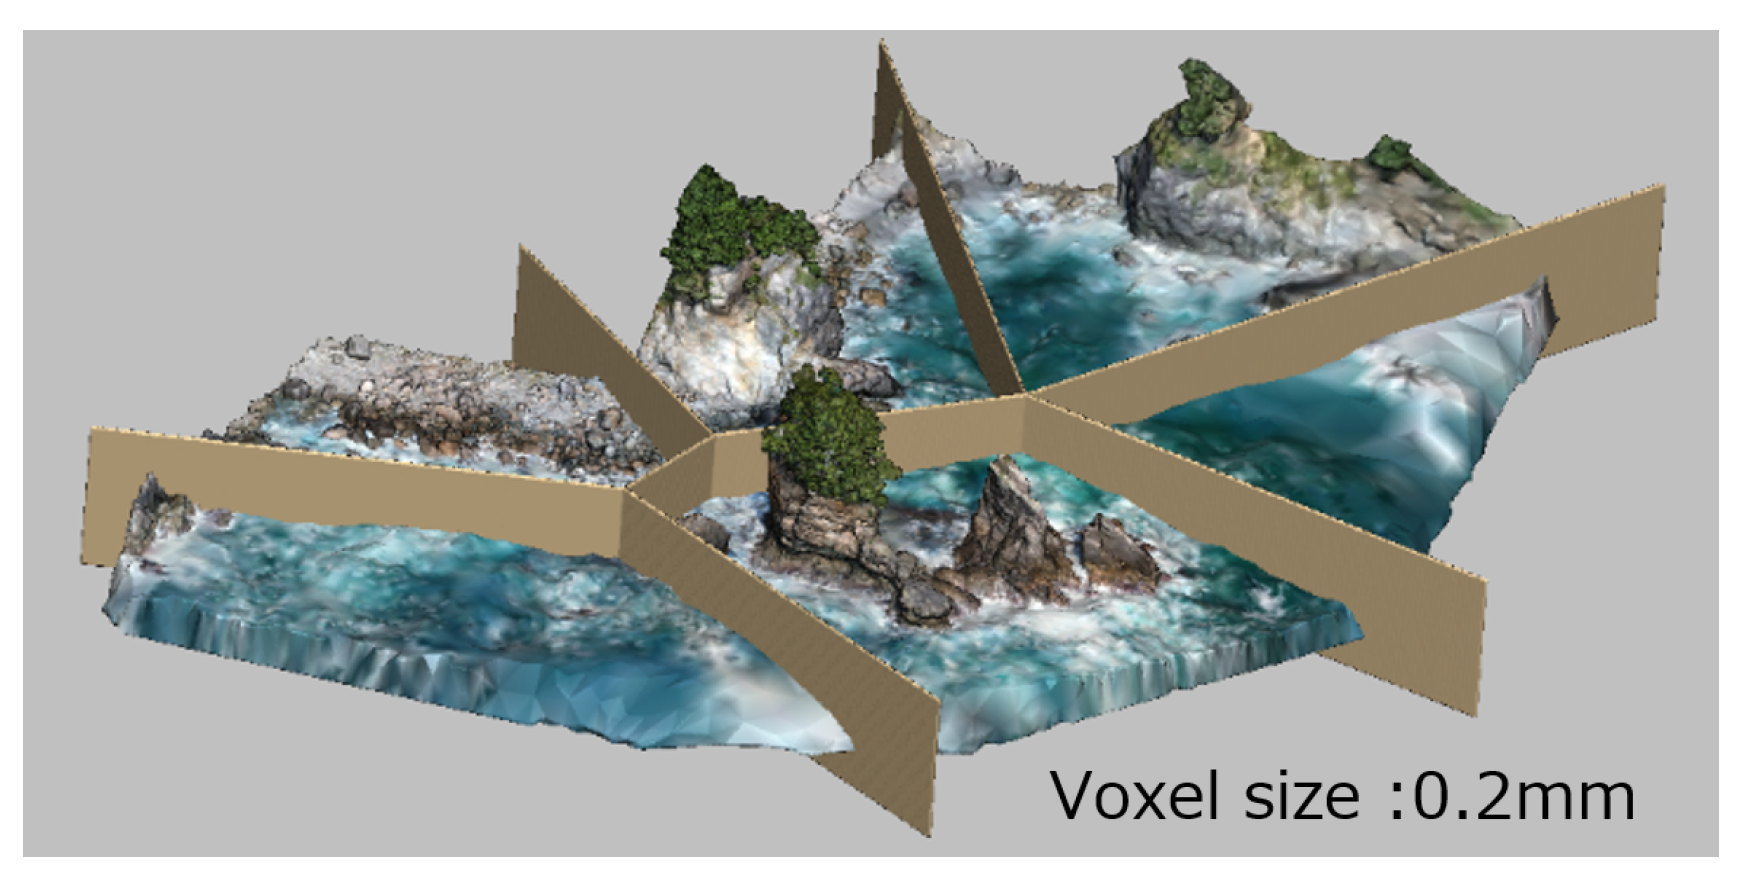
Since the meshed file is hollow and is not suitable for solid 3D printing, we converted the meshed file into a voxel file using the Design X program. After conversion, the areas were trimmed, and internal intersections, nests, and spikes were removed, as shown in
Figure 11.
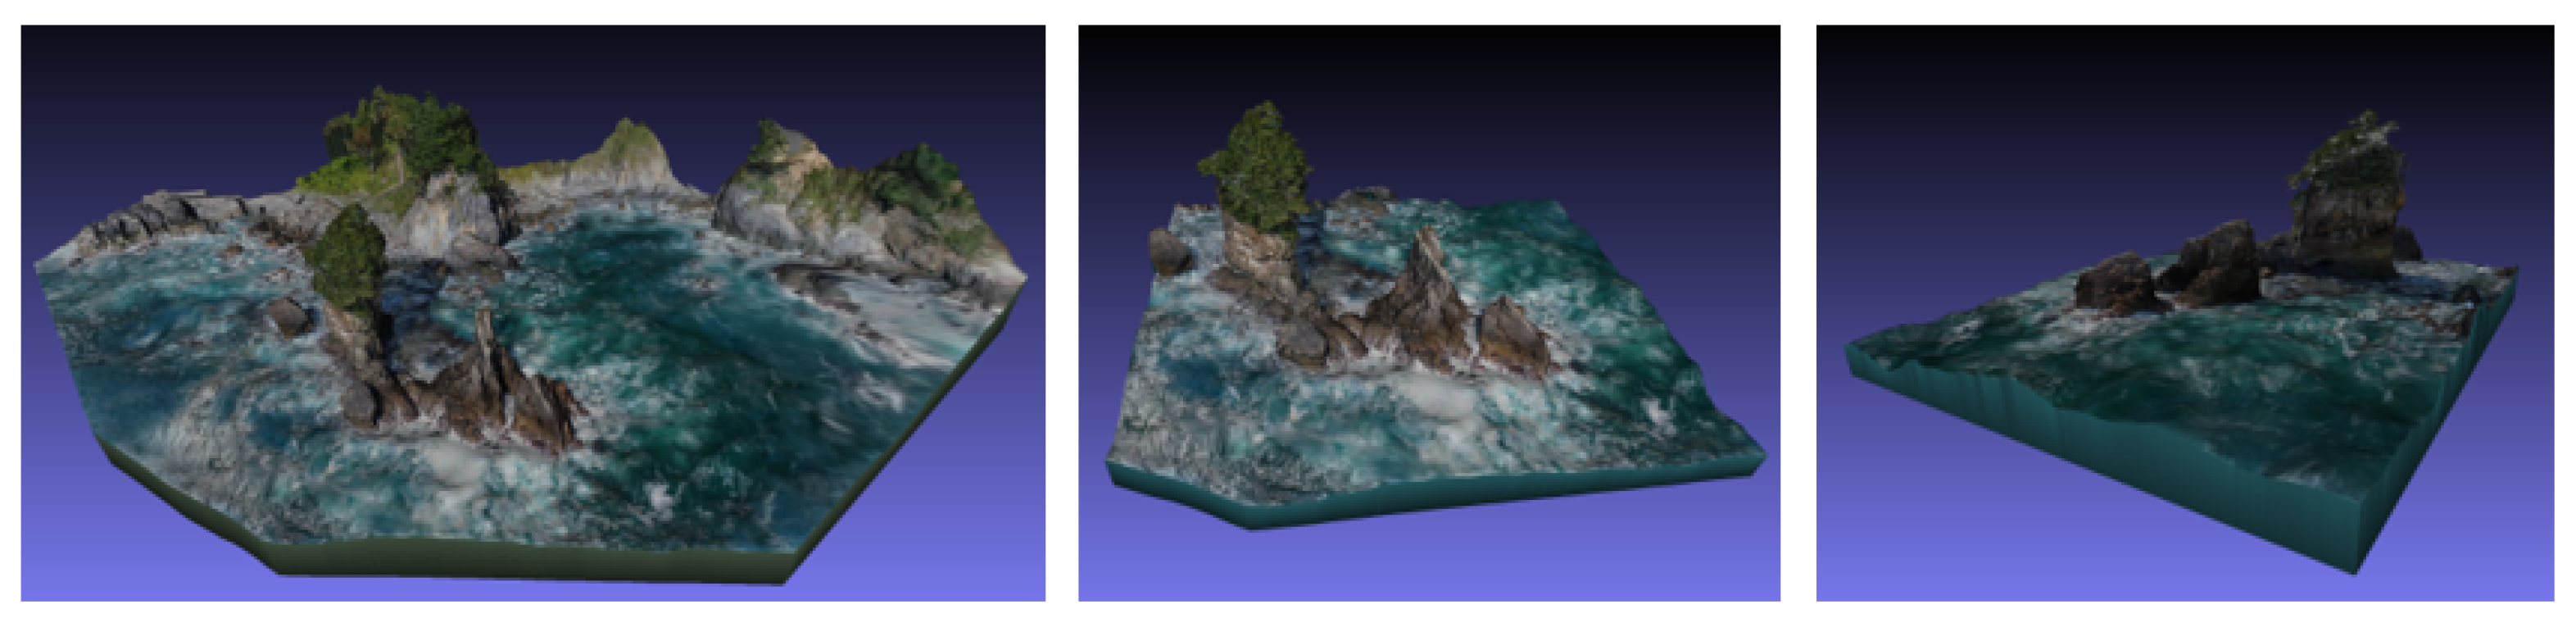
In this step, we modeled the segmented area with Geomagic Design X, and divided the data into six segments based on the modeling results, as shown in
Figure 12. Because of the limited space inside the 3D printer, we used the split model to print the segments separately, and then finally assembled both segments to produce the complete model.
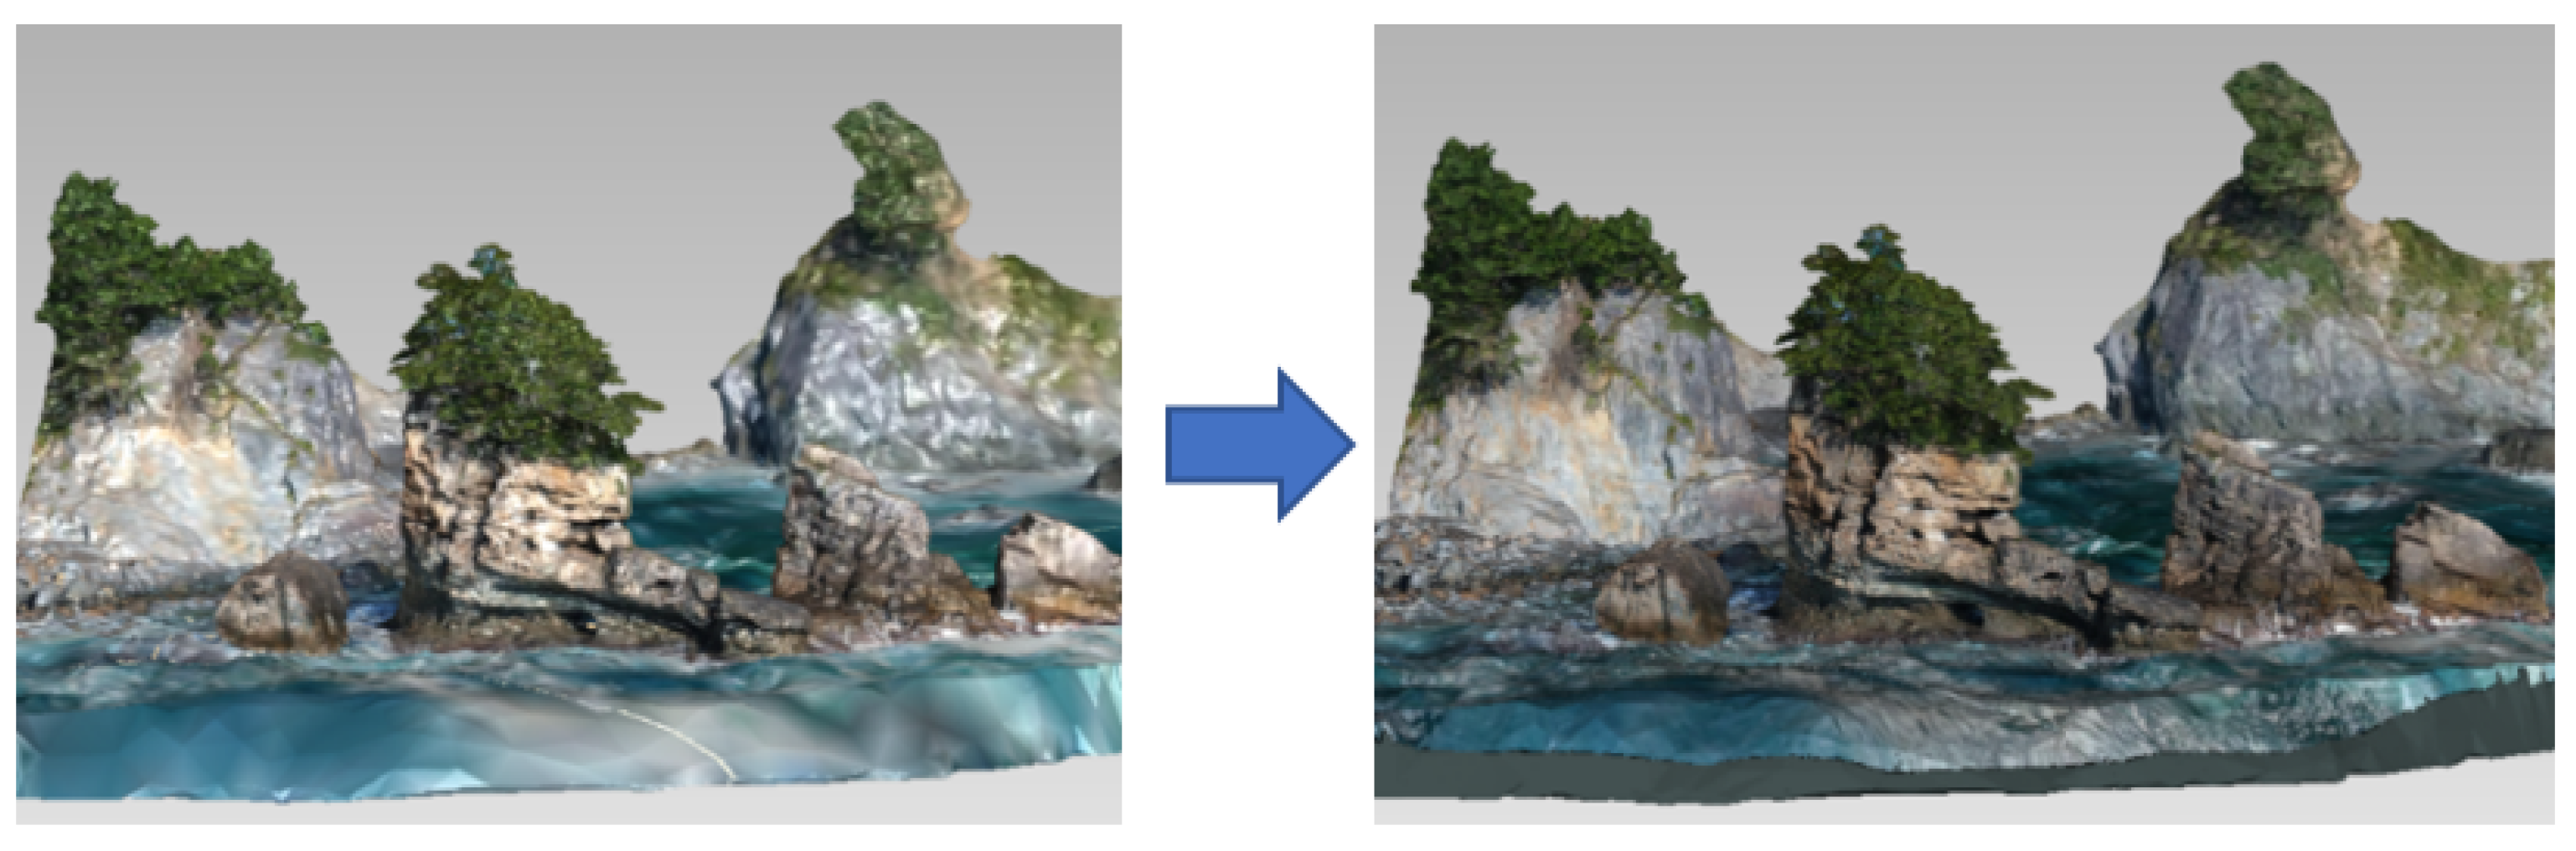
Next, to enhance the contrast of the model colors and make the model appear more natural, the texture mapping process was repeated using the texture information added to the original data, as shown in
Figure 13.
After the 3D printing fixes had been applied, the mesh color files were converted to “Vrml2” format.
Figure 14 shows the 3D printer model, which consists of a closed triangulated polygonal model. As explained above, in this study we used POLYGONALmeister, which has powerful modify/edit functions for polygonal models.
3.3. Calculation of Rock Size, Volume and Weight
We measured the maximum heights of the rocks using the Fusion 360 (Autodesk, Inc., San Rafael, CA, USA) program and compared these values to the heights obtained from geological survey data. As shown in
Table 1, the modeled results are comparable to the actual heights of the rocks.
The volume of the rocks was also calculated using Fusion 360. Since the rocks were composed of sandstone and a conglomerate deposited by the ocean [
9], we estimated the densities of the sandstone and conglomerate to be 2.3 t/m
3 and 1.8 t/m
3, respectively [
10]. We therefore adopted a value of 2.1 t/m
3 to estimate the weight of the rocks. As shown in
Table 2, by multiplying the calculated volume and the density, the weight of the three rocks was also obtained.
3.4. Printing 3D Models Using 3D Printers
In this study, we used two different 3D printers to print our rock formation models: a Z250 (Z Corp., Rock Hill, SC, USA) and a J750 (Stratasys, Ltd., Eden Prairie, MN, USA). The Z250 3D printer uses high-performance composite powder to print a build size 3D model measuring 45.1 × 35.2 × 11.1 cm, as shown in
Figure 15, while the J750 printer has a build size of 35.6 × 20.3 × 12.7 cm. While the rock formation models printed with the J750 printer are more expensive than those printed with the Z250, they are also more detailed, as shown in
Figure 16. The J750 model cost USD 273 to produce, while the Z250 model cost approximately six times less at USD 45.
To analyze the effects of different materials and printers on the model data, we measured the heights of the rocks in the two models separately and presented the results in
Table 3. The comparisons showed that the J750 model was 99.1% accurate, due to its more precise capabilities and the higher quality of the materials used. The accuracy of the model produced using the Z250 model, which was produced before the J750, fluctuated between 95.6 and 98.9% accuracy. These results show that the printer model and quality of the 3D printing material affect the accuracy of the printed models, and that, due to technological advancements, newer 3D printers are more accurate than older versions.
4. Discussion
In recent years, 3D measurements have become widely used at both small and large scales in a variety of indoor and outdoor settings and applications [
11]. Using laser scanning technology, we can now precisely measure building interiors, narrow streets, shops, and parks [
12]. However, static laser-measurement devices have limitations, in that they can only be used in completely stationary and secure locations, and they cannot typically be operated remotely [
13]. Given these limitations, static laser-measurement devices cannot normally be used for 3D measurements of complex terrains [
14,
15]. However, camera-equipped drones can be used to acquire photographic images, and the resulting data can be used to generate 3D models, such as those of the offshore rock formation measurements that were performed in this study.
We measured the height and volume of the digital model and estimated the weight of the rock based on its density. Although the accuracy of the model is yet to be confirmed, this method provides a new technique for measuring large geographical objects. In the future, as the accuracy of 3D measurements improves, the precision of the model will also improve and more accurate heights and volumes will be obtained.
Finally, we fabricated miniature true-to-scale models with 3D printers. Unlike digital models, the 3D-printed models can be handled directly, which means that this method is well suited for use in exhibitions, school curriculum materials, and as molds for mass-produced souvenirs. Furthermore, the process of fabricating a 3D printed model is not limited by geographical distance. Once a person saves a digital model online, it can be printed by users thousands of miles away, which significantly reduces the time cost associated with sending models to different sites.
This method, which provides a safe, convenient, and cost-effective means of gathering observation data remotely, is not limited to the measurement of coastal rocks. It can also be used in areas with complex terrain or areas that are potentially dangerous, such as uninhabited volcanic areas, nuclear contaminated areas, tunnels, and sinkholes.
Numerous previous studies have been conducted on the use of 3D models as part of geological investigations [
16]. However, those models were typically restricted to visual representations and are thus less suitable for scientific analysis and direct comparisons. The novelty of the method described in this study is that it allows experimental results to be compared by combining 3D geographic data with other existing data, facilitating conclusions that are more theoretically based [
17].
5. Conclusions
In this study, we used a camera-equipped drone to capture 1015 high-resolution photographic images of the coastal Sanouiwa rock formation, and then processed those images to generate precise point cloud data using SfM techniques. We also used GNSS location data to precisely mark the rocks’ positions to the global coordinate system.
To create polygonal models from point cloud data, we utilized an automated triangulation function extracted from the point dataset to interactively edit the triangular model and performed further trimming, noise reduction, and color adjustments to the created 3D model.
We also measured the height and volume of the 3D model and then estimated the weight of the rocks based on their density. In so doing, we developed a novel and potentially viable measurement method for use in geological applications.
Finally, we used 3D printers to fabricate precise replicas of the Sanouiwa rock formation for use as museum displays, environmental protection awareness efforts, and souvenirs for local tourism initiatives. The data collected from the generated rock models can also be used for 3D analysis and processing, which could facilitate a number of functions, such as helping people to identify rocks, plants, and other coastal features by color or shape. Such data could also be used to simulate the reconstruction and planning of tourist areas through the creation of software-based 3D models.
Author Contributions
Conceptualization, Zhiyi Gao, Akio Doi; data measurement and 3D mesh generation, Zhiyi Gao, Kenji Sakakibara, Masahiro Harata; 3D printing model, Zhiyi Gao; funding acquisition, Akio Doi; supervision, Akio Doi; visualization, Zhiyi Gao; writing—original draft, Zhiyi Gao, Akio Doi; writing—review and editing, Zhiyi Gao, Akio Doi, Kenji Sakakibara, Masahiro Harata, Tomonaru Hosokawa; Volume detection, Zhiyi Gao. All authors have read and agreed to the published version of the manuscript.
Funding
This work was funded by research grants from the Iwate Prefectural University Academic Research Fund (Regional Policy Research Center).
Institutional Review Board Statement
Not applicable.
Informed Consent Statement
Not applicable.
Data Availability Statement
Data sharing is not applicable to this article.
Acknowledgments
We are deeply grateful to S. Daibou of the “Tsunami Taro” Nonprofit Corporation for his helpful advice throughout this study.
Conflicts of Interest
The authors declare they have no conflicts of interest.
References
- Sanriku Geopark. 2021. Available online: https:sanriku-geo.com/geosite/60/ (accessed on 1 March 2021).
- Introduction Page of Sanouiwa. Available online: https://www.city.miyako.iwate.jp/kanko/tuukou_huka.html (accessed on 1 March 2021).
- Gao, Z.; Satoh, K.; Doi, A.; Sakakibara, K.; Hosokawa, T.; Harada, M.; Konno, T. 3D Modeling of cultural property gardens and utilization for acceleration of disaster reconstruction. In Proceedings of the 23rd International Symposium of Artificial Life and Robotics, B-Con Plaza, Beppu, Japan, 18–20 January 2018. [Google Scholar]
- Cina, A.; Dabove, P.; Manzino, A.M.; Piras, M. Network Real Time Kinematic (NRTK) Positioning—Description, Architectures and Performances. In Satellite Positioning-Methods, Models and Applications; InTech: London, UK, 2015. [Google Scholar] [CrossRef]
- Shapiro, L.G.; Stockman, G.C. Image Processing and Computer Vision; Pearson: London, UK, 2001; ISBN 0-13-030796-3. [Google Scholar]
- Nyimbili, P.H.; Demirel, H.; Seker, D.Z.; Erden, T. Structure from Motion (SfM)—Approaches and Applications. In Proceedings of the International Scientific Conference on Applied Sciences, Antalya, Turkey, 27–30 September 2016. [Google Scholar]
- Su, X.-Y.; Zhang, Q.-C. Dynamic 3-D shape measurement method: A review. Opt. Lasers Eng. 2010, 48, 191–204. [Google Scholar] [CrossRef]
- Gao, Z.; Doi, A.; Sakakibara, K.; Hosokawa, T.; Harada, M. 3D Measurement and Modeling for Gigantic Rocks at the Sea. In Advances in Network-Based Information Systems. NBiS 2018; Lecture Notes on Data Engineering and Communications Technologies; Barolli, L., Kryvinska, N., Enokido, T., Takizawa, M., Eds.; Springer: New York, NY, USA, 2019; Volume 22. [Google Scholar]
- Shimazu, M.; Keiji, T.; Yoshida, S. Geology of the Taro Region. Geological Study of the Region. Akita (6) No. 18. 1970. [Google Scholar]
- Vitz, E.; Moore, J.W.; Shorb, J.; Prat-Resina, X.; Wendorff, T.; Hahn, A. Density of Rocks and Soils—Chemistry LibreTexts; Chemical Education Digital Library (ChemEd DL). 2020. Available online: https://chem.libretexts.org/Ancillary_Materials/Exemplars_and_Case_Studies/Exemplars/Geology/Density_of_Rocks_and_Soils (accessed on 1 May 2021).
- Higuchi, H.; Fujii, H.; Taniguchi, A.; Watanabe, M.; Yamashita, A.; Asama, H. 3D Measurement of Large Structure by Multiple Cameras and a Ring Laser. J. Robot. Mechatron. 2019, 31, 251–262. [Google Scholar] [CrossRef]
- Liu, S.; Zhang, Y.; Shao, T.; Yuan, M. Research on 3D measurement model by line structure light vision. J. Image Video Proc. 2018, 88, 1–10. [Google Scholar] [CrossRef]
- Gong, Z.; Sun, J.; Zhang, G. Dynamic measurement for the diameter of a train wheel based on structured-light vision. Sensors 2016, 16, 564. [Google Scholar] [CrossRef] [PubMed]
- Zheng-You, Z. A flexible new technique for camera calibration. IEEE Trans. Pattern Anal. Mach. Intell. 2000, 22, 1330–1334. [Google Scholar] [CrossRef]
- Tsai, R.Y. A versatile camera calibration technique for high-accuracy 3D machine vision metrology using off-the-shelf TV cameras and lenses. IEEE J. Robot. Autom. 1987, 3, 323–344. [Google Scholar] [CrossRef]
- Hasiuk, F.; Harding, C. Touchable topography; 3D printing elevation data and structural models to overcome the issue of scale. Geol. Today 2016, 32, 16–20. [Google Scholar] [CrossRef]
- van Riel, S. Exploring the Use of 3D GIS as an Analytical Tool in Archaeological Excavation Practice. Master’s Thesis, Archaeology-Lund University, Lund, Sweden, 2016; p. 16. [Google Scholar]
| Publisher’s Note: MDPI stays neutral with regard to jurisdictional claims in published maps and institutional affiliations. |
© 2021 by the authors. Licensee MDPI, Basel, Switzerland. This article is an open access article distributed under the terms and conditions of the Creative Commons Attribution (CC BY) license (https://creativecommons.org/licenses/by/4.0/).


