Article

Evaluating and Visualizing Drivers of Coastline Change: A Lake Ontario Case Study

by
Meredith Caspell
1 and
Liette Vasseur
1,2,*
1
Environmental Sustainability Research Centre, Faculty of Social Sciences, Brock University, 1812 Sir Isaac Brock Way, St. Catharines, ON L2S 3A1, Canada
2
Department of Biological Sciences, UNESCO Chair in Community Sustainability: From Local to Global, Brock University, 1812 Sir Isaac Brock Way, St. Catharines, ON L2S 3A1, Canada
*
Author to whom correspondence should be addressed.
ISPRS Int. J. Geo-Inf. 2021, 10(6), 375; https://doi.org/10.3390/ijgi10060375
Submission received: 25 April 2021 / Revised: 20 May 2021 / Accepted: 26 May 2021 / Published: 2 June 2021

Abstract

:
Environmental and climatic changes are disproportionately felt in coastal communities, where drivers of coastline change are complicated with continued development. This study analyzed the coastline change of Lake Ontario in the Town of Lincoln, Ontario, Canada, using a mixed-methods two-phased approach that is novel to the study area. The first phase of the methodology included a coastline change analysis using historical aerial photographs in a geographic information system to identify the most vulnerable sections of the coastline. To better understand the calculated changes, the second phase explored the roles of select climatic and non-climatic drivers of coastline change, such as historic storms and land use changes. The results indicated that four main areas of Lincoln’s coast were more vulnerable, with rates of erosion between −0.32 and −0.66 m/yr between 1934 and 2018. Sections of coastline that had less erosion included those that were more heavily vegetated, attempted a cooperative protection approach, or utilized revetment stones in areas without steep banks. This methodology can help municipalities understand coastline change in a more holistic way to increase their adaptive capacity and allows for the creation of useful visualizations that better communicate to residents and town staff the level of vulnerability of their coasts.

1. Introduction

Coastal zones are among of the most valuable ecosystems on earth, offering a range of ecosystem services that provide physical, economic, and social benefits [1]. There is a sustained migration of the global population to these zones, supporting roughly 50% of human populations [2]. With this influx of people comes an increased modification of natural coastlines. Human activities within coastal communities are increasingly adding pressure on these ecosystems. They are disrupting the naturally dynamic processes, making coastline increasingly vulnerable to any stressor. Climate change adds an additional layer to the complexity of coastal vulnerability, as communities are increasingly exposed to natural hazards, such as storm surges, that threaten these ecosystems [3].
Coastline changes are the result of interacting drivers of change, experienced at the local scale. These drivers can be social, political, economic, climatic or environmental [4]. Yet, non-climatic drivers of change are rarely considered in the same depth in climate change analyses [5,6]. The role of human influence on the rate of coastal change needs to be considered in assessing coastal vulnerability [7]. For example, protection measures are an important anthropogenic driver of coastline change as they interrupt the natural processes [7]. Land use changes within urban and rural areas, including changes in the road network [6], groundwater flow patterns near the coastline [8], and surficial geology can also influence coastal processes and the evolution of the coast [9,10]. For simplicity, in this study, all drivers are classified into two main categories: climatic and non-climatic; where climatic factors can include weather events or parameters influenced by climate such as water levels, and non-climatic factors include anthropogenic actions such as land use changes, and geological or biophysical characteristics of the land such as shoreline orientation.
Vulnerability is the second component of the concept of risk, with the first component being hazards [11]. In the IPCC AR5 report, vulnerability is the “propensity or predisposition to be adversely affected. Vulnerability encompasses a variety of concepts and elements including sensitivity or susceptibility to harm and lack of capacity to cope and adapt” [12] (p. 1048). At the community level, disaster resilience, defined as how communities prepare to and recover from hazards [13], relates to the capacity to respond and recover [14]. Understanding the drivers of vulnerability is often overlooked in resilience or adaptation planning as there is a tendency to focus on the hazard instead of the community’s vulnerability [15]. Drivers can influence the capacity of a community to deal with hazards [16]. Research has shown that coastal vulnerability is geographically dependent, requiring place-based comprehensive investigations that include physical, socioeconomic, and ecological components [17].
Coastal communities are becoming increasingly aware of the potential impacts that natural hazards can bring. In response, many communities have initiated discussion, planning or development of adaptation plans to respond to these changes. Yet, a study in Quebec reports that 100% of respondents (local and regional authorities) believe that their communities are not adequately prepared or equipped to adapt to coastal hazards [18]. Many barriers to implementing climate action have been identified in the Canadian context, including the lack of awareness, or understanding of local impacts [19]. Visualizing coastal changes to better understand coastal vulnerability is a powerful tool that is gaining traction and will be useful as coastal communities continue to develop their coastlines [20]. Such visualization tools can help better understand coastal vulnerabilities at the community level and to think about the type of adaptation that can be used to reduce risks in the future. This study only examines vulnerabilities and does not examine issues related to disaster risk reduction, although both can be related if a community aims to use the UNDRR guidelines (2007).
In this study, a mixed-methods explanatory sequential approach for understanding coastline change and vulnerability was developed by evaluating the coastline changes of Lake Ontario in the Town of Lincoln, Ontario, Canada. The first phase of the methodology included a coastline change analysis using historical aerial photographs in a geographic information system to identify the most vulnerable sections of the coastline. To better understand the calculated changes, the second phase explored the roles of select climatic and non-climatic drivers of coastline change, such as historic storms and land use changes. This approach was based on a combination of different tools and methodologies that utilize historical aerial photographs in a geographic information system to identify the most vulnerable areas of a coastline, followed by an investigation into select climatic and non-climatic drivers of these changes. The overall coastline change analyses of the Great Lakes region have been completed in the past, which have included parts of the case study area [21]; however, a study that also evaluated the drivers of change in this area had not yet been conducted. The scalability of this approach can benefit those seeking to reduce their coastal vulnerability and the visualization of coastline change may aid in long-term planning for coastal communities.

2. Materials and Methods
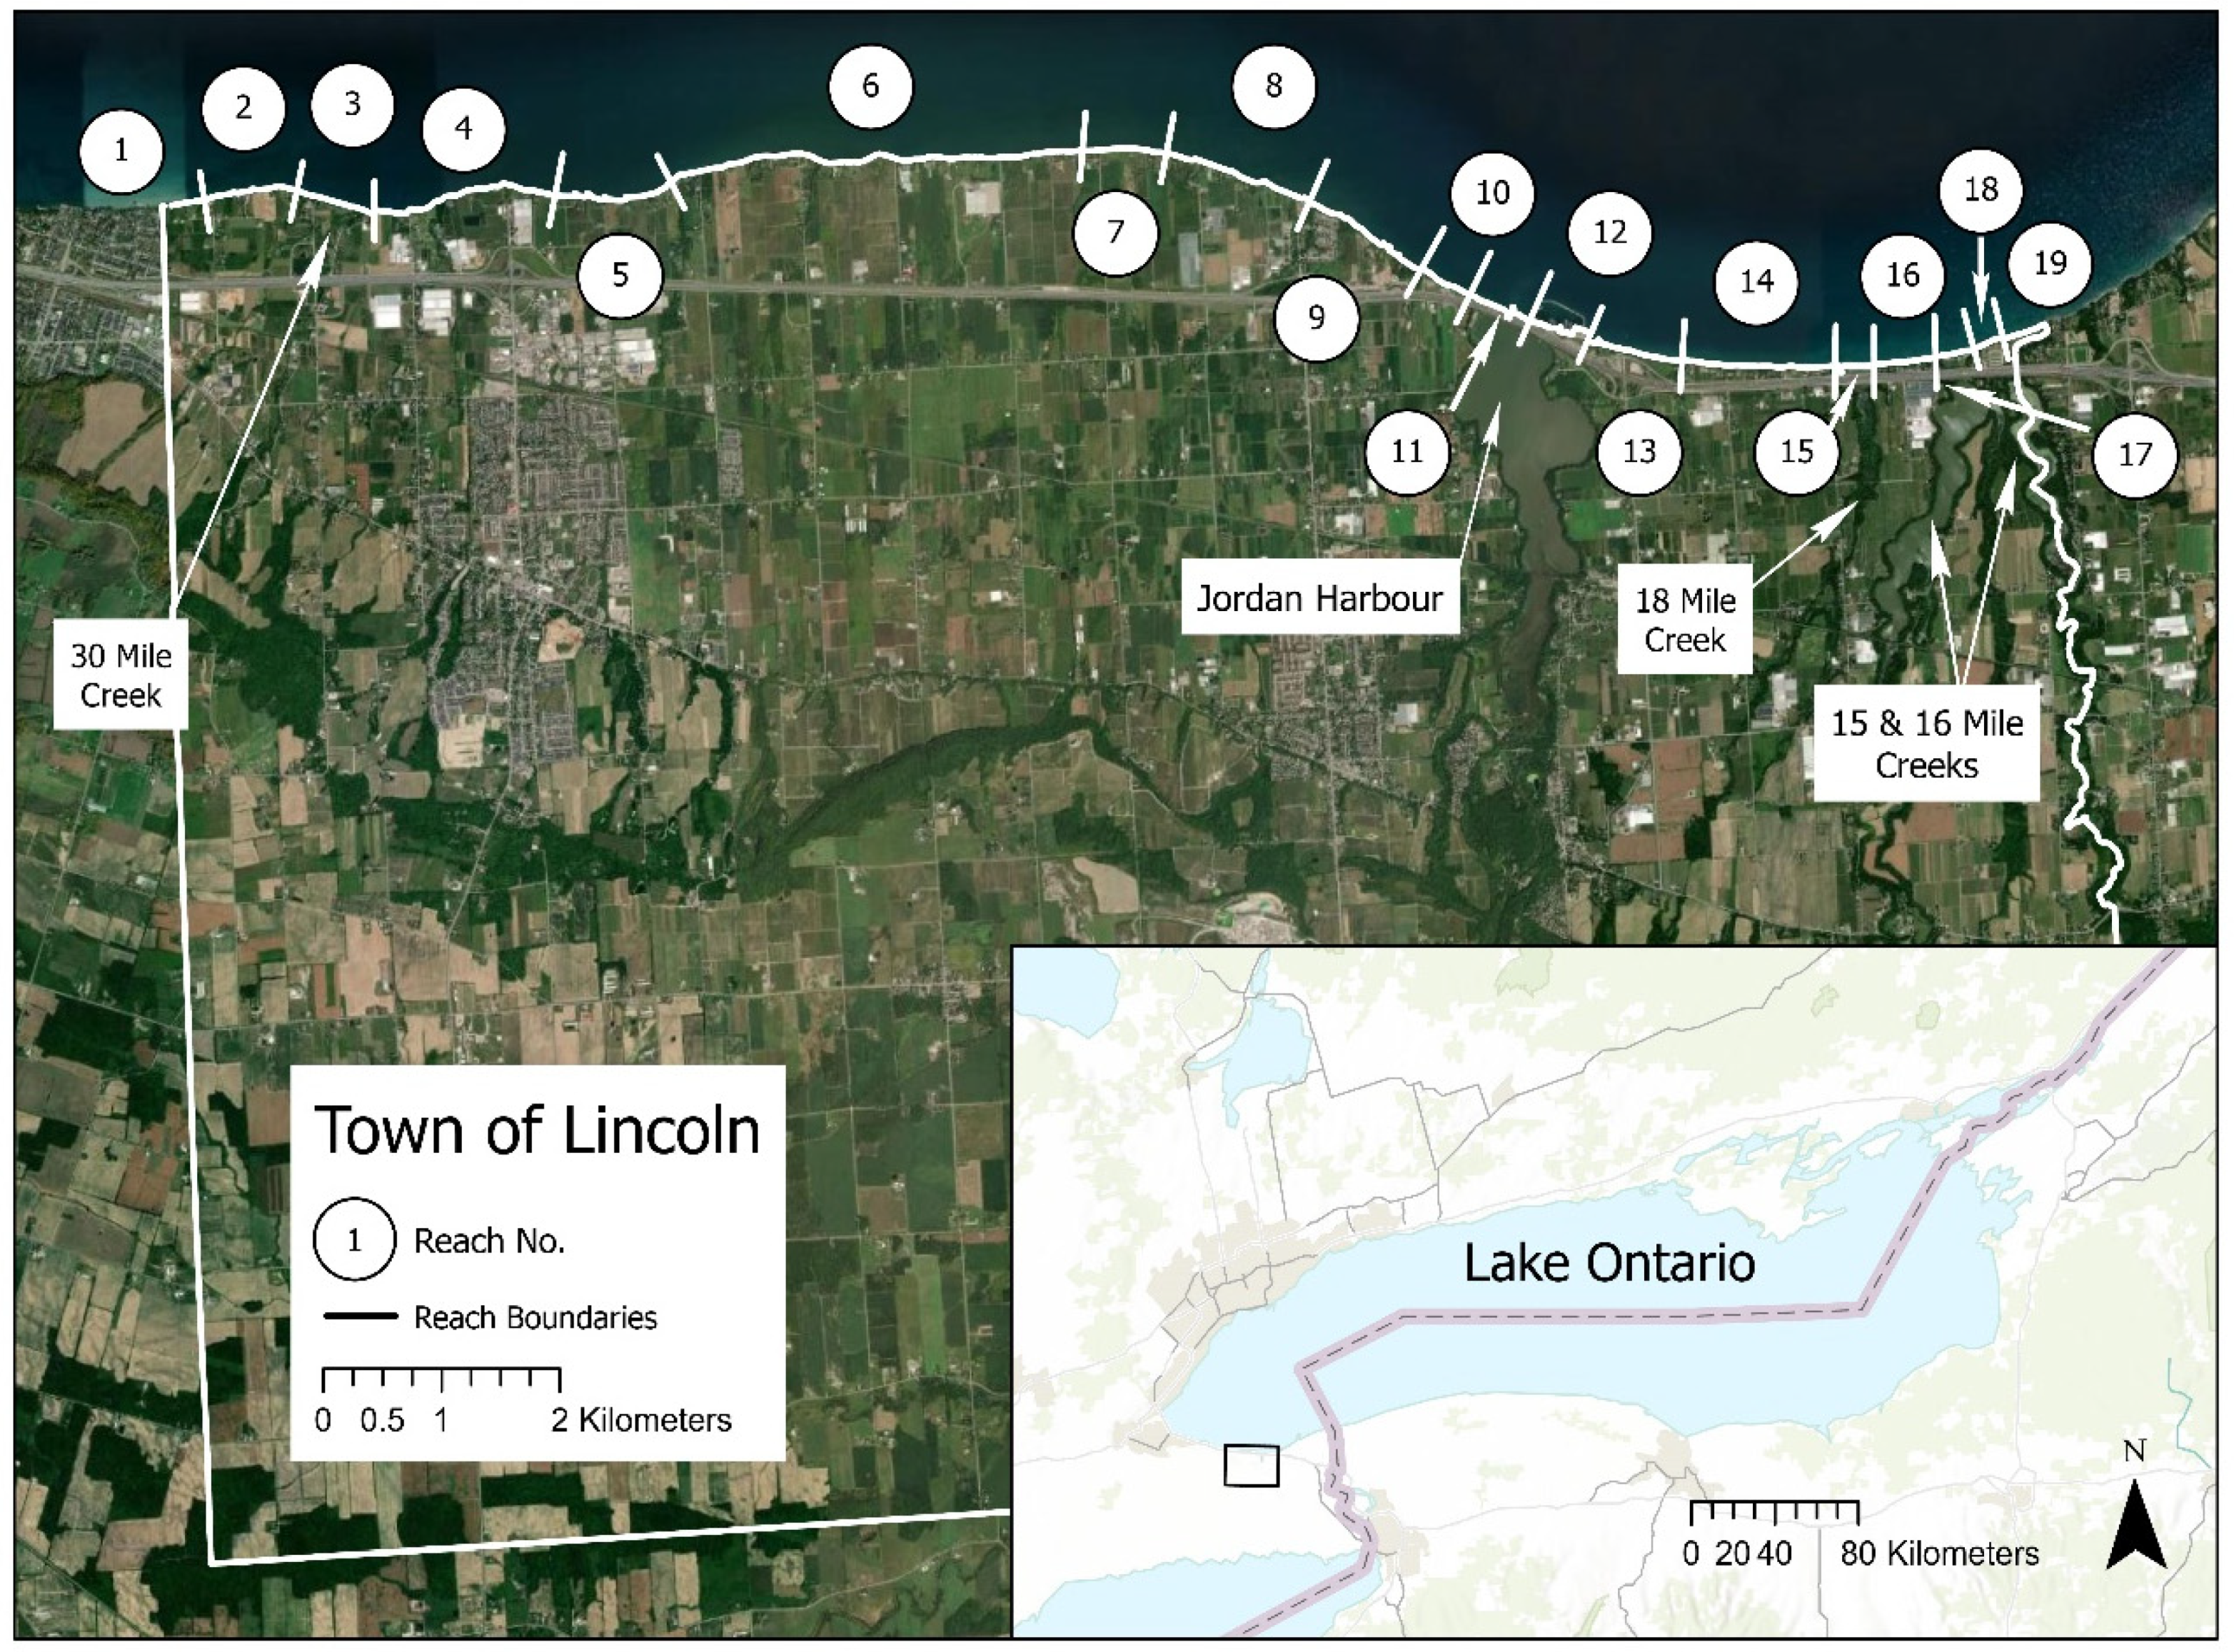
2.1. Case Study

The Town of Lincoln (43°9′10″ N, 79°25′6″ W) is located in the Niagara Region of Ontario, Canada with the northern boundary following the southwest shore of Lake Ontario (Figure 1). Lincoln was incorporated as a municipality in 1970, comprising the communities of Beamsville, Vineland, Jordan, Campden, Tintern and Rockway. It lies on major transportation routes, such as the Queen Elizabeth Way (QEW) and the Canadian National Railway, connecting the Greater Toronto Area to the United States. Lincoln covers a total area of 162.9 km2. Of this, nearly 60 per cent is designated prime farmlands [22], with a significant portion falling within the Niagara Greenbelt Plan, which provides protection to significant ecological and hydrological features [23]. The population of Lincoln is currently nearing 24,000 [24] and is expected to increase up to 32,000 over the next 15 years [25].
The key geologic feature that influences Lincoln is the Niagara Escarpment, which was created through differential erosion of various layers of sedimentary rock [26]. From north to south, there are four topographic features that transect Lincoln: the Haldimand Clay Plain above the escarpment; and the Lake Iroquois Plain, Lake Iroquois Bench, and Vinemount Moraine below the escarpment [27]. Quaternary surficial geology along the Lincoln coastline is predominantly Lake Iroquois stratified sands and Halton till towards the west [28]. Lake Iroquois and Lake Ontario beach and bar deposits are located across the coastline with stream and pond deposits at the mouths of the main tributaries [28]. Streamflow through the Town is generally from south to north, off the Niagara Escarpment and into Lake Ontario. The study did not include the entire municipality, but the approximately 20 km of coastline and up to 5 km inland.
Lake Ontario, the last lake in the chain of Great Lakes, is connected to the St. Lawrence Seaway, which includes the St. Lawrence River and the Gulf of St. Lawrence. The Great Lakes and St. Lawrence River watershed hold 20% of the earth’s freshwater, containing a high diversity of species of plants, wildlife, and fish [29]. A recent Hazard Impact and Risk Assessment workshop report [30] highlights the 18 top risks and hazards for the Niagara Region, including: water quality emergency, transportation emergency, key infrastructure failure, sustainable food systems, land use change, extreme snow/rain, flooding, wind storm, power failure, tornadoes, drought, earthquakes, and extreme temperatures. One of the latest extreme weather events was the flooding in 2017 where Lincoln experienced back-to-back extreme rainfall events that resulted in approximately CAD $1 million damage. Recent 2019 wind and ice storms in the Niagara Region have also caused damage such as flooding and infrastructure damage along the coastal communities at a cost of CAD $1.6 million. The assessment of coastal vulnerability is therefore critical for Lincoln as they plan future development along Lake Ontario and its tributaries.
The methodological approach for understanding coastline change included first defining the most vulnerable areas of the physical coastline, followed by an investigation into select drivers of change (Figure 2). The explanatory sequential mixed methods research design [31] allows for quantitative results from the first phase to inform and guide the qualitative data collection and evaluation in the second phase [32].

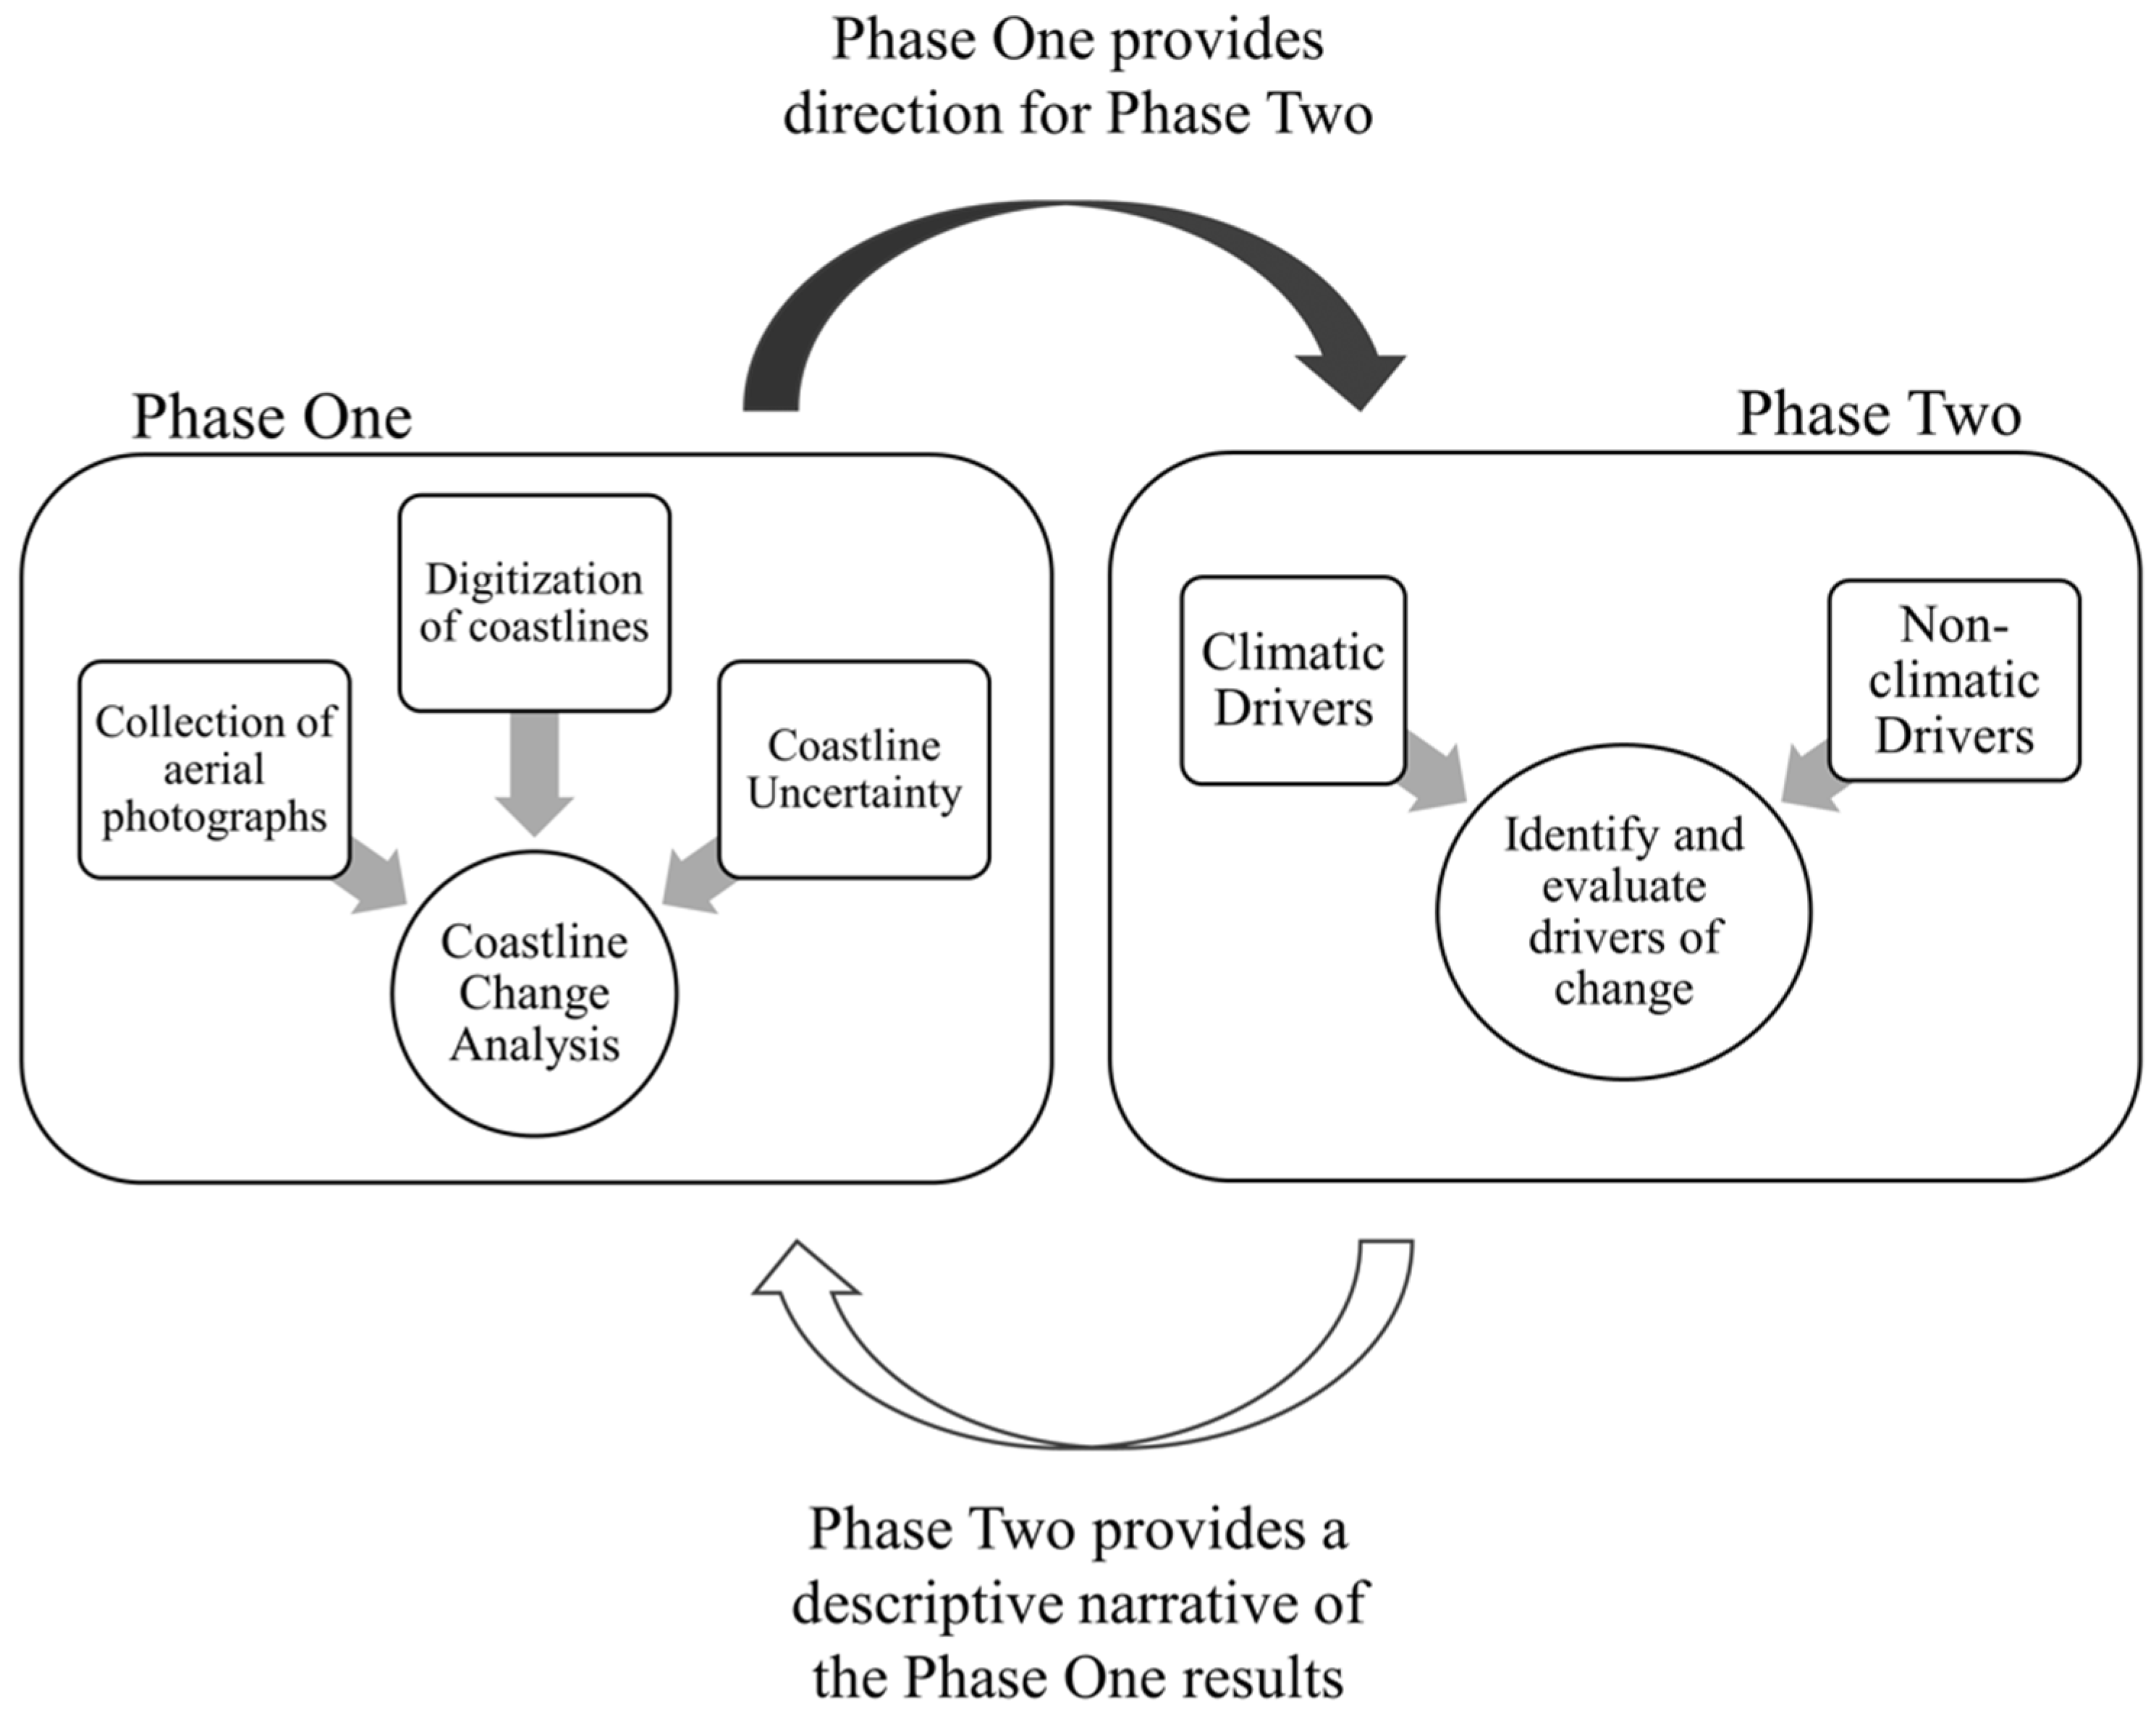
2.2. Phase One—Coastline Change Analysis

Phase One (coastline change analysis) consisted of a five-step process to calculate the rate of change across the coastline using historical aerial photographs to identify sections (or reaches) of the coastline more vulnerable to change over different time frames (Figure 3). Each step is explained in further detail in the subsections below.

2.2.1. Collection of Aerial Photographs

The first step involved the acquisition of historical aerial photographs. To gain as much historical context as possible, aerial photographs were obtained as far back in time as possible and then at least one per decade, including the most recent available image. The photographs were selected based on availability, coverage, photo scale, image type, and contrast. Nine aerial images were acquired from 1934 to 2018 (Table 1), which were all at an appropriate scale to minimize coastline position errors. Aerial photographs used were georeferenced to the same projection and orthorectified (when possible) to have the effects of relief displacement removed, so that distances and angles could be accurately measured [33]. It is often difficult to orthorectify older images, as a digital elevation models or reliable landmarks are often unavailable [34]. Historical aerial images for Lincoln were rectified based on the high resolution 2015 orthoimage; therefore, all rectified images were comparable.

2.2.2. Coastline Digitization

The coastline of each aerial photograph was digitized using the definition of the coastline as the geomorphic influence of the water body [35] using a combination of the vegetation line [36] and top of bank proxies, depending on the section of coastline. This combination of proxies was selected due to the heterogenous nature of the Lincoln coastline from vegetated dynamic beaches to steep bluffs. This selection of proxies was used as they are not dependent on the prevailing conditions during the flights as other proxies, such as the high-water line. This reduced the coastline position uncertainty between years, as daily or seasonal cycles did not need to be heavily considered.
The following criteria were used for delimiting the top of bank/vegetation line proxy in such a way that it could be replicated in other studies during the digital interpretation of the coastline:
  • Where the top of bank was not available or visible, the unbroken canopy edge (vegetation line) was used.
  • In places where there was no vegetation and an artificial structure was observed at the coastline, the top of the artificial structure (for example, top of a seawall) was interpreted as the coastline.
    If there was a hardened protection barrier at the bottom of an obviously eroding slope, the top of bank was used.
    If a stairwell-type wall was observed, the highest step was considered the top of bank.
  • When the mouth of a creek was encountered (and a sandbar was not present), the coastline was assumed to cut across to meet the opposite side of the creek.
    If there was a sandbar or beach with trees present across the mouth of a creek, the vegetation line of the sandbar was used.
To reduce bias or influence of coastline interpretation, no other previously digitized coastlines from other years were visible during the digitization process of each image [37]. Once all coastlines were vectorized, they were visually compared to identify any discrepancies. Areas with visibly significant differences between years were investigated further to ensure consistency in interpretation. Particular attention was paid when instances of extreme erosion or accretion were observed or when hardened structures were present. For example, if a wave break was present over multiple images, whether to include the entire concrete structure as part of the coastline was kept consistent from image to image.

2.2.3. Coastline Position Uncertainty

Various methods for calculating coastline position accuracy [38,39] require high-accuracy reference information that is often absent from historical maps or aerial photographs [37]. As a result, the positional uncertainty was calculated for each image using the root mean squared error (RMSE) formula [37,40]:
R M S E O = ( R M S E B ) 2 + ( R M S E G ) 2 + ( R M S E I ) 2 ,
where:
R M S E O = Overall RMSE
R M S E B = Base image RMSE
R M S E G = Georeferencing RMSE
R M S E I = Interpretation RMSE.
Wernette, et al. [37] describe the formulas for calculating each separate error type (RMSEB, RMSEG, and RMSEI). The RMSE associated with the base image, georeferencing, and interpretation errors were determined for each coastline (year), where information was available. The base image accuracy was obtained from the metadata or from the physical photograph, where available (Table 2). For example, the 2018 orthoimage retrieved from the Niagara Region was accompanied by an information sheet by First Base Solutions (the contracted company who captured and processed the images) that included the flight line and image data, resolution, as well as the accuracy information for the x, y, and z coordinates. This level of information was not always found for each image (Table 2).
To ensure interpretation errors are accounted for, it is important to have other professionals independently interpreting segments of the coastlines [37]. This was completed by three GIS professionals who independently delineated three 5-km segments (selected to include a mix of coastline type and more complex areas). Using transects spaced at 50 m, intersects of the three interpreted coastlines were compared and the mean coastline position of each transect was calculated to determine the overall interpretation error:
R M S E I =   d 2 n ,
where: RMSEI = Interpretation RMSE; d2 = squared distance of each intersect from the mean; n = number of coastlines used
As described by Wernette, et al. [37], a more representative overall coastline positional uncertainty can be calculated using RMSE95, which “indicates the distance below which 95% of the positional errors in the image are expected to fall” (p. 3910). This can be obtained from the following formula:
R M S E 95 = 1.7308 * R M S E O .

2.2.4. Coastline Change Analysis

Several methods to calculate the change rate can be used [41,42,43]; however, the most common approach is the manual interpretations of coastlines across various years, which are then analyzed in a GIS software [43]. For our study, the use of the Digital Shoreline Analysis System (DSAS) created by the United States Geological Survey (USGS) was deemed the most appropriate method due to accessibility, flexibility and guidance availability [44]. The DSAS tool is used to calculate the direction, distance and rate of coastal change, in meters per year using different change rate statistics (m/yr), following the method outlined by the DSAS user guide using Esri’s ArcGIS [45]. By determining the rate of change along the coastline, the areas and time frames most vulnerable to erosion can be identified and the evolution of the coastline visualized. To further narrow down the areas and time frames of higher change rates, the Lincoln coastline was divided into 19 reaches (Figure 1) that were previously defined in the most recent Lake Ontario Shoreline Management Plan [46]. In this plan, the coastline was divided into reaches based on stratigraphy, nearshore composition, wave exposure, orientation, nearshore bathymetry, littoral transport characteristics, bluff height, recession rate, flood susceptibility, environmental sensitivity, and land use. A brief description of each reach is summarized in Table 3.
Determining the overall rate of change of each reach using all years available is an informative analysis to see long-term trends (minimum of ten years) as it minimizes error and short-term cyclical changes and is more reliable for planning or policy purposes [41]. However, studies have shown that the addition of a short-term analysis can help identify vulnerable areas due to short-term variability [41] that are masked in the long-term analysis and can give a better understanding of local coastline change [7,47]. Coastline erosion in quaternary surficial soils is not only common, but can often occur more quickly compared to other geological coasts such as granite shores that are more resistant to change [48], increasing the importance of conducting a short-term analysis as well. In our study, a long-term analysis with all available years was conducted, followed by a short-term analysis. The short-term analyses split the available years into the smallest increments possible with years available. Each of these analyses are described in more detail below.
Long-term Analysis: The DSAS tool offers various statistical methods for coastline rate change calculations. The long-term rate change analysis was first conducted using all possible years, dating back as far as possible to calculate the linear regression rate (LRR) of the coastline. This statistic is determined by fitting a least-squares regression line to all coastline points at each transect [45]. Here, LRR was deemed the most robust option as it was inclusive of all years when calculating the statistics. This analysis provided a change rate statistic for each transect, which were summarized across the entire coastline and an average for each of the 19 reaches was calculated to determine the overall coastline trend and the differences in rates across all reaches, respectively.
Short-term Analysis: With climate change causing increased frequency in extreme weather events in many regions of the world, it is important to consider whether the changes have been responding to this increased variability in recent years. A final round of change rate statistics can be calculated to determine if there were changes in change rates for the shortest available time increments. For this analysis, the end-point rate (EPR) statistics can be calculated by averaging the net coastline displacement between two years. For Lincoln, EPRs were calculated for each of the following periods: 1934 to 1954, 1954 to 1965, 1965 to 1972, 1972 to 1981, 1981 to 1994, 1994 to 2006, 2006 to 2015, and 2015 to 2018. This analysis provided a change rate statistic for each transect, which were summarized across the entire coastline and each reach, for all time intervals.

2.2.5. Identification of Vulnerable Areas and Time Frames

Phase One was completed by the identification of areas and time frames that were highly vulnerable to change. To do this, we considered both the long and short-term coastline analyses. The following factors were considered in identifying these areas or patterns:
  • Highest erosion rates from all rounds of analyses—the short-term results might reveal areas or time frames that had higher erosion rates that were muted in the long-term results
  • Percent erosional transects for each section of the coastline and round of analysis to see patterns of erosion versus accretion for certain areas or time frames
  • Maximum erosional transect rate for each section of the coastline and round of analysis. Some areas could be missed without looking at individual transects as many coastlines are heterogeneous.

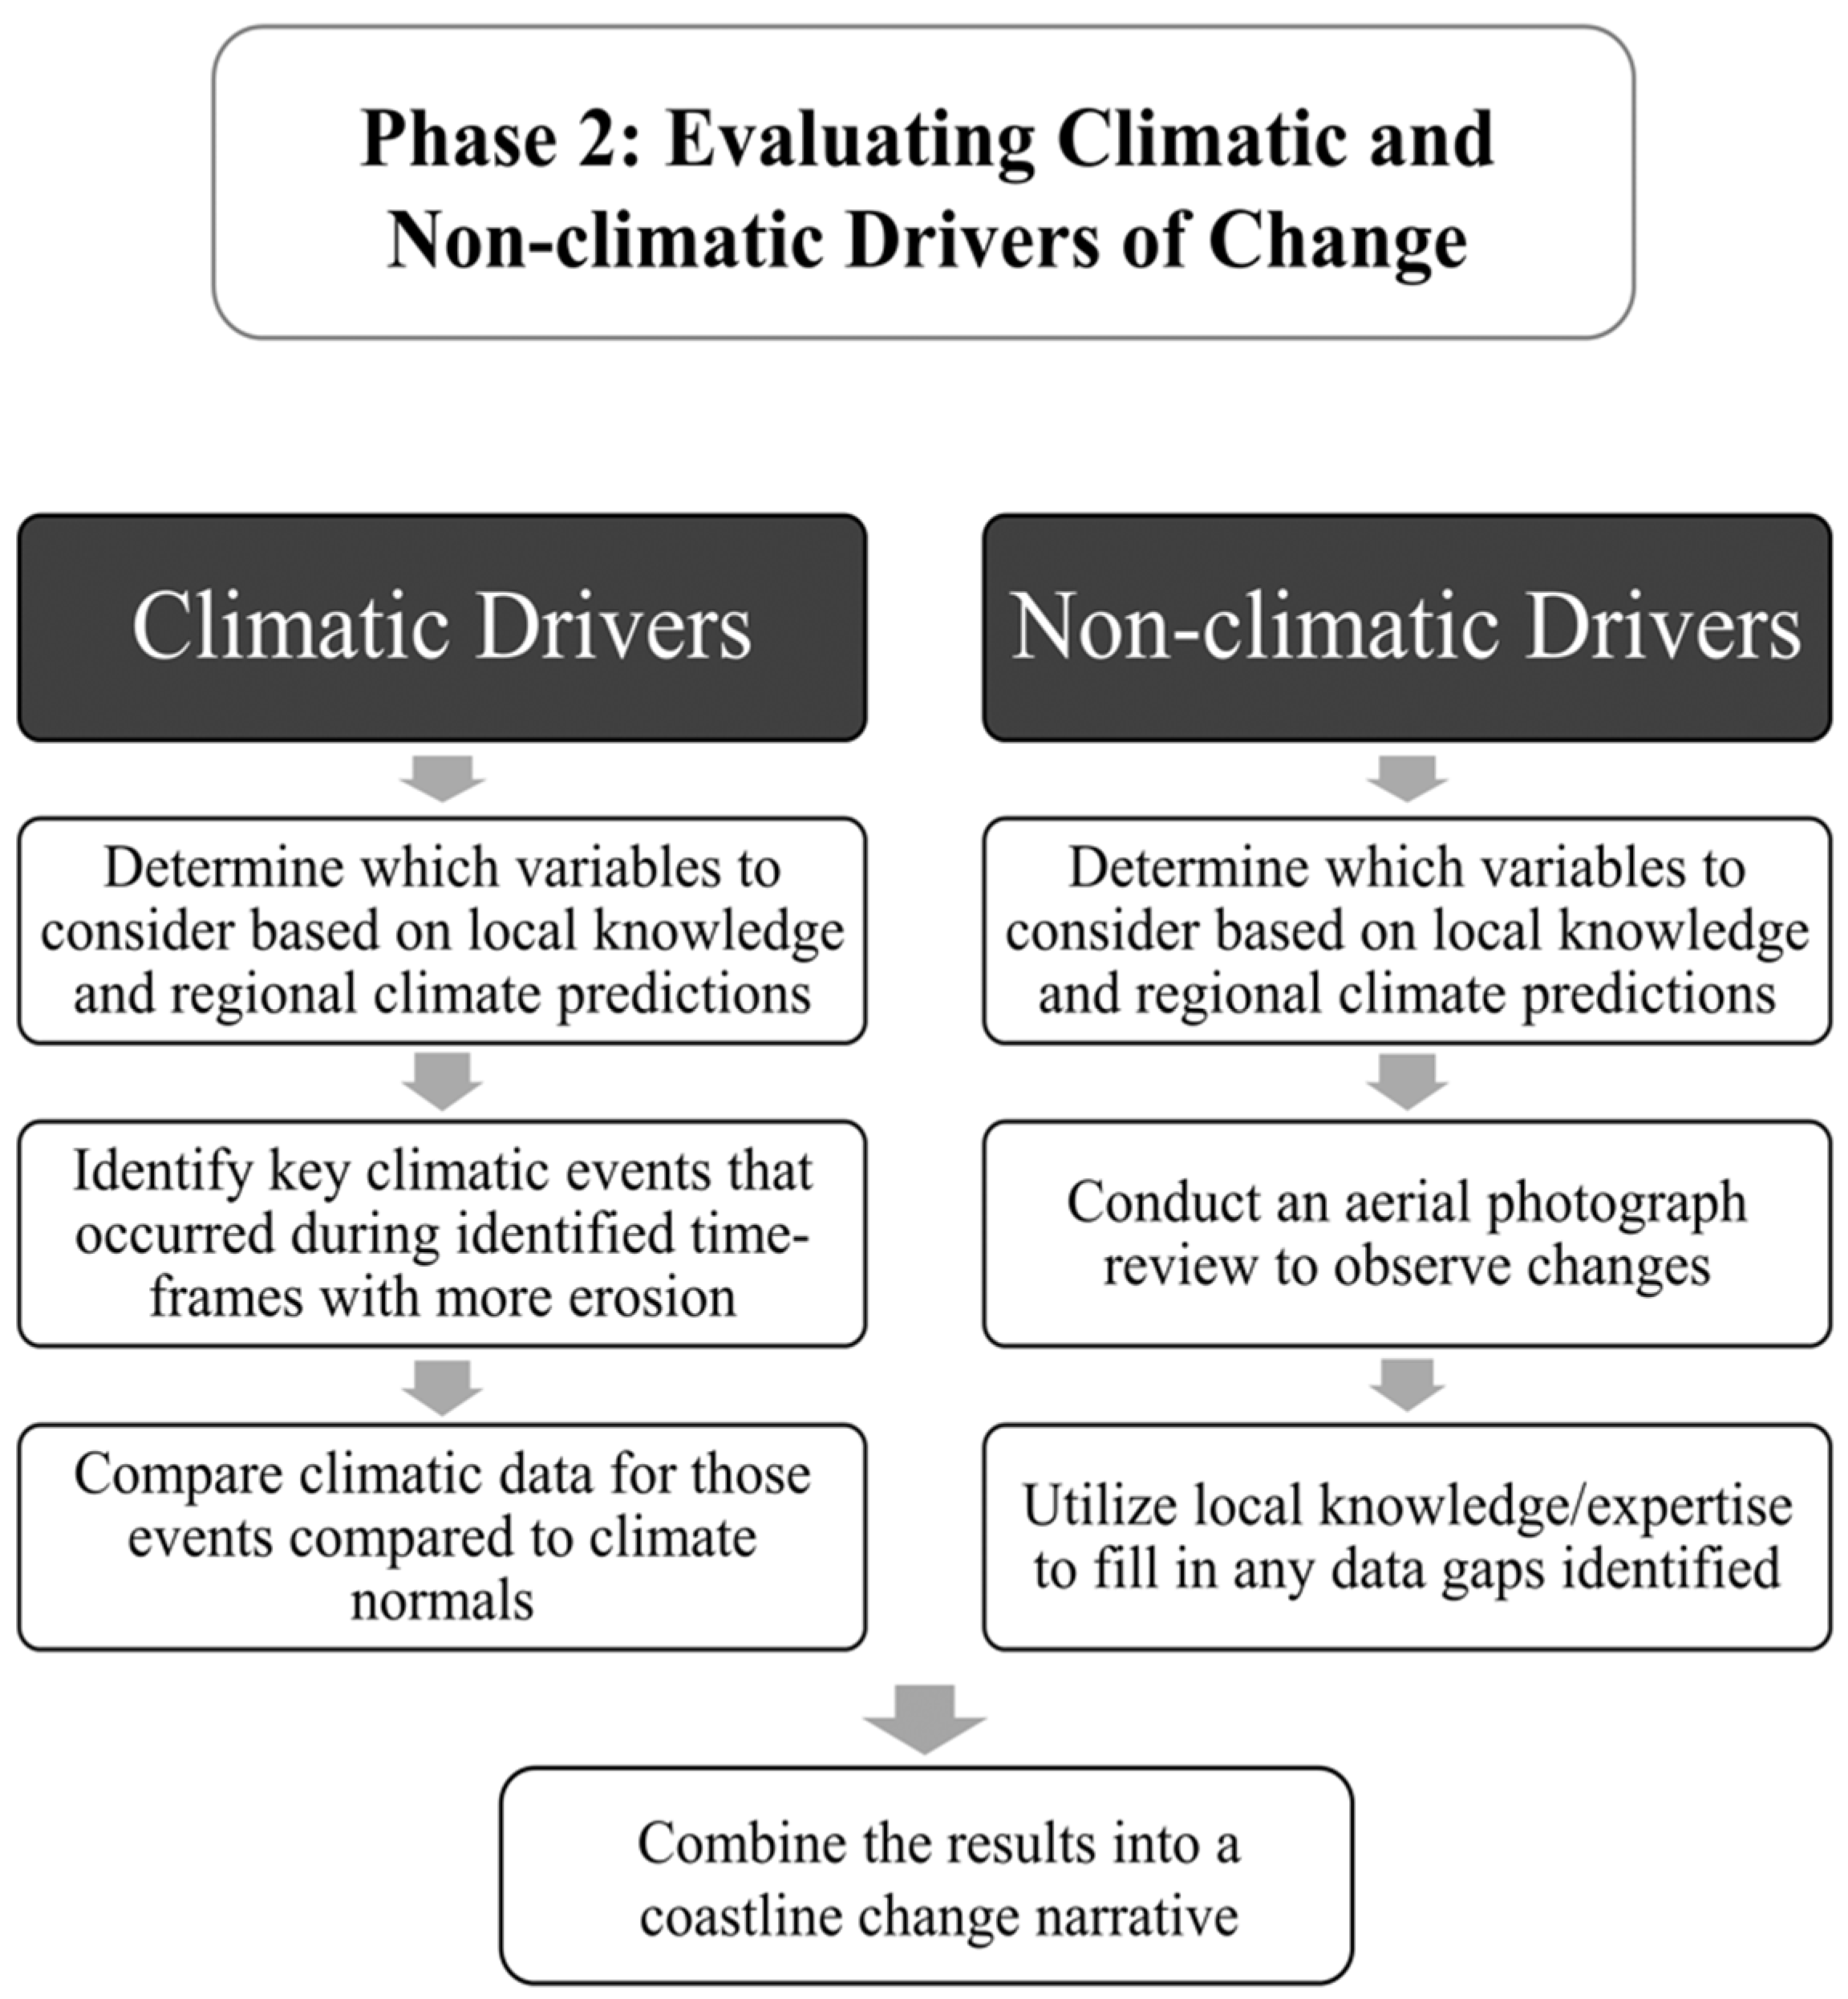
2.3. Phase Two—Drivers of Change

The second phase of the methodological approach included the evaluation of climatic and non-climatic drivers of change that might have influenced the vulnerable areas highlighted in the first phase (Figure 4). Multiple, interacting drivers of vulnerability exist [4]. Climatic and non-climatic drivers of change were identified prior to the commencement of Phase One, with the option of adding drivers to the analysis as new historical datasets became available or drivers that should be investigated became apparent. Identifying the drivers of change to be investigated prior to collecting and evaluating the data can help improve the robustness of the study [49].

2.3.1. Climatic Drivers of Change

Climatic drivers (including changes in winds directions or extreme weather events) can lead to significant impacts for communities, such as flooding or erosion [50,51]. Climatic drivers of coastline change were selected based on a literature review and climate projections of the Town of Lincoln and Niagara Region [22]. The main parameters evaluated are summarized in Table 4, with instances of other studies using these parameters to evaluate coastline change. In the case of Lincoln, projections include warming in winter months that may lead to changes in the duration and extent of ice cover [52], which can increase coastal erosion due to pressure build up causing ice ride-up or pile up [53]. High-level storm events with heavy rainfall and wind data, years with higher rates of erosion may be rationalized as strong winds cause increased wave action that can erode the shore. As flooding increases with heavy rainfall, so does the likelihood of land erosion in some areas compared to others, and an increase in accretion in other areas due to an increase in sediment flux to the shore [54].

2.3.2. Non-Climatic Drivers of Change

Non-climatic drivers can also lead to coastline change and have significant impact on both natural ecosystems and infrastructure [66]. Land-use changes, such as development, increases the amounts of impervious surfaces and increases the sensitivity of the coastline, increasing the likelihood of flooding and overall vulnerability [67]. Changes in land use over time, such as the increase in greenhouses, vineyards, and roads adjacent to the shore, have been shown to increase coastline erosion [6]. Vegetation has been found to stabilize and reduce erosion rates [68] and is so closely linked to coastline stability that some studies have used percent vegetation cover to represent stability level [18]. For this step, historical data were gathered and evaluated. For example, municipal zoning plans was examined to identify when land use and coastal infrastructure changes occurred. Identified changes in land use included road networks, residential or agricultural development, and coastline protection. Land orientation, groundwater flow, and soil type were also considered for the vulnerable areas identified in Phase One. The main drivers evaluated are summarized in Table 5.

3. Results

3.1. Phase One–Coastline Analysis

The fourth step in Phase One is the coastline analysis, which includes a long and short-term analyses. The results of each are summarized in the following subsections.

3.1.1. Long-Term Analysis

Over the past 84 years (1934–2018), the overall rate of change of the Lincoln coastline was −0.15 m/yr, a loss of 29.4 ha of land (Table 6). The average shoreline change envelope (SCE), that is, the distance in meters between the two years that were the farthest apart, was 26.02 m. All reaches had erosional LRRs except Reaches 6 and 11. The highest erosion rate occurred at Reach 15, near Eighteen Mile Creek, with an erosion rate of −0.66 m/yr between 1934 and 2018. Reaches 17 and 19 also showed high erosion rates, most likely due to the dynamic sandy beaches. Of the western reaches, Reach 3 had the highest erosion rate followed by Reach 9 at −0.39 m/yr and −0.29 m/yr, respectively.

3.1.2. Short-Term Analysis

Three time periods in the short-term analyses showed the highest overall erosion rates: 1934–1954 (−0.53 m/yr), 1965–1972 (−0.52 m/yr), and 2015–2018 (−0.49 m/yr) (Table 7). The highest rates of erosion occurred within the eastern reaches of the Lincoln coastline. The highest erosion rate occurred at Reach 19 between 1965 and 1972 (−2.02 m/yr). Only Reaches 3 and 15 had erosional trends in every time frame evaluated. All reaches were relatively stable between 1981 and 2015 (Table 7).

3.1.3. Vulnerable Areas Identified

From the short and long-term analyses, Reaches 3, 9, 14 and 15 were highlighted as having large change rates over the 84 years and therefore, are likely more vulnerable to climatic and non-climatic drivers of change. Each of the reaches or collection of reaches were evaluated further to explore how select climatic and non-climatic factors may be driving change in these areas.

3.2. Phase Two–Drivers of Change Narrative

The climate and non-climatic data collected during Phase Two of the approach are woven together in a narrative, as each component is connected. The reaches with narratives in the subsections below were chosen based on the results of Phase One.

3.2.1. Reach 3

Located on the west side of the Lincoln coastline between Mountain Road and Thirty Road North, Reach 3 is largely agricultural and contains Thirty Mile Creek that runs between the two roads and outlets on the east side of the reach. This reach had the fourth highest erosion rate in the long-term analysis with a maximum transect change rate of −0.62 m/yr (Table 6). According to the short-term analyses, Reach 3 has been consistently eroding since at least 1934 (Table 7).
Along with the other western reaches of the coastline, Reach 3 did not have as high of an erosion rate between 1934 and1954 as the eastern reaches (Table 7), which is likely due to the Halton Till present in this area compared to the sandy banks of the eastern reaches that are more vulnerable to erosion during storm events, such as the tropical Hurricane Hazel in the early 1950′s. After 1981, there were minimal land use changes, which is reflected in the period of relative coastline stability between 1981 and 1994 (Table 7). By 1981, a pier was constructed immediately east of the Thirty Mile Creek outlet, increasing sedimentation west of the pier, helping stabilize the coastline [74]. In each subsequent aerial photograph, additional groynes were constructed on both sides of the creek outlet and additional coastline protection measures, including revetment stones and stacked armourstone, were observed on individual residences.
Despite the attempts of coastline protection, erosion rates were still observed in each short-term analysis; and by 2006, evidence of fallen and scattered concrete blocks that once formed a barrier near the creek outlet was observed. One section west of the creek outlet revealed that some of the attempted walls not only structurally failed, but the land behind the barrier continued to erode (to visualize the changes of these reaches, refer to https://brocku.ca/unesco-chair/lincoln-story-map/, accessed on 27 May 2021). This was the only section of Reach 3 that visibly lost land between 2015 and 2018, and 462 m2 was lost., which corresponded to an erosion rate of −3.58 m/yr (Table 7). This area of high erosion was likely due to the June 2017 storm event that caused approximately CAD$1Million in damage of many roads near the coastline and the first-time voluntary evacuation of residents from their homes due to a flooding event [75]. The alluvium soil in the vicinity of the creek [76], groundwater flow in the NE direction [77], and the steep unvegetated bank could collectively indicate why the coastline in the immediate proximity to Thirty Mile Creek eroded more compared to the rest of the reach in 2015–2018, despite attempts to protect the area.

3.2.2. Reach 9

Reach 9 includes the section of the coastline the locals call “Prudhomme’s Landing”, to the west of Jordan Harbor (Figure 1). The formerly developed area was once a hub for recreation and tourism for the Town, with hotels, restaurants, waterslides, pools, go karts, bumper cars, and water sports. This reach is a historically significant part of Lincoln’s heritage that is currently planned for re-development with housing, commercial, natural environment, and open space uses [78]. The long-term analysis revealed that 100% of the transects across this reach were erosional between 1934 and 2018 (Table 6). The short-term analyses revealed that the highest erosion rates occurred between 1972 and 1981, and 2015 and 2018, at −1.77 m/yr and −1.08 m/yr, respectively (Table 7).
The accretion rate between 1954 and 1965 corresponds with a large amount of fill that appears to have been placed along this reach for the development of Prudhomme’s Landing. Between 1965 and 1981 Prudhomme’s expanded across the eastern section of the reach and by 1972, fill was added to the coastline between the two western most groynes that were installed sometime between 1934 and 1954. By 1994, the east side of Prudhomme’s Landing was decommissioned and by 2018, erosion on each side of the armourstone revetment was evident. Despite human development, including re-contouring and addition of soil across large segments of this reach for decades, there still appeared to be a segment of the reach (immediately west of the groynes) that continued to erode.
Between 1972 and 1981, the erosional transects on the west side of the reach were all greater than −3.0 m/yr, resulting in the loss of over 8500 m2 of agricultural land. Records showed 1972 as a high precipitation year and several severe storms caused extensive damage along the shore that led to over $25 million ($84.7 million today) in damages to the Canadian shore of Lake Ontario [79]. The blizzard of 1977 was one of Canada’s worst winter storms in which a state of emergency was called on 29 January [80] with consistent wind gusts of at least 80 km/h [56]. With less than 50% ice cover on Lake Ontario at the time [81] and the strong winds (which lead to wave action), this storm likely contributed to the coastline erosion during the 1972–1981 time frame.
The high rates of erosion in 2015–2018 are likely a result of the 2017 storms as there were no apparent land use changes during this time. Being one of the only northeast facing reaches, Reach 9 may be more exposed during storm events, especially northeastern storms, leading to more extreme erosion rates compared to other reaches [53].
The west side of the reach was developed into the Victoria Shores residential development between 2002 and 2008. When the homes were constructed, fill was placed along the coastline and a concrete stone revetment wall was installed. This section of reach has remained relatively stable since construction, even during the 2017 flood event.
The eastern edge of the reach contains a man-made drainage ditch that in 1934 had no vegetation on either side [82]. Planting efforts by the orchard owner to the east (in Reach 10) between the 1950s and 1990s resulted in the east side of the channel having significantly less erosion than the west side. It is likely that the lack of vegetation on the west side of the channel (and many other sections of the Lincoln coastline) are making the banks for vulnerable to erosion during high water level and storm events.

3.2.3. Reaches 14 and 15

These two reaches are located immediately east and west of the Eighteen Mile Creek outlet (Figure 1). Both reaches were in the top five erosional reaches in the long-term analysis, with Reach 15 having the highest erosion rate (Table 6). The highest rates of erosion at both reaches occurred between 1934 and 1954. The 1934 aerial photograph reveals Lakeshore Road (previously continuous between Toronto and Niagara Falls) was still present in this area; but by 1954, the entire road, including the bridge that went over Eighteen Mile Creek, was washed out.
The QEW—constructed closest to the coastline at these two reaches—was less than 100 m from the shore in the 1954 photo and the 1965 expansion as close as 60 m to the shore [82]. The QEW construction completely modified Reach 15 and has likely caused water flow disruptions [83]. Eighteen Mile Creek was narrowed by almost 50 m across to support the bridge, most likely creating a bottleneck effect on the natural sediment transport process of the creek [84]. The erosion between 1934 and 1954 was likely a combination of the negative impacts of construction of the QEW and the tropical storms that ripped through the region.
Reach 14 had the largest SCE between 1934 and 2018 with one transect measuring 75.47 m of land lost. Between 1981 and 1994, Reaches 14 and 15 were the only eastern reaches that reported erosion rates. This may be the result of all the land-use changes that occurred including the transition from orchards to vineyards and the increase in the number of residents being constructed in narrow lots along the shore. By 1994, residents started to add revetment walls along their property, which likely attributed to the accretion rate from 1994 and 2006 (Table 7) as fill was most likely added to re-contour properties for coastline protection measures. Almost every landowner across Reach 14 had some form of coastline protection measure by 2006. Most of these were hardened structures and were inconsistent from one land parcel to the next, with the exception of one cluster of homes. Failed barriers were also observed by 2006 with fallen concrete blocks in the water. By 2018, a little over a decade after revetment construction, the coastline continued eroding behind the concrete block revetment in some areas. High energy events such as storm surges are one of the leading causes for short-term significant changes to the coastline [85]. Therefore, it is likely that the recent 2017 storm was a significant contributor to the land lost in these reaches (that are within the Iroquois stratified sands) between 2015 and 2018.

4. Discussion

In this study, we reported that the Town of Lincoln coastline was overall eroding, but the most vulnerable areas included: (1) near the outlet of Thirty Mile Creek (Reach 3); (2) Prudhomme’s Landing (Reach 9); and (3) east and west of the Eighteen Mile Creek outlet (Reach 14 and 15). A third of Lake Ontario coastlines consist of weak Quaternary sediments, typical of coastlines in middle and high-latitude coasts [86]. The coastline of Lincoln is therefore largely at risk of coastline erosion. Both climatic and non-climatic factors have been affecting these rates of coastline change. Anthropogenic impacts can be more significant along more densely developed areas [7]. Coastal infrastructure can alter the natural behavior of the coast [87]. The addition of coastline protection can inhibit the natural erosion and accumulation process responsible for forming beaches and their habitats [53].
The areas near creek outlets were exceptionally vulnerable to coastline erosion. Erosion rates were overall the highest between 1934 and 1954, likely due to both hurricane and storms, and the construction of the QEW. For individual reaches, however, the highest erosion rates occurred between 2015 and 2018, which was likely a result of the 2017 heavy rainfall and high water levels. The east side of Lincoln is eroding at a faster rate than reaches on the west side, likely due to interacting drivers (such as the orientation of the land and sandy soils), including the construction of the QEW. There was a period of relative stability between 1981 and 2015, possibly due to a lack of extreme weather events but also the re-contouring, fill, and coastline protection from increased development during this time. Integrating the financial costs of these changes may also inform planning and decisions. Over an 84-year period, the Town of Lincoln lost 29.4 hectares of land.
Water level impacts on Lake Ontario and the Upper St. Lawrence River were analyzed using historical coastline change at multiple locations between 1973 and 2002 [21]. One of the areas analyzed was located within Lincoln, the area east of Eighteen Mile Creek (Reach 15). The Baird 2006 study reports a higher erosion rate in earlier years (1973–1986; 1.49 m/yr) compared to the later years (1986–2002; 0.6 m/yr) for this area. We found a similar trend of higher erosion in earlier years, but our earlier time ranges had lower erosion rates compared to this study. This difference could be a result of the different years analyzed or different change rate methodologies.
Beaches found in other parts of the world have reported rates of erosion ranging from −0.17 m/yr in the more rocky areas, up to −4 m/yr in the more sandy areas [73]. For example, the Oregon coast, comprising of 58% cliff and bluff-backed beaches, has long-term erosion rates ranging from −0.1 to −0.4 m/yr and short-term rates ranging from −0.05 to −1.1 m/yr [88]. The sandy Lake Iroquois banks found in Lincoln (Reaches 13–18) appear comparable to the cliff and bluff-backed coast of Oregon or the sandy shores of Prince Edward Island that have been eroding at a rate of approximately −0.5 m/yr for centuries [89]. Even though the rates of erosion are comparable to similar places, it does not remove the complexity of managing such a heterogeneous coastline.

Limitations

During the coastline digitization step of the Phase One process, it was sometimes difficult to distinguish between the top of slope and top of bank if the slope was recently re-contoured and grassed. In these instances, if the slopes appeared stable in the image, the top of bank or coastline protection was selected to ensure consistency. The imagery collected for 1981 and 1994 were photomaps which had been scanned in sections and stitched together, therefore the resolution was not as high for these years (Table 1) and these images were visually inspected for evidence of contortion which was adjusted as needed in a GIS.
Selecting climatic and non-climatic drivers of change can appear subjective during the research process, new parameters may become evident that the researcher may want to add to the evaluation. Although research has shown that selecting drivers prior to the collection and analysis phases of a study can make the results more robust [49], ignoring new pieces of information may also be irresponsible if they provide valuable insights. In this study, other parameters that might have had some influences could have been the implementation of the Greenbelt Plan in 2005 or the changes in the Great Lakes Water Management Plan in 2014 [90]. With multiple year gaps between images (in this case up to 20 years), perfect understanding of coastline change remains limited, without on the ground monitoring [91].

5. Conclusions

With this methodological approach, both climatic and non-climatic drivers are acknowledged as playing a role in the coastline change. Overall, in the long-term, the coastline of Lincoln had an erosion rate of −0.15 m/yr, representing a loss of 29.4 ha of land. Considering the prime price of the land in this region, this results in a significant loss of tax revenues for the municipality and as potentially cultivable lands for farmers. The study also demonstrated that short term changes can occur and can be related to climatic drivers such as the Hurricane Hazel in the early 1950s or non-climatic changes such as the construction of the Queen Elizabeth Highway. The long-term analysis may be useful for planning purposes and crucial in helping identify the most vulnerable areas of the coastline, while the short-term analyses are necessary in understanding the nuance of a place and in understanding the drivers that may be leading to increased coastal vulnerability.
The study also showed the complexity at the microscale level with great variation among the reaches. This was due not only to the geological composition of the reaches but also the various non-climatic drivers such as the addition of water breaks in some areas. It is clear that the vulnerability would then vary from place to place due to these various factors. Sections with greater vegetation may be eroding less if only climatic drivers are impacting but if the substrate is sandy, this may not be the case if an intense storm occurs. In terms of reducing risks, both temporal and spatial aspects of the coastline must be considered.
Visualization studies such as this one may help residents and town staff better understand the coastline changes and help better define adaptation measures, which may also be linked to disaster risk reduction. In this study, the findings were delivered to the town staff as recommendations for coastline management in current and future developments. In addition, the StoryMap (https://brocku.ca/unesco-chair/lincoln-story-map/, accessed on 27 May 2021) developed is publicly accessible and a way for the residents to also see the changes that might have occurred on their land over time. This may help residents to engage a dialogue with the municipality and decision makers on what actions in the long term can be done to reduce vulnerability and better adapt to the current and future environmental and climatic changes, many of which may be gradual and not related to extreme events.
The methodology used in this study can be replicated and scaled up to include a larger section of coastline. This methodological approach laid the groundwork for further studies to develop a novel approach in which natural and anthropogenic drivers are evaluated to determine which drivers contributing more to coastline change, or to determine the amount in which climate change is contributing to coastline change.

Author Contributions

Conceptualization, Meredith Caspell and Liette Vasseur; methodology, Meredith Caspell; software, Meredith Caspell; validation, Meredith Caspell and Liette Vasseur; formal analysis, Meredith Caspell; investigation, Meredith Caspell and Liette Vasseur; resources, Meredith Caspell and Liette Vasseur; data curation, Meredith Caspell; writing—original draft preparation, Meredith Caspell; writing—review and editing, Meredith Caspell and Liette Vasseur; visualization, Liette Vasseur; supervision, Liette Vasseur; project administration, Meredith Caspell and Liette Vasseur; funding acquisition, Meredith Caspell and Liette Vasseur All authors have read and agreed to the published version of the manuscript.

Funding

This research was funded by the Social Sciences and Humanities Research Council of Canada, Canada Graduate Scholarship-Master’s Program. The APC was funded by the Marine Environmental Observation, Prediction and Response (MEOPAR) Network, grant number 1-02-02-035.4.

Institutional Review Board Statement

Not applicable.

Informed Consent Statement

Not applicable.

Data Availability Statement

For further information on the project, refer to www.brocku.ca/unesco-chair/marine-environmental-observation-prediction-and-response-network-meopar-project/ (accessed on 27 May 2021).

Acknowledgments

The authors thank the Town of Lincoln for its logistical support, and Brian Jaworsky for his local knowledge, the Friends of Lincoln’s History for suppling historical photographs and the Niagara Peninsula Conservation Authority for sharing the reach boundary shapefiles. This work would not have been possible without the assistance from Sharon Janzen at the Brock University Maps, Data and GIS Library.

Conflicts of Interest

The authors declare no conflict of interest.

References

  1. Agardy, T.; Alder, J. Coastal Systems and Coastal Communities. In Millenium Ecosystem Assessment; Baker, J., Casasola, P.M., Lugo, A., Rodriguez, A.S., Tang, L.D.L., Eds.; Island Press: Washington, WA, USA, 2005. [Google Scholar]
  2. Appeaning-Addo, K.; Lamptey, E. Innovative Technique of Predicting Shoreline Change in Developing Countries: Case of Accra Erosion and Causal Factors. In Coastal Hazards; Finkl, C., Ed.; Springer: Dordrecht, The Netherlands, 2013; ISBN 978-94-007-5234-4. [Google Scholar]
  3. Hoegh-Guldberg, O.; Jacob, D.; Taylor, M.; Bindi, M.; Abdul Halim, S.; Achlatis Australia, M.; Alexander, L.V.; Allen, M.R.; Berry, P.; Boyer, C.; et al. Impacts of 1.5 °C of Global Warming on Natural and Human Systems. Available online: https://www.ipcc.ch/site/assets/uploads/sites/2/2019/02/SR15_Chapter3_Low_Res.pdf (accessed on 15 May 2021).
  4. Bennett, N.J.; Blythe, J.; Tyler, S.; Ban, N.C. Communities and change in the anthropocene: Understanding social-ecological vulnerability and planning adaptations to multiple interacting exposures. Reg. Environ. Chang. 2016, 16, 907–926. [Google Scholar] [CrossRef] [Green Version]
  5. Nicholls, R.J.; Wong, P.P.; Burkett, V.; Woodroffe, C.D.; Hay, J. Climate change and coastal vulnerability assessment: Scenarios for integrated assessment. Sustain. Sci. 2008, 3, 89–102. [Google Scholar] [CrossRef]
  6. De Serio, F.; Armenio, E.; Mossa, M.; Petrillo, A.F. How to Define Priorities in Coastal Vulnerability Assessment. Geosciences 2018, 8, 415. [Google Scholar] [CrossRef] [Green Version]
  7. Hapke, C.J.; Kratzmann, M.G.; Himmelstoss, E.A. Geomorphic and human influence on large-scale coastal change. Geomorphology 2013, 199, 160–170. [Google Scholar] [CrossRef]
  8. Turner, I.L.; Leatherman, S.P. Beach dewatering as a ‘soft’ engineering solulion to coastal erosion—A history and critical review. Oceanogr. Lit. Rev. 1998, 45, 168. [Google Scholar] [CrossRef]
  9. Adamo, F.; De Capua, C.; Filianoti, P.; Maria, A.; Lanzolla, L.; Morello, R. A coastal erosion model to predict shoreline changes. Measurement 2014, 47, 734–740. [Google Scholar] [CrossRef]
  10. Gorgoglione, A.; Gregorio, J.; Ríos, A.; Alonso, J.; Chreties, C.; Fossati, M. Influence of land use/land cover on surface-water quality of Santa Lucia River, Uruguay. Sustainability 2020, 12, 4692. [Google Scholar] [CrossRef]
  11. Marshall, N.; Marshall, P.; Tamelander, J.; Obura, D.; Malleret-King, D.; Cinner, J.E. A Framework for Social Adaptation to Climate Change Sustaining Tropical Coastal Communitites and Industries. Available online: https://www.iucn.org/content/a-framework-social-adaptation-climate-change-sustaining-tropical-coastal-communities-and-industries (accessed on 15 May 2021).
  12. Oppenheimer, M.; Campos, M.; Warren, R.; Birkmann, J.; Luber, G.; Takahashi, K. Emergent Risks and Key Vulnerabilities. In Climate Change 2014: Impacts, Adaptation, and Vulnerability. Part A: Global and Sectoral Aspects. Contribution of Working Group II to the Fifth Assessment Report of the Intergovernmental Panel on Climate Change; Berkhout, F., Brklacich, M., Semenov, S., Licker, R., Hsiang, S., Barros, V., Dokken, D., Mach, K., Bilir, T., Chatterjee, M., et al., Eds.; Cambridge University Press: Cambridge, UK; New York, NY, USA, 2014; pp. 1039–1099. [Google Scholar]
  13. Burton, C.G. A Validation of Metrics for Community Resilience to Natural Hazards and Disasters Using the Recovery from Hurricane Katrina as a Case Study. Ann. Assoc. Am. Geographers 2015, 105, 67–86. [Google Scholar] [CrossRef]
  14. Sherrieb, K.; Louis, C.A.; Pfefferbaum, R.L.; Pfefferbaum, B.J.D.; Diab, E.; Norris, F.H. Assessing community resilience on the US coast using school principals as key informants. Int. J. Disaster Risk Reduct. 2012, 2, 6–15. [Google Scholar] [CrossRef]
  15. Lewis, J.; Kelman, I. Places, people and perpetuity: Community capacities in ecologies of catastrophe. Acme 2010, 9, 191–220. [Google Scholar]
  16. Manyena, B.; Machingura, F.; O’Keefe, P. Disaster Resilience Integrated Framework for Transformation (DRIFT): A new approach to theorising and operationalising resilience. World Dev. 2019, 123, 104587. [Google Scholar] [CrossRef]
  17. Bevacqua, A.; Yu, D.; Zhang, Y. Coastal vulnerability: Evolving concepts in understanding vulnerable people and places. Environ. Sci. Policy 2018, 82, 19–29. [Google Scholar] [CrossRef]
  18. Fraser, C.; Bernatchez, P.; Dugas, S. Development of a GIS coastal land-use planning tool for coastal erosion adaptation based on the exposure of buildings and infrastructure to coastal erosion, Québec, Canada. Geomat. Nat. Hazards Risk 2017, 8, 1103–1125. [Google Scholar] [CrossRef]
  19. Vasseur, L.; Pickering, G. Acting on Climate Change: Extending the Dialogue Among Canadians. Available online: http://www.sustainablecanadadialogues.ca/en/scd/extendingthedialogue (accessed on 15 May 2021).
  20. DeCock-Caspell, M.; Vasseur, L. Visualizations as a tool to increase community engagement in climate change adaptation decision-making. Facets 2021, 6, 240–251. [Google Scholar] [CrossRef]
  21. Baird, W.E.; Associates Coastal Engineers Ltd. Detailed Study Sites for the Coastal Performance Indicators. 2006. Available online: https://www.yumpu.com/en/document/view/22583849/baird-wf-and-associates-coastal-engineering-ltd-detailed-study (accessed on 29 March 2021).
  22. Penney, J. Adapting to climate change: Challenges for Niagara; Niagara Knowledge Exchange: Niagara Region, 2012. [Google Scholar]
  23. Ministry of Municipal Affairs and Housing. Greenbelt Plan. Available online: https://www.ontario.ca/document/greenbelt-plan-2017 (accessed on 15 May 2021).
  24. Statistics Canada. Census Profile, 2016 Census. Available online: https://www12.statcan.gc.ca/census-recensement/2016/dp-pd/prof/details/page.cfm?Lang=E&Geo1=CSD&Code1=3526057&Geo2=PR&Code2=35&Data=Count&SearchText=Lincoln&SearchType=Begins&SearchPR=01&B1=All&GeoLevel=PR&GeoCode=3526057&TABID=1 (accessed on 19 March 2019).
  25. Town of Lincoln Economic Development. Available online: https://lincoln.ca/economic-development (accessed on 5 March 2019).
  26. Hewitt, D.F. The Niagara Escarpment; Ontario Department of Mines and Northern Affairs: Toronto, ON, Canada, 1971.
  27. Shaw, A.B. Diagrams and Technical Information for the Niagara Peninsula. Available online: https://www.google.com.hk/url?sa=t&rct=j&q=&esrc=s&source=web&cd=&cad=rja&uact=8&ved=2ahUKEwiC0o624_fwAhWTmhQKHSzVB90QFjAAegQIAhAD&url=https%3A%2F%2Fwww.vqaontario.ca%2FLibrary%2FDocuments%2FNiagaraPeninsulaTechnicalInformation&usg=AOvVaw2w2YT-NDCN_YDUAXpBhPad (accessed on 30 March 2021).
  28. Feenstra, B.H. Quaternary Geology of the Niagara Area, Southern Ontario; Ontario Division of Mines, Preliminary Map P. 764, scale 1:50,000 1972. Available online: http://www.geologyontario.mndmf.gov.on.ca/mndmfiles/pub/data/imaging/P0764//p0764.pdf (accessed on 29 March 2021).
  29. International Joint Commission. Great Lakes-St. Lawrence River. Available online: https://www.ijc.org/en/watersheds/great-lakes (accessed on 26 January 2019).
  30. Webb, M. Niagara Region HIRA Workshops: 2014, 2015, 2016 Summary Reports. 2016. Available online: https://www.acer-acre.ca/wp-content/uploads/2011/08/2016-HIRA-Workshop-Report.pdf (accessed on 2 April 2021).
  31. Shorten, A.; Smith, J. Mixed methods research: Expanding the evidence base. Evid. Based Nurs. 2017, 20, 74–75. [Google Scholar] [CrossRef] [Green Version]
  32. Creswell, J.W. Research Design: Qualitative, Quantitative, and Mixed Methods Approaches, 4th ed.; Knight, V., Koscielak, K., Bauhaus, B., Markanich, M., Eds.; SAGE Publications Inc.: Los Angeles, CA, USA; London, UK; New Dehli, India; Singapore; Washington, DC, USA, 2014; ISBN 9781452226095. [Google Scholar]
  33. Jensen, J.R.; Jensen, R.R. Introductory Geographic Information Systems, 1st ed.; Pearson Education Inc.: Uttar Pradesh, India, 2013. [Google Scholar]
  34. Kimerling, A.J.; Buckley, A.R.; Muehrcke, P.C.; Muehrcke, J.O. Map Use: Reading, Analysis, Interpretation, 7th ed.; Esri Press Academic: Redlands, CA, USA, 2012. [Google Scholar]
  35. Webster, T. Coastline Change in Prince Edward Island, 1968–2010 and 2000–2010. 2012. Available online: https://atlanticadaptation.ca/en/islandora/object/acasa%253A214 (accessed on 29 March 2021).
  36. Nguyen, H.H.; Pullar, D.; Duke, N.; McAlpine, C.; Nguyen, H.T.; Johansen, K. Historic shoreline changes: An indicator of coastal vulnerability for human landuse and development in Kien Giang, Vietnam. In Proceedings of the ACRS 2010: 31st Asian Conference on Remote Sensing, Hanoi, Vietnam, 1–5 November 2010. [Google Scholar]
  37. Wernette, P.; Shortridge, A.; Lusch, D.P.; Arbogast, A.F. Accounting for positional uncertainty in historical shoreline change analysis without ground reference information. Int. J. Remote Sens. 2017, 38, 3906–3922. [Google Scholar] [CrossRef]
  38. Skidmore, A.K.; Turner, B.J. Map accuracy assessment using line intersect sampling. Photogramm. Eng. Remote Sens. 1992, 58, 1453–1457. [Google Scholar]
  39. Tveite, H.; Langaas, S. An accuracy assessment method for geographical line data sets based on buffering. Int. J. Geogr. Inf. Sci. 1999, 13, 27–47. [Google Scholar] [CrossRef]
  40. Sutherland, J. Error analysis of Ordnance Survey map tidelines, UK. Marit. Eng. J. 2012, 165, 189–197. [Google Scholar] [CrossRef] [Green Version]
  41. Dolan, R.; Fenster, M.S.; Holme, S.J. Temporal Analysis of Shoreline Recession and Accretion. J. Coast. Res. 1991, 7, 723–744. [Google Scholar]
  42. Fletcher, C.; Rooney, J.; Barbee, M.; Lim, S.-C.; Richmond, B. Mapping Shoreline Change Using Digital Orthophotogrammetry on Maui, Hawaii. Source J. Coast. Res. 2003, 38, 106–124. [Google Scholar]
  43. Ford, M. Shoreline changes interpreted from multi-temporal aerial photographs and high resolution satellite images: Wotje Atoll, Marshall Islands. Remote Sens. Environ. 2013, 135, 130–140. [Google Scholar] [CrossRef]
  44. Himmelstoss, E.A.; Henderson, R.E.; Kratzmann, M.G.; Farris, A.S. Digital Shoreline Analysis System (DSAS) Version 5.0 User Guide. Open-File Rep. 2018, 126, 20181179. [Google Scholar]
  45. Thieler, E.R.; Himmelstoss, E.A.; Zichichi, J.L.; Ayhan, E. The Digital Shoreline Analysis System (DSAS) Version 4.0—An ArcGIS Extension for Calculating Shoreline Change; U.S. Geological Survey: Reston, VA, USA, 2017. Available online: https://pubs.er.usgs.gov/publication/ofr20081278 (accessed on 28 March 2021).
  46. Baird, W.; Associates Coastal Engineers Ltd. Lake Ontario Shoreline Management Plan Update. 2009. Available online: https://www.cloca.com/lake-ontario-shoreline-hazard-manag (accessed on 28 March 2021).
  47. BaMasoud, A.; Byrne, M.-L. Analysis of Shoreline Changes (1959–2004) in Point Pelee National Park, Canada. J. Coast. Res. 2011, 27, 839–846. [Google Scholar] [CrossRef]
  48. Lemmen, D.S.; Warren, F.J.; James, T.S.; Mercer Clarke, C.S.L. Canada’s Marine Coasts in a Changing Climate; Government of Canada: Ottawa, ON, Canada, 2016; ISBN 9780660050522. [Google Scholar]
  49. Van Bavel, B.J.P.; Curtis, D.R.; Hannaford, M.J.; Moatsos, M.; Roosen, J.; Soens, T. Climate and society in long-term perspective: Opportunities and pitfalls in the use of historical datasets. Wiley Interdiscip. Rev. Clim. Chang. 2019, 10, 1–18. [Google Scholar] [CrossRef] [Green Version]
  50. Brown, S.; Nicholls, R.J.; Woodroffe, C.D.; Hanson, S.; Hinkel, J.; Kebede, A.S.; Neumann, B.; Vafeidis, A.T. Sea-Level Rise Impacts and Responses: A Global Perspective. In Coastal Hazards; Finkl, C.W., Ed.; Springer: Dordrecht, The Netherlands, 2013; pp. 117–149. ISBN 978-94-007-5234-4. [Google Scholar]
  51. Neumann, B.; Vafeidis, A.T.; Zimmermann, J.; Nicholls, R.J. Future Coastal Population Growth and Exposure to Sea-Level Rise and Coastal Flooding—A Global Assessment. PLoS ONE 2015, 10, e0118571. [Google Scholar] [CrossRef] [Green Version]
  52. Chiotti, Q.; Lavender, B. Chapter 6: Ontario. In From Impacts to Adaptation: Canada in a Changing Climate; Lemmen, D.S., Warren, F.J., Lacroix, J., Bush, E., Eds.; Government of Canada: Ottawa, ON, Canada, 2008; pp. 227–274. ISBN 9780660076805. [Google Scholar]
  53. Daigle, R.J. Impacts of Sea-Level Rise and Residential Development on Salt-Marsh Area in Southeastern New Brunswick; Environment Canada: Ottawa, ON, Canada, 2006; ISBN1 0662439473. Available online: http://publications.gc.ca/site/eng/9.667859/publication.html (accessed on 25 March 2021)ISBN2 0662439473.
  54. Kantamaneni, K.; Du, X.; Aher, S.; Singh, R.M. Building blocks: A quantitative approach for evaluating coastal vulnerability. Water 2017, 9, 905. [Google Scholar] [CrossRef] [Green Version]
  55. NOAA Great Lakes Dashboard. Precipitation Data. Available online: https://www.glerl.noaa.gov/data/dashboard/data/hydroIO/precip/ (accessed on 19 February 2019).
  56. Government of Canada. Historical Data. Available online: https://climate.weather.gc.ca/historical_data/search_historic_data_e.html (accessed on 25 May 2019).
  57. Sahoo, B.; Bhaskaran, P.K. Multi-hazard risk assessment of coastal vulnerability from tropical cyclones—A GIS based approach for the Odisha coast. J. Environ. Manag. 2018, 206, 1166–1178. [Google Scholar] [CrossRef] [PubMed]
  58. Yoo, G.; Hwang, J.H.; Choi, C. Development and application of a methodology for vulnerability assessment of climate change in coastal cities. Ocean Coast. Manag. 2011, 54, 524–534. [Google Scholar] [CrossRef]
  59. NOAA Great Lakes Dashboard. Great Lakes Environmental Research Laboratory (GLERL). Available online: https://www.glerl.noaa.gov/data/dashboard/GLD_HTML5.html (accessed on 27 May 2021).
  60. Moser, S.; Williams, S.J.; Boesch, D.F. Wicked Challenges at Land’s End: Managing Coastal Vulnerability Under Climate Change. Annu. Rev. Environ. Resour. 2012, 37, 51–78. [Google Scholar] [CrossRef] [Green Version]
  61. Newton, A.; Weichselgartner, J. Hotspots of coastal vulnerability: A DPSIR analysis to find societal pathways and responses. Estuar. Coast. Shelf Sci. 2014, 140, 123–133. [Google Scholar] [CrossRef]
  62. NOAA Historical Ice Cover. Available online: https://www.glerl.noaa.gov/data/ice/#historical (accessed on 19 February 2019).
  63. Boucher, É.; Bégin, Y.; Arseneault, D. Impacts of recurring ice jams on channel geometry and geomorphology in a small high-boreal watershed. Geomorphology 2009, 108, 273–281. [Google Scholar] [CrossRef]
  64. Kilibarda, Z.; Shillinglaw, C. A 70 year history of coastal dune migration and beach erosion along the southern shore of Lake Michigan. Aeolian Res. 2015, 17, 263–273. [Google Scholar] [CrossRef]
  65. NOAA Great Lakes Dashboard. Water Level Data. Available online: https://www.glerl.noaa.gov/data/dashboard/data/levels/1918_PRES/ (accessed on 19 February 2019).
  66. Räsänen, A.; Juhola, S.; Nygren, A.; Käkönen, M.; Kallio, M.; Monge Monge, A.; Kanninen, M. Climate change, multiple stressors and human vulnerability: A systematic review. Reg. Environ. Chang. 2016, 16, 2291–2302. [Google Scholar] [CrossRef]
  67. Kling, G.W.; Hayhoe, K.; Johnson, L.B.; Magnuson, J.J.; Polasky, S.; Robinson, S.K.; Shuter, B.J.; Wander, M.M.; Wuebbles, D.J.; Zak, D.R.; et al. Confronting Climate Change in the Great Lakes Region: Impacts on Our Communities and Ecosystems; Union of Concerned Scientists & Ecological Society of America: Cambridge, MA, USA, 2003; Available online: https://www.ucsusa.org/sites/default/files/legacy/assets/documents/global_warming/greatlakes_final.pdf (accessed on 12 November 2020).
  68. Frankl, A.; Nyssen, J.; De Dapper, M.; Haile, M.; Billi, P.; Munro, R.N.; Deckers, J.; Poesen, J. Linking long-term gully and river channel dynamics to environmental change using repeat photography (Northern Ethiopia). Geomorphology 2011, 129, 238–251. [Google Scholar] [CrossRef]
  69. Boateng, I. An application of GIS and coastal geomorphology for large scale assessment of coastal erosion and management: A case study of Ghana. J. Coast. Conserv. 2012, 16, 383–397. [Google Scholar] [CrossRef]
  70. Leach, M.; Rockström, J.; Raskin, P.; Scoones, I.; Stirling, A.C.; Smith, A.; Thompson, J.; Millstone, E.; Ely, A.; Arond, E.; et al. Transforming innovation for sustainability. Ecol. Soc. 2012, 17. [Google Scholar] [CrossRef] [Green Version]
  71. Łabuz, T.A. Environmental Impacts-Coastal Erosion and Coastline Changes. In Second Assessment of Climate Change for the Baltic Sea Basin; The BACC II Author Team, Ed.; Springer: Cham, Switzerland, 2015; pp. 381–396. [Google Scholar]
  72. BaMasoud, A.; Byrne, M.-L. The predictive accuracy of shoreline change rate methods in Point Pelee, Canada. J. Great Lakes Res. 2013, 39, 173–181. [Google Scholar] [CrossRef]
  73. Boye, C.B.; Appeaning Addo, K.; Wiafe, G.; Dzigbodi-Adjimah, K. Spatio-temporal analyses of shoreline change in the Western Region of Ghana. J. Coast. Conserv. 2018, 22, 769–776. [Google Scholar] [CrossRef]
  74. Beletsky, D.; Saylor, J.H.; Schwab, D.J. Mean circulation in the Great Lakes. J. Great Lakes Res. 1999, 25, 78–93. [Google Scholar] [CrossRef]
  75. Steinschneider, S.; Styler, A.; Stedman, R.; Austerman, M. A Rapid Response Survey to Characterize the Impacts of the 2017 High Water Event on Lake Ontario. J. Am. Water Resour. Assoc. 2019, 55, 1065–1075. [Google Scholar] [CrossRef]
  76. Ontario Ministry of Natural Resources. Soil Survey Complex. Available online: http://geo2.scholarsportal.info/proxy.html?http:__giseditor.scholarsportal.info/details/view.html?uri=/NAP/OGDE_SOILOMAF_tablejoin.xml&show_as_standalone=true (accessed on 15 May 2021).
  77. Niagara Peninsula Conservation Authority (NPCA). Updated Niagara Peninsula Source Protection Area Assessment Report. 2013. Available online: http://www.niagaraknowledgeexchange.com/wp-content/uploads/sites/2/2014/11/Niagara_SPP1.pdf (accessed on 25 March 2021).
  78. Town of Lincoln Prudhommes Development Site. Available online: https://lincoln.ca/major-projects/prudhommes-development-site (accessed on 11 March 2020).
  79. Government of Canada. Flooding events in Canada: Ontario. Available online: https://www.canada.ca/en/environment-climate-change/services/water-overview/quantity/floods/events-ontario.html (accessed on 20 May 2019).
  80. CBC News. Blasts from the Past: Canada’s Worst Snowstorms. Available online: https://www.cbc.ca/news/canada/blasts-from-the-past-canada-s-worst-snowstorms-1.1370387 (accessed on 20 March 2021).
  81. GLERL, Northern Great Lakes Dashboard Project (GLDP). Available online: https://www.glerl.noaa.gov/data/dashboard/portal.html (accessed on 12 May 2019).
  82. DeCock-Caspell, M. If Coastlines could talk: A story of Lincoln, Ontario 2020. Available online: https://brocku.ca/unesco-chair/lincoln-story-map/ (accessed on 19 May 2021).
  83. Rangel-Buitrago, N.G.; Anfuso, G.; Williams, A.T. Coastal erosion along the Caribbean coast of Colombia: Magnitudes, causes and management. Ocean Coast. Manag. 2015, 114, 129–144. [Google Scholar] [CrossRef]
  84. Otto, J.E. Sedimentology of the Sixteen Mile Creek Lagoon, Niagara Peninsula, Ontario, Canada; Brock University: St. Catharines, ON, Canada, 1983. [Google Scholar]
  85. Guisado-Pintado, E.; Malvárez, G.; Navas, F.; Carrero, R. Spatial distribution of storm wave energy dissipation for the assessment of beach morphodynamics. J. Coast. Res. 2014, 259–265. [Google Scholar] [CrossRef]
  86. Davidson-Arnott, R.G.D.; Amin, S.M.N. An approach to the problem of coastal erosion in quaternary sediments. Appl. Geogr. 1985, 5, 99–116. [Google Scholar] [CrossRef]
  87. Jabaloy-Sánchez, A.; José Lobo, F.; Azor, A.; Bárcenas, P.; Miguel Fernández-Salas, L.; Díaz del Río, V.; Vicente Pérez-Peña, J. Human-driven coastline changes in the Adra River deltaic system, southeast Spain. Geomorphology 2010, 119, 9–22. [Google Scholar] [CrossRef]
  88. Ruggiero, P.; Kratzmann, M.G.; Himmelstoss, E.A.; Reid, D.; Allan, J.; Kaminsky, G. National Assessment of Shoreline Change-Historical Shoreline Change Along the Pacific Northwest Coast: U.S. Geological Survey Open-File Report 2012–1007; United States Geological Survey: Reston, VA, USA, 2013. Available online: https://pubs.usgs.gov/of/2012/1007/ (accessed on 10 April 2021).
  89. Forbes, D.L.; Parkes, G.S.; Manson, G.K.; Ketch, L.A. Storms and shoreline retreat in the southern Gulf of St. Lawrence. Mar. Geol. 2004, 210, 169–204. [Google Scholar] [CrossRef]
  90. International Joint Commission. Lake Ontario—St. Lawrence River Plan 2014: Protecting against Extreme Water Levels, Restoring Wetlands, and Preparing for Climate Change. 2014. Available online: https://ijc.org/sites/default/files/IJC_LOSR_EN_Web.pdf (accessed on 25 March 2021).
  91. Kim, K.-H.; Yoo, H.-S.; Kobayashi, N. Mitigation of Beach Erosion after Coastal Road Construction. J. Coast. Res. 2011, 27, 645–651. [Google Scholar] [CrossRef]
Figure 1. Town of Lincoln location along Lake Ontario with coastline reaches and key hydrological features identified.
Ijgi 10 00375 g001
Figure 2. A summary diagraph of the coastal vulnerability methodological approach being presented.
Ijgi 10 00375 g002
Figure 3. A summary diagraph of the five sequential steps of Phase One of the methodological approach.
Ijgi 10 00375 g003
Figure 4. Phase Two of the methodological approach involves a series of actions that summate to creating a descriptive narrative for how and why the coastline may have evolved based on select climatic and non-climatic drivers of change.
Ijgi 10 00375 g004
Table 1. Details of the aerial imagery selected for the Lincoln case study. All aerial images had the same projection: NAD 1983 UTM Zone 17N.
YearDate FlownImage TypeScale (Resolution)Source
193429 JuneAir photo1:16,000 (60 cm)Ministry of Natural Resources Canada
1954NDAir photo1:16,000 (70 cm)Ontario Ministry of Natural Resources
196525 September or 16 OctoberAir photo1:16,000 (90 cm)Ontario Ministry of Natural Resources
1972NDAir photo1:12,500General Photogrammetric Services
1981NDPhotomap1:5000Regional Municipality of Niagara
1994AprilPhotomap1:5000Regional Municipality of Niagara
2006SpringOrthoimageryN/A (10 cm)Niagara Region, Ministry of Natural Resources
2015SpringOrthoimageryN/A (30 cm)Niagara Region, Ministry of Natural Resources
2018SpringOrthoimageryN/A (10 cm)Niagara Region, Ministry of Natural Resources
Notes: ND indicates no date was found on physical image or in the metadata of the image. N/A indicates a scale or resolution was not found on the image or within the image metadata.
Table 2. Summary of the root mean square errors for the base imagery (RMSEB), georeferencing (RMSEG) 1, interpretation (RMSEI), overall coastline position (RMSEO) and 95% confidence interval (RMSE95) for each aerial photograph selected for the study.
Year of ImageRMSEB (m) 2RMSEI (m)RMSEO (m)RMSE95 (m)
1934N/A3.173.175.49
1954N/A3.173.175.49
1965N/A3.173.175.49
1972 30.0193.173.175.49
1981 30.0193.173.175.49
1994 30.0193.173.175.49
20060.013.173.175.49
20150.53.173.215.56
20180.0193.173.175.49
Notes: 1 The RMSEG for each image was not able to be calculated as all aerial photographs were georeferenced prior to the study. 2 Accuracy of the base image was not available for 1934, 1954 and 1965 images. 3 1972, 1981, and 1994 images were georeferenced to the 2018 imagery, so accuracy of 2018 was used.
Table 3. A description of each of the 19 reaches within the Town of Lincoln from west to east. Reach boundaries adapted from [46]. Descriptions are based on current land use.
ReachDescription
1West Lincoln boundary to Durham Rd North; privately owned—agricultural; steep bank with armourstone and cement blocks present
2Durham Rd North to 140 m west of Mountainview Rd; privately owned, several lots—mix of agricultural and residential; mix of treed banks and concrete blocks when residences are nearshore
3140 m west of Mountainview Rd to Thirty Rd North; privately owned—agricultural; steep bank with gravelly beach; west side of reach vegetated along top of bank, and east side bare
4Thirty Rd North to midway between Ontario St. N and Bartlett Rd North; privately owned, several lots—agricultural (greenhouse, vineyard); steep bank with beach; inconsistent vegetation and coastline protection
5West of Bartlett Rd North to 250 m west of Sam Rd North; privately owned—agricultural (vineyards); steep bank with beach; one row of trees along most of reach; note: residence on western edge of reach right on edge of bank, concrete ad hoc protection in place
6250 m west of Sam Road North to Creek 140 m west of Cherry Ave North, longest reach in Lincoln; privately owned, several lots—mix of agricultural (greenhouse and vineyard) and residential; steep bank with beach only on west side of reach; single row of vegetation along shore, several groynes at residences between Lakeside Dr and Merritt Rd, armourstone revetement present
7Creek to 280 m west of Martin Rd North; privately owned, several lots—mix of agricultural (greenhouse, orchards, and vineyard) and residential; steep bank; single, sparse row of trees along shore, armourstone revetement/concrete blocks present
8West of Martin Rd North to 100 m east of Victoria Ave; several lots—mix of agricultural and residential (residences on lakeside); sparse tree line at top of bank; armourstone revetment and concrete blocks present
9East of Victoria Ave to east end of former Prudhomme water park; Victoria Shores Park residential area; armourstone revetment in front of residential units, vegetation on either side
10Former Prudhomme water park to Jordon Harbor; empty lot in development, owned by the Town of Lincoln; inconsistent trees along steep bank with beach at bottom; groynes present in middle of reach
11Narrow, armored strip of Prudhomme Boulevard and QEW highway
12Jordan Harbor Marina; hardened engineered structure
13Jordon Harbor Marina to unnamed creek 500 m east of Jordan Rd; vegetated bank with groynes and beaches
14Unnamed creek to Eighteen Mile Creek; narrow privately owned lots; inconsistent vegetation and protection along bank; lots (but one empty lot) on the east side of reach have armourstone revetement and few trees
15Eighteen Mile Creek to 325 m west of Sixteen Mile Creek; former mouth of Eighteen Mile Creek is undeveloped with a steep bank and a cobble beach at the bottom;
16West of Sixteen Mile Creek; small lots at the top of a steep bank; concrete blocks at bottom of bank present; top of steep bank is vegetated
17Sixteen Mile Creek; dynamic beach-sandbar is often vegetated; mouth of creek was narrowed for the construction of the QEW
18Charles Daley Park; public park with access to Fifteen and Sixteen Mile creeks and Lake Ontario; armourstone revetement across parkland until beach is reached
19Fifteen Mile Creek; dynamic beach; sandbar has established vegetation; mouth of creek was narrowed for the construction of the QEW
Table 4. Climatic drivers of change to be investigated, sources of data, and methodological justification.
Climatic DriverParameter MeasurementSource of Secondary DataMethodology Source
Heavy Rainfall EventsLake Ontario Overlake Precipitation (mm) (1900–2016)NOAA Great Lakes Environmental Research Laboratory Dashboard [55]; Environment Canada Historical Data [56] [57,58]
Wind Speed and DirectionMonthly mean wind speed and direction (m/s over lake surface) (1948–2011)NOAA Great Lakes Environmental Research Laboratory Dashboard [59]; Environment Canada Historical Data [56] [60,61]
Ice CoverPercent ice coverage (1973–2018)NOAA Great Lake Ice Atlas [62][63,64]
Water Levels 1Monthly lake-wide average water levels (1918–2018)NOAA Great Lakes Environmental Research Laboratory Dashboard [65] [57,58]
1 Average monthly water levels for Lake Ontario are based on all historical water level data (1918 to 2020), not based on the average monthly water level at the time in question. Summarized data was acquired from the National Oceanic and Atmospheric Association’s Great Lakes Environmental Research Laboratory.
Table 5. Non-climatic factors to be investigated and selection source.
Non-Climatic DriversParameter MeasurementMethodology Source
Land Use ChangePurposes served by land (agricultural, residential, commercial, industrial, park/recreational)[6,57,69,70]
Road Network DevelopmentPresence of roads in coastal areas i.e., distance from the coastline[6,57]
Coastline Protection ActionRetrieve information of what type or protection, where and when installed along the coastline.[47,71,72]
Biophysical CharacteristicsSoil stratigraphy, type of bank/coastline, vegetation, orientation of bank, groundwater flow, and near-shore currents were considered as supportive data[18,73]
Table 6. Long-term coastline change analysis results. Analysis included nine historical aerial photographs, spanning 84 years: 1934, 1954, 1965, 1972, 1981, 1994, 2006, 2015, and 2018. Transects were cast at 20 m intervals. Results include the percent of erosional transects per reach, the transect with the largest change rate per reach, and the mean linear regression rate (LRR) for each reach with calculated uncertainties.
Reach 1 No. of Transects% Erosional Transects (Significant)Maximum Transect
Rate (m/yr)
Mean LRR 2,4 (m/yr)
± Uncertainty 5
1771.43 (14.29)−0.13−0.05 ± 0.12
21782.35 (64.71)−0.4−0.13 ± 0.05
313100 (100)−0.62−0.39 ± 0.07
43293.75 (56.25)−0.59−0.25 ± 0.05
51883.33 (38.89)−0.41−0.14 ± 0.08
67244.44 (23.61)−0.18+0.01 ± 0.04
71593.33 (53.33)−0.15−0.07 ± 0.04
82692.31 (26.92)−0.24−0.08 ± 0.04
923100 (52.17)−0.46−0.25 ± 0.09
109100 (0)−0.17−0.08 ± 0.04
11 11118.18 (0)−0.1+0.15 ± 0.33
12 3------------
131593.33 (20)−0.47−0.19 ± 0.21
142596 (68)−0.81−0.32 ± 0.12
157100 (100)−0.76−0.66 ± 0.13
161080 (10)−0.49−0.09 ± 0.17
17 16100 (100)−0.76−0.54 ± 0.22
185100 (40)−0.31−0.17 ± 0.22
19 17100 (100)−0.58−0.42 ± 0.14
OVERALL31879.25 (43.08)−0.81−0.15 ± 0.02
Notes: 1 indicates the reach is a dynamic beach. 2 Bold LRR indicates a long-term change rate greater than −0.2 m/yr. 3 --- indicates analysis not run due to extensive human manipulation of the reach. Construction of the marina at Reach 12 commenced in the 1960’s. 4 (−) m/yr indicates an erosional rate of change; (+) m/yr indicates an accretional rate of change. 5 Uncertainty calculated in the DSAS software by summing all the uncertainties associated with each transect, divided by the number of significant transects.
Table 7. Short-term coastline change analysis results. Digital Shoreline Analysis System short-term analyses that included the following aerial photographs: 1934, 1954, 1965, 1972, 1981, 1994, 2006, 2015 and 2018; ran at the smallest time increments with years available. Transects were cast at 20 m intervals. Results include the end-point rate (EPR) for each reach with calculated uncertainties for each range.
Mean End-Point Rate 2,3,4,5 (EPR) in m/yr
ReachNo. of Tran-Sects1934–1954
(±0.38)
1954–1965
(±0.69)
1965–1972
(±0.95)
1972–1981
(±0.5)
1981–1994
(±0.35)
1994–2006
(±0.52)
2006–2015
(±0.87)
2015–2018
(±2.6)
17−0.16−0.84+0.8−0.16+0.03+0.02+0.19+0.17
217−0.14−0.22−0.62+0.31−0.2−0.04−0.05−0.65
313−0.19−0.68−0.52−0.95−0.06−0.43−0.03−0.38
432−0.66−0.06−0.66+0.05−0.27−0.11−0.16−-0.19
518−0.61+0.17−0.60+0.46−0.28−0.07−0.1+0.16
672+0.16+0.27−0.66+0.37−0.170+0.05−0.50
715−0.22−0.13+0.12−0.13+0.01−0.01−0.07−0.49
826−0.32−0.22−0.17+0.45−0.24+0.01+0.05−0.33
923−0.91+0.13−0.21−1.77+1.12−0.55+0.28−1.08
109−0.92+0.59−1.460+0.78−0.05−0.18−0.78
11 110−0.53+0.56−0.43−1.91+2.36−0.56+0.04−0.11
1210−1.30---------------------
1315−1.58+0.29+0.51−0.90+0.24+0.12+0.33−0.04
1426−1.44+0.03−0.74−0.25−0.33+0.23+0.21−0.49
156−1.05−0.48−0.33−0.89−0.85−0.51−0.13−0.89
1611−1.26+0.54−1.33+1.02+0.02+0.12−0.12−0.30
17 15−1.32−1.06−0.47−1.08+0.86−0.73−0.44−1.21
186−1.18+0.18−0.67−0.05+0.24+0.06+0.01−0.24
19 16−0.16−0.68−2.02−0.68+0.05−0.11−0.12−1.19
OVER-ALL318−0.53+0.05−0.52−0.15+0.06−0.09+0.02−0.49
Notes: 1 indicates the reach is a dynamic beach. 2 Bold EPR indicates a short-term change rate greater than −1.0 m/yr 3 --- indicates analysis not run due to extensive human manipulation of the coastline. Construction of the marina at Reach 12 commenced in the 1960’s. 4 (−) m/yr indicates an erosional rate of change; (+) m/yr indicates an accretional rate of change. 5 Uncertainty calculated in the DSAS software by taking the square root of the summation of squares (of coastline uncertainties in Table 2), divided by the number of years between the two coastlines.
Publisher’s Note: MDPI stays neutral with regard to jurisdictional claims in published maps and institutional affiliations.

