1. Introduction
The production of statistical data is nowadays more and more “geo”, and the production of geospatial data is more and more “statistical”; therefore, it is logical to envision a greater integration of these two areas. In this way, and according to the United Nations Committee of Experts on Global Geospatial Information Management [
1], the integration of statistical and geospatial information and the resulting geospatially enabled statistics are significant components in meeting the data demands that inform decision-making needs at either the local, national, regional, or global level. Thereby, linking data about people, businesses, or the environment to a geographic location and their integration with other geospatial information through their location can promote a much better understanding of economic, social, and environmental perspectives.
In this sense, geospatial information and statistical information are intrinsically related. The former uses statistical information as part of the attributes of each geospatial entity, and the latter uses geospatial information as a basis for describing the spatial distribution of some of the statistical variables. Both types of information provide a description and a model of the real world at general scales. In this context, geospatial information describes the geometric object of discrete and continuous phenomena characterized by positions in space and some attributes that can record physical variables or reflect human activities. On the other hand, statistical information pays more attention to assessing cultural aspects of reality that can be different depending on the regions of space. For these reasons, both information domains appear to be, in fact, two sides of the same coin.
Following the idea outlined in the previous paragraph, this paper has three interrelated objectives: The first is to highlight the increasing confluence of the production of statistical and geospatial data; the second objective is to show the existence of frameworks adapted to each domain with some analogue aspects; and finally, the last objective is to propose a convergence of these frameworks in order to achieve synergies that are more significant and provide better products and services to citizens and public administrations. This work makes a novel and broad contribution by comparing two different but close domains from technological and organizational perspectives, offering examples of technology transfer from one domain to another, detecting the presence of gaps and synergies and with its challenges to research, organizational management and management of these data.
This document is organized as follows: in
Section 2, the general actors and frameworks that govern the statistical and geospatial domains are presented;
Section 3 offers the frameworks proposed by the United Nations for the statistical domain;
Section 4 outlines a route that attempts to be parallel to
Section 3 in the geospatial domain. However, since the geospatial domain is more open than the statistical one, the frameworks are more dispersed and more diverse; in
Section 5, particular attention is paid to outlining some legal aspects which, in our opinion, have not been considered sufficiently so far.
Section 6 is dedicated to examples that show the symbiosis between developments in the statistical and geospatial domains. Herein, the first example shows the application of the Generic Statistical Business Process Model to geospatial data production. The second example explains how to use the ISO 19157 spatial data quality model in statistical data, and the last example demonstrates how to integrate both areas through Linked Data. Finally, a discussion and the main conclusions of this study are included.
2. General Actors and Frameworks
Statistics and cartography have been related since their inception. However, the evolution of these two domains in recent decades has generated leadership structures, orientations and general frameworks that are somewhat different. This section is devoted to describing these differences and what it is convenient to know before proceeding with the analyses carried out in
Section 3 and
Section 4.
In the statistical domain, and due to the economic importance of statistical data, there are many international entities, such as the United Nations (UN), the Organization for Economic Co-operation and Development (OECD), and the European Statistical Office (EUROSTAT), that have developed leadership activity in statistical production. These efforts have been geared towards establishing methods for obtaining comparable (semantically equivalent) data across countries (e.g., gross domestic product (GDP), income, censuses, etc.). In the case of the geospatial domain, with a perspective more open to the market, to companies and users, the focus has been placed mainly on the interoperability of systems. For this reason, standardization organizations such as the International Organization for Standardization (ISO) and the Open Geospatial Consortium (OGC) have taken the lead. In this sense, the link between geospatial issues and ISO makes it much more open to the industrial and technological fields and general standards. In relation to the contents themselves, there are also transnational initiatives, such as INSPIRE (
https://inspire.ec.europa.eu/, accessed on 10 April 2021), EuroGeographics (
https://eurogeographics.org/, accessed on 10 April 2021), the Pan American Institute of Geography and History (PAIGH,
https://www.ipgh.org/, accessed on 12 April 2021), Multinational Geospatial Co-production Program (MGCP), etc., which have been concerned with achieving a common semantic regarding geospatial data.
Considering the fact that official statistics and cartography are part of e-government in modern administrations,
Figure 1 presents an overview of the technological frameworks of both domains. It should be noted that the UN already has a proposal for a common geospatial-statistical framework. In this sense, the statistical and geospatial frameworks must be understood within other more general interoperability frameworks, for instance the European Interoperability Framework version 2 (EIFv2) and the E-Government Interoperability White Paper version 3 (EIWPv3) defined by the Economic Commission for Latin America and the Caribbean [
2], among others. All frameworks have some aspects in common, and one of these, which is extremely important, is that interoperability must be implemented at all levels (local, regional, national and international) in order to improve the use and reutilization of data. These frameworks propose the adoption of standards, multipart and distributed solutions, open data, and a service architecture.
Moreover, these frameworks encourage the use of authentication of both documents and people. Finally, EIFv2 and EIWPv3 also define a set of indicators and some practical examples. The idea of having a schema of interoperability indicators would allow us to monitor, describe and improve interoperability objectively. In the case of geospatial standards, the Reference Model for Open Distributed Processing (RM-ODP, ISO/IEC 10746-1:1998) is commonly used by both the ISO and OGC initiatives because the RM-ODP provides an overall conceptual framework for building distributed systems incrementally.
3. The Statistical Framework
The Information component. This is defined by the “Generic Statistical Information Model (GSIM)” [
3] and represents the core pieces of information needed by statistical organizations to produce statistical outputs.
The Processes component. The “Generic Statistical Business Process Model (GSBPM)” [
4], which describes the core business processes undertaken by statistical organizations to produce statistical outputs.
The Organization component. This is explained by the “Generic Activity Model for Statistical Organizations (GAMSO)” [
5], which describes overarching activities and management processes to support official statistical production.
The Technological component. This is defined by the “Common Statistical Production Architecture (CSPA)” [
6], which is oriented towards the creation of interoperable tools to share within and between statistical organizations.
Collectively, these four components are called the “ModernStats” models. These models are generic and intended to be applicable across international, regional, national and local statistical organizations. However, these models are not unique, as we can follow others such as the Generic Statistical Data Editing Model (GSDEM), the Modernization Maturity Model, the Common Metadata Framework, the Global Statistical Geospatial Framework (GSGF), etc. In the following subsections, we briefly introduce each of the four components indicated above as well as the GSGF.
3.1. Generic Statistical Information Model (GSIM)
Data constitute the most crucial element of statistical production, and a specific model is required. The GSIM is a reference framework that establishes a conceptual model for statistical information that enables generic descriptions of the definition, management and use of data and metadata throughout the complete statistical production process. It is important to notice that both data and metadata are considered jointly. This model plays a significant role in the arena of the semantic interoperability of data and is one of the cornerstones of the modernization of official statistics, moving away from subject matter silos [
3] and allowing better communication and understanding between stakeholders. A lack of common terminology has been a heavy barrier, but the use of GSIM as a common language increases the ability to compare information within and between statistical organizations [
6]. The information objects of the GSIM are the input and output elements of the GSBPM sub-processes, so this model is complementary to the GSBPM, and each one of these models helps the other in its correct implementation.
GSIM identifies more than a hundred information objects arranged in four groups:
Base group. This includes 12 information objects that provide features reusable by other objects to support functionality (e.g., owner, role, agent, etc.).
Concepts group. This contains 39 information objects centered on the meaning of the data and providing an understanding of what the data are measuring.
Structure group. This includes 26 information objects used to describe and define the terms employed regarding information and its structure (e.g., data set, data resource, data point, data structure, etc.).
Business group. This collects 31 information objects used to capture the designs and plans of statistical programs and the processes undertaken to deliver those programs (e.g., statistical needs, statistical programs, statistical program cycles, business cases, etc.).
Exchange group. This includes 21 information objects used to catalogue the input/output exchanges of information of a statistical organization (e.g., information provider, information consumer, exchange channel, data harvest, product, etc.).
3.2. Generic Statistical Business Process Model
The Generic Statistical Business Process Model (GSBPM) is probably the first recognized piece of statistical organizations’ modernization. Nowadays, the GSBPM is used by more than 50 organizations worldwide, and is considered a cornerstone by the HLG-MOS in the quest to achieve the vision of a standards-based modernization. Additionally, it is essential to note here that the current version of the GSBPM (version 5.1) includes changes to incorporate the growing importance of integrating statistical data with geospatial data.
The GSBPM can be defined as an ordered collection of related and structured logical activities and tasks performed by statistical producers to convert data inputs into statistical information. This model is data-source-independent, generic, logical and exhaustive in its scope, meaning that it can be applied to all data-production activities undertaken by producers of official statistics, regardless of the level of performance (e.g., global, regional, national, local). It is valid for new data products, existing data revisions, time-series, or any kind of data. The GSBPM comprises a vision with three levels: Level 0, or the Management level, Level 1, or the Phases Level, and Level 2, or the Sub-processes level.
The Management level, Level 0, is related to what we can call several management sub-systems but are generally termed “overarching processes.” The aim is quality assurance in production processes. Overarching processes are not cross-cutting to the whole organization; they are only cross-cutting (overarching) to the eight phases of the GSBPM [
7]. The same perspectives are considered under the GAMSO framework for the entire organization. The United Nations [
8] offered a more general view in the “United Nations National Quality Assurance Frameworks Manual for Official Statistics”, including recommendations, the framework and implementation guidance. The overarching processes included at Level 0 [
4] are:
- ◦
Quality management. The focus is on the organization’s quality, but the quality management overarching process refers to product and process quality in the present framework.
- ◦
Metadata management. The relevance of metadata is recognized, and a metadata management system is proposed to ensure that metadata retain their links with data throughout the GSBPM. This includes process-independent considerations such as metadata custodianship and ownership, quality, archiving rules, preservation, retention, and disposal.
- ◦
Data management. The emphasis is on information management throughout the lifecycle and includes process-independent considerations such as general data security, custodianship and ownership, data quality, archiving rules, preservation, retention, and disposal.
- ◦
Process data management. The attention is on the improvement of processes by means of their assessment. This includes the activities of registering, systematizing and using assessment results for better decision making.
- ◦
Knowledge management. This ensures that statistical business processes are repeatable, mainly through process documentation maintenance.
- ◦
Provider management. This includes cross-process burden management, as well as topics such as profiling and management of contact information.
The next level of GSBPM, Level 1, or the Phases level, presents eight phases that conform to the core business processes undertaken by statistical organizations to produce statistical outputs. These phases are directly related to a data lifecycle, and they are:
- ◦
Specify needs. A need detection and specification stage where the producer interacts with stakeholders in order to propose high-level solution alternatives and prepare a business case to meet those needs.
- ◦
Design. This stage includes design activities and any research work needed to define all the elements intervening in the production. The aspects that must be fixed are inputs, outputs, methods, concepts, instruments, and operations, among others.
- ◦
Build. The design created in the previous phase materializes in this phase. Its parts are assembled, configured and adjusted to form a fully operational process within the producer’s production environment.
- ◦
Collect. This phase is exclusively centered on information collection, including data, paradata, and metadata, using whatever collection method may be needed (e.g., acquisition, extraction, etc.), and finishing with a transfer of this information into the appropriate environment for further processing.
- ◦
Process. This stage is exclusively centered on information processing (e.g., integration, classification, cleaning, checking, etc.) to prepare for further analysis and dissemination.
- ◦
Analyze. Statistical outputs and ancillary information (e.g., including commentary, technical notes, etc.) are produced in this phase based on understanding the data and the statistics being produced.
- ◦
Disseminate. This phase is responsible for releasing the statistical products to users in the form of various distributions (e.g., using different file formats) and channels, and it is broken down into five sub-processes.
- ◦
Evaluate. This point develops the evaluation of each specific instance of each statistical-business-process output.
Finally, Level 2, or Sub-processes, deploys the Level 1 phases in 44 well-defined sub-processes. A detailed map of data-related processes is established through them, which is suitable for any organization that produces statistical data. Sub-processes of each phase generally take place sequentially but can also occur in parallel and can be iterative.
It is important to note that there is already documentation that proposes a system of quality indicators for some of the phases of this model (e.g., [
9,
10]).
3.3. Generic Activity Model for Statistical Organizations
The Generic Activity Model for Statistical Organizations (GAMSO) was first developed in 2015 based on the GSBPM, and the Business Activity Model developed by a statistical network conformed at this time by Australia, Canada, Italy, New Zealand, Norway, Sweden and the United Kingdom. This model describes overarching activities and management processes to support official statistical production [
5]. GAMSO is the management complement to the GSBPM. Hence, GAMSO is centered on areas of activities related to the organization’s management and GSBPM on the production process (statistical production). In fact, GSBPM has been incorporated as a deployment of GAMSO’s production activity area. The four activity areas of GAMSO are:
Strategy and Leadership. This activity area includes three high-level strategic activities that enable statistical organizations to develop organizational capabilities in the first place and secondly to deliver the products and services needed by governments and communities nationally and internationally [
5].
Capability Development. This area includes activities focused on the design, development, assessment and transfer of capabilities in order to improve an organization’s efficiency and promote innovation at all levels and in all the different areas (staff, management, production, research, communication, etc.).
Corporate Support. Corporate support includes all the cross-cutting activities required by the organization to deliver its work program efficiently and effectively [
5]. Basically, these are activities focused on ensuring the resources and means for the proper functioning of the organization. They include diverse activities ranging from managing physical space to driving business performance and legislation, as well as obvious activities from the statistical area.
Production. This activity area is deployed by the GSBPM activities. They deliver the outputs approved under Strategy and Leadership, utilizing the capabilities developed under Capability Development and the resources managed under Corporate Support.
The benefits of the GAMSO model are: providing a common vocabulary and framework to support international collaboration activities; providing a basis for resource planning within a statistical organization; supporting the development and implementation of enterprises architectures; and finally, supporting risk management systems [
5]. GAMSO is designed to be generic and applicable across all kinds of government levels of statistical organizations. As well as the administrative and political context, it has a considerable influence on where a statistical organization develops its activity.
3.4. Common Statistical Production Architecture
The Common Statistical Production Architecture (CSPA) is a reference architecture for the statistical industry oriented towards creating interoperable tools to share within and between statistical organizations [
6]. The CSPA is a descriptive specification based on a modular service-oriented architecture approach that focuses on supporting the facilitation, sharing, and reuse of statistical services both across and within statistical organizations, while also fostering alignment with existing statistical standards (e.g., GSBPM or GSIM).
A statistical service is defined as a well-defined interface for accessing statistical business capabilities (e.g., data, metadata, statistical products, etc.) through information technologies. In the CSPA logical information model, the GSIM provides the conceptual layer or framework and the already existing industrial standards, the physical one, such as RDF (Resource Description Framework), SDMX (Statistical Data and Metadata Exchange), JSON (JavaScript Object Notation), etc. It is interesting to highlight that within the statistical entity services, the CSPA considers including “geography services”, which allow for the management and use of geographic information.
CSPA defines an enterprise architecture separated into a number of “perspectives” in order to isolate concerns in a way similar to the RM-ODP viewpoints. These “perspectives” are divided into:
Business Architecture. This defines what the industry does and how it is done (statistics in our case).
Information Architecture. This describes the information, its flows and uses across the industry, and how that information is managed.
Application Architecture. This contains the set of practices used to select, define, or design software components and their relationships (formed by the Computation viewpoint and the Engineering viewpoint).
Technology Architecture. This collects the infrastructure technology underlying (supporting) the other architecture perspectives.
The CSPA Business Architecture defines the need to identify business functions and organize them into business processes that will be achieved by business services. Moreover, CSPA advocates for a service architecture approach that performs one or more statistical process tasks. The service architecture emphasizes the importance of loose coupling. In the CSPA Application Architecture, the concept of global identifiers is introduced as it uniquely identifies entities in the statistical production space, and the fact that messages communicating services use global identifiers is mentioned. The CSPA Information Architecture defines the need for a Logical Implementation Model (e.g., dataset). The CSPA Application Architecture incorporates separate services providing access to statistical information entities (objects) to support statistical production processes in the following categories:
Classification services for the management and use of statistical classifications.
Registry services for the management and use of business, address, and household registered information.
Geography services for the management and use of geographical information.
Statistical metadata services for the management and use of relevant statistical metadata throughout GSBPM statistical production.
In addition, the CSPA Application Architecture recognizes two patterns:
In an event-driven approach, services subscribe to event streams (publish-subscribe pattern) and are triggered in an asynchronous fashion as events occur.
In a process-driven approach (also called request/response pattern), explicit process control functions (workflows) sequence the execution of a collection of services and data flow amongst them.
Additionally, the aforementioned architecture contains three levels of services:
CSPA Service Definition: the capabilities of a statistical service are described.
CSPA Service Specification: these capabilities are fleshed out into business functions covered.
CSPA Service Implementation Description: defines detailed operations whose inputs and outputs are GSIM implementation-level objects.
The CSPA Application Architecture lists the functions of the communication platform used:
Orchestration. This manages the sequence of flow of invocations of the statistical services.
Error handling, where statistical services fail, or the service outputs contain erroneous cases that require a different treatment.
Message payload translation, where a statistical service does not support standard GSIM implementation objects. It can offload this function to a specialized statistical service.
Auditing, logging, activity monitoring.
Performance management.
Security at the level of authentication and authorization.
Finally, it must be noted that the CSPA Application Architecture requires services to be able to support input and output in multiple languages where applicable.
3.5. The Global Statistical Geospatial Framework
The Global Statistical Geospatial Framework (GSGF) has been developed through a collaborative process, engaging statistical and geospatial information agencies globally [
11]. Their main aims are to strengthen institutional collaboration between the geospatial and statistical communities and facilitate data-driven and evidence-based decision making to support local, sub-national, national, regional, and global development priorities and agendas. The GSGF is based on five principles:
Use of fundamental geospatial infrastructure and geocoding. This principle aims to have an infrastructure (the data) that facilitates implementing the proposed framework (the GSGF). This infrastructure must allow standardized and high-quality geocoding of the statistical data in order to ensure the exact assignment of coordinates and grid references. A timestamp adds the time dimension to the spatial framework.
Geocoded units record data in a data management environment. This principle proposes that the minimum and elementary units of statistical data (microdata, recording units) link to highly accurate geographical references (e.g., coordinates, area codes, etc.). This principle’s objective is that statistical data can be used later in any geographic context and also allow the linking of other data, minimizing the risks derived from new geographies or changes to existing ones.
Common geographies for the dissemination of statistics. This principle proposes using the geographic space, made up of a set of geographies, to integrate, work and disseminate statistics, ensuring the processes of aggregation/disaggregation and that users can discover, access, integrate, analyze, and visualize statistical information seamlessly into geographies of interest.
Statistical and geospatial interoperability. This principle aims to achieve a higher degree of interoperability between the statistical and geospatial components, including the data themselves, standards, processes and organizations.
Accessible and usable geospatially enabled statistics. The goal of this principle is to release geospatially enabled statistical information in a functional and accessible form (e.g., using standard web services, linked data technologies, machine-readable access, etc.) within legal compliance and secure frameworks.
4. The Geospatial Approaches
First of all, we remark that we have centered this section on the significant components of the previously presented statistical frameworks. This is so because in the geospatial domain, there is no equivalent global authority to the HLG-MOS, and also because there is a greater tradition regarding the use and development of international standards and adoption of standards from other sectors. The absence of frameworks defined by a global geospatial authority leads us to adopt a different working method in this section than in
Section 3. Thereby, whereas in
Section 3, a description of the documents that establish frameworks was presented, in this section a search for relevant elements (documents, examples, etc.) must be carried out. In this way, we deduce the implicit existence of parallel frameworks to those existing in the statistical area.
The development of the different aspects for each geospatial framework is based in most cases on the ISO and OGC documents (e.g., standards, specifications, etc.) and multinational initiatives (e.g., INSPIRE), where there is a great need for coordination. For instance, OGC has developed an architecture supporting its vision of geospatial technology and data interoperability called the OGC Abstract Specifications (
https://www.ogc.org/docs/as, accessed on 9 December 2020), which provides the conceptual foundation for most OGC specifications and the development of most implementation standards activities.
On the other hand, ISO technical committee 211 currently has more than 82 published documents and 25 projects in preparation. This set of documents (international standards, specifications, and reports) establishes a detailed geospatial framework covering many more aspects (e.g., vocabulary, positioning, ontologies, spatial and temporal models, services, quality, etc.) than those covered by the statistical frameworks presented above. Moreover, from a more specific perspective, the European initiative INSPIRE facilitates public access to spatial information throughout Europe and assists in policy-making across boundaries with a high-level direction that coordinates the sharing of environmental spatial information among public sector organizations.
Considering the diverse initiatives, we observed numerous relevant frameworks in the geospatial domain with extensive experience and development, so it is impossible to thoroughly present them in this document. For these reasons, we offer a geospatial scenario referencing the same components illustrated for the statistical framework in order to set a comparative context between both domains.
4.1. Geospatial Information Model
In order to address the geospatial information model, we distinguish between the conceptual model and the standards that can support it from a geospatial perspective.
4.1.1. Core Conceptual Model
The core conceptual model elements must be a set of standardized and well-defined information objects that are the inputs and outputs used when designing and implementing geospatial information production and dissemination processes. Following the GSIM structure, the conceptual Geospatial Information Model (GeoIM) should be composed of five groups:
Base group. This should contain information objects that provide shared features (e.g., identifiable artefact, role, agent, change event, etc.) related to production and information exchange.
Concepts group. This should comprise information objects associated with semantical definitions of the terms used and semantic registries (e.g., scope, dictionary, concept, feature concept, etc.).
Structure group. This should collect information objects used to describe and define the terms used in relation to information and its structure (e.g., application schema, feature type, etc.).
Business group. This should present information objects used to capture the design, planning and execution of geospatial production programs (e.g., production program, geospatial needs, statistical programs, business cases, etc.).
Exchange group. This should describe information objects used to describe the data products and other information exchanges of geospatial information from the point of view of both the producer and the consumer (e.g., data product specification, data content and structure, etc.).
Figure 2a shows the relationship between crucial information objects in the GSIM, whereas
Figure 2b shows their equivalents in the geospatial world using ISO 19126 for concepts, ISO 19109 for structure, and ISO 19131 for exchange. Note that the ISO 19100 standards family does not provide a standard that covers the business group. For this reason, the information objects for the business group could be adapted from the GSIM.
4.1.2. Implementation Standards
There are three candidates for the concepts, structures, and exchange groups:
ISO 19126 Geographic information—Feature concept dictionaries and registers specifies a schema for geographic feature concept dictionaries managed as registers. The feature concept dictionary contains terms and definitions required for describing thematic spatial object types. Its central role is to support the harmonization effort and identify conflicts between the specifications of the spatial object types in the different themes.
ISO 19109 Geographic information—Rules for application schema describes a metamodel framework for defining features and application schemas. An application schema defines a formal description of the data structure and specifies the associated operators for manipulating and processing data through an application.
ISO 19131 Geographic information—Data Product Specifications describes in a structured way what the user wants—that is, the specification of the product required. While aimed primarily at specifying required datasets, the standard can also define services and other geospatial products.
However, these standards are loosely coupled. A profile is required to support the GeoIM core model. The business group can be implemented with references pointing to information objects defined in these standards.
4.2. Geospatial Business Management
As pointed out previously, it must be noted that there is no geospatial business process model as such, but there are enough references to allow us to assemble this model in a reasonably direct way. In this section, we present an approach to this model on two levels, which are equivalent to the L0 and L1 levels of the GSBPM. The GSBPM L2 level is very detailed, and the deployment of its equivalence in the geospatial domain is beyond the scope of this paper; however, the example presented in
Section 6.1 is an approximation at this level.
As indicated in
Section 3.2, Level L0 comprises overarching processes, which are cross-cutting to the production processes (the 8 phases of the GSBPM), and not cross-cutting to the whole organization. This means that we can construct the L0 level of a “geospatial business process model” looking for references to quality management around specific production issues (e.g., providers, metadata, etc.), leaving a more global and organization-centered perspective, that of quality management systems (QMS), for
Section 4.3.
Quality Management. Considering the perspective of overarching processes, we have to focus on production and not on the organization (see
Section 4.3). In this line, several agencies all over the world have proposed partial quality assurance plans centered on geospatial data (e.g., [
12,
13,
14], etc.). There are also cases of plans focused on some specific typology of data, for example, on digital aerial imagery [
15], on the positional component, or for particular projects (e.g., [
16]).
Provider management. The management of providers is considered in a general way in the ISO 9001 framework. In the field of geospatial data, ISO 19158 Geographic information—Quality assurance of data supply establishes a system for provider management based on the quality principles and quality evaluation procedures of geographic information identified in ISO 19157 Geographic information—Data Quality and the general quality management principles defined in ISO 9000. Quality is understood as data quality, supply quantity, delivery term and production costs. The main ideas to apply are quality control, quality assurance and accreditation, where three levels of accreditation are considered depending on the supplier’s confidence. Guidelines have also been developed for the procurement of supplies of specific data products such as images [
17], mapping products [
18], and more general products [
10]. It should also be noted that traditionally, the calibration of certain equipment has been required from suppliers (e.g., photogrammetric cameras, LiDAR sensors, etc.).
Process data management. Process data management is an immediate exigency of QMSs where decisions must be taken based on evidence. From a simplistic perspective, process data management has traditionally been performed in the geospatial domain using statistical process control tools (e.g., Shewhart control charts) [
19,
20]. With an updated perspective and from our point of view, process data management can be carried out using Business Process Management (BPM) tools. These tools can be linked to spatial data production tools (e.g., ArcGIS™, FME™, gvSIG
®, QGIS
®, etc.) to generate data in order to understand what is happening in the organization. The automation of spatial data production and its control processes is allowing more and more mapping agencies (MAs) to implement monitoring systems for their processes [
21].
Knowledge management. In our very competitive information and knowledge society, knowledge management is a key production factor. As such, QMS provides general guidelines regarding knowledge management, but ISO 30401:2018 sets requirements and provides guidelines for establishing, implementing, maintaining, reviewing and improving an effective management system for knowledge management in organizations. There is no documented case of applying these ideas to geospatial data organizations to our best knowledge. However, the review of the strategic plans of some MAs would indicate that it is an aspect that they routinely consider (see
Section 3.3.).
Data management. There is no specific ISO framework for geospatial data management within the ISO/TC 211 standards, but many ISO/TC 211 standards (e.g., ISO 19131, 19157, 19119, 19117, etc.) can be considered as parts of a general data management framework. In addition, there are other non-ISO sources, such as the Group on Earth Observation (
http://www.earthobservations.org, accessed on 15 March 2021), which provide interesting documents (e.g., Data Management Principles Implementation Guidelines [
22]). Concerning data/information security management, MAs are, in many cases, governmental bodies, and therefore, they must follow the national security frameworks (e.g., the National Security Scheme [
23] or the National Strategy for Digital Security in France [
24]). In Europe, public and private organizations are aware that ISO 27001 is an excellent approach to tackling the EU General Data Protection Regulation (GDPR) compliance. This is because ISO 27001 is one of the most widespread standards in Europe and, therefore, is used by MAs.
Metadata management. In 1994, the Federal Geographic Data Committee adopted its Content Standards for Digital Geospatial Metadata [
25], which was the first specification for digital spatial metadata. Nine years later, ISO/TC 2011 issued the international standard ISO 19115:2003 on metadata. Since these dates, the MAs have been concerned first with creating data and services metadata and then integrating them into the life cycle of the products they refer to and maintaining them over a long period. The latter means preservation, and in 2018 a new international standard was issued concerning preservation: ISO 19165-1:2018. Thus, there are ISO frameworks for the interoperability of geospatial metadata and its preservation, but there is still no specific framework for its management. CEOS (
http://ceos.org, accessed on 15 March 2021) offers several guidelines for the management of metadata (e.g., preservation, best practices, etc.) related to observational data from the Earth and other MAs with a more general perspective [
26]. This includes process-independent considerations such as metadata custodianship and ownership, quality, archiving rules, preservation, retention and disposal.
Concerning the L1 level, we must consider the experience regarding the life cycles of geospatial data. A data life cycle provides a high-level overview of the stages involved in the successful management and preservation of data for use and reuse [
27]. There is no ISO/TC 211 standard devoted specifically to this matter, but mentions and recommendations related to the geospatial data life cycle are found in many ISO standards and equivalent documents. For instance, ISO 14721:2003 is a conceptual framework describing the environment, functional components, and information objects within a system responsible for the long-term preservation of digital materials, which also proposes a lifecycle model for data archives integrated with other ISO standards such as ISO 9001 and ISO 15489 [
28]. More recent is the ISO/IEC 27050:2016 standard that defines phases for handling electronically stored information, which can be considered a general data management (life cycle) process. In the geospatial domain, the Federal Geographic Data Committee [
29] issued a lifecycle model which advocates compliance with Office of Management and Budget Circular A-16: “Coordination of Geographic Information and Related Spatial Data Activities.” Federal USA agencies must use this model to develop, manage, and report on National Geospatial Data Asset (
https://www.geoplatform.gov/ngda/, accessed on 14 March 2021). Additionally, from a science data perspective, the United States Geological Survey has developed its Science Data Lifecycle Model [
30], wherein description, quality management, and security have been included as cross-cutting model elements of the lifecycle. In Andalusia (Spain), Technical Mapping Standard NTCA 01002 [
31] proposes a data life cycle as the basis for a data quality assurance model so that both models are considered together in order to organize the geospatial data production. It is certain that various versions of the geospatial data lifecycle exist, and the differences are due to the specificities of each MA, but this circumstance does not mean that the phases of a general life cycle cannot be defined and applied to all cases, as is the case of level L1.
4.3. Strategic Planning in Geospatial Organizations
Firstly, we want to remember that GSBPM and GAMSO are related but have different focuses. The first focuses on the production processes (phases) and the second on the organization’s own management activities (called “activities”). This causes some activities in the GAMSO framework to appear as overarching processes in the GSBPM framework. We assume this distinction of levels in order to approach the development of this section.
The GAMSO model describes and defines quality management activities. Quality management has been a topic of great interest in the geospatial field for decades [
20]. Regarding this aspect, the basic reference adopted in the geospatial sector was the ISO 9001 standard in its successive versions (1994, 2000, 2008, 2015). This standard provides a QMS general framework for managing quality processes within organizations regardless of size or work area. The GAMSO activities are directly linked to the contents associated with leadership, competence, support and operation of the ISO 9001 international standard. Focusing on the producers of official geospatial data, it should be noted that EuroGeographics (
https://eurogeographics.org/, accessed on 10 April 2021), the association of cartographic and cadastral agencies in Europe, has promoted its application through various publications [
32,
33,
34]. The cartographic agencies that have implemented this system have been numerous (IGN-France, Ordnance Survey, IGN-Turkey, ICGC-ES, etc.). In any case, the extent of its application has not been significant, perhaps conditioned by the first experiences that indicated an increase in bureaucracy without clear benefits for quality. In the field of private companies dedicated to the production of geospatial data (e.g., photogrammetric data capture, mapping, cadastral services), its application has been most significant, although conditioned by the requirements of official contracting, e.g., the requirement of quality certifications in official tenders [
20].
Given that not all organizations may wish to be certified according to ISO 9001 and that, in addition, it is difficult to access the documentation of an organization’s QMS, an alternative exploratory path has been considered. In this way, it is appropriate to analyze instead the existence of strategic plans (SP), documents that usually have a more public perspective than the documentation of a QMS and that typically include proposals aligned with the GAMSO model’s activities. We carried out a worldwide search for the period 2009–2019 of SP related to geospatial data production, geomatics and spatial data infrastructures (SDI), mostly performed by a MAs. To execute this query, we started with a list of all the existing national MAs. We restricted the search to documents written in English and centered in the last decade (2009–2019) by means of web searches with the name of the organization and the following keyword combination: [organization name] ++ [“strategic plan”].
After analyzing the almost eighty SPs found, we classified them with the dual objective of identifying which MAs have devoted efforts to GAMSO activities. Moreover, we also determined qualitatively what degree of approach they have in their theoretical model. According to our analysis, the MAs would fall into some of the following groups:
Group I. The organization has no structured SP.
Group II. The organization has incomplete SPs with respect to the GAMSO model, focusing only on the first of the model’s four areas of activity, strategy, and leadership.
Group III. The organization has complete plans with respect to the GAMSO theoretical model.
Group IV. The organization has developed activities that transcend the model, thinking more of strategic activities for a data policy than activities developed to build the agency’s organizational model in the geo-information context of the digitalization of public administrations.
We considered the following geographic areas: the Americas (31 countries), Eastern Asia, Southeast Asia and Oceania (30 countries) and Europe (58 countries). Africa was not considered as no results were found in this continent. In the case of Eastern Asia, Southeast Asia and Oceania, it should be noted that there are two different perspectives, that of the Australian and New Zealand Land Information Council (ANZLIC,
https://www.anzlic.gov.au, accessed on 20 March 2021), which has the perspective of official mapping agencies, and the Pacific Geospatial and Surveying Council (PGSC,
http://pgsc.gem.spc.int/, accessed on 20 March 2021), which have a more practitioners’ association perspective. In this case, there are also some SPs centered on specific areas, for instance, GNSS [
35,
36], Earth Observation [
37], and other cases with a broad scope concerning a nationwide perspective (e.g., [
38]).
Regarding the analysis of SPs of MA, we only looked at the documents available on the web. Hence, we consider that if there is no SP published on the web, it has not given enough importance to IT and should not be considered. The numerical results are presented by continents and groups in
Figure 3. In this figure, the “Total available” bar indicates the percentage of localized cases with respect to the total number of countries in each geographic area. Summarizing the situation, we found quite a low percentage of SPs published, only 34 out of 89 cases (38%), which means that 62% of MAs are in Group I. Looking at those 34 SPs, 62% are in Group II, having a classical simple SP based on vision, mission and strategy; 35% are in Group III, having a GAMSO like SP; and 3% have a diverse and advanced SP. This result is not very good and means that in many cases, the MA performs strategic analysis and takes decisions based on intuition, without considering an explicit approach. This has very well-known disadvantages, which include unclear vision, lack of sustainability and non-comparable plans. In the case of Europe, it should be noted that the search results are disappointing. We expected a greater strategic scope in those MAs, which are a global reference among MAs outside of the developed world.
In any case, let us consider the case of the UK as being noteworthy for its innovative character, developing the UK’s geospatial strategy from 2020 to 2024. The UK, by means of The Geospatial Commission, which is an independent committee directing the MAs with the suggestive slogan “Unlocking the power of location”, will release a common strategy for the six main geospatial production actors: the British Geological Survey, Coal Authority, UK Hydrographic Office, HM Land Registry, Ordnance Survey and Valuation Office Agency. This model opens up a new stage in the data agencies’ strategic planning, where the activities may be the same as in the GAMSO model, but the goal is not to transform the data agencies but instead define a national data policy. In other places, such as in Scandinavian countries, these new goals are defined through the foundation of new agencies for data supply over the traditional statistical and cartographic agencies, opening up a new stage in SP. This trend might indicate the necessity for a new revision of the GAMSO model.
In conclusion, the countries where MAs have implemented SPs show results similar to the GAMSO model, and these were implemented earlier than that model appeared; the central problem in the majority of the countries is the absence of strategic activities rather than the lack of a model.
4.4. Information Technology Reference Model in Geospatial Production
As we mentioned previously, it must be noted that there is no geospatial production architecture as such, and that the RM-ODP standards have been widely adopted, and they constitute the conceptual basis for the ISO 19100 series of geospatial standards (being a normative reference in ISO/DIS 19119). Additionally, the RM-ODP was the basis for the OGC Reference Model document (
http://portal.opengeospatial.org/files/?artifact_id=3836, accessed on 9 December 2020). Modern versions of the OGC Reference Model have deviated from the RM-ODP (
https://www.ogc.org/standards/orm, accessed on 9 December 2020), but we can still see the separation of viewpoints in the structure of the document. The RM-ODP defines five views that we can relate to the perspectives of the CSPA (see
Section 3.4):
Enterprise viewpoint: This focuses on the purpose, scope and policies for that system (called Business Architecture in the SCPA).
Information viewpoint: This concentrates on the semantics of information and information processing (called Information Architecture in the SCPA).
Computational viewpoint: This captures component and interface details without regard to distribution (which considered together with the Engineering viewpoint is called Application Architecture in the SCPA).
Engineering viewpoint: This presents the mechanisms and functions required to support distributed interaction between objects in the system (which considered together with the Computations viewpoint is called Application Architecture in the SCPA).
Technology viewpoint: This describes the choice of technology (called Technology Architecture in the SCPA).
As indicated previously, the CSPA Business Architecture defines the need to identify business functions and separate them into business processes that are achieved by business services, and this is also applied in the geospatial domain where web services are the bases. Thereby, the CSPA specifically mentions a service-oriented architecture (SOA) and clarifies that it is different from web services, although web services are used to implement SOA. In the OGC, a narrower definition of SOA was adopted to reference web services, implementing a binding based on remote procedure calls (RPC) using HTTP (Hypertext Transfer Protocol) methods that transport XML (eXtensible Markup Language) encoded payloads. This was the state-of-the-art when they were initially designed in the late 1990s. Currently, the OGC geospatial web services are transitioning towards web application programming interfaces (APIs), which use HTTP methods in the way they were originally defined and entail lightweight encodings such as JSON (
https://ogcapi.ogc.org, accessed on 9 December 2020). This approach is also accepted in the broader definition of SOA adopted by the CSPA Application Architecture. Regarding the need for a logical implementation model, the OGC Reference Model (RM) spends quite a long time presenting the information model based on maps, features, coverages and sensors, and we can conclude that both models (OGC and CSPA) are based on the concept of the dataset. In relation to the classification of services by the Application Architecture of the CSPA, the OGC RM introduces the following separation that has some elements in common but is nevertheless different:
Service (bind operations): This publishes services to a service directory and delivers services to service consumers.
Service Consumer (provides find operations): This performs service discovery operations on the service directory in order to find the service providers it needs and then accesses service providers to provide the desired service.
Service Directory (publish functions): This helps service providers and service consumers to find each other by acting as a registry of services.
Concerning the supported levels of services, the service definition in OGC (first level) is covered by the OGC Abstract Specification (
https://www.ogc.org/docs/as, accessed on 9 December 2020). Modern OGC services are written independently of the binding physical implementation (service specification), and the latter defines the physical implementation (sometimes called binding or service implementation). Some of the new OGC APIs are just another binding for the abstract principles, but others take approaches that are more pragmatic and develop convenient APIs.
Nowadays, the functions of the communication platform implemented in OGC standards cover orchestration, error handling, and sometimes security. The OGC has a working group on Quality of Service and Experience (
https://www.ogc.org/projects/groups/qosedwg, accessed on 10 December 2020) exploring how to consider auditing, logging, activity monitoring and performance in the OGC. Payload translation is achieved by ad hoc independent OGC services. Finally, regarding multiple support languages, this capability is often forgotten by OGC services but has been partially reintroduced by INSPIRE extensions and included by the HTTP language negotiation supported by the new OGC APIs.
4.5. A Global Geospatial Framework
It is important to indicate that there is no proper geospatial framework in the geospatial field, as is proposed for the statistical case by the GSGF. ISO standards and OGC documents have a different perspective on what needs to be dealt with in a framework that runs parallel to the GSGF. In this way, it is more appropriate to seek more applied initiatives if challenges are posed on the data themselves. Therefore, it is interesting to compare the GSGF with other multinational initiatives such as INSPIRE from a geospatial perspective. This initiative is centered on creating an SDI for Europe used mainly to facilitate environmental policy decisions in the European zone [
39]. INSPIRE defines de facto a consistent set of web services dealing with all interoperability actions; indeed, data download and metadata interchange are considered web services. It is based on five general principles:
Data should be collected only once and kept where they can be maintained most effectively.
It should be possible to combine seamless spatial information from various sources across Europe and share it with many users and applications.
It should be possible for information collected at one level/scale to be shared with all levels/scales; detailed for thorough investigations, general for strategic purposes.
Geographical information needed for good governance at all levels should be readily and transparently available.
It should be easy to find what geographic information is available, how it can be used to meet a particular need and under which conditions it can be acquired and used.
These five principles are related to general organizational interoperability issues as far as they deal with high-level management ideas. In this sense, the comparison of the principles of GSGF and the approach of INSPIRE employed to obtain a functional system successfully is quite interesting and is shown in
Table 1.
In the view of other more general interoperability frameworks (e.g., EIFv2 and EIWPv3) and INSPIRE, some of its premises and implementation should guide us in the proposal of a Global Geospatial Framework:
A modern service-oriented architecture: this allows on-the-fly mapping from statistical data to geospatial data.
Openness: open data, open services, open source and open standards.
User-centered architecture and development.
Multilingual.
W3C standards but not forgetting ISO, OGC and ITC standards.
Interoperability assessment using indicators.
Implementation of organizational and management aspects to obtain interoperability, following GSGF principle 4.
5. Regulatory Framework and Legal Implications
Regulatory frameworks that have legal implications affect the statistical and spatial fields. This is a vast and complex aspect that we want to outline here, given its relevance. In this section, the regulatory framework and legal implications will be examined together through a comparative discourse.
The legal approach can be aligned with the Roman legal aphorism that “
where there is society, there is law”. In geospatial data [
40], which must be accomplished with legality, it is based on the principle of “where there is a law, there is “space” and, consequently, the spatial and spatio-temporal dimensions are essential (e.g., regulations, legal defense, etc.). Reality happens in a place and generates statistics. Place changes over time as statistical values. Geospatial and statistical knowledge of reality and its subsequent representation are essential for the jurist in applying legal science and technology to achieve harmony, the effectiveness of fundamental rights and freedoms and justice. Thus, in relation to the legality of statistical data, “where there is a law, there are statistics”.
The current regulatory framework for statistics is heterogeneous, lacking harmonized legal norms, and broad due to the existence of national and international standards. The regulation of statistical data is generated by entities at different levels, from the United Nations Economic Commission for Europe (UNECE) to Eurostat, as well as the various agencies in the United States. For legal reasons, technical documents approved by entities or associations, generically called “technical standards”, lack the general legal force of legal norms adopted by national parliaments [
40]. The economic interest and societal need for the use of statistical and geospatial data have led countries to adopt common legal instruments and standards. In order to safeguard the rights, freedoms and legitimate interests of citizens with regard to statistical and geospatial information, these legal standards clarify, simplify and harmonize the applicable principles and rules ([
41] and others). However, the central authority model in the European Union, with Eurostat as the statistical authority [
42], differs substantially from that followed in the United States. The latter defines multiple agencies, which generates greater regulatory heterogeneity: (the Bureau of the Census), the Bureau of Economic Analysis (BEA), the Bureau of Justice Statistics (BJS), Bureau of Labor Statistics (BLS) or STAT-USA, an agency in the Economics and Statistics Administration (U.S. Department of Commerce). However, in the spatial field, despite distributed production, there is leadership by the Federal Geographic Data Committee that establishes regulatory standards for the production of spatial data. Comparing geospatial and statistical data in the European Union, Directive 2007/2/EC establishes INSPIRE [
39] for geospatial data, whereas, for statistical data, there is no harmonized and legally enforceable body of rules.
The legal rules applicable to the statistical function seek to guarantee its coherence and comparability. In practice, this takes the form of cooperation and coordination between the competent authorities in the development, production and dissemination of statistics, which is articulated through systematic development and according to the existing legal framework in international and national organizations ([
41]; Law 12/1989 in [
43]). The necessary legal harmonization of the statistical function in its relation to geospatial data is not limited to the statistical domain only. It affects relevant legal matters such as privacy [
44], transparency (Law 19/2013 in [
45,
46]), the re-use of public sector information ([
47,
48]; Law 18/2015 in [
49]), and more particularly interoperability [
40,
50,
51].
Statistical cooperation and coordination and the correct implementation of the international statistical system elements lead to the promotion and use of international concepts, classifications and methods, mainly to ensure greater coherence and better comparability between statistics on a global scale. This perspective could be synthesized under the concept of interoperability [
40,
52], which has been developed in the geospatial domain [
53], and which includes the technical, semantic and organizational dimensions. However, the most important dimension of conformity to the existing legal order and legality are the enforceability of interoperable statistical data application between technical operators and legal actors.
Typically, legal frameworks support the idea that statistics at the supranational or international level are produced from data developed and disseminated by others, such as national statistical authorities. However, due to the need for privacy, transparency, re-use and interoperability, there is currently no harmonized strategy to facilitate the compilation of statistical aggregates, which are essential for designing public policies with a territorial or personal scope. The same situation exists in the field of geospatial data, where some regional digital maps are regularly produced in Europe by EuroGeographics (ERM, EGM, EuroBoudaries, EuroDTM) and in America by PAIGH (Integrated Maps of South, Central and North America), applying good common practices and methods, but without an explicit common standard.
Regardless of the data models or sources and the statistical organization itself, the statistical function is neither independent nor exclusive of the application of legal standards. The rights and freedoms of individuals are also enforceable and binding in the statistical function (Law 12/1989 in [
43]). For this reason, statistics must also respect, among other rights, the right to private and family life and the protection of personal data ([
41]; Law 13/2018 in [
54]).
Because of its direct application to statistical and geospatial data, it should be noted that the right to the protection of personal data is, at least in the European Union, an autonomous right regarding privacy and a fundamental right. In addition, as a characteristic of the high degree of protection intended to guarantee, it is the only fundamental right whose protection has been assigned to an independent supervisory authority and prior to judicial control, according to Art. 8.3 of the Charter of Fundamental Rights of the European Union.
Various statistical standards (national, international and those regarding geospatial data) set out provisions to ensure the protection of individuals regarding the processing of personal data and the free movement of these data. Both dimensions, protection of the data themselves and combining their freedom of movement, are essential for a balanced application of legal rules on data in the statistical or geospatial domain, whether or not they are of a personal nature.
However, in the statistical field, in official statistics, confidentiality is distinguished from personal data protection. Confidentiality is an obligation that may arise from law or contract, but the privacy of individuals is a fundamental right. In addition, the respective purposes are different: confidentiality of statistical information aims at preserving the trust of citizens and of the entities responsible for providing such information. Data protection, on the other hand, seeks to protect the privacy of individuals. Consequently, the rules governing statistical confidentiality safeguard two main guarantees: on the one hand, to ensure the confidentiality of the data used in statistical production; and on the other hand, to provide access to such confidential data in response to technical progress and the needs of users in democratic societies. The guarantee of confidentiality has a robust legal basis: the availability of confidential data for statistical needs, general or particular, is of great importance in increasing the benefits of the data and thus improving the quality of statistics and ensuring a flexible response to statistical needs. In the context of big data or aggregated data, and for research purposes, access to confidential data used for the production, development and dissemination of statistics is legally permitted. In parallel, legal rules, which are also recognized in various statistical models, strictly prohibit the processing of confidential data or information for purposes that are not exclusively statistical, such as administrative, legal or, fiscal data or even the control of statistical units.
Due to its practical relevance, the General Data Protection Regulation applies to the processing of personal data for statistical purposes [
41]: “Statistical content, access control, specifications for the processing of personal data for statistical purposes and appropriate measures to safeguard the rights and freedoms of data subjects and to ensure statistical confidentiality should, within the limits of this Regulation, be laid down by Union or Member State law”. It is clarified that the statistical purpose implies that the result of processing for statistical purposes is not personal data but rather aggregated data, and that this result or the personal data are not used to support measures or decisions relating to individual natural persons.
6. Examples
This section aims to show the potential for symbiosis between developments in the statistical and geospatial fields. There are many possible examples of a very diverse nature, such as the use of OGC services (joint of tables, catalogues, etc.) for statistical data, application of the GSBPM to the field of geospatial data production, the use of discrete global grid systems for statistical geographies support, etc. Three examples have been selected: the first one assesses the application of a statistical framework to a geospatial data product (
Section 6.1); the second one evaluates the opposite (
Section 6.2), and the third one is centered on an intermediate term between the two fields (
Section 6.3).
6.1. Application of the GSBPM to a Geospatial Product
In this section, we present the application of the GSBPM to the case of a geospatial data product. It is an initial approach exercise, but one that is of great relevance in determining the feasibility of the proposal. The product is called Datos Espaciales de Referencia de Andalucía (DERA) (Spatial Reference Data of Andalusia) (
https://www.juntadeandalucia.es/institutodeestadisticaycartografia/DERA/, accessed on 30 March 2021). DERA is produced by the IECA (Instituto de Estadística y Cartografía de Andalucía) (
http://www.juntadeandalucia.es/institutodeestadisticaycartografia/, accessed on 30 March 2021), the official statistical and mapping agency of the regional government of Andalusia (Spain).
DERA is a collection of geospatial data layers of different geometric natures (points, lines, polygons, raster images) that cover the autonomous region of Andalusia, constituting the main spatial database in terms of the thematic diversity of the autonomous government. The layers are organized into thematic blocks (relief, hydrography, transport and communications, administrative divisions, etc.). This data product is generated by compiling information from very different sources to guarantee updating, geometric coherence and territorial continuity. DERA is a complex and complete product that can be used for GIS analysis, offered through web services (e.g., WMS, WFS, etc.), and even create printed cartography (hard copies). For these reasons, we consider it an excellent example of the proposed analysis. Additionally, IECA geospatial data products follow INSPIRE technical specifications, so this example has a broader perspective than IECA’s own.
In order to carry out the analysis, we had the help of those responsible for the information infrastructures area and the cartographic production service of the IECA. A document compilation process was carried out regarding the entire life cycle of DERA (see footnote of
Table 2) to support this approach with written evidence.
The references were analyzed by a group of three experts, and in cases of doubt, those responsible for the activities were asked. In this way, we built the matrix presented in
Table 2, which shows each of the GSBPM phases and their sub-processes (Level 2). Each of the sub-processes for which there is sufficient explicit evidence in the documentation are marked with a cross.
The degree to which the existing documentation covers the sub-processes of the GSBPM model is very high. This means that the model can be easily adopted for the DERA. The parts where there is minor coverage are the Design and Follow-up phases. On the other hand, it should be noted that some of the sub-processes are not directly applicable to the general case of geospatial data products. For example, it is unusual for these products to perform analysis operations, as was indicated previously in the comparison of life cycles.
6.2. Application of ISO 19157 to a Statistical Product
The
Sistema de Información Multiterritorial de Andalucía (SIMA) (Andalusian Multi-Territorial Information System (
https://www.juntadeandalucia.es/institutodeestadisticaycartografia/sima/index2.htm, accessed on 30 March 2021) is a statistical data product of the IECA, conformed as a data warehouse, that offers a large amount of multi-thematic and multi-territorial statistical information whose variables come from a large variety of sources. It was taken as an example case because it is reasonably representative of the statistical data products of most local, national and regional statistical bodies since they present somewhat similar quality descriptions. In order to carry out the analysis, we had the help of the IECA’s information management area.
This product has a technical report [
55] that presents its description, production methodology and content. It is important to note that many variables of this statistical data product follow Eurostat technical guidelines, therefore this example has a broader perspective than IECA’s own. The municipal aggregation level, which is the most complete, collects 887 variables grouped in a tree with six main thematic branches: the physical environment, demography and population, society, economy, the labor market and finance. There is no information available on the quality of the data, but there is a document on quality indicators [
56] taken from the European Statistical System Quality Assurance Framework (ESS QAF) [
57]. However, no indicator has been included regarding the accuracy and reliability of the data. In reality, the majority of the indicators are strategic indicators related to the production and publication activity of the SIMA. Only the metadata rate is an indicator of the quality of the metadata; specifically, it is a metadata completion. For this reason, the quality of the statistical data remains to be described, which the accuracy and reliability indicator of the ESS QAF would characterize.
In order to propose how to complete the description of quality described in the previous paragraph, a selection of variables was analyzed, and we performed an attempt to explore the possibilities of adapting and applying the principles and prescriptions of ISO 19157:2014. A first consequence of following the model of the standard to describe data quality is the necessity to define the scope of application, to choose which dimension of quality is to be determined (e.g., relevance), which element of quality (e.g., the impact on users), what measure (e.g., the annual number of data requests) and the method of measurement. This last step is undetermined in both the SIMA and the ESS QAF cases.
Following the test carried out to apply the ISO 19157 quality model, the municipal level of SIMA was chosen. For this exploratory analysis, twelve variables were chosen; that is, two for each of the thematic branches. The variables have very diverse units of measurement, such as individuals, euros, tons of garbage, cultivated area, etc., and many of them refer to specific categories (e.g., genre, use or coverage, business sector, level of education, etc.). Some variables express total sums (e.g., the sum of area, counts of people and businesses, etc.), mean values (e.g., age, income) and percentages (e.g., by category, etc.).
The application of the ISO 19157 quality model to the variables analyzed can be considered almost straightforward, given its generic definition. As an example,
Table 3 presents the application of ISO 19157 to two SIMA variables (primary care resources and built-up plots by property). However, the straightforward application does not apply with the quality measures (ISO 19157 Annex D), many of which are specific to geospatial data, and therefore measures more appropriate to the statistical needs should be proposed. Thus, focusing the analysis on the applicability of the quality elements of ISO 19157 to the analysis carried out, the following elements can be considered:
Logical consistency elements. The quality elements domain consistency and format consistency are directly applicable to all cases of statistical variables analyzed. In addition, in that case, it can be considered that automated checks have already been carried out that allow their control by complete inspection. The quality elements of ISO 19157 are applicable, the control methods are equivalent to those applied on geospatial data, and the measures proposed by ISO 19157 are applicable, so reporting on these quality elements would be relatively simple. Some qualifications are required for the other two aspects of logical consistency: topological consistency and conceptual consistency. Topological consistency is not directly applicable to statistical data, as it refers to spatial characteristics of the data. Regarding conceptual consistency, “model rules” can be found that must be met. Thus, in the variables that provide the distribution of the area of a municipality by classes, the sum of the areas of all of the classes must be equal to the total area. On the other hand, and considering the semantics of the statistical variables, it is possible to establish consistency rules that must be fulfilled and determine their compliance through automatic checking processes, in order to obtain as a measure in each case, for instance, of the percentage of municipalities in which each rule is satisfied. For example, the land uses of vegetation covers must be such that they allow dry herbaceous crops so that 4.1.1.1 is more significant than zero, or for example, recorded land uses must be consistent with 1.1.3.6.
Temporal quality elements. The temporal validity quality element is also directly applicable to all the statistical variables considered since they include the temporal component. The temporal quality elements of ISO 19157 are applicable, the determination methods are equivalent to those applied on geospatial data, and the measures proposed by ISO 19157 for this element are applicable, so reporting on these quality elements would be relatively simple.
Completeness elements. The omissions and commissions elements apply to census or inventory type variables (e.g., public teaching centers, health centers). Regardless of whether the completion is considered with respect to the real world or against another data set, we believe that it is relevant to report on this perspective. In this case, the determination of the possible omissions and commissions can be a more complex and expensive process than the previous cases, but knowing the degree of completeness of the data is key to having confidence in its use. We consider that the quality elements of ISO 19157 are applicable, although the evaluation methods should be adjusted to each specific statistical case. Regarding the quality measures proposed by ISO 19157 for these quality elements, we consider applying them to the statistical case.
Regarding the thematic accuracy category, the quality elements, classification correction, non-quantitative attribute correction and quantitative attribute accuracy are applicable depending on the type of the statistical variable. There are numerous statistical variables analyzed that refer to specific categories, so available information on the goodness of the classification in these categories (classification correction), on the assignment of attributes (correction of non-quantitative attributes) or values (accuracy of quantitative attributes) is relevant. In the case of quantitative variables (e.g., totals, means, etc.), it is always pertinent to know their accuracy when they come from an estimate. In this case, the evaluation methods must be adjusted to each specific statistical case, and it will also be necessary to develop appropriate quality measures specific to the case of the accuracy of each quantitative attribute, since the measures proposed by ISO 19157 may be scarce compared to the remarkable diversity that statistical variables present.
In conclusion, although the analysis carried out on the SIMA has not been exhaustive, we consider that the quality model proposed by ISO 19157 applies to the SIMA case; it is enriching and brings new features to the description of the quality of statistical data. Doing so is straightforward in the case of some categories of quality (e.g., logical consistency and temporal quality), and in other instances, methodological developments are required for the evaluation and proposal of new quality measures.
6.3. Linked Data
Most contemporary problems require a cross-disciplinary approach, but existing data sources are locked in silos and cannot be easily shared and integrated across organizations and communities. This scenario is not external to geospatial and statistical information domains. Linked Data (
http://linkeddata.org, accessed on 10 December 2020) may address some of these challenges, adopting best practices for exposing, sharing, and integrating data on the Web [
58,
59].
Along this line, one of the first approaches that integrated geospatial and statistical data following the Linked Data principles was [
60]. This study reused and semantically integrated heterogeneous data sources created and maintained by diverse Spanish National Agencies such as the National Mapping Agency (Instituto Geográfico Nacional de España—IGN-E), the National Statistics Institute (Instituto Nacional de Estadística—INE), and the National Meteorological Agency (Agencia Estatal de Meteorología—AEMET). This diversity of agencies entailed various issues related to datasets heterogeneity issues (multithemed, multiresolution, multitemporal, multilingual, and multiformat).
In order to overcome these issues, the authors performed a process to generate, integrate, and publish the aforementioned heterogeneous data sources from three different areas, such as meteorological, pure geospatial and statistical data (
Figure 4). Thereby, they created an ontology network to model information of diverse geospatial and statistical datasets semantically, reusing RDF Data Cube Vocabulary (
https://www.w3.org/TR/vocab-data-cube/, accessed on 11 December 2020) and GML and WGS84 vocabularies, among others. The authors also carried out a transformation process on RDF according to the developed ontology in order to harmonize different formats of distinct datasets (databases, shapefiles, spreadsheets, and CSV files) and avoid using proprietary formats. Further details about distinct systems utilized to convert diverse datasets into RDF were collected in [
60]. After integrating data from the Spanish National Agencies, the RDF was enriched with other Linked Data sources such as GeoNames, DBpedia (a community effort to obtain structured information from Wikipedia and to make this information available on the Web), and GDAM (a spatial database of the location of the world’s administrative areas for use in GIS and similar software).
This study also developed an application to display on the map geometrical representation such as points (which show provinces’ centroids), linestrings (these shapes depict hydrographical features such as rivers, roads, etc.), and polygons (they show administrative boundaries, reservoirs, etc.). Moreover, this application allowed the integration of resources from statistical datasets (e.g., level of unemployment in Spanish provinces) while displaying a meteorological variable (e.g., temperature) as a semantic mashup.
Several initiatives have appeared from the emergence of this initial approach aimed at connecting the geospatial and statistical information domain with best practices to publish data on the web [
59]. On the one hand, diverse efforts have focused on developing ontologies/vocabularies to achieve the aforementioned integration and overcome semantic heterogeneity problems [
61]. These allow the modelling of semantic relationships between distinct structures and form an integrated and coherent view of multiple and heterogeneous datasets [
62]. Among these efforts appeared GeoSPARQL [
63]; a vocabulary for describing geospatial data in RDF and an extension to the SPARQL query language for processing geospatial data; and the aforementioned RDF Data Cube Vocabulary, which enables statistical information to be represented using the RDF standard and published following the principles of Linked Data. Additionally, some proposals have addressed the semantic modelling of statistical data and spatiotemporal aspects [
64] or Earth observations [
65] in an integrated way. In this sense, several approaches have appeared in the literature using these vocabularies or additional ones to connect geographical and statistical data using the Linked Data principles [
66,
67,
68,
69,
70].
In conclusion, the adoption of Linked Data facilitates the reuse and connection of multiple and heterogeneous statistical and geospatial data sources, overcoming current integration problems of data silos associated with these information domains. Diverse working and expert groups have recognized this evidence within these realms [
1,
11]. Despite this, the generation, use, and adoption of Linked Data resources are not part of common practice in these areas. Nevertheless, the proliferation of these initiatives in the Linked Data cloud (
https://lod-cloud.net/, accessed on 11 December 2020) demonstrates initial steps toward the next decade scenario, where a collective understanding of geospatially enabled statistics will strengthen the analysis of data in order to promote informed, data-driven, evidence-based decision-making [
11], connecting global issues to local ones.
7. Discussion
This discussion section does not pretend to be exhaustive about everything presented in this document, but it does focus on those aspects that we consider the most notable.
First, we consider that there are differences in approaches. Geospatial data management is an activity to produce metric geospatial models of the real world easier to manage, study and analyze than reality. This is the profound idea behind GIS, the concept of Digital Earth, SDIs and, in general, geomatics, Earth observation, etc. From that point of view, statistics are not at the same level of abstraction as GI management. Statistics are, from the technical point of view, another thematic field of application of GI along with defense, scientific applications, climatology, the environment, and urban geography. Indeed, statistics are quite general, and their purpose, until now, has been to give an alphanumeric description of the real world. However, statistics activities are driven by an explicit intention (e.g., monitoring the population, unemployment, etc.). At the same time, GI aims to give a neutral representation of the real world and sometimes a registered image (e.g., orthophotos, imagery, LiDAR, etc.), since the knowledge areas which illuminate it are, above all, inseparable from Earth Sciences. This specificity of GI has possibly been hidden until now because of the leading GI management initiatives having been coordinated and directed by statistical bodies (UN-GGIM, UNECE, etc.) or environmental bodies (EEA, INSPIRE Structure), with the logical statistical or environmental bias.
Secondly, so far, a very different leadership situation has been evident in the two domains. In the statistical domain, there has been a strong international leadership that has been consolidated for decades consisting of methodologies for creating statistical variables. Definitions of statistical variables and capture methods (semantics) have traditionally been harmonized to ensure statistical data comparability. Countries align with these guidelines in order to obtain economic benefits (e.g., international aids, investment, etc.). More recently, this leadership has also covered management and technology aspects. In the geospatial domain, there has been strong international leadership that has also been consolidated for decades which is standard-oriented to the interoperability of geographic information systems. Numerous standards related to formats, web services, metadata, etc., have been defined. However, the more semantic aspects associated with the meaning of objects and their capture methods have experienced less progress. The adoption of standards by data producers, tool developers, users, and administrations is generally voluntary in those cases that the producers have no obligation to publish in another service (e.g., INSPIRE).
The statistical framework (GSIM, GSBPM, etc.) is a comprehensive and consistent tool (information, business, activities, etc.) that develops a corporate vision led at the highest international level. Statistical agencies adopt this framework for their technical advantages and the need for countries to meet certain statistical information standards. The proposed frameworks are flexible, allowing for their adoption to varying degrees and for statistical agencies to refine them over time. There is extensive prior experience and also international standards in other areas for many relevant aspects covered in these frameworks (e.g., interoperability, metadata, quality management, etc.). However, the documents that establish them do not seem to favor the integration with these experiences, particularly from the geospatial domain and, in general, with the industrial domain.
On the other hand, the geospatial domain does not present a formalized general framework equivalent to the previous one, but rather an approximation, such as that developed in
Section 4, can be made. First, it should be noted that much of the documentation that supports the development carried out in
Section 4 are international standards (ISO and OGC). Therefore, these are models whose adoption is voluntary, although the law in some cases mandates it (e.g., in Europe by INSPIRE and in the USA by NSDI). These standards cover many aspects and details of GI and have allowed us to establish a fast and straightforward, but not complete, geospatial information model parallel to the GSIM. ISO standards adequately cover the proposal of an information technology reference model in geospatial production. In other cases, such as those related to geospatial business management, considerable evidence allows us to understand that organizations that produce spatial data can develop a framework from them. Concerning a geospatial framework parallel to GAMSO, it should be noted that quality management has always been understood in the geospatial field through the implementation of the ISO 9001 model (certified or not). This clearly shows the difference in perspectives between the two areas—the geospatial are aligned with international standardization and industry, and the more closed and self-centric statistical area. Finally, initiatives such as INSPIRE have developed transnational projects that offer a clear, mature and consolidated example of how the GI can be technologically and semantically integrated on an international scale.
In relation to the application of the GSBPM to the case of a geospatial product, the same flexible guidelines were followed as indicated in its documentation for the case of applying it to statistical products. In general, the application was relatively straightforward. It is noteworthy that DERA’s documentation does not consider the sub-processes of the analysis and evaluation phases because the geospatial data producer does not usually perform analyses on the products (this is left to the users). In the case of the evaluation phase, we understand the absence of evidence to be, in reality, a failure to manage the life cycle of the DERA by the producer. For all these reasons, we consider that the applicability of the GSBPM to the geospatial field has been demonstrated, although it is true that a wording that is sensitive to the geospatial area (data and processes) is required.
The application of the ISO 19157 spatial data quality model to the data of a statistical product has also been relatively straightforward. Many aspects of the quality of statistical data are equivalent to those of geospatial data (e.g., logical consistency, temporal quality, etc.). However, the dimensions of quality included in ISO 19157 are not all that a statistical product such as the one analyzed may need. Nevertheless, the latest version of ISO 19157 will establish new quality elements and overcome current limitations. The main problem with the possibilities of immediately applying ISO 19157 to statistical data is the absence of adequate quality measures for some statistical variables. This is not a problem, as ISO 19157 proposes a process and a template to define new quality measures. The ISO 19157 application to statistical data makes it possible to complement the quality indices implemented by statistical agencies, which does not address data quality.
The third example demonstrated the possibility of linking statistical and geospatial data and, even further, linking meteorological data by applying Linked Data principles. Although this case was one of the pioneers in integrating statistical and geospatial data, their proposals (ontology development, RDF generation, and so on) are still valid and an excellent example for the integration of both information domains. However, the optimal scenario would be that statistical and geospatial data, from their design, participate in the same information model so that the link is from the creation of the data, not as something that happened when both products already existed. This requires a greater degree of coordination between the producers of statistical and geospatial data.
The regulation of statistics and its various models such as the GAMSO and others have paid extensive attention to technical issues and legal ones. Thus, the advent of new phenomena and their legal implications, such as the digital and technological processing of data that identify or concern individuals, from big data to artificial intelligence, deepfakes or biometrics, as well as other emerging technologies, does not imply the disappearance of fundamental rights or public freedoms. On the contrary, the statistical function should respect and recognize a greater legal value and significance of rights such as privacy, honor, personal or family image, privacy or freedom of thought, expression or movement. The collection, processing, storage and dissemination of statistical data, such as geospatial data, must respect fundamental rights—in particular, those of privacy and intimacy when personal data are involved. However, a significant legal difference between geospatial and statistical data lies in the regulation of statistical confidentiality, which is not covered by the legal regulation of geospatial data, which, far from possessing such confidentiality, are subject to certain limitations to public access. Such limitations include the confidentiality of the procedures of public authorities (Organic Law 6/1985 in [
71]), international relations, national defense [
72] and public security (National Cybersecurity Strategy in Gobierno Español in [
73,
74]); the development of judicial proceedings; the confidentiality of commercial and industrial data [
75] and intellectual property rights [
76]; and the protection of the environment to which the information refers ([
77]; Law 27/2006 in [
78]), for example, the location of rare species.
Finally, the existence of statistical frameworks or models, even in their particular relationship with geospatial data and services, does not imply a necessary diversity of legal standards, insofar as that the fundamental rights and public freedoms recognized for individuals are homogeneous in the same territorial areas that are covered by these statistical frameworks. To be precise, the existence of widely harmonized rights and liberties at the international level could help to develop statistical regulation, also at the international level, which would take into account the specialties of the statistical function and bring about a better understanding and comprehension of its importance. As a summary, the main synergies, gaps and integration possibilities that have been pointed out in the document are presented in
Table 4.
8. Conclusions
This article is a first attempt at comparing existing statistical and geospatial information conceptualization and production frameworks. In this sense, the first conclusion is that this comparative analysis has been very fruitful, since we discovered many good practices from each of those two domains that can be translated and applied to the other side. Although there are some gaps in the whole picture and some aspects not fully covered by any of the considered production frameworks, the second conclusion is that it would be very fruitful to draw a map of synergies, gaps and areas covered by both types of production frameworks (see
Table 4). When we mention synergies, we are referring not to the obvious synergies arising when geospatial and statistical information are merged and linked, but to the mutual benefits obtained by the cooperative alignment and integration of the ideas and contents of production frameworks of the two sides.
On the other hand, we are convinced that the convergence between both domains will be unavoidable in the coming years and we will likely be witnesses of the foundation of new agencies for data supply by fusion of the ancient statistical offices and mapping agencies. However, this future process must not impose production frameworks or invent new ones if they already exist.
The statistics domain is advanced in formalizing a general worldwide common process management framework. On the other hand, the geospatial domain is much more advanced in developing and applying international standards and interoperability and much more advanced and focused on the market. In the statistics domain, some proposed advances are already consolidated in other domains and included in many international standards, suggesting that they have a self-centered perspective. In this sense, the geospatial realm is much more open and more permeable.
It would also be fruitful to progress and evolve holistic approaches embracing statistical and geospatial information domains, mainly: Linked Data, global feature unique and persistent identifiers (e.g., INSPIRE’s ones), OGC standards (e.g., Table Joining Services), and other key points demanding some kind of global coordination like geographic units used for georeferencing (e.g., discrete global grid systems or INSPIRE Geographical Grid Systems), or the global production projects of open seamless statistical and geospatial information.
Regarding the integration of both types of data, production processes and production frameworks, we identified many good perspectives for the future, but the critical point seems to be the organizational aspects implied. It is evident than both “sides” would benefit by considering the good practices, management concepts, principles and methods of the other side. In this sense, organizations that nowadays are responsible for producing both statistical and geospatial information, such as the IECA (in Andalusia, Spain) or INEGI (in Mexico), are in a privileged position to face and to lead efforts to overcome this challenge.
Additionally, we consider that there are some needs at a higher level than the producer organizations; for example, a co-governance between geomatics and statistical organizations and experts—until now, there has been a certain preponderance among the latter. As we have mentioned above, some strategic international initiatives, such as UN-GGIM, are proposed for statistics bodies. It would also be logical to have geospatial bodies responsible for coordination and management at the same level as statistical ones (e.g., Eurostat, UNECE, etc.). In this sense, the situation has not changed very much during the last century, and GeoIM demands more attention, resources and political support; for instance, it would be wise to have a Geographic Division at the UN, and a body similar to Eurostat in Europe but devoted to geospatial information.
Unlike general geospatial regulation, statistical data and services lack a harmonized regulatory framework from a legal perspective. However, the collection, processing, storage, and dissemination of statistical data, as with geospatial data, must respect fundamental rights, and in particular, privacy and intimacy rights. A relevant legal difference between geospatial and statistical data lies in the regulation of statistical confidentiality: the legal regulation of geospatial data does not cover it. On the other hand, for geospatial data, certain limitations to public access are regulated. Finally, the existence of different statistical models does not imply a necessary diversity of legal rules, as the fundamental rights and public freedoms recognized for individuals are homogeneous in the same territorial areas covered by these statistical frameworks. The existence of broadly harmonized rights and freedoms at the international level could help in the development of statistical regulations at the international level, which would take into account the specialties of the statistical function and bring about a better understanding and comprehension of its importance. Legal aspects need to be taken into account in statistical and geospatial data production frameworks. From a general point of view, there is a need for a global framework on the Internet and for digital processes, given that most of our activity is developed in a non-fully regulated digital arena. At the same time, other international contexts already have such an international framework, such as the electromagnetic spectrum or outer space.
Taking advantage of synergies, eliminating gaps and achieving integration is not an easy task. Many of the aspects indicated in this study require research and other technical adaptation or development of standards; however, along with the above, a change in mentality is also required that favors the convergence of both worlds and, in this way, offers better products and services to citizens and public administrations. As indicated above, this article is only an initial step in the integration and interoperability of the statistical and geospatial information domains, but other thematic information production frameworks probably need to be compared and integrated similarly. The real world is unique and, because of globalization and the progress of all fields of human activity, there is a growing demand to unify disciplines and take holistic approaches. For this reason, we need seamless data in order to confront, plan for and monitor the global challenges of the 21st century described in the United Nations Sustainable Development Goals. One of the first options to consider is probably the duality that comprises statistical and geographic information.


 ,
, 


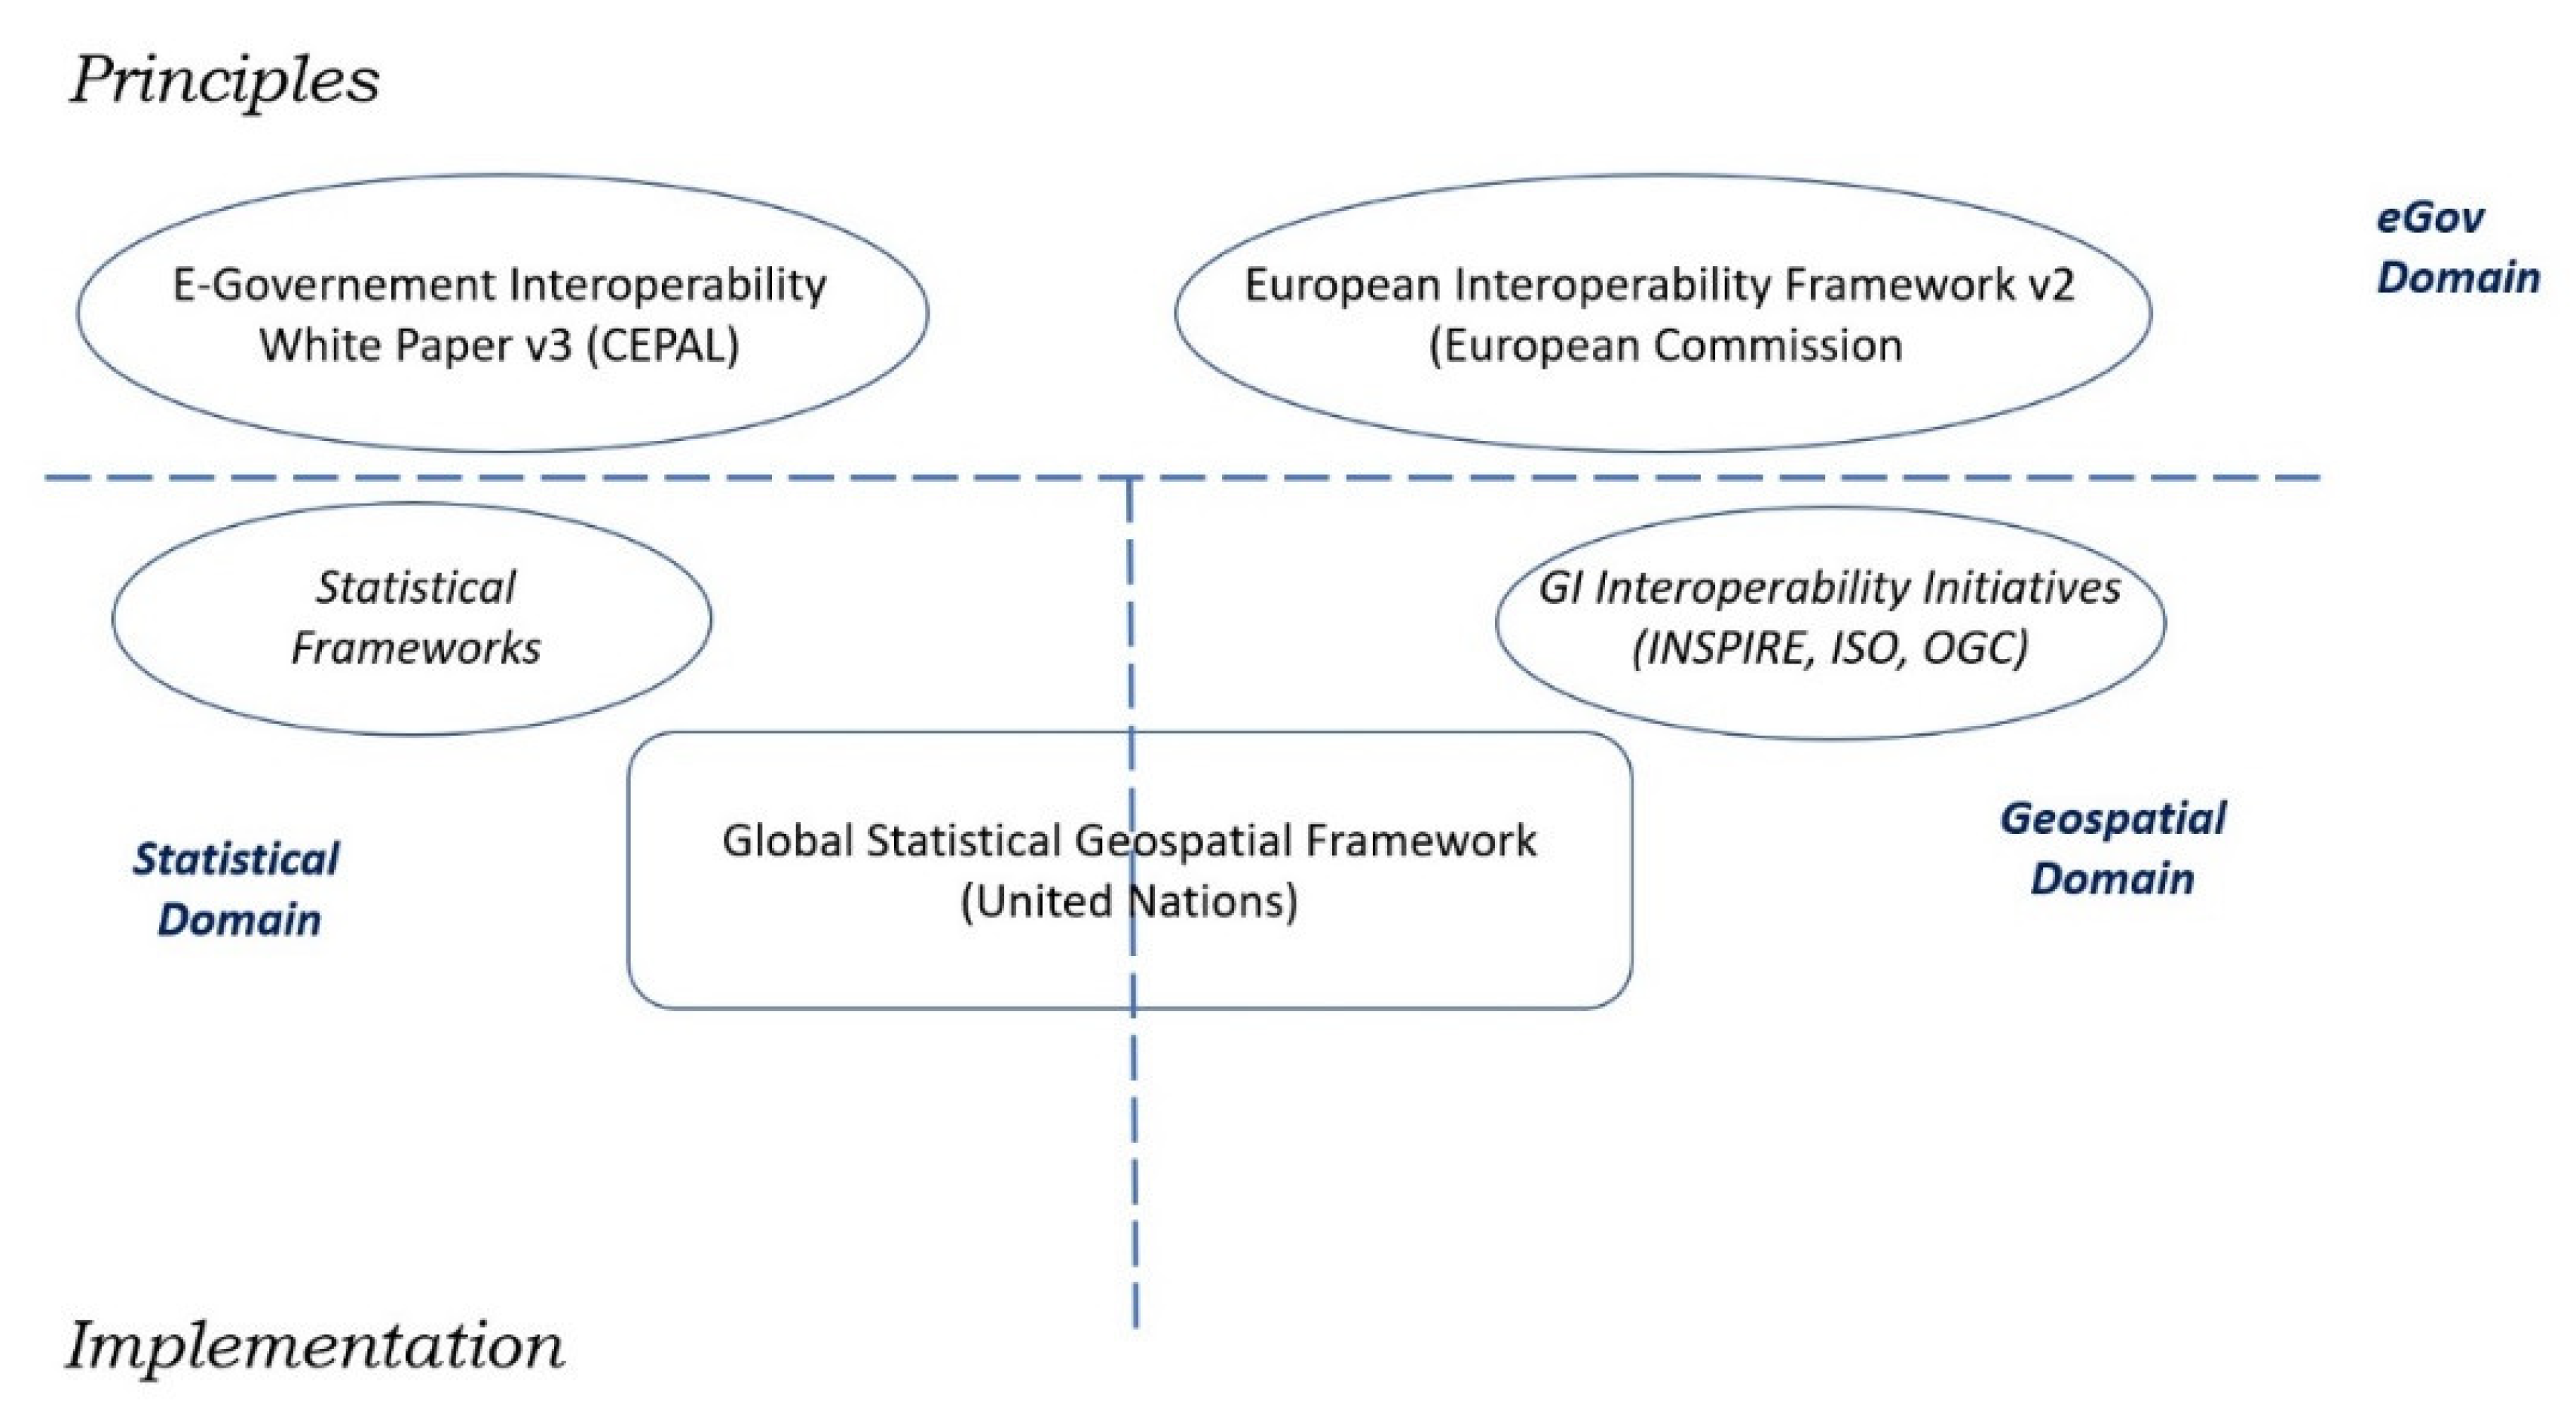
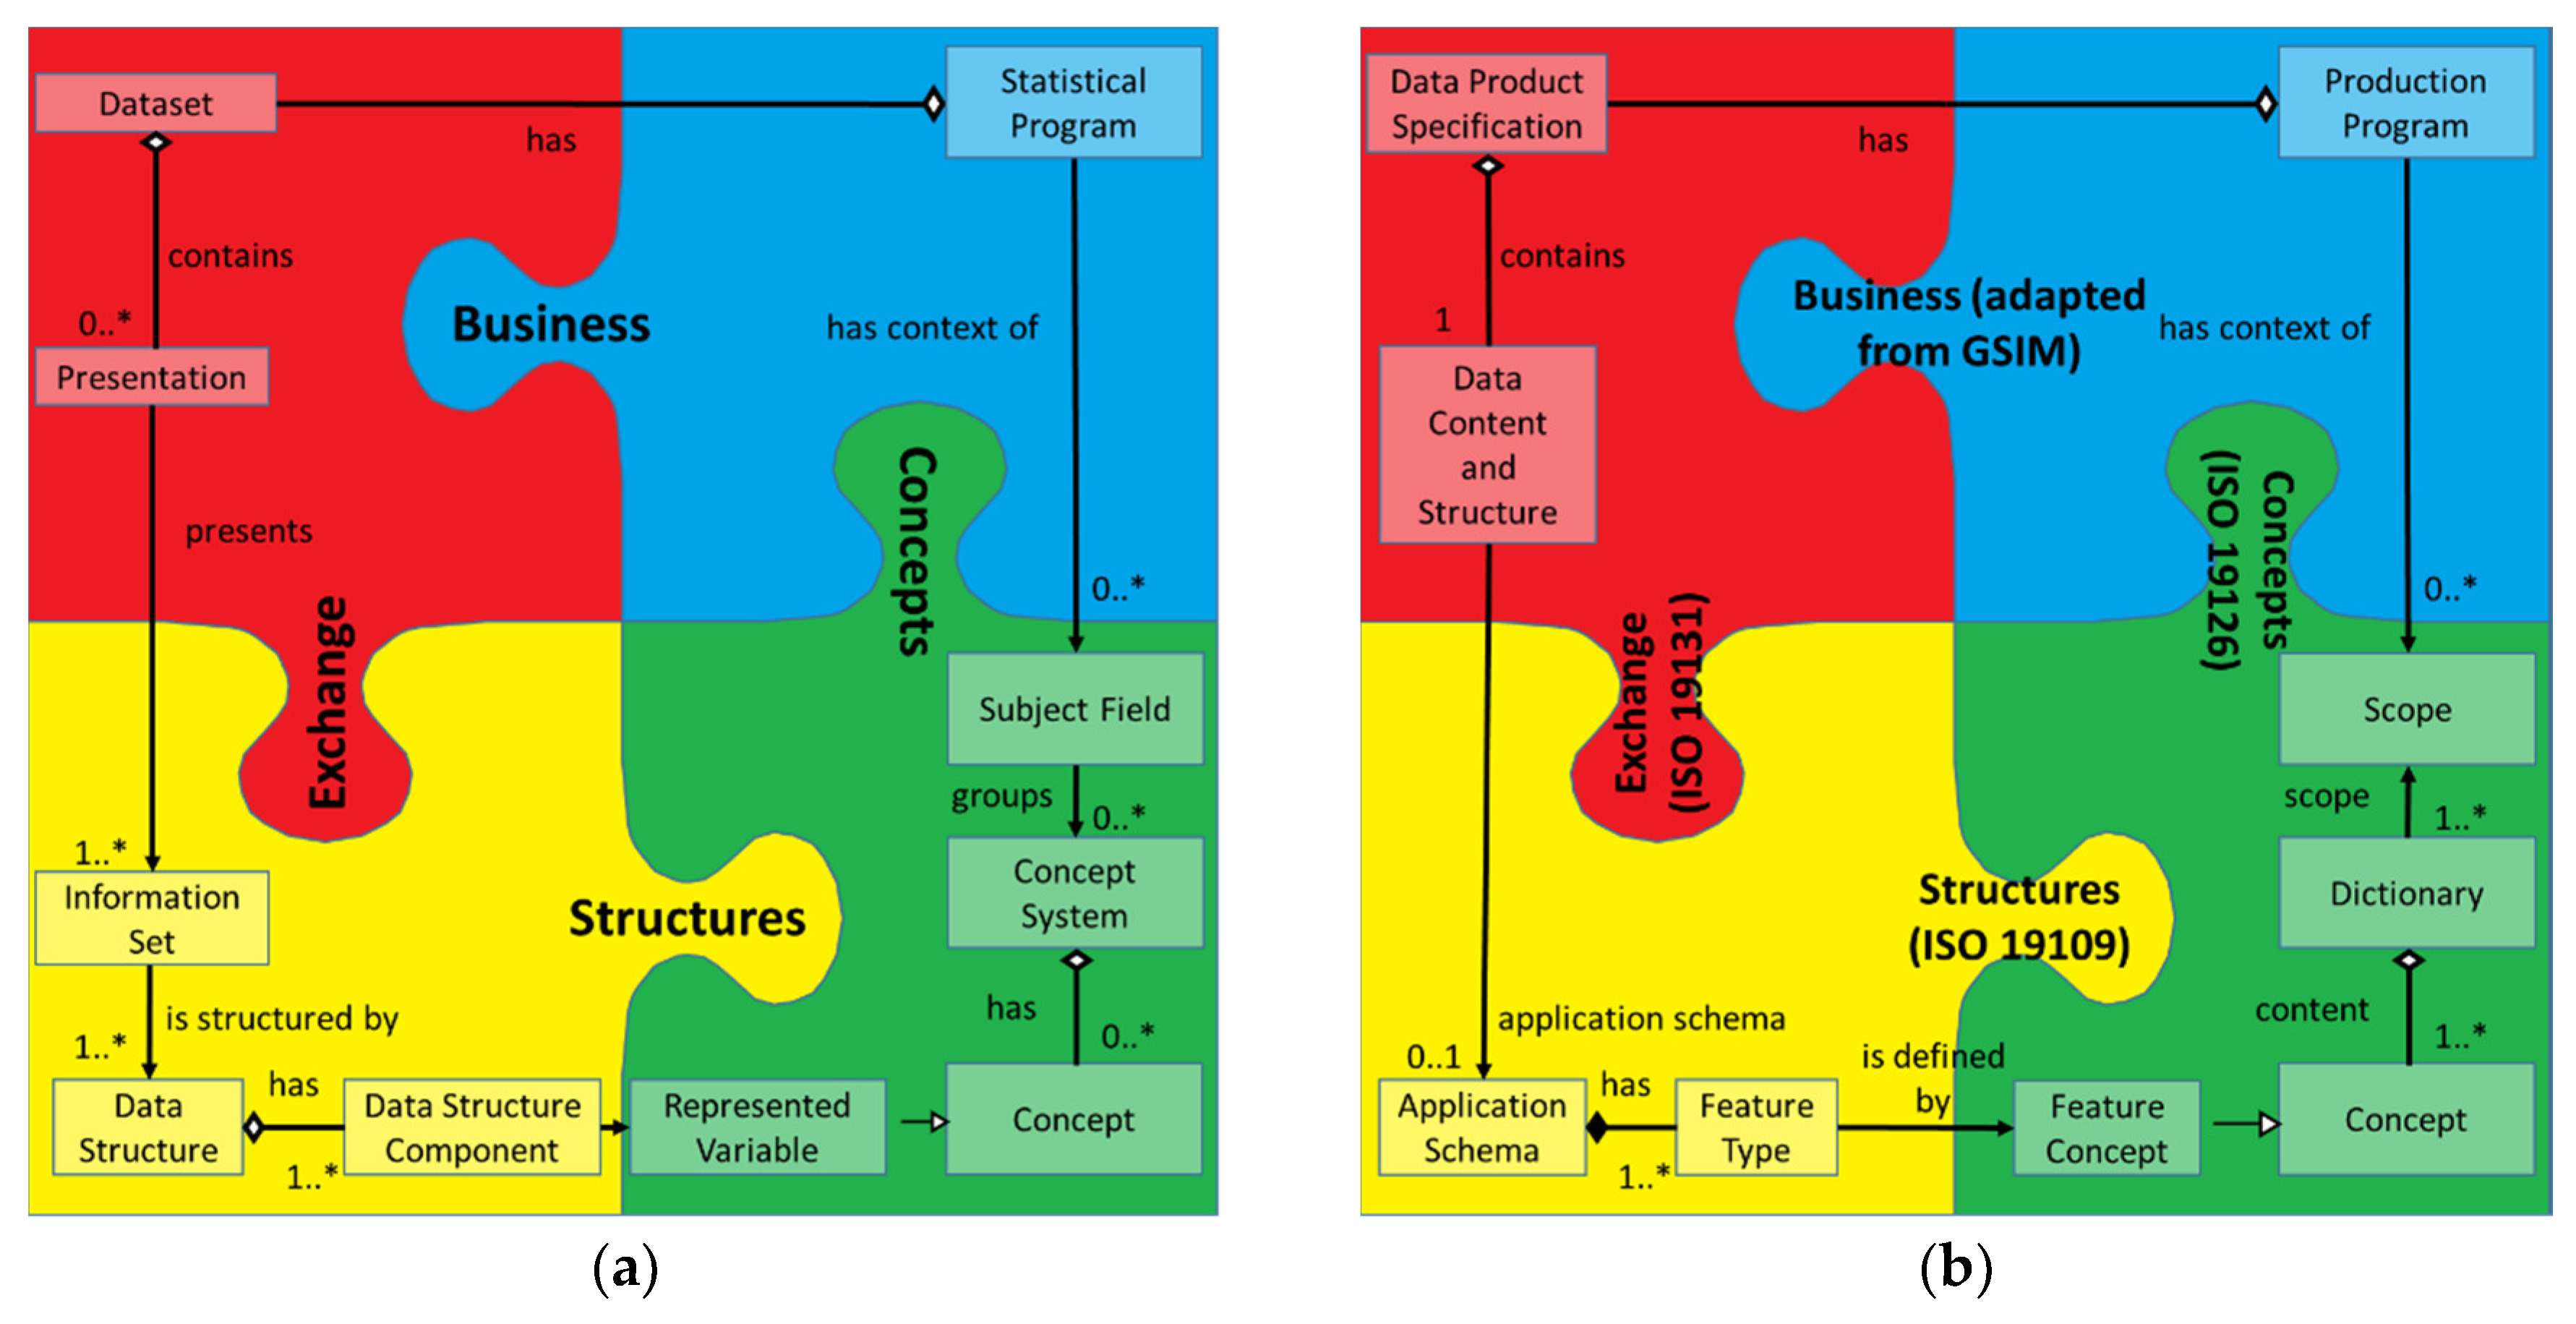
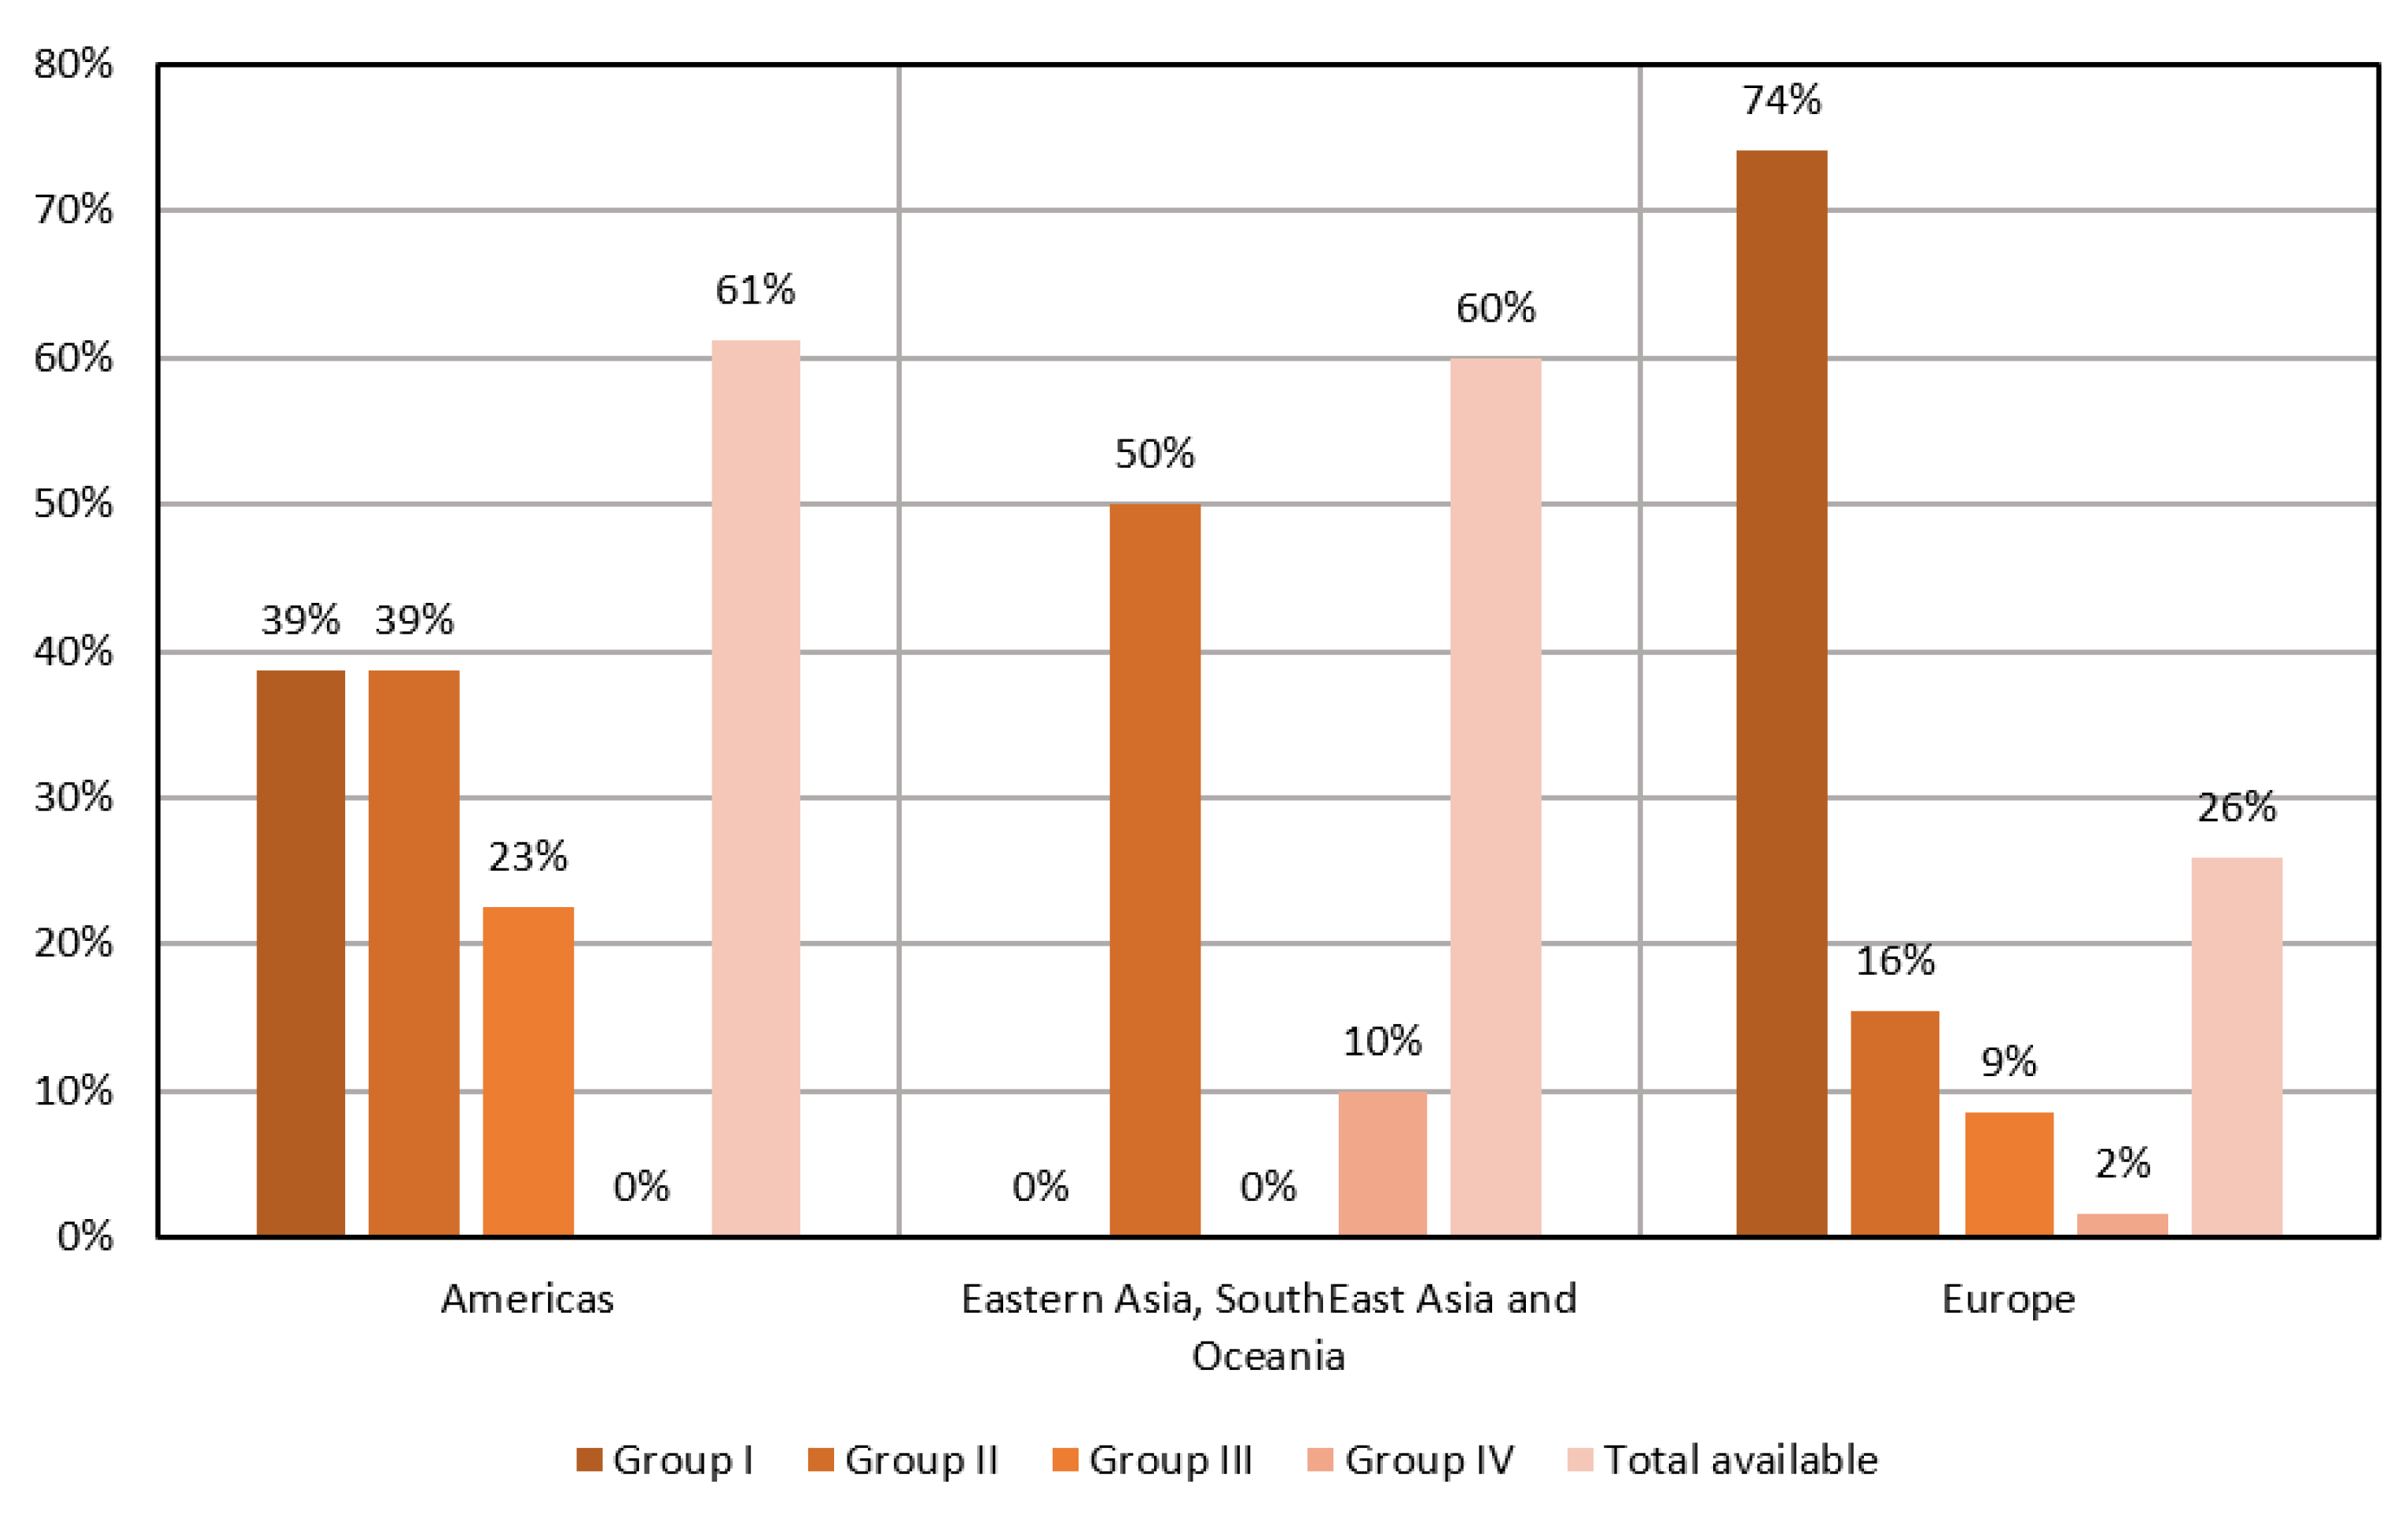
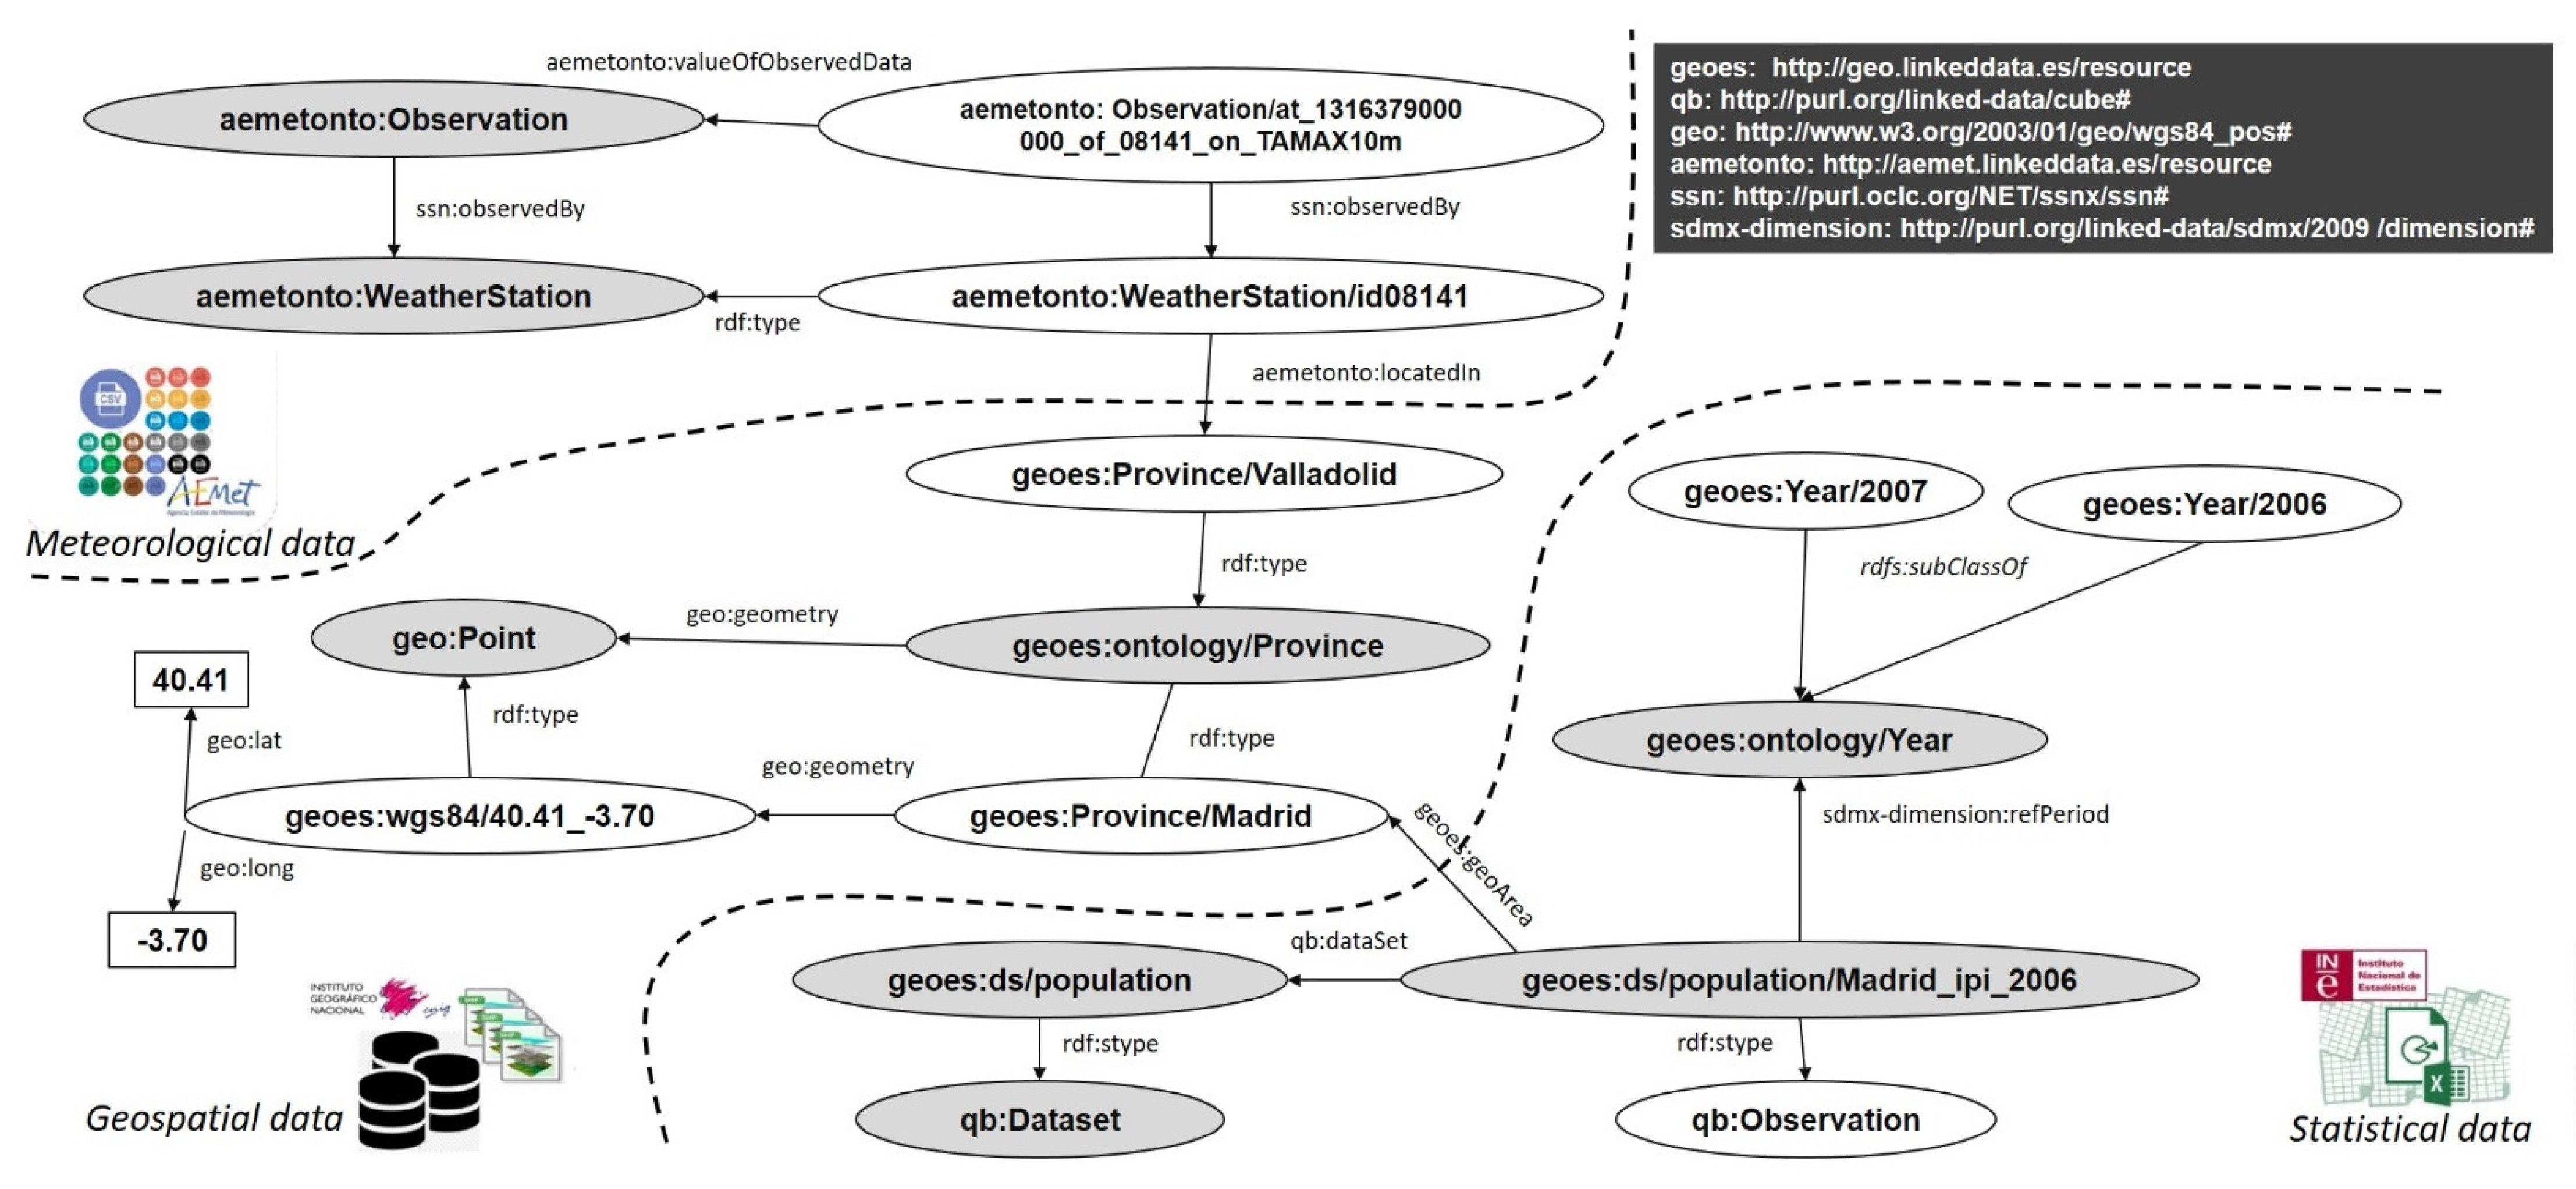