Article

AIS and VBD Data Fusion for Marine Fishing Intensity Mapping and Analysis in the Northern Part of the South China Sea

1
Faculty of Geomatics, Lanzhou Jiaotong University, Lanzhou 730070, China
2
State Key Laboratory of Resources and Environmental Information System, Institute of Geographic Sciences and Natural Resources Research, Chinese Academy of Sciences, Beijing 100101, China
3
National-Local Joint Engineering Research Center of Technologies and Applications for National Geographic State Monitoring, Lanzhou 730070, China
4
School of Geography and Ocean Science, Nanjing University, Nanjing 210023, China
5
Collaborative Innovation Center of South China Sea Studies, Nanjing University, Nanjing 210093, China
6
Gansu Provincial Engineering Laboratory for National Geographic State Monitoring, Lanzhou 730070, China
*
Authors to whom correspondence should be addressed.
ISPRS Int. J. Geo-Inf. 2021, 10(5), 277; https://doi.org/10.3390/ijgi10050277
Submission received: 3 March 2021 / Revised: 7 April 2021 / Accepted: 26 April 2021 / Published: 28 April 2021
(This article belongs to the Special Issue Geovisualization and Social Media)

Abstract

:
For the sustainable development of marine fishery resources, it is essential to comprehensively, accurately, and objectively obtain the spatial characteristics and evolution law of fishing intensity. However, previous studies have focused more on the use of single data sources, such as AIS (Automatic Information System) and VBD (VIIRS boat detection), to obtain fishing intensity information and, as such, have encountered some problems, such as insufficient comprehensive data coverage for ships, non-uniform spatial distribution of data signal acquisition, and insufficient accuracy in obtaining fishing intensity information. The development of big data and remote sensing Earth observation technology has provided abundant data sources and technical support for the acquisition of fishing intensity data for marine fisheries. Based on this situation, this paper proposes a framework that integrates the data of fishing vessels from two sources (AIS, with high space-time granularity, and VBD, with short revisit cycle and high sensitivity), in order to obtain such information based on closely matching and fusing the vector point data of ship positions. With the help of this framework and the strategy of indirectly representing fishing intensity by data point density after fusion, the spatial characteristics and rules of fishing intensity in typical seasons (February, April, September, and November) in the northern South China Sea in 2018 were systematically analyzed and investigated. The results revealed the following: (1) Matching and fusing AIS and VBD data can provide a better perspective to produce robust and accurate marine fishery intensity data. The two types of data have a low proximity match rate (approximately 1.89% and 6.73% of their respective inputs) and the matching success for fishing vessels in the data was 49.42%. (2) Single AIS data can be used for nearshore (50 to 70 km) marine fishery analysis research, while VBD data reflect the objective marine fishing in space, showing obvious complementarity with AIS. (3) The fishing intensity grid data obtained from the integrated data show that high-intensity fishing in the study area was concentrated in the coastal area of Maoming City, Guangdong (0–50 km); the coastal area of Guangxi Beihai (10–70 km); around Hainan Island in Zhangzhou (10–30 km); and the Sanya nearshore area (0–50 km). However, it did not decay with increasing offshore distance, such as at the Trans-Vietnamese boundary in the Beibu Gulf, near the China–Vietnam Common Fisheries Area (50 km) and high-intensity fishing areas. (4) The obtained fishing intensity data (AIS, VBD, and AIS + VBD) were quantitatively analyzed, showing that the CV (Coefficient of Variation) of the average for each month (after fusing the two types of data) was 0.995, indicating that the distribution of the combined data was better than that before fusion (before fusion: AIS = 0.879, VBD = 1.642). Therefore, the integration of AIS and VBD can meet the need for a more effective, comprehensive, and accurate fishing intensity analysis in marine fishery resources.

1. Introduction

Marine fisheries play a vital role in food security and marine economic development [1,2]. However, with advances in fishing technology and an increased market demand for fisheries, the increased intensity of marine fishing, deteriorating marine ecological environments, and the increasing frequency of IUU (illegal, unreported, and unregulated) fishing incidents have presented significant challenges to the sustainable development of marine fisheries and the conservation of fish species diversity [3,4]. There has been a lack of effective integrated fishing assessment management practices and measures [5]. and therefore the scientific determination of fishing intensity data in marine fisheries is pre-requisite and key to the management of fishing quotas [6]. As an important fishing and trans-shipment carrier at sea, the quantity and spatial distribution of fishing vessels reflect the primary development trend of fishery resources. In the age of big data, the location data of fishing vessels have become an essential support for the dynamic spatial features of marine fisheries [7,8]. Accurate, in-depth analysis and map visualization of fishing space information is an important way to grasp the fishing intensity of fishery resources [9,10]. Common ship positioning data types include AIS, VMS (Vessel Monitor System), and more. Furthermore, night light remote sensing satellite data NLT (Nightime Lights), radar imagery, and so on, can monitor the fishing vessels at sea [11], in which night light remote sensing has ultra-high sensitivity, microlight recognition capabilities, and the ability to accurately capture fishing vessel night-time operations [12], providing good quantification of light trap fishing vessels during night operations.
AIS and VMS trajectory data have been widely used in marine fisheries. In a marine fishery fishing intensity map, based on statistical analysis and the identification of VMS data (e.g., position, direction, speed, and so on), the fishing intensity information can be obtained effectively. Natalie et al. used the hybrid Gaussian Mixture Model in Swedish waters to segment, identify, and produce the statistical distribution characteristics of the trawler AIS speed [13]. The validation of fishing log data has shown that the accuracy of the mapping is affected by the coverage of the AIS data. Guiet et al. analyzed the temporal and spatial changes in the intensity of industrial fishing recorded under the global AIS coverage for 2015–2017 [14]. Research on the coupling factors, trans-shipment events, and hot-spot perception of fisheries with the help of AIS data include the following: Kroodsma et al. researched the relationship between environmental change and political events [15]; Miller et al. tracked and analyzed 694 vessels engaged in marine fisheries fishing trans-shipment and studied the global trans-shipment of marine fisheries [16]; and Boerder analyzed global maritime catch trans-shipment hotspots for 2012–2017 [17].
In addition to the application of AIS and VMS to marine fisheries fishing research, the target of offshore fishing vessels in NLT provides the most intuitive reflection of human night fishing at sea [18]. Many scholars have used such data to carry out a lot of work in the areas of marine lighting fishing vessel fishing law feature mining, situational awareness of fishery resource development, assessment of the benefits of fishing bans in sea areas, and IUU fishing monitoring [19,20,21,22]. Among them, Elvidge et al., based on Suomi NPP/VIIRS data (hereafter referred to as SNPP), proposed a peak detection and fixed threshold segmentation of the sea lighting vessel identification method for the first time [23]. This provides a classical idea and framework for the subsequent application of NLT to the study of fishery quantification and intelligence. Subsequently, Tian et al. and Chen et al. have improved the NLT lighting operation fishing vessel identification method, based on maxEnt (maximum entropy) threshold segmentation and local peak detection LSD [12,24]. Using the above methods, they extracted fishing vessels in the NLT for further analysis. Zhang based on SNPP DNB data, obtained light extraction results of night fishing vessels in the South China Sea. After nuclear density analysis, obtained the core fishery of the lamplight fishing vessels were obtained and dynamic changes occurred [25]. Geronimo et al. used NLT fishing areas and fishery management areas to map and track fishing activities accurately [26]. The core area of fishing in the Philippines was excavated using the density clustering method, where the intensity range of different seasonal patterns was analyzed. Elvidge et al. used night lighting fishing vessels SNPP to assess the effectiveness of different types of no-fishing areas in Vietnam (toxic industrial emissions, seasonality, and coastal permanent fishing bans) [27]. Li et al. used NLT data to study the distribution pattern of fish resources in the South China Sea [28].
In addition to the above research on Marine fishing with single AIS, VMS, and SNPP data, Liu et al. used VMS to verify that SNPP data could effectively detect the activities of fishing vessels at sea. It was pointed out that the combination of VIIRS ship data and VMS can provide a good foundation for future fishery management [19]. Longepe et al. used VDS (Vessel Detection System), VMS, and AIS data based on high-resolution radar images to evaluate illegal fishing in Indonesia, and found that the proportion of IUU fishing vessels changed significantly before and after the fishing ban [29]. Hsu et al. applied VMS, VBD (VIIRS Boat Detection) in Indonesia to carry out a cross-matching study of fishing types among various vessels for the identification and analysis of illegal fishing “Dark Vessels” at sea [30]. Based on Sentinel 1, Sentinel 2, and AIS data, Kurekin et al. developed INSURE (Integrated System for Surveillance IUU) in Ghana [31]. Ruiz et al. assessed squid fishing over seven years using AIS and NPP/VIIRS in FAO Region 41, showing a high degree of consistency between the two types of data at a spatio-temporal scale [32]. Park et al. combined four satellite technologies (AIS, SAR, optical imagery, and SNPP DNB band) to conduct an in-depth study on illegal fishing in sensitive areas between North Korea, Japan, and Russia [33]. Exeter et al. utilizes VIIRS boat detections (VBD) and GPS data to predict fishing effort, biomass and value, as well as the spatial and temporal distribution of catch [34].
In conclusion, the complementary advantages of AIS/VMS, VBD, and multi-source data in existing studies, to a certain extent, have provided important support for understanding the spatial and temporal intensity and dynamic changes of fishing. However, from a more accurate and microscopic perspective, there are also some deficiencies: (1) A single AIS/VMS has the phenomenon of uneven coverage size (The further offshore, the coarser the data sampling interval) [35]; (2) Not all ships are equipped with AIS equipment and may have low VMS coverage rate; (3) NLT can only reflect the saturated spillover effect of targets and nearshore data for high-intensity light trapping vessels; that is, the target extraction effect of vessels in nearshore areas (5 km) is not good. Moreover, it can only reflect the operation situation of the whole light trapping vessel in the sea area and cannot carry out fine-scale identification and analysis. In addition, it cannot effectively meet the management and containment of IUU in sea areas outside the prohibited fishing area and time limit; (4) Marine ship lights mainly come from fishing boats, oil and gas platforms, and so on, while the proportion of fishing boats and whether lights from other ships that can be captured by NLT are unknown. It can be concluded that the existing studies have focused more on the analysis and mining of the fishing intensity characteristics of Marine fisheries by using a single data source [13,25]. Although there are cases in existing studies that have combined multiple sources of data, most of them have focused on illegal fishing at sea, and there are still no cases that combine the advantages of the two and explore fishing intensity information of Marine fisheries through their fusion [29,30,31,32,34].
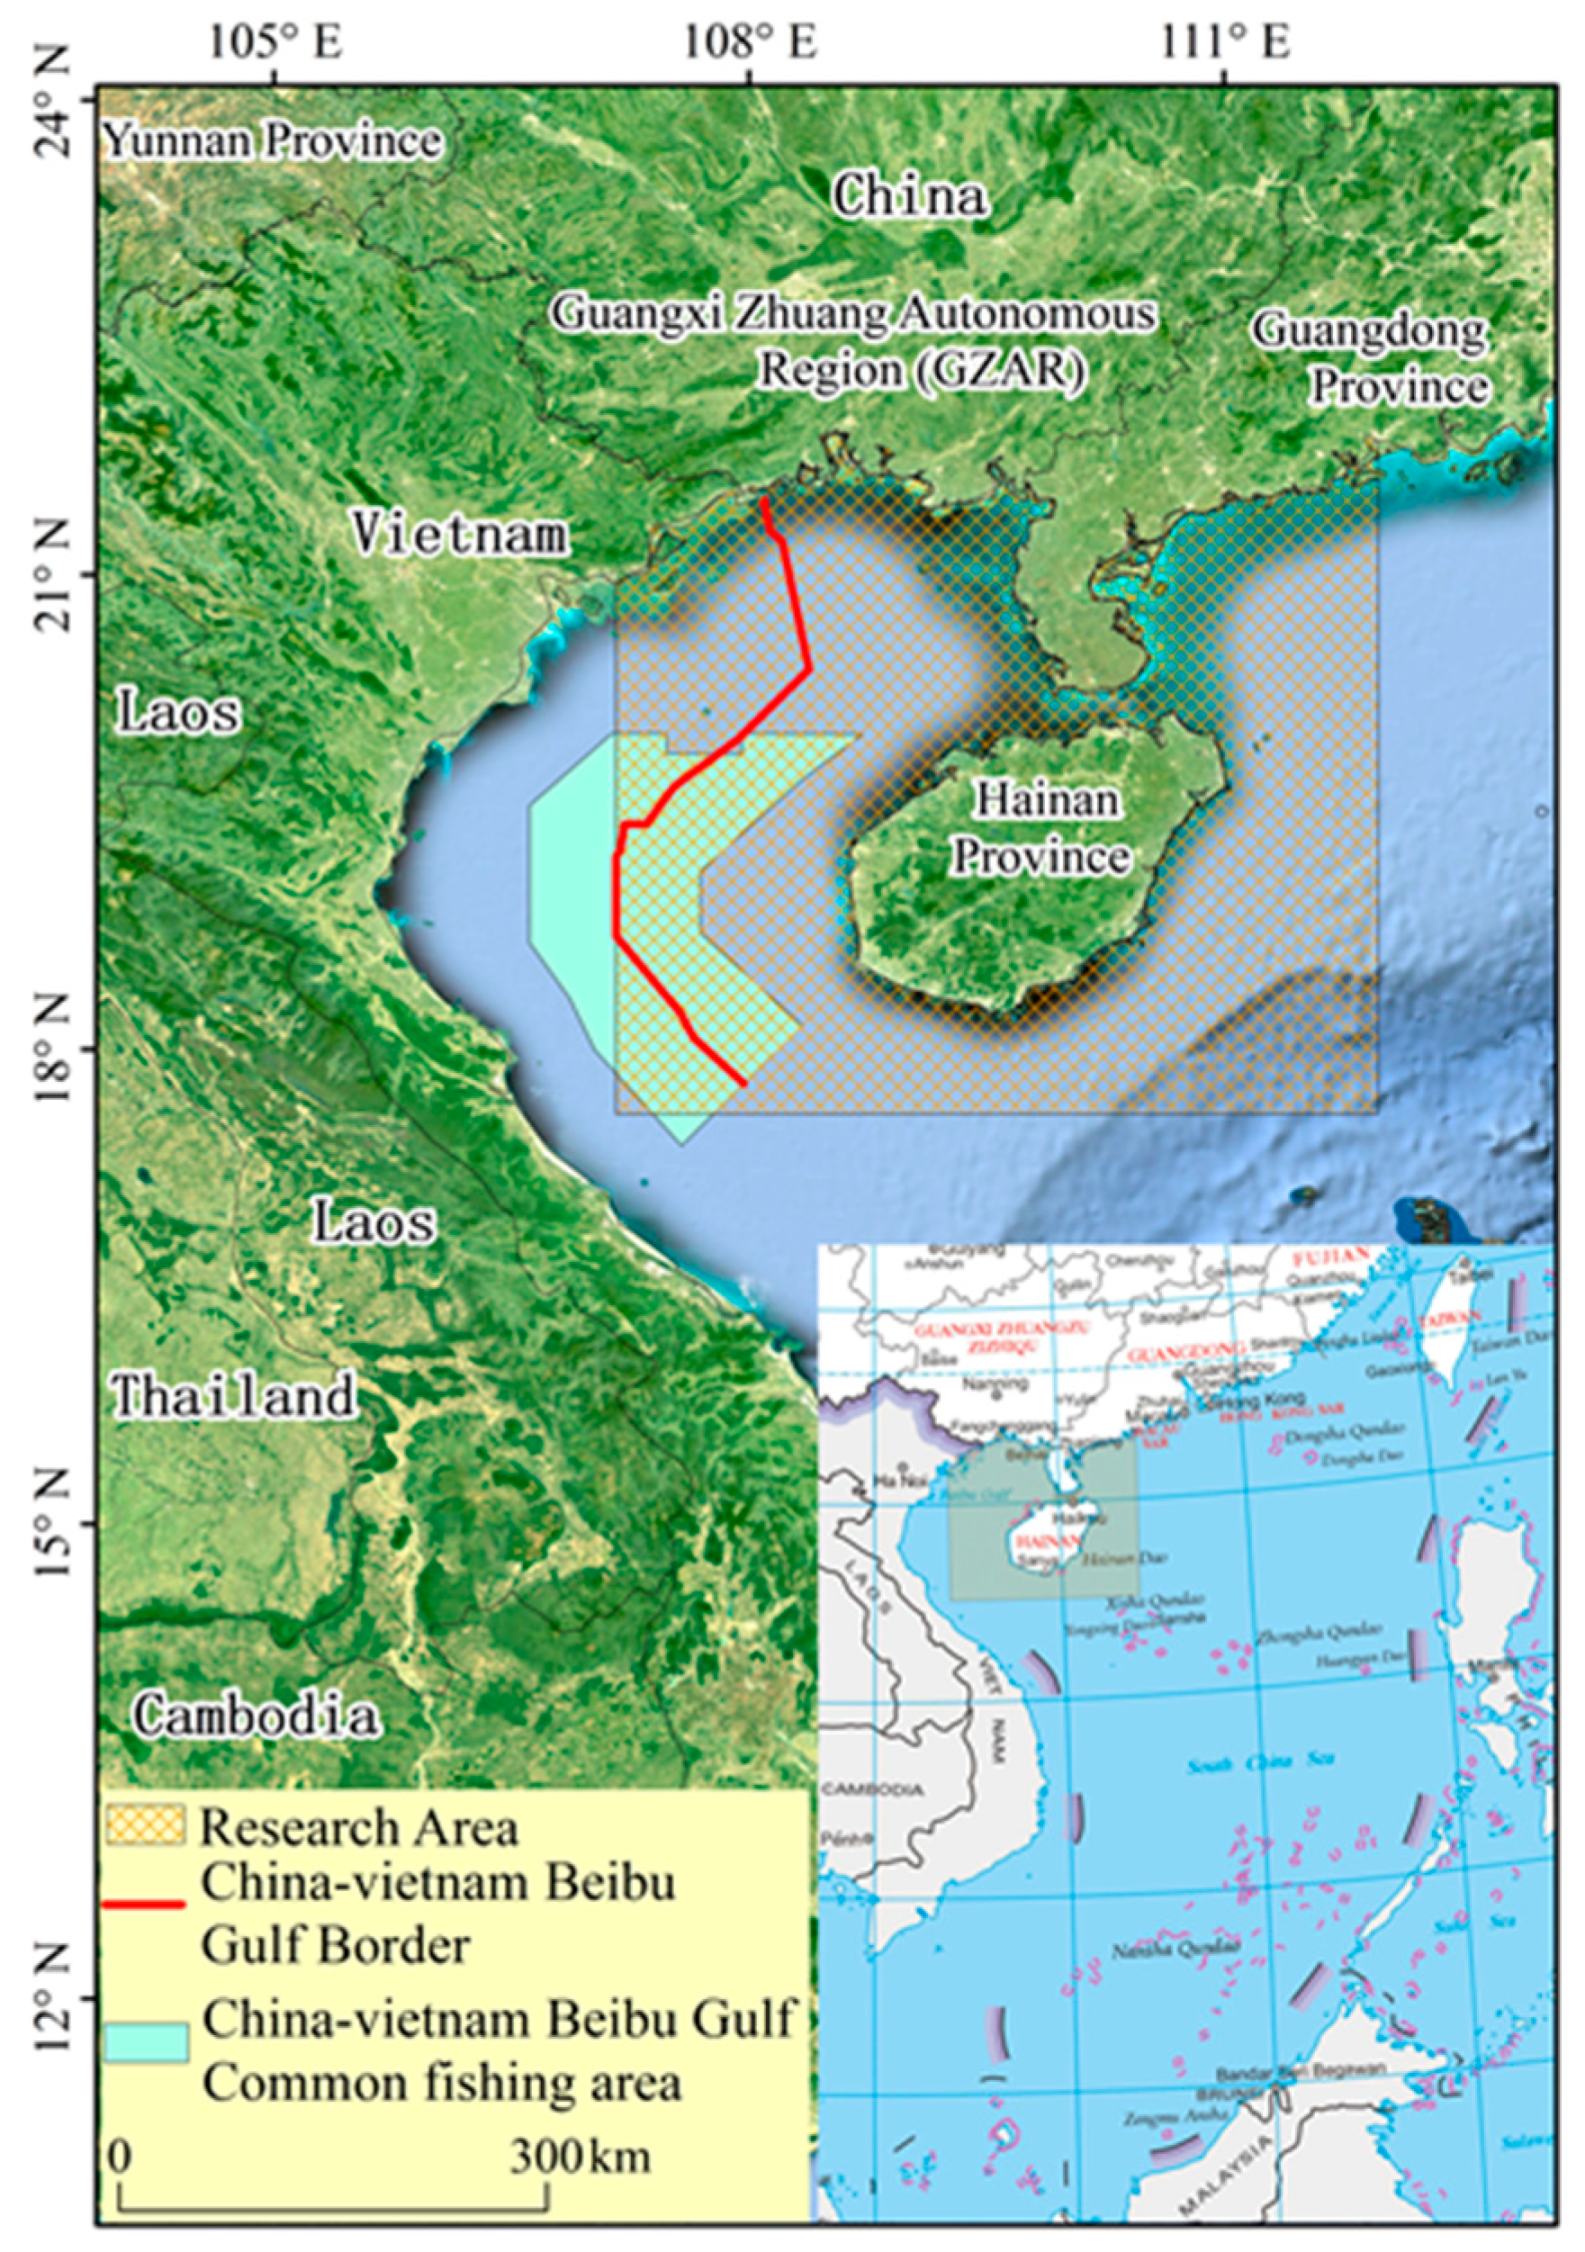
Based on this research status, this paper makes full use of such a strategy of combining the advantages of NLT and ship AIS data, in order to put forward a method to obtain the fishing intensity of Marine fisheries by integrating multi-source data. Taking the northern waters of the South China Sea as the research area, the typical season of 2018 was selected to conduct experiments using the proposed method. It is expected to provide an avenue for the information management of fishery resources, assessment of fishing intensity, protection of the legitimate rights and interests of fishing vessels, and to provide information sources and references for the formulation of scientific and effective fishery management and protection policies.

2. Study Areas and Data Sources

2.1. Introduction to the Research Area

Marine fishery is the pillar industry of Marine economic development around the South China Sea. The natural conditions of the South China Sea region are superior, the fishery ecological environment is diverse, and the bait is abundant. Fishery resources have been enriched in the northern continental shelf of the South China Sea, the Beibu Gulf, and in other waters. Among them, the Beibu Gulf fishing ground occupies an important position for the three provinces (Guangdong, Guangxi, and Hainan province) and regions in the South China Sea, as well as the Marine fishing industry of Vietnam, and is the most important fishing area with the highest productivity of fishery resources in the South China Sea [36]. However, the actual fishing quantity of the Beibu Gulf fishery is far beyond the level that the natural ecology of the fishery can bear, and its fishery resources are crucial to the sustainable development of fisheries in the whole South China Sea [37]. Furthermore, the northern continental shelf area of the South China Sea provides a suitable environment for the growth and reproduction of fish bait organisms, such that there are also abundant fishery resources in this area. Therefore, the Beibu Gulf fishery and the fishery in the northern part of the South China Sea continental shelf (along the coast of Guangdong and around Hainan Island) were selected as the main study areas (see Figure 1), located in the range of 107.159° E~111.975° E and 17.591° N~21.881° N, with a total area of about 160,000 km2 and a water depth of 0–1500 m, with an average water depth of 200 m. Most of the study area lies within Chinese waters, but it also includes some waters off Vietnam.

2.2. Introduction to Data Sources

2.2.1. AIS

AIS equipment provides ships with a near-real-time state vector (e.g., position, speed, heading), static information (e.g., ship identifier, size, ship type), and voyage-related information (e.g., destination, estimated time of arrival, draft) [38], and carries out information exchange with other ships, not only with coastal AIS base stations [39,40]. AIS has the typical characteristics of big data, rich attribute information, wide coverage, and is commonly used in relevant studies on fishing intensity, IUU, and the maritime perception of Marine fishery [29]. In order to ensure the safety of maritime operations, more and more ships have been required to be equipped with AIS equipment. Under the existing conditions, most AIS data reception mainly relies on land base stations and a few satellite AIS. The AIS data used in this paper are in the CSV format, and were extracted from the global daily AIS data set, according to the scope of the study area and the type code of ship class. In this paper, the AIS data were obtained through business co-operation with the YiHaiLan Company, while the data pre-processing was mainly carried out using MySQL, Python, ArcGIS, and other tools. The processing contents included the deletion of trajectory anomaly data, the elimination of “flying points” (ship trajectory points occurring on land), and the sorting of MMSI (Maritime Mobile Service Identify) of the same ship by time, among others.

2.2.2. VBD

VBD data by the NOAA (National Oceanic Atmospheric Administration) were provided by the EOG (https://eogdata.mines.edu/vbd/ (accessed on 27 April 2021)). Using VBD data is very effective for analyzing dynamic fishery changes and the spatio-temporal changes of fishery grounds. EOG has been working towards the use of SNPP data for Marine lightship inspection since 2014, initially in Southeast Asia and now globally. The detection algorithm was proposed by Elvidge et al. [23], which mainly applied DNB (Day/Night Band, 0.5–0.9 μm) and VCM (VIIRS Cloud Mask) data products in VIIRS data. Daily VBD data were in CSV format, and contain rich image data attribute information. Table 1 briefly lists some important relevant information. In addition, the VBD data use EOG nighttime fire point data to prevent oil/gas platforms from being identified as ships. At present, VBD is mainly used for research on Marine light trapping vessels [27,30]. The data are ready for use, and the VBD-related attribute information content is complete. Near real-time data acquisition is available at a cost, while an ordinary user can obtain 45-day lag data for free.
The above two types of data are trajectory data records, generated by the movement of ships at sea. The difference is that the AIS data are obtained by decoding the messages received by the ground-based base stations or AIS satellites, while VBD data are obtained from SNPP DNB band image detection, such that the acquisition of VBD depends on the sampling time and coverage area when the satellite passes over the study area.

2.2.3. Other Data

We also used global vector data from Nature Earth public sphere Earth data set (http://www.naturalearthdata.com/ (accessed on 27 April 2021)), vector data from Geographic Information resources directory Service system (National Catalogue Service For Geographic Information) (http://www.webmap.cn/commres.do?Method=result100W (accessed on 27 April 2021)), and the South China Sea island illustrations from the standard map service website (http://bzdt.ch.mnr.gov.cn/ (accessed on 27 April 2021), plan approval, GS (2019) 1708). Furthermore, the Beibu Gulf–joint fishing zone border data were obtained from the website (https://www.un.org/Depts/los/LEGISLATIONANDTREATIES/STATEFILES/VNM.htm (accessed on 27 April 2021)), providing the site co-ordinates.

3. Technical Routes and Research Methods

3.1. Technical Route

The premise of matching and fusion of data from different sources is that they have the same spatiotemporal reference benchmark and interval range. Both AIS and VBD contain longitude and latitude co-ordinates and time information; however, the reference and format of the time information are inconsistent. The time included in AIS and VBD data was converted to the Beijing time standard. The technical flow of data processing was as follows (Figure 2): (1) Obtaining image information through VBD data, such as image frame (boundary) co-ordinates, and image start and end scanning time. Based on the relationship between the coverage range of DNB band images and the inclusion of the study area, images which completely covered the study area and VBD data obtained by detection were screened. (2) The time of satellite transit through the center of the study area was obtained, according to the frame co-ordinates of the selected images, the start and end time of scanning imaging, and the longitude and latitude co-ordinates of the center of the study area, such that the two kinds of data belonged to the same space–time constraint. (3) The central time of the satellite transit research area was used as a reference, in order to screen the AIS data sequence. Then, the AIS data sequence was combined with the central time of the satellite transit research area for the interpolation calculation. (4) Under the same spatial and temporal constraints, the proximity analysis method was used to match and fuse the AIS and VBD data obtained by interpolation calculation, where the fusion data and the kernel density analysis method were used to obtain raster data of the fishing intensity field. (5) Finally, we analyzed and mined the matching data information, compared the fishing intensity characteristics of the study area obtained by the data before and after fusion, and mined the characteristic rules.

3.2. Research Methods

3.2.1. Satellite Transit Time Acquisition

The SNPP satellite orbits the Earth about 14 times per day and can observe the Earth’s surface twice. As the SNPP satellite performs linear array scanning imaging and orbits from north to south, the image time of a single image of the DNB band sensor is about 340 s, the width is about 3040 km, and the image latitude span is about 20°. The latitude span of the study area is about 5°, accounting for about a quarter of the entire satellite imaging time (about 90 s). VBD data records provide image frame co-ordinates (Table 1), in order to reduce the bias caused by incomplete coverage of a single image in the study area in the analysis of the processing results. During data processing, VBD data of a single image completely covering the study area was screened, according to the frame co-ordinates of the image and the inclusion relationship between the image and the study area. At the same time, to ensure that the comparative analysis of data between different months was not affected by the difference in the number of images selected, the same number of images were screened in each month; namely, 25 images. To obtain accurate NPP satellite transit time information, co-ordinate information corresponding to the center point of the study area and the start and end points of image scanning was adopted, combined with the start and end times of image scanning and linear interpolation method, in order to obtain (Figure 3). The longitude and latitude co-ordinates of No. 2, the center of the research area, and No. 8 are denoted as ( L o n 2 , L a t 2 ) ,   ( L o n s t u d y _ a r e a _ c e n t e r , L a t s t u d y _ a r e a _ c e n t e r ) ,   ( L o n 8 , L a t 8 ) , respectively. For the convenience of interpolation calculation, it was uniformly converted to the Gaussian plane Cartesian co-ordinate system. The co-ordinates converted to the Gaussian projection Cartesian co-ordinate system and the corresponding time are respectively denoted as ( X 2 , Y 2 , T 2 ) ,   ( X o , Y o , T o ) ,   ( X 8 , Y 8 , T 8 ) . It should also be noted that the satellite scans from north to south, such that the imaging time is more related to latitude information. In order to avoid the occurrence that the latitude of the center point of the research area is too far away from the scanning starting and ending points, the longitude of the center point of the research area was calculated using Equation (1) below:
L o n s t u d y _ a r e a _ c e n t e r = 1 2 ( L o n 8 + L o n 2 )
Δ t 1 = T o T 2
Δ T = T 8 T 2
S 2 o = ( X o X 2 ) 2 + ( Y o Y 2 ) 2
S 28 = ( X 8 X 2 ) 2 + ( Y 8 Y 2 ) 2
Δ t 1 = Δ T S 2 o S 28
After pulling down, the image scanning time t o of 0 point in the center of the research area is calculated by linear interpolation as follows:
t o = T 2 + Δ T S 2 o S 28

3.2.2. AIS Track Data Interpolation

Ship trajectory interpolation methods include Lagrange linear interpolation, piecewise linear interpolation, cubic spline, and so on [41]. The linear interpolation algorithm is simple, but its interpolation accuracy is not high. Although the calculation time and interpolation error of piecewise linear interpolation are small, the interpolation results will lead to the trajectory not being smooth. Cubic spline interpolation has high precision in the simulation of trajectory, but its theory is based on numerical analysis, without considering the inherent attributes of AIS. Therefore, we chose a linear interpolation method, proposed by Zhou et al. that comprehensively considers heading, speed, time, and trajectory type (straight line and curve). The method is carried out as follows [42]: First, the AIS geodetic longitude and latitude ( L , B ) are converted into plane coordinates ( x , y ) by Gauss–Kruger projection, and the degree is calculated in meters instead of minutes. Then, the interpolation co-ordinates are converted to geodetic longitude and latitude co-ordinates. If the Gaussian co-ordinates before and after the interpolation point are A ( x 1 , y 1 ) and B ( x 2 , y 2 ) , then the predicted co-ordinates of two groups of interpolation calculation points can be obtained by taking A and B as the reference points, respectively:
{ x i 1 = x 1 + v 1 s i n ( θ 1 ) ( t i t 1 ) y i 1 = y 1 + v 1 c o s ( θ 1 ) ( t i t 1 )
{ x i 2 = x 2 + v 2 s i n ( θ 2 ) ( t i t 2 ) y i 2 = y 2 + v 2 c o s ( θ 2 ) ( t i t 2 )
where θ and v respectively represent the vessel heading and speed at the interpolation base point; and t 1 and t 2 represent the corresponding times at the interpolation base point. Then, the predicted co-ordinates ( x i 1 , y i 1 ) and ( x i 2 , y i 2 ) are weighted and averaged. The weight is determined by the time difference between the interaction point and points A and B. The closer the distance is, the larger the weight of the close point is as follows:
{ Q 1 = 1 ( t i t 1 ) / ( t 2 t 1 ) Q 2 = 1 ( t 2 t i ) / ( t 2 t 1 )
where Q 1 and Q 2 are the weights of both ends of A and B, respectively, then the coordinates of interpolation points after weighted averaging are
{ x i = Q 1 x i 1 + Q 2 x i 2 y i = Q 1 y i 1 + Q 2 y i 2
Finally, the corresponding plane co-ordinates are converted into longitude and latitude co-ordinates to obtain the final interpolation results. In addition, dynamic data reporting intervals range from 2 s to 3 min, depending on navigation conditions and region. Therefore, in order to ensure sufficient input data accurately, we selected data 15 min before and after in time in the satellite transit research area, for the interpolation calculation.

3.2.3. Different Fishing Boat Data Matching and Fusion

The interpolated AIS ship trajectory data, and VBD data which detected by NLT images, are discrete in spatial distribution. In the study of Hsu et al. [30], the use of VMS and VBD data accounted for about 10% of spatial matching. The matching threshold applied in the matching process was 700 m in space and 5 s in time (i.e., satellite orbit model transit study area time interpolation calculation error of ±2 s). Therefore, the method applied in this paper took AIS data as the matching benchmark and searched for VBD data within the 700 m threshold of space with single AIS data as the benchmark. When there were one or more points in the neighborhood that could be matched, the distances between the VBD point and the AIS point in the matching field were calculated, respectively. According to the proximity principle, the nearest point was selected as the matching point (see Figure 4).

3.2.4. Analysis of the Nuclear Density of Fishing Vessels

Kernel Density was used to analyze the fishing intensity of multi-source fishing vessels. The kernel density analysis method uses a kernel function to calculate the quantity of each unit area, according to point or broken line elements to fit each point or broken line into a smooth cone surface. The vector fishing boat track points fused after pre-processing, fusion matching, and repetition of point filtering were used as input, and a circular search area was applied. The density value of each pixel was calculated as well as the output for each ship trajectory vector point located in the research area [43]. The calculation equation of the kernel density method can be expressed as:
f ( s ) = i = 1 n 1 h 2 k ( s c i h )
where f ( s ) is the calculation function of the kernel density at the spatial position s; h is the distance attenuation threshold; n is an element point number, whose distance from position s is less than or equal to h ; and the function k represents the spatial weight function. The geometric meaning of this equation is that the density value is maximum at each core element c i , and decreases continuously with greater distance from c i until the distance from core c i reaches the threshold value h , after which the kernel density value drops to 0 [44,45].

4. Analysis of Experimental Results

4.1. AIS and VBD Match Analysis

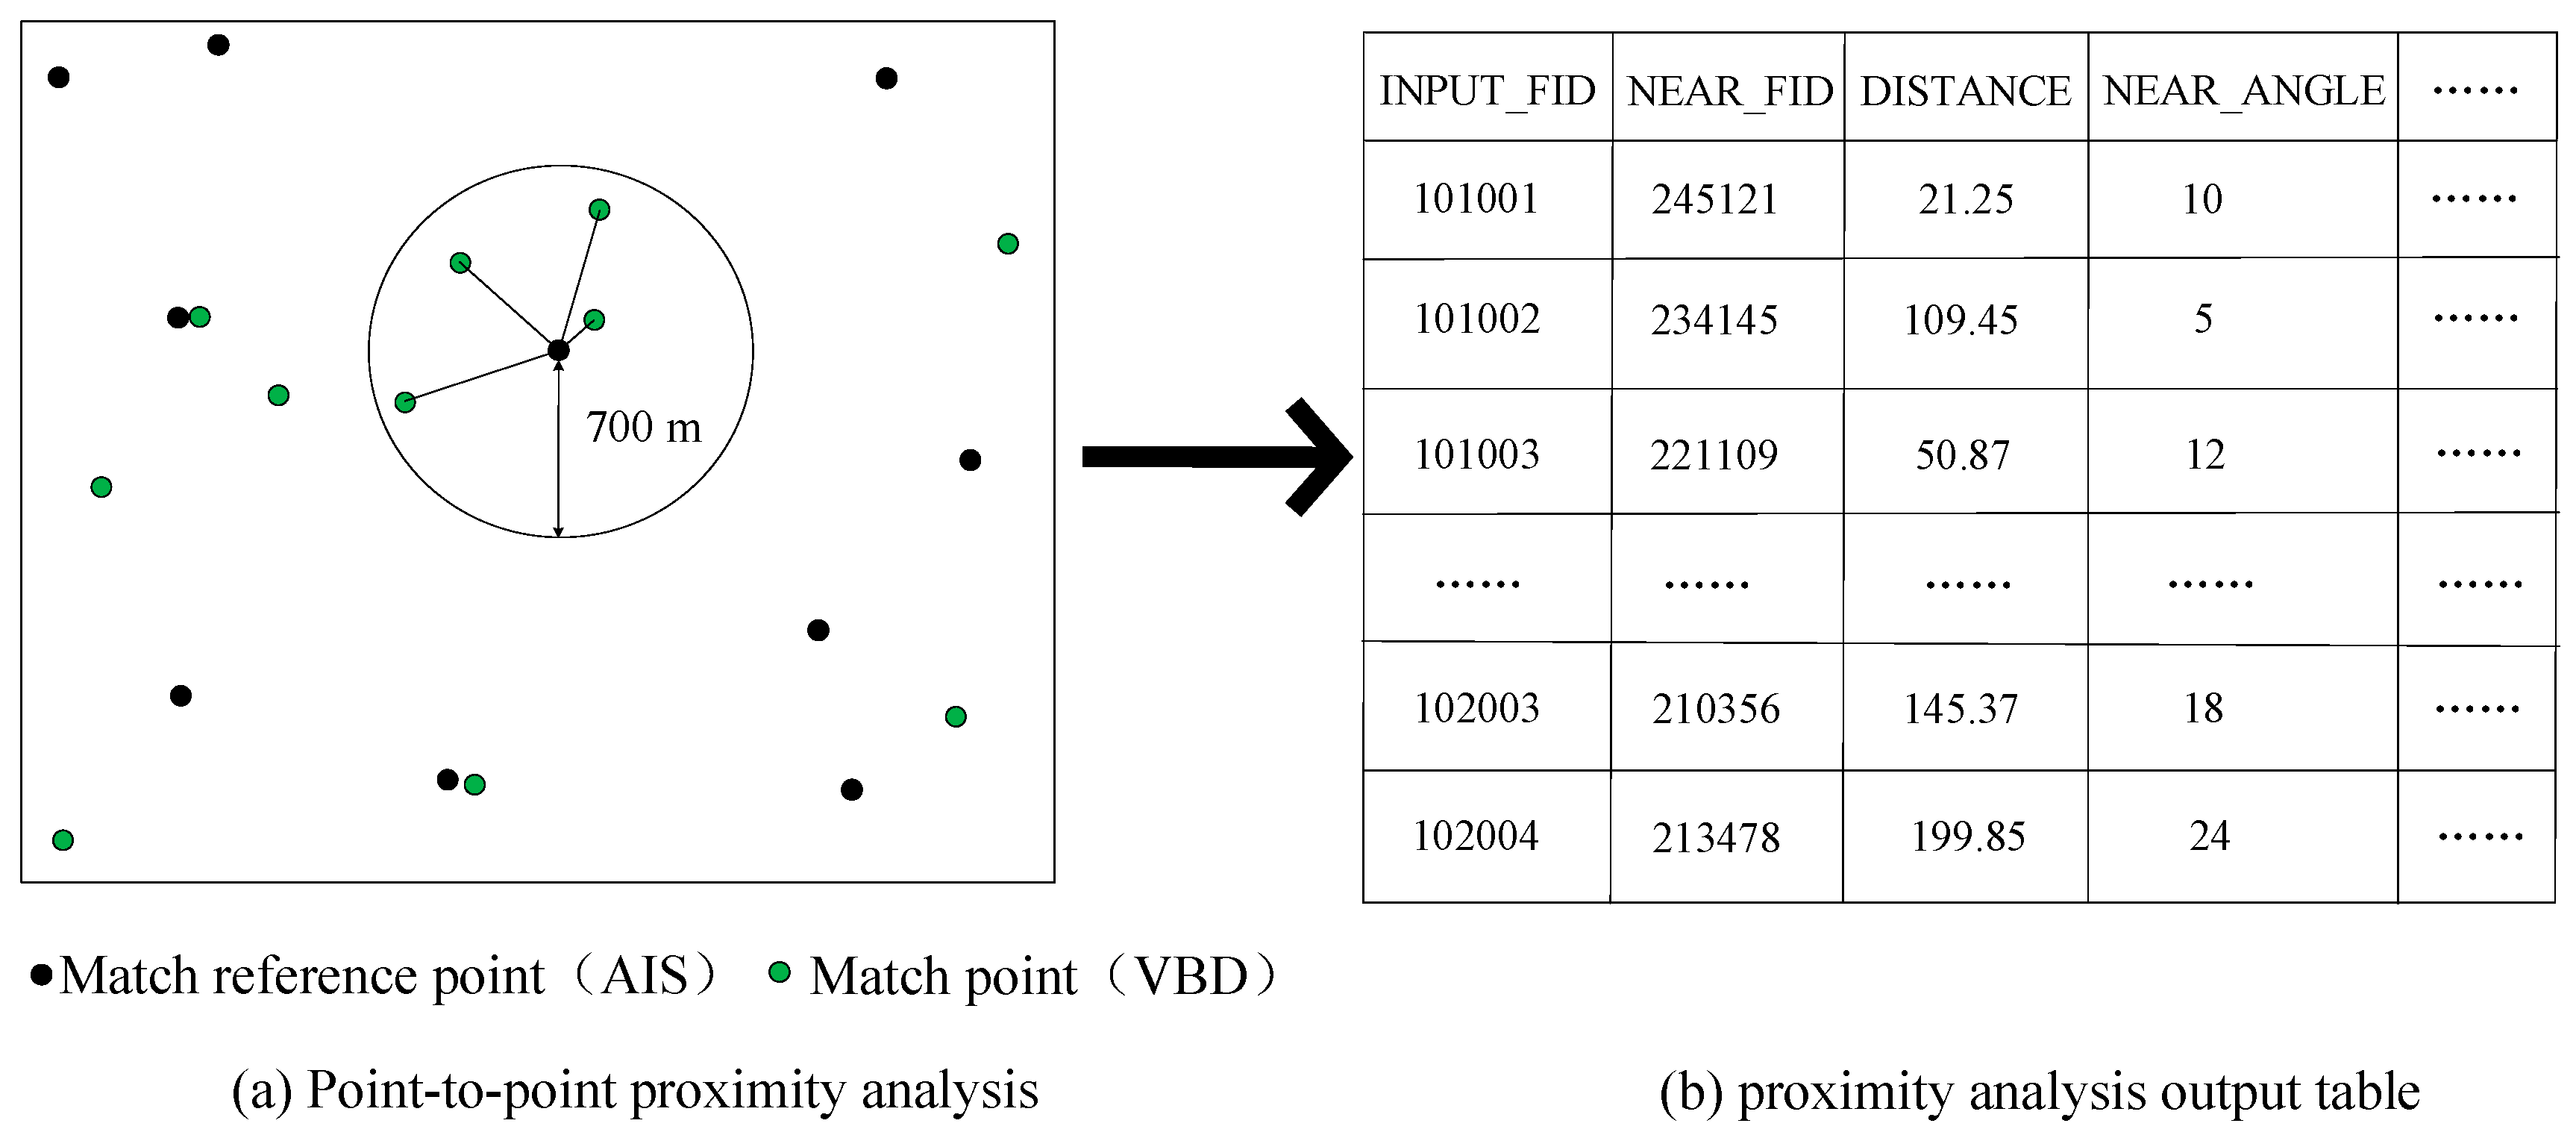
Taking AIS as the benchmark data and VBD as the data to be matched, 219,847 (interpolated AIS) AIS records and 61,855 VBD records in the study area were selected for proximity matching analysis. About 4164 were matched to the target, accounting for about 1.89% of the AIS benchmark data and 6.73% of the VBD data to be matched. Further analysis of the matched VBD successfully combined with AIS attribute information showed that fishing boats accounted for 49.42% of VBD obtained by neighbor matching, while cargo ships, tankers, tugboats, passenger ships, and other vessels accounted for 20.89%, 6.54%, 1.83%, 1.49%, and 19.9%, respectively. According to the matching information, it can be concluded that most of the matched VBD data obtained from maritime detection were from fishing boats that performed light trapping at night. However, the lights generated by other ships at sea can also be picked up by noctilucent remote sensing satellites, as they pass through the sea. This also fully demonstrates that it is very effective to use light to obtain fishery information, in order to analyze dynamic fishery change and spatiotemporal variation characteristics of fishery grounds. Furthermore, no matter whether the input AIS benchmark data or the input VBD data were to be matched as the measurement index, it can be seen that the successful matching ratio of the two types of data was relatively low. In other words, the integration of the two types of data could more effectively mine and analyze the fishing situation. In addition, about 23.68% of the MMSI of the ships that were matched were incorrect. According to the analysis of vessels without abnormal MMSI, ships of Chinese nationality accounted for 77.49%. Among ships from other countries, the top three were Panama, the Marshall Islands, and Vietnam, accounting for 4.74%, 2.71%, and 2.61%, respectively.

4.2. Analysis of Fishing Intensity Characteristics

4.2.1. Based on AIS Fishing Intensity Analysis

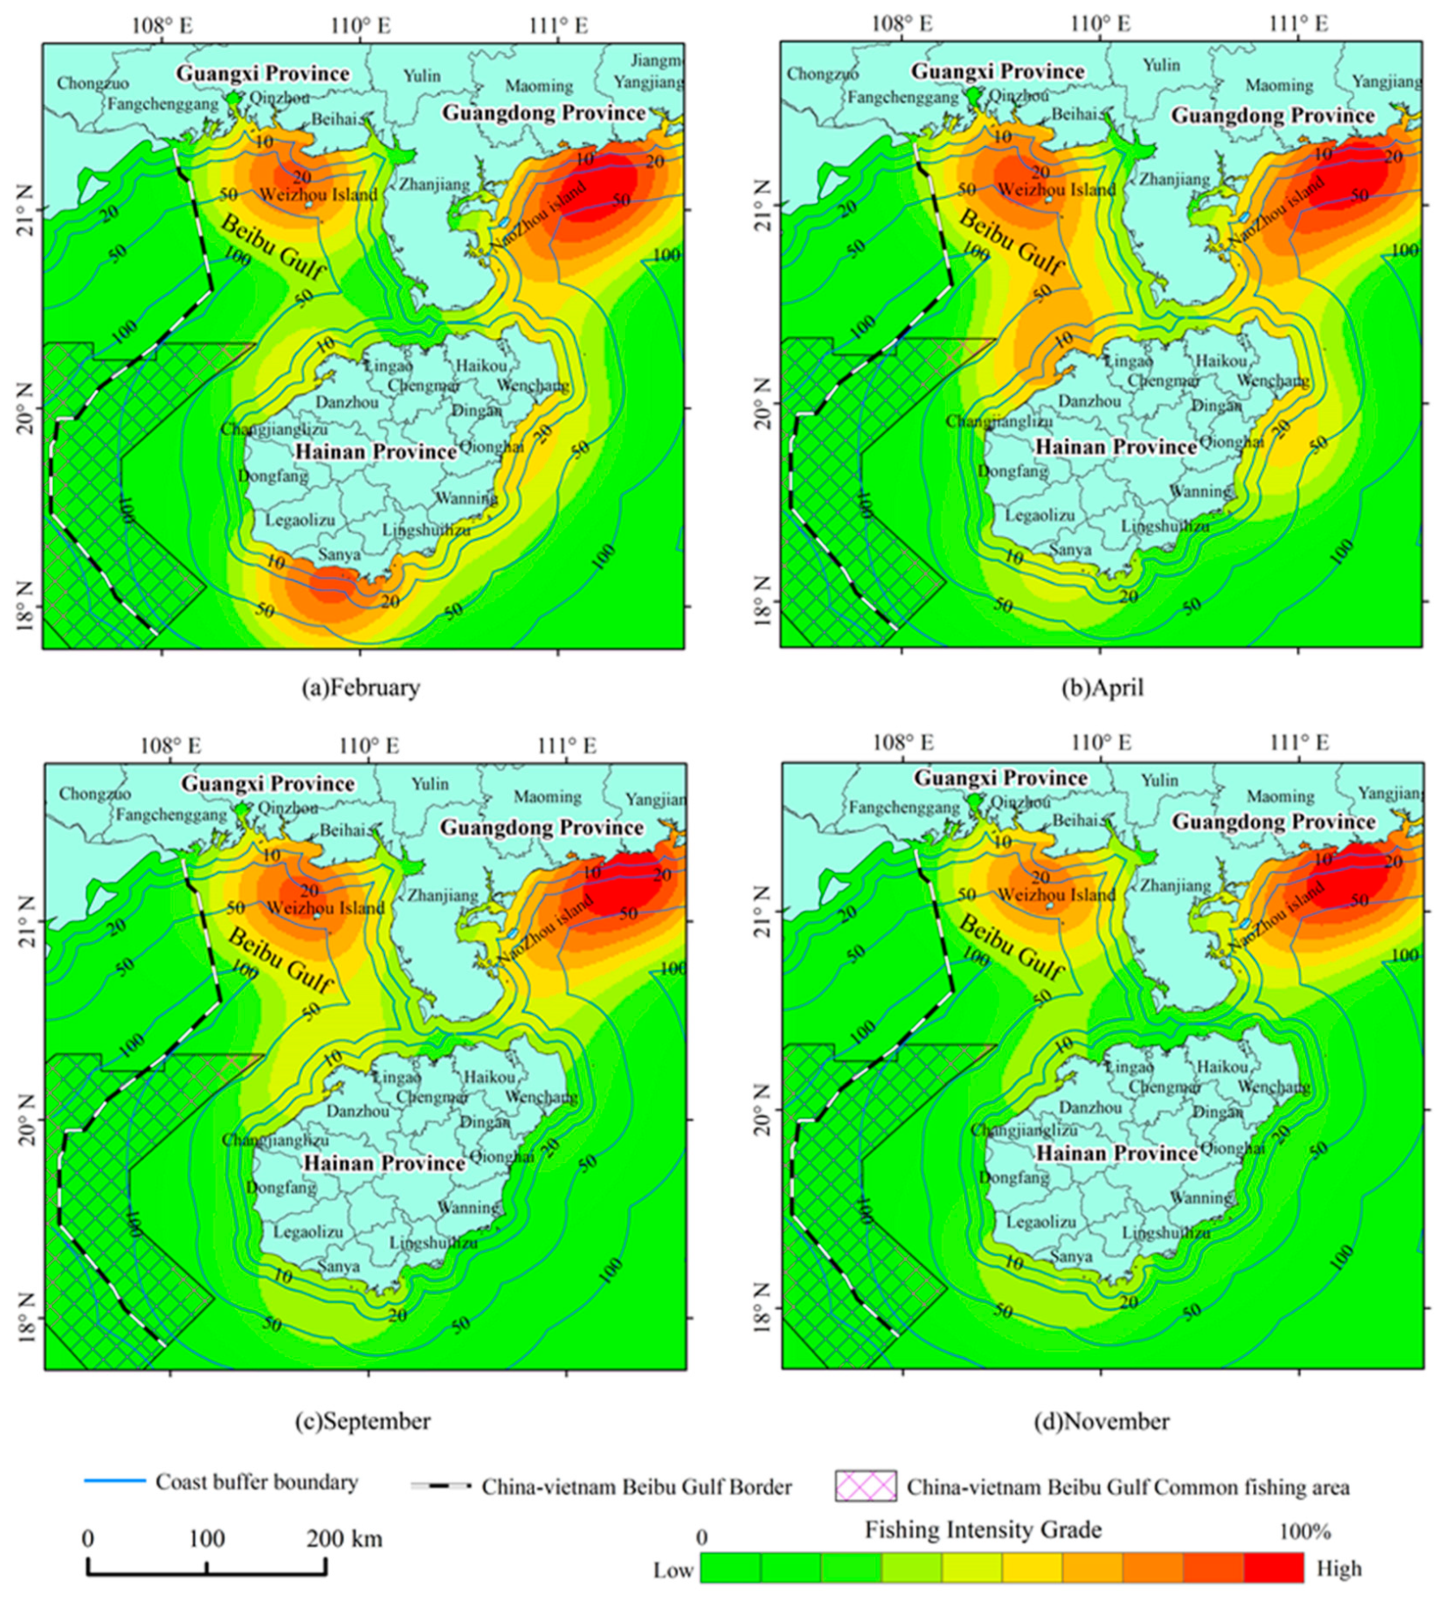
In order to better identify the advantages and disadvantages of the various data used in Marine fishery analysis, as well as the differences before and after fusion, based on the perspectives of AIS, VBD, and their fusion, we conducted a comparative analysis of the respective fishing intensity data obtained. Based on the time in the satellite transit study area, the AIS data obtained by screening, integration, and sampling were used to form a fishing intensity map of the Marine fishery. The processed AIS data can avoid the problem of inconsistent granularity of data time interval, caused by the distance of fishing boats offshore. It can be seen, from Figure 5, that AIS better reflected the fishing intensity of the nearshore fishery. The results indicated that: (1) The fishing intensity near the coastal areas of Guangdong and Guangxi Provinces was always higher than that around Hainan Island. The change of fishing intensity was small on the macroscopic scale, especially in the coastal areas near Guangdong and Guangxi Provinces; however, there were slight changes at the detailed scale, such as in the waters around Sanya and Danzhou in Hainan Province. (2) The fishing intensity in the coastal areas of Guangdong Province was always higher than that around Hainan Island, and the fishing intensity in the coastal areas of Guangdong Province was always the highest within the selected time range. (3) The offshore distance of the high-intensity fishing distribution area, based on AIS data, was about 20–50 km. Therefore, the fishing intensity map produced by the AIS data of fishing vessels obtained through screening and interpretation sampling has good applicability within the sea area of 50–70 km offshore. However, the results are limited to countries and regions where AIS equipment is mandatory for fishing vessels.

4.2.2. Based on VBD Fishing Intensity Analysis

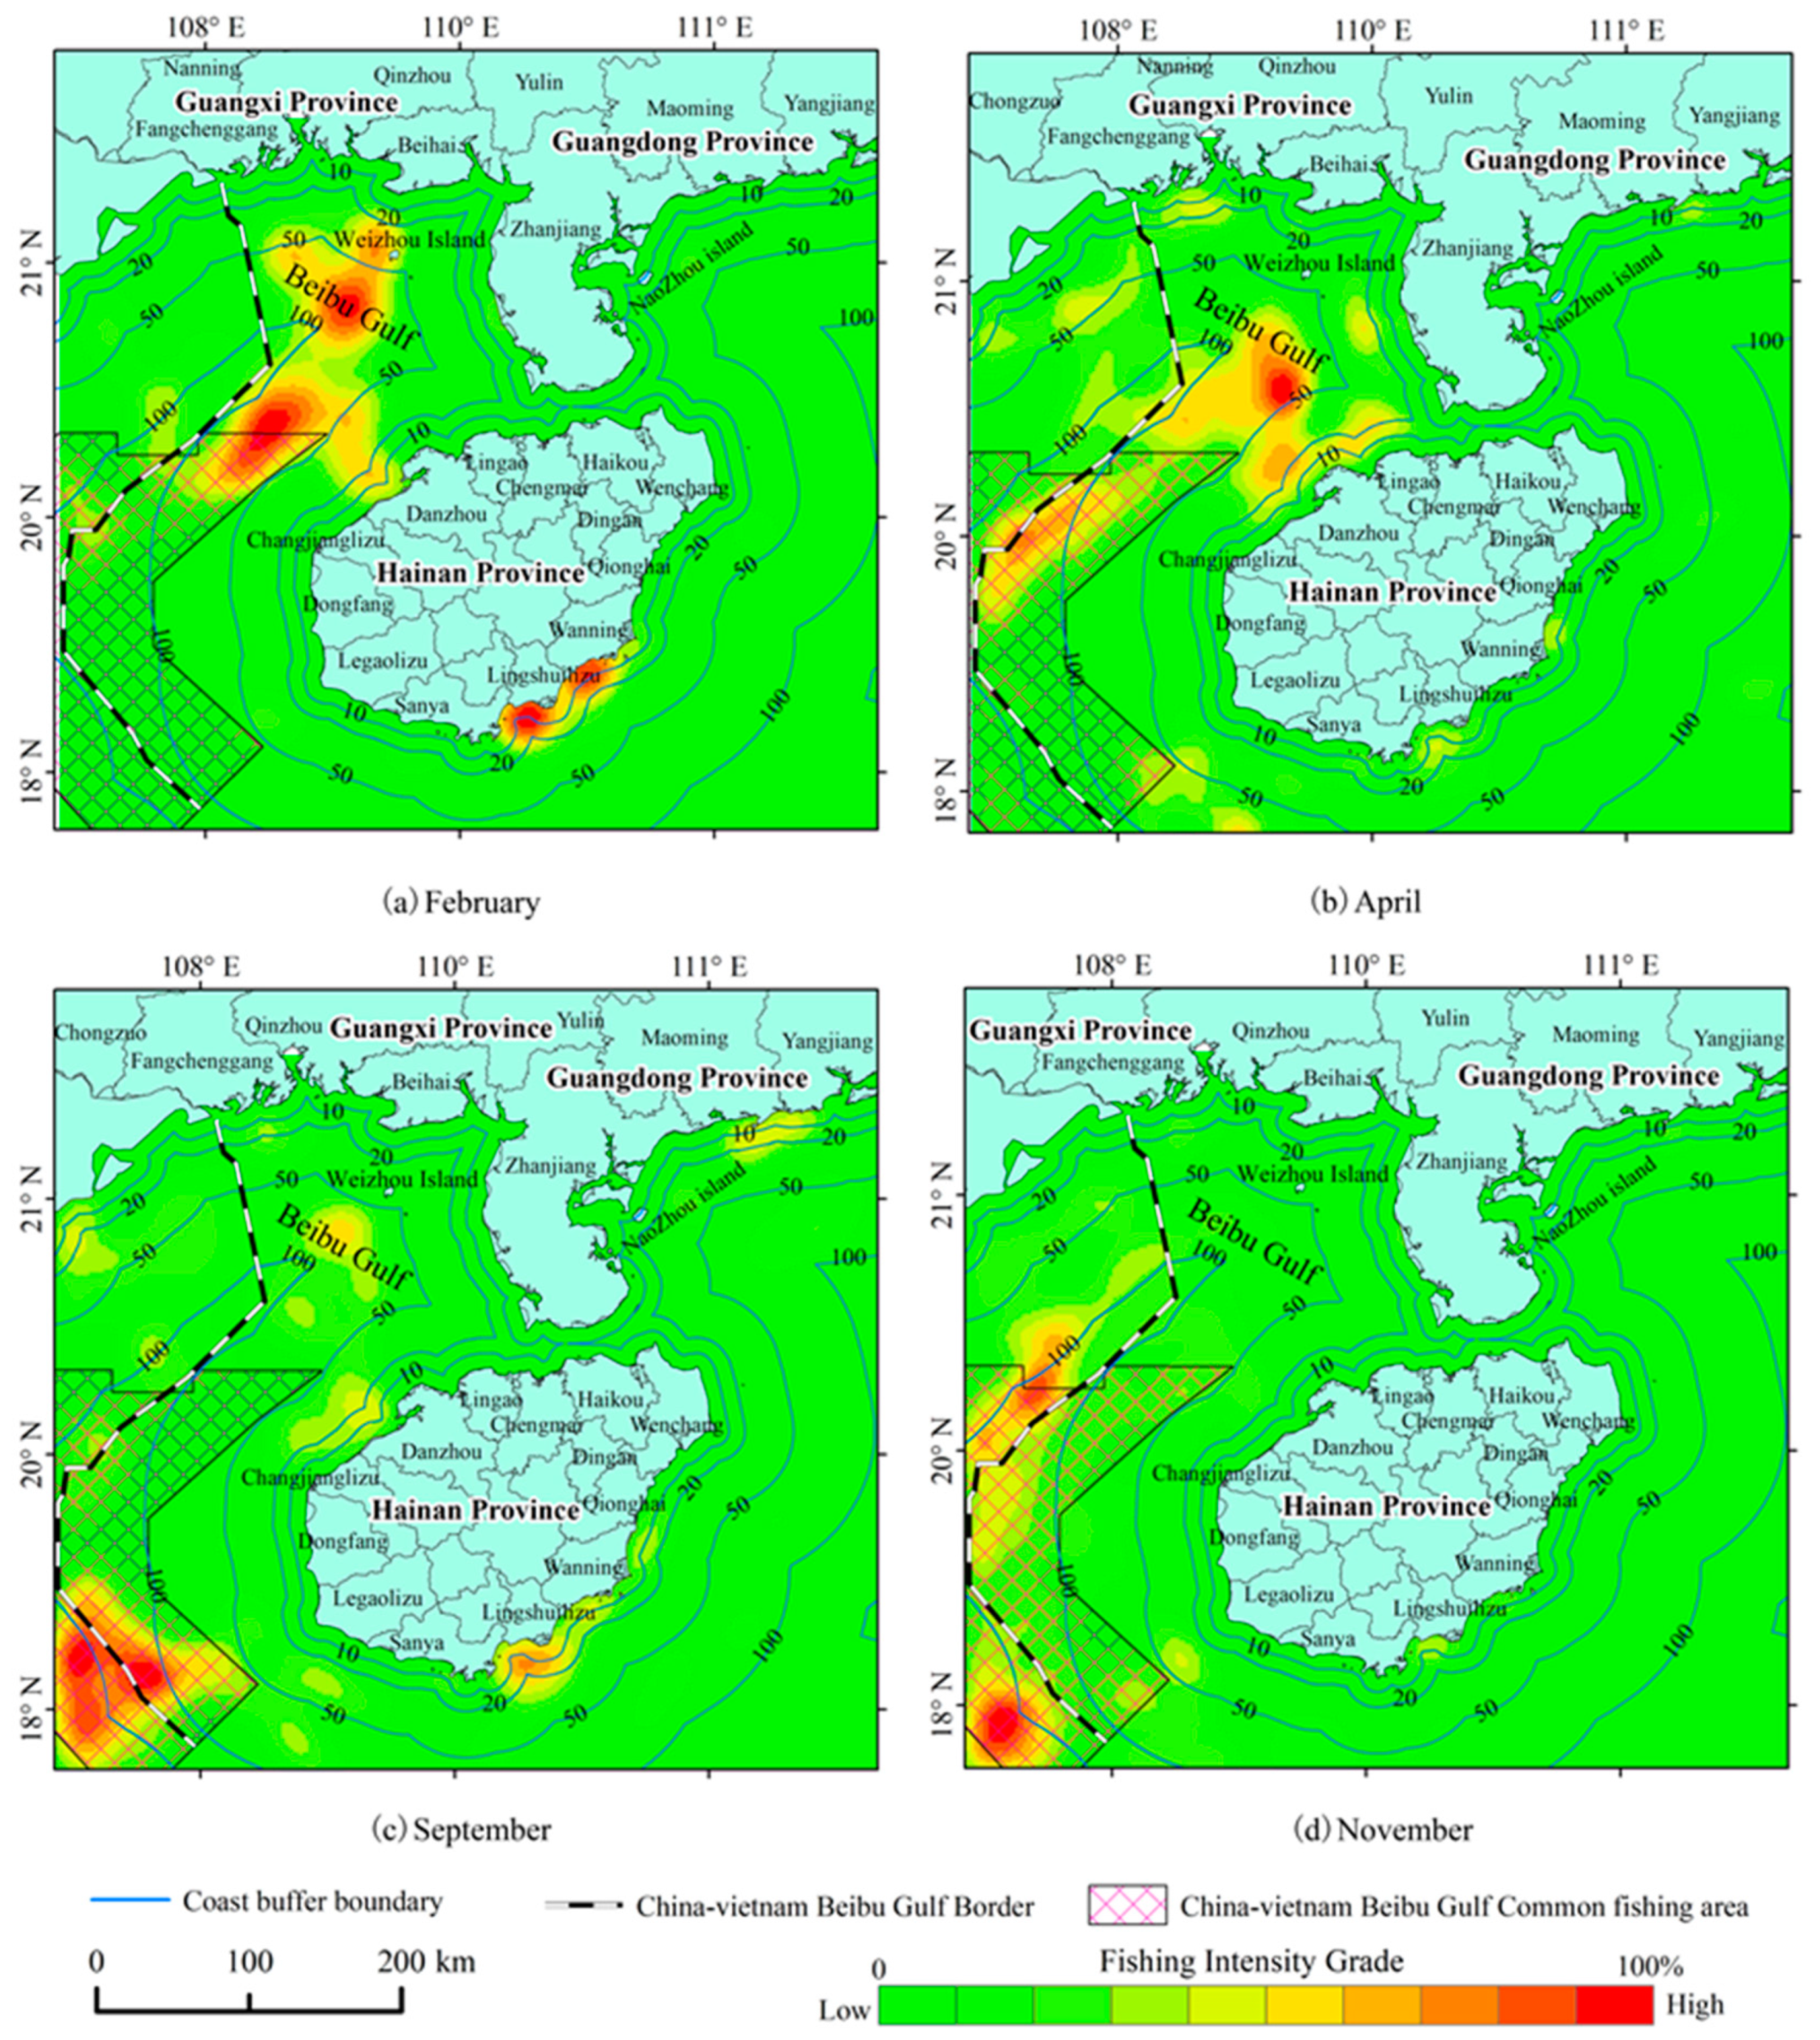
Compared with AIS data, the prominent advantage of VBD data is that it has reasonable objectivity in spatial distribution. Because the fishing resources in the northern part of the South China Sea are extremely rich, there is illegal fishing by fishing boats from other countries and regions. In order to avoid exposure, fishing boats will turn off the AIS equipment when operating in this area. Therefore, this section still adopts the method used in previous Marine fishery fishing research on light data to obtain fishing intensity, but the difference is that the target data of non-fishing vessels that match successfully is eliminated. It can be seen from Figure 6 that the fishing intensity data obtained based on VBD data in the study area are different in both spatial distribution and temporal coverage. With people in the past, “nearshore fishing intensity is high, far shore fishing intensity is low” understanding is quite different. The fishing intensity reflected has the following characteristics: (1) Most of the high-intensity fishing areas are located 50 km away from the offshore, and most of the study areas are located within 50 km or nearby the China-Vietnam common fishing area. However, it is also found in coastal areas, such as Danzhou, Lingshui, and Maoming of Guangdong Province. (2) The spatial distribution of fishing intensity was significantly different from month to month. For example, the areas with high fishing intensity in February were concentrated in the range of 50–100 km offshore, such as Lingshui in Hainan and within 20 km offshore at the boundary of Lingshui and Wanning. (3) The characteristics of high-intensity fishing areas are mainly isolated “clumps”, and the adjacent high-intensity “clumps” converge to form a “strip” feature, which is more prominent in the Beibu Gulf region of China and Vietnam. It can be seen from Figure 6 that, especially when the VBD data is far from the coast (about 100 km), it reflects that the fishing of Marine fishery is more objective. Therefore, the integration of AIS and VBD is a new strategy to obtain the characteristics of fishing intensity in Marine fisheries.

4.2.3. Fishing Intensity Analysis under the Fusion of AIS and VBD

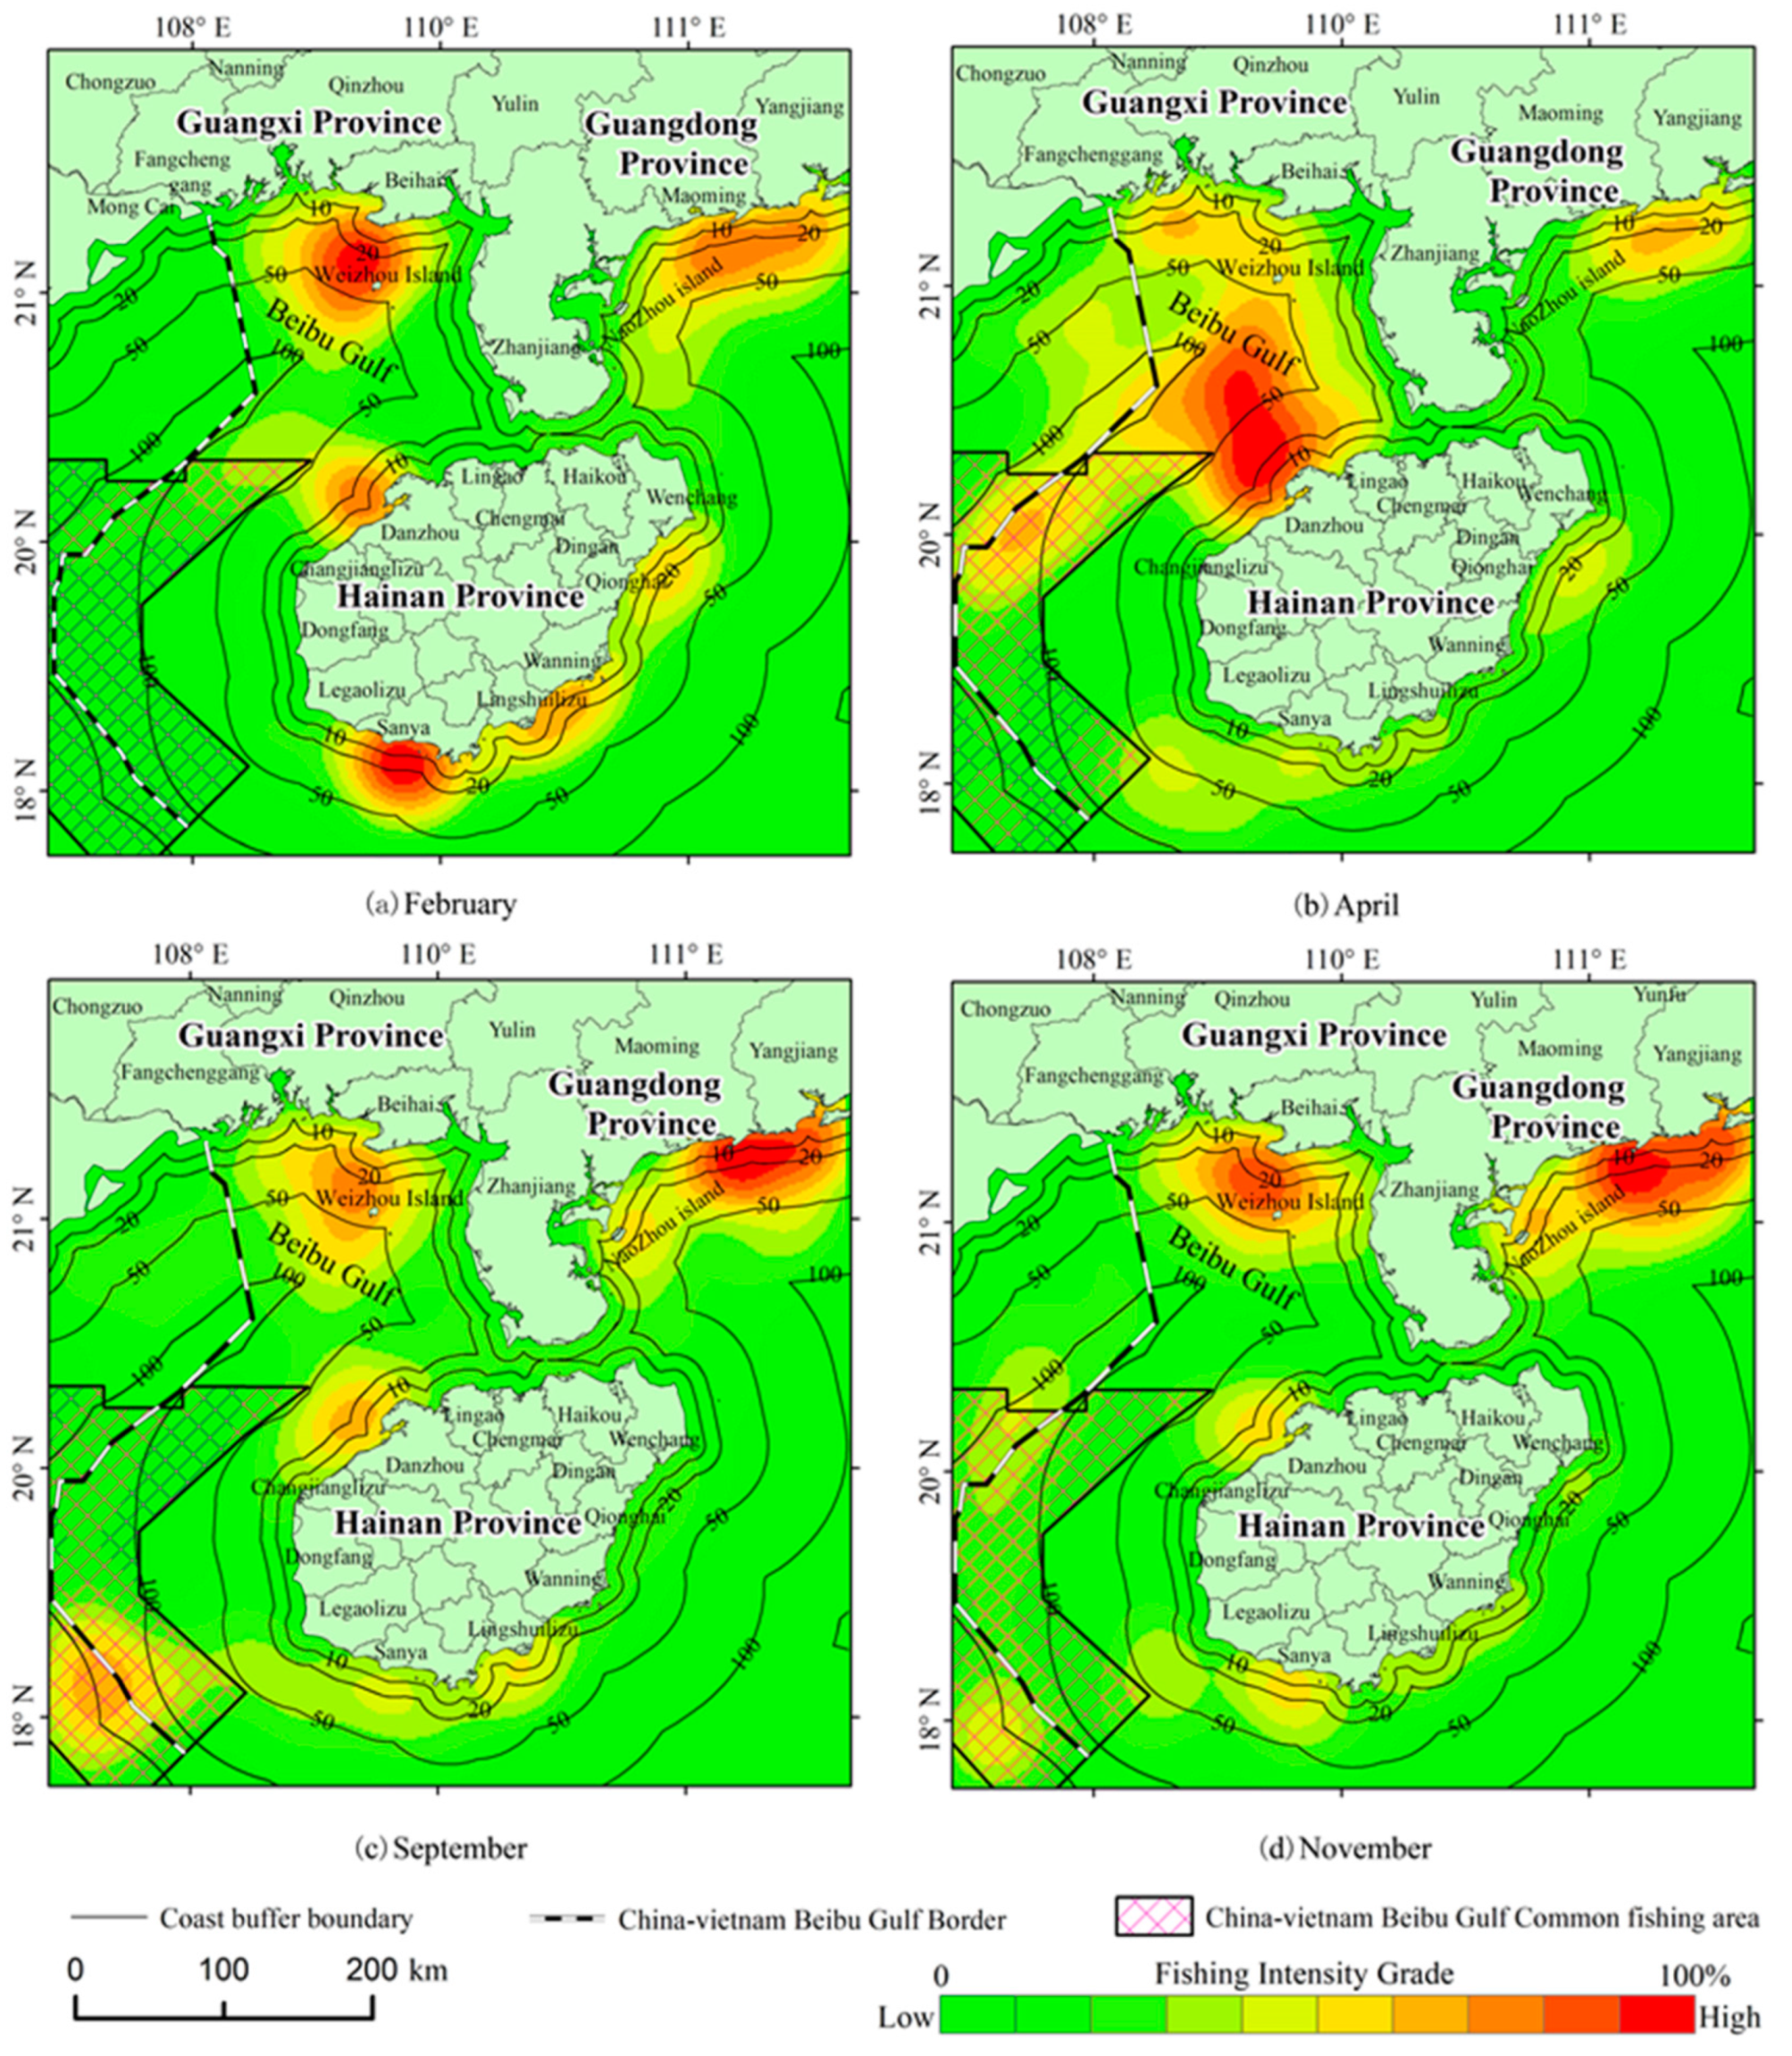
AIS and VBD data, which were successfully matched in proximity, represented the same fishing boat or moving target on the sea under the same space–time constraints. Therefore, the point density was used to obtain the fishing intensity after the fusion of the two data types, aimed at identifying those ship targets that were successfully matched under the same space–time constraints. In order to avoid the impact of repeated data on the analysis results, one of the categories of targets needed to be eliminated. In this paper, the matching VBD data were selected to be eliminated. The fishing intensity map obtained after the fusion of AIS and VBD is shown in Figure 7. As can be seen from the fishing intensity diagram (Figure 7) after data fusion, high-intensity fishing was not only limited to the nearshore area, but distributed throughout the whole study area. In terms of overall distribution characteristics, the results obtained in Figure 7 were more authentic, accurate, and objective. Compared with the conclusions drawn from Figure 5 and Figure 6, the conclusions obtained from the fusion of the two types of data were different, both in terms of the spatial scale and the selected time scale.
As can be seen from Figure 7, after the fusion of data from two different sources expressing the same factor, the fishing intensity of Marine fisheries obtained mainly presented the following characteristics: ① Overall, after the data fusion, the results show that the fishing intensity of offshore fisheries was significantly higher than that of high seas fisheries; however, it did not decrease with an increase of offshore distance. ② In February, the distribution of fishing intensity was more “clump-like,” where the fishing intensity formed a ring around Hainan Island (40 km around Sanya) > along the coast of Guangxi (10–60 km near Beihai) and > the coastal area near Guangdong (10–40 km near Maoming). The main characteristic trend of coastal areas around Hainan Island was Sanya > Danzhou >Lingshui > Qionghai. In addition, the high-intensity fishing on the south coast of Guangdong was mainly characterized by a “strip” with a length of about 100 km and a width of about 50 km. ③ The fishing intensity in April was different from that in other months. The areas with high fishing intensity were mainly distributed between Danzhou City of Hainan Island and Fangchenggang City of Guangxi Province, forming a diamond-shaped “strip” distribution about 50–60 km wide and 100 km long. ④ Comparatively, the spatial distribution characteristics of fishing intensity in September and November were similar, to some extent. The differences were mainly reflected in the boundary of the Beibu Gulf and the vicinity of the common fishing area of China and Vietnam. It can be seen, from Figure 7c,d, that, in addition to the greater fishing intensity around Hainan Island in the “Guangdong–Guangxi” coastal areas, the high-intensity values also had a sporadic distribution in the China–Vietnam fishery agreement area. Moreover, the distribution of high-intensity values in the fisheries agreement zone was closer to the Vietnamese side. In addition, it can be inferred, by comparing the results in Figure 5, Figure 6c,d and Figure 7c,d, that the contribution of high-intensity fishing values was higher from other countries and regions (i.e., except for China). The reasons for this are as follows: (1) As early as 2011, China’s Marine fishery administration department introduced corresponding management measures, in order to ensure the safety of fishing boat operations, through the mandatory installation of AIS equipment; and, (2) in the AIS data screening in Figure 5, only the AIS data of fishing vessels of Chinese nationality were analyzed, according to the static information of the AIS. ⑤ It can be seen, from Figure 7, that there were certain differences in the high-intensity fishing of offshore Marine fishery in the Guangdong and Guangxi areas. The main results for this are as follows: (1) The fishing intensity on the south coast of Guangdong was higher than that in the coastal area of Guangxi; and (2) the high-intensity fishing on the south coast of Guangxi mainly presents a “strip” feature, where the strip generally expands outward from the near shore, with expansion distance generally about 50 km, and where the length of the coastal line of the strip is about 70–100 km. However, along the coast of Guangxi province, there are mainly elliptical “clumps,” where the center of the clumps is distributed within a range of 20–50 km offshore, while the clump radius is about 20 km.

4.3. Comparison and Analysis of Fishing Intensity from Multi-Source Data

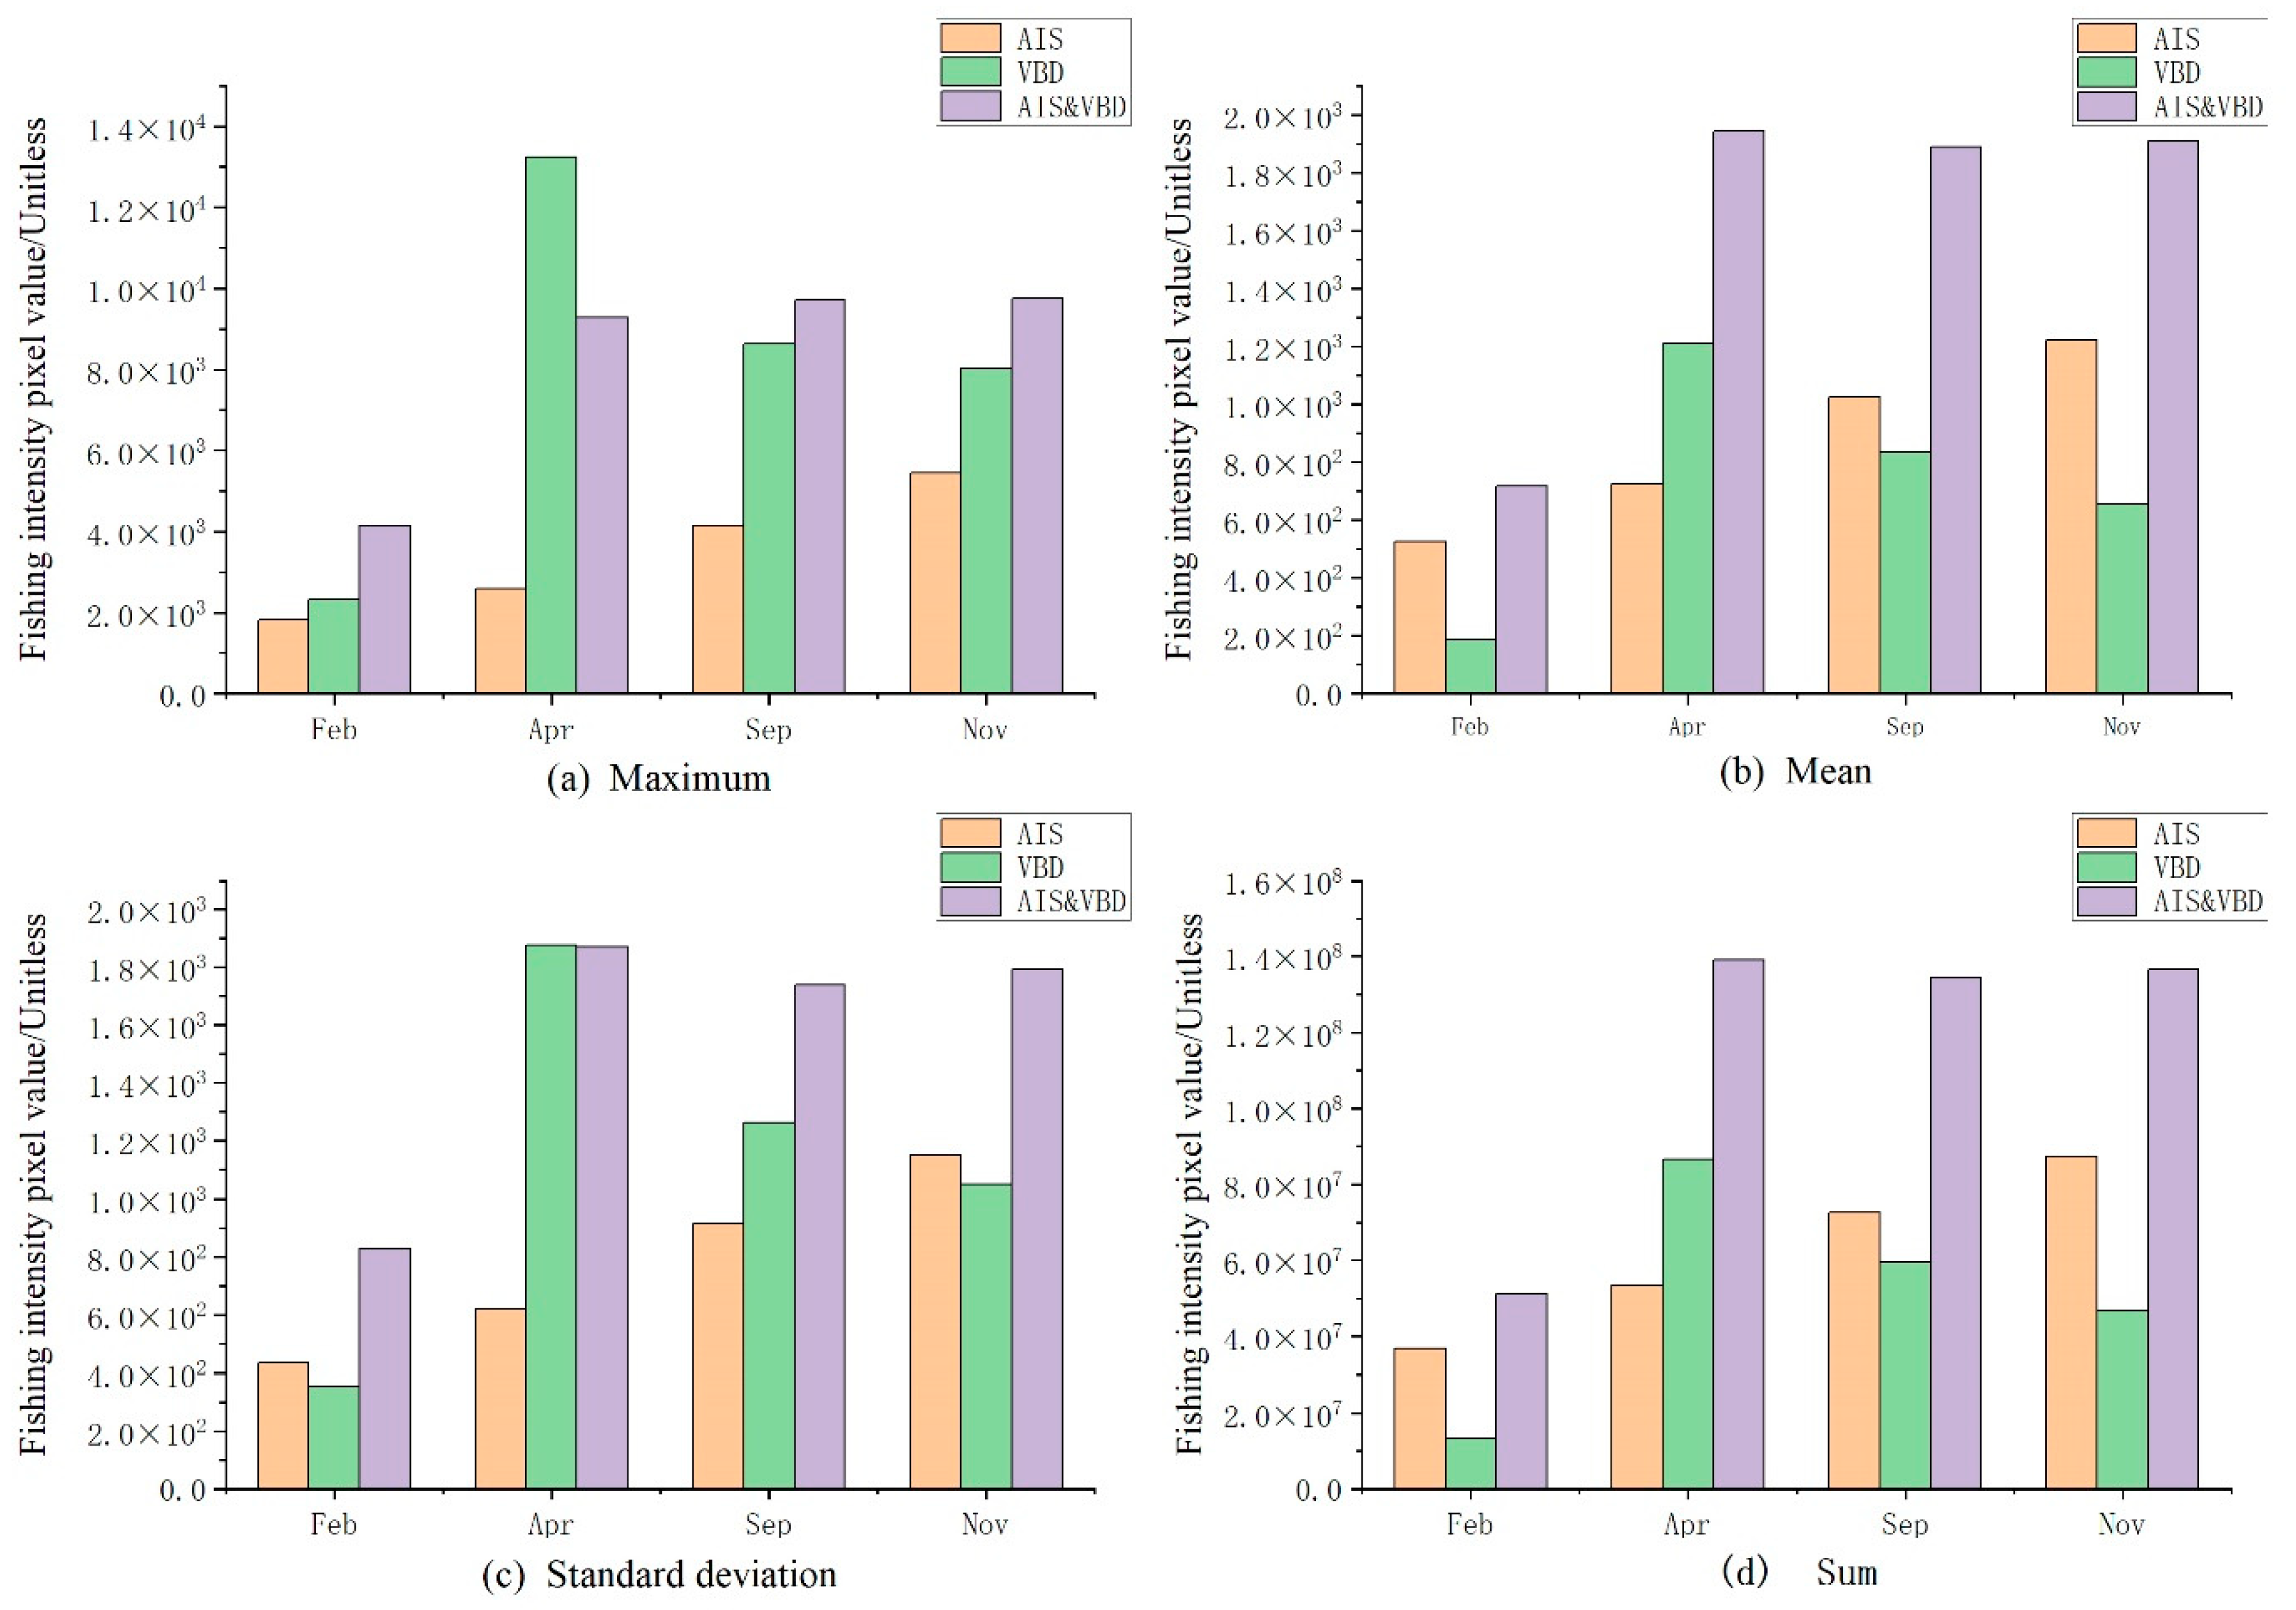
Section 4.2 compared and analyzed the different marine fishery characteristics derived from the data mentioned previously in the paper. This analysis showed that the fishing intensity characteristics derived from the AIS and VBD data fusion strategy can better reflect the rich characteristic rules, and can better support the deficiency in the distribution rules of the Marine fishery fishing situation and its intensity characteristics. However, the deficiency is that there is no quantitative analysis of fishing intensity on a monthly scale under different data types. The raster data of the fishing intensity field obtained above is the most direct reflection of the fishing operations of the Marine fishery. Therefore, this section further analyzes the statistical characteristics of pixel value sum, mean value, maximum value, and standard deviation of the obtained raster fishing intensity maps (Figure 8).
From the pixel statistics of fishing intensity obtained after the screening, sampling, and interpretation of AIS data, it can be seen that, in the four months from February to November, the fishing intensity values showed an increasing trend, where the increase in proportion between adjacent months was about 33.7% on average. According to the statistical results of pixel values of raster pixels in the fishing intensity map obtained from the VBD data in the study area, from February to April, the intensity increased about 5.5 times, on the original basis. From the perspective of the coverage range of the selected data time scale, the order of fishing intensity, from high to low, was April > September > November > February, which was significantly different from the results reflected by AIS data. From the perspective of AIS and VBD data fusion, it can be concluded that, within the selected data coverage range, the fishing intensity in February was the lowest. After data fusion in other months, it can be clearly seen that the fishing intensity in each month had little difference from that in the others. The ratio between the mean pixel value and standard deviation CV (Coefficient of Variation) of fishing intensity based on AIS was 0.879, the CV of fishing intensity map based on VBD data was 1.642, and the CV of fishing intensity data based on AIS and VBD data fusion was 0.995.

5. Discussion

In view of the problems inherent to AIS, VBD, and other single data sources when reflecting Marine fishery intensity, such as the existing fishing vessel coverage rate and the incomplete regional reflection, we proposed a framework for fishing intensity information acquisition, based on a multi-source data fusion strategy in this paper. Through comparative analysis of the experimental results in Section 4.2 and Section 4.3, we found that, compared with the traditional assessment methods of fishery resource development intensity and situation, the fishing intensity information acquisition method based on the fusion of AIS and VBD multi-source ship position data proposed in this paper was more accurate. It should be clarified that the fishing intensity maps and advantages of AIS and VBD fusion shown apply only to fishing effort at night and/or light trap fishing vessels. It effectively weakens the problems that AIS does not cover all fishing vessels at sea effectively; that VBD cannot reflect the fishing information of non-light fishing vessels; that the signal reception at AIS database stations can be affected by ship navigation density, weather, and communication technology; and that the data sampling interval granularity is not even. It provides a promising avenue for the efficient and accurate macro-scale mining and acquisition of fishing intensity information under temporal and spatial constraints, thus laying a good foundation for a wider range of Marine fishing research in the future. Meanwhile, it can be effectively extended to the study of illegal fishing during ambushing moratoria in the South China Sea. Our experimental results showed that the fusion of AIS and VBD data can be well-applied to the mapping of fishing intensity and the mining of temporal and spatial dynamic characteristics of Marine fishery. The matching and fusion analysis of AIS and VBD data showed that: (1) Adjacent matching between AIS and VBD accounted for about 1.89% of the input AIS data, where fishing boats accounted for about 49.42% of the matching data, which indicated that most of the targets in the VBD data were fishing boats. The low matching rate indicated that the fusion of the two had a good foundation.
In existing studies, Hsu et al. [30] performed a 32-month VMS–VBD data matching analysis in Indonesia, and showed a data volume ratio of 1:9. In our experiment, the data volume ratio between AIS and VBD was about 10:3. Therefore, based on the number of VBDs in the experiment of this paper, the matched data accounted for about 6.73% of the total AIS data, which was relatively low on the whole. The main reasons for this can be summarized as follows: ① The light from some fishing boats is too weak to be monitored by satellite or was affected by cloud cover [46], which led to the decline of identification accuracy of fishing boats. ② The fishing types of Marine fisheries are not limited to light traps, and fishing vessels account for about one-third of the AIS data. ③ At present, the coverage rate of AIS equipment in fishing vessels in the study area is high. In addition, Feng-Chi Hsu et al. applied cross-matching of VMS and VBD data for the identification of illegal fishing vessels lacking AIS and VMS equipment at sea. In this paper, the fishing intensity information in the study area was obtained and analyzed on the basis of cross-matching. ④ The number of fishing vessels carrying AIS equipment for light trapping is relatively small. ⑤ It also has some limitations for sensors or equipment to obtain AIS and VBD. Taking the VBD as an example, VBD can only reflect the number and distribution of light vessels captured by the NPP/VIIRS satellite. The number and distribution of light vessels are mainly affected by cloud cover at the moment of image acquisition, the brightness of ship light, and whether the light spots are within 5 km of shore (the light spots within 5 km of the shore are excluded by the mask). ⑥ The distant-based proximity analysis matching method used in this paper has some limitations, and future research will also refer to Rodger et al. AIS and radar images data fusion matching use a modified GNN (Global Nearest Neighbour) [47]. In addition, Russo et al. analyzed and studied VMS and AIS in Italy, and found that the coverage ratio of VMS in fishing boats was more extensive than that of AIS [48,49]. As a consequence, the effective integration of the two was more suitable for fishery research. However, most of the research in this paper was located in China. If you have some knowledge of China’s maritime fishery management background, you should know that most (or even all) fishing boats are equipped with AIS equipment. At the same time, in contrast to Geronimo et al. who used satellite images for night map fishing of fisheries and the maximum entropy model [26], in this paper, by using multi-source data fusion strategy, we came closer to reflecting the real fishery conditions. In future research, this will also be combined with all kinds of fishery resources, in an information analysis model for the fishing grounds, in order to provide a reference for Marine fishery reserves. In addition, differing from the research of Kroodsma et al. [15], we effectively avoided the shortcomings of the application of single AIS data to Marine fishery; however, our results were only limited to the exploration of typical areas in the northern part of the South China Sea and we did not explore the analysis of external incentives (Marine environment, Government policy, Fishing moratorium) for the spatial characteristics of fishing intensity changes.
Although this paper is innovative, compared with previous studies, it also had some limitations: ① Night-time remote sensing data are susceptible to clouds and moonlight, especially clouds. In the extraction process of fishing boats, masks are often used to remove them [46]. To some extent, this leads to the absence of VBD data, which can lead to deviations of the analysis results. ② In the extraction of NLT fishing boats, traditional methods (e.g., threshold segmentation) rely more on the mask and elimination of false alarm factors (e.g., oil and gas platforms, islands and reefs, offshore light sources, and so on), in order to ensure the accuracy of identification. However, the process of threshold statistical segmentation is greatly influenced by experience and understanding; furthermore, there are problems relating to insufficient empirical reference data. In this paper, some matching light data information was obtained in the data matching, but, due to the limited number of successful matchings within the selected time range, further statistical analysis of the matching light data was not carried out. ③ Due to the data quality problem of the static AIS data of fishing vessels [48], the quantitative fitting conversion relationship between the vessel light brightness and the cargo size of the vessel (e.g., ship length, ship width, ship stern distance, and so on) could not be effectively constructed. To some extent, this brought about a certain lack of precision for the construction of more efficient and accurate data fusion.

6. Conclusions and Prospects

Fishing intensity data provide an important basis for fishery management systems, for obtaining an accurate grasp of the actual situation of fishery production, and for the scientific and reasonable formulation of fishery development policies and measures by fishery management departments. In this paper, the advantages of AIS and VBD data were fully combined, for which a method of data matching and fusion was adopted. Under a time constraint, the compression and sampling of large AIS data on the time scale were realized, which improved the efficiency of data processing in later stages. Moreover, the advantages of VBD were fully exploited to expand the AIS, which can only reflect the deficiency of some fishing boats and inshore fishing. The fishing intensity field data were generated using the density of fishing boat track points generated by Marine fishing, and the characteristics of fishing intensity in the typical season in 2018 in the northern part of the South China Sea were analyzed and excavated. Through the analysis and comparison of fishing intensity mapping obtained by the fusion of AIS and VBD data of fishing vessels, it was found that: (1) Compared with the fishing intensity mapping produced by single data, the fishing intensity mapping obtained by the fusion of the two types of data obtained some valuable regular features. The main characteristics were as follows: After data fusion, the near shore fishing intensity was obviously more significant than that offshore, but it did not decrease with an increase of offshore distance. For example, in April 2018, it showed a trend of expansion from the coastal area of Danzhou City of Hainan Island to Fangchenggang of Guangxi province. From the fused four-month data, it could be seen that the highest intensity of fishing in each month was near the shore. The fishing intensity of the second grade was more obvious in the 30 km range around Hainan Island and the common fishing area, especially in the common fishing area. (2) The monthly fishing intensities based on AIS and VBD in the study area were significantly different, where the ratio of pixel mean to standard deviation of fishing intensity for the two types of data were 0.879 and 1.642, respectively. After fusion of the two types of data, the standard deviation of the average monthly fishing intensity data in the study area was 0.995, indicating that the distribution of data after fusion was better than that before fusion.
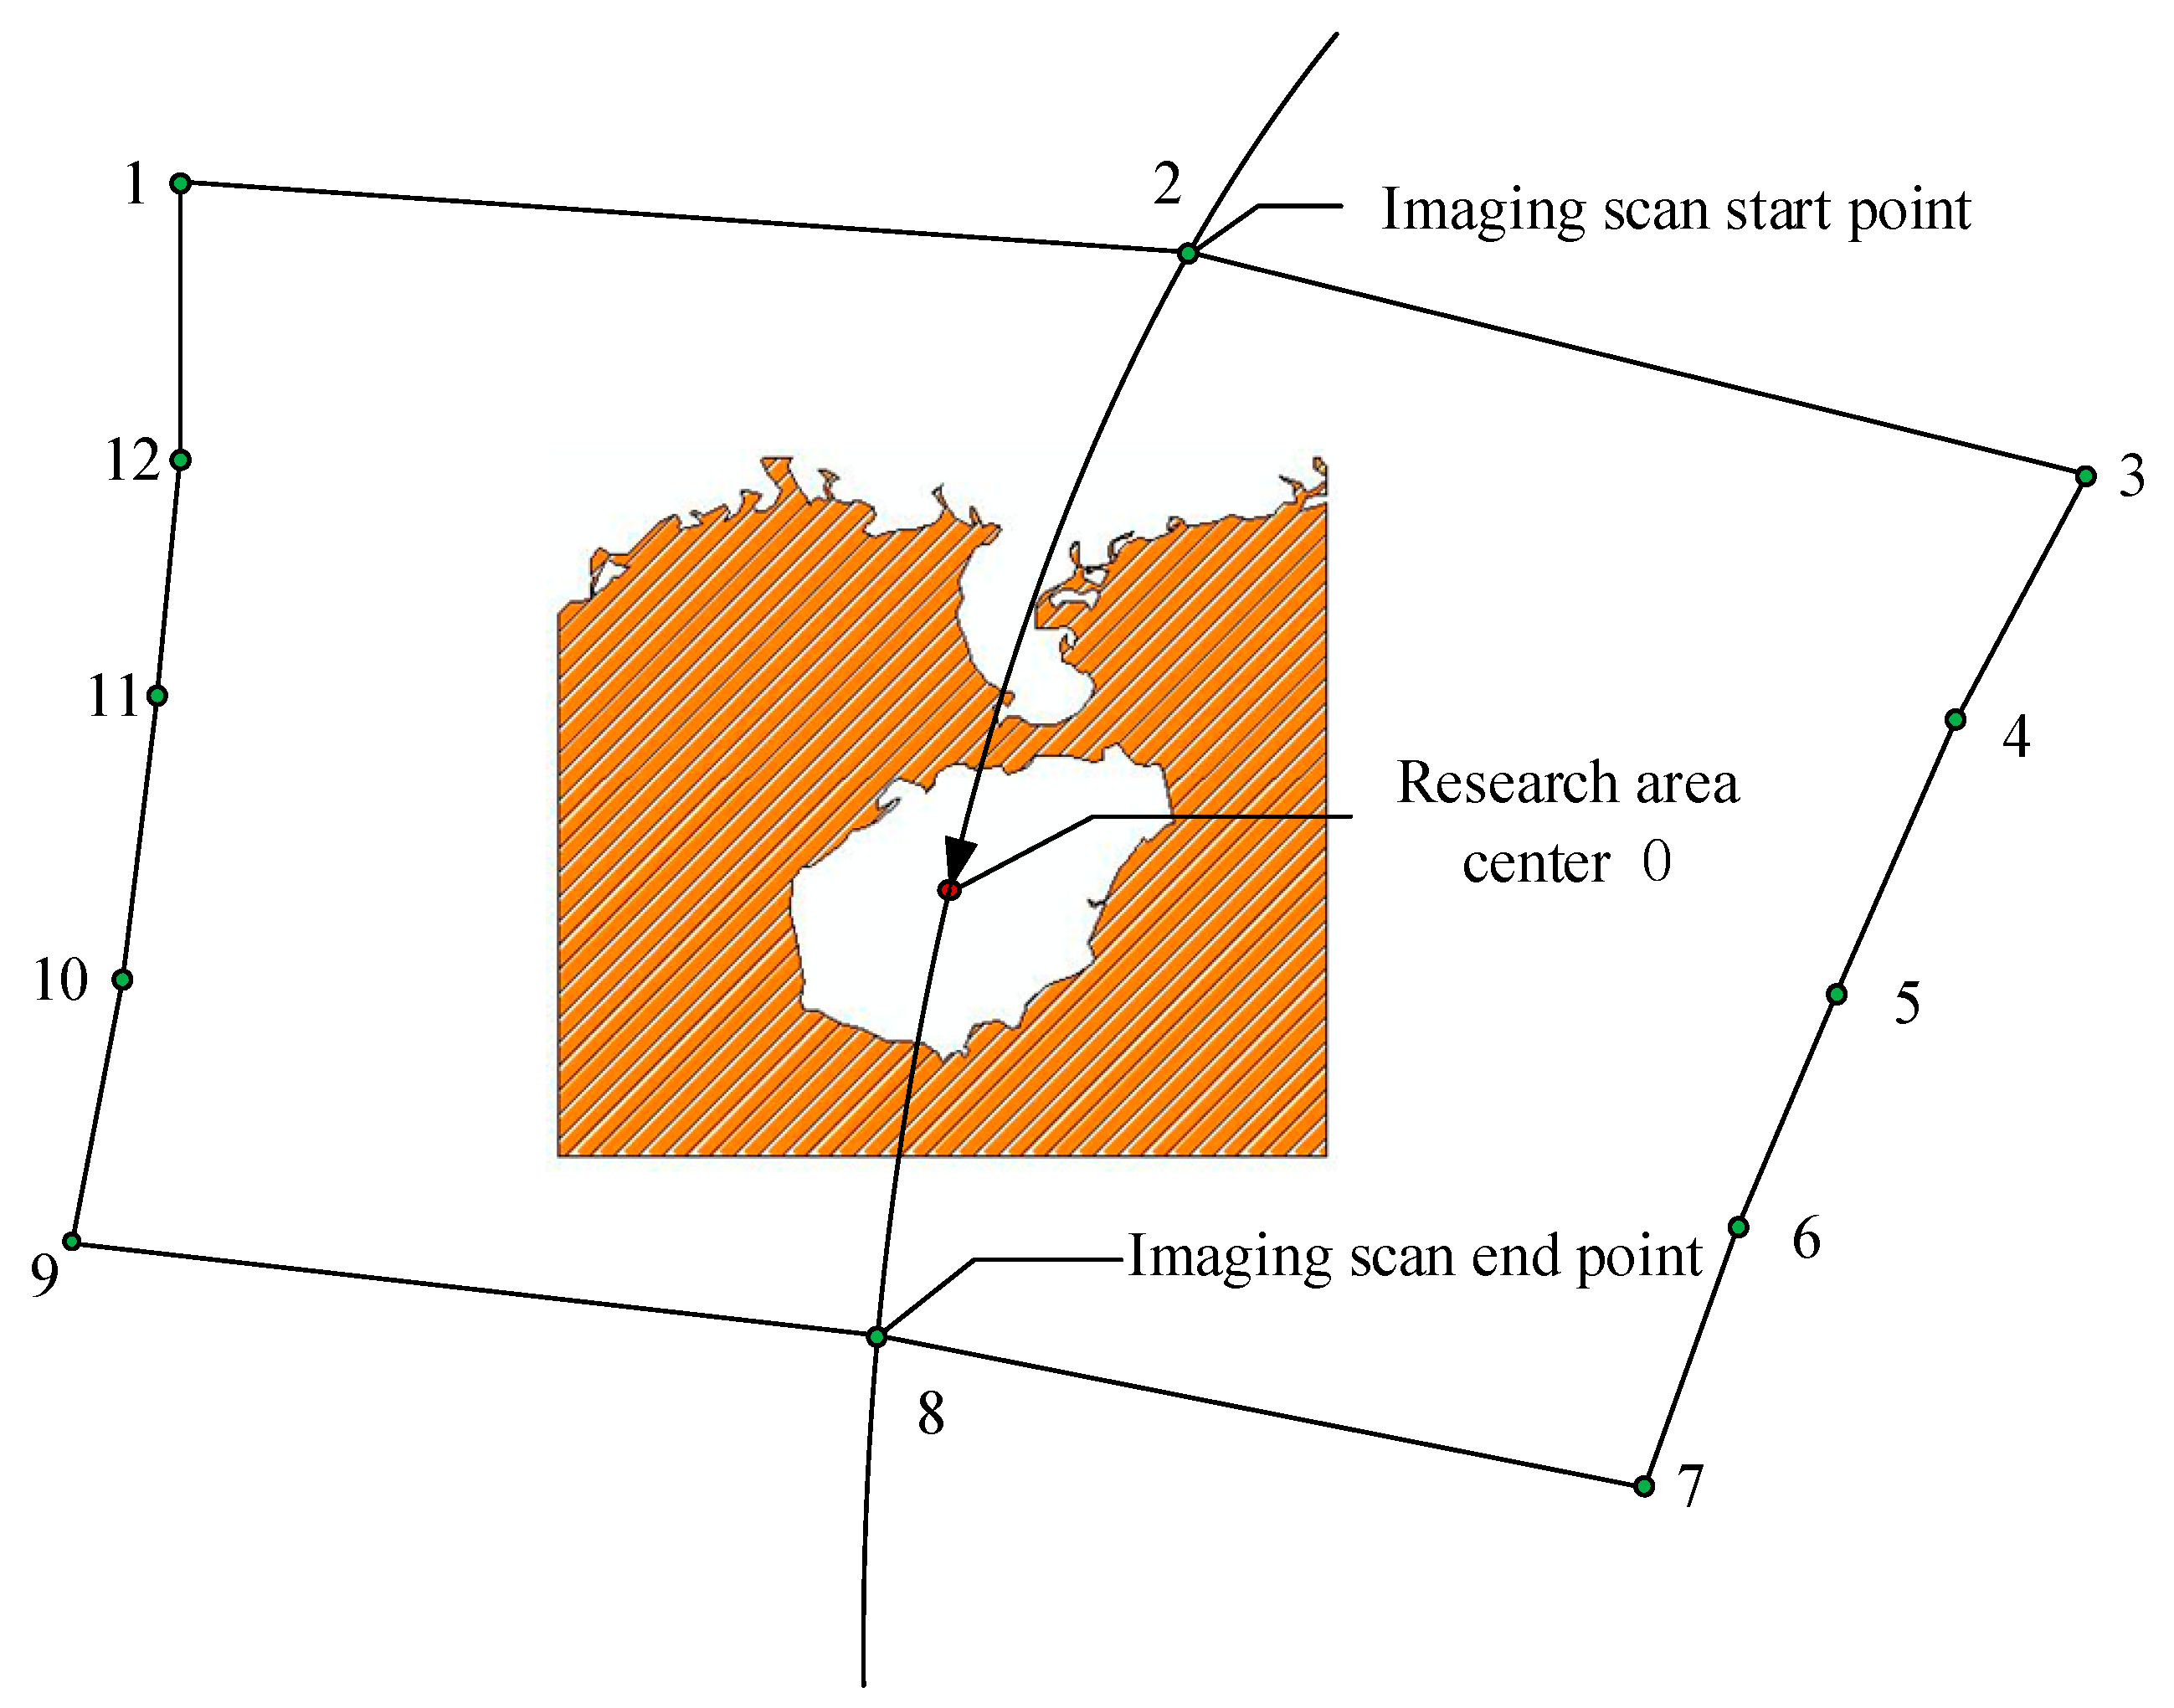
Although the present study, compared with existing studies, provides certain innovations, there also existed some limitations as discussed above. Therefore, future research should focus on the following: (1) The external factors influencing fishing intensity in marine fisheries (i.e., marine environmental factors and policy measures, as well as further discussion and analysis of the relationships between external conditions). (2) As the study area was small and the latitude span was not large, the linear interpolation method was adopted to obtain the time information regarding when the satellite data passed through the central area of the research area. When the latitude span of the study area is large, a strict satellite orbit data model should be used to accurately and efficiently obtain the transit time of satellites at different latitudes. (3) In future research, AIS static attribute data should be used to reflect the premise of situation, then matched with VBD data to effectively construct reflected radiation intensity mapping of Marine fishing intensity, where the AIS data can reflect the transformation model between ship maneuvering and size. In this way, integration can be realized in a true sense, in order to achieve the purpose of fusion fishing intensity data to obtain higher precision, and it will also better support the 2030 agenda for Suatainable Development [50].

Author Contributions

Data curation, Xiaoen Li; Formal analysis, Fenzhen Su; Methodology, Xiaoen Li; Resources, Fenzhen Su; Supervision, Liang Zhou and Wenzhou Wu; Visualization, Xiaoen Li; Writing—original draft, Xiaoen Li; Writing—review and editing, Yang Xiao; Fungding support, Fenzhen Su. All authors have read and agreed to the published version of the manuscript.

Funding

Science and Technology Basic Resources Investigation Program of China (Grant No. 2017FY201401); National Natural Science Foundation of China (Grant No.41890854, 41961027); Strategic Priority Research Program of the Chinese Academy of Sciences (A class) (Grant No.XDA19060304); Lanzhou Jiaotong University Excellent Platform (LZJTU EP), (Grant No. 201806).

Institutional Review Board Statement

Not applicable.

Informed Consent Statement

Not applicable.

Data Availability Statement

Data sharing not applicable.

Acknowledgments

This work supported by the Science and Technology Basic Resources Investigation Program of China (Grant No. 2017FY201401), National Natural Science Foundation of China (No.41890854, 41961027), Strategic Priority Research Program of the Chinese Academy of Sciences(A class) (Grant No.XDA19060304), Lanzhou Jiaotong University Excellent Platform (LZJTU EP) (Grant No. 201806) and the free VBD data providers (Agency for International Development, the NOAA Joint Polar Satellite System (JPSS) proving ground program, and World Bank).

Conflicts of Interest

The authors declare no conflict of interest.

References

  1. Qiu, Y.S. Evaluation of Sustainability of Fisheries Resources for South China Sea Based on the AHP. J. Nat. Resour. 2010, 25, 249–257. [Google Scholar]
  2. Chuaysi, B.; Kiattisin, S. Fishing Vessels Behavior Identification for Combating IUU Fishing: Enable Traceability at Sea. Wirel. Pers. Commun. 2020, 115, 2971–2993. [Google Scholar] [CrossRef]
  3. Cabral, R.B.; Mayorga, J.; Clemence, M.; Lynham, J.; Koeshendrajana, S.; Muawanah, U.; Nugroho, D.; Anna, Z.; Ghofar, A.; Zulbainarni, N.; et al. Rapid and lasting gains from solving illegal fishing. Nat. Ecol. Evol. 2018, 2, 650–658. [Google Scholar] [CrossRef] [PubMed]
  4. Tickler, D.; Meeuwig, J.J.; Palomares, M.-L.; Pauly, D.; Zeller, D. Far from home: Distance patterns of global fishing fleets. Sci. Adv. 2018, 4, eaar3279. [Google Scholar] [CrossRef] [PubMed] [Green Version]
  5. Melnychuk, M.C.; Kurota, H.; Mace, P.M.; Pons, M.; Minto, C.; Osio, G.C.; Jensen, O.P.; de Moor, C.L.; Parma, A.M.; Richard Little, L.; et al. Identifying management actions that promote sustainable fisheries. Nat. Sustain. 2021. [Google Scholar] [CrossRef]
  6. Costello, C.; Ovando, D. Status, Institutions, and Prospects for Global Capture Fisheries. Annu. Rev. Environ. Resour. 2019, 44, 24. [Google Scholar] [CrossRef]
  7. Rowlands, G.; Brown, J.; Soule, B.; Boluda, P.T.; Rogers, A.D. Satellite surveillance of fishing vessel activity in the Ascension Island Exclusive Economic Zone and Marine Protected Area. Mar. Policy 2019, 101, 39–50. [Google Scholar] [CrossRef]
  8. Pei, T.; Liu, Y.; Guo, S.; Shu, H.; Du, Y.; Ma, T.; Chenghu, Z. Principle of big geodata mining. Acta Geogr. Sin. 2019, 74, 586–598. [Google Scholar]
  9. McCluskey, S.M.; Lewison, R.L. Quantifying fishing effort: A synthesis of current methods and their applications. Fish Fish. 2008, 9, 188–200. [Google Scholar] [CrossRef]
  10. Rudd, M.B.; Branch, T.A. Does unreported catch lead to overfishing? Fish Fish. 2017, 18, 313–323. [Google Scholar] [CrossRef]
  11. Stasolla, M.; Greidanus, H. The exploitation of Sentinel-1 images for vessel size estimation. Remote Sens. Lett. 2016, 7, 1219–1228. [Google Scholar] [CrossRef] [Green Version]
  12. Chen, G.; Liu, Y.; Tian, H.; Ye, Z.; Yu, H.; Li, J.; Tian, Y. Dynamic analysis of night fishing vessels in the Yellow Sea based on VIIRS-DNB data. J. Fish. China 2020, 44, 1036–1045. [Google Scholar]
  13. Natale, F.; Gibin, M.; Alessandrini, A.; Vespe, M.; Paulrud, A. Mapping Fishing Effort through AIS Data. PLoS ONE 2015, 10, e0130746. [Google Scholar] [CrossRef] [PubMed] [Green Version]
  14. Guiet, J.; Galbraith, E.; Kroodsma, D.; Worm, B. Seasonal variability in global industrial fishing effort. PLoS ONE 2019, 14, e0216819. [Google Scholar] [CrossRef] [PubMed]
  15. Kroodsma, D.A.; Mayorga, J.; Hochberg, T.; Miller, N.A.; Boerder, K.; Ferretti, F.; Wilson, A.; Bergman, B.; White, T.D.; Block, B.A.; et al. Tracking the global footprint of fisheries. Science 2018, 359, 904–908. [Google Scholar] [CrossRef] [PubMed] [Green Version]
  16. Miller, N.A.; Roan, A.; Hochberg, T.; Amos, J.; Kroodsma, D.A. Identifying Global Patterns of Transshipment Behavior. Front. Mar. Sci. 2018, 5, 240. [Google Scholar] [CrossRef] [Green Version]
  17. Boerder, K.; Miller, N.A.; Worm, B. Global hot spots of transshipment of fish catch at sea. Sci. Adv. 2018, 4, eaat7159. [Google Scholar] [CrossRef] [Green Version]
  18. Levin, N.; Kyba, C.C.M.; Zhang, Q.; Sánchez de Miguel, A.; Román, M.O.; Li, X.; Portnov, B.A.; Molthan, A.L.; Jechow, A.; Miller, S.D.; et al. Remote sensing of night lights: A review and an outlook for the future. Remote Sens. Environ. 2020, 237, 111443. [Google Scholar] [CrossRef]
  19. Liu, Y.; Saitoh, S.-I.; Hirawake, T. Detection of Squid and Pacific Saury fishing vessels around Japan using VIIRS Day/Night Band image. Proc. Asia Pac. Adv. Netw. 2015, 39, 28. [Google Scholar] [CrossRef]
  20. Li, D.; Li, X. An Overview on Data Mining of Nighttime Light Remote Sensing. Acta Geod. Cartogr. Sin. 2015, 44, 591–601. [Google Scholar]
  21. Cozzolino, E.; Lasta, C.A. Use of VIIRS DNB satellite images to detect jigger ships involved in the Illex argentinus fishery. Remote Sens. Appl. Soc. Environ. 2016, 4, 167–178. [Google Scholar] [CrossRef]
  22. Zhao, M.; Zhou, Y.; Li, X.; Cao, W.; He, C.; Yu, B.; Li, X.; Elvidge, C.D.; Cheng, W.; Zhou, C. Applications of Satellite Remote Sensing of Nighttime Light Observations: Advances, Challenges, and Perspectives. Remote Sens. 2019, 11, 1971. [Google Scholar] [CrossRef] [Green Version]
  23. Elvidge, C.D.; Zhizhin, M.; Baugh, K.; Hsu, F.-C. Automatic Boat Identification System for VIIRS Low Light Imaging Data. Remote Sens. 2015, 7, 3020–3036. [Google Scholar] [CrossRef] [Green Version]
  24. Tian, H.; Yang, L.; Yongjun, T.; Shigang, L.; Luxin, Y.; Guanyu, C.; Jianchao, L.; Yuan, L.; Longshan, L. Detection of Pacific saury (Cololabis) fishing boats in the Northwest Pacific using satellite nighttime imaging data. J. Fish. China 2019, 43, 2359–2371. [Google Scholar]
  25. Zhang, S.Y. Study on Fishing Dynamics in the South China Sea based on Nighttime Light Data. Master’s Thesis, Nanjing University, Nanjing, China, 2017. [Google Scholar]
  26. Geronimo, R.C.; Franklin, E.C.; Brainard, R.E.; Elvidge, C.D.; Santos, M.D.; Venegas, R.; Mora, C. Mapping Fishing Activities and Suitable Fishing Grounds Using Nighttime Satellite Images and Maximum Entropy Modelling. Remote Sens. 2018, 10, 1604. [Google Scholar] [CrossRef] [Green Version]
  27. Elvidge, C.D.; Ghosh, T.; Baugh, K.; Zhizhin, M.; Hsu, F.-C.; Katada, N.S.; Penalosa, W.; Hung, B.Q. Rating the effectiveness of fishery closures with visible infrared imaging radiometer suite boat detection data. Front. Mar. Sci. 2018, 5, 132. [Google Scholar] [CrossRef]
  28. Li, J.; Cai, Y.; Zhang, P.; Zhang, Q.; Jing, Z.; Wu, Q.; Qiu, Y.; Ma, S.; Chen, Z. Satellite observation of a newly developed light-fishing “hotspot” in the open South China Sea. Remote Sens. Environ. 2021, 256, 112312. [Google Scholar] [CrossRef]
  29. Longepe, N.; Hajduch, G.; Ardianto, R.; Joux, R.; Nhunfat, B.; Marzuki, M.I.; Fablet, R.; Hermawan, I.; Germain, O.; Subki, B.A.; et al. Completing fishing monitoring with spaceborne Vessel Detection System (VDS) and Automatic Identification System (AIS) to assess illegal fishing in Indonesia. Mar. Pollut. Bull. 2018, 131 Pt B, 33–39. [Google Scholar] [CrossRef]
  30. Hsu, F.-C.; Elvidge, C.D.; Baugh, K.; Zhizhin, M.; Ghosh, T.; Kroodsma, D.; Susanto, A.; Budy, W.; Riyanto, M.; Nurzeha, R.; et al. Cross-Matching VIIRS Boat Detections with Vessel Monitoring System Tracks in Indonesia. Remote Sens. 2019, 11, 995. [Google Scholar] [CrossRef] [Green Version]
  31. Kurekin, A.A.; Loveday, B.R.; Clements, O.; Quartly, G.D.; Miller, P.I.; Wiafe, G.; Adu Agyekum, K. Operational Monitoring of Illegal Fishing in Ghana through Exploitation of Satellite Earth Observation and AIS Data. Remote Sens. 2019, 11, 293. [Google Scholar] [CrossRef] [Green Version]
  32. Ruiz, J.; Caballero, I.; Navarro, G. Sensing the Same Fishing Fleet with AIS and VIIRS: A Seven-Year Assessment of Squid Jiggers in FAO Major Fishing Area 41. Remote Sens. 2020, 12, 32. [Google Scholar] [CrossRef] [Green Version]
  33. Park, J.; Lee, J.; Seto, K.; Hochberg, T.; Wong, B.A.; Miller, N.A.; Takasaki, K.; Kubota, H.; Oozeki, Y.; Doshi, S.; et al. Illuminating dark fishing fleets in North Korea. Sci. Adv. 2020, 6, eabb1197. [Google Scholar] [CrossRef] [PubMed]
  34. Exeter, O.M.; Htut, T.; Kerry, C.R.; Kyi, M.M.; Mizrahi, M.I.; Turner, R.A.; Witt, M.J.; Bicknell, A.W.J. Shining Light on Data-Poor Coastal Fisheries. Front. Mar. Sci. 2021, 7, 625766. [Google Scholar] [CrossRef]
  35. Greig, N.C.; Hines, E.M.; Cope, S.; Liu, X. Using Satellite AIS to Analyze Vessel Speeds Off the Coast of Washington State, U.S., as a Risk Analysis for Cetacean-Vessel Collisions. Front. Mar. Sci. 2020, 7, 109. [Google Scholar] [CrossRef]
  36. Qiu, Y.S.; Zeng, X.G.; Chen, T.Y.; Wang, Z.; Yuan, W.W. Fishery Resources and Fishery Management in the South China Sea; Ocean Press: Beijing, China, 2008; pp. 1–45. [Google Scholar]
  37. Zhang, J.; Su, F.; Wang, W. A review of geographical information research on resources and environment of the South China Sea region. Prog. Geogr. 2018, 37, 1443–4153. [Google Scholar]
  38. Wang, H.; Du, Y.; Sun, Y.; Liang, F.; Yi, J.; Wang, N. Clustering Complex Trajectories Based on Topologic Similarity and Spatial Proximity: A Case Study of the Mesoscale Ocean Eddies in the South China Sea. ISPRS Int. J. Geo Inf. 2019, 8, 574. [Google Scholar] [CrossRef] [Green Version]
  39. Svanberg, M.; Santén, V.; Hörteborn, A.; Holm, H.; Finnsgård, C. AIS in maritime research. Mar. Policy 2019, 106, 103520. [Google Scholar] [CrossRef]
  40. Mou, N.; Ren, H.; Zheng, Y.; Chen, J.; Niu, J.; Yang, T.; Zhang, L.; Liu, F. Traffic Inequality and Relations in Maritime Silk Road: A Network Flow Analysis. ISPRS Int. J. Geo Inf. 2021, 10, 40. [Google Scholar] [CrossRef]
  41. Hintzen, N.T.; Piet, G.J.; Brunel, T. Improved estimation of trawling tracks using cubic Hermite spline interpolation of position registration data. Fish. Res. 2010, 101, 8. [Google Scholar] [CrossRef]
  42. Zhou, P.; Chen, J.; Lin, Q.; Mei, Q.; Huang, P. Research on Trajectory Interpolation Method Based on AIS. J. Jimei Univ. 2015, 23, 443–447. [Google Scholar]
  43. Ester, M.; Kriegel, H.-P.; Sander, J.; Xu, X. A density-based algorithm for discovering clusters in large spatial databases with noise. In Kdd; Association for the Advancement of Artificial Intelligence: Menlo Park, CA, USA, 1996; pp. 226–231. [Google Scholar]
  44. Terrell, G.R.; Scott, D.W. Variable kernel density estimation. Ann. Stat. 1992, 20, 1236–1265. [Google Scholar] [CrossRef]
  45. Xie, Z.; Yan, J. Kernel density estimation of traffic accidents in a network space. Comput. Environ. Urban Syst. 2008, 32, 396–406. [Google Scholar] [CrossRef] [Green Version]
  46. Kopp, T.J.; Thomas, W.; Heidinger, A.K.; Botambekov, D.; Frey, R.A.; Hutchison, K.D.; Iisager, B.D.; Brueske, K.; Reed, B. The VIIRS Cloud Mask: Progress in the first year of S-NPP toward a common cloud detection scheme. J. Geophys. Res. Atmos. 2014, 119, 2441–2456. [Google Scholar] [CrossRef]
  47. Rodger, M.; Guida, R. Classification-Aided SAR and AIS Data Fusion for Space-Based Maritime Surveillance. Remote Sens. 2021, 13, 104. [Google Scholar] [CrossRef]
  48. Harati-Mokhtari, A.; Wall, A.; Brooks, P.; Wang, J. Automatic Identification System (AIS): Data Reliability and Human Error Implications. J. Navig. 2007, 60, 17. [Google Scholar] [CrossRef]
  49. Russo, T.; D’Andrea, L.; Parisi, A.; Martinelli, M.; Belardinelli, A.; Boccoli, F.; Cignini, I.; Tordoni, M.; Cataudella, S. Assessing the fishing footprint using data integrated from different tracking devices: Issues and opportunities. Ecol. Indic. 2016, 69, 818–827. [Google Scholar] [CrossRef]
  50. Li, Z.; Gong, X.; Chen, J.; Jon, M.; Li, S.; Xu, Z.; Wu, H. Functional Requirements of Systems for Visualization of Sustainable Development Goal (SDG) Indicators. J. Geovis Spat Anal. 2020, 4, 5. [Google Scholar]
Figure 1. Map of the study area.
Ijgi 10 00277 g001
Figure 2. A flow chart of the data processing and analysis.
Ijgi 10 00277 g002
Figure 3. Suomi NPP Satellite Transit Research Centre is calculated at all times.
Ijgi 10 00277 g003
Figure 4. A proximity analysis match based on point distance.
Ijgi 10 00277 g004
Figure 5. The AIS-based typical seasonal fishing intensity in the northern South China Sea in 2018. (Note: For the convenience of expression, visualization, and analysis, the raster data obtained from point density analysis were uniformly normalized and rendered in equal-interval layering. Figure 6 and Figure 7 were processed in the same way).
Ijgi 10 00277 g005
Figure 6. The typical seasonal fishing intensity in the northern South China Sea based on VBD.
Ijgi 10 00277 g006
Figure 7. The typical seasonal fishing intensity in the northern South China Sea in 2018, fusion for VBD and AIS.
Ijgi 10 00277 g007
Figure 8. Statistical comparative analysis of fishery fishing intensity maps with multi-source data during the typical season in the northern South China Sea in 2018.
Ijgi 10 00277 g008
Table 1. Attributes provides by VIIRS boat detections (VBD) used in this study.
NameExplanationUnits
ID_keyUnique VBD IDUnitless
Lat_DNBVBD pixel latitude from VIIRS geolocation fileDegrees
Lon_DNBVBD pixel longitude from VIIRS geolocation fileDegrees
Data_MscanVBD pixel date-time at mid-scan reported in Universal Time.Unitless
Rad_DNBRadiance of VBD pixel in VIIRS DNB bandW/m2/sr/um
QF_DetectInteger quality flag for VBD pixel, yielding information about quality and detection type (see field description tab).Unitless
File_DNBVIIRS DNB HDF5 fileUnitless
File_LTZ Local time zone reference file containing vectors used to determine offset from UTC to LTZ.Unitless
Lat_Gring Latitude values as a series of semi-colon separated points that enclose the DNB swath data when connected by great-circle arcs.Degrees
Lon_Gring Longitude values as a series of semi-colon separated points that enclose the DNB swath data when connected by great-circle arcs.Degrees
(Note: The above-mentioned content is from https://eogdata.mines.edu/vbd/#csv- (accessed on 27 April 2021) column, this paper uses the data QF_Detect = 1, 2).
Publisher’s Note: MDPI stays neutral with regard to jurisdictional claims in published maps and institutional affiliations.

