Abstract
Improving the urban livability status has become the core goal of urban development, and reasonable assessment of the urban livability status and impact is crucial. By combining an objective environment with residents’ subjective cognition, an artificial society (urban livability change artificial society; ULC-AS) is constructed. The ULC-AS includes four types of agents, namely, government, family, resident and safety facility management agency agents, and recognizes dynamic interaction among various agents and between agents and the environment. Taking the Futian District of Shenzhen as an example, this paper examines factors such as migrants, birth policies, and government investment. We simulate the interactions among resident satisfaction changes, relocation decision-making behavior and urban safety livability and analyze the change processes and development trends of urban safety livability under multiple scenarios. Our main result indicates that population change and investment construction are important factors affecting urban safety livability. At present, the population of the Futian District is saturated. Therefore, the government must assess the urban safety livability and increase investment in high-demand areas. Through this method, the goals of urban resource allocation optimization and coordinated urban development can be achieved.
1. Introduction
Urban livability is a hot topic in urban science research in contemporary society and a subject of close attention from the government and ordinary urban residents [1]. It affects the lives of the general public and is related to the development of the national economy, social harmony and social progress. Urban livability refers to the quality of life experienced by the residents of a city or region, including natural, social, human, and political factors as well as the aspects of safety, comfort, convenience, accessibility, and tolerance [2,3].
The formation and development of livability theories in Chinese and western cities have taken a long time, and their development process has undergone obvious stages, as shown in Figure 1 and Figure 2. Since Howard proposed the idea of a rural city in the late 19th century, the theory of livable cities in the West has received much attention and research ranging from shallow to deep. From focusing on comfort and health at the beginning to the comprehensive consideration of urban functions such as housing, work, and transportation, the theory of urban livability has gradually improved, and a clear concept was formed in 1996. Later, in North America, Europe, Australia and other countries, researchers applied the livability theory to the assessment and planning of specific livable cities and achieved practical results.
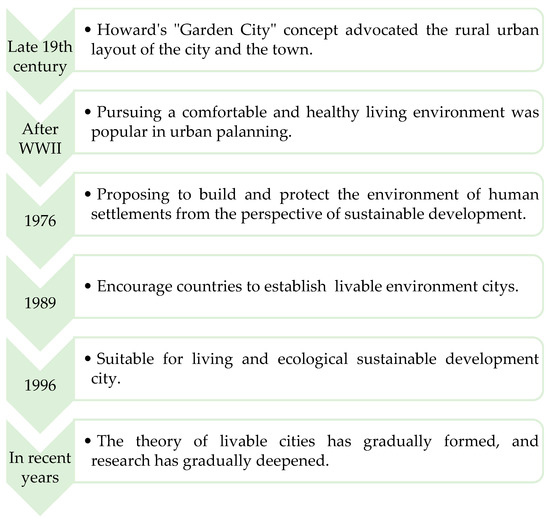
Figure 1.
Development of livability in Western Cities.
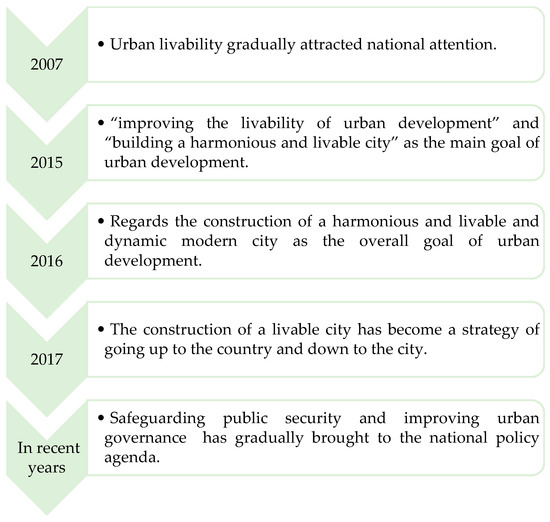
Figure 2.
Development of livability in China.
In China, the theory of urban livability began being the subject of wide concern and study relatively late. In 2007, it gradually attracted national attention. In 2016, it was clearly placed in an important position in urban planning and development. Nowadays, the construction of a livable city has become a national top-down development target. The construction of a livable city is more related to the well-being of thousands of people. Therefore, exploring the laws of livable city construction and building a city suitable for human life and residence are the main goals of urban development and the main directions of urban research.
It is generally believed that the safety of life and property is the top priority when choosing residence. Therefore, urban safety is a prerequisite for shaping urban livability. In the current study, the urban safety indicators focus on public safety, fire safety, traffic safety, emergency safety and residential safety [4]. Public security incidents include natural disasters, accident disasters, public health incidents, social security incidents, etc. [5]. Fire safety is aimed at fire incidents [6]. Traffic safety refers to people driving and walking safely on the road to avoid personal injury or property loss [7]. Emergency safety usually means that the accident occurred in an emergency situation [8]. Residential safety is directly related to people’s vital interests, including environment, diet, construction, water and electricity, etc. [9].
Urban safety livability is defined as the quality of life and well-being of a city with safety as the main factor, and its level is measured by residents’ satisfaction with safety facilities. This study uses an artificial society to analyze and predict urban safety livability by taking urban security as an example. This paper deeply analyzes and deconstructs the complex human factors and individual decision-making behavior and studies the dynamic change process of urban safety and livability under the influence of various factors by constructing the real social environment and human decision-making behavior rules. In this work, five safety indicators were used to construct and apply the urban livability change-artificial society (ULC-AS) model, taking urban residents, families, governments and safety facility management organizations as simulation objects, and analyzing the general rules and interactive behaviors of each object. This study analysis the impact of safety facility coverage and residents’ decision-making behaviors on urban safety livability and evaluates changes in urban safety livability and residents’ satisfaction to help the government make investment decisions for urban construction and promote the sustainable and healthy development of cities. This study scientifically evaluates the changes and development trends in urban safety livability under the influence of various environmental changes, different policy implementations and residents’ decision-making to provide advice and decision-making behaviors support for urban planning and construction.
2. Background
2.1. Urban Livability
Changes of urban livability are mainly affected by the interaction between the environment and human behavior. Studies of the complex adaptive behavior of humans in the environment can provide a better understanding of the process and development mechanism of urban livability. The current research on urban livability mainly includes two types of studies. The first type of research focuses on the concept and evaluation indicators of urban livability and analyzes in detail the various aspects of urban livability and the various indicators for evaluating urban livability. Sofeska and Okulicz-Kozaryn et al. analyzed and studied the livability of a city based on residents’ evaluations of the degree of urban livability in Skopje and several European cities [10,11]. Wey et al. used fuzzy Delphi methods to study expert questionnaires and select key evaluation indicators for livability in terms of transportation. The research results were applied to develop decision-making strategies for responding to the environmental dynamics of Taipei City’s transportation infrastructure system by using the analytic network process combined with a data-mining technique [12]. Saitluanga suggested that the evaluation index of urban livability includes objective and subjective dimensions. Using the data reduction method, the levels of objective and subjective dimensions of livability were measured at the neighborhood level [13]. The second type of research uses a reasonable method to evaluate a city’s livability under the influences of multiple factors to obtain the linear or non-linear relationship between the city’s livability and various factors of the city. For example, based on a large-scale questionnaire survey conducted in 40 major cities in China in 2015, Zhan et al. used geographic detector models to explore the characteristics of satisfaction with urban livability and its influencing factors [14]. Liu et al. analyzed a conceptual model of 35 large and medium cities in China from 2003 to 2012 and concluded that excessive tourism development represents a potential threat to urban livability [15]. Mesimäki et al. used green roofs as an example to gain insight into how people envisage novel geographical indications in urban environments and to reveal the scope of the meanings and values people attach to these kinds of green infrastructure to improve sustainable and livable urban environments [16]. Paul et al. divided space into clusters and performed cluster analysis to assess the changes in the livability of different regions of a city to understand the differences in livability among different regions. Khorasani et al. analyzed the relationship between the distance between urban suburban areas and urban areas and the migration rate of the area to analyze the influencing factors of livability. They all think that spatial factors on the regional scale will have an important impact on livability [17,18]. Li et al. and Yu et al. performed principal component analysis (PCA) to determine that socio-environmental factors are important factors affecting urban livability [19,20].
Changes of urban livability represent a complex system in which people and nature are coupled. Usually, natural factors and human activities closely intersect and contribute to changes in urban livability, and there are numerous non-linear relationships and complex interactions among elements in this complex system, which complicates research. In previous studies, the first type of research focused on the definition of urban livability, ignoring the impact of spatial environment changes on urban livability. Although the environmental and human factors affecting the livability of cities have been considered in the second type of research, the heterogeneity of the spatial environment and the complex decision-making behaviors of humans have been ignored or simplified. However, human factors and the complexity of residents’ decision-making behaviors are important factors that cannot be ignored and are the most difficult to analyze. The artificial society method can not only simulate all kinds of space environmental factors, but also simulate human decision-making behavior, which has unique advantages for studying the complex micro-behaviors of human beings. Therefore, using the artificial society method to study the interactions between many environmental factors of the city and the decision-making behaviors of the residents is of great significance for the study of urban livability.
2.2. Artificial Society
The artificial society method is one of the research directions of complexity science and represents a comprehensive interdisciplinary discipline that integrates multiple disciplines, such as artificial intelligence, agent technology, computer simulation, and social science [21]. It uses computer simulation as the research method and complexity science as the guiding ideology. Artificial society research uses computer technology to simulate the evolution, and movement of artificially constructed societies to explore the laws of biological and human social development [22]. In recent years, great progress has been made in researching the use of artificial social theory to solve urban problems. For example, Fernandez-Anez et al. proposed a conceptual model of a smart city and described society as a comprehensive, multi-dimensional system [23]. Hadimlioglu et al. used street map data to reconstruct the three-dimensional urban environment, simulated the flood scene for testing, so as to promote the concept of emergency management and smart city [24]. Sepasgozar et al. used survey-based methods to develop and verify the Urban Services Technology Acceptance Model (USTAM) to guide cities in selecting appropriate technologies to achieve the efficient use of urban resources [25]. Ghosh S et al. used the semi-Markov model to capture the random dynamics of earthquake events, which have great reference value in artificial social emergency management [26]. Wahyudi et al. used agent modeling method to study the influence of spatial decision-making of private land developers on urban development [27]. Maqbool et al. simulated disaster scenarios in Pakistan urban areas, designed demand and resource allocation behavior, and analyzed the application of resource allocation mechanism in disaster reduction [28].
Although previous research has provided a number of insights into the impacts of human behaviors and the natural environment on urban development, they often ignore the heterogeneity of urban spaces and consider the environment to be homogeneous and unchanged. Previous research also often greatly simplified complex human behaviors and decisions, which increases the difficulty of truly reflecting the impact of each agent’s micro-behaviors on urban development. In this paper, we propose a complete artificial society to examine the changes of urban livability, namely, the ULC-AS. The ULC-AS uses a social hierarchy framework to clearly indicate the impacts of the natural geographic environment, human social environment, and human behavioral decisions on changes in urban safety livability. The ULC-AS describes and reproduces the city’s security environment and agent behavior in detail based on real city data. This ULC-AS can also explore the impact of changes in the population, policies, and environment on agents’ decisions and changes in urban livability.
3. Study Area
In this article, we will focus on the Futian District and predict that the urban safety livability changes in this district will play an important role in shaping the future sustainable development of the city. Futian District, which is located in central Shenzhen, covers an area of 78.8 square kilometers and has a total population of more than 1.5 million people (approximately 1,501,700 in 330,000 households). It connects Hongling Road and Luohu District in the east and connects Qiaocheng East Road and Haiyuan 1st Road to the Nanshan District in the west. It faces the Shenzhen River to the south and the Mai Po in the New Territories across the river, and it borders Shenzhen Bay to the south and the Yuen Long New Territories to the south across the river. The ridges from Baiweishi, Brain Shell and Huangzhuyuan in the north are adjacent to Minzhi Street in Longhua New District, as shown in the red area of Figure 3.
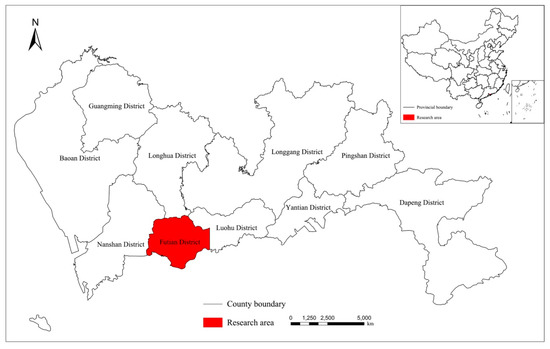
Figure 3.
Location of Futian District.
4. Methodology
The ULC-AS maps the real-world social system to a computer-simulated world and abstracts the social system at three main levels: facility level, geography level and agent level. In order to calculate the livability of different ranges, the geographical layer is divided into units, grids and streets, as shown in Figure 4.
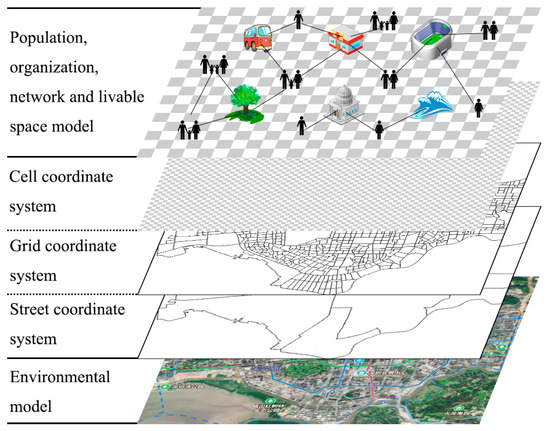
Figure 4.
Levels of the social system.
The bottom layer describes the environmental composition of an artificial society, including the coverage of security facilities, fire protection facilities, transportation facilities, emergency facilities, and residential facilities. The middle layer is the artificial social geospatial information model, which mainly establishes the cell coordinate system, the grid coordinate system and the street coordinate system for the geospatial coordinates to determine the spatial position of each agent. The street system is the township-level administrative region of mainland China, and the grid system is that of the Municipal Planning Bureau, which relies on information technology and follows relevant national, industry and local standards to implement the grid division of the entire city in improve the level and efficiency of urban management. The grid, which can promote the in-depth development and information construction of urban grid management, contains numerous cells with a size of 50 × 50 square meters each. The cell includes environmental attributes and the families and residents that live in the area. The top layer is the individual agents and organizational agents in the artificial society and the relationships among the various types of agents, and it includes various elements of livable cities.
4.1. The ULC-AS Overview
4.1.1. Architecture
The ULC-AS architecture has four parts: preprocessing, model initialization, artificial society, and data management, as shown in Figure 5. The preprocessing portion contains two parts, the agent model and the initial data processing, thus providing operational agents for the model initialization and multidimensional data information. The model initialization part includes the initial configuration of the agent and the loading of the space environment. The content of the initial configuration of the agent includes the attributes, behavior, type, quantity, order and relationship of the agent. The main function of the space environment loading is to import the processed data into the model as the operating environment of the agent. The artificial society part includes the agent, space environment and model control unit. The agent and space environment are the basic components of the artificial society. The function of the model control unit is to control the normal operation of the system, including agent scheduling, clock control, environmental control, state control, I/O (input/output) control, parameter control and scenario simulation. The data management part can extract data, perform a statistical analysis and provide a visual display of a large number of dynamically changing map data, population data and key parameters. The latest data are used as a variable in the next run of the model and are the basis for information feedback and adjustment in the artificial society. The above four parts form a complete ULC-AS architecture.
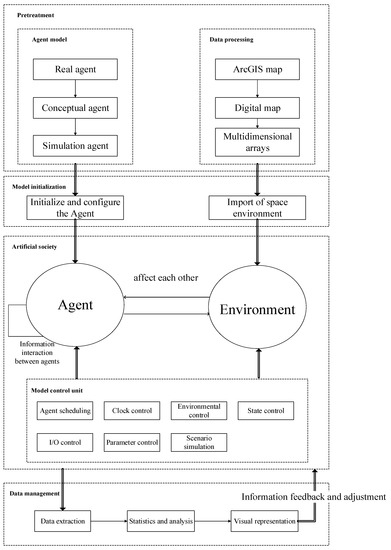
Figure 5.
Model architecture.
The core of the ULC-AS is the information interaction between agents and the interaction between agents and the environment. Different types of agents and different individual agents are linked by information transfer and through their respective operational rules, thus realizing the decision-making behavior and interaction of the agent. The interaction between the agent and space environment is not only the driving factor for changes in urban livability and residents’ satisfaction but is also the result of these changes. The information obtained by the agent provides a reference for its decision-making, which affects the livability level of the corresponding location, and the change in the livability level of the corresponding location affects the resident satisfaction of the agent in the next round. In this way, the interaction between agents and the interaction between the agents and the space environment constitute a complex space-time evolution system. The regularity that the system exhibits during its evolution is a true reflection of the evolution of the simulated objects.
4.1.2. Model Processes
The operational rules for the ULC-AS are designed as follows. (1) Different geographical locations show different security livability levels due to differences in their resource environments and building types and scales. (2) Residents have different safety preference indicators (one or more of the five safety indicators) due to different age levels, resulting in heterogeneity of their satisfaction. (3) Resident satisfaction is interactively affected by the satisfaction of surrounding residents due to psychological factors. (4) Family satisfaction, which is the satisfaction of the head of the family, is an important basis for family decisions. Within a certain range, if family satisfaction is high, a family’s willingness to relocate is lower. (5) The dynamic changes in the population density in different geographical locations caused by family relocation, in turn, acts on the environment. The model is based on the above rules to produce a multifactor-affected urban safety livability change system over time.
The ULC-AS operational process is calculated and updated in units of years, as shown in Figure 6.
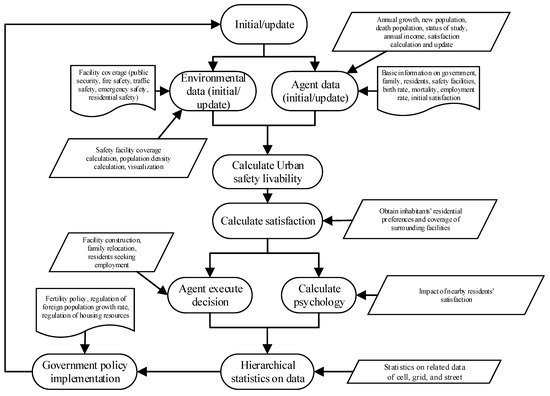
Figure 6.
Model calculation process.
First, the environment and agent data are initialized. The environmental data initialization includes the introduction of the coverage of various safety facilities and the building coverage. When the data are updated, the safety facility coverage calculation, population density calculation and building coverage calculation are performed and visualized. The agent data initialization includes basic information on the government, families, residents, and safety facility management agencies as well as the birth rate, mortality rate, employment rate, unemployment rate, initial satisfaction, and vacant resources. When updating the data, the annual growth, new population, number of deaths, educational status, annual income, and satisfaction calculation must be considered. Then, based on the weights of the safety facilities obtained through the survey and the coverage rates of the various safety facilities, the livability calculation is carried out. Next, the residents’ satisfaction is calculated based on their preferences and surrounding facilities coverage, and then the decision-making behavior and psychological calculations of the residents and family agents are carried out. The agent decision-making behaviors include facility construction, family relocation, residents seeking employment, and psychological factors to consider the impact of nearby residents’ satisfaction. Finally, statistics and government policies are established. The statistics include cell, grid, and street data statistics, printing and preservation. Government policies include birth policies, immigrant population growth rates and investment intensity regulations, and then, the cycle is repeated.
4.1.3. Agent
In this model, the four types of agents are government agents, family agents, resident agents, and security facility management agency agents. The government agent represents the highest administrative unit in the study area and can issue the relevant policies for urban planning so that the safety facility management agency can invest in the construction of various facilities. Family agents take the family as a unit, and family members include spouses, parents, children and other relatives living together. The resident agent is an individual, and many resident agents with marriage and blood relationship form a family agent. The safety facility management agency agent represents the unit that collects statistics and manages various safety facilities in the environment.
4.1.4. Agent Attributes and Activities
The attributes of the government agent include the government name, government location and administrative area. The government’s activities are mainly policy adjustments and releases, including the assessment and statistics of the livability of each grid and the satisfaction of all households. The government then issues policies based on statistical results, which are passed on to households, residents, and safety facility management agencies.
The attributes of the family agent include the family ID (unique), the grid number of the family residence, and the family member structure, income, expenses, deposits, satisfaction, and residence preferences (as determined by the head of the family). Family activities include weddings and funerals, raising children, relocation, and family member satisfaction information. These activities are reflected in increases and decreases in family members, changes in education levels, changes in family deposits, changes in family residence and changes in family satisfaction.
The attributes of the resident agent include the resident ID (unique), family ID, age, gender, marital status, educational background (junior high school and below, senior high school and bachelor’s degree), employment status (dependent children, income workers, unemployed people, and retired people), income and residence preferences. Resident agent activities include learning, production, consumption, and satisfaction information. During the period of schooling, the resident agent is a dependent child and needs the family to provide learning fees. Resident agents will have their own income when working and will constantly seek higher wages. A resident will constantly seek jobs that are suitable for them during periods of no work, and a resident will have a pension during their old age that will be part of their family income.
The attributes of the safety facility management agency agent include the grid number of the organization and the types of facilities to be managed (public security facilities, fire protection facilities, transportation facilities, emergency facilities, and residential facilities). The safety facility management organization is the safety facility manager in the urban social system. Its activities are mainly to build, improve or dismantle safety facilities (police stations, hospitals, fire stations, traffic kiosks, police offices, emergency shelters, squares, houses, green spaces, schools, commercial centers, etc.) in the area under its jurisdiction according to policies issued by the government.
4.1.5. Agent Decision Parameters
This model takes safety as an example. The city’s safety livability level and residents’ satisfaction with the urban safety conditions are key parameters. To more clearly describe the calculation of these two key parameters, we refer to safety livability and safety satisfaction. Safety livability includes the cell safety livability, grid safety livability, and street safety livability, whereas safety satisfaction includes the resident safety satisfaction, family safety satisfaction, cell safety satisfaction, grid safety satisfaction, and street safety satisfaction. The specific introduction and formula are as follows:
(1) Safety Livability
The infrastructure distribution data in the model are provided by the urban construction management department of Futian District, Shenzhen. The distribution map of the infrastructure is shown in Figure 7.
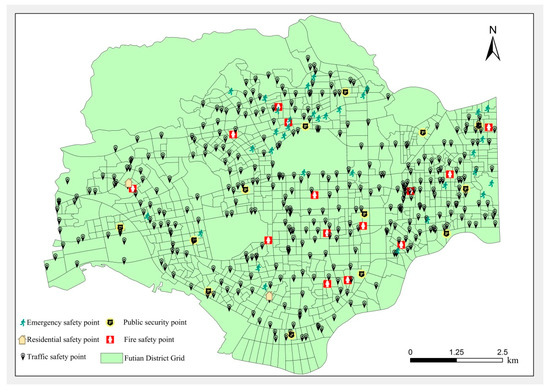
Figure 7.
Infrastructure distribution.
The coverage of each safety indicator is calculated based on the real safety facilities distributed in the geospatial space of Futian District. Centered on the location of a safety facility, the 500-m buffer zone is the scope of the facility, and the real-world security facilities are converted into quantitative coverage data using the geographic information processing software ArcGIS [29]. The safety indicator coverage is calculated in grids. The specific design rules are shown in Formula (1).
where is the initial grid security indicator coverage, is the area of the buffer formed by the facility included in the safety indicator in the grid and is the total area of the grid.
Through the above calculation method, the coverage of each safety indicator of the 887 grids in Futian District is calculated, and the current safety index distribution map of Futian District is obtained and shown in Figure 8a–e. The safety facilities considered in the safety indicator distribution map cover 13 medium-sized and above police stations, 10 large-scale fire stations, and many security facilities such as traffic booths, police rooms, emergency shelters, and plazas.

Figure 8.
Safety indicator distribution.
The population density affects the level of resources in an environment and the local facilities. If the population is large, there will be fewer per capita resources. Therefore, the population density is negatively correlated with the evaluation indicators. In this model, safety liability assessment indicators (traffic safety, emergency safety, and residential safety) will change dynamically over time based on the population density. The specific design rules are shown in Formula (2).
where and are the populations of the previous year and the current year (including the resident population and the floating population), is the indicator value for the previous year and is the number of types of safety facilities.
According to the relationships among the cell, grid and street, three layers of safety livability are defined: cell safety livability, , grid safety livability, and street safety livability, . The cell safety livability is calculated by the weighted average of the coverage ratios of the indicators, the grid safety livability is the average of the cell safety livability of all the cells in a grid, and the street safety livability is the average of the grid safety livability of all the grids on a street. The specific calculations are shown in Formulas (3)–(5).
where is the weight of , is the number of the type of safety facility and 1 ≤ ≤ 5, has a cumulative sum of 1, is the number of cells and grids and , , and represent the cell, grid, and street numbers, respectively.
(2) Satisfaction
The calculation of the resident agent’s safety satisfaction is related to two variables. The first variable is the satisfaction degree of the resident agent with the security environment of his location according to his preferences. The second variable is the bias caused by the resident agent’s psychological factors, which are affected by the high or low safety satisfaction of surrounding residents. This paper defines these two variables as not considering the agent interaction satisfaction and considering the agent interaction satisfaction .
where is calculated according to the personal safety preferences and the surrounding environment. The first item is the satisfaction of residents based on their own preferences, and the second item is the change in satisfaction caused by the residents’ influence on the surrounding environment (the average of the preferences of the residents of the eight cells around them). In this paper, the preference of the resident agent in the artificial society is initialized based on the real data obtained by sampling from multiple distributions, thereby ensuring the authenticity of the artificial society.
where is the weight of the family preference indicators; is the number of residents’ preference indicators, 0 ≤ ≤ 5; has a cumulative sum of 1; is an array of preference indicators of the family, the calculation method is shown in Formula (2); is the number of indicators for family preference, with 0 ≤ ≤ 5; and is the mean of the type preference for the eight grids in the Moore neighborhood centered on the grid of the family (types are security, fire, traffic, emergency, and residence).
For , the level of resident satisfaction among the surrounding residents affects the satisfaction of the resident, such that it increases or decreases. The specific performance is as follows: the bottom layer will decrease, the middle level will remain unchanged and the high level will decrease. The specific change probability and range of each case is shown in Formula (8).
Family preferences are generally determined by special groups in the family, such as the elderly and children [30]. Therefore, these special groups are used as the decision makers of family preferences and defined as the head of the household. If there is no special group in the family, a family member is randomly determined as the head of the household. The family safety satisfaction , which is determined by the head of household, is the satisfaction of the head of the household. In order to calculate the satisfaction of different geospatial levels, this paper also defines the cell, grid and street safety satisfaction according to a geospatial hierarchy. From the family to the cell, from the cell to the grid, from the grid to the street, the error of the statistical results is minimized through layer by layer calculation. The cell safety satisfaction is the average family safety satisfaction of all families in the cell. Grid safety satisfaction is the average of all cell safety satisfaction levels within the grid. Street safety satisfaction is the average of all grid safety satisfaction levels on the street. The specific formulas are shown as Formulas (9)–(11).
where is the number of cells and grids and , , , and represent the family, cell, grid, and street number , respectively.
4.1.6. Agent Decision and Interaction
The most important feature of the agent in the artificial society is its ability to make decisions independently; that is, it can independently generate corresponding actions according to the environmental conditions without external guidance. In the model, the government agent selects the place that needs the most help for investment construction. The family agent chooses to live in the best place in terms of the living conditions according to its own conditions. The resident agents seek the highest wages that their ability can merit. The security facility management agency agent selects the optimal location to construct, expand and dismantle the facility.
(1) Government agent
At the end of each year, the government agent obtains information on the urban safety livability of each layer, sorts it according to the corresponding level and identifies the grid with the lowest security and satisfaction. Then, the government agent identifies the lowest coverage security indicator in the grid with the lowest security livability and transmits the information to the security facility management agency responsible for the grid. Then, the government agent invests in the construction of safety facilities in the grid.
According to the U-type relationship hypothesis and scale economy theory between China’s urban population density and urbanization process, a positive correlation is observed between China’s urban population and the process of urbanization [31,32]. Therefore, changes in the population size are related to the urban economic growth index. In this model, the demographic changes of different regions during the current year will affect the economic situation of the region in the current year, and the economic growth index is defined to measure this aspect. The specific formula is shown in Formula (12).
where and are the populations of the previous year and the current year (including the resident population and the floating population), respectively, and create economic benefits for the local population and the changing migrant population of the year, respectively, with .
The definition of the government investment capacity in this model is positively correlated with the economic growth index. After the model selects the grid, the increase in the value of safety facility coverage is calculated by Formula (13).
where and indicate the safety facilities coverage during the current year and previous year, respectively.
(2) Family agent
The family agent determines whether the family is relocated according to the family’s moving desire and combines the family’s economic conditions and vacant resources. The strength of the family’s willingness to move is measured by the family agent’s moving desire. The moving desire (MD) is closely related to the family satisfaction. The more dissatisfied is the family is with the current place of residence, the greater the desire to move. The calculation formula of the MD is shown in Formula (14).
The artificial society constructed in this paper set two adjustable parameters related to home moving during the simulation. One parameter is the minimum threshold for the household moving desire. Only families with a desire to move that is greater than this value will move. The other is the threshold for relocation income. Only families with annual incomes greater than this value have the ability to relocate. Therefore, the family agent moves when the above conditions are met at the same time.
The total number of immigrants is determined by considering the number of immigrants and the immigration ratio, both of which increase each year. The family attribute is assigned according to the family structure and allocated to the immigrant family. If the annual income of the family is greater than or equal to the relocation income threshold under the condition of vacancy, the vacant place that meets the family preference is selected for the relocation by family.
The family agent makes child-bearing decisions every year based on the fertility rate when childbearing conditions are met. Fertility conditions mean that the family includes married women aged 23–40 and married men aged 23–45. In the artificial society constructed in this paper, the fertility rate and sex ratio of newborns are obtained according to the Shenzhen Statistical Yearbook. The fertility policy is set as the two-child policy commonly adopted in China, which means that a family can only have a maximum of two children. At the same time, the family’s ability to have children is also limited by the family’s economic conditions. When the above conditions are met, the family agent implements the decision to have children and updates the family structure.
(3) Resident agent
Resident agents will have preferences for their own needs, which lead to differences in the importance of various facilities. The model reflects these differences by constructing different preferred resident agents and calculating their satisfaction through their preferences. The unemployed residents in the model constantly pay attention to employment information and find jobs every year according to their age and education level. If they find a job, they will allocate the wages according to the job information for the resident agent.
(4) Safety facility agent
In the model, the security facility management agency can adjust the security facilities in the grid under its jurisdiction according to the information transmitted by the government. The specific process is as follows. The safety facility management agency selects the optimal location within the grid and constructs the safety facility in accordance with government policies. Regarding the selection of the location of the safety facility, the following rules apply. Under the condition that the building coverage is between 0.2 and 0.8, the geometric center point of the grid is selected as the optimal construction location. The geometric center-point coordinates (x, y) of the grid are calculated as shown in Formulas (15) and (16).
where and represent the abscissa and ordinate of the grid and represents the total number of cells within the grid.
If the cell in which the geometric center point is located does not satisfy the building coverage condition, then a search should be conducted within a cell-centered radius of 100 m, and a cell that satisfies the conditions for the construction location of the safety facility should be randomly selected. If a cell within 100 m cannot satisfy the condition, then the search range should be expanded in increments of 100 m until a cell that satisfies the conditions is found. After the construction location of the safety facility is determined, the safety facility management agency constructs a corresponding type of safety facility at that location, and it will be put into use in the coming year.
4.2. Implementation of the ULC-AS
The ULC-AS was developed by the research team using the Repast (Recursive Porous Agent Simulation Toolkit) simulation modeling tool and written in the Eclipse development platform based on the JAVA language. ArcGIS is used to rasterize real geographic data to provide operational data for the model.
The operational interface of the model is shown in Figure 9.
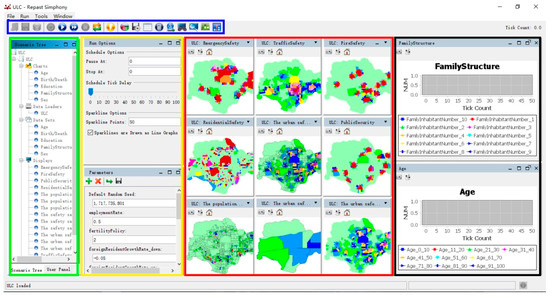
Figure 9.
Operational interface.
In the blue box on the interface is the Repast toolbar, which provides run control functions. In the green box on the left side of the interface is a view bar, which contains all views and data parameter control bars that can be viewed. Above the yellow box is the model running speed regulator, which controls the number of runs and the running time. Below the yellow box is the parameter setting tool that adjusts the environmental variables of the model. The red box in the middle of the interface is a geographical environment view, which can simultaneously observe changes in multiple indicators in real time. Inside the black box on the right side of the interface is a statistical chart that collects the data of the model runtime and displays them in the form of a line chart.
A simulation of more than 1.5 million residents in Futian District was performed with the ULC-AS. For the normal operation of the model, more than 300,000 resident agents were defined, in which one resident agent represents five people in reality. The population change, income/expenditure, average satisfaction, average livability, etc. of the entire region are calculated in annual time units, and the corresponding statistics are output at the end of each year and stored in an Excel spreadsheet. The resident agent, the family agent, the grid and the priority are sequentially reduced, and the priority is included in each cycle. The large amount of data generated during the operation can be updated in real time and stored in the form of a table. The different levels of statistical data, such as safety livability, satisfaction, population density, and building coverage, are represented by normalized values and are divided into ten levels, 0–0.1, 0.1–0.2, …, 0.9–1.0, which are represented by different colors.
5. Simulation Results
The verification of the ULC-AS model was carried out in four steps, namely, code rehearsal, debugging, analysis and parameter scanning, to ensure the reliability of the model system. To make the results of the model more intuitive, we used ArcGIS software to display the map according to the security level.
5.1. Model Setting and Scenarios
In recent years, the Futian District has faced many problems in improving its safety and livability conditions. Due to the increasing number of migrants in the Futian District, competition for resources among the migrants and permanent residents has intensified, and the urban population pressure has increased. In addition, the phenomenon of China’s aging population is becoming increasingly serious. Although the country has liberalized the second-child policy, the domestic fertility rate is still not as high as expected. The number of young and middle-aged laborers continues to decrease, and the full liberalization of the birth policy has become the trend of future development. The existing safety facilities in the Futian District have difficulty meeting the growing needs of the residents. Therefore, increased government urban investment construction is an important means of solving these problems.
To cope with the current safety problems and the future development trends of Futian District in Shenzhen, the ULC-AS takes the safety livability of the Futian District as an example and applies different scenarios to simulate changes in urban livability and resident satisfaction under different policy conditions. Through the operation of the ULC-AS over a period of time (20 years), we compared the impact of policies in different scenarios on urban safety livability. Based on the actual situation of the region, we examined the following four scenarios in the simulation.
In Scenario 1, the current situation of the Futian District, Shenzhen is simulated. In this scenario, real data are used as the operating parameters of artificial society, and the behavioral rules mentioned above are used as the changing rules of the artificial society to conduct the simulation experiments. In this scenario, the specific conditions of the operating parameters of the artificial society are shown in Table 1.

Table 1.
Main parameters of the ULC-AS.
In Scenario 2, we focused on the impact of the advancement of urbanization on the safety and livability of cities. The advancement of urbanization means an increase in the migrant population. Therefore, in this scenario, we only adjusted the parameter of the growth rate of the migrant population, and the settings of the remaining parameters remained exactly the same as those in Scenario 1. To observe the impacts of different growth rates of immigrants on changes in urban safety and livability, we conducted multiple experiments. We set the fluctuation range of the growth rate of the migrant population to 5–10%, 10–15%, and 5–15% and conducted three experiments to observe the experimental results.
In Scenario 3, we focused on the new fertility policy that China intends to implement in response to the challenges of an ageing population. China’s comprehensive liberalization of its fertility policy has become a trend that does not limit the number of children a family can have. Therefore, in this scenario, we adjusted the two-child policy in the original rule mentioned above to fully liberalize the fertility policy, and the remaining parameters were set exactly the same as in scenario 1. According to this scenario, we conducted experiments and observed the results.
In Scenario 4, we focused on the impact of government intervention in the coverage of safety facilities on the development of urban safe livability in the Futian District. The government can increase the coverage of safety facilities by constructing, improving and managing safety facilities, thereby affecting five safety indicators. Therefore, in this scenario, we assumed that the government can directly increase the coverage of this safety indicator in this grid after identifying the grid with the lowest safe livability and the worst safety indicator in the grid. The settings of the other parameters were exactly the same as those in Scenario 1. In this scenario, to observe the impact of the increase in the coverage of different safety facilities on the change in the safety and livability of the city, we conducted multiple experiments. We set the fluctuation range of the increase in the coverage of safety facilities to (0.1~0.2), (0.2~0.3), and (0.3~0.4) and conducted three experiments to observe the experimental results.
5.2. Results and Analysis
In these four scenarios, we used the ULC-AS to simulate the changes in urban safety and livability over the past 20 years and obtained a number of experimental results.
(1) Scenario 1
This scenario simulates the current situation in the Futian District. In this scenario, the population of the Futian District changes over time and is relatively stable over 20 years, as shown in Figure 10c. During the simulation period, the resident population of the Futian District is relatively stable, and the total population is affected by the floating population. The urban safety livability and satisfaction show an overall stable trend, as shown in Figure 10a,b. Figure 10d–f show the distribution maps of urban safety livability after 20 years at different levels (cell, grid, street). During the 20-year period, urban safety livability is affected by demographic changes in the Futian District and the coverages of various safety facilities. Small-scale changes in the population make it difficult to balance the limited resources of the security facilities, resulting in a decline in urban safety livability. However, the government’s investment in the construction of safety facilities has a positive impact on improving the safety environment in the Futian District so that urban safety livability and resident satisfaction can be maintained to a certain extent. The results of the overall stability of urban safety livability indicate that government investment is an essential means of national macroeconomic regulation and control and plays an important macro-oriented role in social investment and resource allocation. The positive impact of government investment on urban livability compensates for the negative impact of small population changes. Government investment can compensate for the failure of social distribution, coordinate the major investment ratio relationship of the whole society, and promote economic development and structural optimization. However, in the construction plan of Futian District, the government should make a reasonable comparison of all grids to ensure that it invests in safety facilities where they are most needed to achieve a gradual improvement in the safety and livability conditions of the Futian District.
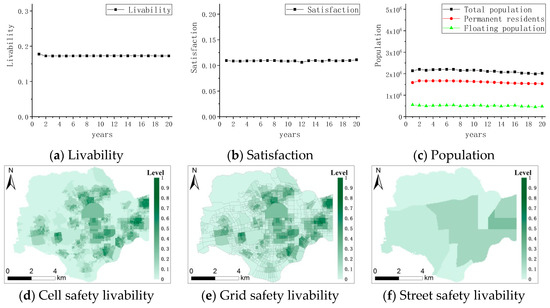
Figure 10.
Scenario 1 results.
(2) Scenario 2
Under the setting of this scenario, experimental results are obtained showing the fluctuation ranges of the growth rate of the foreign population in the ranges of 0–5%, 5–10% and 10–15%. The simulation results show that the population of the Futian District increased to varying degrees over time in the three experiments. Compared with the normal scenario, the total population in the three cases increased by more than 120,000, 190,000 and 360,000 people, as shown in Figure 11.

Figure 11.
Population with increased growth rates of the foreign population.
However, the results of the three experiments showed that the safety livability and satisfaction of the cities in the Futian District presented a downward trend within 20 years, and the contrast did not change significantly. The population growth rate of 10–15% provides an example of the results, as shown in Figure 12. The urban safety livability and satisfaction of the Futian District show a downward trend over 20 years, as shown in Figure 12a,b. Figure 12d–f show the distribution maps of urban safety livability at different levels (cell, grid, and street) after 20 years. This finding shows that under the condition in which government investment and construction remain unchanged, the growth of foreign populations makes it difficult to distribute security facility resources to each resident in a balanced manner, resulting in a reduction of per capita security resources and a decline in security facility service capabilities. Therefore, population growth is an important factor affecting the livability of cities, although the impact of growth within the normal range of the population on the safety of cities is not obvious. Under the normal operation of the Futian District, the population will not change sharply; therefore, in reality, this factor has only a minor effect on the urban safety livability of the Futian District.
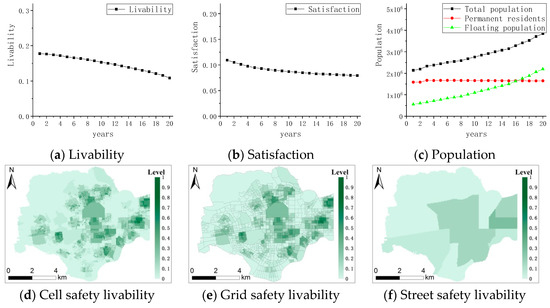
Figure 12.
Scenario 2 results.
(3) Scenario 3
This scenario simulates the development of the Futian District after the full liberalization of the fertility policy. According to the simulation results, during the 20-year period, the resident population in the Futian District increases significantly within a short period. The resident population increases by more than 50,000 in the first three years, and then the change tends to remain flat, as shown in Figure 13c. The above results show that the full liberalization of the birth policy increases the fertility rate within a short period. The number of newborn children increases sharply and then gradually reaches equilibrium. As shown in Figure 13a,b, the urban safety livability and satisfaction of Futian District show a downward trend over 20 years. The safety livability decreases significantly in the first three years and remains relatively flat over the next 17 years. This trend is consistent with the changing trend of the population. Figure 13d–f show the distribution maps of urban safety livability after 20 years at different levels (cell, grid, and street). A comparison of Scenarios 2 and 3 reveals that the population during the first three years in this scenario increases faster than does the population in Scenario 2, resulting in a more rapid decline of the urban safety livability within the Futian District. Therefore, the rapid increase in population in a short period puts more pressure on cities, and the government has difficulty coping with the rapidly increasing population through normal management, thereby accelerating the decline in urban safety livability. The analysis indicates that the full liberalization of the birth policy leads to a sharp increase in the population of the Futian District within the first three years, and the balance between this increase and additional safety facility resources is difficult to maintain. Therefore, the government should focus on increasing its investment in construction of safety facilities in the early stage of the full liberalization of the birth policy to improve the safety facility resources, meet the needs of residents as much as possible, and compensate for the impact of the comprehensive liberalization of the birth policy on urban safety livability and satisfaction.
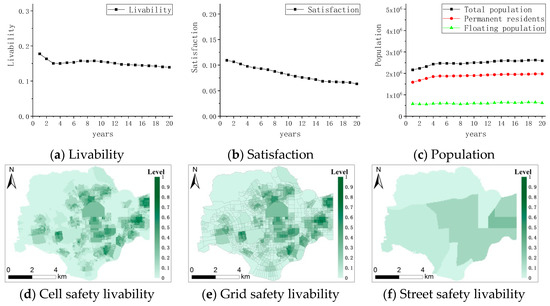
Figure 13.
Scenario 3 results.
(4) Scenario 4
Under the setting of this scenario, the experimental results show that the fluctuation range of the safety facility coverage increases by 0.1–0.2, 0.2–0.3 and 0.3–0.4. The simulation results of the three experiments indicate that in the next 20 years, the safety livability and satisfaction of the Futian District will increase to different degrees as shown in Figure 14 and Figure 15.

Figure 14.
Safety livability with increased coverage of safety facilities.

Figure 15.
Satisfaction with increased coverage of safety facilities.
The degree of improvement in safety livability and satisfaction is positively related to the increase in the coverage of safety facilities. By observing the trends of population changes, we found that the population changes were consistent among the three experiments and that significant differences did not occur. The differences were basically similar to the population changes in normal scenarios as shown in Figure 16.

Figure 16.
Population with increased coverage of safety facilities.
Therefore, the experimental results show that the government has increased investments in construction of areas with low livability and narrowed the urban livability gap between different regions in the Futian District. In this way, the distribution of security facility coverage tends to be balanced, which is conducive to the stable development of the city. The satisfaction rate is significantly higher than that in Scenario 1, which indicates that the government has increased the construction of and investment in safety facilities and narrowed the relative gaps between the safety facilities service capacities of various regions. In this way, the gaps between residents’ satisfaction with the safety environment are also reduced, resulting in a steady increase in satisfaction. The difference in the growth trend of safe livability and satisfaction among the three experiments show that the government’s measures to increase the coverage of safety facilities have a very significant impact on the growth of the safety livability in the Futian District.
6. Discussion and Conclusions
The artificial society uses the computer as a social laboratory for the simulation and experimental evaluation of different types of real factors underlying changes in society and then analyzes and predicts the impacts of various factors on society. In this paper, the artificial society theory is applied to the analysis and prediction of urban safety livability of complex urban system. Taking the safety and livability of the Futian District in Shenzhen as an example, a ULC-AS is constructed. The various types of agents in the model interact with each other and adapt to the environmental changes in a bottom-up simulation of the emergence of agent behaviors and the change laws of urban safety livability. By simulating four different scenarios, the model discusses the impact of immigration, birth policy, government investment and other factors on urban development in the next 20 years. The results show that the livability of residents in the current environment has not reached the peak and shows a stable trend: an increase in the number of migrants will destroy the livability of the current city; with the opening of the fertility policy, the pressure on livability of the city is becoming more and more tense; the government’s appropriate adjustment of the coverage rate of safety facilities with the change of population will help to improve the livability.
The model has important reference value for the study of urban safety livability. The model can predict the development trend of urban safety livability in various environments by adjusting the parameters and provide scientific decision-making support for the government’s future safety facility coverage planning, which has very important practical significance for the realization of the harmonious and stable development of the city.
Compared with the traditional research methods of urban livability, the ULC-AS model proposed in this paper reveals the spatial heterogeneity of urban livability more comprehensively. Although many geospatial explorations focus on regional spatial heterogeneity, due to the lack of spatial heterogeneity and the combination of complex cognitive factors and residents’ decision-making, there are great deficiencies in solving the problems of human social science. In this study, computer simulation method was used to evaluate and deduce urban livability by comprehensively considering the influence of complex environmental factors and residents’ decision-making behaviors on livability. This study compares two models of urban livability. The urban livability constructed by Bassolas focuses on the connection between spatial environment and ignores the influence of human factors [33]. Mouratidis focuses on commuter satisfaction, neighborhood satisfaction and housing satisfaction as predictors of subjective well-being and urban livability indicators, which is the theory of contact interaction between human decision-making model [34]. This study makes up for the deficiencies of the above two models, and connects them with the field of simulation modeling to construct a complete ULC-AS architecture. This model reveals a new approach based on micro to macro analysis and provides a reference value for the research of many complex social science problems. At present, due to the lack of relevant data, the model does not make reasonable arrangements for transportation, catering, medical treatment, etc. The ULC-AS only considers the impact of safety in urban livability on urban development trends. However, a city’s comfort, convenience, accessibility, inclusiveness and other factors also have significant impacts on its livability. These aspects also need to be implemented in future models to build a large-scale artificial society of urban safety livability changes. The construction of an artificial society with large-scale urban livability is bound to face certain challenges. The most important difficulty may be the lack of computer memory due to the large number of agents, which makes it difficult for the artificial society to operate at high speeds. The experimental environment and proxy initialization information of the ULC-AS is shown in Table 2.

Table 2.
Experimental environment and agent information in the ULC-AS.
Only after more than 1.5 million resident agents are scaled down to more than 300,000 can our experiments be implemented normally. Therefore, the search for more high-performance simulation tools and processing methods represents an important focus of future research. With socioeconomic growth at different stages, the diversity of human activities, and the impact of safety facilities on the environment, the rationality and accuracy of a simulation based on historical data may not be fully applicable in the future. Thus, the model needs to be further optimized.
Author Contributions
Conceptualization, Lihu Pan; methodology, Lihu Pan and Huimin Yan; software, Shipeng Qin; formal analysis, Le Zhang; writing—original draft preparation, Shipeng Qin and Le Zhang; writing—review and editing, Shipeng Qin and Le Zhang; project administration, Rui Peng and Fen Li; funding acquisition, Huimin Yan, Rui Peng and Fen Li. All authors have read and agreed to the published version of the manuscript.
Funding
This work was supported by the Urban Livable Space Wisdom Model and Personalized Decision-making System Research and Development (no. JSGG20170413173425899),The Science and Technology Special Project (Class A) of the Chinese Academy of Sciences (no. XDA20010000), A sub project of the strategic leading The Science and Technology Special Project (Class A) of the Chinese Academy of Sciences, diagnosis of regional state of agriculture, forestry and animal husbandry and assessment of ecological environment effect of medium and long term development(no. XDA23100202). Excellent innovation project of graduate students in Shanxi Province (no. 2020SY439).
Data Availability Statement
Publicly available datasets were analyzed in this study. This data can be found here: https://github.com/ZhangLe407/ULC.
Acknowledgments
The authors would like to thank three anonymous reviewers for their valuable suggestions and comments.
Conflicts of Interest
The authors declare no conflict of interest. The opinions, findings, and conclusions expressed in this work are those of the authors and do not necessarily reflect the views of the sponsors.
References
- Wang, J.; Su, M.; Chen, B.; Chen, S.; Liang, C. A comparative study of Beijing and three global cities: A perspective on urban livability. Front. Earth Sci. 2011, 5, 323–329. [Google Scholar] [CrossRef]
- Li, J.; Liu, Q.; Sang, Y. Several Issues about Urbanization and Urban Safety. Procedia Eng. 2012, 43, 615–621. [Google Scholar] [CrossRef]
- Zanella, A.; Camanho, A.; Galvão, T. The assessment of cities’ livability integrating human wellbeing and environmental impact. Ann. Oper. Res. 2014, 226, 695–726. [Google Scholar] [CrossRef]
- Rastyapina, O.; Korosteleva, N. Urban Safety Development Methods. Procedia Eng. 2016, 150, 2042–2048. [Google Scholar] [CrossRef][Green Version]
- Zhao, M.; Liu, X. Reprint of: Regional risk assessment for urban major hazards based on GIS geoprocessing to improve public safety. Saf. Sci. 2017, 97, 112–119. [Google Scholar] [CrossRef]
- He, A.; Wang, W.; Du, W.; Wang, C.; Chen, N. Eml based urban fire incident modeling method and pro-totype. ISPRS Ann. Photogramm. Remote Sens. Spat. Inf. Sci. 2020, 5, 617–624. [Google Scholar] [CrossRef]
- Astarita, V.; Festa, D.C.; Giofrè, V.P.; Guido, G. Surrogate Safety Measures from Traffic Simulation Models a Comparison of different Models for Intersection Safety Evaluation. Transp. Res. Procedia 2019, 37, 219–226. [Google Scholar] [CrossRef]
- Liu, L.; Liu, Y.; Wang, X.; Yu, D.; Liu, K.; Huang, H.; Hu, G. Developing an effective 2-D urban flood inundation model for city emergency management based on cellular automata. Nat. Hazards Earth Syst. Sci. 2015, 15, 381–391. [Google Scholar] [CrossRef]
- Oliveira, I.A.S.J.; Carayannis, E.G.; Ferreira, F.A.F.; Jalali, M.S.; Carlucci, D.; Ferreira, J.J.M. Constructing home safety indices for strategic planning in residential real estate: A socio-technical approach. Technol. Forecast. Soc. Chang. 2018, 131, 67–77. [Google Scholar] [CrossRef]
- Sofeska, E. Understanding the Livability in a City through Smart Solutions and Urban Planning Toward Developing Sustainable Livable Future of the City of Skopje. Procedia Environ. Sci. 2017, 37, 442–453. [Google Scholar] [CrossRef]
- Okulicz-Kozaryn, A.; Valente, R.R. Livability and Subjective Well-Being across European Cities. Appl. Res. Qual. Life 2018, 14, 197–220. [Google Scholar] [CrossRef]
- Wey, W.-M.; Huang, J.-Y. Urban sustainable transportation planning strategies for livable City’s quality of life. Habitat Int. 2018, 82, 9–27. [Google Scholar] [CrossRef]
- Saitluanga, B.L. Spatial Pattern of Urban Livability in Himalayan Region: A Case of Aizawl City, India. Soc. Indic. Res. 2013, 117, 541–559. [Google Scholar] [CrossRef]
- Zhan, D.; Kwan, M.-P.; Zhang, W.; Fan, J.; Yu, J.; Dang, Y. Assessment and determinants of satisfaction with urban livability in China. Cities 2018, 79, 92–101. [Google Scholar] [CrossRef]
- Liu, J.; Nijkamp, P.; Huang, X.; Lin, D. Urban livability and tourism development in China: Analysis of sustainable development by means of spatial panel data. Habitat Int. 2017, 68, 99–107. [Google Scholar] [CrossRef]
- Mesimäki, M.; Hauru, K.; Kotze, D.J.; Lehvävirta, S. Neo-spaces for urban livability? Urbanites’ versatile mental images of green roofs in the Helsinki metropolitan area, Finland. Land Use Policy 2017, 61, 587–600. [Google Scholar] [CrossRef]
- Paul, A.; Sen, J. Livability assessment within a metropolis based on the impact of integrated urban geographic factors (IUGFs) on clustering urban centers of Kolkata. Cities 2018, 74, 142–150. [Google Scholar] [CrossRef]
- Khorasani, M.; Zarghamfard, M. Analyzing the Impacts of Spatial Factors on Livability of Peri-Urban Villages. Soc. Indic. Res. 2017, 136, 693–717. [Google Scholar] [CrossRef]
- Li, P.; Hu, Y. Comprehensive Evaluation of Chinese Urban Living Environments. In Proceedings of the 2014 International Conference on Construction and Real Estate Management, Kunming, China, 27–28 September 2014; pp. 1547–1554. [Google Scholar] [CrossRef]
- Yu, D.; Fang, C.; Xue, D.; Yin, J. Assessing Urban Public Safety via Indicator-Based Evaluating Method: A Systemic View of Shanghai. Soc. Indic. Res. 2013, 117, 89–104. [Google Scholar] [CrossRef]
- Zhang, J.; Li, X. Artificial Societies-Agent Based Social Simulation. Syst. Eng. 2005, 1, 13–20. [Google Scholar]
- Pan, L.; Huang, Q. Application of Artificial Society Model to Study of Land Use Change. J. Syst. Simul. 2010, 22, 1965–1969. [Google Scholar]
- Fernandez-Anez, V.; Fernández-Güell, J.M.; Giffinger, R. Smart City implementation and discourses: An integrated conceptual model. The case of Vienna. Cities 2018, 78, 4–16. [Google Scholar] [CrossRef]
- Hadimlioglu, I.A.; King, S.A. City Maker: Reconstruction of Cities from OpenStreetMap Data for Environmental Visualization and Simulations. ISPRS Int. J. Geo-Inf. 2019, 8, 298. [Google Scholar] [CrossRef]
- Sepasgozar, S.; Hawken, S.; Sargolzaei, S.; Foroozanfa, M. Implementing citizen centric technology in developing smart cities: A model for predicting the acceptance of urban technologies. Technol. Forecast. Soc. Chang. 2019, 142, 105–116. [Google Scholar] [CrossRef]
- Ghosh, S.; Gosavi, A. A semi-Markov model for post-earthquake emergency response in a smart city. Control. Theory Technol. 2017, 15, 13–25. [Google Scholar] [CrossRef]
- Wahyudi, A.; Liu, Y.; Corcoran, J. Generating Different Urban Land Configurations Based on Heterogeneous Decisions of Private Land Developers: An Agent-Based Approach in a Developing Country Context. ISPRS Int. J. Geo-Inf. 2019, 8, 229. [Google Scholar] [CrossRef]
- Maqbool, A.; Usmani, Z.U.A.; Afzal, F.; Razia, A. Disaster Mitigation in Urban Pakistan Using Agent Based Modeling with GIS. ISPRS Int. J. Geo-Inf. 2020, 9, 203. [Google Scholar] [CrossRef]
- Scott, L.M.; Janikas, M.V. Spatial Statistics in ArcGIS. In Handbook of Applied Spatial Analysis; Springer: Berlin/Heidelberg, Germany, 2009; pp. 27–41. [Google Scholar]
- Horsti, K.; Pellander, S. Conditions of cultural citizenship: Intersections of gender, race and age in public debates on family migration. Citizsh. Stud. 2015, 19, 751–767. [Google Scholar] [CrossRef]
- Chen, P.; Li, P. Urban population density and urbanization process in China: An empirical U-shaped curve. Soc. Sci. J. 2012, 34, 129–133. [Google Scholar]
- Yao, Z.; Xie, Y. An Empirical Study on the Relationship between Urban-Rural Income Gap and Urbanization. Stat. Decis. 2017, 9, 140–143. [Google Scholar]
- Bassolas, A.; Barbosa-Filho, H.; Dickinson, B.; Dotiwalla, X.; Eastham, P.; Gallotti, R.; Ghoshal, G.; Gipson, B.; Hazarie, S.A.; Kautz, S.; et al. Hierarchical organization of urban mobility and its connection with city livability. Nat. Commun. 2019, 10, 413–432. [Google Scholar] [CrossRef] [PubMed]
- Mouratidis, K. Commute satisfaction, neighborhood satisfaction, and housing satisfaction as predictors of subjective well-being and indicators of urban livability. Travel Behav. Soc. 2020, 21, 265–278. [Google Scholar] [CrossRef]
Publisher’s Note: MDPI stays neutral with regard to jurisdictional claims in published maps and institutional affiliations. |
© 2021 by the authors. Licensee MDPI, Basel, Switzerland. This article is an open access article distributed under the terms and conditions of the Creative Commons Attribution (CC BY) license (http://creativecommons.org/licenses/by/4.0/).