Article

A GIS-Based System for Spatial-Temporal Availability Evaluation of the Open Spaces Used as Emergency Shelters: The Case of Victoria, British Columbia, Canada

1
Faculty of Social Science and Asia-Pacific Studies Institute, Chinese University of Hong Kong, Hong Kong 999777, China
2
Department of Urban Planning, Tsinghua University, Beijing 100084, China
3
Department of Systems Engineering and Engineering Management, City University of Hong Kong, Hong Kong 999666, China
4
Department of Architecture and Civil Engineering, City University of Hong Kong, Hong Kong 999666, China
5
School of Marine Science, Nanjing University of Information Science and Technology, Nanjing 210044, China
*
Author to whom correspondence should be addressed.
ISPRS Int. J. Geo-Inf. 2021, 10(2), 63; https://doi.org/10.3390/ijgi10020063
Submission received: 2 December 2020 / Revised: 25 January 2021 / Accepted: 27 January 2021 / Published: 2 February 2021
(This article belongs to the Special Issue Disaster Management and Geospatial Information)

Abstract

:
Canadian emergency management planners have historically ignored the self-motivated evacuation procedures of people who cannot initially choose the safest evacuation areas. In densely developed urban areas, open spaces can be seen as ideal evacuation areas and should thus be included in shelter planning. In this study, the public open spaces in Great Victoria were selected as the study area and evaluated using GIS technologies. A multi-criteria TOPSIS evaluation model was used to conduct comprehensive quantitative evaluations of the open spaces’ safety, accessibility, and availability. Through hybrid process, service area, and POI aggregation coupling analyses, a model is created that provides an overall evaluation at the district level. In addition to providing a model for evaluating open spaces as emergency shelters, applicable to most Canadian cities, this study emphasizes the importance and disadvantages of open space emergency shelters in Canada, which have heretofore been ignored by decision makers. In Great Victoria, we found that the distribution of open spaces does not match the dynamics of the population distribution, meaning that through inadequate preparation some districts lack a safe evacuation place—this in an area where people are at high risk of earthquake disasters and their subsequent effects.

1. Introduction

Severe earthquakes normally cause extensive but unpredictable loss of life and property, amid which evacuating people to shelter can be difficult. Damaged and collapsed buildings and interruptions in electricity, water, and natural gas supply can cause mass casualties after a severe quake. When an earthquake happens, the first evacuation step is that to stay away from buildings and move to open spaces. Since the local government may have no chance to give out evacuation directives, people need self-rescue, which is a self-motivated evacuation procedure. A proper well-planned self-motivated evacuation can reduce the casualties to a great extent [1]. Some earthquake videos reflect the problem of people not being fully aware of where to escape to, as no clear guiding to such shelters are available; in fact, around 28.9% of residents prioritize roads as evacuation sites [1,2,3]. These findings signify two potential issues: an uneven distribution or lack of safe open spaces in urban areas and unavailability of emergency shelter guidelines.
Earthquake emergency shelters provide people safe places away from active fault zones and other secondary disasters [4]. The earliest emergency shelter studies began in the 1920s in Japan and were developed in the 1970s by Hoshino [2]. However, most cities that have not suffered a severe earthquake in the last half century tend to minimize the importance of emergency shelter planning. Even so, many cities around the world have a high likelihood of suffering a severe earthquake. Especially in certain vast and sparsely populated countries, such as Canada, densely populated towns may lack emergency shelters. Urban planners should take the full advantage of open spaces as emergency shelters that can support post-earthquake evacuation and reduce casualties in a limited urban area [5].
Through the use of big data acquired from open resources, a quantitative emergency shelter evaluation model can be built to support future urban planning. The data-supported evaluation results adopt a scientific approach that takes different aspects into account, including safety, accessibility, availability, etc. Taking advantage of the analysis of the population distribution and emergency shelters in different periods, such as a weekday, weekends, and night time, the model is completed. Based on the results, planners can adjust and improve post-earthquake emergency evacuation planning to maximize the effective use of open spaces.

2. Literature Review

2.1. Emergency Shelter

Disaster relief (DR) shelters are different from other housing or buildings, with different requirements depending on the duration of the disaster [6]. The post-earthquake recovery process is divided into four stages: immediate relief (hour), immediate sheltering (day), temporary housing (week), and permanent housing (month) [7]. Service time decides the types of shelters and their supporting facilities, and some countries provide standards for building such shelters [8,9]. The emergency shelter service period is from hours to days and does not require permanent buildings. However, a large quantity, good distribution, and high accessibility are needed to support self-motivated evacuation [10,11]. In order to prevent using some private areas that are not open to public, public open spaces have been considered an ideal emergency open space amid natural disasters and especially the public parks are widely used to support evacuation after seismic events [12,13]. An eligible shelter must meet the standards of safety that would guard against disasters and other types of earthquake effects, such as high accessibility, so that residents and rescue workers can access the location, and the capability to at least accommodate 200 people at 2 square meters/person [14,15]. The government of the City of Victoria, Canada publishes reception centers on its website but notes that some places in the city are not covered [16]. They are some indoor long-term shelters, which are high maintenance and insufficient in quantity. Although decision makers and planners encourage people to prepare themselves for earthquakes, people still have no idea where the safest place is. The existing indoor emergency shelters are far from enough. Open spaces have historically been overlooked and not been included in post-disaster planning either. Open spaces as emergency shelters have not been evaluated, as they may also be at risk, and thus would not be able to support the post-earthquake emergency evacuation.

2.2. Conditions of Canadian Shelters

The high building code and sparse population has led Canadians to ignore emergency shelters in urban planning. Canada is vast and sparsely populated, with a national population density of only 3.41 per square meter, and its standard for seismic design is 7 [17,18], indicating that new buildings will not collapse under a 7-magnitude earthquake. However, research evaluating building damage in some parts of Victoria and Vancouver has shown that older neighborhoods may sustain up to 30% structural damage [19], indicating that open spaces as emergency shelters are needed because the indoor spaces are no longer safe. The design of Canadian shelters is mainly based on existing buildings, but an upgrade plan could provide long-term accommodation for political asylum seekers, the homeless young, and first nations (Canadian aborigines) [20,21]. However, these shelters have certain disadvantages that diminish the support they can offer during post-earthquake self-evacuation. According to Schina and Onur et al. [19,22], Canada has little experience in establishing standards for emergency shelters. The Toronto and Vancouver Housing Authority has experience in settling the homeless, providing housing stability by providing daily services to deliver homeless people better living conditions and promote social equity [20]. However, these shelters are not suitable for earthquake response, because they do not consider the widespread effects of natural disasters.

2.3. Location Evaluation
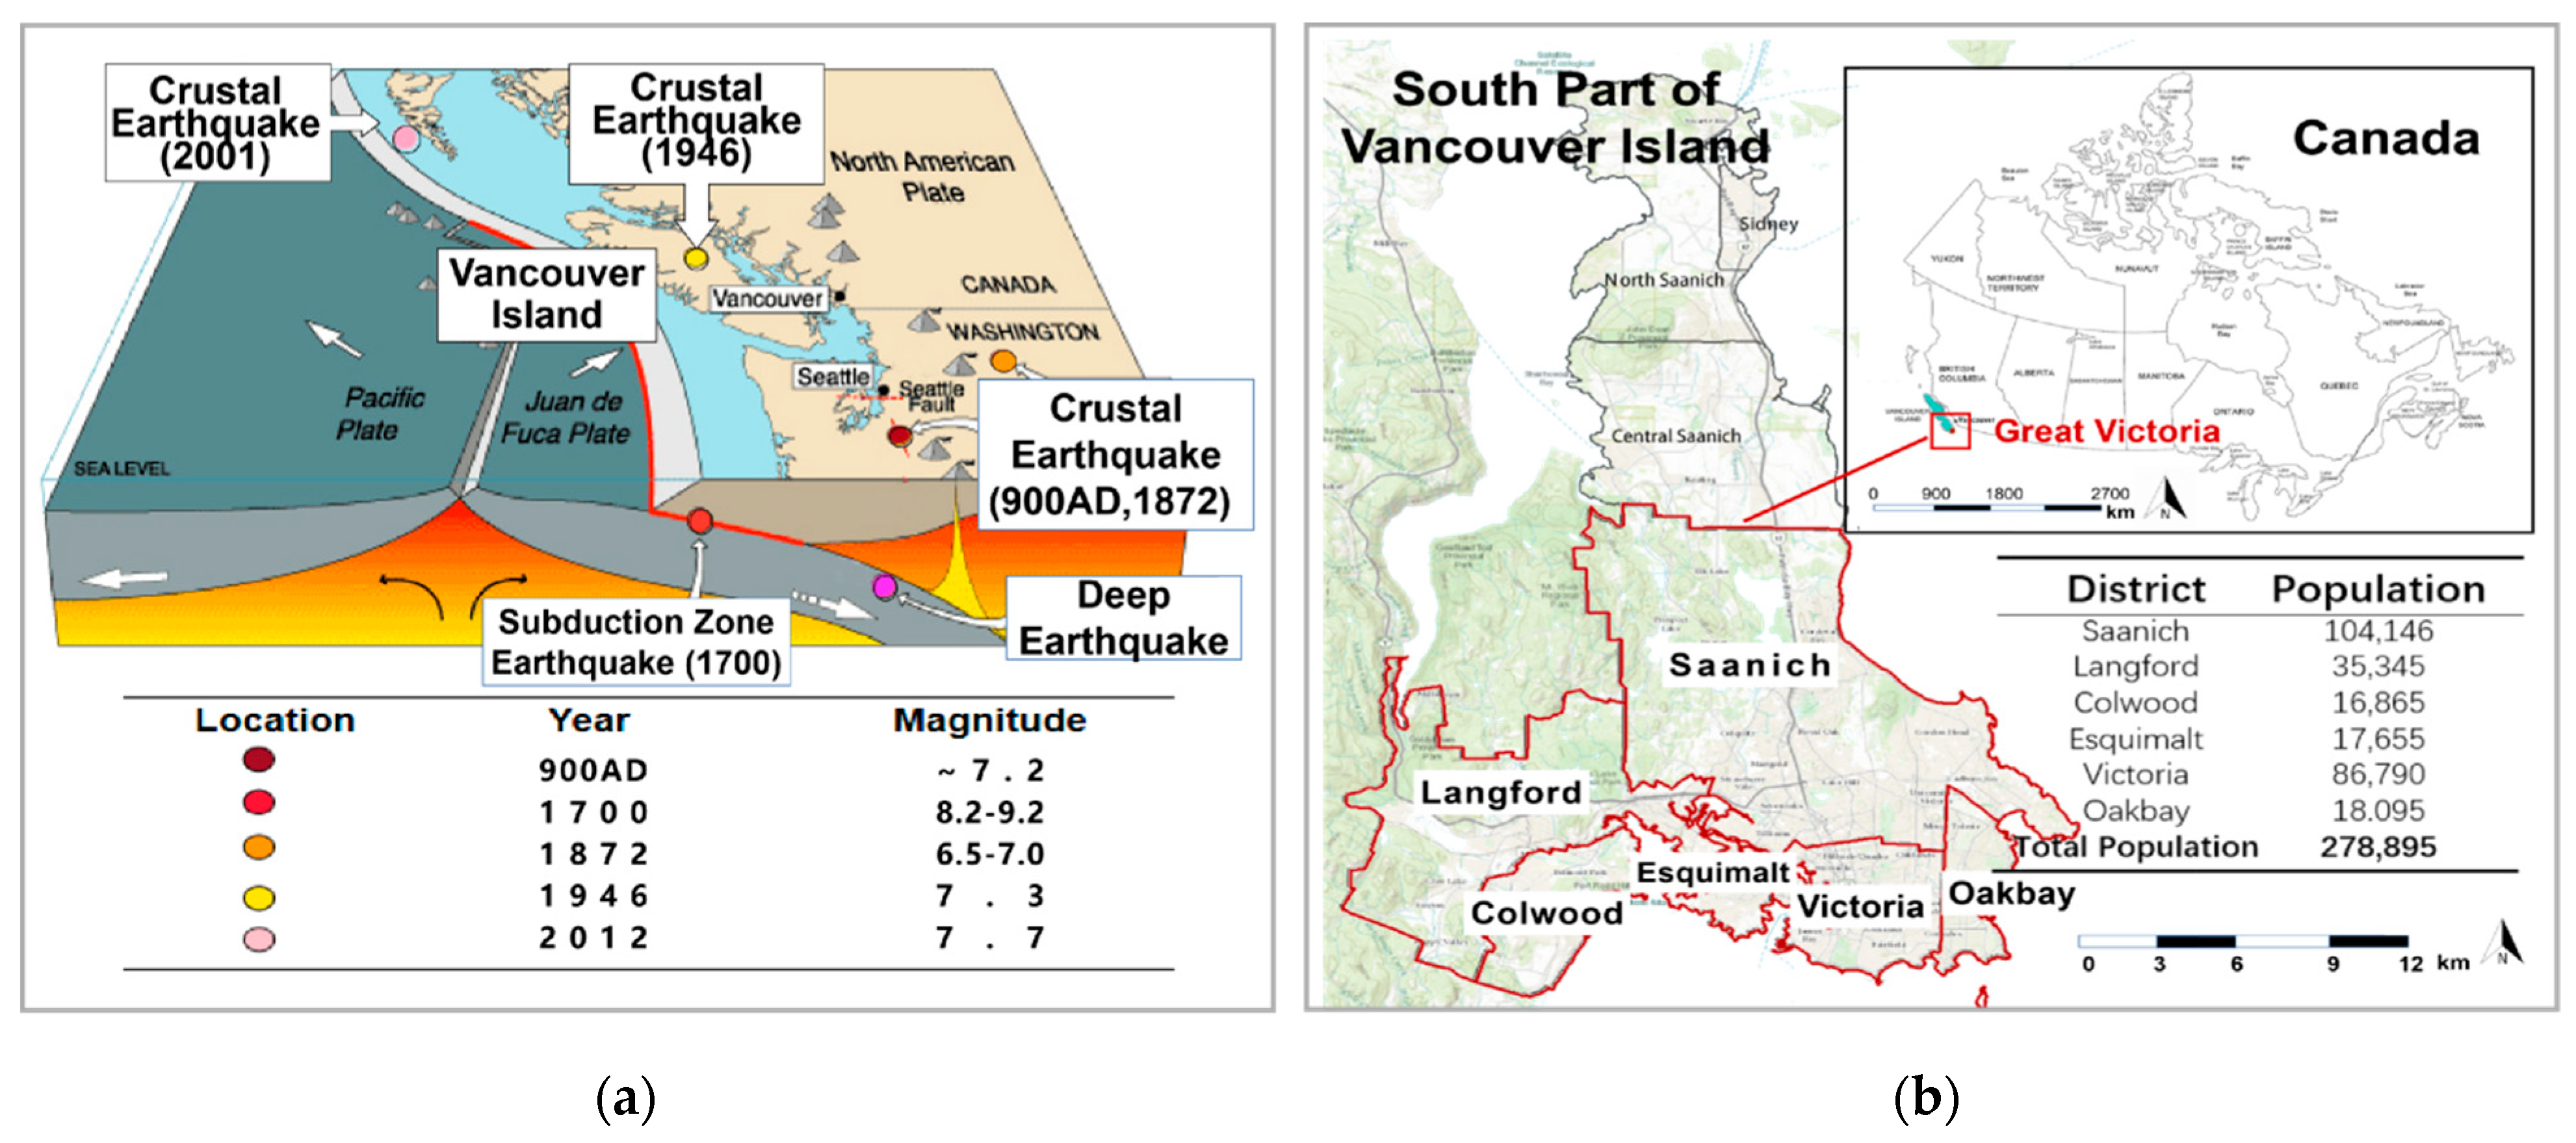
Most emergency shelter evaluations give only the score of a location, ignoring the dynamic nature of the population distribution at different times [15]. A hybrid approach is needed to combine multi-criteria decision making methodology and coupling analysis with a view to producing a complete emergency shelter evaluation model.
The multi-criteria evaluation method is widely used to evaluate facility locations. Criteria selection may differ but generally include accessibility (road safety, distance to important facilities), safety (the earthquake disasters and effects), and effectiveness (area, capacity, and service area) [6,23,24,25]. After the criteria are determined, they are applied through multi-criteria decision-making (MCDM) models [23]. Researchers have developed several methods, such as the analytical hierarchy process (AHP) and techniques for order preference by similarity to ideal solution (TOPSIS), to evaluate existing shelters. AHP has two main advantages: it is a clear systematic quantitative analytical method that is highly suitable for multi-criteria calculation, and it does not require large amounts of data [26]. However, criteria weight was strongly impacted by the subjective matrix, which is not the best method in this study. TOPSIS is popular in large-scale decision-making and location-based analysis since it is based on the distance to the alternative value [6,24].
In summary, this study is intended to provide safe places in Victoria, British Columbia, Canada, where people can wait on government-organized indoor relocation and sheltering arrangements, by building a model for evaluating emergency shelters and district-level shelter services based on Canadian national conditions. Based on the literature review, open spaces are resources for efficiency evacuation. GIS technology, new data, and a multiple criteria evaluation model are used to evaluate the availability of open spaces as voluntary emergency shelters. The distribution matching degree of populations and shelters is also being considered by the coupling analysis. The spatial aggregation of populations is used to identify possible population hotspots, which is represented by point of interest (POI) data. Multi-criteria evaluation and coupling analysis can provide a complete emergency evaluation model [27,28].

3. Study Area

Vancouver Island in Canada lies on the boundary of the Cascadia subduction zone, which is the most seismically active region in the world. The Juan de Fuca Plate and North American tectonic plate converge here, and the two plates are blocked together and build up the frictional stress, which is the primary cause of the earthquakes. The hundreds of years of enormous stress building up results in a “mega-thrust” earthquake when the stress finally reaches a threshold [27]. Some great historical earthquakes are shown in Figure 1a. According to the research of local geologists, in the next 50 years, 32% of the entire Vancouver Island on the coastal continental plate will suffer destructive earthquakes [16,28].
The six most densely populated regions were selected as the study area, which is known as the Great Victoria region (Figure 1b). The population density is 1275 people per square kilometers—over 300 times the Canadian average population density (4/km2) [2]. As the most livable city in Canada, Great Victoria also attracts hundreds of thousands of tourists or elderly people who come to travel or settle down, and who are vulnerable groups of people after an earthquake happens.
Based on previous research by Schina and Onur et al. [19,22], rarely has Canada experienced establishing standards for emergency shelters, so the current shelters would provide limited support during a post-earthquake disaster. Toronto and Vancouver Housing Authority only provide daily service to deliver homeless people for better living conditions [19,20,21]. As Figure 2a shows, there are only seven shelters in Great Victoria, totaling 218 km2, and their distribution is only concentrated in Victoria downtown, with at least 197 km2 having no shelter [29]. The design of shelters mainly relies on existing buildings, as the street images in Figure 2 show; however, their distribution and the amount are not nearly enough to support the post-earthquake evacuation and relocation, suggesting that open spaces need to be introduced in future planning. In summary, taking Great Victoria as a typical example, it would be valuable to improve Canadian emergency planning.

4. Methodology

Taking advantage of advances in multiple new data, combined with GIS technology, this paper provides an evaluation model to evaluate the availability of open space as an emergency shelter in Canada. The hybrid approach consists of three major steps, and the methodology flow chart is shown in Figure 3. Step 1: The emergency shelters were evaluated by using the weighted multi-criteria TOPSIS method (technique for order preference by similarity to ideal solution). Step 2: The population distribution in the different periods was estimated (weekday, weekend, and night time). Step 3: The shelters’ service areas are calculated by the GIS network analysis tool, and the matching degree were measured by coupling analysis (Figure 3).

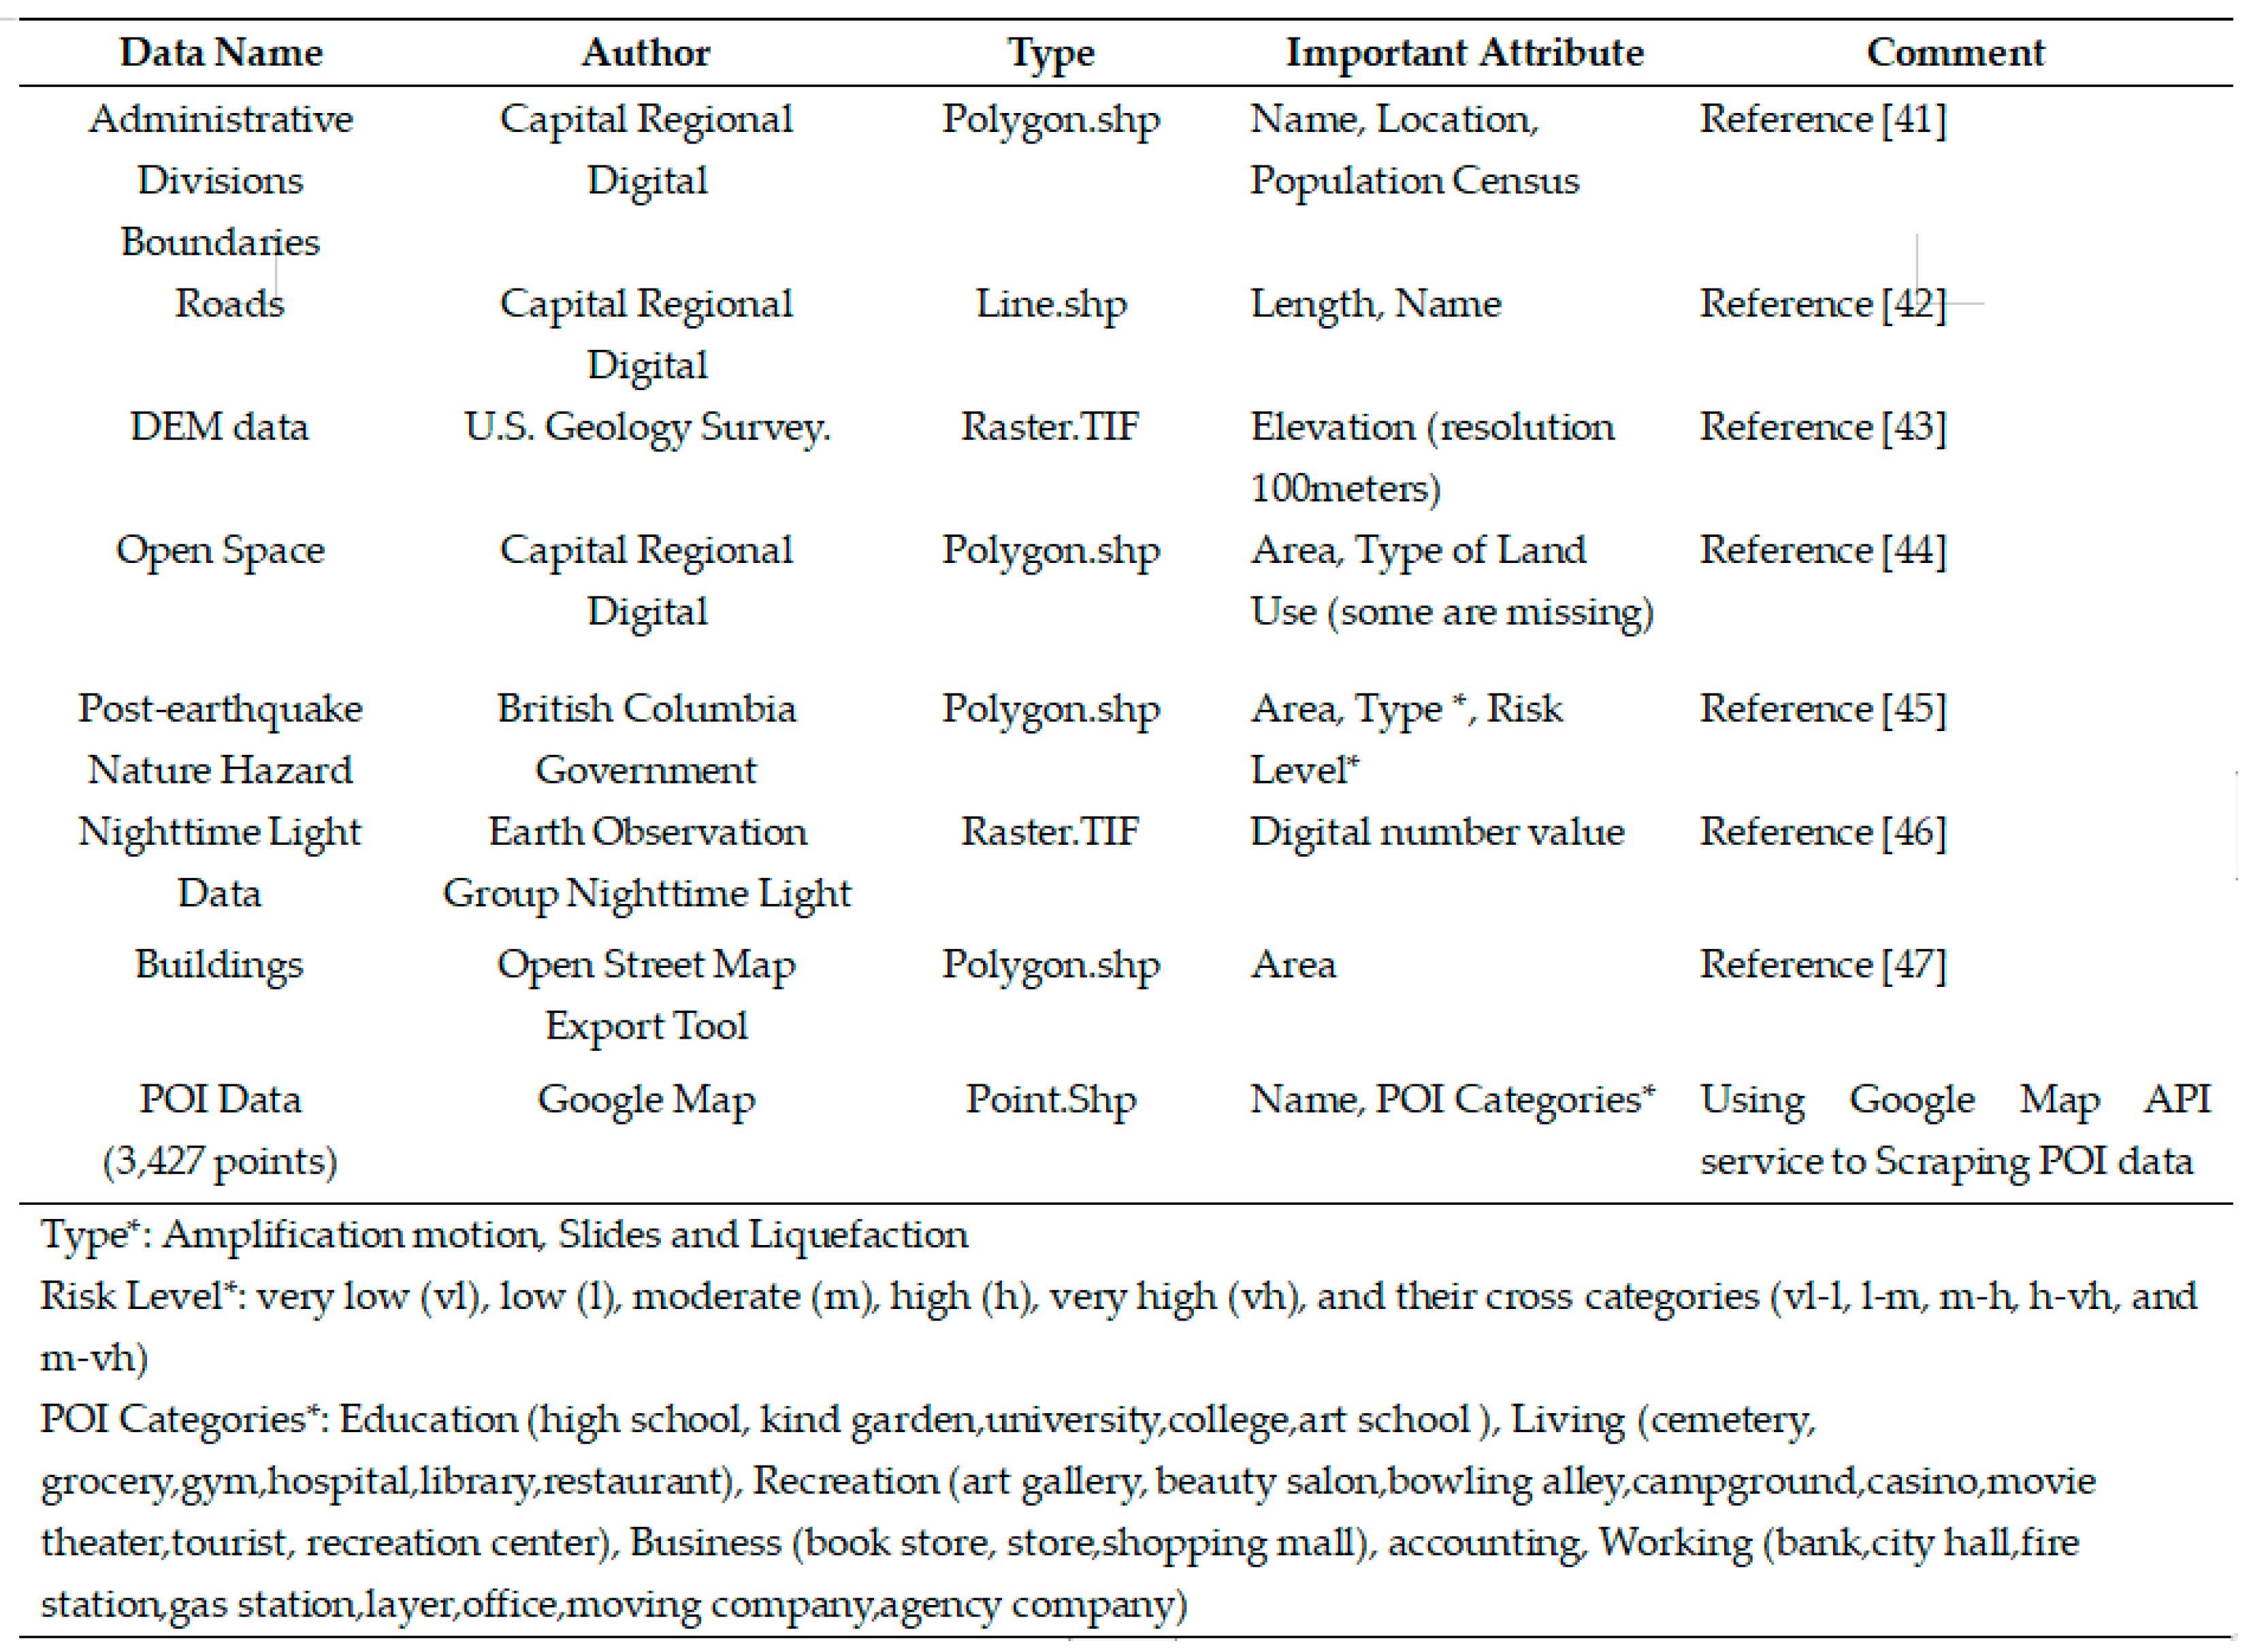
4.1. Data Collection and Pre-Processing

This study contains several sets of open data. The POI data scraping is based on Python Script by using the Google API to extract the points data on Google Maps. The attributes used in this study are their location and function. Open spaces, roads, and building polygon data are downloaded from Open Street Map (OSM). The type and area of open spaces and building polygons are used in the next analysis. The NPP-VIIRS DNB (Day/Night Band) is the artificial nighttime light data, which has a higher spatial and temporal resolution than traditional nighttime light data and can be used to estimate the active urban area [30]. In this study, the data are used to remove the forest area where there may be some POIs and buildings but there are no permanent residents. Victoria hazard data were obtained from the British Columbia Government Official Website geoscience map section; this geological survey is supported by the National Earthquake Hazard Reduction Program (NEHRP) [31]. Ground amplification motion, slides, and liquefaction hazards are the three types of natural hazard used to screen the open spaces that can be used as emergency shelters. Faulting and ground rupture hazards were not addressed in this program, because the above hazard area has covered the rupture area. The data in full detail is given in Appendix A.
The shape-file format data were obtained, projected, and adjusted into the same projection, the NAD83 UTM Zone 10N Transverse Mercator projection, which guarantees the accuracy of the area and direction. The software used in this research is ArcMap 10.6, provided by the Chinese University of Hong Kong computer lab.

4.2. Emergency Shelters Evaluation

Before evaluating, open spaces with a high risk of disaster must be removed first. According to the hazard evaluation data posted by NEHRP, over 20% of the open space areas are under a type of high-degree hazard, whether it is landslides, liquefaction, or ground amplification, and were thus removed. Since Great Victoria is not at risk from coastal communities facing the Pacific Ocean, the waves will only cause a low-risk slow rise in water levels of about 1.5 to 3 m [32]. Therefore, based on the DEM data and Victoria Tsunami Modelling and Mapping Report results, which is a tsunami flooding analysis, coastal areas that are lower than 12 mare defined as high tsunami risk [33]. The selected open space is defined as a potential available emergency shelter (Figure 4).
The first step of the evaluation is to determine the criteria. In this study, emergency shelters serve for the period within the 24 h after an earthquake happens, and extra facilities or permanent buildings are not required. There are two principles of selecting the indicators that are independent of each other and quantifiable in estimation. The earthquake emergency shelter is evaluated on three aspects, including safety, accessibility, and availability, and each aspect includes different criteria. Based on previous research, there are three essential requirements (safety, accessibility, and capability), including six criteria (building collapsing, fire hazard, roads accessibility, rescue response of firefighting, medical service, and capacity) that are relevant to emergency shelter site evaluation after an earthquake [6,23,24,25]. The following three paragraphs contain the criteria explanations.
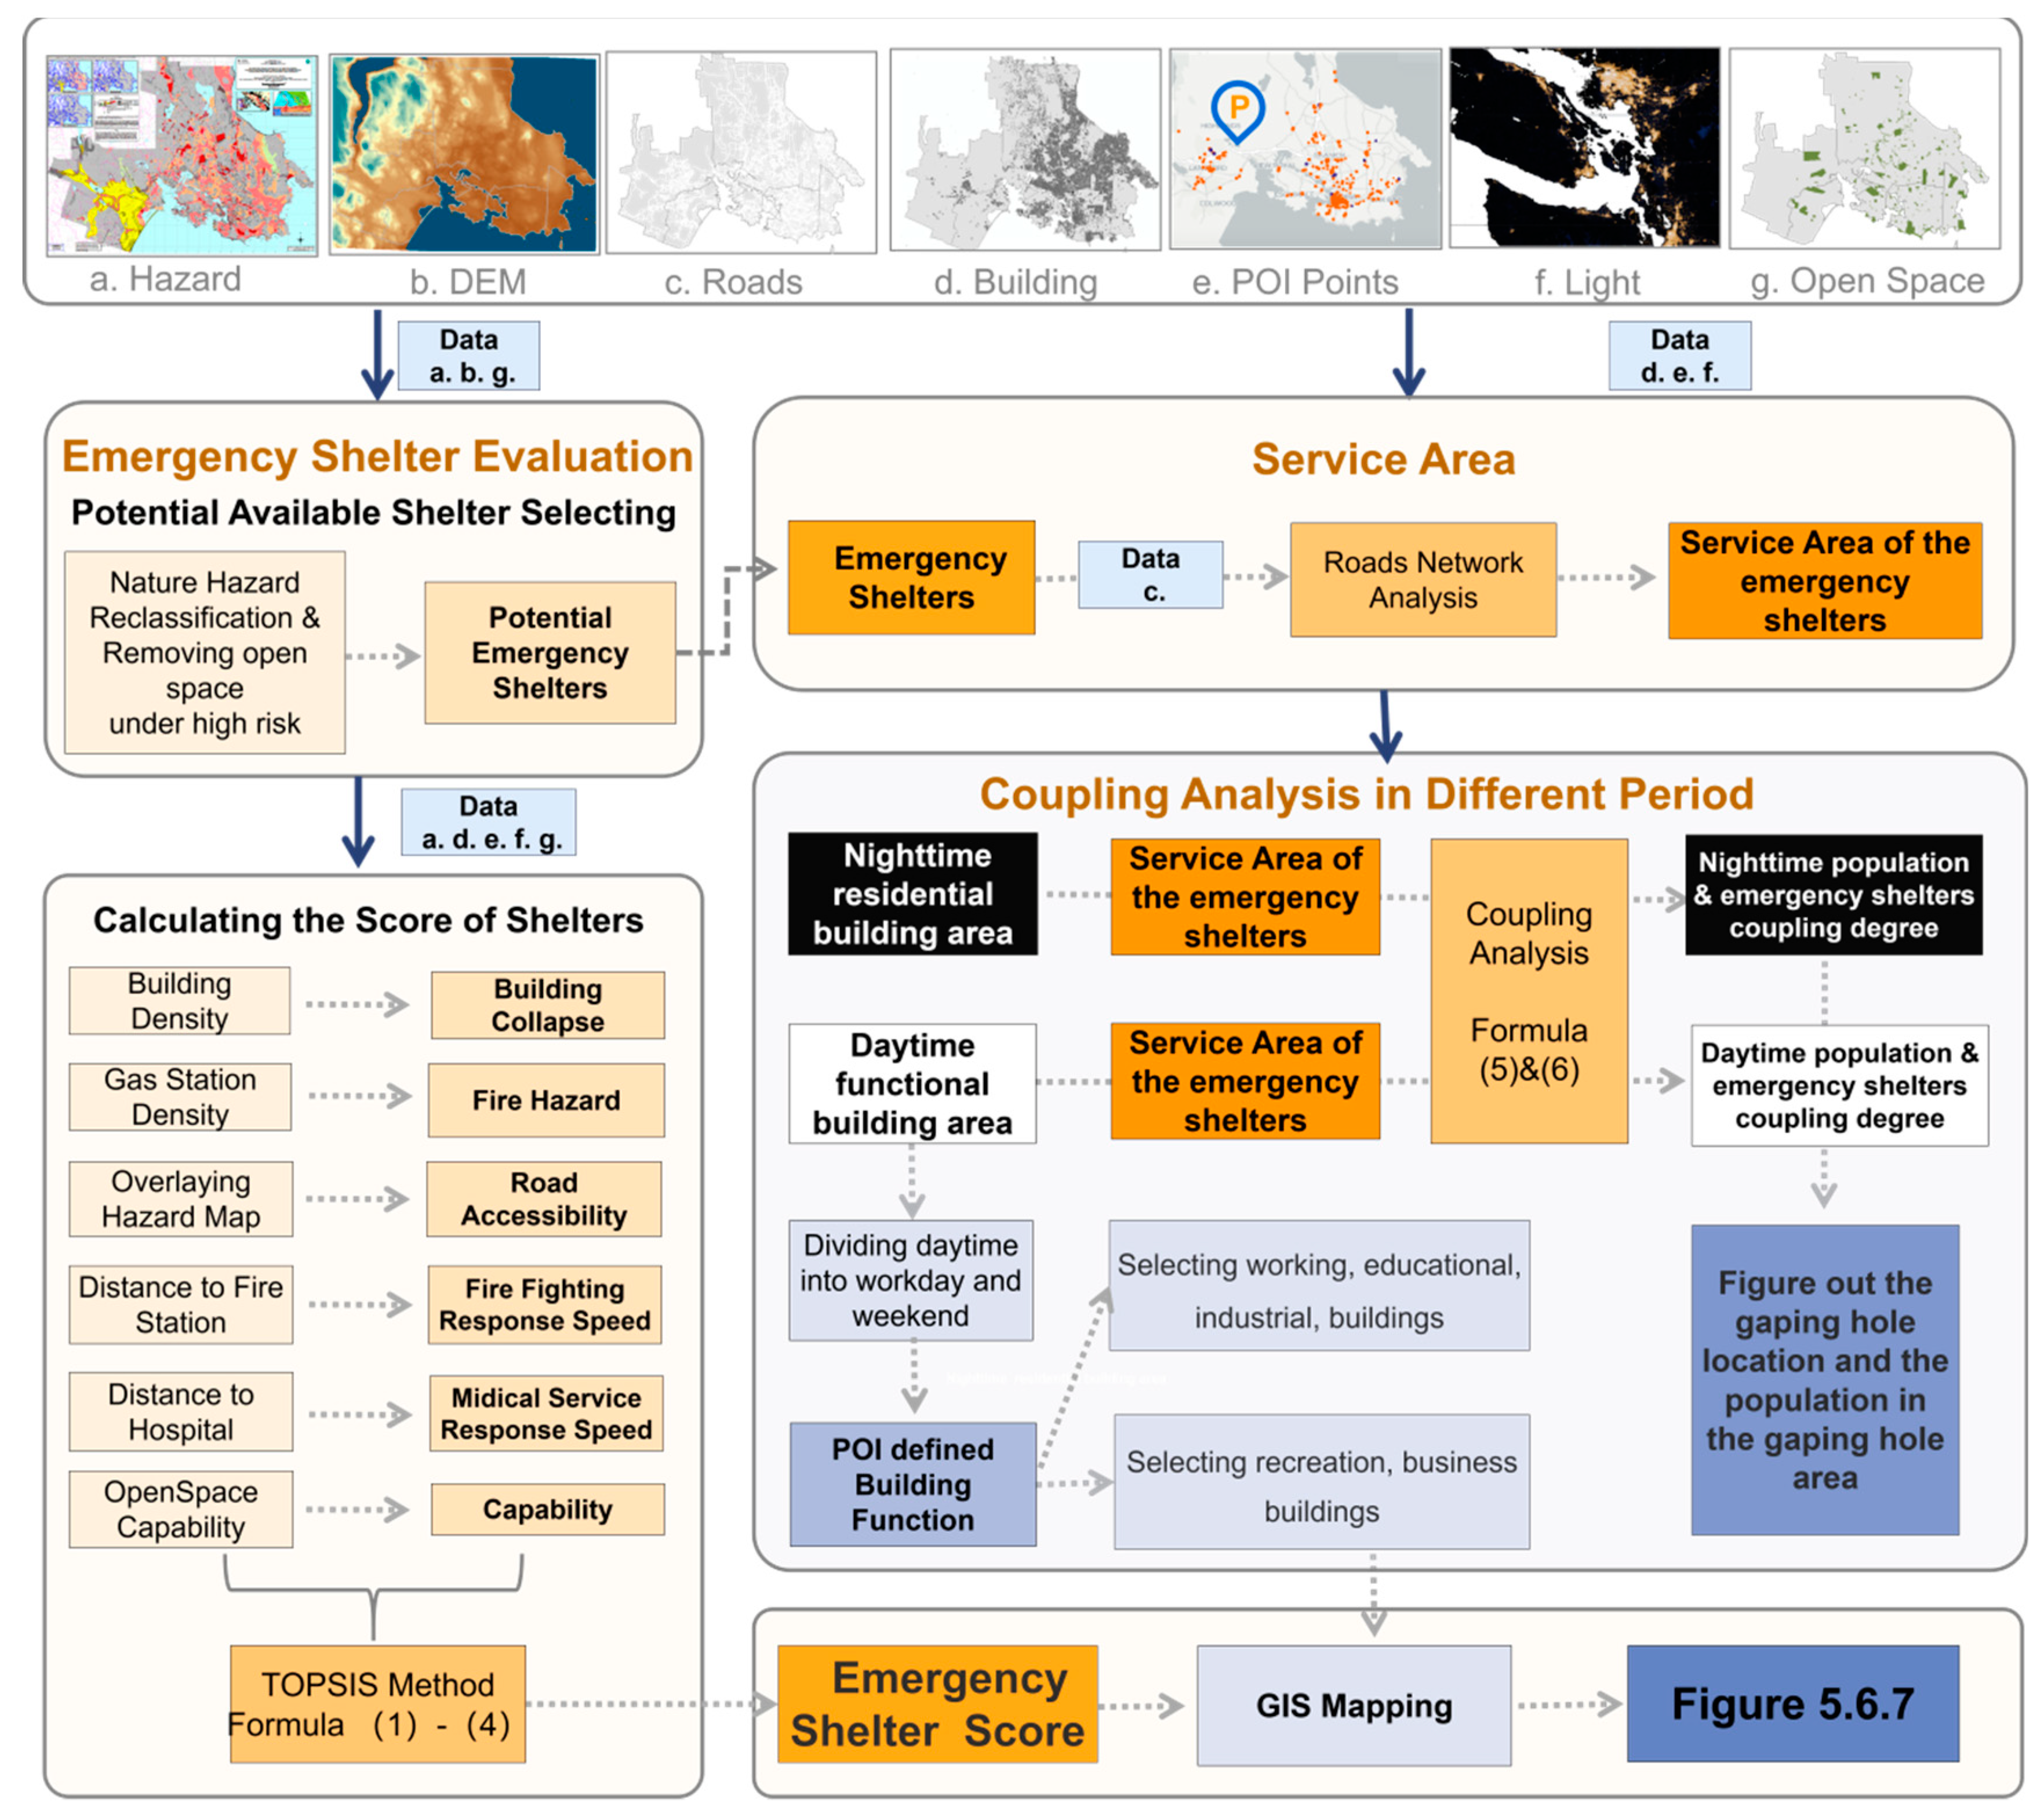
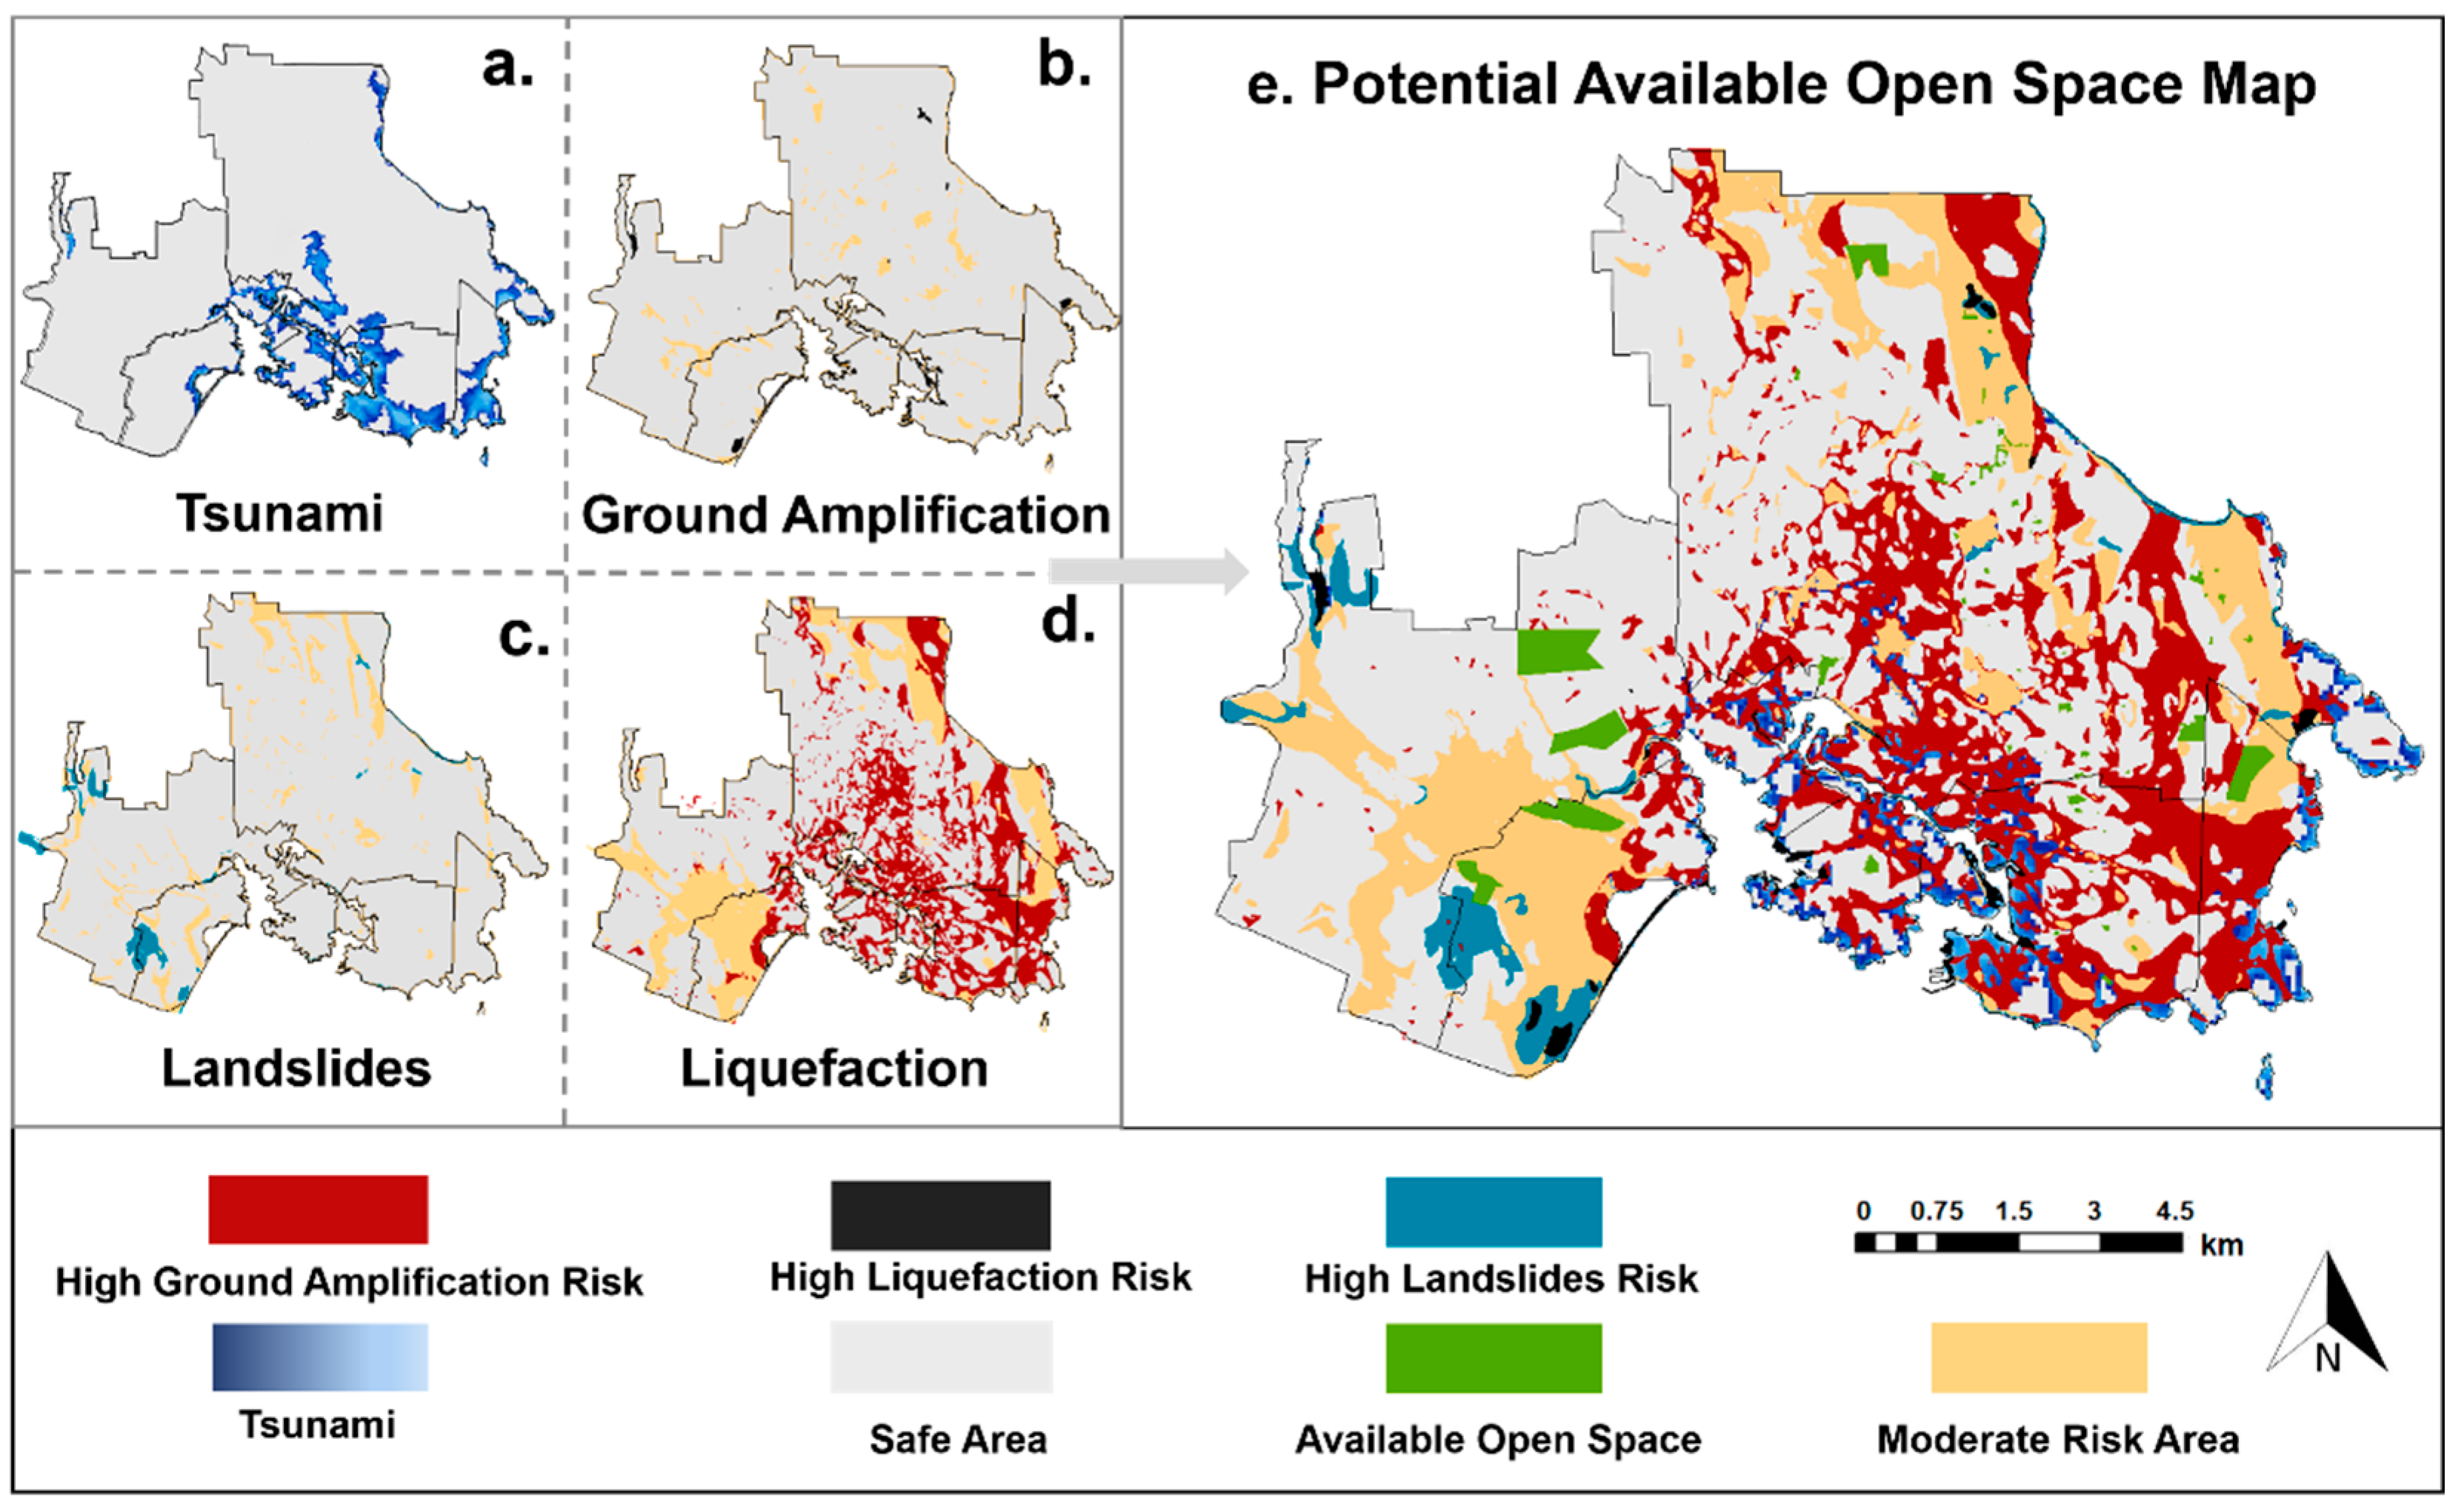
  • Criteria of Safety: People must avoid the high-risk places, such as areas at risk of building collapsing and fire. Buildings under high risks of liquefaction, ground amplification, and landslides have a high possibility of collapsing, because of the unstable geological structure [34,35]. Additionally, in Great Victoria, most individual houses are under three floors, and the wood frame structure buildings have less possibility of blocking the roads than the concrete buildings [36,37,38]. Therefore, those buildings higher than three floors and that have liquefication, high ground amplification, or a landslide risk have a high possibility of blocking the roads. The proportion of collapsing buildings within a 500-m buffer was used to evaluate the building collapsing hazard. Because the scope of gas station fire is unpredictable, the numbers of gas stations within the optimum service radius (500-m buffer) were counted to represent the fire hazard possible.
  • Criteria of Accessibility: The accessibility condition includes criteria of road accessibility and rescue response speed [23,24]. The roads layer is overlaid on the natural hazard data layer, and the road conditions are divided into high, moderate, and low risks, which are given the weight of 1, 0.5, and 0, respectively. The sum of the road length timing their corresponding weight represents the roads accessibility within the 500-m buffer. Through GIS technology, Euclidean distances from the open space to the nearest fire station and to hospitals were applied to evaluate the rescue responsible speed and rescue accessibility.
  • Criteria of Capability: Larger capacity emergency shelters have the advantage of reducing the cost of emergency resources scheduling. The area divided by the 2 square meters per person is the open space capability [14,15]. The capability may be overestimated because the capability evaluation step is simplified and the building debris does not include it. However, in the Great Victoria case study, there is no building inside of open spaces, and under the quick approach and wide-scale research this limitation is acceptable.
TOPSIS approaches provide decision support to shelter location selection, and the calculation steps are orderly listed below, as a list from Process (1)–(7). Formula (1): A decision matrix is applied to build up the model and to evaluate the effectiveness of every open space. Because the calculated criteria values have different units, they need to be transformed to a dimensionless form through a mathematics model. Formula (2): The criteria are not equally important, thus relative weights are assigned to different criteria. Due to Canada’s lack of a previous weight standard, for reference in this case the information entropy was used to determine the weight. Formulas (3) and (4): Finally, according to the distance to the worst and best alternative value, this study provides a score of the candidate sites, between 0 and 1; the higher score open space is more valuable as an emergency shelter during the post-earthquake evacuation process.
(1)
The decision matrix can be constituted of xij:
[ x 11 x 12 x 1 n x 21 x 22 x 2 n : : : x m 1 x m 2 x m n ] a
xij is the open space i evaluation value of criteria j
i: is the potential emergency shelter, where i = 1, 2, 3, …, m
j: is criteria where j = 1, 2, 3, …, n
(2)
Normalized xij to rij, so that rij is a dimensionless value:
r i j = x i j i = 1 n x i j 2
rij: the normalization score of the emergency shelter i in criteria j.
[ x 11 x 12 x 1 n x 21 x 22 x 2 n : : : x m 1 x m 2 x m n ]   nomalize   process   [ r 11 r 12 r 1 n r 21 r 22 r 2 n : : : r m 1 r m 2 r m n ]
(3)
The entropy weight coefficients calculation wj:
w j = 1 e j m j = 1 m e j
where
e j = ln n i = 1 n ( p i j × ln p i j ) .     p i j =   r i j j = 1 m r i j .     0 H i 1
tj is the entropy value, and
pij is the proportion of emergency shelter i of the total value of j.
To reduce the extreme values’ impact, the largest and smallest value are removed in the entropy weight calculation
(4)
Calculate the weighted normalized decision matrix:
[ r 11 r 12 r 1 n r 21 r 22 r 2 n : : : r m 1 r m 2 r m n ] t i j = r i j × w i j [ t 11 t 12 t 1 n t 21 t 22 t 2 n : : : t m 1 t m 2 t m n ]
(5)
Determine the worst alternative and best alternative:
Aw = {<max(tij| i = 1, 2, 3, …, m)|j J−>, <min(tij|i = 1, 2, …, m)|j∈J+>} {twj|j = 1, 2, …, n}
Ab = {<min(tij| i = 1, 2, 3, …, m)|j J−>, <max(tij|i = 1, 2, …, m)|jJ+>} {tbj|j = 1, 2, …, n}
where:
J+ is the criteria having a positive impact, and
J− is the criteria having a negative impact.
(6)
Calculate the distance between the target worst or best alternative value:
D i w = j = 1 m ( t i j t w j ) 2 D i b = j = 1 m ( t i j t b j ) 2
where
D i w :   the   distance   from   the   criteria   value   to   the   worst   alternative , and
D i b :   the   distance   from   the   criteria   value   to   the   best   alternative .  
(7)
Open space evaluation score Si:
S i = ( D i w D i w + D i b ) ( 0   S i   1 )
The score is converted to a hundred-mark system, so the full mark is 100.

4.3. Service Area and Population Distribution Coupling Analysis

To calculate the service area of the emergency shelters, it must be understood that people’s behavior influences the open space service efficiency, such as limited walking speed and choosing the familiar targets. Some researchers applied Simulex technology to simulate people’s walking speed after an earthquake; the result shows that the walking speed is between 0.5 m/s and 2 m/s [2]. Other research, using videotape data, showed that the speed is between 2.3 m/s and 3 m/s, which does not consider vulnerable groups [39]. According to previous studies, the general speed interval is between 0.5 m/s and 3 m/s, the elderly people and young children move at slower speeds, and the average evacuation speed is assumed as 1.2 m/s (4.3 km/h). This speed value is lower than the average value in this study; the service area evaluation is thus adopting a conservative approach. During an evacuation, people avoid the high-risk areas and roads so that the high-risk roads are removed before processing the network analysis. A GIS-based network analyst tool was used to determine the theoretical 15-min service area.
(1)
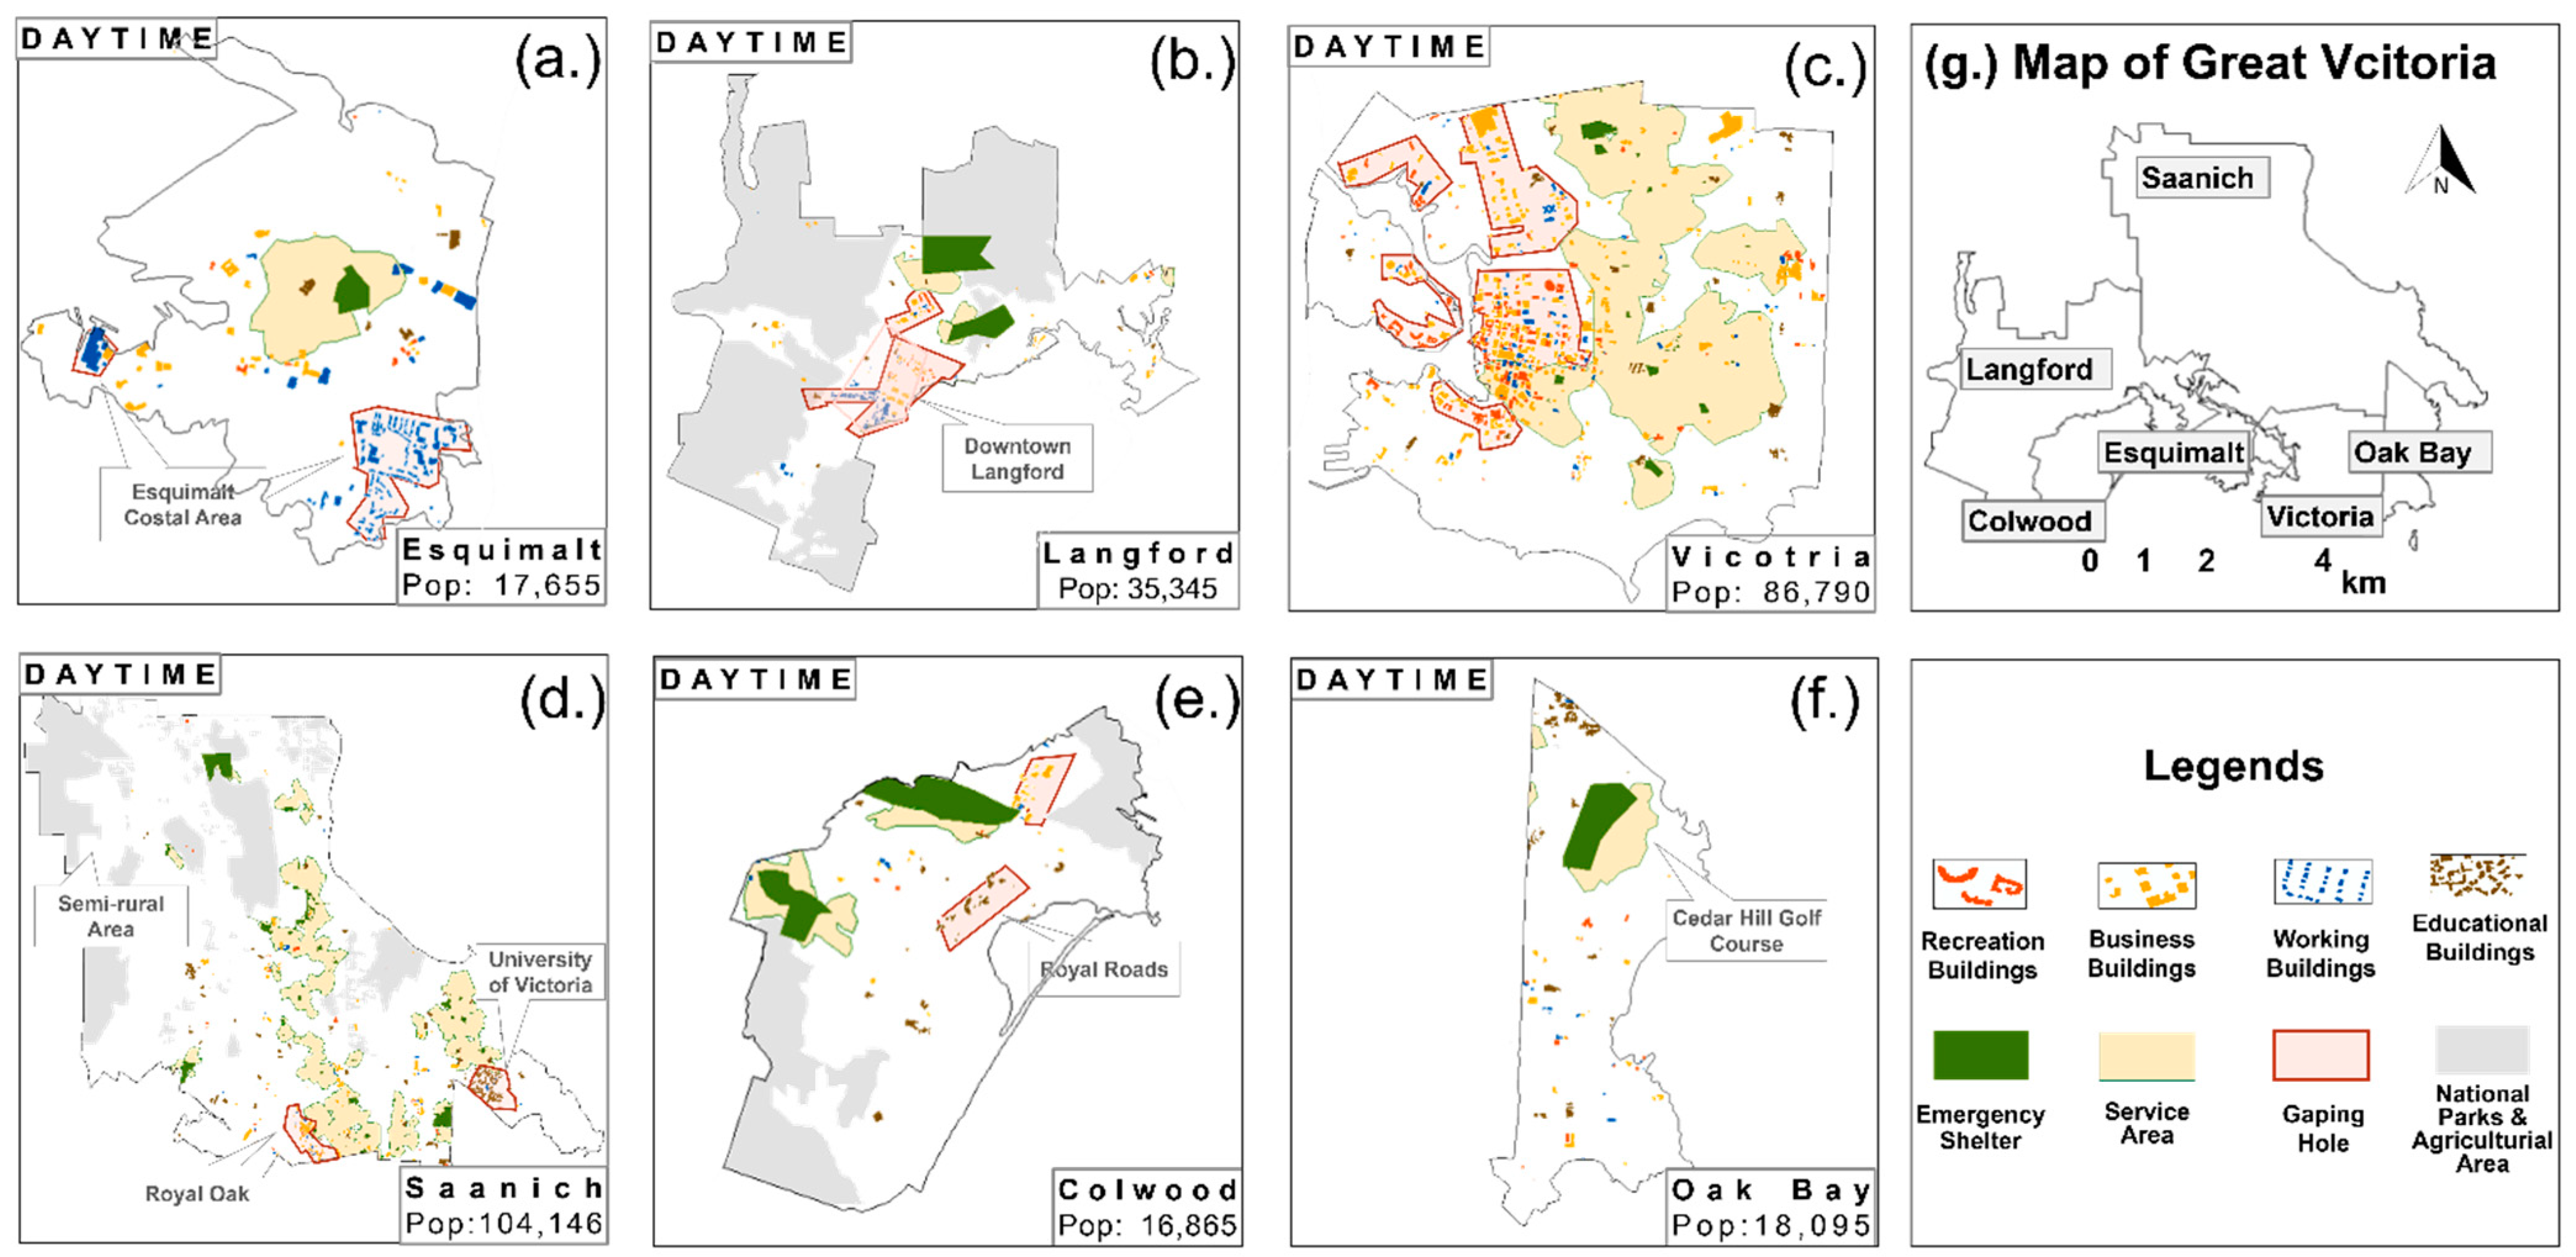
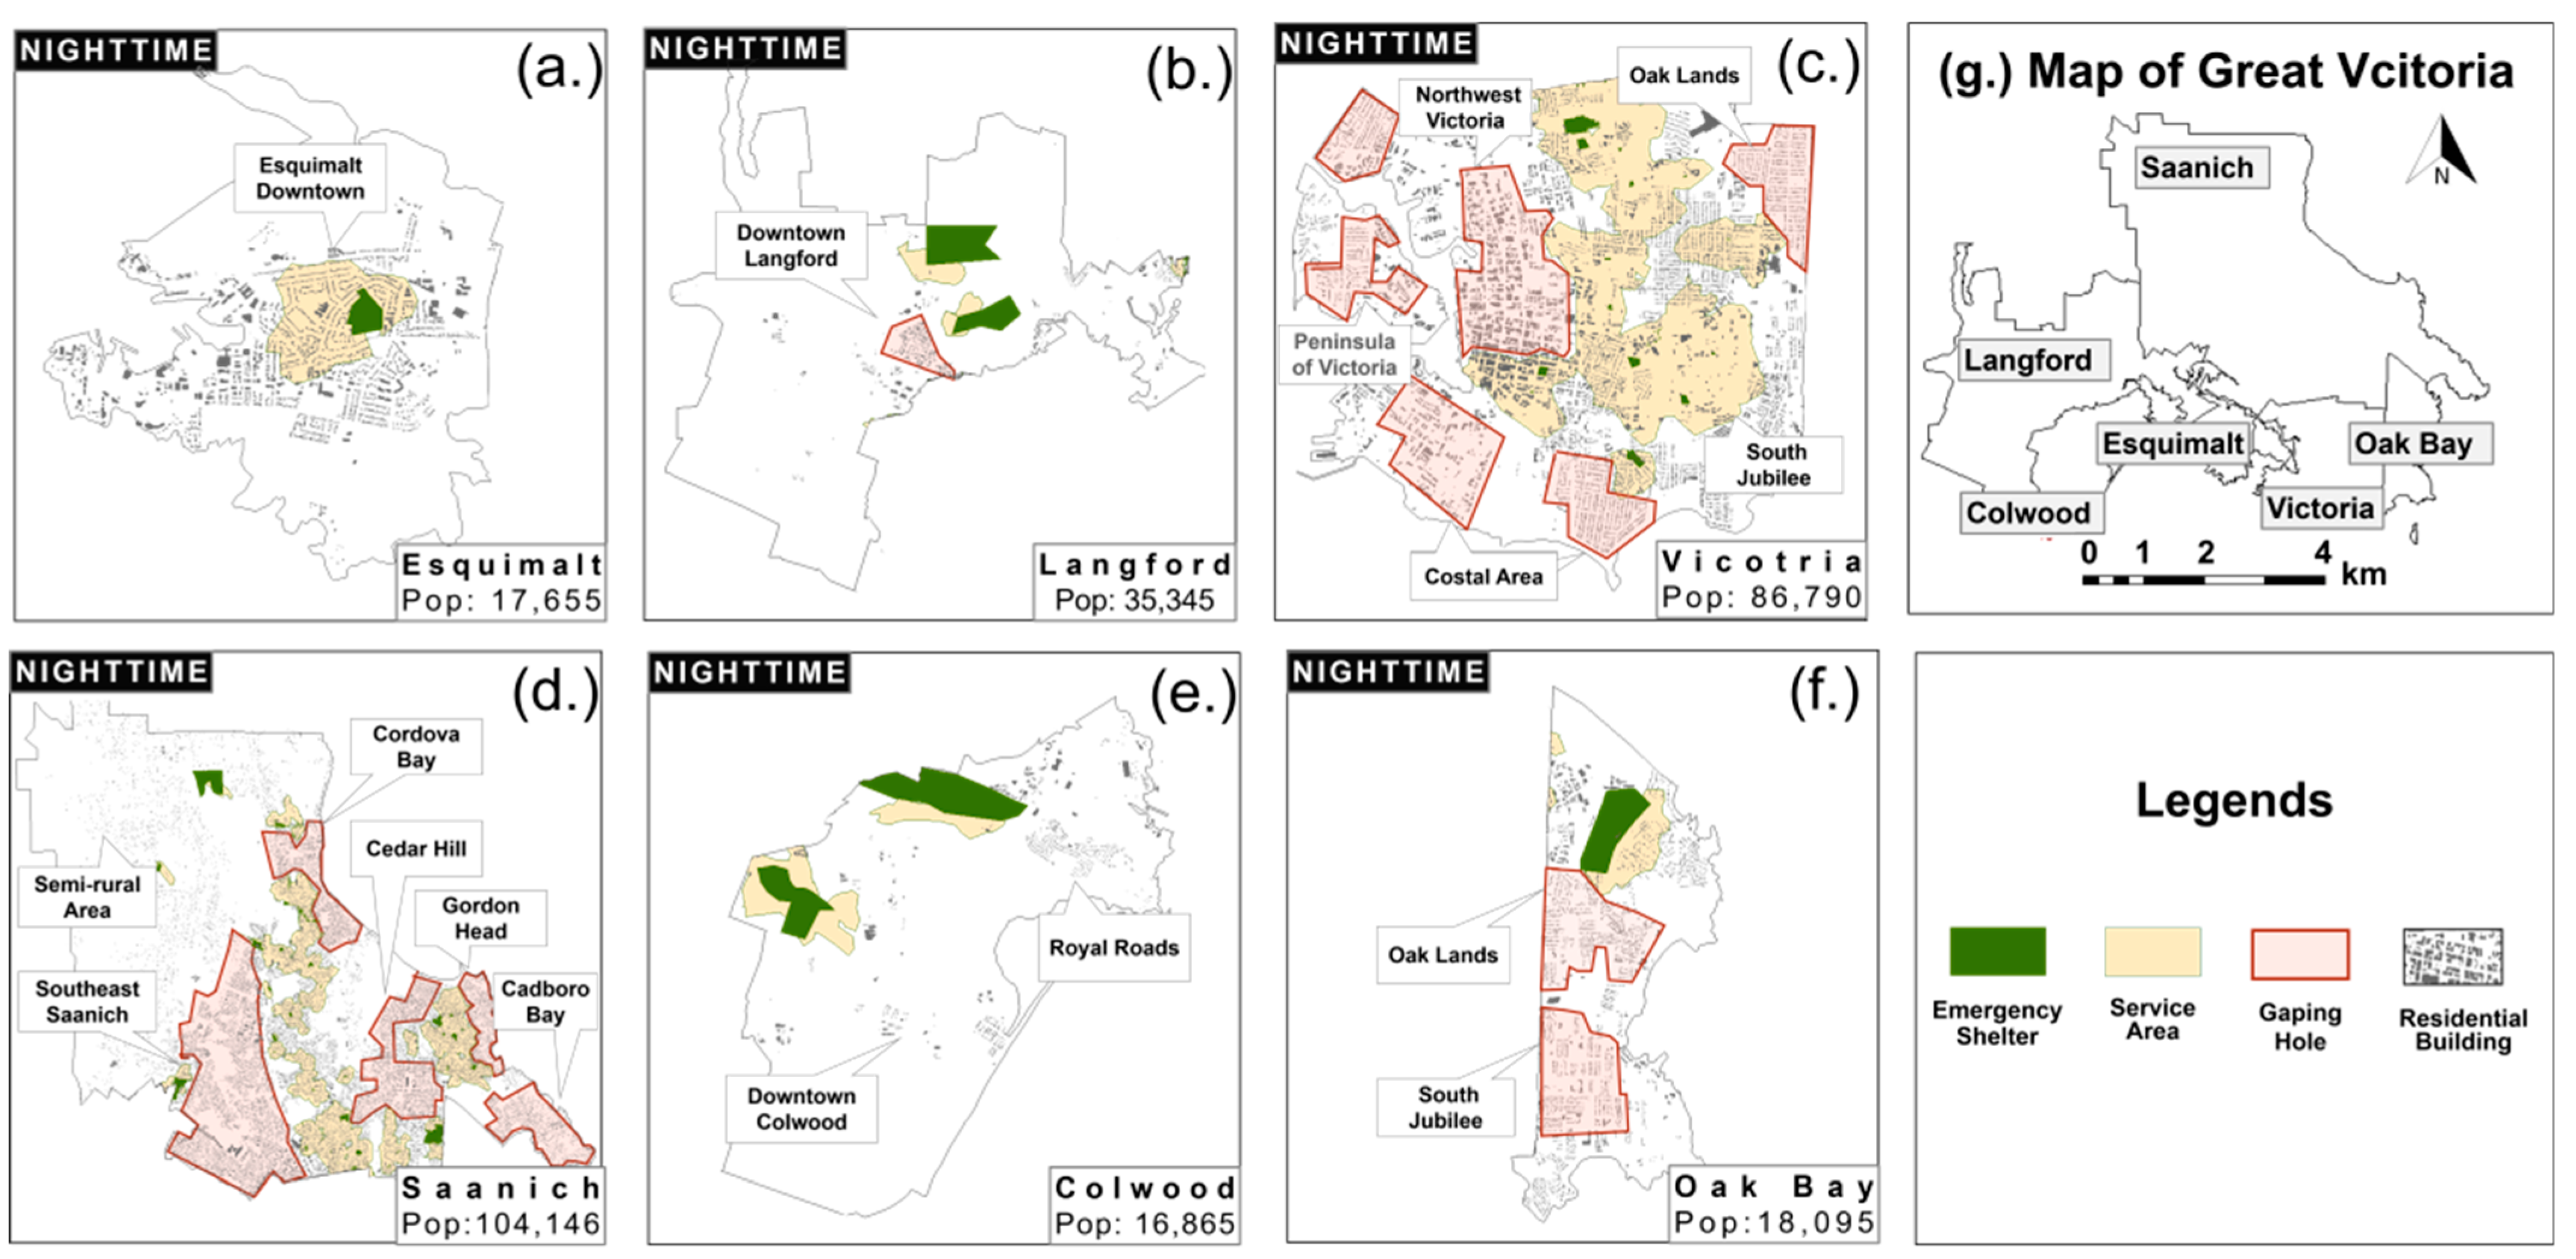
The coupling analysis is a quantity analysis that represents how the emergency shelter service area matches the population distribution [30,39]. Given the service area, the buildings in the service area compared with the total building area can represent a coupling degree. The population in the service area can be estimated according to the coupling degree. The opposite of coupling, the high building density functional zoning but without any emergency shelter, is defined as a gaping hole area. The calculation of the gaping hole method is similar to the coupling degree, which is the proportion of the building area in the gaping hole area of the total district building area. Some functional areas are hotspots that attract a large population in some period. Through the spatial join method, the building functions are defined by using POI data: educational buildings (including some art school, interest training organizations, etc.) and working buildings (e.g., office blocks, factories, etc.), business buildings (e.g., shopping mall, individual shop, etc.), recreation buildings (e.g., restaurants, board game bar, museums, antique stores, etc.), and residential buildings (e.g., house, apartment, condo, etc.). Combining the service area and population distribution results, the gaping hole also can be founded. The proportion of the building area in the service area of the total district building area, value c in Formula (5), represents the coupling degree or the proportion of the gaping hole. Next, Formula (6) calculates the population of the service area or of the gaping hole. The formulas are shown below: The estimation of the coupling degree or the proportion of gaping hole in the district:
c = x = 1 n l a y e r s   o f   b x × a r e a   o f   b x   t o t a l   b u i l d i n g   a r e a   o f   t h e   d i s t r i c t
In the day time, bx are all functional buildings, therefore all buildings except residential buildings are included to calculate the coupling degree. In the night time, light data are used to remove the vacant houses in the suburban area where the value digital number value is 0, and only bx are residential buildings. The buildings bx in the gaping hole estimation calculate the proportion of the gaping hole.
(2)
The number of people in the service area or in the gaping hole area:
P = c × district   total   population

5. Results

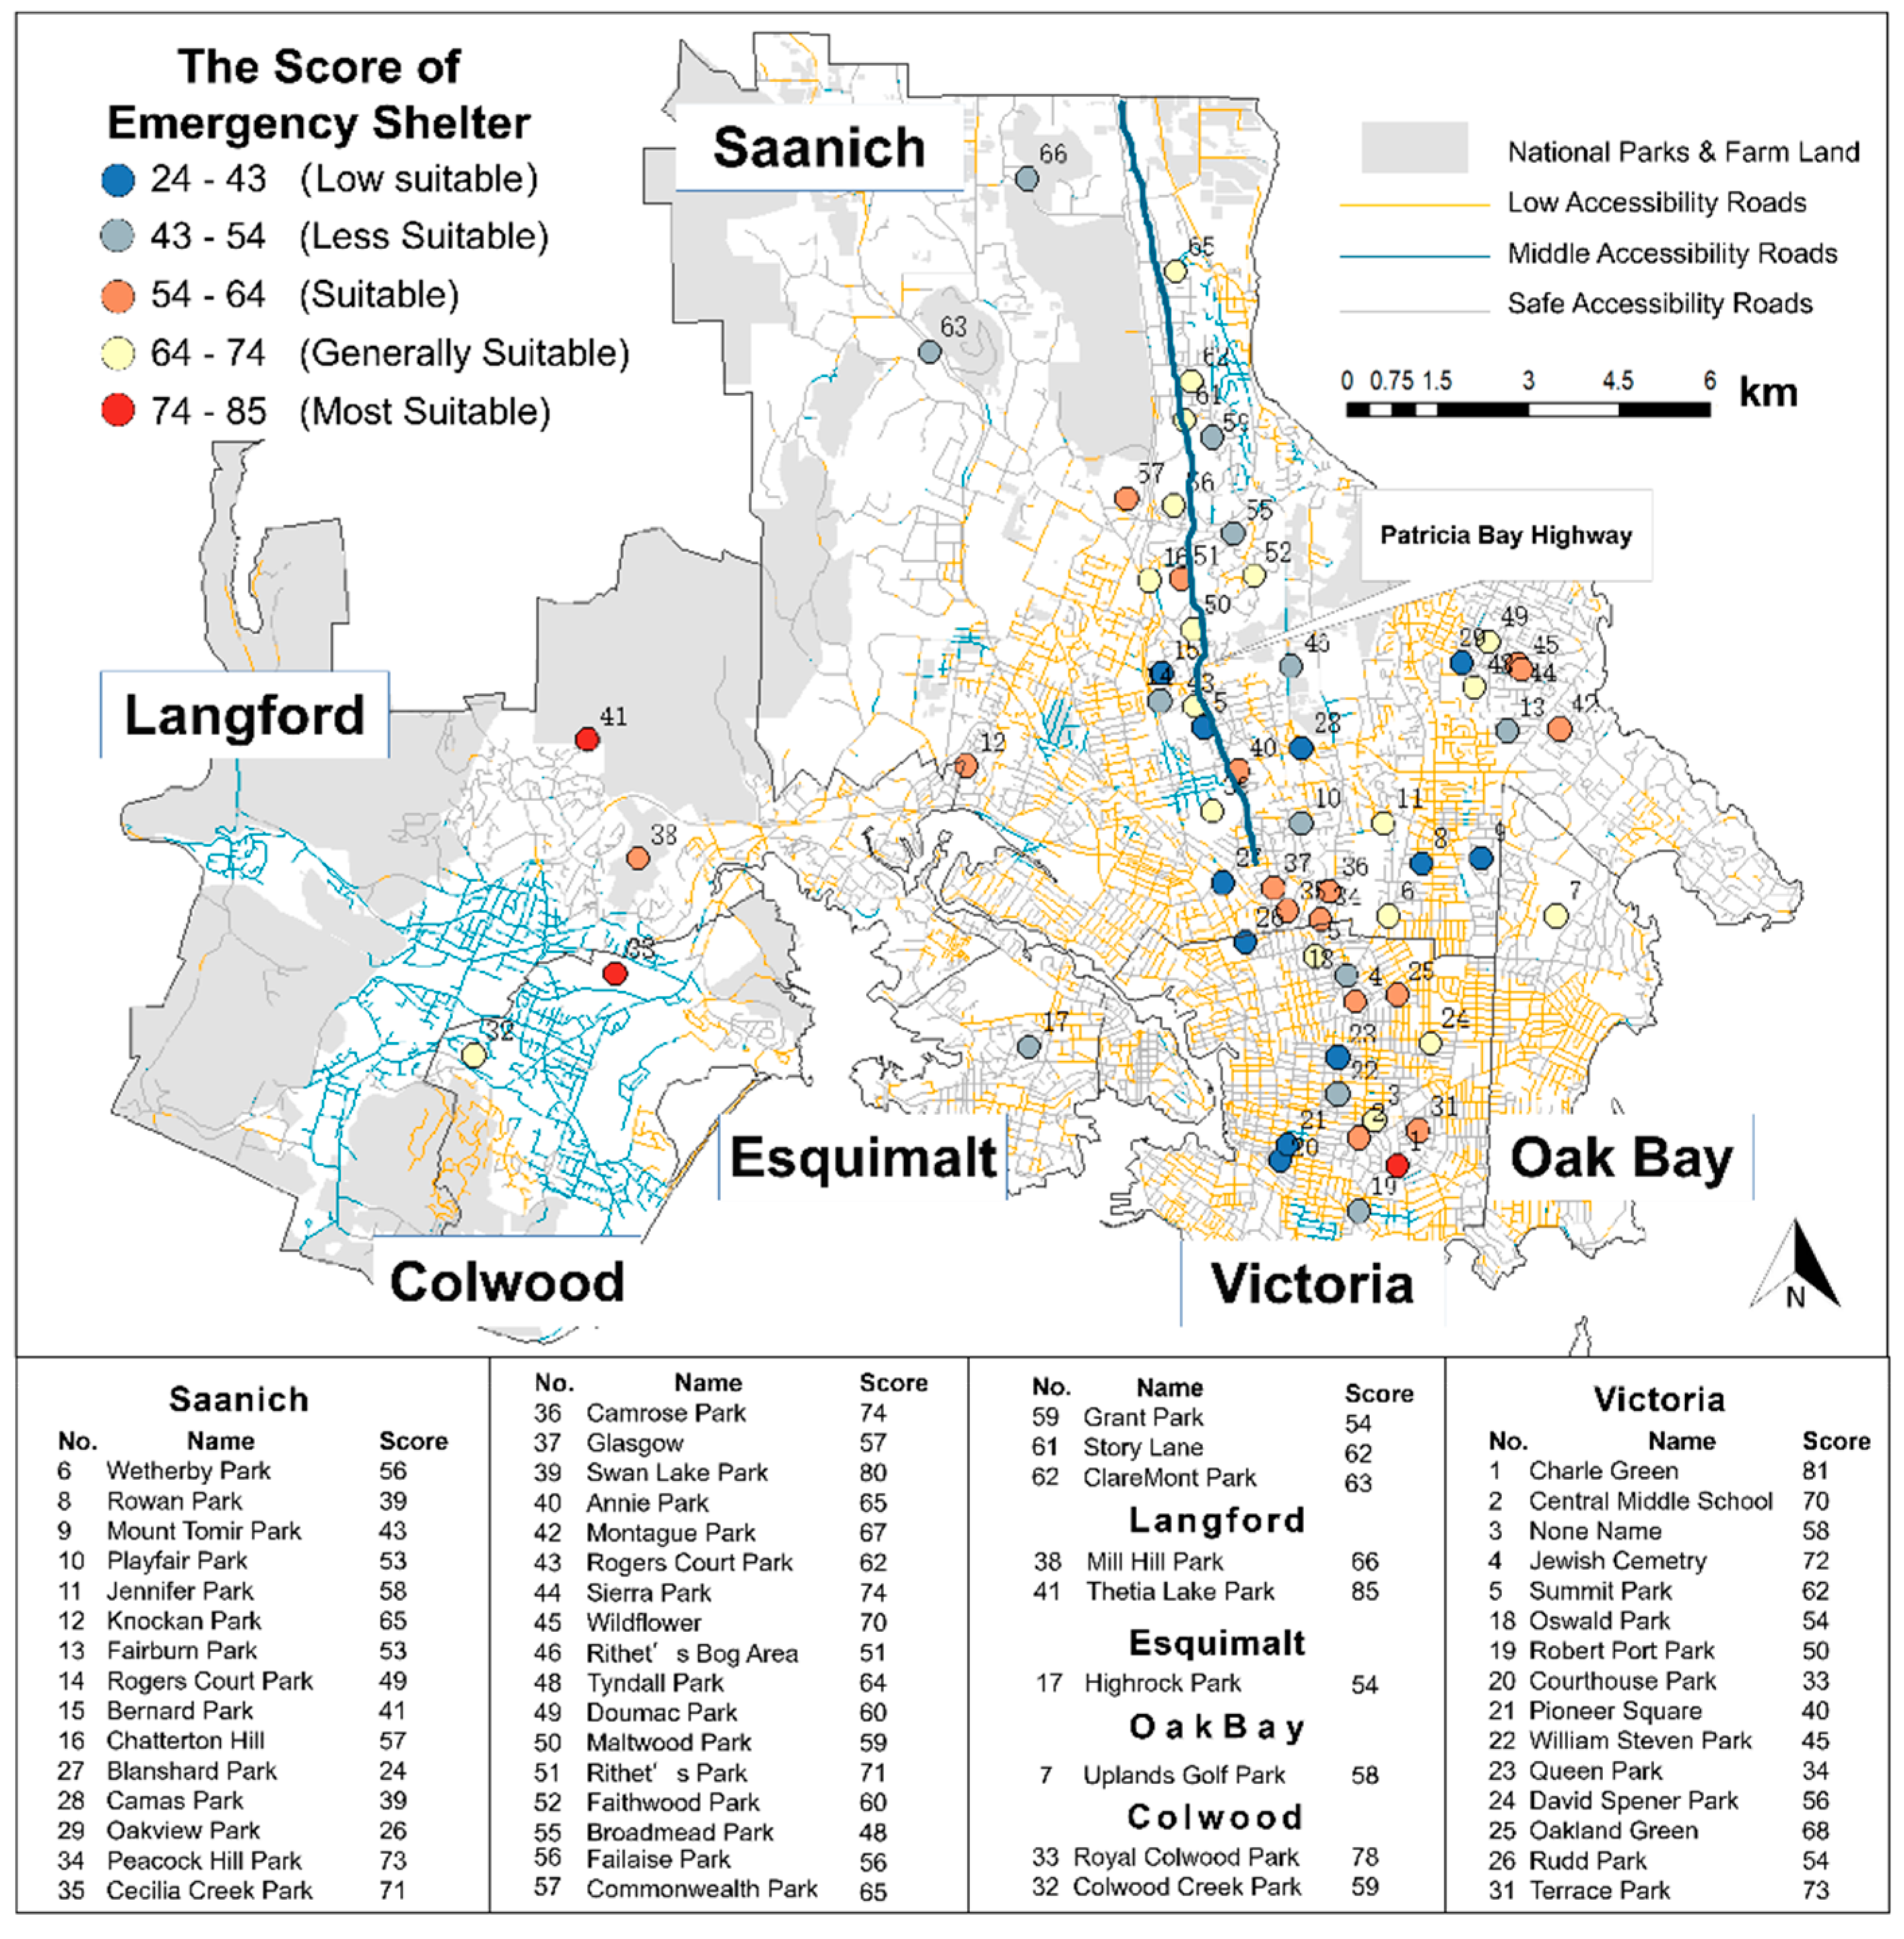
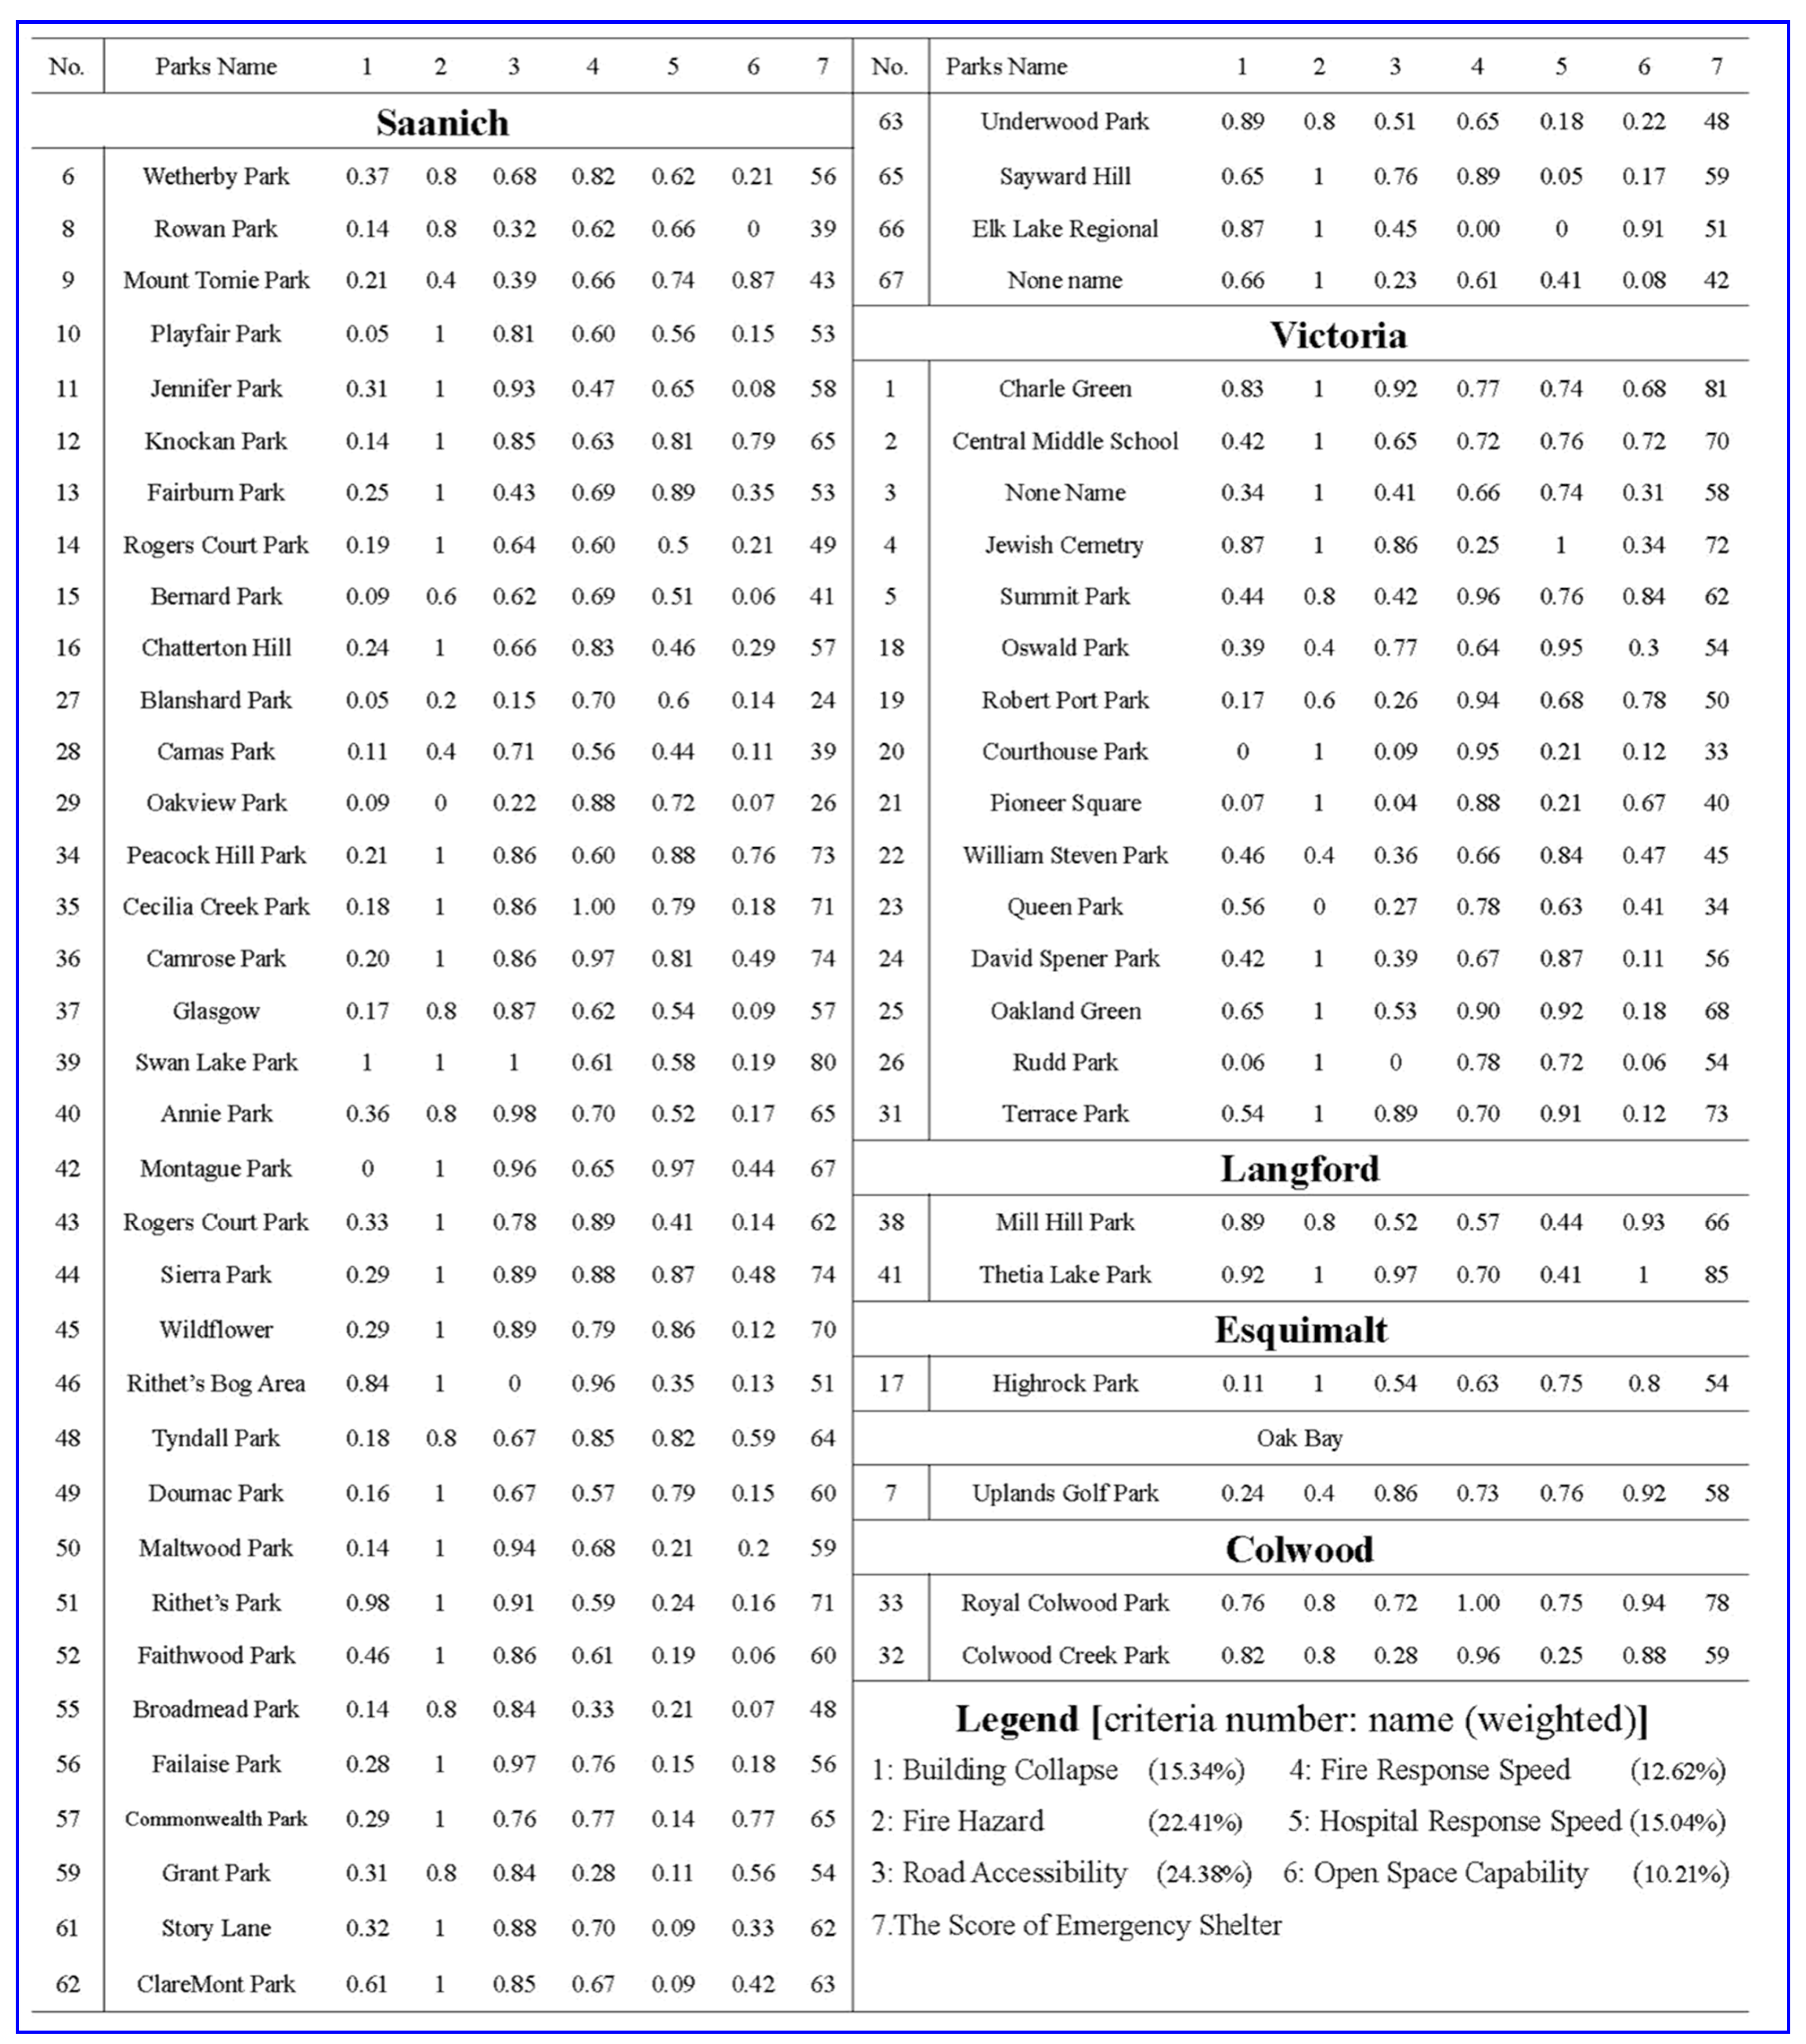
5.1. The Emergency Shelter Evaluation Score

There are a total 375 public open spaces in Great Victoria, and 60 of them are available as earthquake emergency shelters. Emergency shelters must meet the basic security requirements to be safer than roads, indoor spaces, and densely built areas. People should avoid evacuating to the other 315 open spaces, which may seem safe and open but are high-risk areas (Figure 5). Each of the open spaces has a score; in order to simply represent the availability of emergency shelters, the evaluation scores were assigned into 5 categories, using the natural breaks classification method. A decision value from a low to a high level means that the open space is less suitable to very suitable as an emergency shelter, respectively (detailed information in Figure A2).
As Figure 5 shows, Saanich, the largest municipality, has the most emergency shelters, with 39 emergency shelters covering 1,111,865 m2 and 15 of them are classified as low or less suitable conditions. The high fire risk and low rescue responding speed are two main reasons reducing the values of the emergency shelters. Victoria has 15 open spaces (114,398 m2) that can be used as emergency shelters, generally uniformly distributed among communities, such as Fernwood, Oakland, and Downtown. All emergency shelters areas in Victoria are small, which is disadvantageous in a densely populated district. High Rock Park is the only emergency shelter available in Esquimalt (64,514 m2), which is large in size and in the central area. As the highest point in Esquimalt, the landform reduces its accessibility. Fortunately, rescue response is high in this region, which may reduce casualties. The Langford and Colwood emergency shelters’ surrounding areas are undeveloped, which offer outstanding accessibility and capability. They are high value emergency shelters, but they are far from the urban area so that they may have a low using efficiency. In Oak Bay, the shelter is in the northern part, but far from some of the populated coastal communities; it is a golf course (64,514 m2), so although its safety and accessibility are high, the surrounding areas’ functions mainly serve the purpose of golfing.

5.2. Service Area and Day Time Population Coupling

Due to the limitations associated with social and environmental conditions, the distribution of emergency shelters in different districts is uniform. Gaping holes are evident without open space available for use as emergency shelters, increasing the levels of evacuation uncertainty and risk.
As Figure 6 and Table 1 shows, Saanich has the largest service area and the highest population coupling degree (8.1%) during the daytime. Some 49.4% of the people are in the gaping hole; one such hole is the University of Victoria, where students are concentrated during weekdays. Another is Royal Oak, which has some shopping centers where people are concentrated on weekends. Emergency shelter service areas are highly overlapping in Victoria. There are five gaping holes in Victoria, covering 76.3% of the people, and the largest gaping hole is in the downtown area where is the center of business, recreation, and works. Therefore, whether it is weekdays or weekends, downtown Victoria always has a high population density. There is likewise a recreation hotspot associated with kayaking clubs. Because evacuation risk is unpredictable when people are on the water, it can be considered as a high-risk point. People living in or traveling the peninsula border of Esquimalt cannot reach a proper emergency shelter within 15 min. The coupling degree of Oak Bay is 0 because the golf course surrounding area has no functional buildings. The whole Oak Bay district has very limited functional buildings, and scattered working offices or recreation centers are in the southern part. There are some industrial parks in Esquimalt and Langford; therefore, on weekdays, the working zone is more likely to be densely populated. Langford downtown has no emergency shelter available, so it has the largest proportion of people in the gaping hole (83.9%). Colwood has the lowest population, and what is more, service areas are in sub-central areas of the districts, further reducing service availability.

5.3. Service Area and Nighttime Population Coupling

Figure 7 and Table 2 show the nighttime population distribution and emergency shelter coupling degree. In Saanich, people in the gaping holes and service areas are similar, both around 30%. Around 40% of the people live in the semi-rural area, where the buildings are mainly individual houses and scattered around the farmland or national parks. Southeast Saanich has the largest gaping hole, which are mostly apartment buildings; therefore, it is the least vulnerable to any type of earthquake disaster and effect. Nearly 45% of the people in Victoria can get to emergency shelters on time. The riskiest region is from downtown to northwest Victoria, and the peninsula of Victoria, because of the high apartment building density. Esquimalt has the highest coupling degree, and there is no gaping hole because the emergency shelter is in the central downtown area, and the coastal residential are mostly individual houses. Oak Bay golf course covers 12.4% residential population at night; however, around 80% live in the southern part and are in the gaping hole. As an aging community with a long coastal line, Oak Bay has the highest pressure of emergency evacuation after an earthquake. Langford and Colwood have a high score of emergency shelters but the lowest coupling degree. Especially in Langford downtown, over 90% of people are in the gaping hole.

6. Discussion

6.1. Spatial and Temporal Distribution of Emergency Shelters

In general, Langford, Colwood, and Oak Bay lack open spaces as emergency shelters although their scores are high. Esquimalt has better evacuation conditions than the other districts because of the shelter in the central urban area. The only disadvantage is the low accessibility, which leads to some people in the coastal area needing more time to get to the shelter. The emergency shelters in Victoria downtown are mostly of low suitability. The east part of the Victoria emergency shelter areas has the characteristics of being small, with a high score, and equally distributed. In Saanich, emergency shelters are along the Patricia Bay Highway. The fire hazard and low rescue responding speed are the main reasons that some shelters have low scores.
The population distribution and service area coupling degree in the night time are higher than in the day time, and the weekend coupling degree is better than the workdays degree. Because the working areas are normally with a high building density and lacking greening space or playgrounds, they become areas with the highest risk. Business and recreational areas attract more people on weekends. From Victoria downtown to Saanich uptown, the central belt of business and recreational facilities should be highlighted as a gaping hole. To be more specific towards a district-level evaluation, the north part of Saanich has only a few emergency shelters; it is a thinly populated, semi-rural area mainly occupied by agricultural land where people can safely evacuate [34]. The gaping holes in Saanich are in the southeast part—the greater Victoria sub-center—where no open space is available as an emergency shelter. There are three high-risk gaping holes in Victoria: Peninsula of Victoria, Victoria downtown, and northwest Victoria, due to the high population density in both the day time and at night. Esquimalt, being a peninsula, and Oak Bay, with its long coastal line, are both relatively isolated areas whose seaward facing may increase evacuation pressure. In Langford and Colwood, the developed urban area has no available open spaces suitable for use as emergency shelters, allowing only limited support of post-earthquake evacuation. The industrial parks of Langford correspond to gaping holes. Accordingly, if an earthquake happens on a weekday, people in these districts are at high evacuation risk.

6.2. Suggestions for Future Planning

Due to the limitations of historical city planning, a lack of urban disaster mitigation plans, and the social gap among different districts, urban emergency shelters are not included in the disaster prevention plans of greater Victoria. The open spaces used for early self-evacuation in greater Victoria have been evaluated based on the criteria scores (Figure A2), which provide an overall picture for decision makers. Based on the results of this study, some insights, limitation, and suggestions can be provided to guide decision makers in making plans. Four points summarize the general evacuation conditions and suggestions:
  • This study shows that in Great Victoria, public open spaces are an available resource for emergency sheltering during post-earthquake self-motivated evacuations. Emergency shelters can make up for shortages in existing shelters, releasing evacuation pressure, and reducing casualties. Furthermore, across the whole western coastal area of Canada it is also possible to apply open spaces as earthquake emergency shelters.
  • Although the evaluation scores of the emergency shelters differ, they are all valuable for supporting evacuation. Highly scoring emergency shelters should be retained and developed carefully to take full advantage of them. By fully using these emergency shelters, the cost of evacuation planning can be reduced, consistent with the principle of integrating daily facilities with disaster prevention facilities.
  • Residents can use the evacuation conditions map to find the nearest available safe place that can serve as an emergency shelter; they should stay in emergency shelters and wait for future rescue and relocation arrangements. Decision makers should also improve the whole first-time evacuation plan, focusing on high-risk gaping holes and densely populated areas.
  • Evacuation plans should reflect population distribution dynamics, distinguishing and considering differences between day and night, weekday, and weekends. Therefore, the population concentrated in different areas, such as offices, industries, schools, etc. (weekdays), recreation places, business, etc. (weekends), and residential (night), are different during different time periods. A population simulation can be introduced to estimate the population dynamics distribution [40]. Planners should pay more attention to this issue in the future.

6.3. Limitations and the Next Improvement

There are not only limitations in this contribution as mentioned in the methods, but also some limitations of the data resource and evaluation methodology. Due to the limited nature of the open resource data, some types of the earthquake effects and secondary disasters, such as debris and flooding, are underestimated. They are not high risks in this study but may highly influence other cities. Since the building data cannot support the debris simulation, the capability estimation is only acceptable under the quick approach and wide-scale conditions. In the aspect of methodology, since Canada lack research on emergency shelters, there is no reference in evaluating the open space as emergency shelters either. The entropy weighted method is based on the data itself, and it loses sight of how the social rules influence the evacuation behaviors. In sociology-related evaluation research, the professional grading by Canadian sociologists and policy makers is also necessary to include. Although the criteria selected in this study are applicable to most areas in Canada, still some criteria are ignored; for example, the gradient of the emergency shelter. In the hilly cities, some open spaces are built on rough ground, which can reduce their capability. Finally, because Canada lacks emergency shelter planning, the real usage efficiency of the emergency shelters cannot be estimated. We suggest that the signage needs to be built up near by the high-value emergency shelters. Sociologists can use this study results to further simulate human behaviors in the post-earthquake evacuation process. The evacuation simulation can be applied to further understand the possible shelter disadvantages of the surrounding environments. It also would be interesting to explore the Google thermal population thermal graphic, possibly applying it to the emergency evacuation plan making.

7. Conclusions

This study provides a first-time self-motivated post-earthquake emergency shelter evaluation model for Canada, which can be applied to most North American cities on the seismic belt. Public open spaces are used as emergency shelters, providing a clear safe evacuation destination for the public while taking full advantage of the open spaces. The advantages and disadvantages of each district are outlined so that the planners and decision makers can devise customized plans. Second, although Canadian geologists have conducted some research into earthquake prediction and hazard evaluation, meaningful scientific results have not been implemented for practical urban planning. Previous urban planning of greater Victoria has been limited by a lack of understanding of the open spaces’ potential for use as emergency shelters, which may lead people to evacuate to high-risk open spaces that seem safe. A straightforward location map of open space shelters provides the public with escape destinations, aiding evacuation while reducing rescue time and casualties. Third and last, to overcome the limitations of traditional data, we introduce POI data and nighttime light data to improve the accuracy of the criteria evaluation model. Meanwhile, by taking advantage of Google’s API, we can extend the big data source while reducing the technical barriers and costs associated with future studies.

Author Contributions

Conceptualization, Yibing Yao and Yuanzhi Zhang; Data curation, Yibing Yao and Yuyang Zhang; Formal analysis, Yibing Yao, Taoyu Yao and Kapo Wong; Investigation, Yuyang Zhang and Taoyu Yao; Methodology, Kapo Wong and Yuanzhi Zhang; Resources, Jin Yeu Tsou; Software, Jin Yeu Tsou; Supervision, Jin Yeu Tsou and Yuanzhi Zhang; Writing—review & editing, Yuanzhi Zhang. All authors have read and agreed to the published version of the manuscript.

Funding

This study was financially supported by the National Natural Science Foundation (U1901215), the Marine Special Program of Jiangsu Province in China (JSZRHYKJ202007), the Natural Scientific Foundation of Jiangsu Province (BK20181413), and the National Key Research and Development Program of China (Project Ref. No. 2018YFC1407200, 2018YFC1407203, and 2016YFC1402003), and the State Key Lab Fund for Geological Processes and Mineral Resources (2016).

Acknowledgments

Field measurements and data collection from the local government in Canada are highly appreciated.

Conflicts of Interest

The authors declare no conflict of interest

Appendix A

The data presented in this study are openly available online reference number [41,42,43,44,45,46,47].
Figure A1. The Data List.
Ijgi 10 00063 g0a1
Figure A2. The Emergency Shelters’ Scores.
Ijgi 10 00063 g0a2

References

  1. Luo, J. Feasibility analysis and research on library as a disaster emergency shelter. J. Catastr. 2019, 34, 181–186. [Google Scholar]
  2. Wang, J. Residential Refuge Circle; Southeast University Press: Nanjing, China, 2016; pp. 3–45. [Google Scholar]
  3. Dunford, M.; Li, L. Earthquake reconstruction in Wenchuan: Assessing the state overall plan and addressing the ‘forgotten phase’. Appl. Geogr. 2011, 31, 998–1009. [Google Scholar] [CrossRef]
  4. Liu, Q.; Ruan, X.; Shi, P. Selection of emergency shelter sites for seismic disasters in mountainous regions: Lessons from the 2008 Wenchuan Ms 8.0 Earthquake, China. J. Asian Earth Sci. 2011, 40, 926–934. [Google Scholar] [CrossRef]
  5. Kılcı, F.; Kara, B.; Bozkaya, B. Locating temporary shelter areas after an earthquake: A case for Turkey. Eur. J. Oper. Res. 2015, 243, 323–332. [Google Scholar] [CrossRef]
  6. Tai, C.A.; Lee, Y.L.; Lin, C.Y.; Ishii, H. Earthquake evacuation shelter feasibility analysis applying with GIS model builder. In Proceedings of the 40th International Conference on Computers & Industrial Engineering, Awaji, Japan, 25–28 July 2010; pp. 1–6. [Google Scholar]
  7. Wei, Y.; Jin, L.; Xu, M.; Pan, S.; Xu, Y.; Zhang, Y. Instructions for planning emergency shelters and open spaces in China: Lessons from global experiences and expertise. Int. J. Disaster Risk Reduct. 2020, 51, 101813. [Google Scholar] [CrossRef]
  8. Zhao, X.; Xu, W.; Ma, Y.; Qin, L.; Zhang, J.; Wang, Y. Relationships between evacuation population size, earthquake emergency shelter capacity, and evacuation time. Int. J. Disaster Risk Sci. 2017, 1, 457–470. [Google Scholar] [CrossRef] [Green Version]
  9. Yun, L. The Planning and Construction of Urban Disaster-prevention Parks in Japan after the Hanshin Awaji Earthquake. Chin. Landsc. Archit. 2007, 7, 3–15. [Google Scholar]
  10. Kaveh, A.; Javadi, S.M.; Mahdipour, R.M. Emergency management systems after disastrous earthquakes using optimization methods: A comprehensive review. Adv. Eng. Softw. 2020, 149, 102885. [Google Scholar] [CrossRef]
  11. Boonmee, C.; Arimura, M.; Asada, T. Facility location optimization model for emergency humanitarian logistics. Int. J. Disaster Risk Reduct. 2017, 24, 485–498. [Google Scholar] [CrossRef]
  12. Anhorn, J.; Khazai, B. Open space suitability analysis for emergency shelter after an earthquake. Nat. Hazards Earth Syst. Sci. 2015, 15, 789–803. [Google Scholar] [CrossRef] [Green Version]
  13. French, E.L.; Birchall, S.J.; Landman, K.; Brown, R.D. Designing public open space to support seismic resilience: A systematic review. Int. J. Disaster Risk Reduct. 2019, 34, 1–10. [Google Scholar] [CrossRef] [Green Version]
  14. Chou, J.; Ou, Y.; Cheng, M.; Lee, C. Emergency shelter capacity estimation by earthquake damage analysis. Nat. Hazards. 2013, 65, 2031–2061. [Google Scholar] [CrossRef]
  15. Trivedi, A.; Singh, A. Prioritizing emergency shelter areas using hybrid multi-criteria decision approach: A case study. J. Multi-Criteria Decis. Anal. 2017, 24, 133–145. [Google Scholar] [CrossRef]
  16. City of Victoria Emergency Preparedness. 2019. Available online: https://www.victoria.ca/EN/main/residents/public-safety/emergency-management.html (accessed on 23 October 2018).
  17. Kukovica, J.; Molnar, S.; Ghofrani, H.; Assatourians, K. Impact from a nearby seismically-active fault to seismic hazard in Victoria, Canada. Wit Trans. Eng. Sci. 2018, 121, 173–181. [Google Scholar]
  18. Tamima, U.; Chouinard, L. Framework for earthquake evacuation planning: Case study for Montreal, Canada. Leadersh. Manag. Eng. 2012, 12, 222–230. [Google Scholar] [CrossRef]
  19. Onur, T.; Ventura, C.; Finn, W.L. Regional seismic risk in British Columbia—Damage and loss distribution in Victoria and Vancouver. Can. J. Civ. Eng. 2005, 32, 361–371. [Google Scholar] [CrossRef]
  20. BC Housing. Shelter Design Guideline. 2017. Available online: https://www.bchousing.org/partner-services/asset-management-redevelopment/construction-standards (accessed on 18 November 2016).
  21. Shelter, Support & Housing Administration. Toronto Shelter Standard. 2018. Available online: https://www.toronto.ca/wp-content/uploads/2018/12/9547-A1600035_TSS_FinalDraft_V3_Dec4_Blue_SimpleAccessible_updated2.pdf (accessed on 1 December 2018).
  22. Schina, B. Exploring Perceptions of Disaster Risk and Earthquake Hazard on Southern Vancouver Island, British Columbia, Canada. Ph.D. Thesis, University of Victoria, Vancouver, BC, Canada, 2013. [Google Scholar]
  23. Yu, J.; Zhang, C.; Wen, J.; Li, W.; Liu, R.; Xu, H. Integrating multi-agent evacuation simulation and multi-criteria evaluation for spatial allocation of urban emergency shelters. Int. J. Geogr. Inf. Sci. 2018, 32, 1884–1910. [Google Scholar] [CrossRef]
  24. Nappi, M.; Souza, C. Disaster management: Hierarchical structuring criteria for selection and location of temporary shelters. Nat. Hazards 2015, 75, 2421–2436. [Google Scholar] [CrossRef]
  25. Cheng, H.; Yang, X. A comprehensive evaluation model for earthquake emergency shelter. In Proceedings of the Ninth Asia Pacific Transportation Development Conference, Chongqing, China, 29 June–1 July 2012; pp. 412–422. [Google Scholar]
  26. Hosseini, S.; Fuente, A.; Pons, O. Multicriteria decision-making method for sustainable site location of post-disaster temporary housing in urban areas. J. Constr. Eng. Manag. 2016, 142. [Google Scholar] [CrossRef] [Green Version]
  27. Poll, M.; Naylor, B.J.; Alexander, J.M.; Edwards, P.J.; Dietz, H. Seedling establishment of Asteraceae forbs along altitudinal gradients: A comparison of transplant experiments in the native and introduced ranges. Divers. Distrib. 2009, 15, 254–265. [Google Scholar] [CrossRef]
  28. Government of Canada. Earthquake Canada. 2020. Available online: https://www.earthquakescanada.nrcan.gc.ca/historic-historique/events/19460623-en.php (accessed on 19 October 2018).
  29. BC 211 Shelter Map. Available online: https://www.streetmessenger.io/map (accessed on 20 January 2017).
  30. Chen, Y.; Zheng, Z.; Wu, Z.; Qian, Q. Review and prospect of application of nighttime light remote sensing data. Adv. Earth Sci 2019, 38, 205–223. [Google Scholar]
  31. Fariborz, N. Earthquake scenario for the mega-city of Tehran. Disaster Prev. Manag. Int. J. 2001, 10, 95–101. [Google Scholar] [CrossRef]
  32. Liao, X. Application of Simulex to Simulate Public Evacuation Time after Earthquake Occurred-Take the Western District of Taichung City as a Case Study. 2009. Available online: https://ndltd.ncl.edu.tw/cgi-bin/gs32/gsweb.cgi?o=dnclcdr&s=id=%22097CYUT5224013%22.&searchmode=basic (accessed on 12 November 2020).
  33. Capital Regional District. Tsunami Modelling and Mapping Project. Available online: https://www.crd.bc.ca/docs/default-source/climate-action-pdf/reports/2020-sea-level-mapping-project/coastal-flood-inundation-mapping-project-summary.pdf (accessed on 11 September 2020).
  34. Central Saanich Agricultural Area Plan. District Central Saanich Agricultural Area Plan Phase 3 Report. Available online: https://www.centralsaanich.ca/sites/default/files/uploads/documents/agricultural_area_plan_0.pdf (accessed on 9 May 2011).
  35. Karimzadeh, S.; Miyajima, M.; Hassanzadeh, R.; Amiraslanzadeh, R.; Kamel, B. A GIS-based seismic hazard, building vulnerability and human loss assessment for the earthquake scenario in Tabriz. Soil Dyn. Earthq. Eng. 2014, 66, 263–280. [Google Scholar] [CrossRef]
  36. Golla, A.P.S.; Bhattacharya, S.P.; Gupta, S. The accessibility of urban neighborhoods when buildings collapse due to an earthquake. Transp. Res. Part D Transp. Environ. 2020, 86, 102439. [Google Scholar] [CrossRef]
  37. Sharma, K.; Deng, L.; Noguez, C.C. Field investigation on the performance of building structures during the April 25, 2015, Gorkha earthquake in Nepal. Eng. Struct. 2016, 121, 61–74. [Google Scholar] [CrossRef]
  38. BC Building Code. 2018. Available online: http://www.bccodes.ca/building-code.html (accessed on 1 December 2020).
  39. Bernardini, G.; Quagliarini, E.; D’Orazio, M. Towards creating a combined database for earthquake pedestrians’ evacuation models. Saf. Sci. 2016, 82, 77–94. [Google Scholar] [CrossRef]
  40. Qi, W.; Liu, S.; Gao, X.; Zhao, M. Modeling the spatial distribution of urban population during the daytime and at night based on land use: A case study in Beijing, China. J. Geogr. Sci. 2015, 25, 756–768. [Google Scholar] [CrossRef]
  41. Capital Regional Digital. Boundaries. 2020. Available online: https://mapservices.crd.bc.ca/arcgis/rest/services/Boundaries/MapServer (accessed on 12 November 2020).
  42. Capital Regional Digital. Roads. Version 2017. 2020. Available online: https://mapservices.crd.bc.ca/arcgis/rest/services/Roads/MapServer (accessed on 12 November 2020).
  43. U.S. Geology Survey. British Columbia DEM. 2020. Available online: https://earthexplorer.usgs.gov/ (accessed on 12 November 2020).
  44. Capital Regional Digital. Parks. 2020. Available online: https://mapservices.crd.bc.ca/arcgis/rest/services/Parks/MapServer (accessed on 12 November 2020).
  45. British Columbia Government. British Columbia Hazard Map. 2020. Available online: https://www2.gov.bc.ca/gov/content/safety/emergency-preparedness-response-recovery/preparedbc/know-your-hazards/hazard-map?keyword=Earthquake (accessed on 12 November 2020).
  46. Earth Observation Group Nighttime Light. Great Victoria Nighttime Light Data. 2020. Available online: https://eogdata.mines.edu/products/vnl/ (accessed on 12 November 2020).
  47. Open Street Map Export Tool. Great Victoria Building Polygon. 2020. Available online: https://export.hotosm.org/en/v3/exports/new/describe (accessed on 12 November 2020).
Figure 1. (a) The geological condition of the study area and some of the great earthquakes’ year and magnitude. (b) The location and population of the study area.
Ijgi 10 00063 g001
Figure 2. Great Victoria Emergency Shelter Distribution Map. The example street images of emergency shelters show that they are indoor shelters based on existing buildings. The street images are from BC211.
Ijgi 10 00063 g002
Figure 3. The methodology flow chart.
Ijgi 10 00063 g003
Figure 4. (a) The areas under tsunami risk. (b) The areas under ground amplification risk. (c) The areas under landslide risk. (d) The areas under liquefaction risk. (e) Nature hazard classification and potential available open space map.
Ijgi 10 00063 g004
Figure 5. The score of the open space as emergency shelters.
Ijgi 10 00063 g005
Figure 6. Images (af) they are, respectively, Esquimalt, Langford, Victoria, Saanich, Colwood, and Oak Bay, depicting the population density and service area coupling maps in the day time; the yellow and red polygons are, respectively, service areas and gaping holes.
Ijgi 10 00063 g006
Figure 7. Image (af) are, respectively, Esquimalt, Langford, Victoria, Saanich, Colwood and Oak Bay, depicting the population density and service area coupling maps in the night time; the yellow and red polygons are, respectively, service areas and gaping holes.
Ijgi 10 00063 g007
Table 1. The table shows the daytime population in the service areas and gaping holes, the coupling degree, and the proportion of the population in the gaping hole. The sum of the coupling degree and gaping hole proportion does not equal 1 because some people live outside of these areas.
DistrictService Area Pop (Coupling Degree)Gaping Hole Pop (Proportion)
Esquimalt1215 (6.9%)1036 (58.7%)
Langford1154 (3.3%)10,743 (63.7%)
Victoria6327 (7.3%)66,221 (76.3%)
Saanich8436 (8.1%)72,277 (49.4%)
Colwood736 (4.4%)10,743 (63.7%)
Oak Bay07690 (42.5%)
Table 2. The table shows the nighttime population in the service areas and gaping holes, the coupling degree, and the proportion of population in the gaping hole. The sum of coupling degree and gaping hole proportion does not equal 1 because some people live outside of these areas.
DistrictService Area Pop (Coupling Degree)Gaping Hole Pop (Proportion)
Esquimalt12,764 (72.3%)0
Langford827 (2.3%)32,871 (93.1%)
Victoria38,882 (44.8%)34,629 (39.9%)
Saanich31,927 (30.7%)33,430 (32.1%)
Colwood253 (1.5%)0
Oak Bay2243 (12.4%)15,543 (81.9%)
Publisher’s Note: MDPI stays neutral with regard to jurisdictional claims in published maps and institutional affiliations.

