
Mitigating Urban Visual Pollution through a Multistakeholder Spatial Decision Support System to Optimize Locational Potential of Billboards


Abstract
1. Introduction
2. Related Work
- (a)
- (b)
- (c)
- (d)
- (e)
- (f)
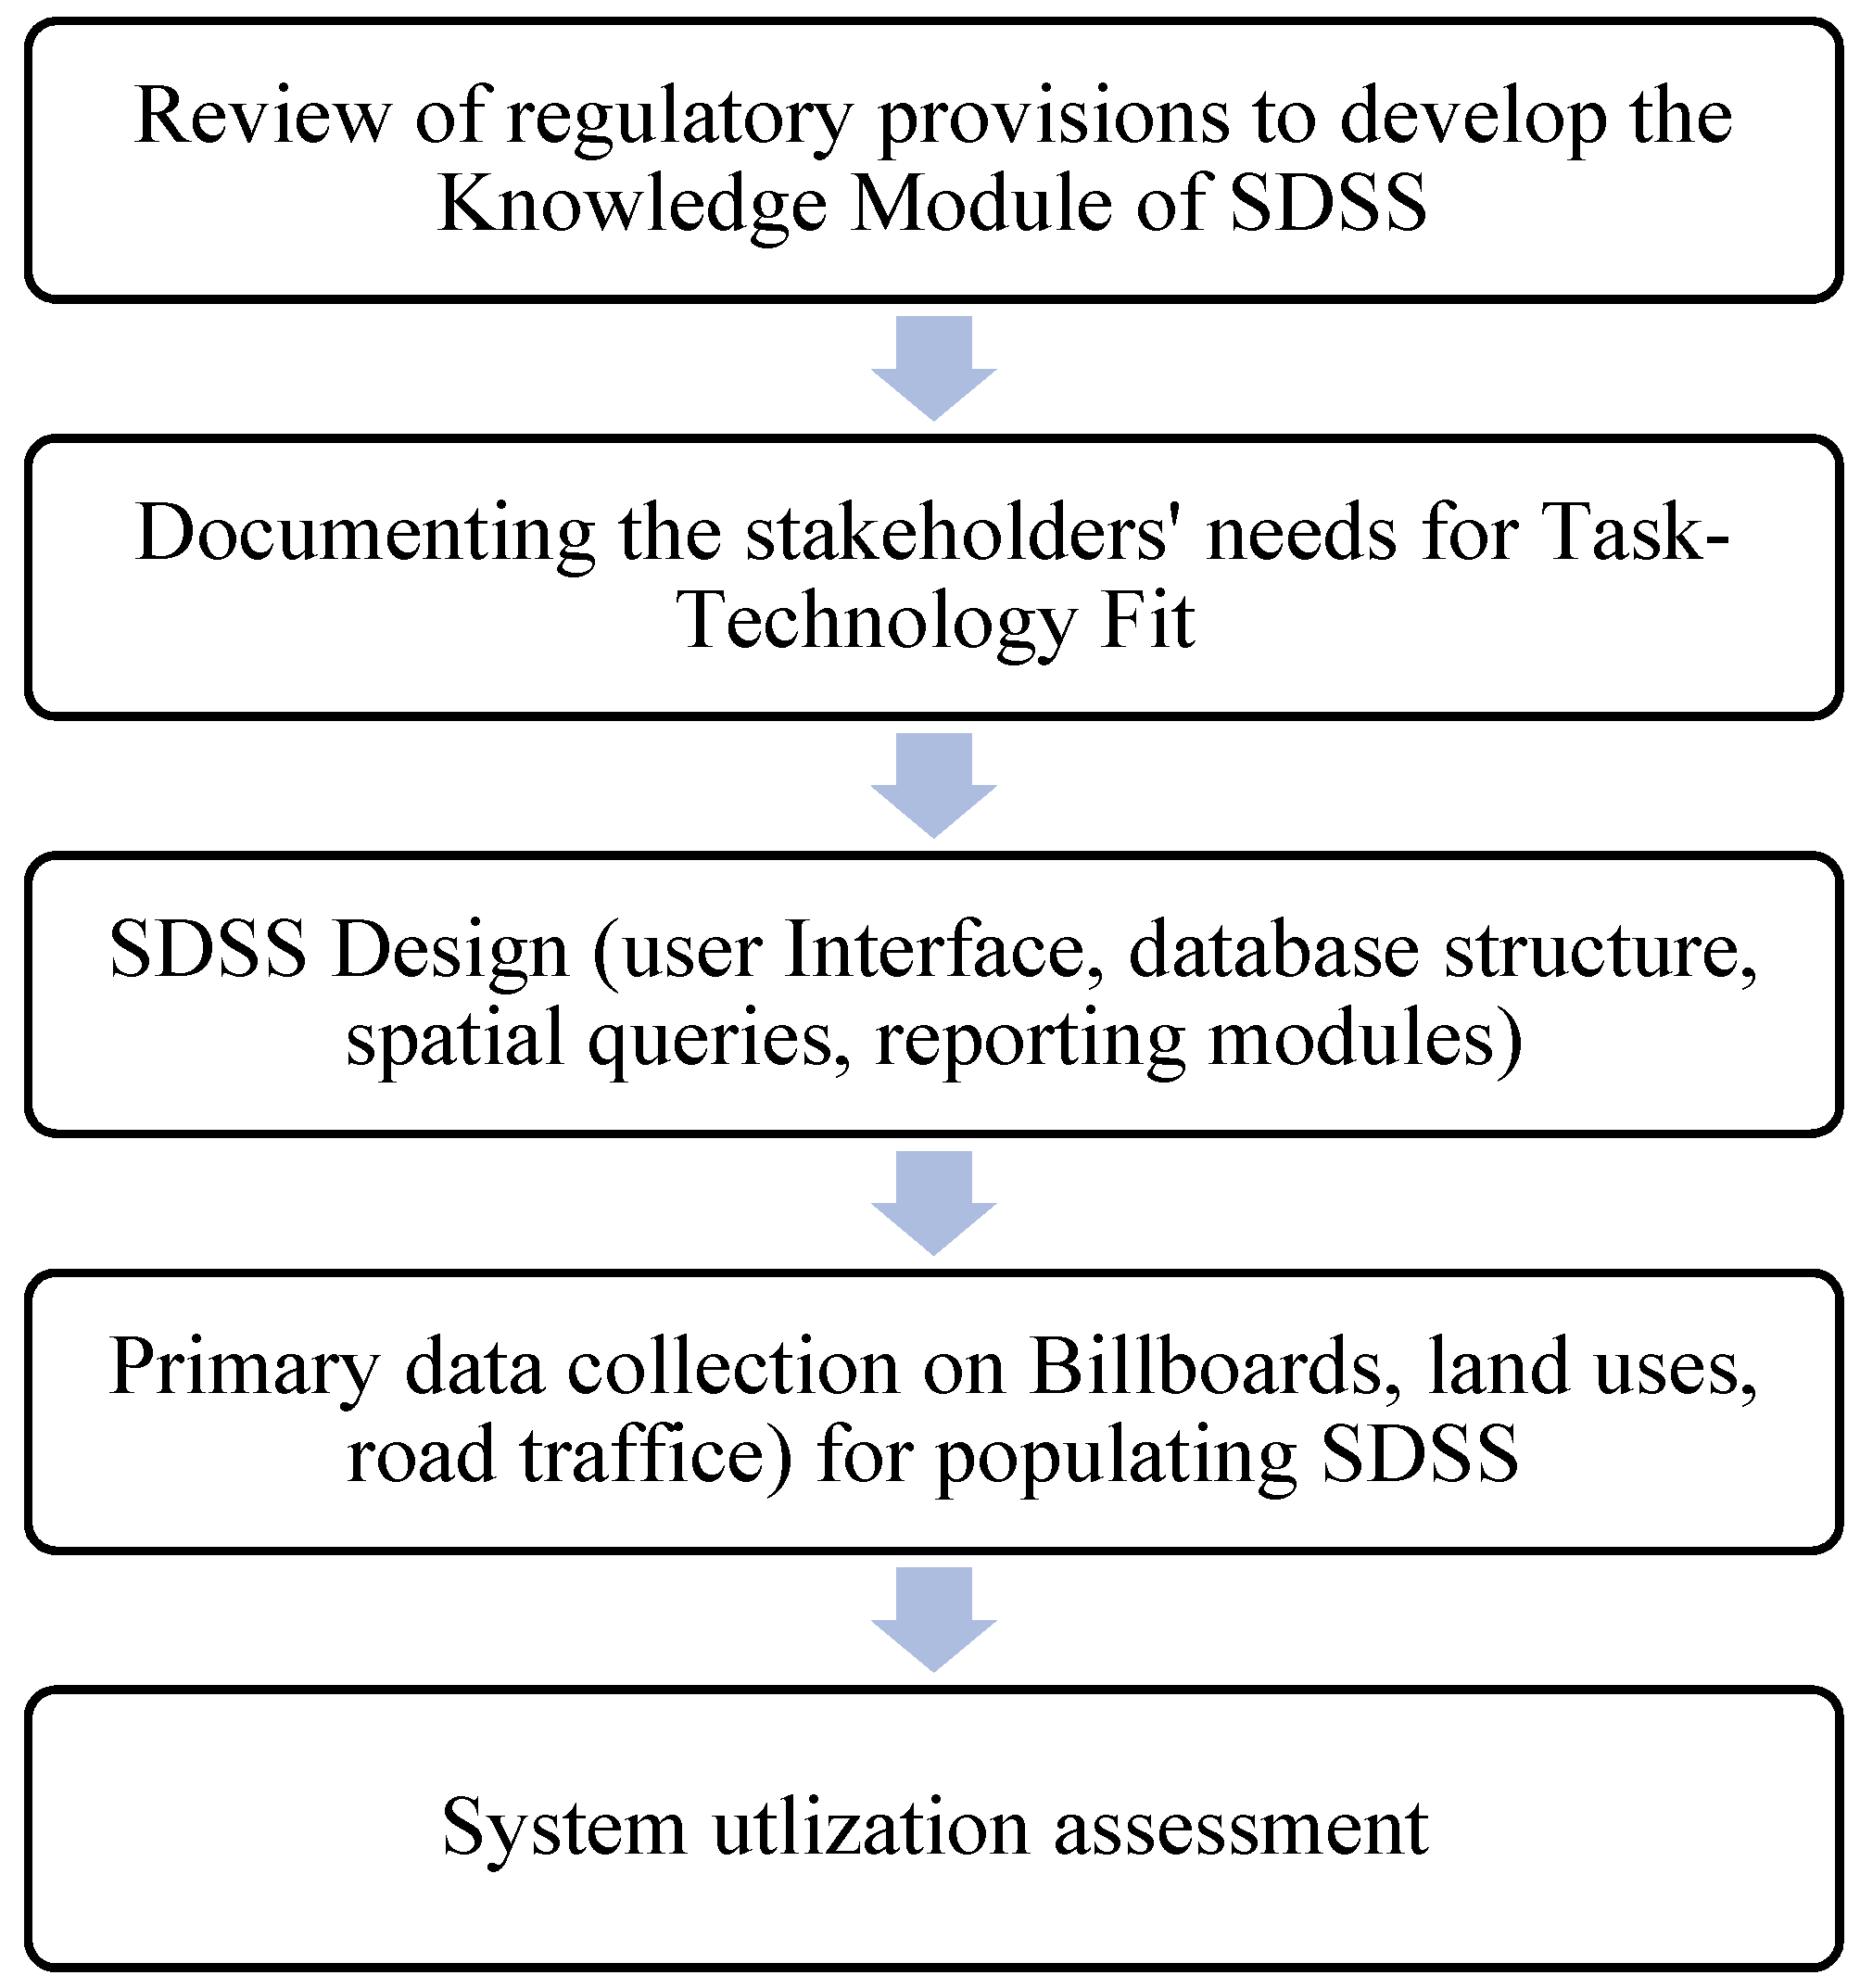
3. Materials and Methods
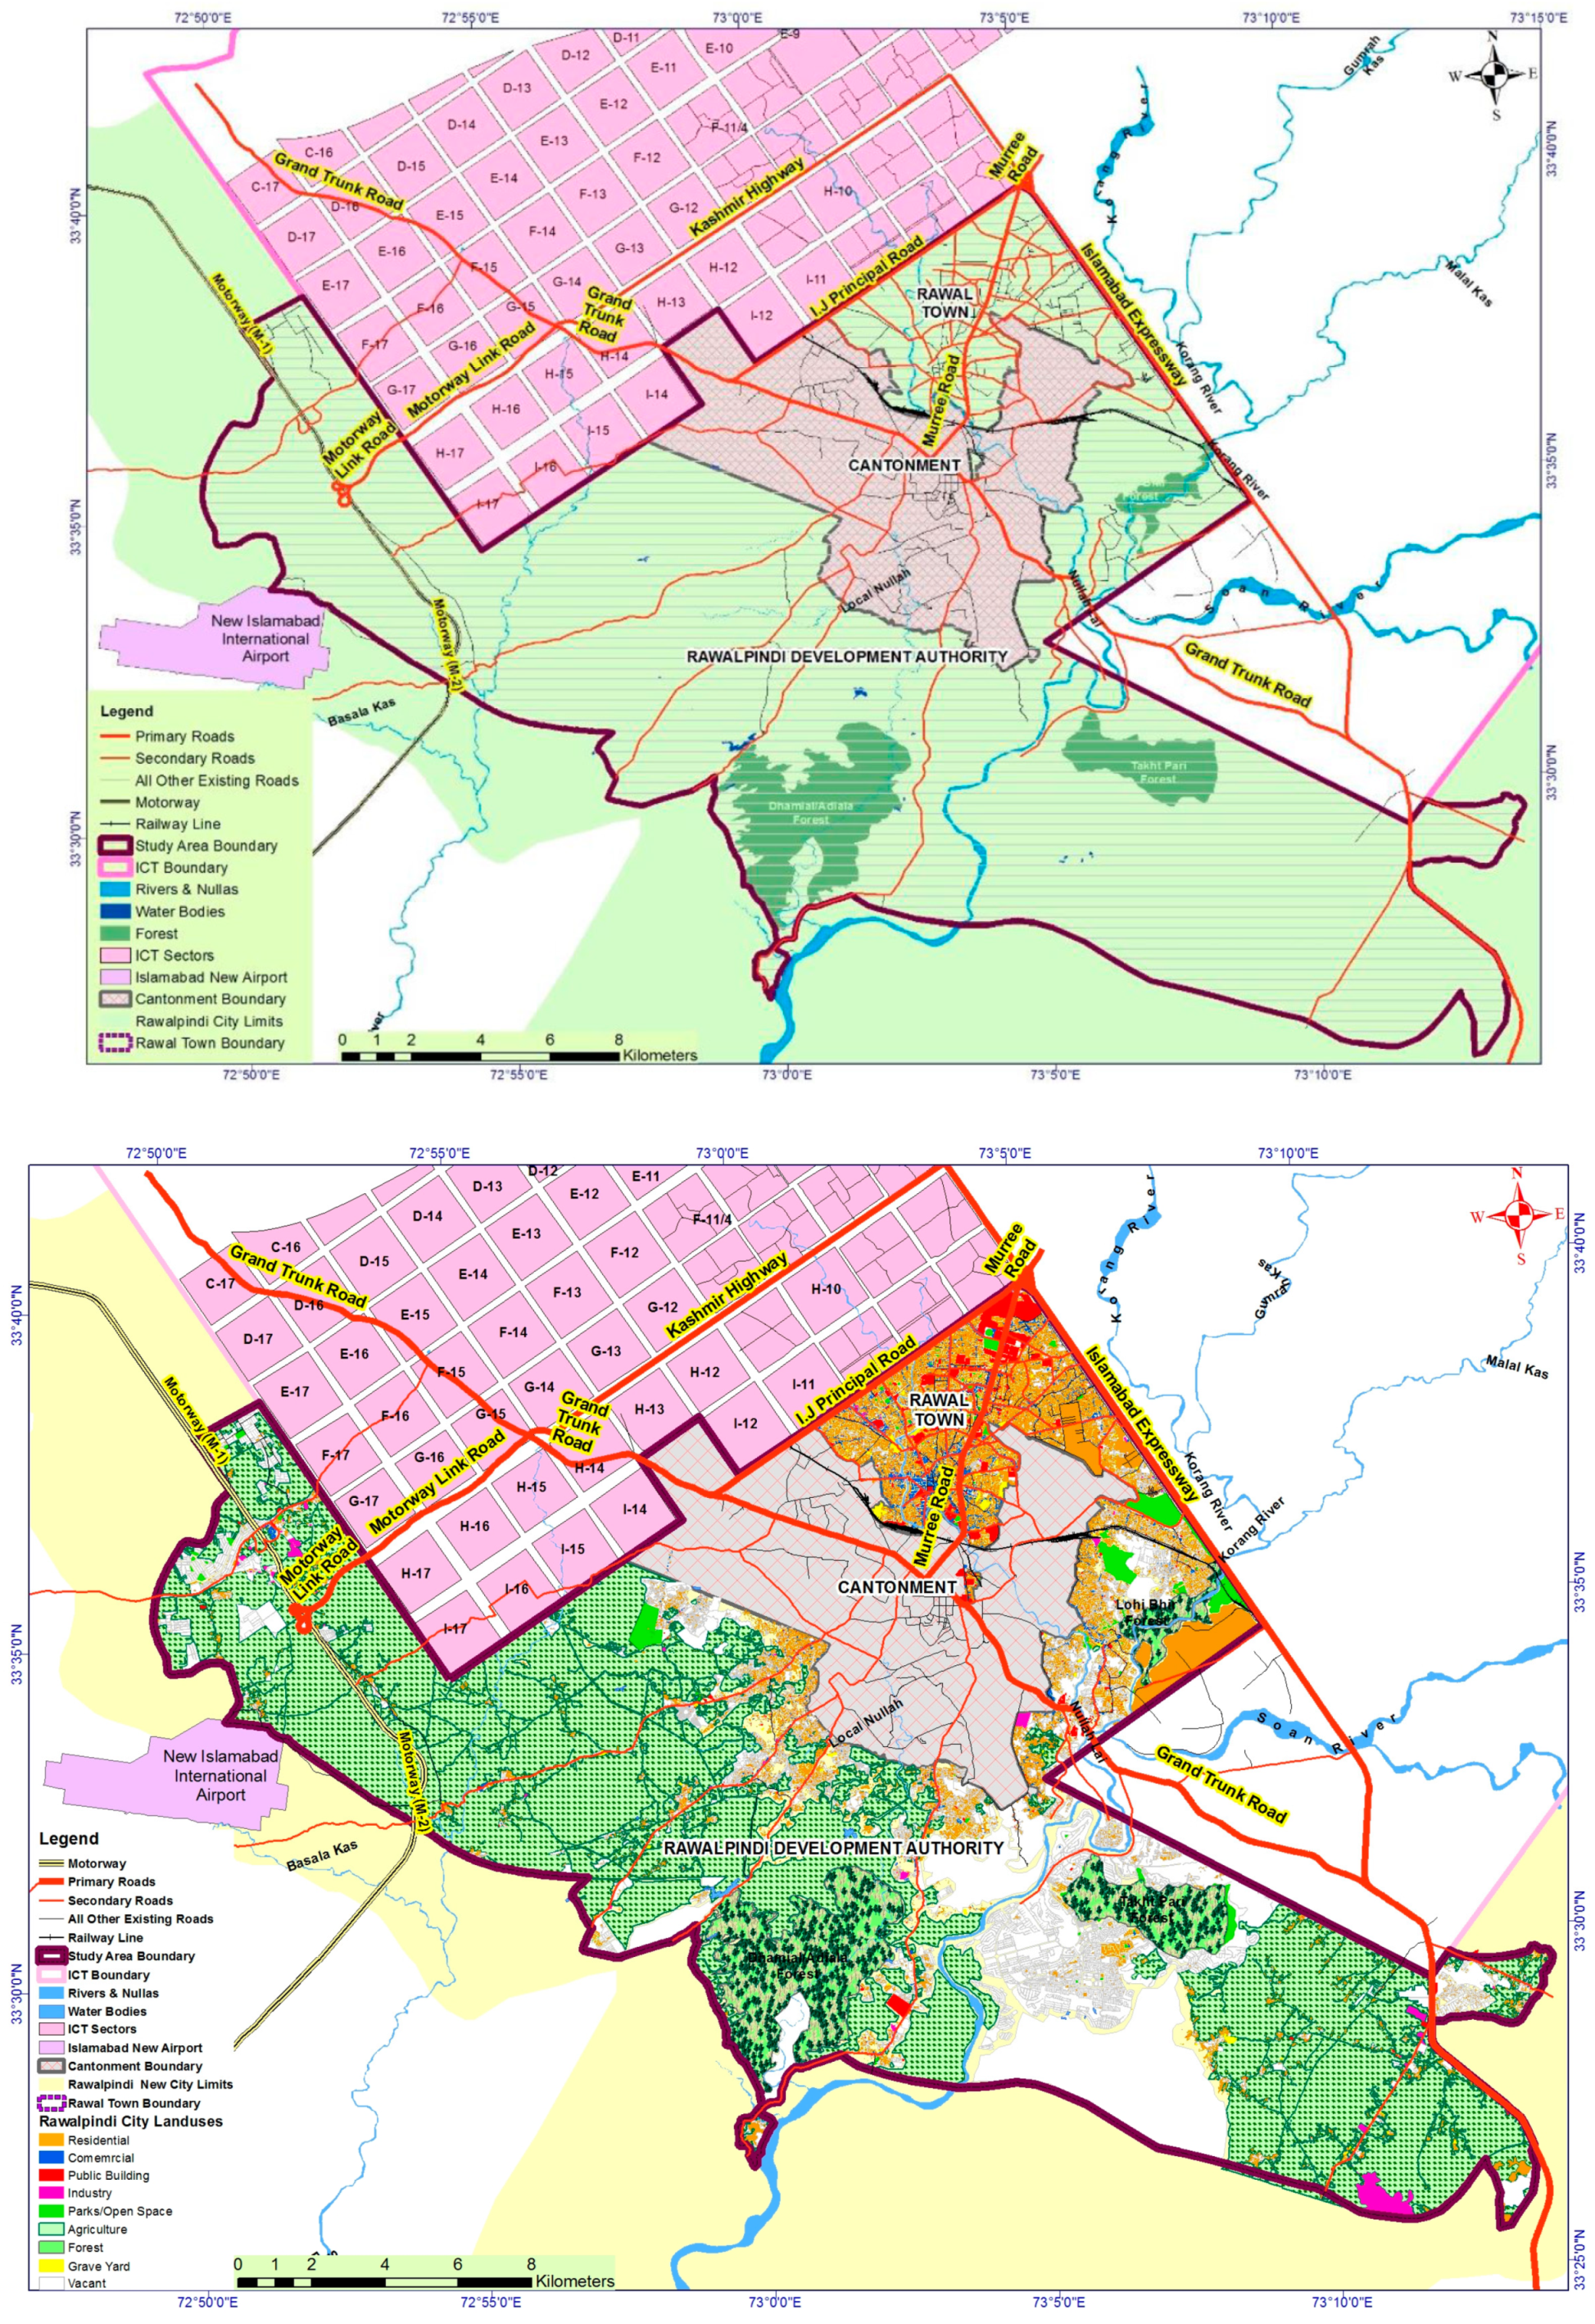
3.1. Case Study Area
3.2. Review of Rules and Regulations Related to the Billboards and Hoarding
- Regulations for Outdoor Advertisements and Billboards by Parks and Horticulture Authority (PHA), 2013 [39];
- Punjab Local Government Act, 2013 [171];
- City District Government Faisalabad Advertisement Bylaws, 2013 [23];
- Punjab Outdoor Advertisements and Sign Boards Policy, 2008 by Punjab Housing and Urban Development Department (PHUDD) [24];
- Standard Operation Procedures (SoPs)—Hoarding in Cantonment Areas, July 2011;
- Military Lands and Cantt Hoarding Policy, 2012 [21];
- Advertisement, Signage Bylaws for Karachi 2003;
3.3. Mapping the Stakeholders and Their Competing Needs
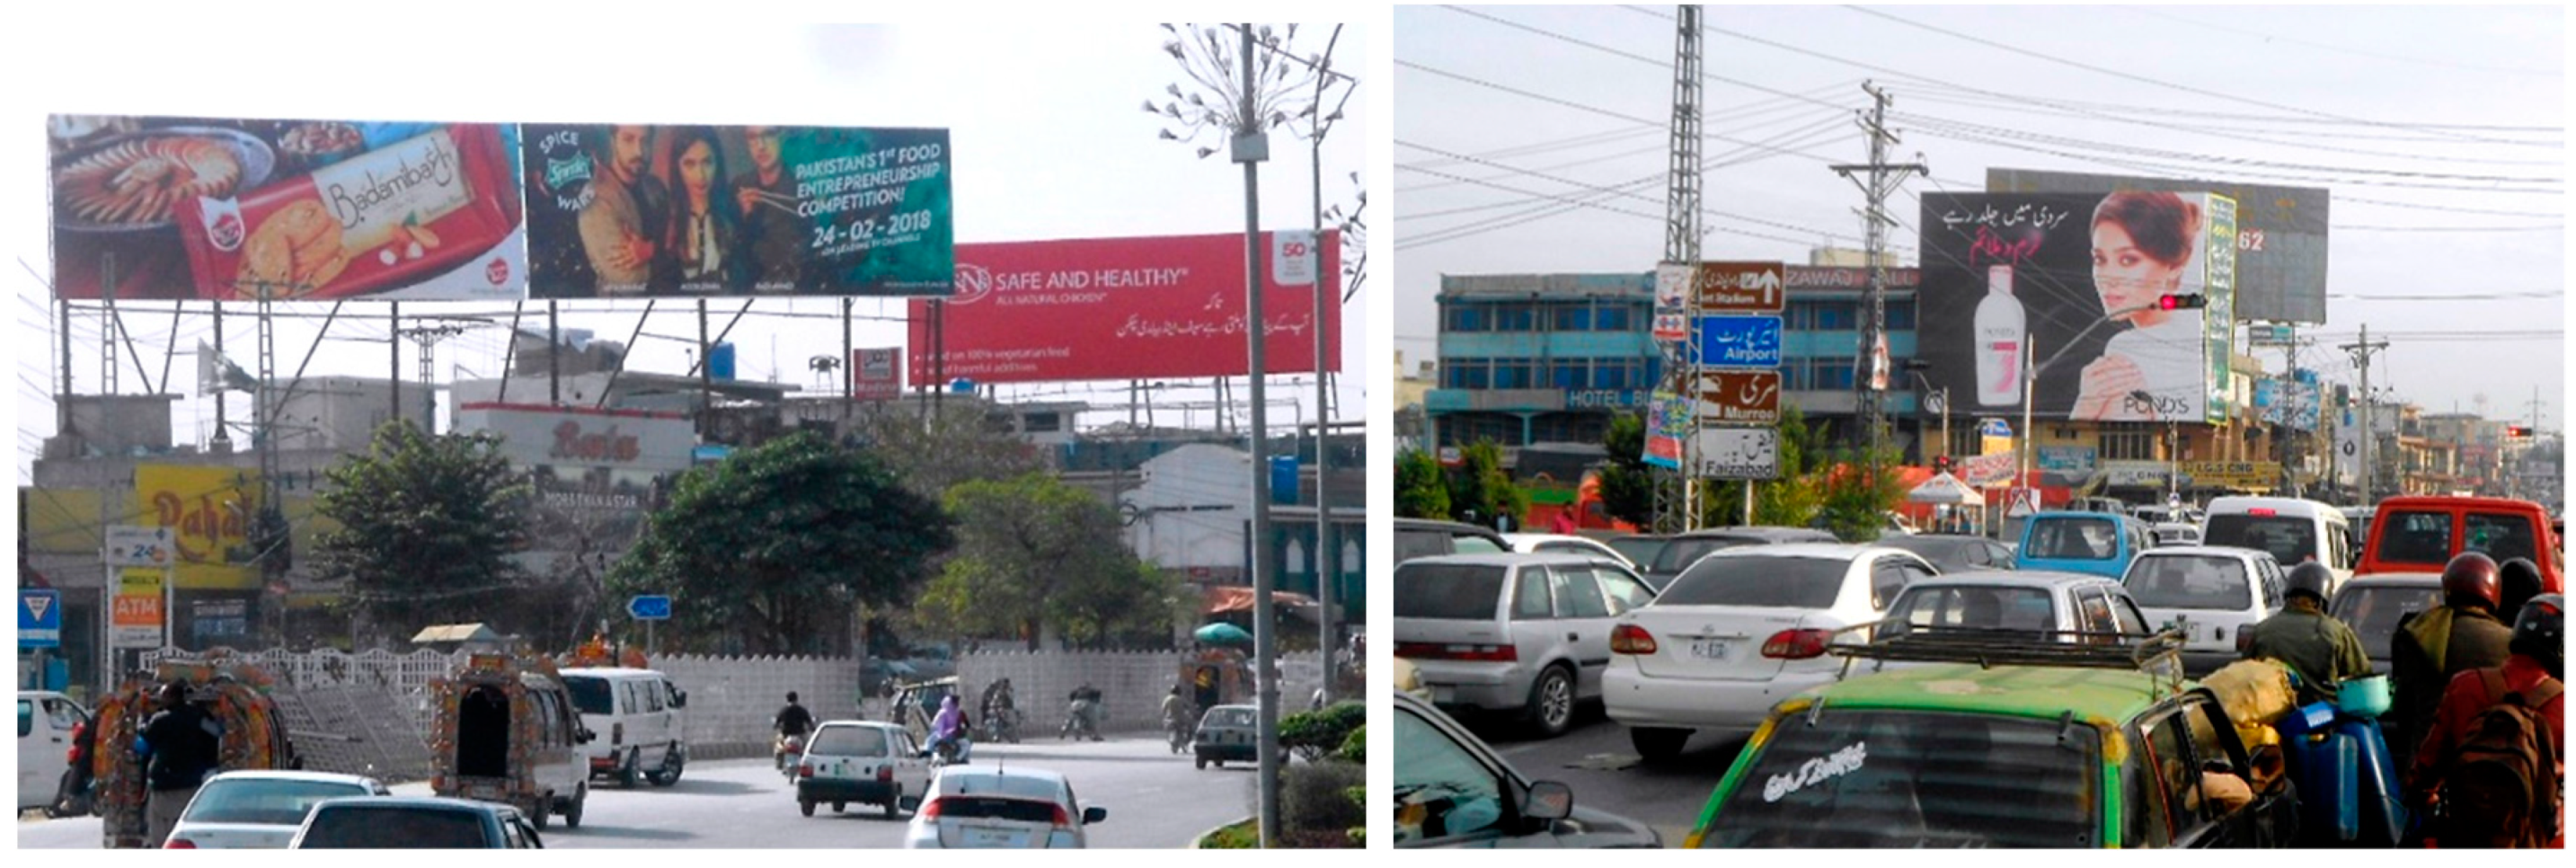
3.4. Collection of Primary Data on Billboards/Hoardings (Location and Other Attributes of Interest) and Secondary Data
3.5. Design of Database Structure for SDSS
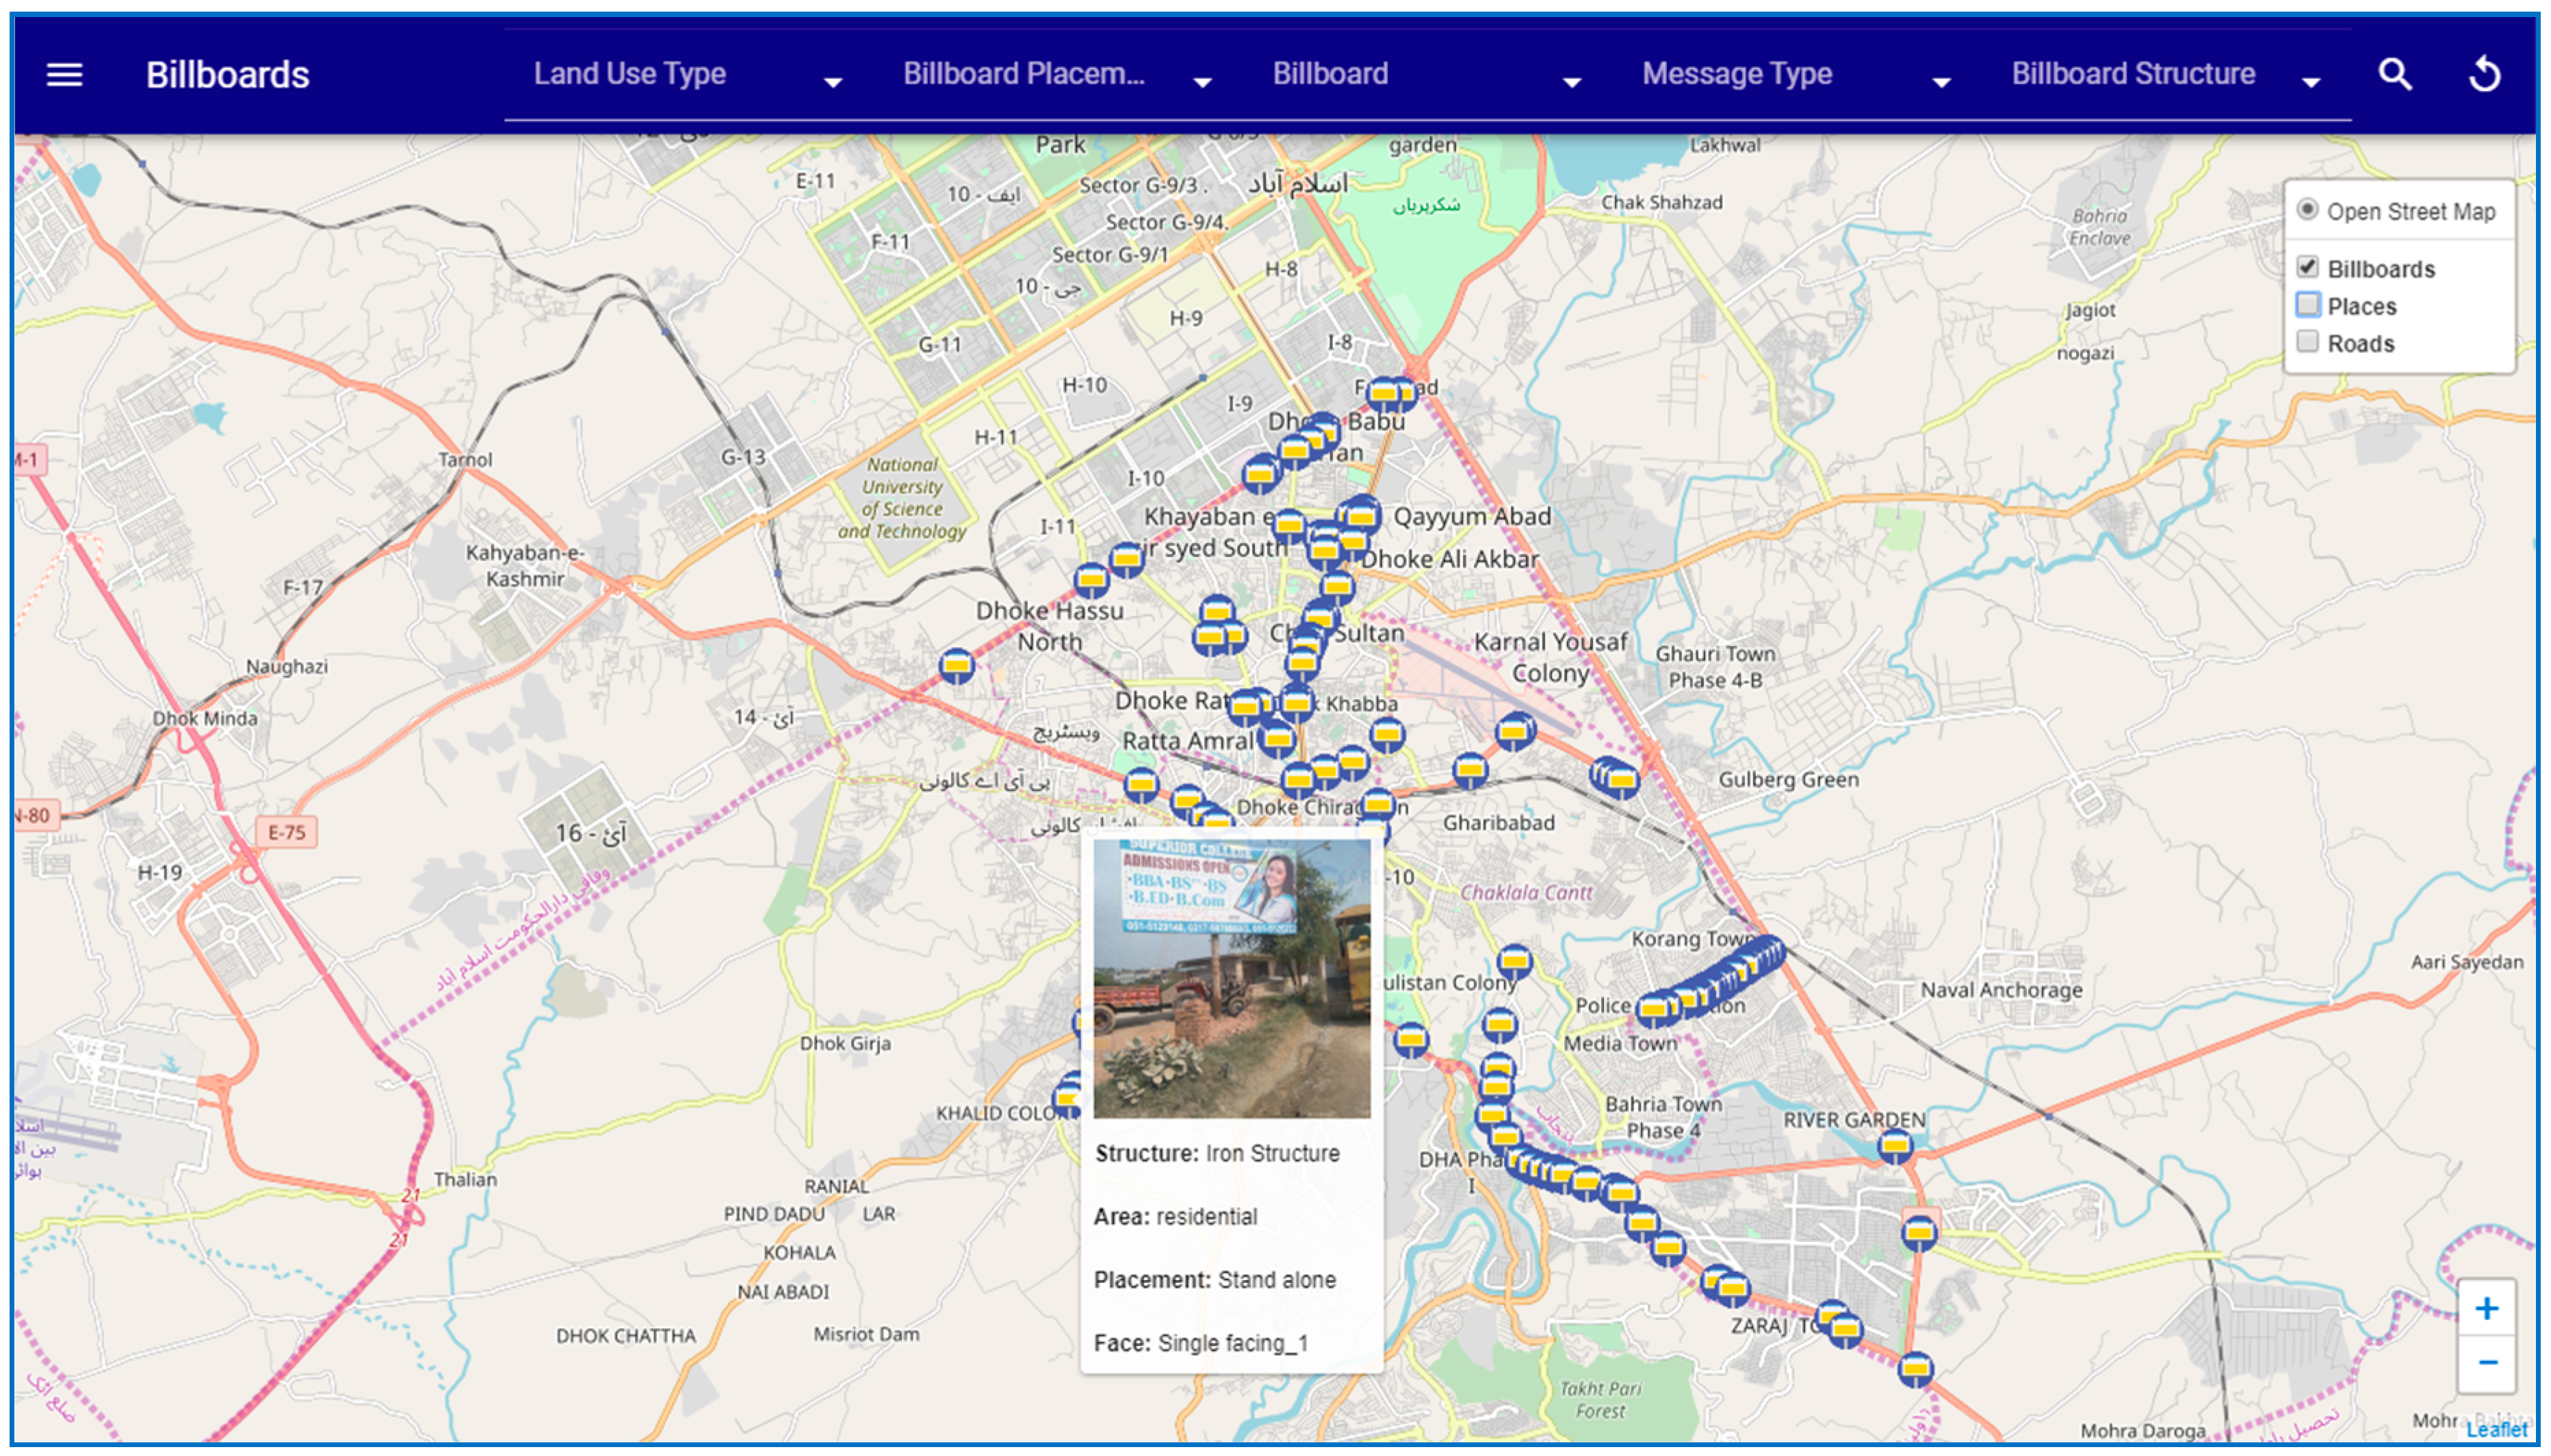
3.6. Design of User Interface Prototypes and Workflow
3.7. Technology Stack
3.8. SDSS Assessment and User Feedback
4. Results and Discussion
- Every single user selects a criterion and then makes the pairwise comparison only for the alternatives under it, and does not evaluate the other alternatives;
- Some alternatives are specific for a given criterion but not for the others;
- The elements of the hierarchy are not fully connected;
- The criteria are not compared pairwise;
- There is no weighting system of the criteria and alternatives;
- There is no estimate of the inconsistency of the matrices.
5. Conclusions
Author Contributions
Funding
Institutional Review Board Statement
Informed Consent Statement
Data Availability Statement
Acknowledgments
Conflicts of Interest
References
- Portella, A. Visual Pollution: Advertising, Signage and Environmental Quality; Routledge: Abingdon-on-Thames, UK, 2016. [Google Scholar]
- Voronych, Y. Visual Pollution of Urban Space in LVIV. Master’s Thesis, Politechnika Lwowska, Lviv Oblast, Ukraine, 2013; pp. 309–314. [Google Scholar]
- Kadir, J.J. Deformation and visual pollution in the commercial streets of the old city of Mosul. Eurasian J. Sci. Eng. 2017. Available online: https://core.ac.uk/download/pdf/227204443.pdf (accessed on 29 January 2021).
- Allahyari, H.; Salehi, E.; Zebardast, L. Evaluation of visual pollution in urban squares, using SWOT, AHP, and QSPM techniques (Case study: Tehran squares of Enghelab and Vanak). Pollution 2017, 3, 655–667. [Google Scholar] [CrossRef]
- Wakil, K.; Naeem, M.A.; Anjum, G.A.; Waheed, A.; Thaheem, M.J.; Hussnain, M.Q.U.; Nawaz, R. A Hybrid Tool for Visual Pollution Assessment in Urban Environments. Sustainability 2019, 11, 2211. [Google Scholar] [CrossRef]
- Sivaramanan, S. Visual Pollution; Central Environmental Authority: Sri Jayawardenepura Kotte, Sri Lanka, 2016. [Google Scholar]
- Wakil, K.; Naeem, M.A.; Anjum, G.A.; Waheed, A.; Thaheem, M.J.; Hussnain, M.Q. The assessment and mapping of urban visual pollution through an assembly of open source geospatial tools. In Proceedings of the Real Corp 2019 Proceedings, Karlsruhe, Germany, 2–4 April 2019; Volume 4, pp. 723–730. [Google Scholar]
- McMahon, E. Litter on a Stick. Plan. Comm. J. 1998, 45, 123. [Google Scholar]
- Bendak, S. The role of roadside advertising signs in distracting drivers. Int. J. Ind. Ergon. 2010, 40, 231–236. [Google Scholar] [CrossRef]
- Dukic, T.; Ahlstrom, C.; Patten, C.; Kettwich, C.; Kircher, K. Effects of Electronic Billboards on Driver Distraction. Traffic Inj. Prev. 2013, 14, 469–476. [Google Scholar] [CrossRef] [PubMed]
- Edquist, J. The Effects of Visual Clutter on Driving Performance; Monash University: Melbourn, Australia, 2009; p. 226. [Google Scholar]
- Chmielewski, S.; Samulowska, M.; Lupa, M.; Lee, D.; Zagajewski, B. Citizen science and WebGIS for outdoor advertisement visual pollution assessment. Comput. Environ. Urban Syst. 2018, 67, 97–109. [Google Scholar] [CrossRef]
- Płuciennik, M.; Sylla, M.; Gonda-Soroczyńska, E. The role of outdoor advertisements in the landscape of a city—public and private interests. Landsc. Archit. 2017, 55, 34–47. [Google Scholar]
- Bankole, O.E. Urban Environmental Graphics: Impact, Problems and Visual Pollution of Signs and Billboards in Nigerian Cities. Int. J. Educ. Res. 2013, 1, 1–12. [Google Scholar]
- Portella, A. Evaluating Commercial Signs in Historic Streetscape; Chapter 1–5; Oxford Brookes University: Oxford, UK, 2007. [Google Scholar]
- Azeema, N.; Nazuk, A. Is Billboard a Visual Pollution In Pakistan? Int. J. Sci. Eng. Res. 2016, 7, 862–874. [Google Scholar]
- Wakil, K.; Hussnain, M.Q.; Naeem, A.M.; Tahir, A. Regulating outdoor advertisement boards; employing spatial decision support system to control urban visual pollution. IOP Conf. Ser. Earth Environ. Sci. 2016, 37, 012060. [Google Scholar] [CrossRef]
- Taylor, C.R.; Franke, G.R.; Bang, H.K. Use and effectiveness of billboards perspectives from selective-perception theory and retail-gravity models. J. Advert. 2006, 35, 21–34. [Google Scholar] [CrossRef]
- Taylor, C.R.; Franke, G.R. Business perceptions of the role of billboards in the US economy. J. Advert. Res. 2003, 43, 150–161. [Google Scholar] [CrossRef]
- Da Silva, M. Making Sense of Visual Pollution: The ‘Clean City’ Law in São Paulo, Brazil. In Toxic Truths; Manchester University Press: Manchester, UK, 2020; Available online: https://library.oapen.org/bitstream/handle/20.500.12657/42642/9781526137005_fullhl.pdf?sequence=1#page=173 (accessed on 29 January 2021).
- Military Lands and Cantonments. Military Lands and Cantt Hoarding Policy; Military Lands and Cantonments: Karachi, Pakistan, 2012. Available online: http://www.scribd.com/doc/211203418/Military-Lands-and-Cantt-Hoarding-Policy-2012 (accessed on 9 December 2015).
- The City Government, Advertisement, Signage By-Laws Karachi; The City Government Laws: Karachi, Pakistan, 2003. Available online: http://www.scribd.com/doc/211212901/The-City-Govt-Laws-on-Billboards-in-English-Highlights (accessed on 9 December 2015).
- City District Government, City District Government Faisalabad Advertisement Byelaws. 2013. Available online: http://pcgip.urbanunit.gov.pk/docs/FinalAdvertisementByelaws2013Faisalabad[MEHRAN]withouttc.pdf (accessed on 12 December 2015).
- PHUDD. Punjab Outdoor Advertisements and Sign Boards Policy; Government of Punjab: Lahore, Pakistan, 2008.
- Hussnain, M.Q.; Anjum, G.A.; Wakil, K.; Tharanga, P.H.T.D. Improving Efficiency in Data Collection for Urban Development Plans through Information and Communication Technology; University of Engineering and Technology: Lahore, Pakistan, 2014. [Google Scholar]
- Hasnain, K. Regulations on Outdoor Advertising. Dawn, 7 March 2013. [Google Scholar]
- Maclurcan, D.C.B. Visual Pollution. Aust. Surv. 1973, 25, 82–88. [Google Scholar] [CrossRef]
- Holdstein, R.E. The Problem of Visual Pollution and Its Relation to the Role of the Art Educator; Ohio State University: Columbus, OH, USA, 1974. [Google Scholar]
- Bakhotmah, F.A. Visual Amenity & Visual Pollution Definition; Mass: Colombo, Sri Lanka, 1998. [Google Scholar]
- Özyurt, M.; Kumbur, H. Visual Pollution in Mersin and its Environmental Effects. In Proceedings of the 12th International Symposium on Environmental Pollution and its Impact on Life in the Mediterranean Region, Antalya, Turkey, 4–8 October 2003. [Google Scholar]
- Dunn, M. Educating for a Sustainable Community. Environmental Topic: Visual Pollution; The City of Albuquerque: Albuquerque, NM, USA, 2006. [Google Scholar]
- Kratz, J.; Littlejohn, G. Visual Pollution. Green Teacher. 2007. Available online: http://search.proquest.com/openview/8b3bda9ffc55ef617035201aab10a998/1.pdf?pq-origsite=gscholar&cbl=33544 (accessed on 30 January 2021).
- Stapleton, R.M. Pollution A to Z. 2004. Available online: http://www.pollutionissues.com/Ve-Z/Visual-Pollution.html (accessed on 30 January 2021).
- Marinescu, D.; Truşcā, P. Visual Pollution and Aesthetic Education. Metalurgia 2010, 62, 41–45. Available online: http://search.ebscohost.com/login.aspx?direct=true&profile=ehost&scope=site&authtype=crawler&jrnl=04619579&asa=Y&AN=48618211&h=UDGsQ9it0BGCvBM%2FqnPyNZrMh%2BWBMrpJHd2dbgRreCHax0%2FJGxTa0%2BgsNsmcy%2B9UGybzhXCJAoN4KEm%2BBlhn2A%3D%3D&crl=c (accessed on 30 January 2021).
- Meunier, S. Visual Pollution; Steidl: Göttingen, Germany, 2010. [Google Scholar]
- Portella, M.O. Environment and urban landscape: Advertising and outdoor advertising and visual pollution. Revista Direito Ambiental e Sociedade 2013. Available online: https://www.researchgate.net/publication/287407937_Visual_pollution_Advertising_signage_and_environmental_quality (accessed on 30 January 2021).
- Beer, C. Adriana Portella: Visual Pollution: Advertising, Signage and Environmental Quality. Hum. Ecol. 2016, 44, 129–130. Available online: http://search.proquest.com/openview/3951d14c52b0aa6de72c21440f46f311/1?pq-origsite=gscholar&cbl=48275 (accessed on 30 January 2021). [CrossRef]
- Enache, E.; Morozan, C.; Purice, S. Visual Pollution: A New Axiological Dimension Of Marketing? Ann. Univ. Oradea Econ. Sci. Ser. 2012, 21, 820–826. Available online: http://search.ebscohost.com/login.aspx?direct=true&profile=ehost&scope=site&authtype=crawler&jrnl=15825450&asa=Y&AN=85949029&h=xXLZRQmlkXPDzjeuzvoSb9nThpntHN0hPTYznJkP5P83S6j76f0964al4%2Fjm%2FC5%2FuY8%2B3I83x5jP668pcGJzjA%3D%3D&crl=c (accessed on 30 January 2021).
- Jacksonville Community Council, Inc. Visual Pollution Study. 1985. Available online: https://digitalcommons.unf.edu/jcci/4 (accessed on 30 January 2021).
- Barrett, J.H. Visual Pollution in a national park. Mar. Pollut. Bull. 1972, 3, 25–27. Available online: https://www.sciencedirect.com/science/article/pii/0025326X72902147 (accessed on 30 January 2021). [CrossRef]
- Troy, L. Visual Pollution in WA; Claremont Teachers College: Perth, Australia, 1974. [Google Scholar]
- Flad, H.K. Country clutter: Visual pollution and the rural roadscape. Ann. Am. Acad. Pol. Soc. Sci. 1997, 553, 117–129. [Google Scholar] [CrossRef]
- Muthukrishnan, N. Visual Pollution-More Dangerous than You Think It Is. CPR Environmental Education System. 2015. Available online: http://cpreec.org/161.htm (accessed on 5 March 2019).
- Cheng-lin, H. On the Problems of Touring Ecology Destruction and Visual Pollution in the “Two-Mountain and One-Lake Area” of Anhui Province. J. Catastrophol. 2003. Available online: http://en.cnki.com.cn/Article_en/CJFDTotal-ZHXU200304015.htm (accessed on 30 January 2021).
- Xin, S.U.N. Discussion of Visual Pollution in City. China Environ. Manag. 2011. Available online: http://en.cnki.com.cn/Article_en/CJFDTotal-HJGN201104019.htm (accessed on 30 January 2021).
- Elena, E.; Cristian, M.; Suzana, P. Visual Pollution: A New Axiological Dimension of Marketing? Ann. Fac. Econ. 2012, 1, 820–826. [Google Scholar]
- Al Zaydee, N.M. Visual pollution in the city of Mosul (A study in geographic contamination). Mosoliya Stud. 2013. Available online: https://www.iasj.net/iasj?func=article&aId=76673 (accessed on 30 January 2021).
- Anciaes, P.R. Book Review: Visual Pollution: Advertising, Signage and Environmental Quality by Adriana Portella; LSE Review of Books: London, UK, 2014; Available online: http://eprints.lse.ac.uk/57500/ (accessed on 30 January 2021).
- Grygny, N. Reklama w Przestrzeni Miejskiej Visual Pollution—Zawłaszczanie i Odzyskiwanie Miasta. Ph.D. Thesis, Zachodniopomorski Uniwersytet Technologiczny, Szczecin, Poland, 2014. [Google Scholar]
- Codato, M.V.F. Visual pollution and noise: A troubled relationship between environment and society. Rev. Eletrônica Gestão Educ. Tecnol. Ambient. 2014. Available online: https://periodicos.ufsm.br/index.php/reget/article/view/14516 (accessed on 30 January 2021).
- Jana, M.K.; De, T. Visual pollution can have a deep degrading effect on urban and suburban community: A study in few places of Bengal, India, with special reference to unorganized billboards. Eur. Sci. J. 2015, 7881, 1–14. [Google Scholar]
- Babcock, H. Is using the public trust doctrine to protect public parkland from visual pollution justifiable doctrinal creep. Ecol. LQ 2015, 42, 1. [Google Scholar]
- Blewitt, J. Visual Pollution: Advertising, Signage and Environmental Quality; Taylor & Francis: Oxfordshire, UK, 2015. [Google Scholar]
- Somida, I.D.A. The Effect of Visual Pollution on Double Meaning of The Facad. Master’s Thesis, Cairo University, Giza, Egypt, 2015. [Google Scholar]
- Correa, V.F.; Mejía, A.A. Visual pollution Indicators and its Effects on Population. Enfoque UTE 2015. Available online: http://scielo.senescyt.gob.ec/scielo.php?script=sci_arttext&pid=S1390-65422015000300115&lng=en&nrm=iso&tlng=en (accessed on 30 January 2021).
- Kharate, S.; Banerjee, S. A Study of Visual pollution and Its Effect on Mental Health. Innov. IT 2016, 3, 35–37. Available online: https://www.indianjournals.com/ijor.aspx?target=ijor:jiit&volume=3&issue=1&article=008 (accessed on 30 January 2021).
- Banerjee, S. A study of visual pollution and its effect on mental health. Sch. Res. J. Interdiscip. Res. 2017. Available online: https://www.academia.edu/33171208/A_STUDY_OF_VISUAL_POLLUTION_AND_ITS_EFFECT_ON_MENTAL_HEALTH (accessed on 30 January 2021).
- Tota, A.L. ‘Poluição visual’: Uma reflexão sobre a sustentabilidade de imagens “Visual pollution”: A reflection on the sustainability of images. RBSE Rev. Bras. Sociol. Emoção 2017. Available online: http://www.cchla.ufpb.br/rbse/RBSEv.16n.47ago2017completo.pdf#page=105 (accessed on 30 January 2021).
- EL-Ghonaimy, I.H. Visual pollution phenomena and sensitivity of residences in heritage city centers Case of: Old district of Manama city, Kingdom of Bahrain. J. Contemp. Urban Aff. 2019, 3, 175–190. Available online: http://www.ijcua.com/index.php/ijcua/article/view/125 (accessed on 30 January 2021). [CrossRef][Green Version]
- Szczepańska, M.; Wilkaniec, A.; ŠkaMlová, A. Visual pollution in natural and landscape protected areas: Case studies from Poland and Slovakia. Quaest. Geogr. 2019, 38, 133–149. Available online: https://content.sciendo.com/view/journals/quageo/38/4/article-p133.xml (accessed on 30 January 2021). [CrossRef]
- Kim, J.; Kim, Y. Visual pollution on public sites affecting public sights. In Proceedings of the 32th KKHTCNN Symposium on Civil Engineering, Daejeon, Korea, 24–26 October 2019; Available online: https://koasas.kaist.ac.kr/handle/10203/276299 (accessed on 30 January 2021).
- Campos, C.; Cirafici, A. Visual Pollution and Social Asymmetry. The Origin of Dientenegro. Disegnarecon 2020. Available online: http://disegnarecon.univaq.it/ojs/index.php/disegnarecon/article/view/731 (accessed on 30 January 2021).
- Tama, B. Visual Pollution in the Urban Environment. 2020. Available online: https://nda.rtu.lv/en/view/25589 (accessed on 30 January 2021).
- Cvetković, M.; Momčilović-Petronijević, A.; Ćurčić, A. Visual Pollution of Urban Areas as One of the Main Issues of the 21st Century. Available online: https://www.researchgate.net/profile/Mila_Cvetkovic3/publication/331718054_VISUAL_POLLUTION_OF_URBAN_AREAS_AS_ONE_OF_THE_MAIN_ISSUES_OF_THE_21ST_CENTURY/links/5c8bca3da6fdcc381755c205/VISUAL-POLLUTION-OF-URBAN-AREAS-AS-ONE-OF-THE-MAIN-ISSUES-OF-THE-21ST-C (accessed on 30 January 2021).
- Jorge, A.P.; Gentil, P.A.B. Social Da Propriedade: A Problemática Da Poluição Visual, Social Function Of Property: The Problem of Visual Pollution. 2009. Available online: https://www.jfrj.jus.br/sites/default/files/revista-sjrj/arquivo/7-23-1-pb.pdf (accessed on 30 January 2021).
- Schodorf, R.J. A Study of Visual Pollution from Overhead Wires and Associated Structures. Master’s Thesis, Western Michigan University, Kalamazoo, MI, USA, 1973. [Google Scholar]
- Silverstone, S. Visual Pollution: Unaesthetic Use of Land as Nuisance. Alta. Law Rev. 1974, 12. Available online: http://www.albertalawreview.com/index.php/ALR/article/view/2371 (accessed on 30 January 2021). [CrossRef]
- Allen, M. The SAGE Encyclopedia of Communication Research Methods; SAGE Publications, Inc.: Thousand Oaks, CA, USA, 2017. [Google Scholar]
- Fischer, L.; Abllez, M.E. Campus Communication or Visual Pollution? 1996. Available online: https://scholarworks.lib.csusb.edu/cgi/viewcontent.cgi?article=1396&context=coyote-chronicle (accessed on 30 January 2021).
- Zbadi, H. An Analytical Study of the Symptoms and Causes of Visual Pollution in the Contemporary Egyptian City. Master’s Thesis, Department of Architecture, Assiut University, Assiut, Egypt, 1997. [Google Scholar]
- Dumitrescu, A. Dams, visual pollution and environment damage. Rev. Ecol. Ind. 2000, 7, 59–62. [Google Scholar]
- Dumitrescu, A. Wind turbines, solar panels and visual pollution. Rev. Ecol. Ind. 2000, 7, 63–66. [Google Scholar]
- Nagle, J.C. Cell phone towers as visual pollution. Notre Dame JL Ethics Pub. Pol’y 2009, 23, 537. [Google Scholar]
- Marks, P. Projector phones: Cool app or visual pollution. New Sci. 2009, 201, 18–19. Available online: https://www.sciencedirect.com/science/article/pii/S0262407909605650 (accessed on 30 January 2021). [CrossRef]
- Sumartono, S. Visual Pollution in the Context of Conflicting Design Requirements. J. Vis. Art Des. 2009. Available online: http://journals.itb.ac.id/index.php/jvad/article/view/742 (accessed on 30 January 2021). [CrossRef]
- Roca, M.A.S. Visual pollution by television antennas on the Albaicin. A technologic proposal for its correction. e-Rph-Rev. Electron. Patrim. Hist. 2011, 59–88. Available online: https://dialnet.unirioja.es/servlet/articulo?codigo=5370842 (accessed on 30 January 2021).
- Jensen, C.U.; Panduro, T.E.; Lundhede, T.H. The vindication of Don Quixote: The impact of noise and visual pollution from wind turbines. Land Econ. 2014, 90, 668–682. [Google Scholar] [CrossRef]
- Ogunbodede, R.S.E.F. Posters, Banners and Billboards Visual Pollution in Nigerian Urban Environment: Challenges to Urban Managers. IOSR J. Humanit. Soc. Sci. 2014, 19, 56–64. [Google Scholar] [CrossRef]
- Azeema, N. Billboard Advertisement Visual Pollution; Dr. Bernard Weitzman: New York, NY, USA, 2015. [Google Scholar]
- Madleňák, R.; Hudák, M. The Research of visual pollution of road infrastructure in Slovakia. In International Conference on Transport Systems Telematics; Springer: Cham, Switzerlands, 2016; Available online: https://link.springer.com/chapter/10.1007/978-3-319-49646-7_35 (accessed on 30 January 2021).
- Nami, P.; Jahanbakhsh, P.; Fathalipour, A. The Role and Heterogeneity of Visual Pollution on the Quality of Urban Landscape Using GIS; Case Study: Historical Garden in City of Maraqeh. Earth Env. Sci. 2016, 6, 20–29. [Google Scholar] [CrossRef]
- Probst, A.K. Environmental Visual Pollution and Its Relationship to Signage Technology: A Case Study in Thailand. Master’s Thesis, University of Cincinnati, Cincinnati, OH, USA, 2016. [Google Scholar]
- Naguib, M.M. Visual pollution caused by banners and signage installed on buildings facades Case study: Alexandria versus Moscow city. Int. J. Sci. Eng. Res. 2016, 7, 1663–1667. [Google Scholar]
- Khanal, K.K. Visual pollution and eco-dystopia: A study of billboards and signs in Bharatpur metropolitan city. Res. J. Engl. Lang. Lit. 2018, 6, 202–208. Available online: http://rjelal.com/6.1.18/202-208KAMALKRISHNAKHANAL.pdf (accessed on 30 January 2021).
- Urban, M.; Avilés, D.J.V.; Bojović, M.; Urban, K. Artificial, cheap, fake: Free associations as a research method for outdoor billboard advertising and visual pollution. Hum. Aff. 2020, 30, 253–268. Available online: https://www.degruyter.com/view/journals/humaff/30/2/article-p253.xml (accessed on 30 January 2021). [CrossRef]
- Wakil, K.; Hussnain, M.Q.; Waheed, A.; Naeem, A.M. Contextual Review of Outdoor Advertisements: Impacts and Regulatory Practices. Sci. Int. 2016, 1, 531–535. [Google Scholar]
- McEvoy, J.; Williams, S. Visual Pollution in the Lake Tahoe Basin: A Report to the Tahoe Regional Planning Agency Based on the Application of a Quantitative Method of Assessing the Visual Environment; University of California: Oakland, CA, USA, 1976. [Google Scholar]
- Williams, J.M.S., III. Visual Pollution in the Lake Tahoe Basin; University of California: Davis, CA, USA, 1970. [Google Scholar]
- Xiu, S.; Zhou, Q.; Cai, Q.; Long, L.; Lu, D.; Shang, X. Investigation and Research of University Campus Visual Pollution. Bull. Sci. 2009. Available online: http://en.cnki.com.cn/Article_en/CJFDTotal-KJTB200903024.htm (accessed on 30 January 2021).
- Yilmaz, D.; Sagsöz, A. In the context of visual pollution: Effects to trabzon city center silhoutte. Asian Soc. Sci. 2011. [Google Scholar] [CrossRef]
- Emeji, M.J. Environmental Communication and Visual Pollution in the Nigerian City of Port Harcourt: Implications for Design Education and City Planning. Vis. Arts Res. 2011, 37, 42–53. Available online: https://muse.jhu.edu/article/451821/summary (accessed on 30 January 2021). [CrossRef]
- Mousa, I. Visual Pollution in the Commercial Streets in Duhok City; Higher Institute of Urban Planning, the University of Duhok: Dahuk, Iraq, 2011; Available online: https://www.researchgate.net/publication/342851846_REPERCUSSION_OF_VISUAL_POLLUTION_AND_ITS_EFFECTS_ON_SOME_PEOPLE_IN_DUHOK (accessed on 30 January 2021).
- Mendez, V.; Carmen, A. Visual pollution in public spaces in Venezuela. Gestión Ambient. 2013, 16, 45–60. Available online: https://inis.iaea.org/search/search.aspx?orig_q=RN:45026928 (accessed on 30 January 2021).
- Kan, R.; Ngai, S.; Wong, C.Y. Visual Pollution in Hong Kong. 2012. Available online: http://hku-env-health.blogspot.in/2012/11/visual-pollution-in-hong-kong-byr-kan.html (accessed on 10 May 2014).
- Sabah, O.A.; Samad, M.H. Livable Heritage Street and Visual Pollution In Georgetown/Penang. Int. Conf. Liveable Cities 2015. Available online: http://www.academia.edu/download/46329828/LIVABLE_HERITAGE_STREET_AND_VISUAL_POLLUTION_IN_GEORGETOWN-PENANG.pdf (accessed on 30 January 2021).
- Benavides, D.A.M. Environmental Diagnosis of Visual Pollution Perception by University Population from the Civil Engineering and Natural, Exact and Education Sciences Faculties at Universidad del Cauca. Luna Azul 2017, 44, 211–230. Available online: http://www.scielo.org.co/scielo.php?pid=S1909-24742017000100013&script=sci_arttext&tlng=en (accessed on 30 January 2021). [CrossRef]
- Cvetković, M.; Momčilović-Petronijević, A. Visual Pollution of the Historical City Core—A Case Study, the City of Niš. In Proceedings of the 6th International Conference Contemporary Achievements in Civil Engineering, Subotica, Serbia, 20 April 2018; Available online: http://zbornik.gf.uns.ac.rs/doc/NS2018.49.pdf (accessed on 30 January 2021).
- Anwer, M.; Aowais, A. Visual Pollution and its Impact on the Aesthetics: The Town of Eizariya as a Model. J. Plan. Dev. 2019, 24, 44–70. Available online: https://www.iasj.net/iasj/article/184101 (accessed on 30 January 2021).
- Zaeimdar, M.; Sarab, F.K.; Rafati, M. Investigation of the relation between visual pollution and citizenry health in the city of Tehran (case study: Municipality districts No. 1 & 12 of Tehran). Anthropog. Pollut. 2019, 3, 1–10. Available online: http://ap.iauardabil.ac.ir/article_546040.html (accessed on 30 January 2021).
- Córdoba, L.Y. The Historical Environment of the City of Cartagena Opaque by Commercial Visual Pollution. Aglala 2013, 4, 72–92. Available online: https://revistas.curn.edu.co/index.php/aglala/article/view/733 (accessed on 30 January 2021).
- Erickson, L.E. Approach to Valuing Visual Pollution from Western Electricity Production; Battelle Pacific Northwest Labs: Richland, WA, USA, 1977. Available online: https://www.osti.gov/biblio/7307006 (accessed on 30 January 2021).
- Jellet, P. Beachwatch Visual Pollution Ratings 1 July 1991 to 31 March 1993: Data Analysis and Modelling; NSW Environment Protection Authority (EPA): Parramatta, Australia, 1993.
- Khaled, M.T.J. Analyzing and Evaluating Visual Pollution in Tulkarem City (Center of Tulkarem City—Case Study). 2009. Available online: https://repository.najah.edu/handle/20.500.11888/7484 (accessed on 27 January 2021).
- Zhou, D.; Wang, B.J.; Shi, B. GIS Viewshed Analysis of Visual Pollution Assessment for Mine Environment. Xuebao J. Guilin Univ. 2011. Available online: http://en.cnki.com.cn/Article_en/CJFDTotal-GLGX201102009.htm (accessed on 30 January 2021).
- Gokhale, I.R.V.A.; Raichur, M. Examining Impact of Visual Pollution on City Environment: Case Study of Pune, India. Available online: https://www.academia.edu/17307236/Examining_Impact_of_Visual_Pollution_on_City_Environment_Case_Study_of_Pune_India (accessed on 27 January 2021).
- Luo, X.; Huang, Y. The Analyses of Visual Pollution Problem and Its Strategies in Historic District. Mod. Urban Res. 2011. Available online: http://en.cnki.com.cn/Article_en/CJFDTotal-XDCS201103015.htm (accessed on 30 January 2021).
- Atta, H.A. Visual pollution and statistical determination in some of Karrada district main streets, Baghdad. J. Eng. 2013, 19, 414–428. [Google Scholar]
- Souad, B.F. The Impact of Visual Pollution on Historic Buildings (Tlemcen City, Algeria: Model). Shedet 2014, 1, 35–50. Available online: https://shedet.journals.ekb.eg/article_87632.html (accessed on 30 January 2021).
- Kamičaitytė-Virbašienė, J.; Godienė, G.; Kavoliūnas, G. Methodology of Visual Pollution Assessment for Natural Landscapes. J. Sustain. Archit. Civ. Eng. 2016, 13. [Google Scholar] [CrossRef]
- Kamičaitytė-Virbašienė, J.; Godienė, G. Analysis of Legal and Theoretical Framework Creating the Methodology of Visual Pollution Assessment for Natural Landscapes. J. Sustain. 2015, 44–56. Available online: https://www.ceeol.com/search/article-detail?id=483560 (accessed on 30 January 2021).
- Lascu, L.F. The Impact of Visual Pollution on Quality of Life. Case Study: The Historic Core of Bucharest. Calitatea 2015, 16, 662–666. Available online: http://search.proquest.com/openview/5831355d3b0b410d59c511413801b8cd/1?pq-origsite=gscholar&cbl=1046413 (accessed on 30 January 2021).
- Chmielewski, S.; Lee, D.J.; Tompalski, P.; Chmielewski, T.J.; Wężyk, P. Measuring visual pollution by outdoor advertisements in an urban street using intervisibilty analysis and public surveys. Int. J. Geogr. Inf. Sci. 2016, 30, 801–818. [Google Scholar] [CrossRef]
- Al-Sharaa, A.; Bakar, S.A.; Maulan, S.B. Determining Peoples Threshold Towardes Visual Pollution Using Areal Comulative Analysis and Public Survey. MLA Seminar 2016. Available online: http://mlaupm.com/an-component/media/download/MLA_SEMINAR_2016.pdf#page=18 (accessed on 30 January 2021).
- Bakar, S.A.; al-Sharaa, A.; Maulan, S.; Munther, R. Measuring Visual Pollution Threshold along Kuala Lumpur Historic Shopping District Streets Using Cumulative Area Analysis; SUNY College of Environmental Science and Forestry: Syracuse, NY, USA, 2019; Available online: https://digitalcommons.esf.edu/vrconference/16/ (accessed on 30 January 2021).
- Roca, M.A.S. Numerical assessment of visual pollution degree in an “cultural interest good”: Methodology for implementation. Application of this method to the Albaicin neighbourhood of Granada. E-RPH-Rev. Electron. Patrim. Hist. 2016, 18, 70–83. [Google Scholar]
- Kucharikova, Z.; Simko, J. Visual pollution localization through crowdsourcing and visual similarity clustering. In Proceedings of the 2017 12th International Workshop on Semantic and Social Media Adaptation and Personalization (SMAP), Bratislava, Slovakia, 9–10 July 2017; Available online: https://ieeexplore.ieee.org/abstract/document/8022662/ (accessed on 30 January 2021).
- Shaban, L.K.; Suleiman, S.; Abdel-Aziz, D.; Isawi, H.Y. Evaluating the Visual Pollution in Urban Corridors-Case of Al-Madina Al-Munawara Corridor, Amman. Res. J. Appl. Sci. Eng. Technol. 2018, 15, 288–294. Available online: https://www.airitilibrary.com/Publication/alDetailedMesh?docid=20407467-201808-201811230017-201811230017-288-294 (accessed on 30 January 2021). [CrossRef]
- Xiaolan, T.; Yanyan, J.; Wenyuan, B. An Analysis of Visual Pollution Problems and Countermeasures in the Construction of Beautiful Urban-Rural Areas. J. Nanjing For. 2018. Available online: http://en.cnki.com.cn/Article_en/CJFDTotal-NJLS201802008.htm (accessed on 30 January 2021).
- Melhosseini, D.K.; Mortazavi, S.; Hosseini, S.M.; Shayesteh, K.; Falahatkar, S. Investigating the Visual Pollution of Non-Heterogeneous Land Uses in the Tourist Areas (Case Study: Dohezar And Sehezar Forests of Tonekabon). J. Appl. RS GIS Tech. Nat. Resour. Sci. 2018, 9, 47–58. Available online: https://www.sid.ir/en/journal/ViewPaper.aspx?id=597316 (accessed on 30 January 2021).
- Ahmed, N.; Islam, M.N.; Tuba, A.S.; Mahdy, M.R.C.; Sujauddin, M. Solving visual pollution with deep learning: A new nexus in environmental management. J. Environ. Manag. 2019, 248, 109253. Available online: https://www.sciencedirect.com/science/article/pii/S0301479719309557 (accessed on 30 January 2021). [CrossRef]
- Al-Anbari, M.A.; Abd, M.A.; Obaid, A.H. Evaluation of Some Visual Pollution Indicators in the Physical Environment of Al-Hilla City. Muthanna J. Eng. Technol. 2020, 8, 10–25. Available online: http://engineering.uobabylon.edu.iq/fileshare/articles/repository1_publication6158_15_227.pdf (accessed on 30 January 2021).
- Radomska, M.; Yurkiv, M.; Nazarkov, T. The Assessment of the Visual Pollution from Industrial Facilities in Natural Landscapes. Available online: http://www.kdu.edu.ua/EKB_jurnal/2019_1(27)/PDF/45_49.pdf (accessed on 30 January 2021).
- Ramos, C.V.; Treviño, M.G.M. Perception of Visual Contamination of the Population of the City of H. Matamoros, Tamaulipas. Mexico. Available online: http://www.eumed.net/rev/cccss/2017/03/contaminacion-visual-mexico.zip (accessed on 30 January 2021).
- Chmielewski, S. Chaos in Motion: Measuring Visual Pollution with Tangential View Landscape Metrics. Land 2020, 9, 515. [Google Scholar] [CrossRef]
- Yellin, I.E. Visual Pollution and Aesthetic Regulation. Los Angeles Bar Bull. 1971, 11, 425–434, 456, 458. [Google Scholar]
- Robinette, G. Plants for easing visual pollution, or ways to overcome ugliness [Beautification]. Yearbook of Agriculture U.S. Dept. of Agriculture. 1972. Available online: http://agris.fao.org/agris-search/search.do?recordID=US19790421803 (accessed on 30 January 2021).
- Eyenga, I.I.; Focke, W.W.; Prinsloo, L.C.; Tolmay, A.T. Photodegradation: A solution for the shopping bag ‘visual pollution’ problem? Macromol. Symp. 2002, 178, 139–152. [Google Scholar] [CrossRef]
- Furze, J. Stealth wind turbines: Designs and technologies to reduce visual pollution. Refocus 2002, 3, 18–20. Available online: https://www.sciencedirect.com/science/article/pii/S1471084602800221 (accessed on 30 January 2021). [CrossRef]
- Rescia, P.; Corbetta, E.; Puletti, M.; Rizzi, W.; Tornquist, J. Offshore Plants Visual Pollution Mitigation. In Proceedings of the SPE International Conference on Health, Safety, and Environment in Oil and Gas Exploration and Production, Calgary, AB, Canada, 29–31 March 2004; Available online: https://www.onepetro.org/conference-paper/SPE-86778-MS (accessed on 30 January 2021).
- Chuan, W. Stop Urban Visual Pollution. Archit. Cult. 2009. Available online: http://en.cnki.com.cn/Article_en/CJFDTotal-JZYW200911020.htm (accessed on 30 January 2021).
- Stephany, T.J. Energy Generation System for Reduced Visual Pollution and Cost. U.S. Patent Application 12/189,777, 11 February 2010. Available online: https://patents.google.com/patent/US20100032957A1/en (accessed on 30 January 2021).
- Bi-xuan, M. On exploration for management and strategies of visual pollution in historic streets. Shanxi Archit. 2014. Available online: http://en.cnki.com.cn/Article_en/CJFDTotal-JZSX201416011.htm (accessed on 30 January 2021).
- Bedin, B.; Ferrari, M.; Gajardo, R. Visual Pollution and Its Control in Caxias do sul County from the Municipal Law no. 412/2012/a Poluicao Visual e o seu Controle no Municipio de Caxias do sul a Partir da lei Municipal no. 412/2012. Direito da Cidade. 2015. Available online: https://go.gale.com/ps/i.do?id=GALE%7CA566559048&sid=googleScholar&v=2.1&it=r&linkaccess=abs&issn=23177721&p=IFME&sw=w (accessed on 30 January 2021).
- Cercleux, A.-L.; Merciu, F.-C.; Merciu, G.-L. A Model of Development Strategy Encompassing Creative Industries to Reduce Visual Pollution—Case study: Strada Franceză, Bucharest’s Old City. Procedia Environ. Sci. 2016, 32, 404–411. [Google Scholar] [CrossRef][Green Version]
- Abdelhamid, M.M. An Attempt to Reduce Visual Pollution in the Building Sector within Egyptian Cities. Spaces Flows Int. J. Urban Extra Urban Stud. 2018, 9, 23–34. Available online: http://search.ebscohost.com/login.aspx?direct=true&profile=ehost&scope=site&authtype=crawler&jrnl=21548684&AN=136111844&h=M7nkngiEkrFWaO%2FxFo4Tq8SZZdZA1ZPxrhWTkF%2BSsKqwHeoj3OTeqRZgI6Z5zjivyVFPBQzHadV9s%2Bt0460bpA%3D%3D&crl=c (accessed on 30 January 2021). [CrossRef]
- Nessim, A.A. Visual Pollution: An Approach to Reduce the Environmental Impact of Light Pollution in Egypt. In Architecture and Urbanism: A Smart Outlook; Springer: Cham, Switzerlands, 2020; Available online: https://link.springer.com/chapter/10.1007/978-3-030-52584-2_33 (accessed on 30 January 2021).
- Choudhary, A.; Shrivastava, A.T. Model to mitigate visual polluution by Ads and signage. Int. J. Eng. Res. Gen. Sci. 2016, 4, 516–521. [Google Scholar]
- Jian, A. Road Traffic Safety Management of Visual Pollution By Outdoor Advertisements. Master’s Thesis, Universiti Teknologi Malaysia, Skudai, Malaysia, 2020. [Google Scholar]
- Sahana, S.; Karthigayini, S. Design Strategies to Reduce the Impact of Visual and Noise Pollution in Urban Areas. Asian Rev. Environ. Earth Sci. 2020, 7, 67–71. Available online: https://core.ac.uk/download/pdf/327110692.pdf (accessed on 30 January 2021).
- De Loyola, R.B. Berleant’s Non-Cognitive Engagement Approach in Remedying the Problem on Urban Visual Pollution. Available online: https://www.dlsu.edu.ph/wp-content/uploads/pdf/conferences/arts-congress-proceedings/2018/acp-02.pdf (accessed on 30 January 2021).
- Wakil, K.; Hussnain, M.Q. Regulatory Mechanisms for Outdoor Advertisement Boards in Lahore. In Proceedings of the 2014 International Conference on Town Planning and Urban Management (ICTPUM 2014), Lahore, Pakistan, 29–30 September 2014; Available online: http://citypulse.com.pk/publications/Regulatorymechanismforadvertisementboardsinlahore.pdf (accessed on 16 February 2019).
- Club, S. Visual Pollution. Sierra Club Policies; Sierra Club: Oakland, CA, USA, 1966. [Google Scholar]
- Sadeghi, R.; Mazloomy-Mahmoodabad, S.S.; Rezaeian, M.; Fallahzadeh, H.; Khanjani, N. The application of geographic information systems (ArcGIS) in selecting locations for installing banners and billboards in a health campaign. Health Educ. Res. 2019, 34, 532–541. [Google Scholar] [CrossRef] [PubMed]
- Misagh, N. Designing and developing a citizen-oriented advertisement system based on the concept of geographic fence. Geofence 2020. [Google Scholar] [CrossRef]
- Haidu, I.; Crăciun, A.I.; Lupău, C.; Şerban, C. Using GIS in Order to Detect the Optimal Areas for Dedicated Advertising. Geogr. Tech. 2009, 40–49. Available online: https://www.researchgate.net/publication/236880396_USING_GIS_IN_ORDER_TO_DETECT_THE_OPTIMAL_AREAS_FOR_DEDICATED_ADVERTISING (accessed on 9 December 2015).
- Luke, D.; Esmundo, E.; Bloom, Y. Smoke signs: Patterns of tobacco billboard advertising in a metropolitan region. Tob. Control 2000, 9, 16–23. [Google Scholar] [CrossRef] [PubMed]
- Hillier, A.; Cole, B.L.; Smith, T.E.; Yancey, A.K.; Williams, J.D.; Grier, S.A.; McCarthy, W.J. Clustering of unhealthy outdoor advertisements around child-serving institutions: A comparison of three cities. Health Place 2009, 15, 935–945. [Google Scholar] [CrossRef] [PubMed]
- Malloy, L. Using Location-Based Information to Get More From Your Out-of-Home Advertising. AdSmart Blog. 2014. Available online: http://www.intermap.com/adsmart-blog/2014/09/get-more-from-out-of-home-advertising (accessed on 12 December 2015).
- Pelzer, P. Usefulness of planning support systems: A conceptual framework and an empirical illustration. Transp. Res. Part A Policy Pract. 2017, 104. [Google Scholar] [CrossRef]
- Zigurs, I.; Buckland, B.K. A theory of task/technology fit and group support systems effectiveness. MIS Q. 1998, 22, 313–334. [Google Scholar] [CrossRef]
- Hussnain, M.Q.; Waheed, A.; Wakil, K.; Tahir, A.; Pettit, C.; Pelizaro, C.; Jabbar, J.A. A Planning Support System to Aid Spatial Planning in Pakistan. In Proceedings of the 15th International Conference on Computers in Urban Planning and Urban Management, Adelaide, Australia, 11–14 July 2017. [Google Scholar]
- Hussnain, M.Q.; Waheed, A.; Anjum, G.A.; Naeem, M.A.; Wakil, K.; Tahir, A.; Pettit, C.; Hussain, E. Application of the Online WhatIf? Planning Support System in Peri-urban Spatial Planning; Case study of Muzaffargarh, Pakistan. In Proceedings of the 24th International Conference on Urban Planning and Regional Development in the Information Society 2019, Karlsruhe, Germany, 2–4 April 2019; Volume 4, pp. 77–87. [Google Scholar]
- Li, C.; Xu, C.; Li, X. A multi-criteria decision-making framework for site selection of distributed PV power stations along high-speed railway. J. Clean. Prod. 2020, 277, 124086. [Google Scholar] [CrossRef]
- Saaty, T.L. Decision making with the analytic hierarchy process. Int. J. Serv. Sci. 2008, 1, 83. [Google Scholar] [CrossRef]
- Belton, V. A comparison of the analytic hierarchy process and a simple multi-attribute value function. Eur. J. Oper. Res. 1986, 26, 7–21. [Google Scholar] [CrossRef]
- Carver, S.J. Integrating multi-criteria evaluation with geographical information systems geographical information systems. Int. J. Geogr. Inf. Syst. 1991, 5, 321–339. [Google Scholar] [CrossRef]
- Goepel, K.D. Implementing the analytic hierarchy process as a standard method for multi-criteria decision making in corporate enterprises—A new AHP excel template with multiple inputs. In Proceedings of the International Symposium on the Analytic Hierarchy Process, Kuala Lumpur, Malaysia, 23–26 June 2013. [Google Scholar]
- Kil, S.-H.; Lee, D.K.; Kim, J.-H.; Li, M.-H.; Newman, G. Utilizing the Analytic Hierarchy Process to Establish Weighted Values for Evaluating the Stability of Slope Revegetation based on Hydroseeding Applications in South Korea. Sustainability 2016, 8, 58. [Google Scholar] [CrossRef]
- Huang, R.; Yeh, C. Development of an assessment framework for green highway construction. J. Chin. Instig. Eng. 2008, 31, 573–585. [Google Scholar] [CrossRef]
- Franek, J.; Kresta, A. Judgment Scales and Consistency Measure in AHP. Procedia Econ. Financ. 2014, 12, 164–173. [Google Scholar] [CrossRef]
- Mardani, A.; Jusoh, A.; Nor, K.M.D.; Khalifah, Z.; Zakwan, N.; Valipour, A. Multiple criteria decision-making techniques and their applications—A review of the literature from 2000 to 2014. Econ. Res. Istraz. 2015, 28, 516–571. [Google Scholar] [CrossRef]
- Mohajeri, N.; Amin, G.R. Railway station site selection using analytical hierarchy process and data envelopment analysis. Comput. Ind. Eng. 2010, 59, 107–114. [Google Scholar] [CrossRef]
- Beskese, A.; Demir, H.H.; Ozcan, H.K.; Okten, H.E. Landfill site selection using fuzzy AHP and fuzzy TOPSIS: A case study for Istanbul. Environ. Earth Sci. 2015, 73, 3513–3521. [Google Scholar] [CrossRef]
- Noorollahi, E.; Fadai, D.; Shirazi, M.A.; Ghodsipour, S.H. Land suitability analysis for solar farms exploitation using GIS and fuzzy analytic hierarchy process (FAHP)—A case study of Iran. Energies 2016, 9, 643. [Google Scholar] [CrossRef]
- Asakereh, A.; Soleymani, M.; Sheikhdavoodi, M.J. A GIS-based Fuzzy-AHP method for the evaluation of solar farms locations: Case study in Khuzestan province, Iran. Solar Energy 2017, 155, 342–353. [Google Scholar] [CrossRef]
- Taibi, A.; Atmani, B. Combining Fuzzy AHP with GIS and Decision Rules for Industrial Site Selection. Int. J. Interact. Multim. Artif. Intell. 2017, 4, 60–69. [Google Scholar] [CrossRef]
- Darani, S.K.; Eslami, A.A.; Jabbari, M.; Asefi, H. Parking Lot Site Selection Using a Fuzzy AHP-TOPSIS Framework in Tuyserkan, Iran. J. Urban Plan. Dev. 2018, 144, 04018022. [Google Scholar] [CrossRef]
- Tsiko, R.G.; Haile, T.S. Integrating Geographical Information Systems, Fuzzy Logic and Analytical Hierarchy Process in Modelling Optimum Sites for Locating Water Reservoirs. A Case Study of the Debub District in Eritrea. Water 2011, 3, 254–290. [Google Scholar] [CrossRef]
- Di Zio, S.; Rosas, J.D.C.; Lamelza, L. Real Time Spatial Delphi: Fast convergence of experts’ opinions on the territory. Technol. Forecast. Soc. Chang. 2017, 115, 143–154. [Google Scholar] [CrossRef]
- Gomez, J.E.A., Jr. The Billboardization of Metro Manila. Int. J. Urban Reg. Res. 2013, 37, 186–214. [Google Scholar] [CrossRef]
- GoP. Punjab Local Government Act 2013; GoP: Lahore, Pakistan, 2013. [Google Scholar]
- Jiang, H.; Yi, J.; Chen, S.; Zhu, X.; Wang, Z. A Novel RFID-Based Outdoor Billboard Management System. In Proceedings of the 2015 International Conference on Advanced Manufacturing and Industrial Application, Phuket, Thailand, 20–21 December 2015. [Google Scholar] [CrossRef]
- Ke, X.; Li, J.; Liu, J.; Yu, Y. Design and implementation of billboards management system base on measurable streetview map. J. Geomat. 2015, 40, 71–73. [Google Scholar] [CrossRef]
- Andrei, B. The automation of a sustainable billboard management system. In Proceedings of the 2013 8th International Symposium on Advanced Topics in Electrical Engineering (Atee), Bucharest, Romania, 23–25 May 2013; Available online: https://ieeexplore.ieee.org/abstract/document/6563490/ (accessed on 30 January 2021).
- Mahabadi, M.; Mahabadi, S.; Shariaty, S. Method and system for providing management services to billboard owners and providing billboard availability data to billboard renters. U.S. Patent Application 10/876,154, 30 December 2004. Available online: https://patents.google.com/patent/US20040267634A1/en (accessed on 30 January 2021).


| Serial Number | Attributes | Categories |
|---|---|---|
| 1 | GPS location | Latitude, longitude |
| 2 | Type of structure | Wooden structure, iron structure monopole, multi post |
| 3 | Size of billboard | Small, 10 × 20, 20 × 30, 30 × 40, 30 × 90, Larger |
| 4 | Type of message | Commercial, religious, movie, public service message, harsh religious/political statement, political, indecent postures |
| 5 | Face directions | Single, double, vertical |
| 6 | Road frontage | In feet, number of lanes and flow direction |
| 7 | Type of advertisement board | Digital, mechanical, painted, mobile, poster, other |
| 8 | Number of display surfaces | Single facing, double facing (back to back), v facing triangle |
| 9 | Placement | Stand alone, on-wall, on the rooftop, other |
| 10 | Condition | Broken, leaning, torn off, normal and good |
| 11 | Ownership | Billboard ownership, contact details |
| 12 | Legal status | Permitted, nonpermitted (legal, illegal) |
| Controlling Agency | Advertisers | Community |
|---|---|---|
Need to know:
| Need to know
| Need a mechanism to report if a billboard is causing visual pollution (due to its size, condition, or type of message) |
| Admin Panel | Users Panel |
|---|---|
| Adding/uploading of layers | Viewing/visualizing of layers (on/off, feature identification, measure distance) |
| Editing of layers | Calculating the point density of the billboards by showing it as a layer |
| Visualization control | Symbolizing (setting the opacity of layers and symbols by attributes such as classification of billboards by size, ownership, cost) |
| Knowledge management | Specification of the regularity controls as quantitative equations |
| Query Types. | Query Functions |
|---|---|
| Select queries on attributes (nonspatial query) | Select billboards where size is of a certain size e.g., larger than 90ft |
| Select billboards where pole type is for example “Monopole” | |
| Select blocks where land use is “Residential” | |
| Spatial queries (Select objects from a layer based on their proximity to some other layer.) | Select billboards which are within “x” meters of a selected road |
| Select billboard which is within “x” of parcel block | |
| Select billboards which are within “x” meters of a point on a map |
Publisher’s Note: MDPI stays neutral with regard to jurisdictional claims in published maps and institutional affiliations. |
© 2021 by the authors. Licensee MDPI, Basel, Switzerland. This article is an open access article distributed under the terms and conditions of the Creative Commons Attribution (CC BY) license (http://creativecommons.org/licenses/by/4.0/).
Share and Cite
Wakil, K.; Tahir, A.; Hussnain, M.Q.u.; Waheed, A.; Nawaz, R. Mitigating Urban Visual Pollution through a Multistakeholder Spatial Decision Support System to Optimize Locational Potential of Billboards. ISPRS Int. J. Geo-Inf. 2021, 10, 60. https://doi.org/10.3390/ijgi10020060
Wakil K, Tahir A, Hussnain MQu, Waheed A, Nawaz R. Mitigating Urban Visual Pollution through a Multistakeholder Spatial Decision Support System to Optimize Locational Potential of Billboards. ISPRS International Journal of Geo-Information. 2021; 10(2):60. https://doi.org/10.3390/ijgi10020060
Chicago/Turabian StyleWakil, Khydija, Ali Tahir, Muhammad Qadeer ul Hussnain, Abdul Waheed, and Raheel Nawaz. 2021. "Mitigating Urban Visual Pollution through a Multistakeholder Spatial Decision Support System to Optimize Locational Potential of Billboards" ISPRS International Journal of Geo-Information 10, no. 2: 60. https://doi.org/10.3390/ijgi10020060
APA StyleWakil, K., Tahir, A., Hussnain, M. Q. u., Waheed, A., & Nawaz, R. (2021). Mitigating Urban Visual Pollution through a Multistakeholder Spatial Decision Support System to Optimize Locational Potential of Billboards. ISPRS International Journal of Geo-Information, 10(2), 60. https://doi.org/10.3390/ijgi10020060