Article

Smart Design for Evacuation Signage Layout for Exhibition Halls in Exhibition Buildings Based on Visibility

1
Faculty of Architecture and Urban Planning, Chongqing University, Chongqing 400044, China
2
College of Architecture and Urban Planning, Chongqing Jiaotong University, Chongqing 400074, China
*
Author to whom correspondence should be addressed.
ISPRS Int. J. Geo-Inf. 2021, 10(12), 806; https://doi.org/10.3390/ijgi10120806
Submission received: 13 September 2021 / Revised: 27 November 2021 / Accepted: 29 November 2021 / Published: 30 November 2021

Abstract

:
The reasonable placement of evacuation signage is an important means to improve the efficiency of evacuation in the exhibition halls of exhibition buildings. The booths in exhibition halls are arranged and changed frequently for different exhibitions, which means that the evacuation paths are not fixed. Most people are also unfamiliar with the exhibition hall environment. In case of fire, earthquake, or other emergencies, people need to quickly escape to the safety exit, adhering to the guidance of evacuation signage. Existing evacuation signs are located according to the standards and the experience of the designers, and the locations of the signs are fixed and do not change with the changes in the booth layout, which means that the signage can be easily obscured by the booths, affecting the signage identification. Based on the visibility of evacuation signage, a smart design method of evacuation signage layout is proposed in this paper that can be adapted to different forms of booth arrangements in exhibition halls. This method establishes a key goal of achieving the full coverage of the visibility range of evacuation passages with the minimum number of evacuation signs. In the context of the actual visibility range of evacuation signage being blocked by booths in a three-dimensional space, this method finds the optimal number and best locations of evacuation signs by using a genetic algorithm. Finally, a case is given to verify the effectiveness of the method. This smart design for evacuation signage layout can enhance the guidance ability of evacuation signage in exhibition halls and improve the efficiency of evacuation.

1. Introduction

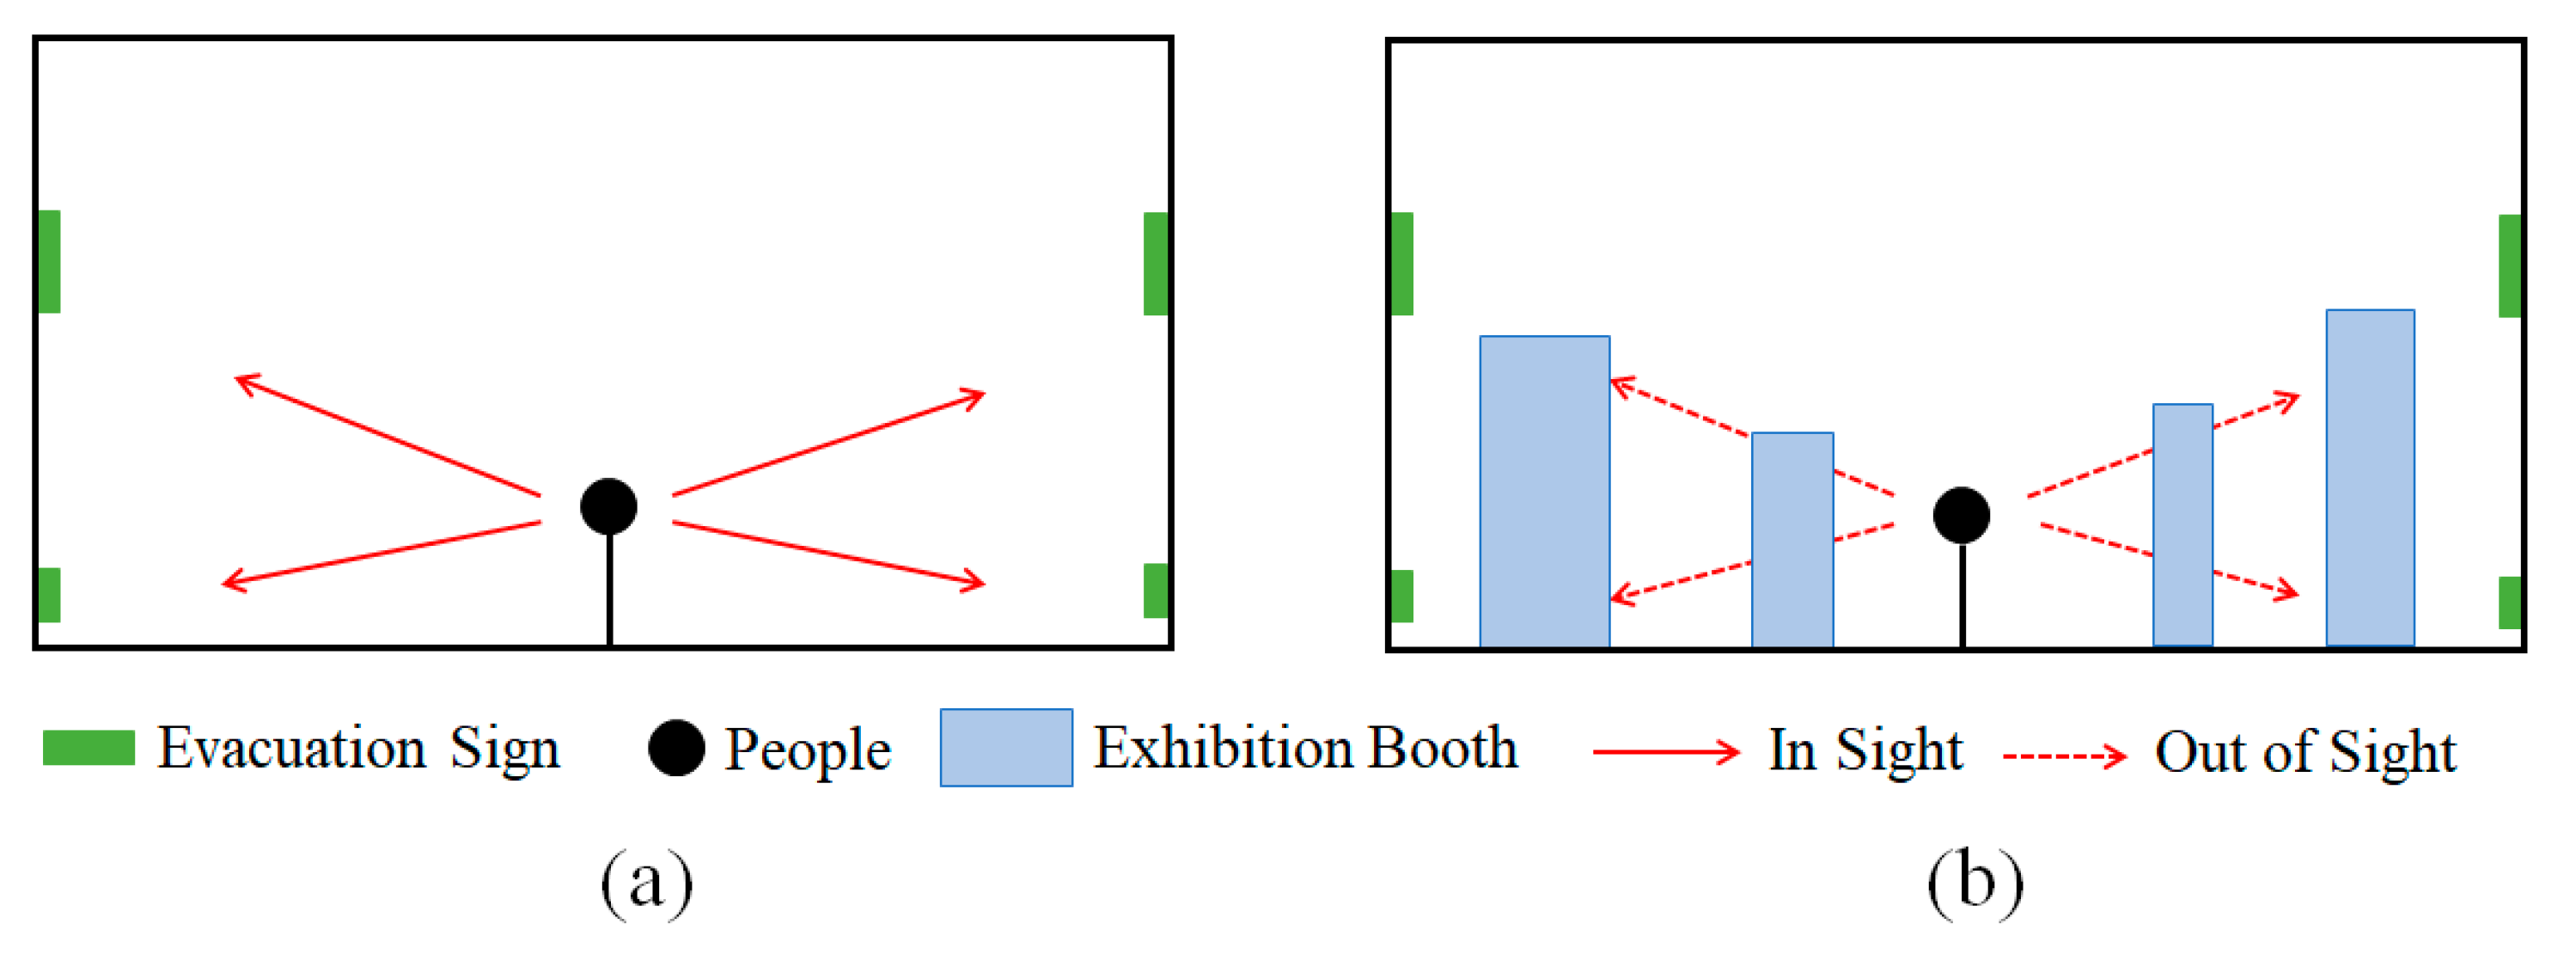
The development of exhibition buildings has recently shown a trend of increasing scale and complexity [1]. The exhibition hall is an important part of an exhibition building [2]. During an exhibition, the booths are arranged according to the exhibition theme and content of the exhibition, which varies significantly and leads to irregular evacuation paths [3,4]. In addition, there are many types of visitors, who are primarily first time visitors, unfamiliar with the exhibition hall environment, and they crowd in the hall during the exhibition. In case of fire, terrorist attack, earthquake, or other emergencies, they must quickly escape to the safety exit [5]. A reasonable placement of evacuation signage can effectively improve the efficiency of evacuation [6], but the existing evacuation signs in exhibition halls are laid out according to the relevant legislation, standards, and designers’ experience. Before the booths are laid out (when there is no exhibition), the evacuation signs arranged on the walls or at the safety exits can be seen very directly in the empty exhibition hall. However, after an exhibition is installed, some of the evacuation signs may be obscured by the booths, and visitors cannot effectively identify the signs [7,8] (Figure 1 and Figure 2). The layout of evacuation signage cannot flexibly adapt to the variations in the exhibition hall layout, which leads to a reduction in the actual guiding efficiency of the evacuation signage [9] and is not conducive to the safe evacuation of people in the exhibition hall.
Evacuation signage plays the role of conveying evacuation guidance information in the exhibition space, and its effectiveness is influenced by both sign visibility and content readability. Currently, the legislation, standards, and related studies, such as the Design Code for Exhibition Building (JGJ 218-2010) and the Code for Fire Protection Design of Buildings (GB50016-2014), have primarily focused on sign text [10], graphics [11,12], color [13,14], size [15], brightness characteristics [16,17], and smart evacuation guidance systems [18,19] to solve the problem of the readability of evacuation signage, but not much research has been devoted to whether evacuation signage can be “seen”. In practice, many evacuation signs are often set up formally, blindly, and arbitrarily, ignoring the relationship between booth layout and the visibility range of evacuation signage in the three-dimensional space.
Evacuation behavior needs are closely related to the guidance efficiency of the evacuation signage, so it is necessary to ensure that people can identify the evacuation signage at any position along the evacuation passages to ensure that people can quickly reach the safety exit [20]. Based on visibility, this paper introduces a smart evacuation signage layout design method that can be adapted to different booth layout forms in the exhibition hall. As the key goal, the minimum number of evacuation signs and the best location to achieve full coverage of the visibility range of the evacuation passages in the exhibition hall are determined. In addition, the calculation model for determining the actual visibility range of the evacuation signage is proposed to make up for the limitation of only considering two-dimensional planes in past research. This is conducted in order to enhance the rationality and feasibility of the layout method by fully considering the relationship between the height and scale changes of booths on the visibility range of evacuation signage in a three-dimensional space. The paper is organized as follows: Section 2 summarizes the current status and shortcomings of the existing research by performing a literature review; Section 3 describes the smart design method of evacuation signage layout adapted to different exhibition hall scenarios; Section 4 conducts a case study to verify the reliability and validity of the signage layout design model; and Section 5 concludes the paper.

2. Related Work

2.1. Research on the Visibility of Evacuation Signage

The visibility of evacuation signage is a necessary precondition to ensure the rationality of evacuation signage layout [21]. People need to identify and understand the signage before they can make choices of evacuation behavior based on the signage information [22,23]. Visibility emphasizes the visual accessibility, i.e., the scope or visibility of a sign from one or more locations [24,25]. This is an important evaluation indicator of whether the sign can be seen [26]. The visibility of evacuation signage is generally expressed in terms of the viewable area or visibility range, which is the range of the spatial area in which a person can visually receive information about an object [8,27,28].
The location and number of evacuation signs have a significant impact on the visibility of evacuation information. According to the ISO 16069:2017 (Graphical symbols—Safety signs—Safety way guidance systems), the signs are divided into high, intermediate, and low location placements according to their height. Low evacuation signs are generally installed on the floor or slightly above the floor. High evacuation signs are installed at the same height as the ceiling or at a distance of no less than 1.8 m from the floor level. Horasan [7] and Fu et al. [29] concluded that high evacuation signs have a positive impact on the choice of evacuation routes in large building spaces. Du [30] further divided the signage into boundary signage and internal signage according to the planar position of the evacuation signage. In the early and middle evacuation stages, the internal signage in the exhibition hall plays the primary role, and people who are stressed follow the guides to find the boundaries of the safety area, walls, and exits, and quickly escape to the safety exit during the late evacuation period according to the direction of the boundary signage.
Research on the amount of evacuation signage in the exhibition hall shows that when the number of signs is small, the visibility range of the evacuation signage in a space has a small impact area with a visual blind spot. However, this does not mean the more evacuation signs, the better. Too many signs will bring a sense of stress to people, leading to difficulties in choosing where to go when escaping. When the number of signs is more than a threshold value, the evacuation effectiveness tends to be stable, and further increasing the number of evacuation signs has little effect on improvements in evacuation efficiency [31].
Existing studies have considered the visibility of evacuation signs that are obscured. Nassar et al. [32] considered the maximization of visibility and minimization of obscuration of evacuation signage for evaluating the visibility range of evacuation signage at different locations, but this approach has obvious limitations and is only applicable at fixed locations. Chen et al. [33] and Dubey et al. [34] did not consider how the vertical height in a three-dimensional space is related to evacuation signage and booth visibility. They started from a two-dimensional plane to determine the obscuration relationship between evacuation signage and obstacles. Visibility exists in three-dimensional (3D) space perception. Adding the change in vertical isovists in a 3D space can better reflect the actual visual range [35]. Three-dimensional spatial visibility analysis has been used in the fields of geography [36], urban space [37,38], architecture [39,40], and landscape architecture [41]. However, related research and existing software (e.g., ArcGIS, Depthspace 3D) are not suitable for solving the visibility range of evacuation signage. Therefore, it is necessary to pay attention to vertical height in the 3D spatial relationship between the evacuation signage and the booth, so as to obtain the actual visibility range of the evacuation signage.

2.2. Research on the Layout of Evacuation Signage

The placement of evacuation signage in buildings is a complex task. One method is to use virtual reality (VR) or eye tracking devices for human experiments. Kubota et al. [42] and Motamedi et al. [43] conducted a VR experiment to evaluate the effect of evacuation signage locations on their visibility to people by studying the orientation and angle of the signage in order to locally optimize the layout of evacuation signage. Zhu et al. [44] introduced an eye-tracking device to determine the location of evacuation signage through the guidance efficiency of evacuation signs. The purpose of these studies is mainly to evaluate the potential location of signs or to suggest the rationality of sign layout optimization. Evacuation signs were set manually in advance and could not be automatically arranged.
Another method is to combine mathematical models with computer simulation to develop intelligent and effective evacuation sign layout to promote smooth evacuation. Chen et al. [33] proposed a Lagrangian relaxation algorithm, which used the theory of the maximum covering location problem (MCLP) to calculate the visibility of an evacuation sign that is obscured, and to maximize the coverage area of the visibility range for a given number of people to be evacuated. Zhang et al. [31] combined the exponential dichotomy search method and heuristic search algorithm to solve the cooperative maximum cover location problem (CMCLP). However, they did not consider actual complex scenes and obstacles. Chu et al. [45] considered both the number of signs and evacuation passage constraints to determine the location of evacuation signage based on the path nodes of people’s activities. Dubey et al. [34] optimized the signage arrangement in buildings with multiple criteria and determined the optimal signage layout in the visibility range according to a particle swarm algorithm. The existing evacuation signs in these studies can be actively set to the best position, reducing the occlusion of the visibility range of the signs. However, the problem is that it does not guarantee full coverage of the visibility range in the building space.
Based on the work mentioned above, most of the studies on evacuation signage layout have been conducted in subway stations, school buildings, and shopping malls with fixed scenes and obstacles in a single building space, but without considering the special variable situations that exhibition buildings present. The number and location of evacuation signs should be determined according to the specific exhibition scene. In addition, in terms of evacuation signage visibility, although attention has been paid to the horizontal blocking of obstacles to the line of sight, the influence of vertical blocking of the visibility range of signage in a booth in a three-dimensional space has been ignored. Therefore, the proposal of solutions to cope with the variability in exhibition hall booth layouts in a three-dimensional space without affecting the exhibition hall booth layout, and how to ensure visibility anywhere in the space through the optimal location and number of evacuation signs still require further exploration. This study provides a new method for solving these problems.

3. Method

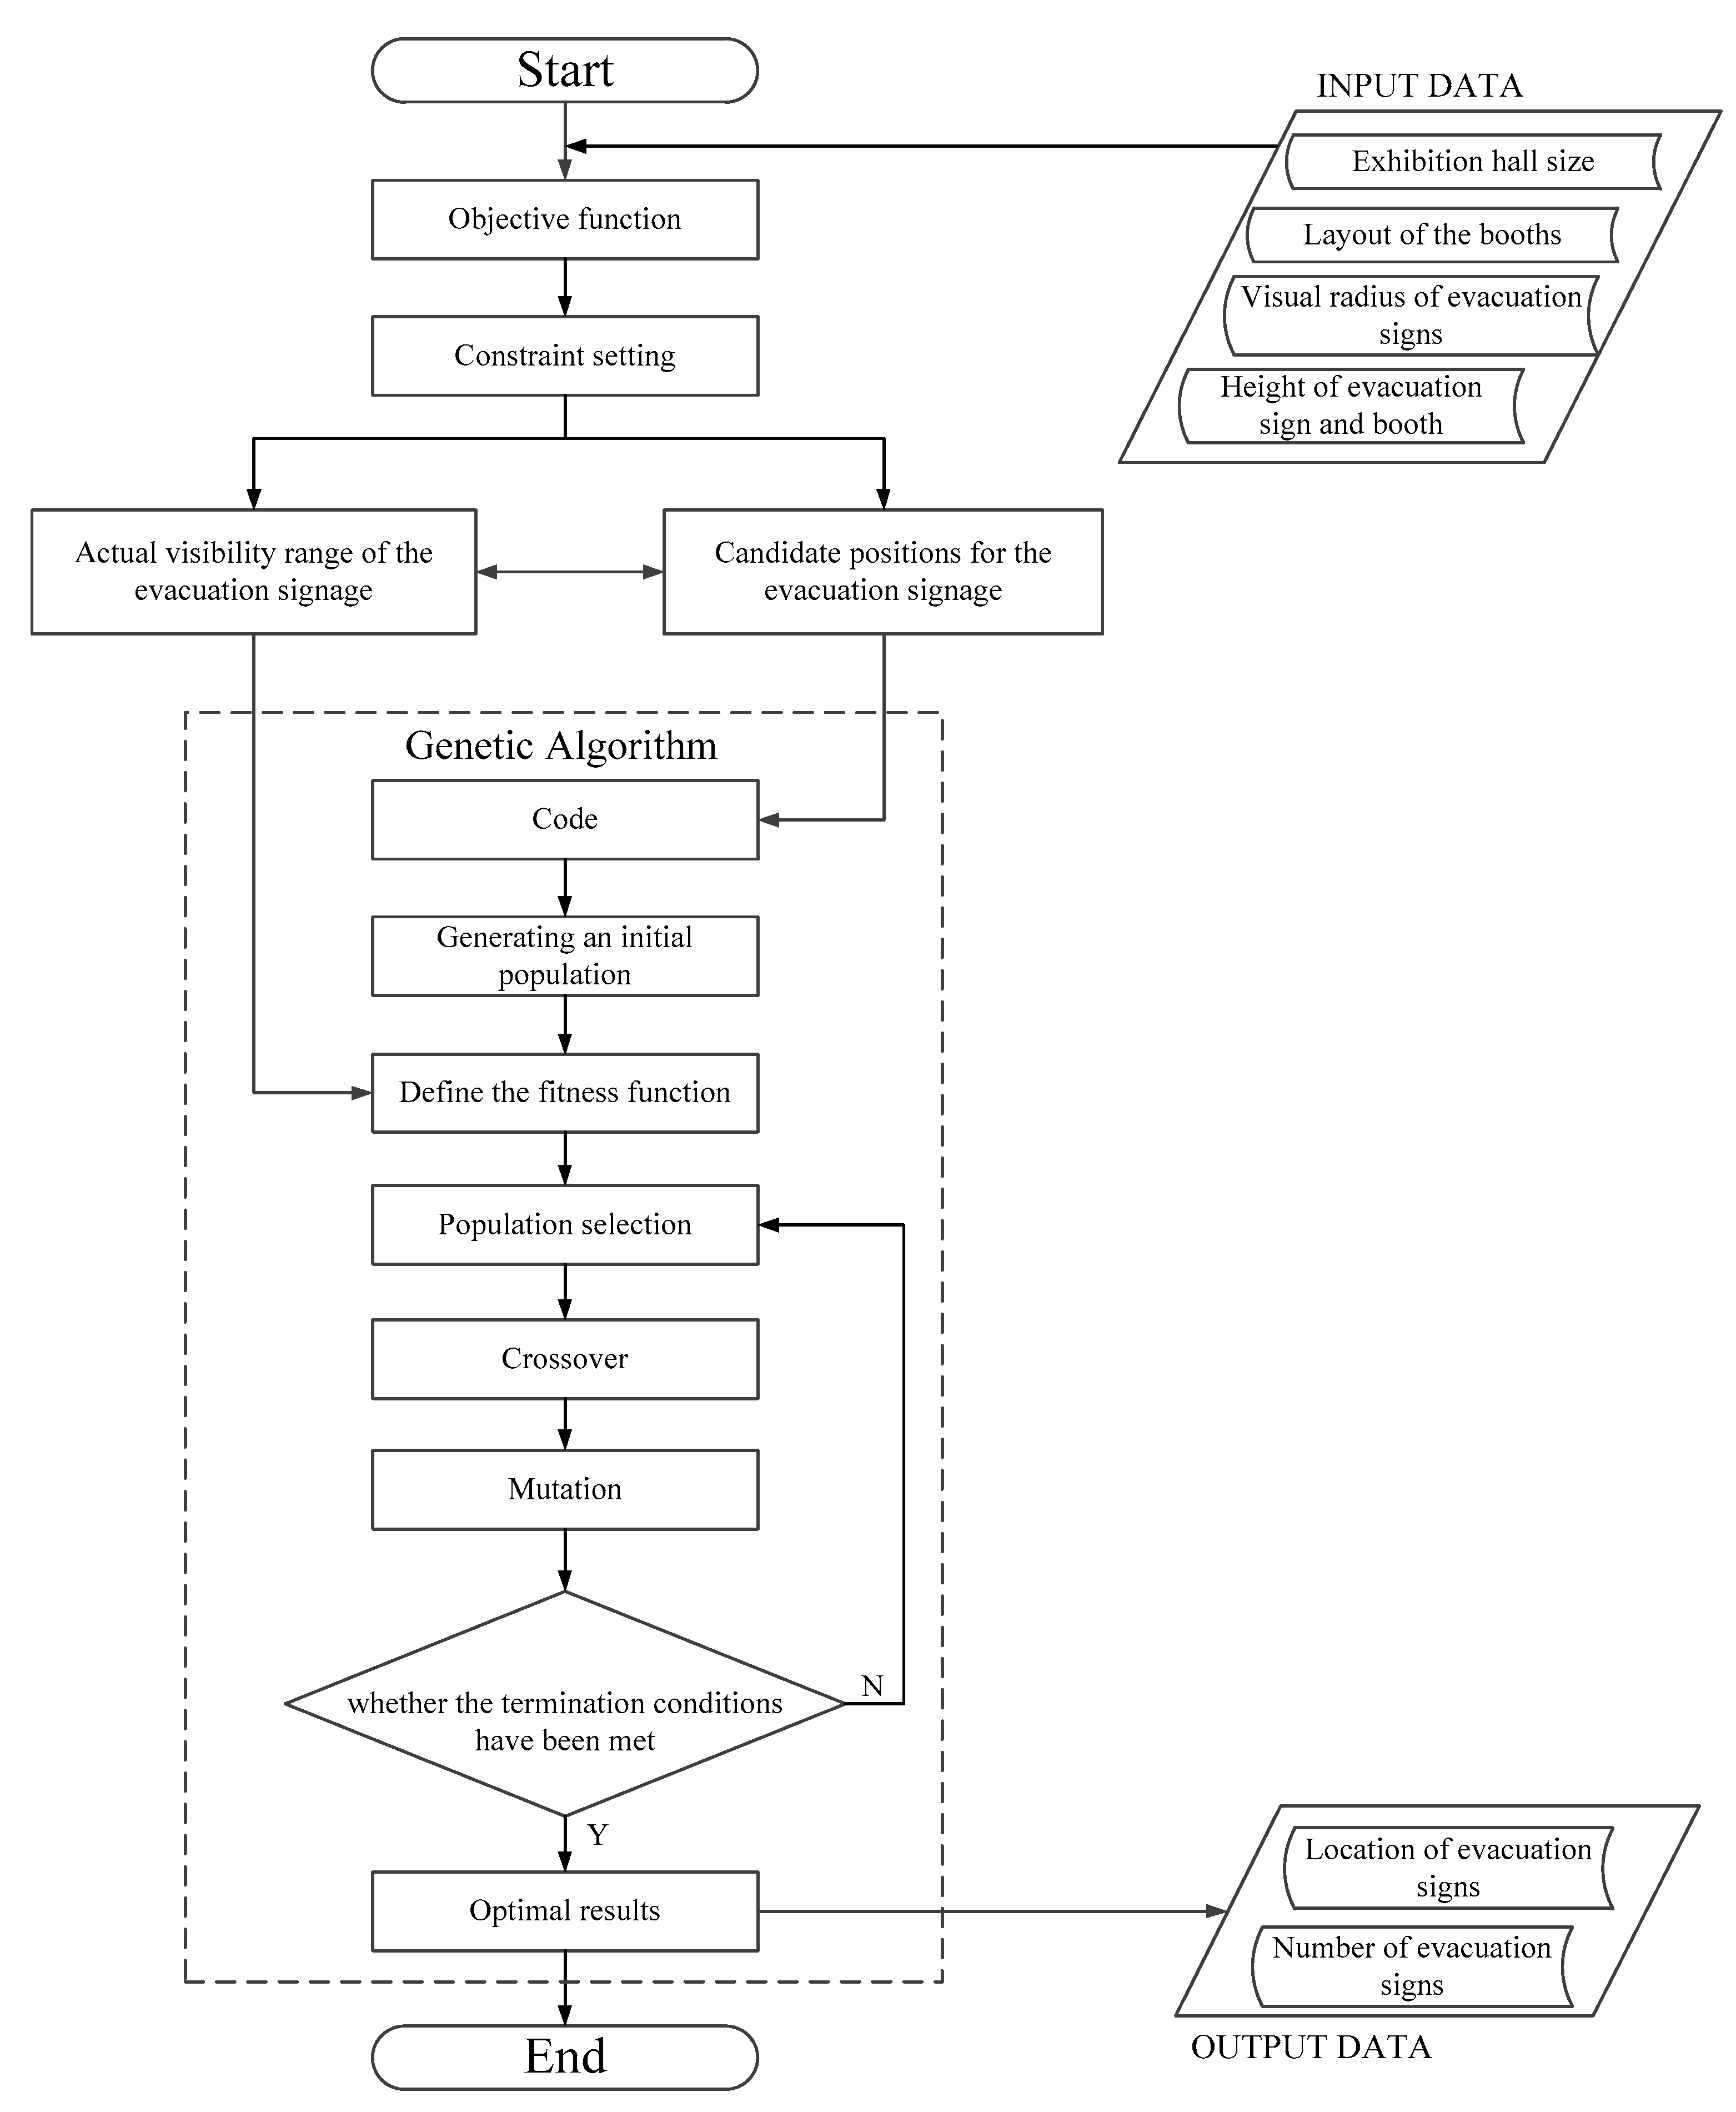
In this section, the workflow of the smart design method of evacuation signage layout in an exhibition hall is explained in detail (Figure 3). First, for the problem of signage layout in the exhibition hall, on the basis of ensuring the visibility of evacuation signage, the objective function of the evacuation signage layout is proposed according to the known information and constraints, such as the exhibition hall booth layout and related dimensions (length, width, and height). In addition, the actual visibility range of the evacuation signs that are blocked is calculated, the candidate positions of the evacuation signage are determined, and the optimal position and number of evacuation signs are solved using a genetic algorithm. The model is programmed using MATLAB R2018a software (MathWorks, Natick, MA, USA) to determine the best location and number of evacuation signs.

3.1. Optimization Formulation

For any form of exhibition booth layout, during the process of people evacuation, it is necessary to maintain the continuity of identification of evacuation signage, i.e., the evacuation signage can be identified at any position along the evacuation passage in an exhibition hall. The actual visibility range of the evacuation signs and the total number of evacuation signs are used as the judgment criteria. The objective of evacuation signage layout optimization in an exhibition hall is to achieve full coverage of the visibility range of the evacuation passage with the minimum number of evacuation signs. In order to coordinate the relationship between the different objectives, the weight coefficient method was used to convert multiple sub-objective functions into a single-objective function using a weighting calculation, and the equation for converting a multi-objective function into a single-objective function is defined as follows:
min f = α N 1 N + ( 1 α )   ( 1 S 1 S )
where f is the weighted sum of the number of evacuation signs and the coverage of the visibility range; α is the weight ratio of the number of evacuation signs to the coverage of the visibility range in different exhibition halls, satisfying 0 < α < 1; N 1 is the number of evacuation signage layouts in the exhibition hall; N is the number of candidate positions of the evacuation signage, and N 1 N; S 1 is the actual coverage area of the visibility range of evacuation signage in the exhibition hall; and S is the total area covered by the visibility range of evacuation signage in the exhibition hall, and S 1 S.

3.2. Constraint Setting

Based on the premise that the information, such as the layout plan of the exhibition hall and booth, and the related dimensions (length, width, and height) are known, and excluding the influencing factors not related to the environment of the exhibition hall, the constraints for the booth and evacuation signage were defined as follows.
(1) People could identify at least one evacuation sign at any position along the evacuation passage of the exhibition hall and could be guided to the safety exit using the sign.
(2) The shapes of the exhibition hall and booths were rectangular. The thickness of the walls of the exhibition hall and the booths were not considered, and the size of the exhibition hall was only the size of the axes of the exhibition hall.
(3) The safety exit and evacuation signs in the exhibition hall did not consider the actual size, which was indicated by points. The existing evacuation signs were placed above the safety exit of the exhibition hall. All of the new evacuation signs in the exhibition hall must be placed along the center line of the evacuation passage, and the heights must be consistent.
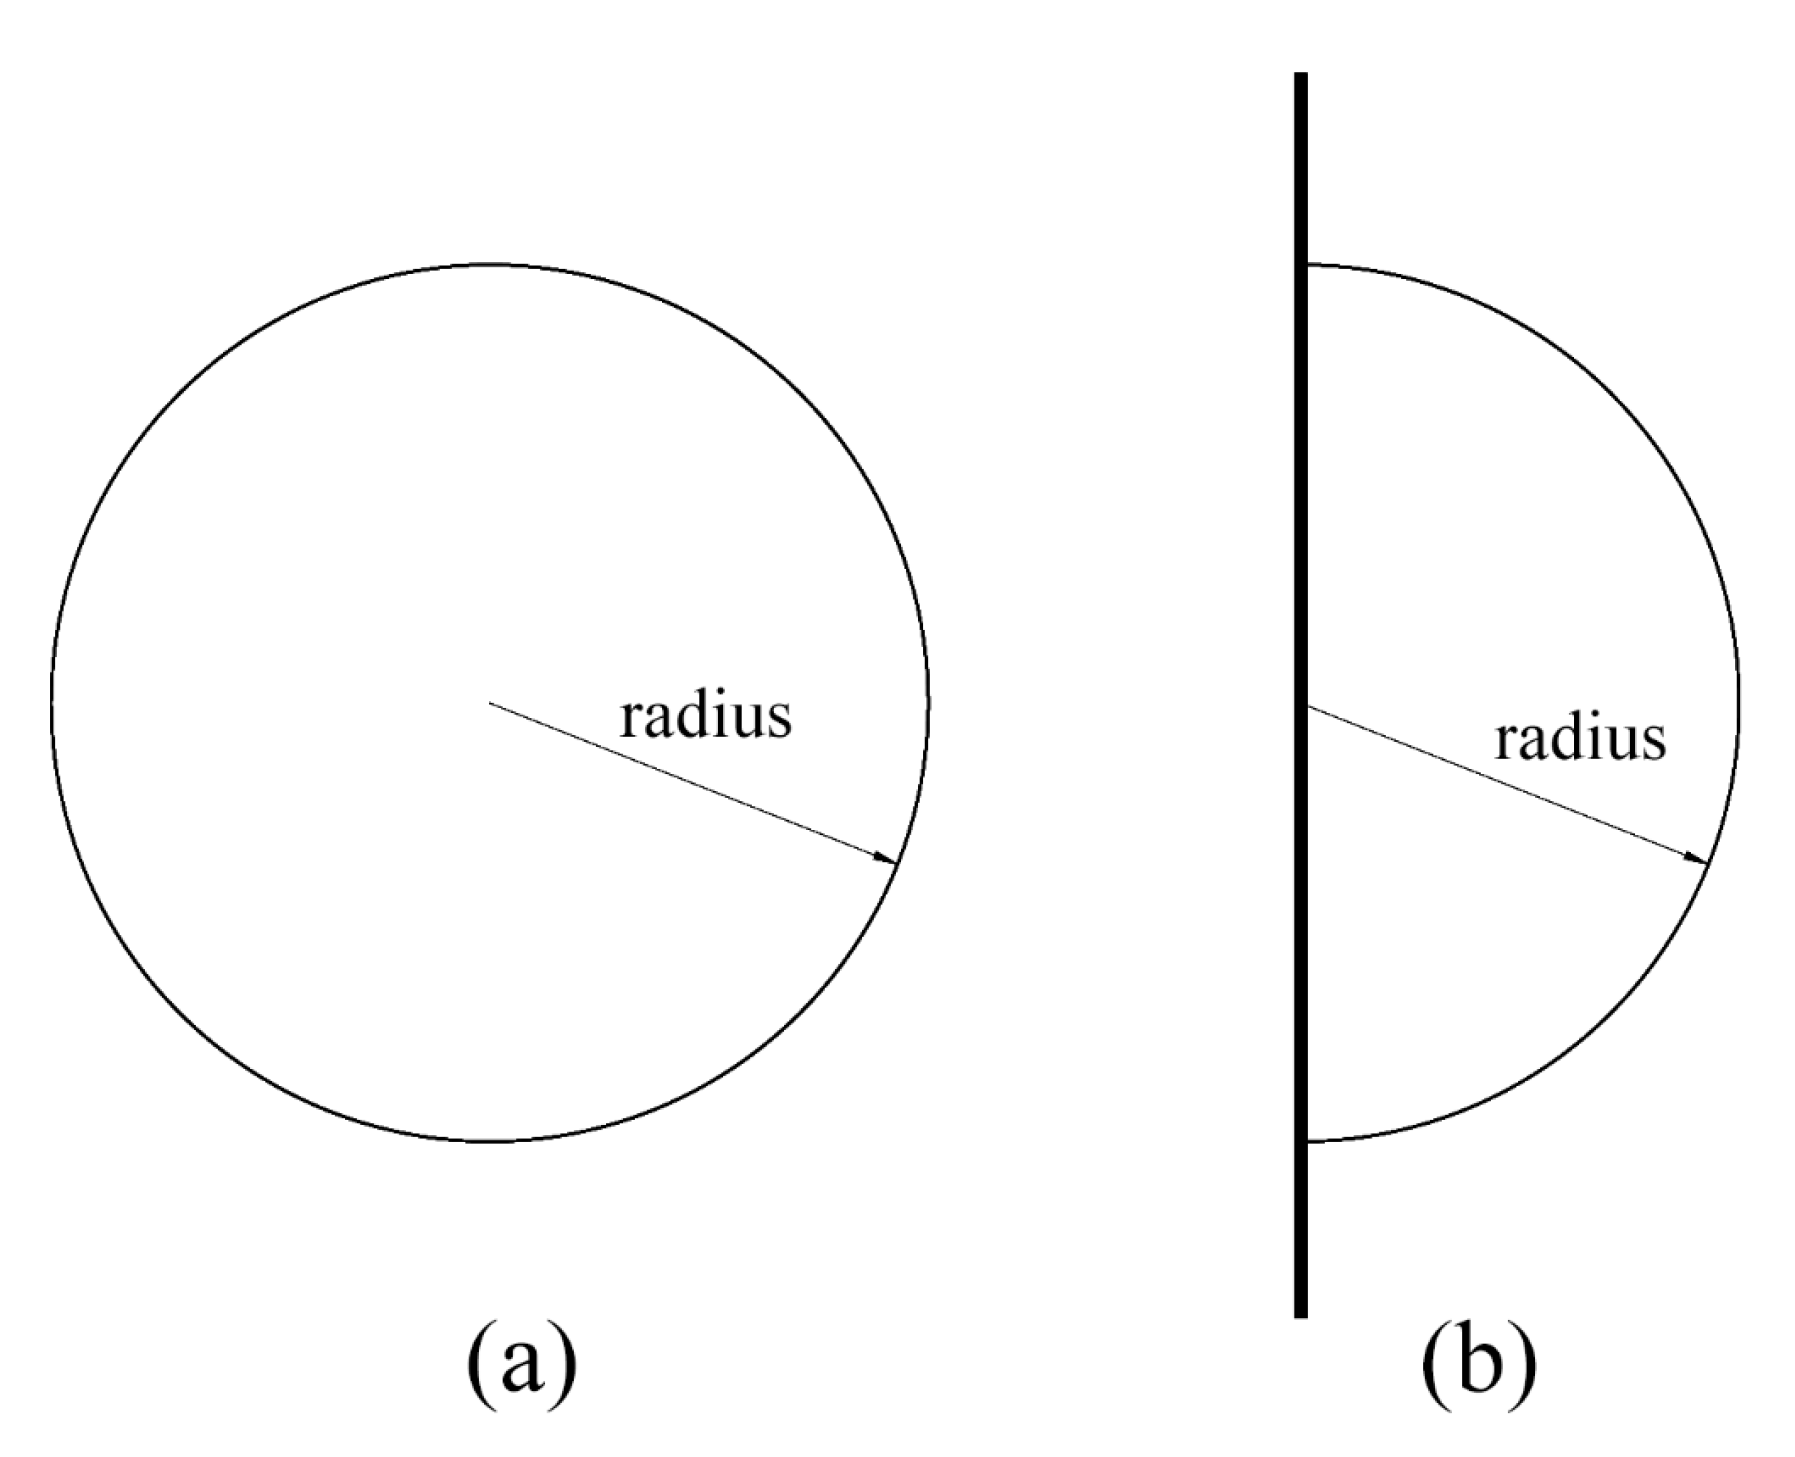
(4) The evacuation signs were divided into two categories: the visibility range of the evacuation signs in the exhibition hall that were not blocked was a circular coverage area with a radius r, and the visibility range of the evacuation signs above the safety exit or on the wall that were not blocked was a semicircular coverage area of radius r [33] (Figure 4).

3.3. Solution to the Evacuation Signage Layout Optimization Model

The model solution was divided into two steps. First, to determine the actual visibility range of the evacuation signage and candidate positions of the evacuation signage. Second, to solve the optimal location and number of evacuation signs using the genetic algorithm.

3.3.1. Model for Determining the Actual Visibility Range of the Evacuation Signage

After the evacuation signs in the exhibition hall were blocked by a booth, the visibility range of the evacuation signage changed. The actual visibility range of the evacuation signage refers to the collection of points that can be observed by the line of sight of people within the range of the identification signage, which needs to be determined using the judgment of the intervisibility of line of sight several times.
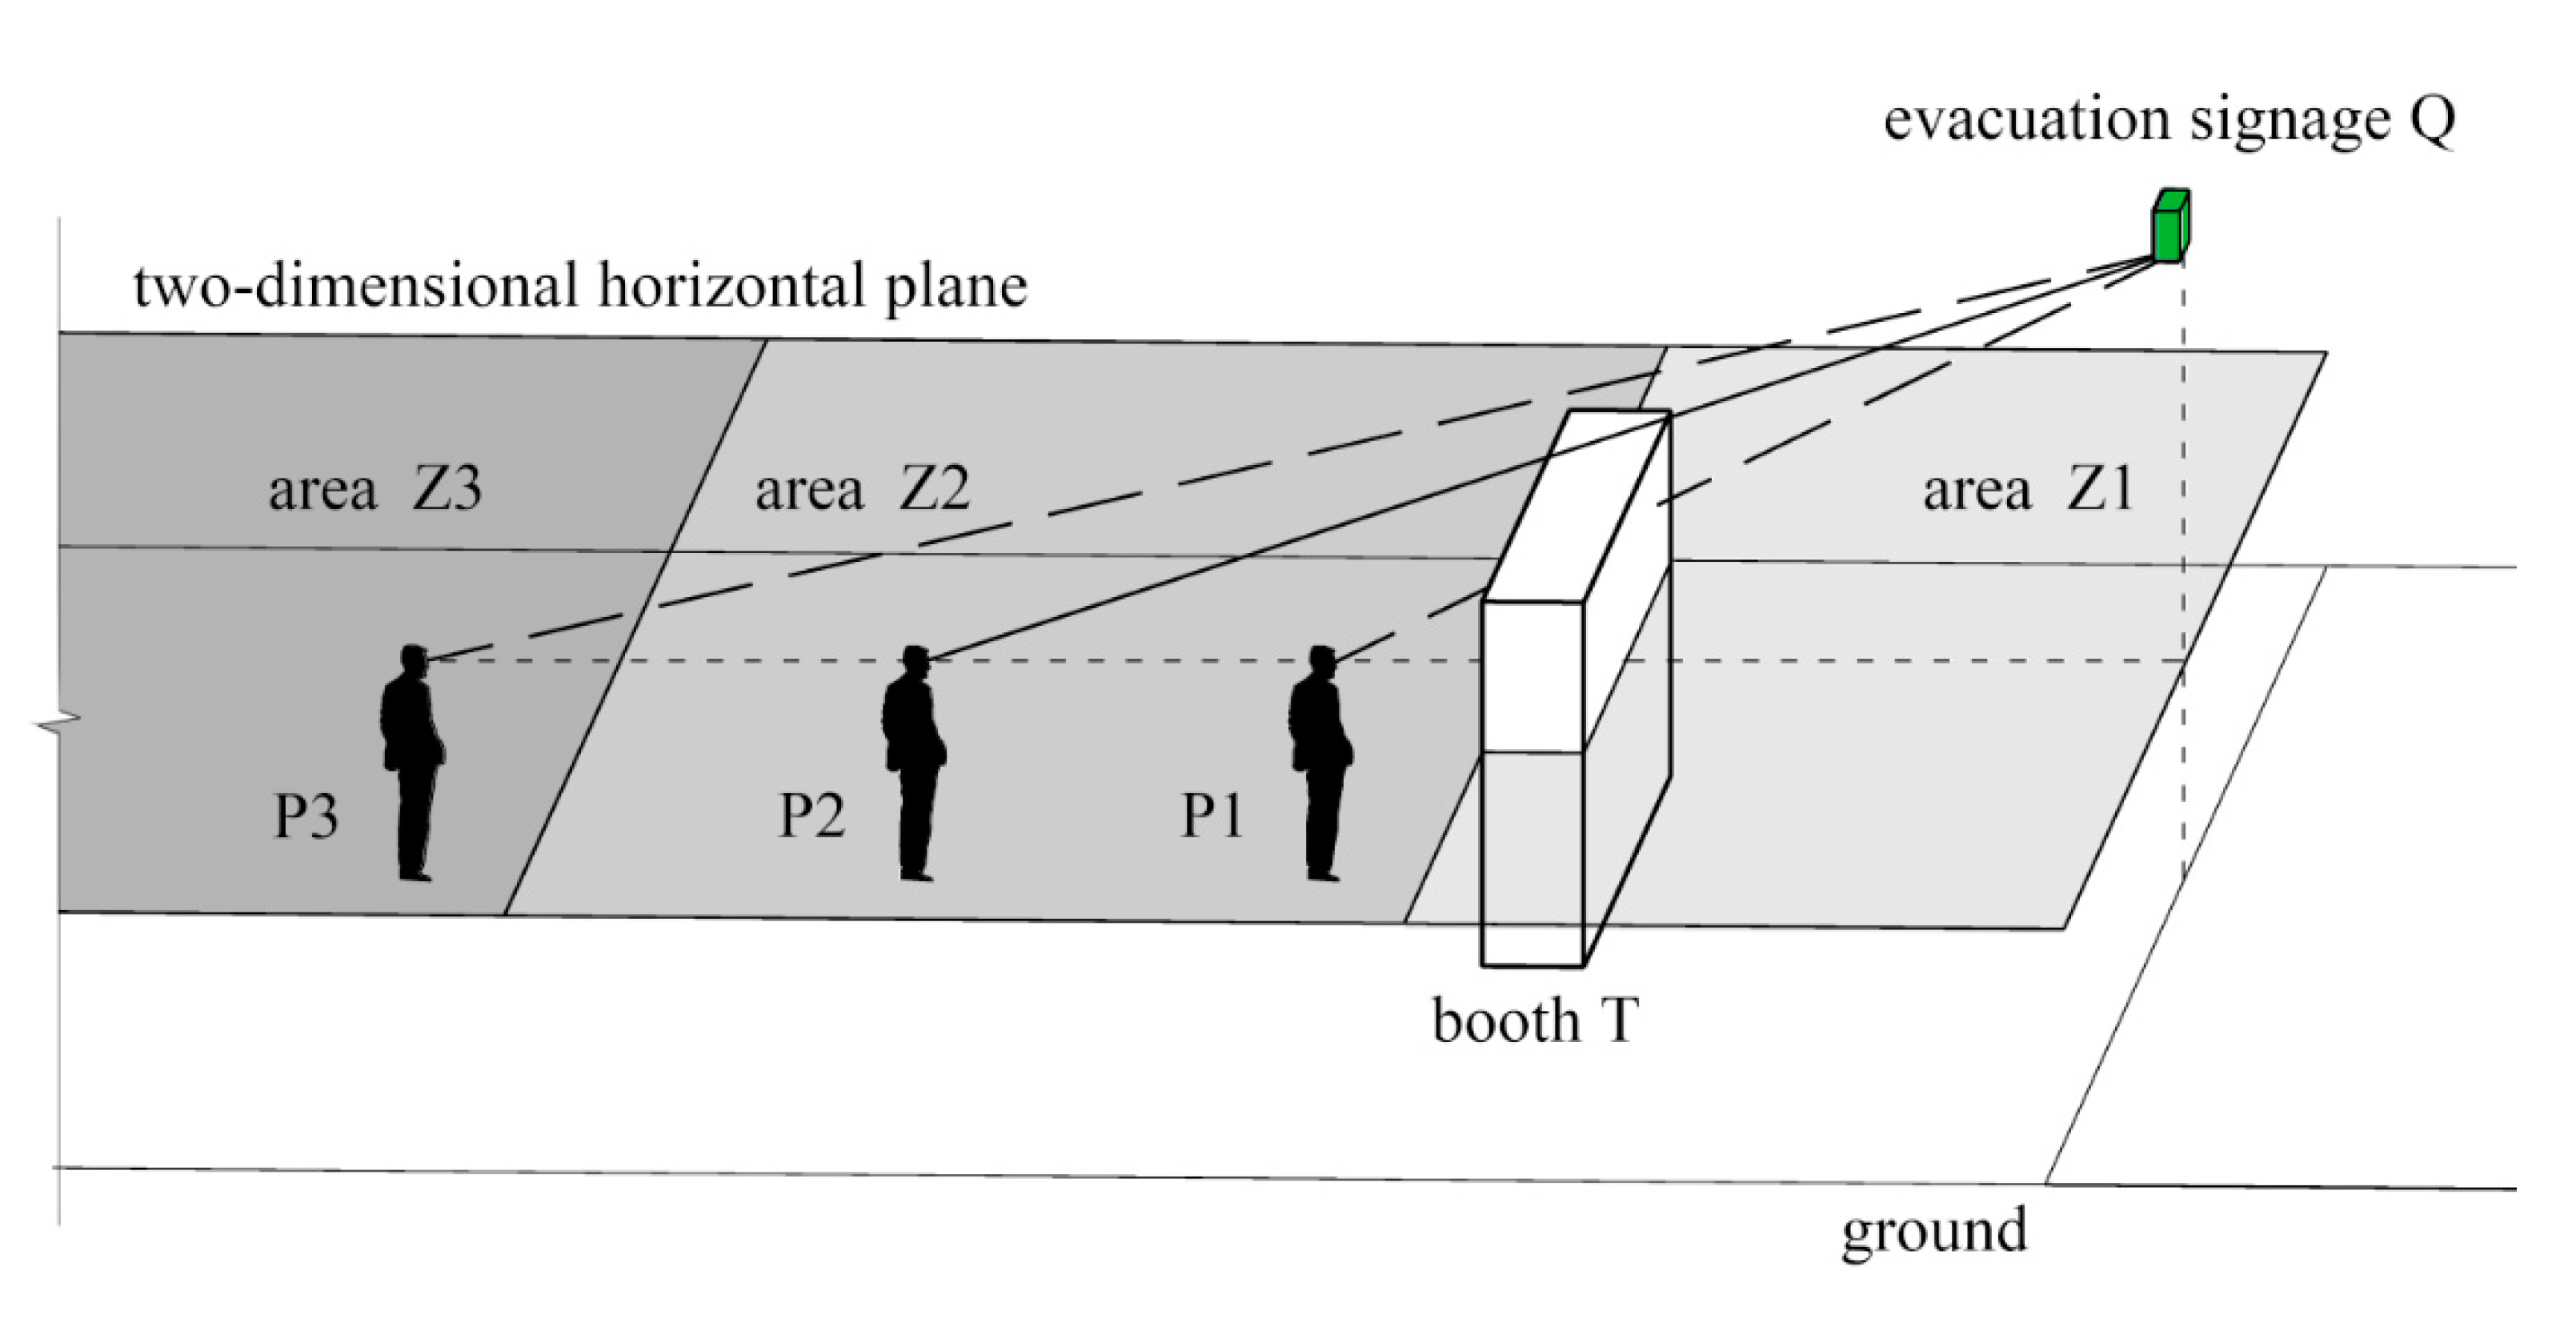
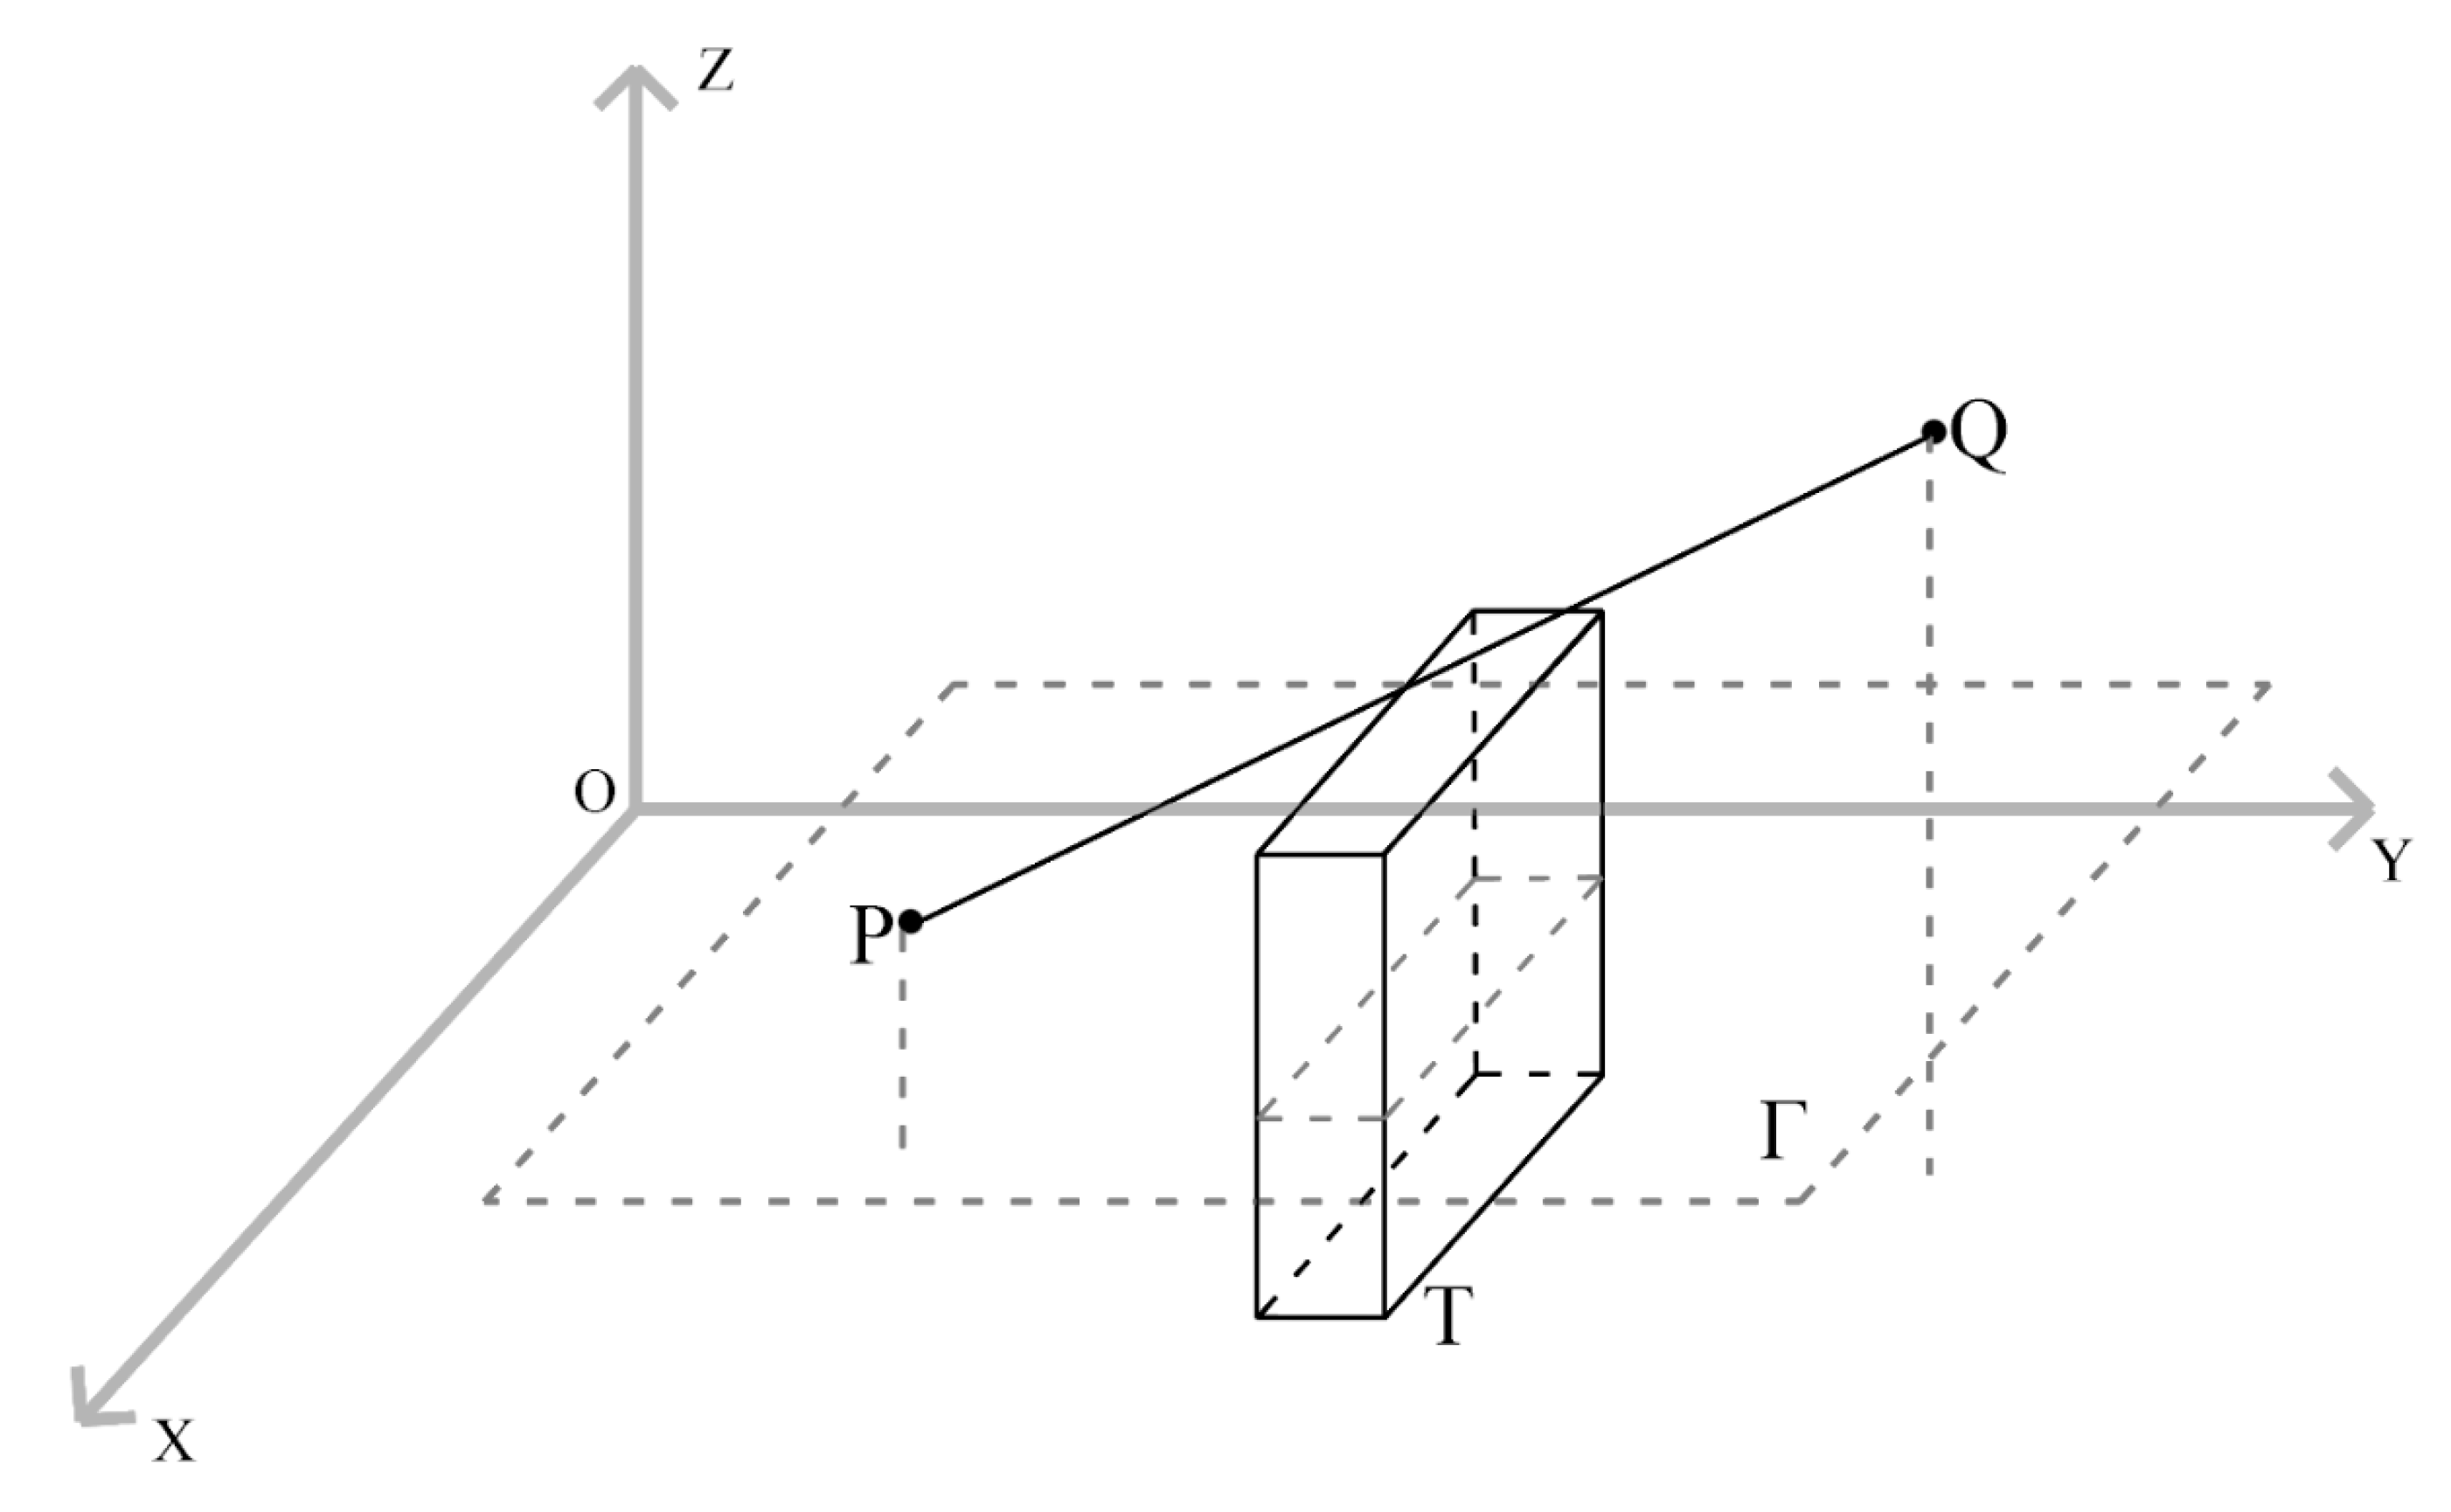
The visibility range of the evacuation signage and booths had a three-dimensional spatial relationship, and the three-dimensional space was converted to the two-dimensional horizontal plane using the height of the human eye viewpoint. Then, the plane was rasterized and divided into 1 × 1 m grid cells. For example, the area Z1–Z3 was the plane where the visibility range of the evacuation sign Q was projected to the intersection of the human viewpoint and booth T, where the people in area Z1 could identify the signage. In area Z2, the person P1’s view was blocked by the booth, and P1 could not identify the signage, but person P2’s view was not blocked by the booth, and P2 could effectively identify the evacuation signage. In area Z3, P3’s view was out of the visibility range of the evacuation signage. Therefore, the primary concern of this study was the visibility range of the evacuation signage in area Z1 and area Z2 (Figure 5).
A person’s eyes and the evacuation signage can be connected with a straight line. If the intersection of this line and the booth is in the height range of the booth, the evacuation sign is not visible, and if not, the evacuation sign is visible. A spatial right angle coordinate system was established with Q   ( x 0 , y 0 , h 0 ) , consisting of the evacuation signage coordinates, where h 0 indicates the height of the signage. The visual field, Γ, of the evacuation signage without obstruction (i.e., the visibility range of the evacuation signage when it is not obstructed) was judged separately for each point P( x 1 ,   y 1 , h 1 ) in Γ. The judgment method was as follows: using the traversal method, traverse each grid cell (1 × 1 m) in the projection area where the booth, T, intersects with Γ. The length and width dimensions of the booth, T, range from [a,b] × [c,d], and let h 2 be the booth height (Figure 6). The parametric equation for the line PQ connecting the human eye and the sign is known from the geometric relationship:
{ x = x 0 + ( x 1 x 0 ) t y = y 0 + ( y 1 y 0 ) t z = h 0 + ( h 1 h 0 ) t   ( 0 t 1 )
Solve the inequality:
{ a x 0 + ( x 1 x 0 ) t b c y 0 + ( y 1 y 0 ) t d
where t is the spatial variable of line PQ, t 1 and t 2 are the variable limit values within the booth occlusion range obtained by solving the inequality (3), and t 1 t t 2 . If h 0 t 1 t t 2 min + ( h 1 h 0 ) t < h 2 , this means that the point P is obscured, and the sign is not visible; conversely, it means that the current booth, T, cannot obscure the line of sight of the human eye at point P to the signage at point Q. When all booths are unable to obscure the line of sight of the human eye at point P to the signage at point Q, it is considered that P is within the visibility range of the sign at point Q. Finally, the actual visibility range of the evacuation signage obscured by the booths was obtained. Here, let a person’s view height h 1 = 1.6 m by considering the average view height.
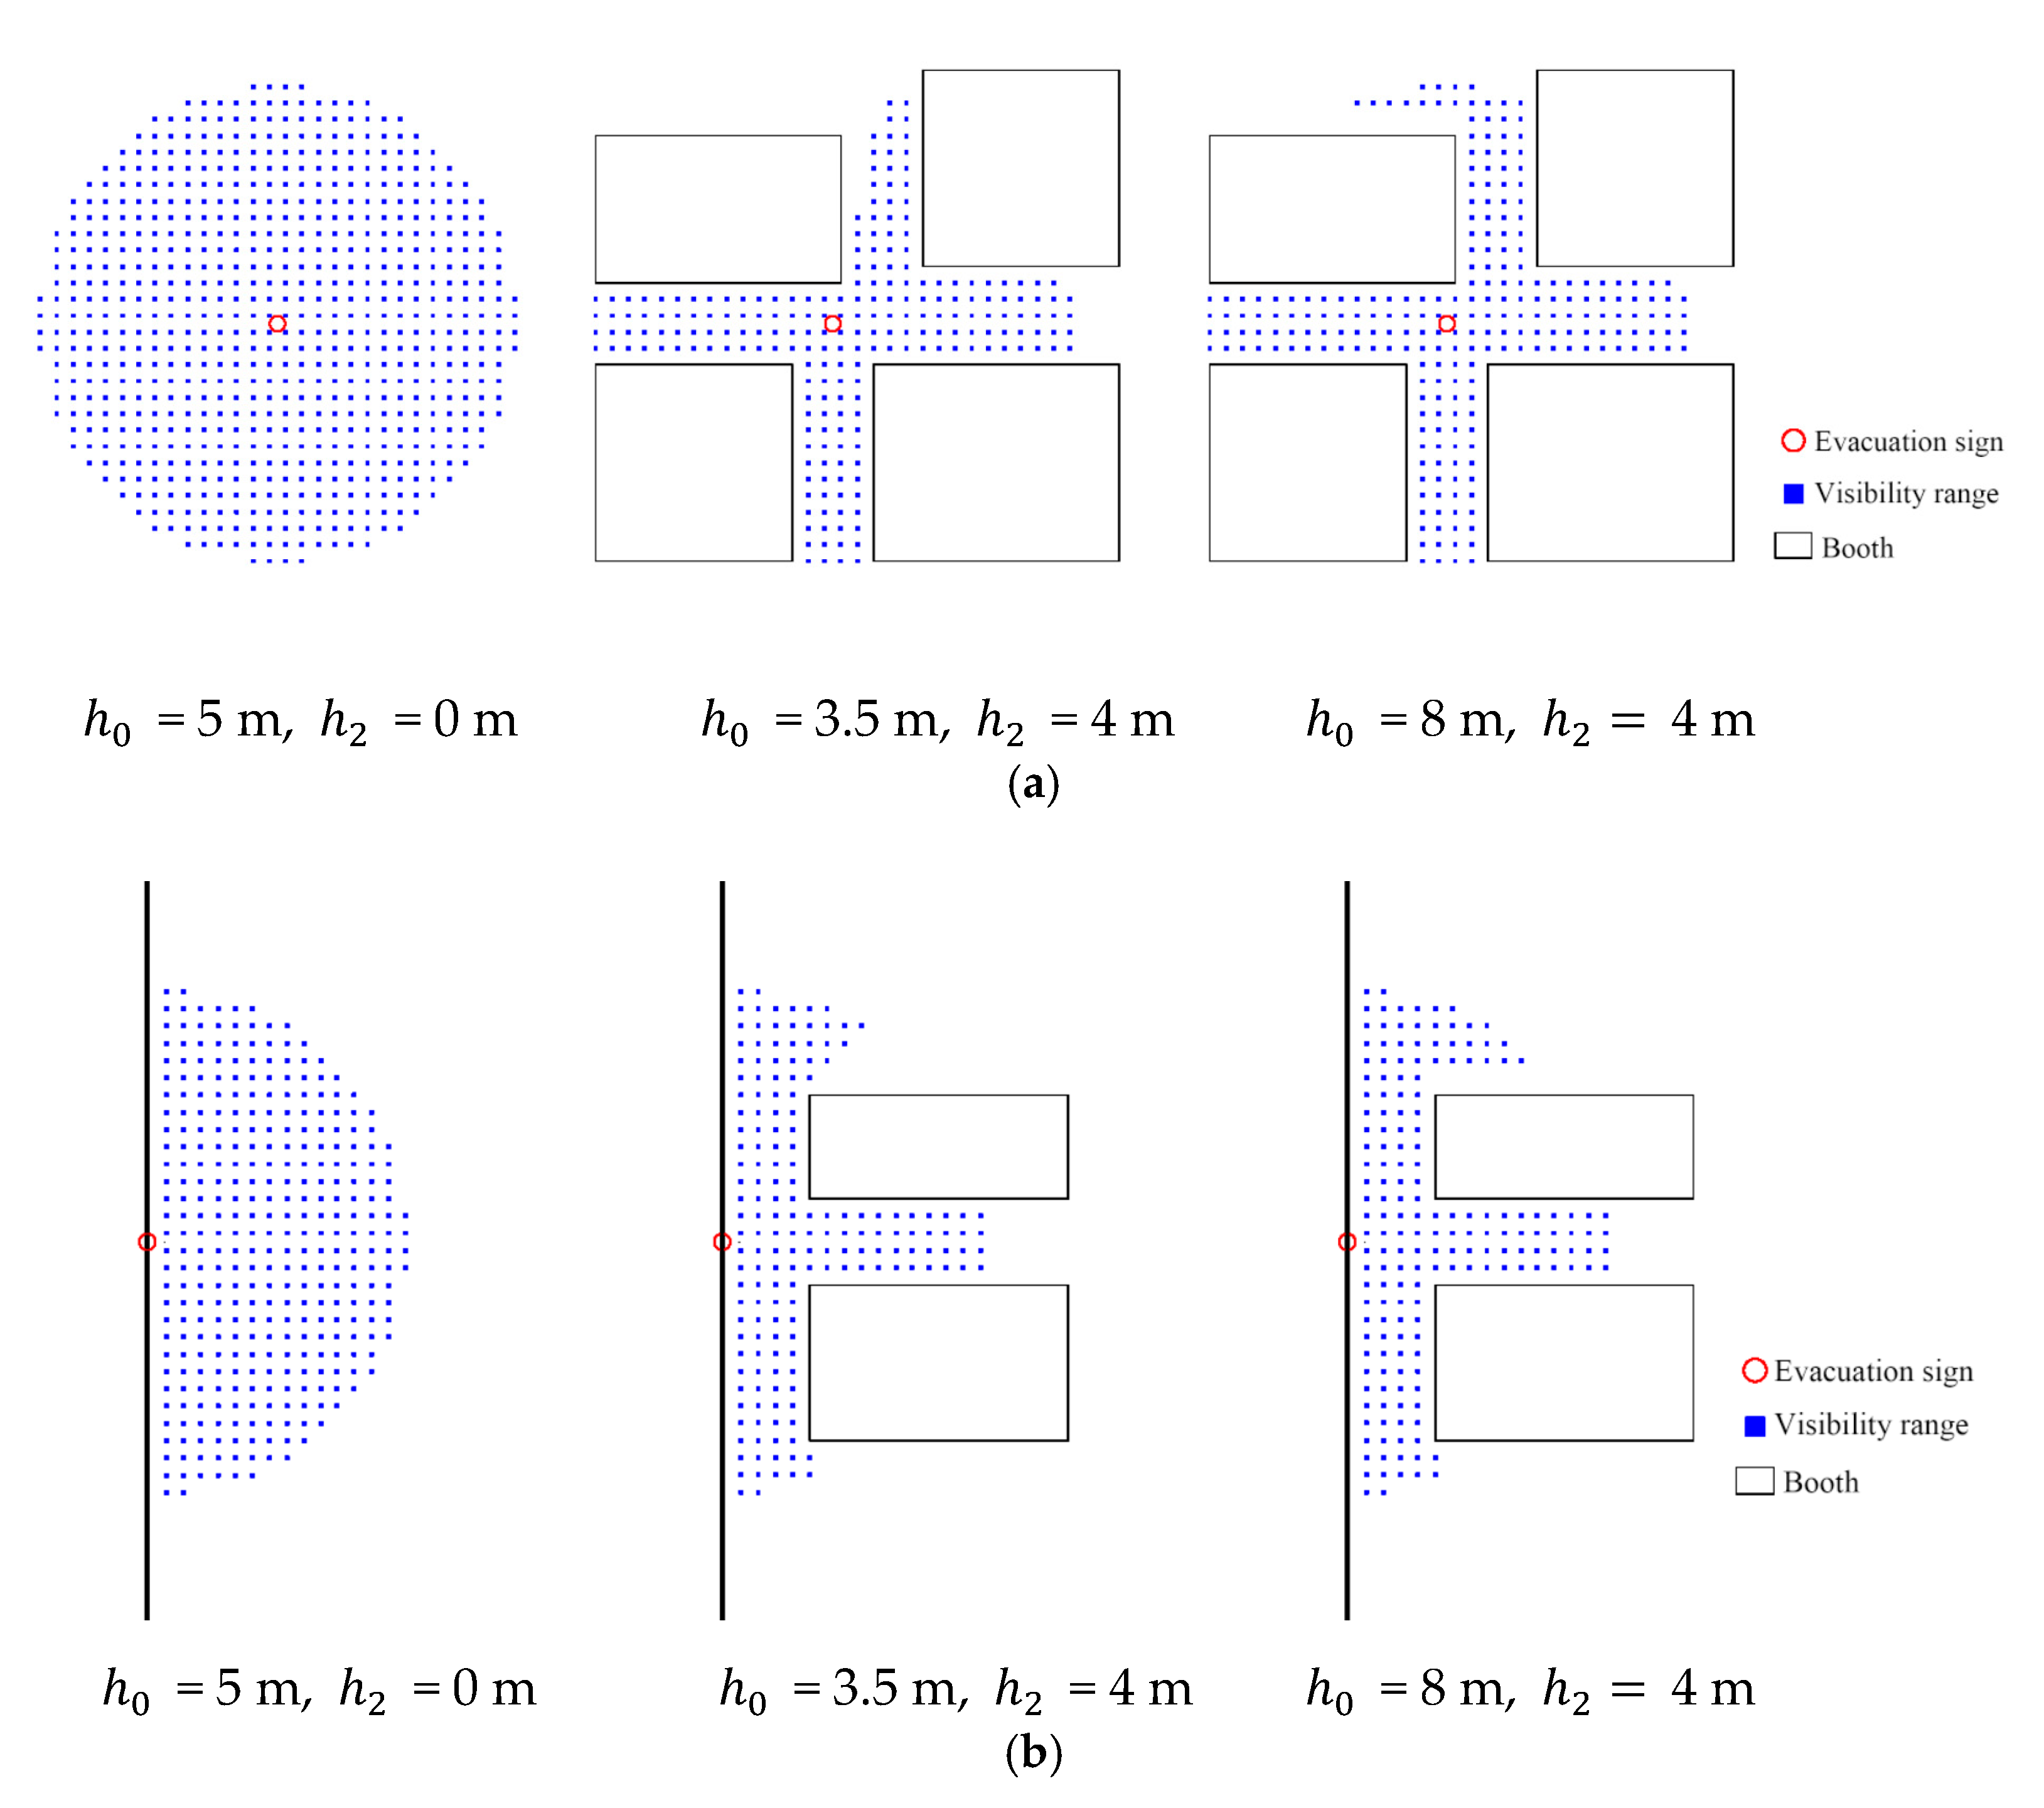
The new determination model, which considers the relationship between the vertical height of the evacuation signage and the booth, can more accurately reflect the actual visibility range of the evacuation signage. Figure 7 shows that when the height of the booth was fixed, the actual visibility range of the signage changed as the height of the signage changed, and an increase in the signage visibility coverage area helped to reduce the wayfinding errors during the evacuation process and improve the visibility of the signage.

3.3.2. Selection of the Candidate Positions for the Evacuation Signage

Evacuation signage candidate position refers to the collection of evacuation signage locations that may have an impact on the evacuation behavior of people in the scope of evacuation signage layout along the evacuation passage of an exhibition hall. The spatial nodes of an evacuation passage of an exhibition hall are divided into three types: target points, directional decision points, and passage guidance points.
The target point is located at the place directly above each safety exit of an exhibition hall. It is required to be set and fixed according to the specification and standards. The directional decision point is the intersection of the passages, which is the spatial node with a high flow of people in the exhibition hall. The passage guidance point is a supplementary point on the long passage. When the evacuation passage in the exhibition hall is too long, people tend to pause, hesitate or look back and forth, and are not confident about their escape direction. Hence, new evacuation signage nodes need to be added in the passage to enhance people’s self-confidence in finding the escape path and guide them to find the evacuation exit more quickly.
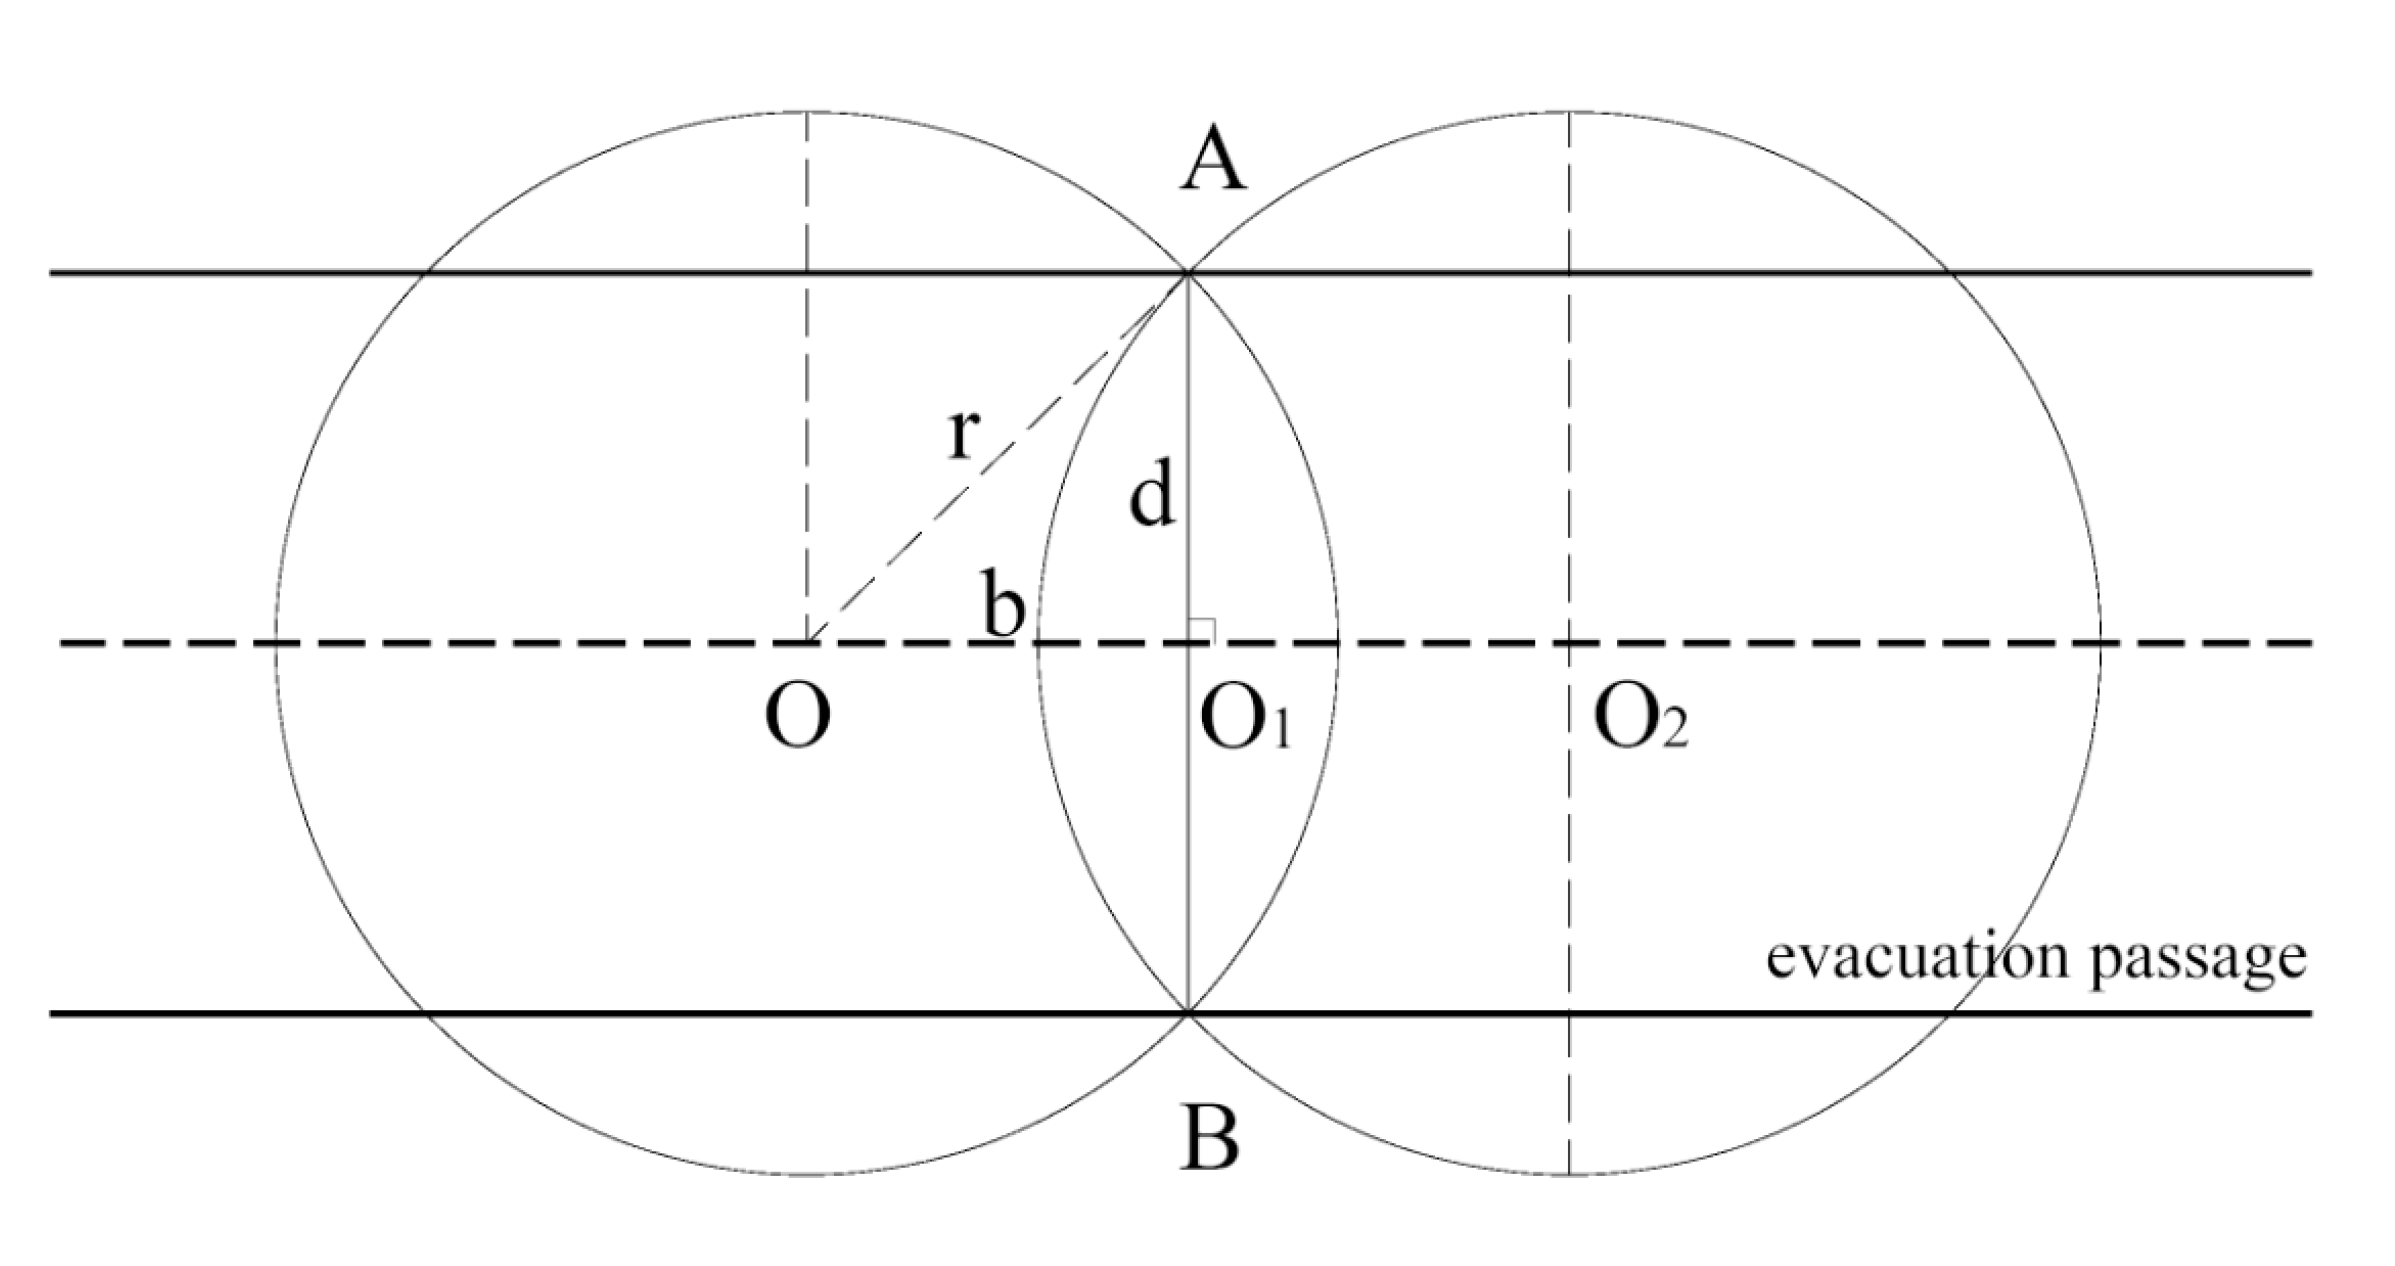
In Figure 8, the evacuation sign, O, is assumed to be the origin of xy axes, the points O1 and O2 are the center of the circle of the visibility range of the evacuation signage. In addition, r is the radius of the visibility range of the evacuation signage. The center line of the evacuation passage passes through the points O and O2, and the distance between the two signs is OO2=2OO1=2b. b is half of the distance between the two evacuation signs, br, and d is half of the width of the evacuation passage AB. Both points A and B fall on the circle, so b = r 2 d 2 .
The width of the evacuation passage in the exhibition hall is 3–14 m, and the value range of d is 1.5–7 m, r = 15 m. By using several trial calculations, it was found that when b = r, the two signs are just tangential to each other and fail to cover the evacuation passage completely. When b = 0.5 r, there was too much overlap of the visibility ranges, which was wasteful. In order to adapt to the overlapping coverage of the visibility range of signs for different exhibition hall sizes and candidate locations, as well as to reduce the amount of the subsequent calculations, let b = 0.75 r to effectively adapt to the visibility range of different evacuation signs (Figure 9).

3.3.3. Solution Using the Genetic Algorithm

The genetic algorithm (GA) was used to solve the evacuation signage layout in an exhibition hall. The genetic algorithm was a global stochastic optimization search method proposed by John Holland, which was calculated by simulating the biological evolutionary process of natural selection and elimination [46]. Being simple and general, it was more applicable, easier to operate, and has been widely used in transportation logistics, computer image processing, and site layouts [47,48].
(1) Coding operation
The coding method chosen for this study was the standard 01 coding. The number of candidate positions in the different exhibition halls varied, and the length of the binary number was determined using the number of candidate positions for evacuation signage in the exhibition hall.
(2) Generation of an initial population
Each chromosome was composed of various genes, corresponding to the possible solutions of the evacuation signage layout set. The initial population was generated using the random survival model.
(3) Fitness function
The fitness reflects the degree of goodness of each individual in the population to reach or approach the optimal solution in the optimization calculation. It is affected by the number of evacuation signs and the visibility range. According to the principle that the objective function is to minimize, and the fitness function is to maximize, the fitness of each individual is measured by means of an objective Equation (1), and the fitness function was defined as:
F i t n e s s ( f ( x ) ) = { C max f ( x ) C max > f ( x ) 0 o t h e r s
where C max is the maximum estimate of the objective function f ( x ) .
(4) Selection
The roulette wheel selection model was used in this study, i.e., the probability of each individual entering the next generation was equal to the ratio of its own fitness to the fitness of the entire population, and the higher the fitness of an individual, the higher the probability of it being selected.
(5) Crossover
To ensure that genes of the outstanding chromosomes can be passed on to the next generation, two different chromosomes were first randomly selected according to the fitness function of the chromosomes, which were called the parent chromosomes. Then, a crossover was randomly selected to cross the two parents (two paternal chromosomes), with the crossover probability to produce two new chromosomes with some genes of both parents, thus producing a new chromosome. In addition, the value of the crossover was set at 0.5–0.9.
(6) Mutation
The use of the variation operator can increase the local search ability of the genetic algorithm. To a certain extent, it can prevent the algorithm from falling into local points prematurely to avoid the phenomenon of premature maturity. In addition, it was combined with the crossover operator to enable the genetic algorithm to complete the optimization process in the optimization problem with good search performance. In order to ensure convergence speed, the variation was set at 0.05–0.1.
(7) Termination condition
The final optimization result should be considered comprehensively based on whether the fitness reached a satisfactory value or the iterative accuracy did not increase. If this was satisfied, the evolution result was output as the optimal solution. If it was not satisfied, then we returned to step (3) and re-ran the evolutionary process until the optimal solution met the condition.
In addition, to overcome the instability of the solution index due to the randomness of the initial population, as well as the evolutionary process of the single genetic optimization, and to avoid premature convergence and improve the efficiency of the later evolution, the strategy of multiple genetic algorithm solutions in the optimal selection was also adopted. The default number of the repeated genetic optimization was three, which ensured the stability of the optimal solution to obtain the best layout plan.

4. Case Study

4.1. Project Overview

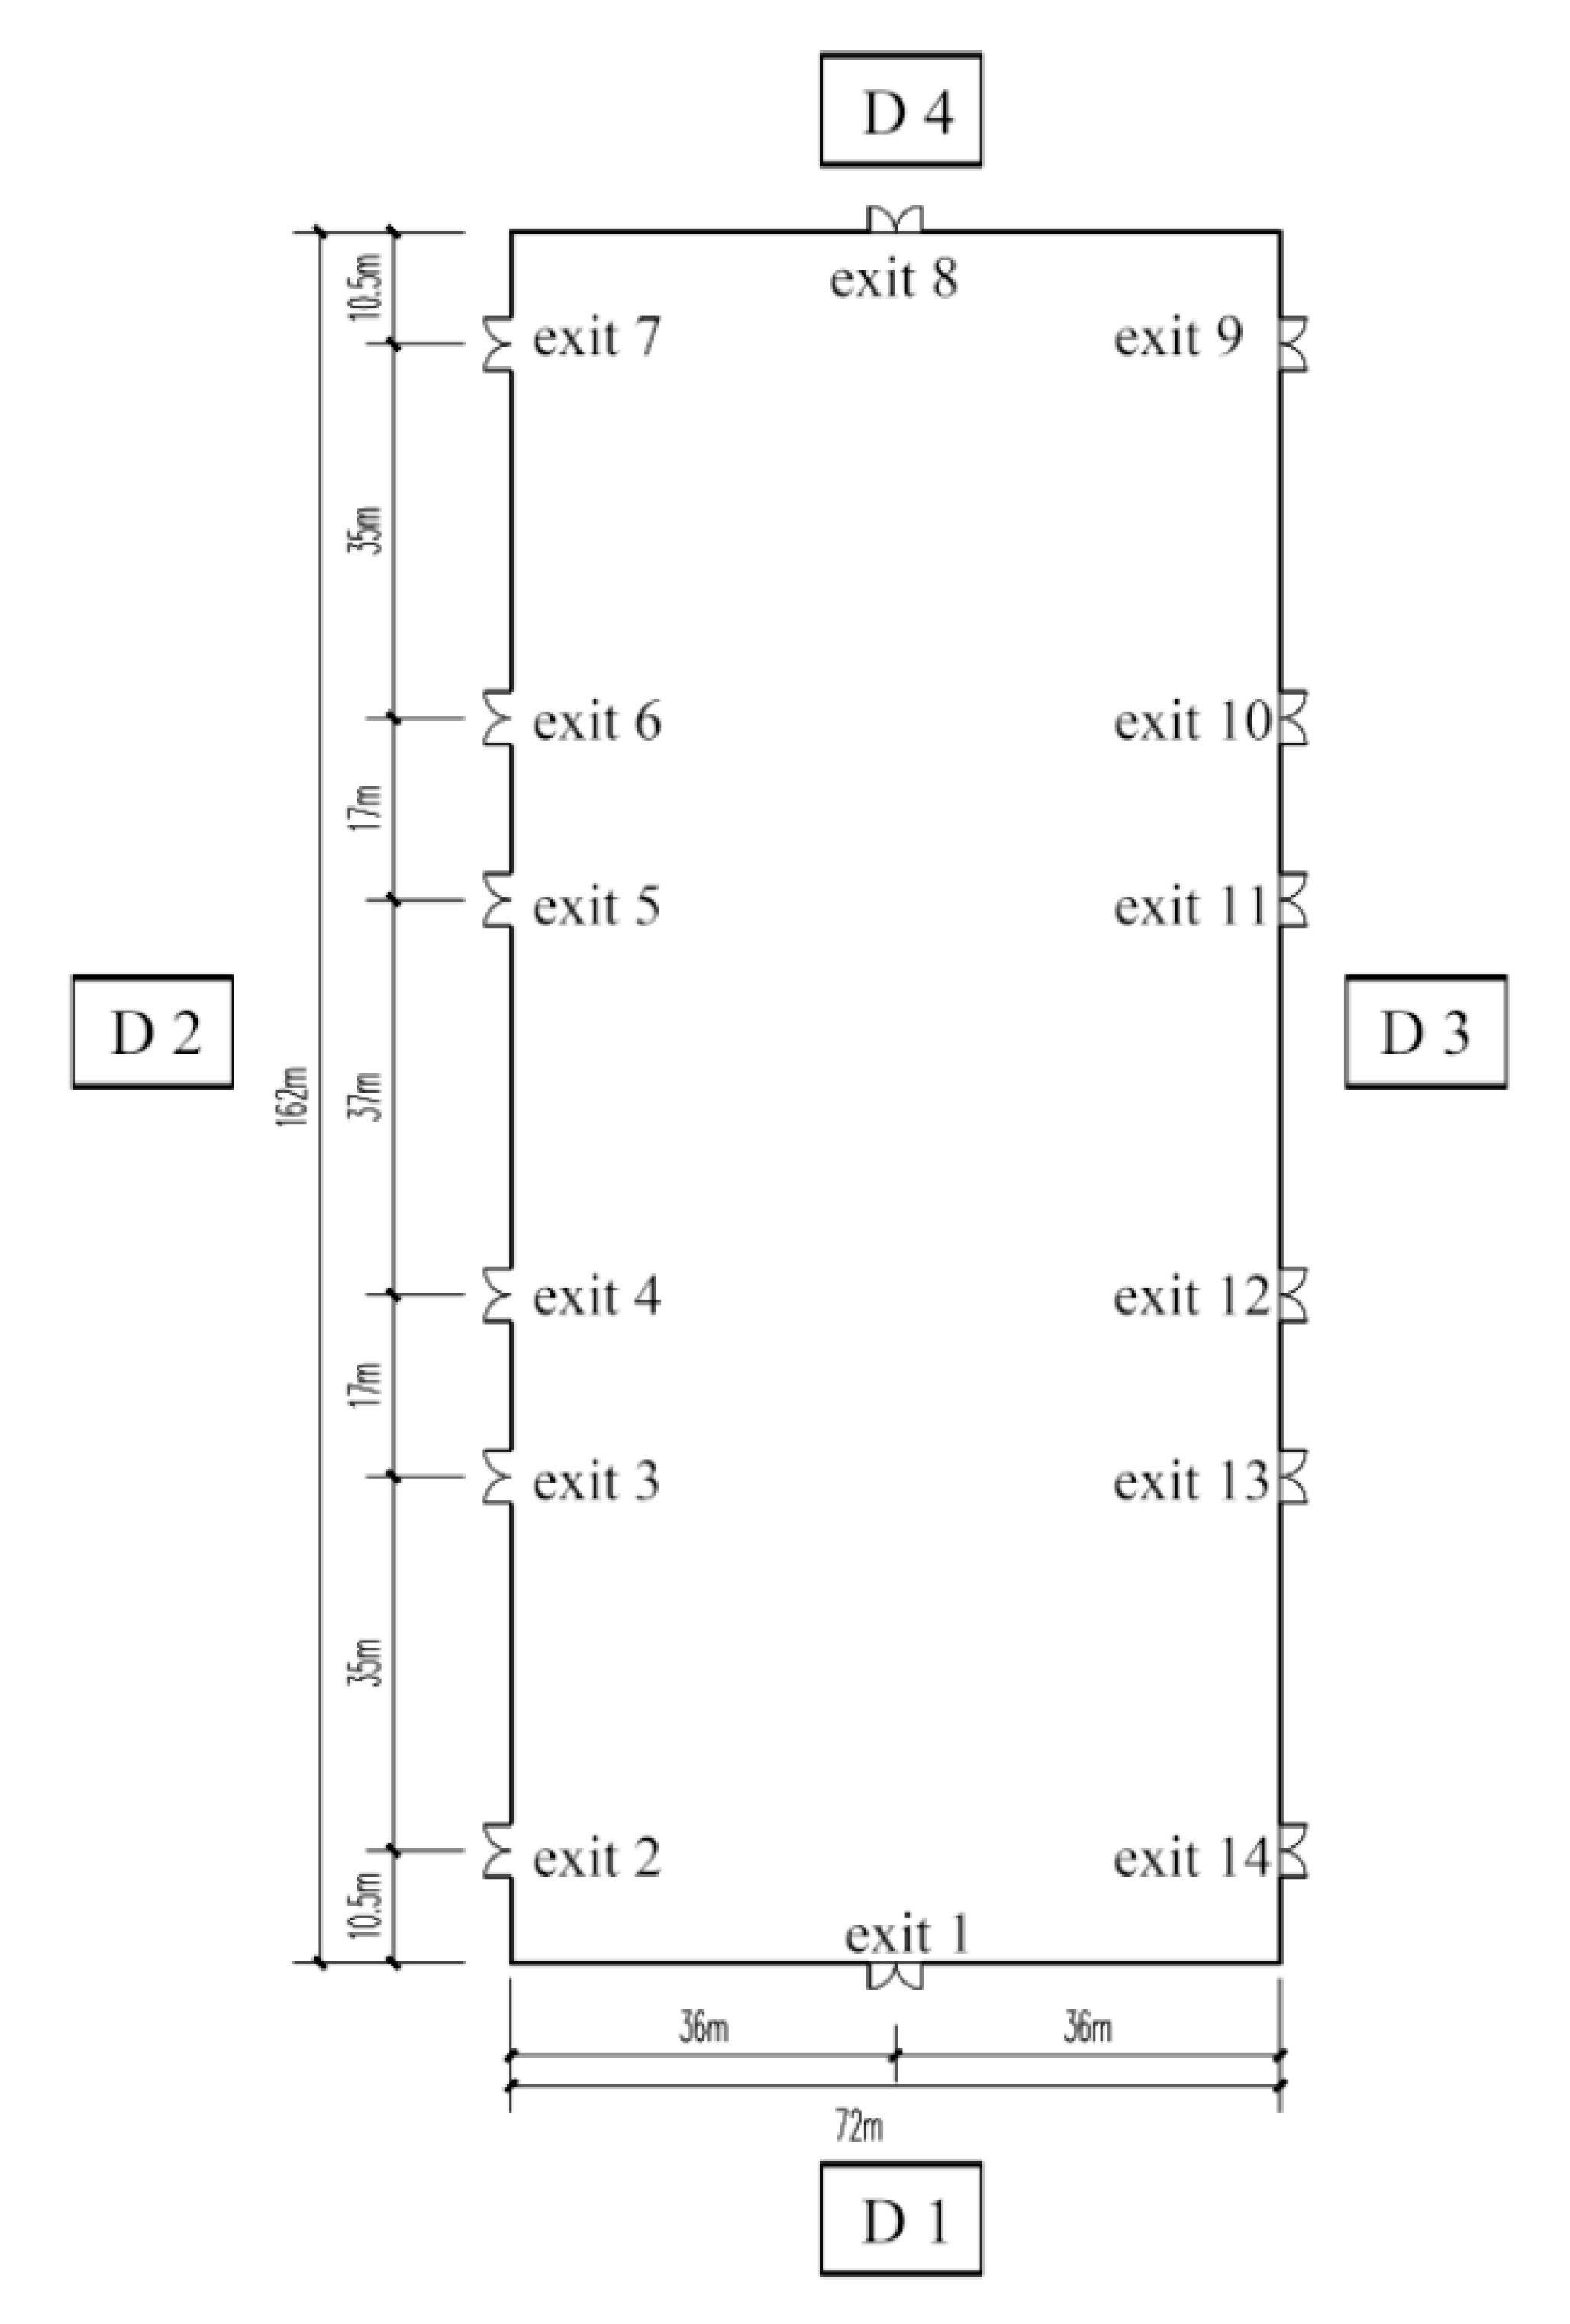
To verify the effectiveness of the smart design method of the evacuation signage layout, this study used a standard exhibition hall in the Western China International Expo City located in Chengdu as a simulation object. To improve the research, the ancillary spaces in the exhibition hall, such as offices and toilets, were simplified. The total area of the exhibition hall was 11,664 m2, with a length of 162 m, width of 72 m, and height of 18 m (Figure 10).
According to the regulations in the Design Code for Exhibition Buildings (JGJ 218-2010), the total number of people in the exhibition hall was assumed to be 8000. The width of the main evacuation passage in the exhibition hall was set to 5–6 m, and the width of the secondary evacuation passage was set to 3–5 m. The number of doors at the safety exit in the model were simplified, and only one was used to indicate the exit. Six doors were arranged on each long side of the exhibition hall, and one door was arranged on each short side, totaling 14 doors, with a door height of 3–4.5 m, and the width of each door was set to 5 m. The existing evacuation signs in the exhibition hall were located above each safety exit, with a total of 14 places, and the height of the evacuation signage was 3.5–5 m.
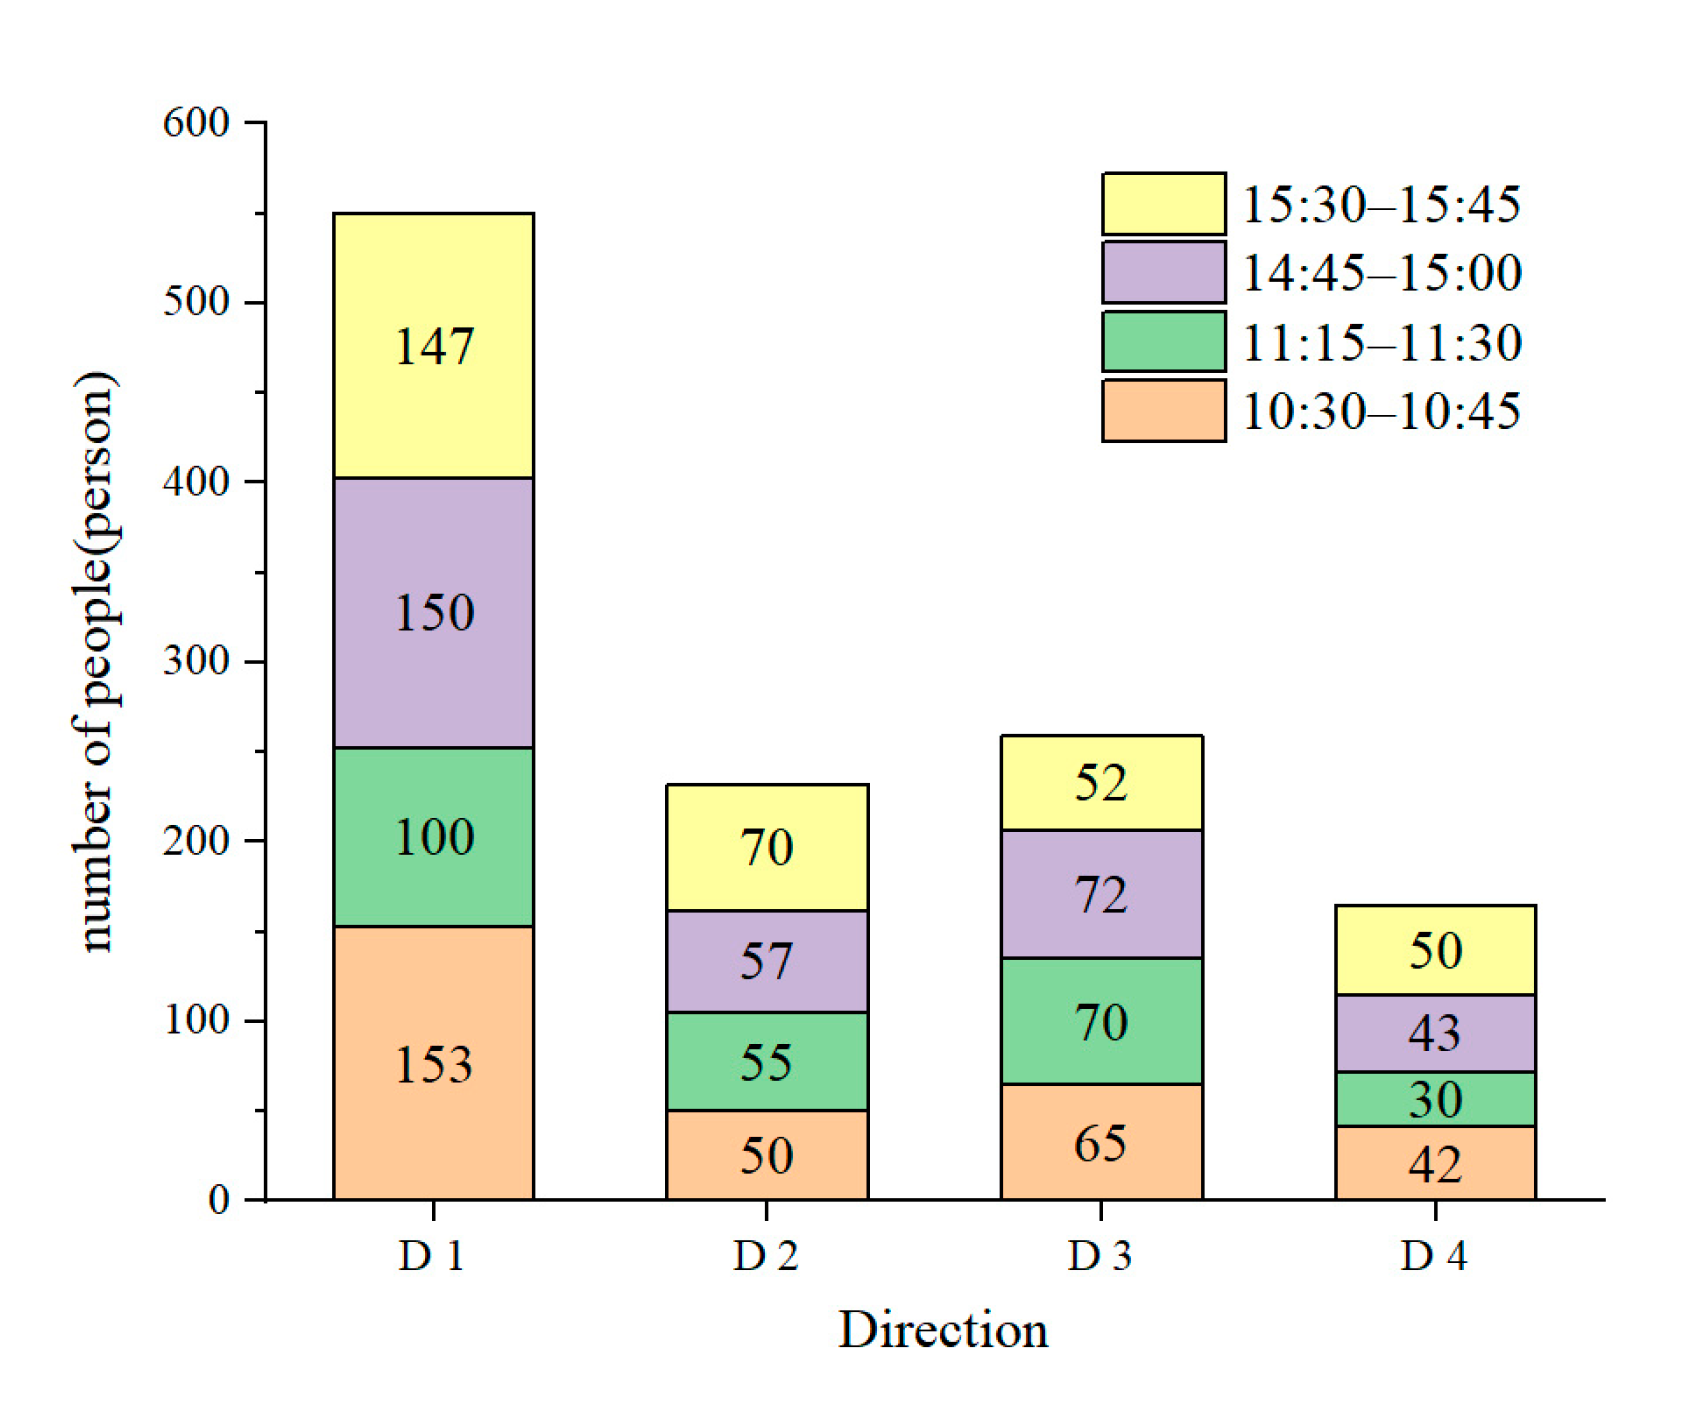
To accurately understand the utilization of each entrance, the observation method was adopted. Direction 1 (D1) was near the main entrance of the exhibition building and was the main entrance and exit. Directions 2 (D2) and 3 (D3) were connected to other exhibition halls accessible through the atrium. Direction 4 (D4) was the freight passage, which was primarily used for loading and unloading exhibits and for staff use. The observation was made during four periods at 10:30–10:45, 11:15–11:30, 14:45–15:00, and 15:30–15:45 on 30 July 2020, when there was an exhibition in the exhibition hall. After four rounds of observation and statistics, by comparing the situation of each entrance, it was found that the highest and lowest number of people entered from D1 (safety exit 1) and D4 (safety exit 8), which were 550 and 165 people, respectively. The use of the entrance by people in direction 1 accounted for 45%, D2 (safety exits 2–7) and D3 (safety exits 9–14) each accounted for 20%, and direction 4 accounted for 15% (Figure 11).

4.2. Optimal Results of the Evacuation Sign Layout for Exhibition Halls

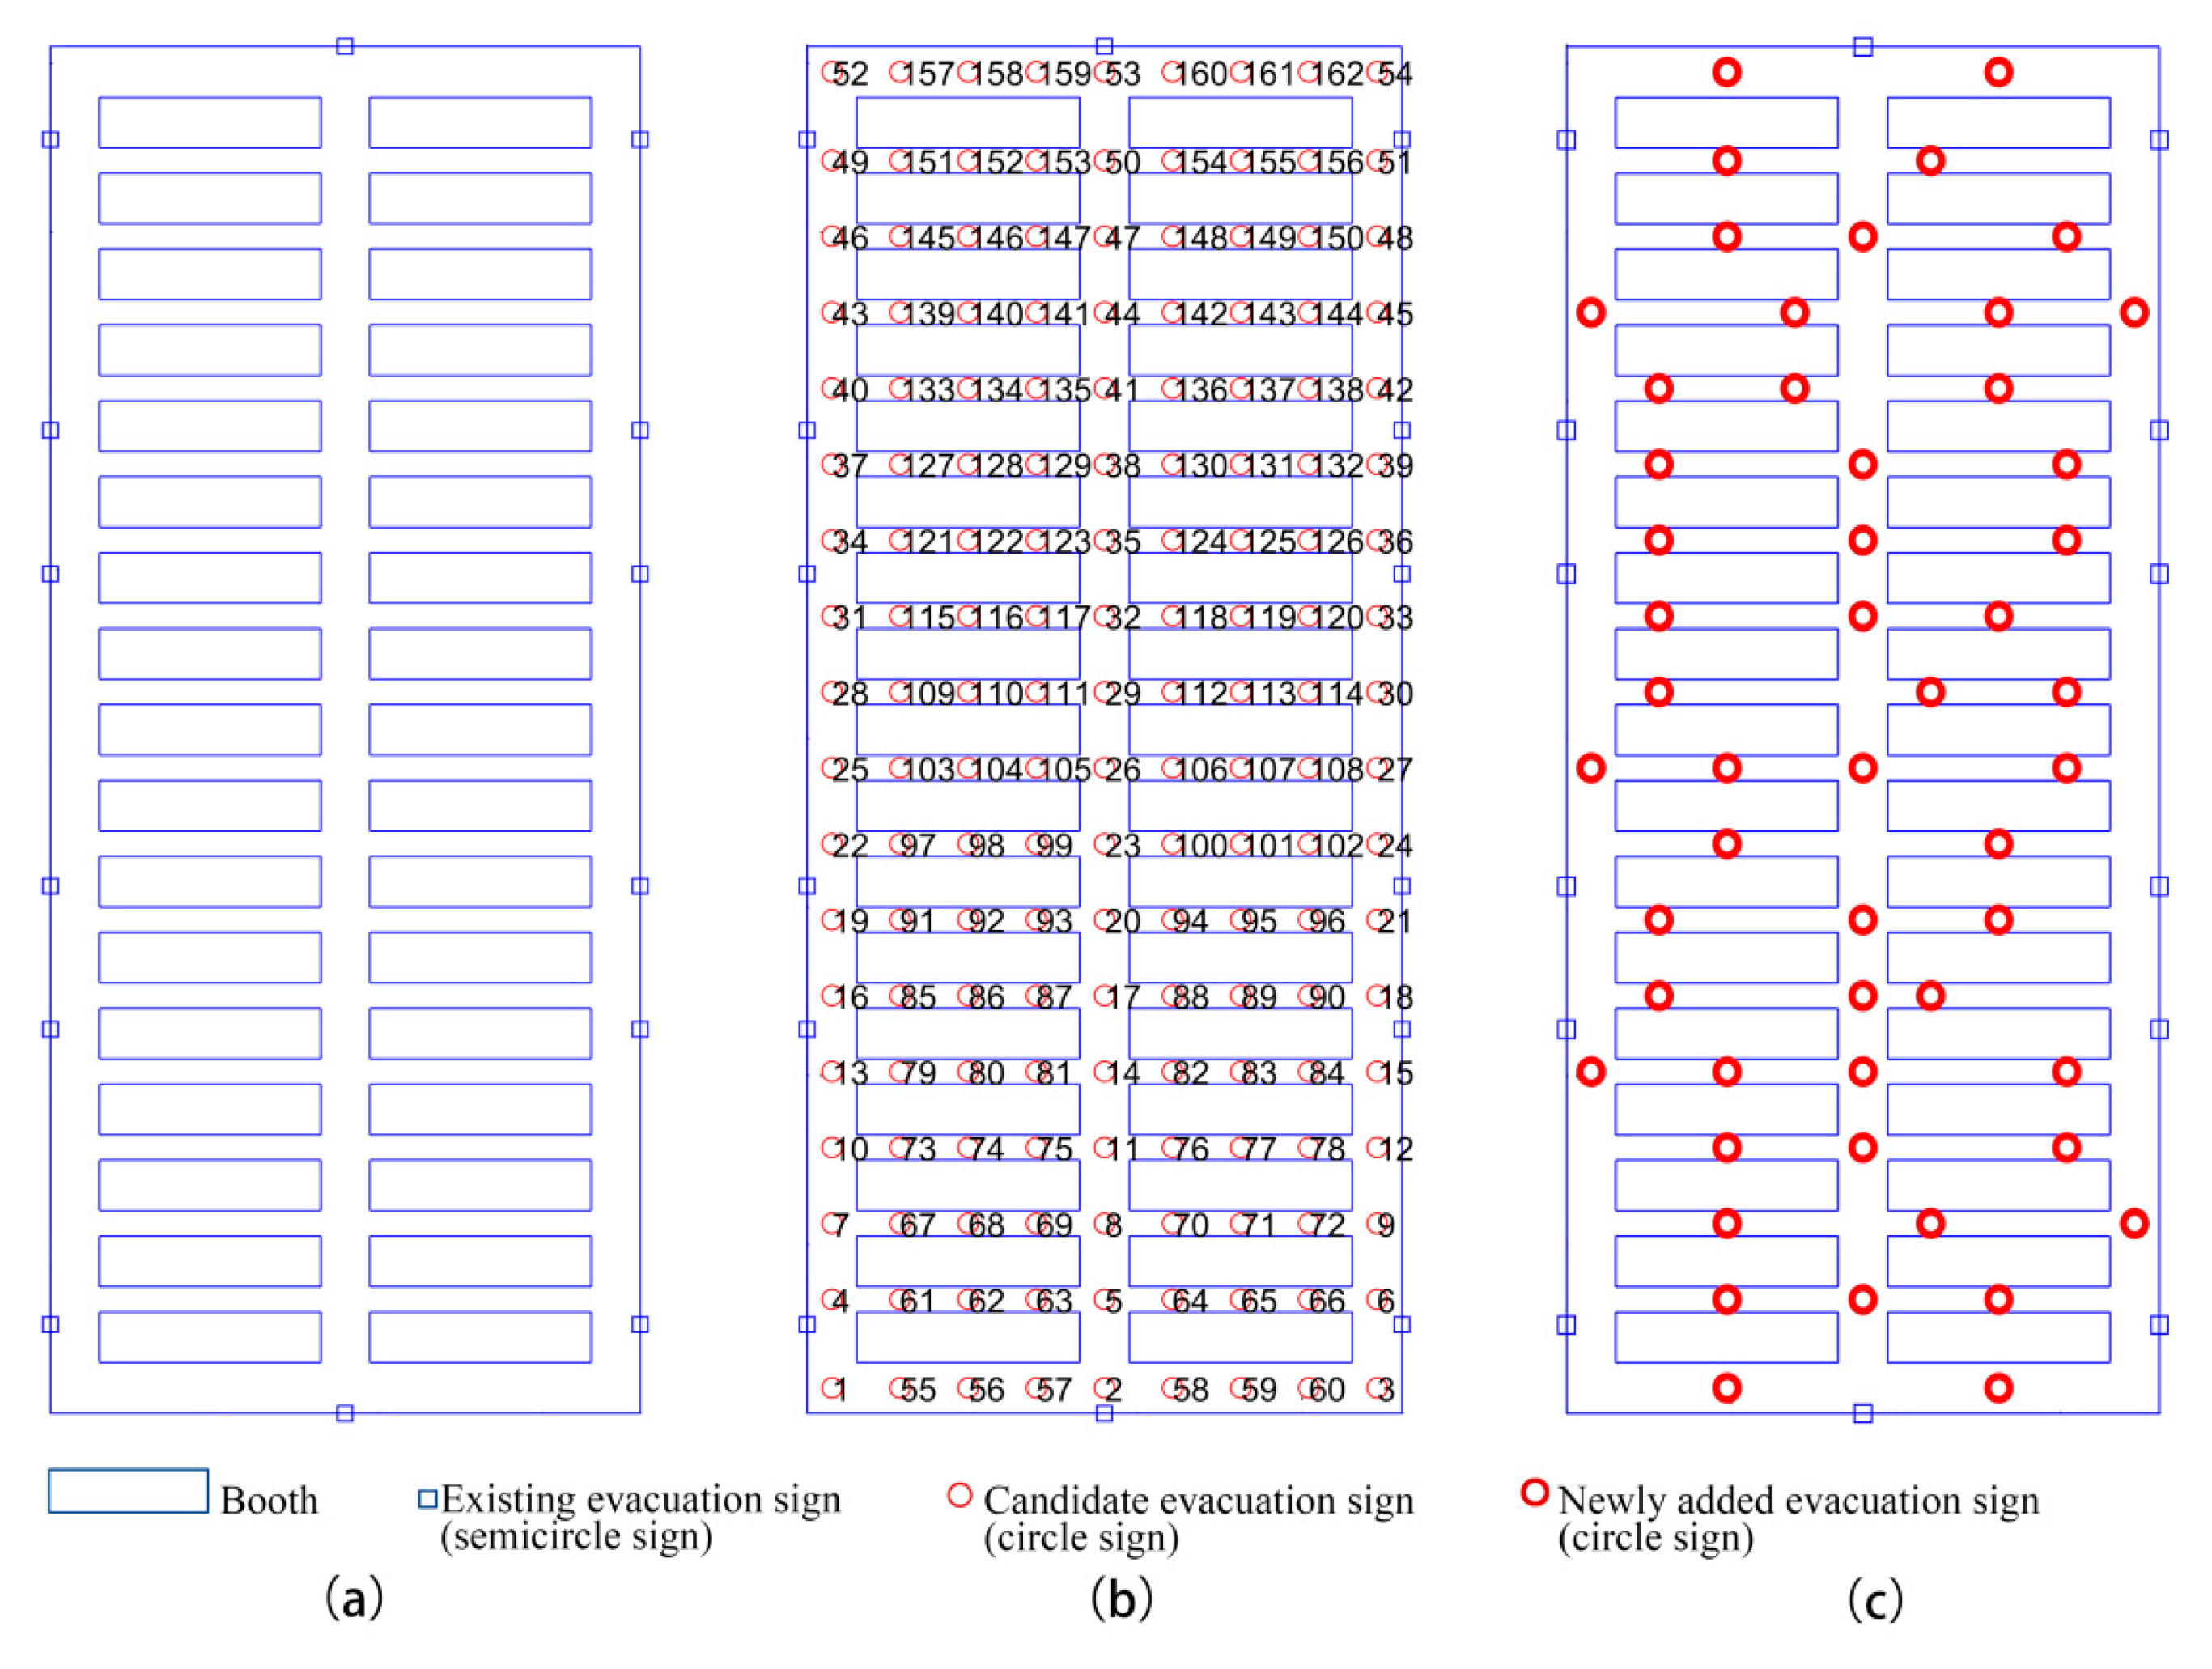
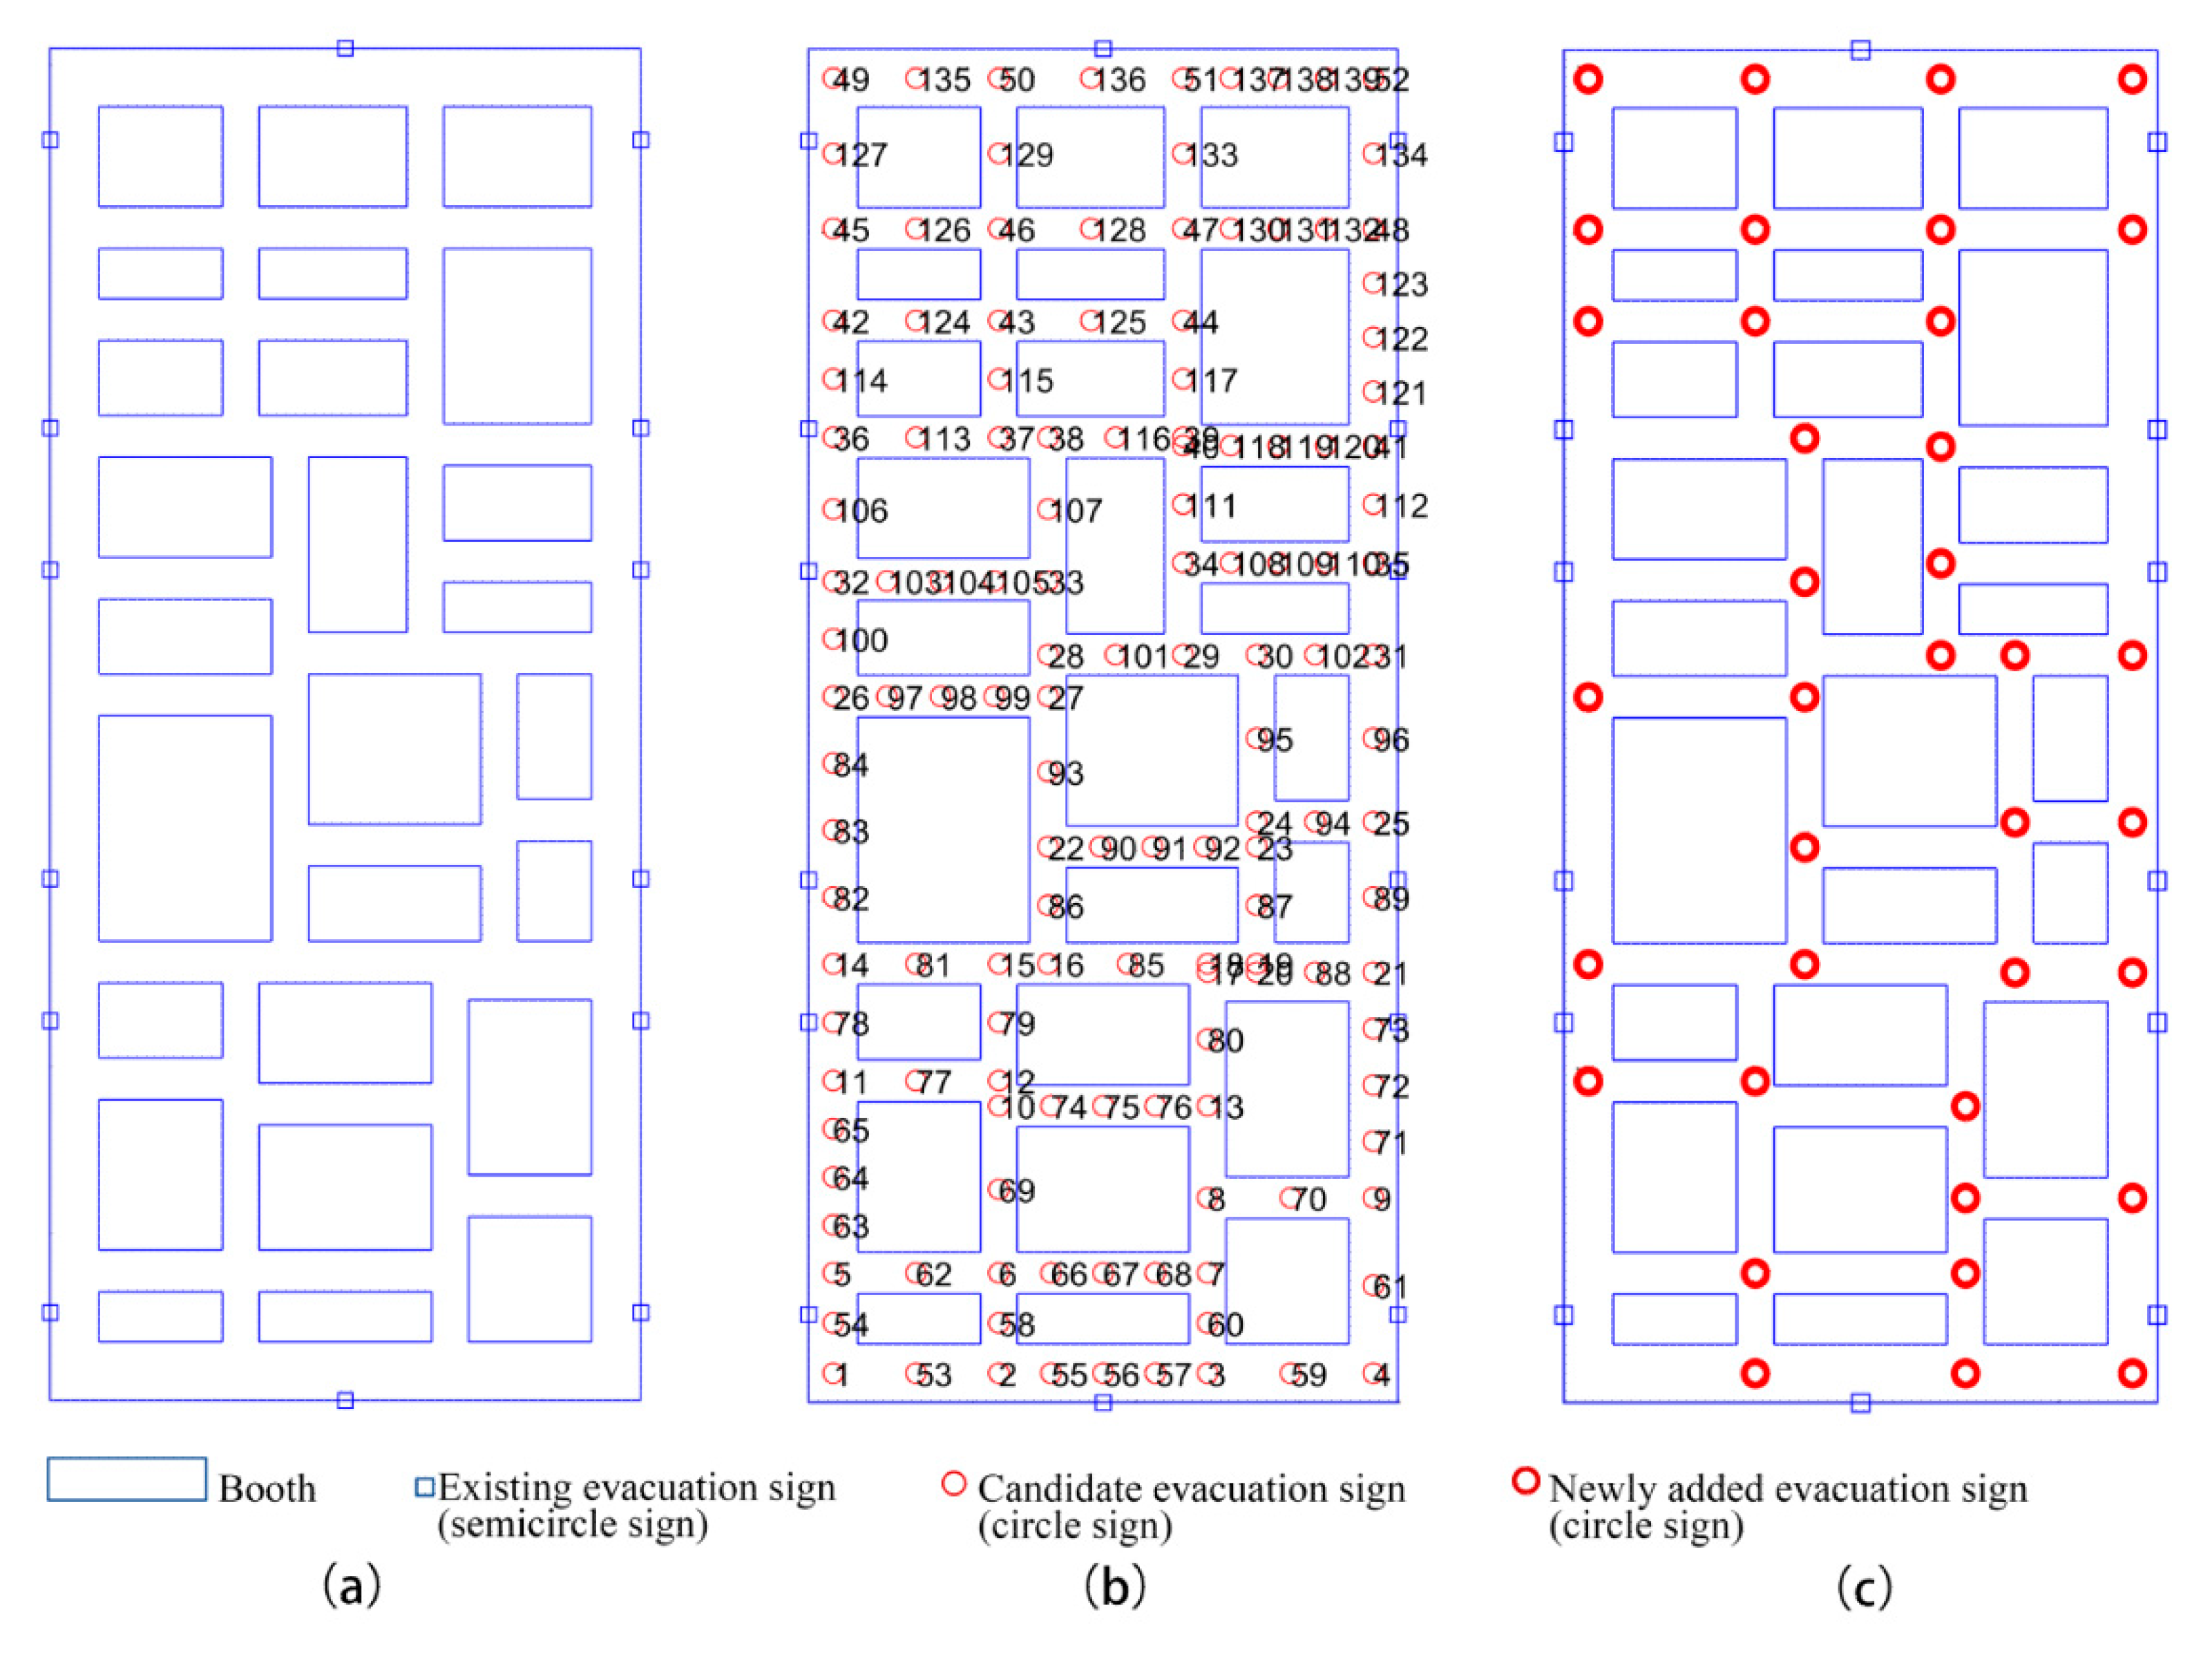
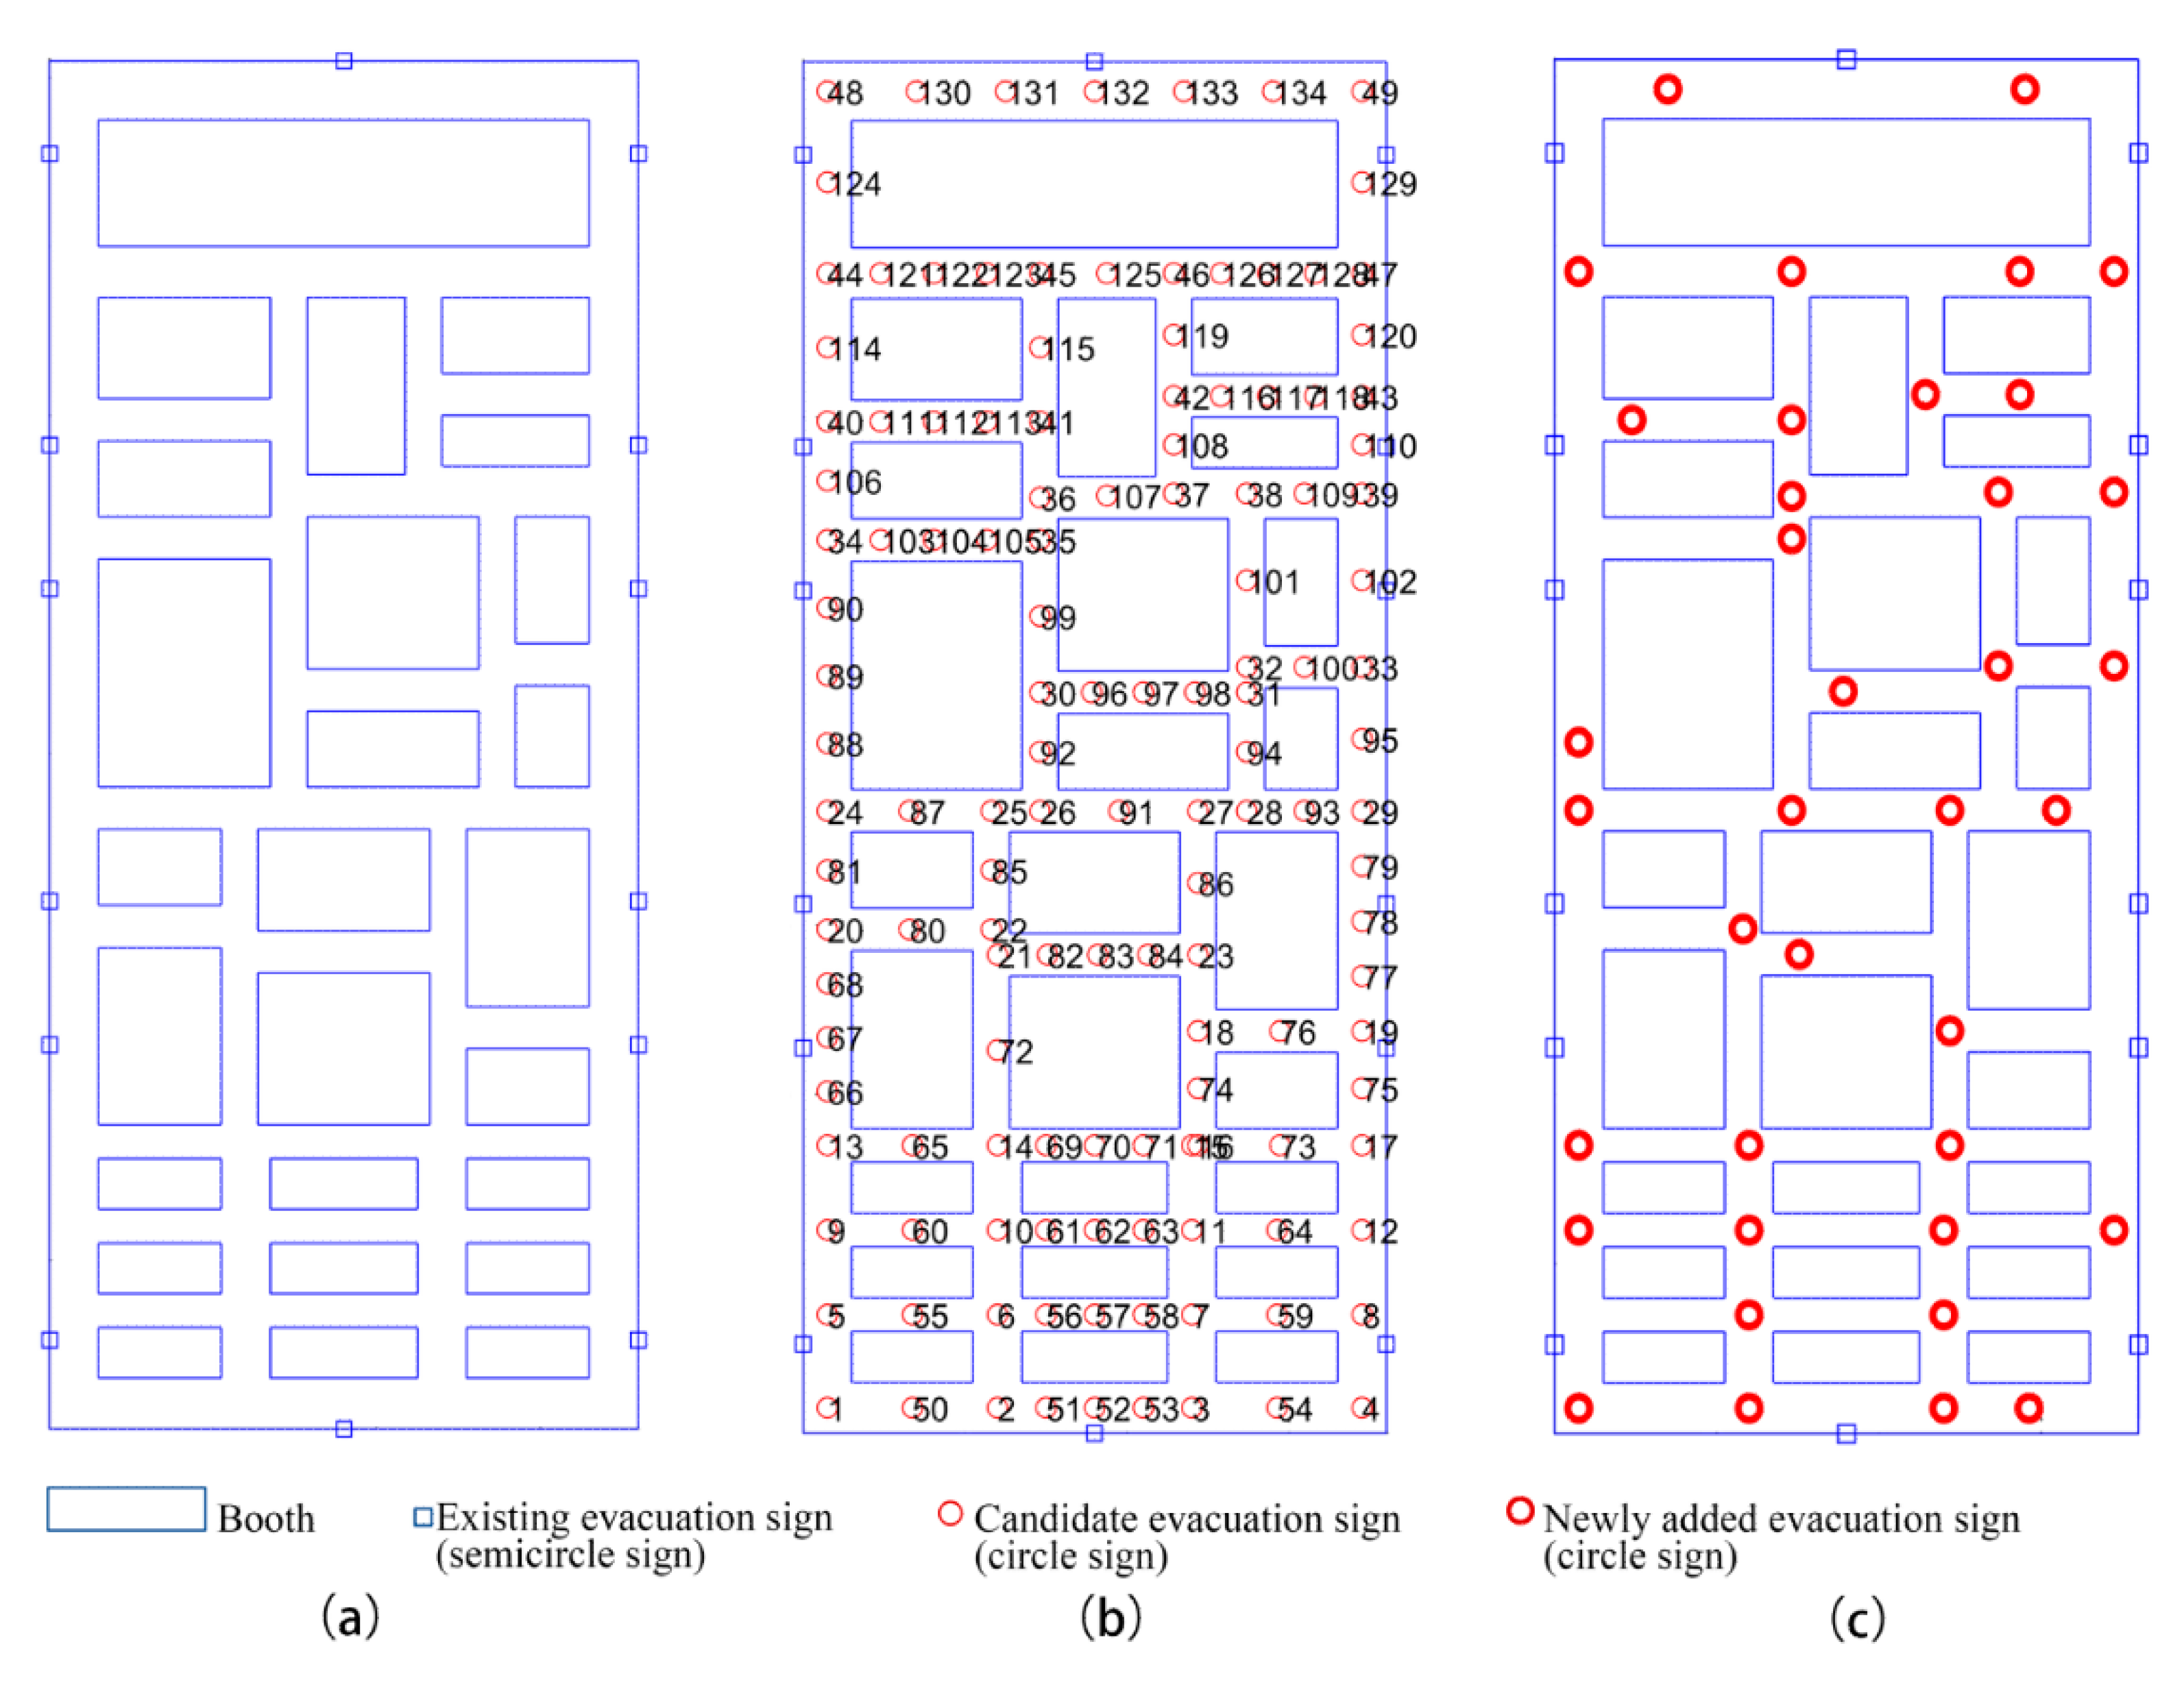
Three common exhibition hall booth layout forms [49], namely, row (scenario 1), free style (scenario 2), and mixed style (scenario 3), were selected for the optimized design of the evacuation signage layout. Assuming that the height of the evacuation signage was unified at h 0 = 5 m, the height of the booths was unified as h 2 = 3.5 m, and the visibility range of the evacuation signage was set at r = 15 m. The layout optimization scheme of the evacuation signage was obtained for the different booth arrangements in the exhibition hall. Under the premise of ensuring that the visibility range of the evacuation signage could completely cover the passage of the exhibition hall, it was found from Figure 12, Figure 13 and Figure 14 that in the same exhibition hall, different forms of booth layouts would cause differences in the layout of the evacuation signage, and the location and quantity of the evacuation signs would be different. A comparison of the three booth layout scenarios showed that evacuation signs are more often set at intersections. However, compared with scenarios 2 and 3, scenario 1 had a limited visibility range of one single evacuation sign due to the long length of the booth, so it was necessary to add evacuation signs in the middle of the passage to ensure the continuity of sight lines (Table 1).

4.3. Verification of the Evacuation via Simulation

To verify the contribution of the optimized evacuation signage layout results to evacuation, the efficiency of evacuation was simulated and verified using Anylogic software (The AnyLogic Company, St. Petersburg, Russia) [50], in which the smart agent in AnyLogic enables an effective connection between evacuation signage and people’s evacuation behavior. The simulation was used primarily for verifying the effectiveness of the evacuation signage layout optimization, so the type of people was simplified, with 50% of men and 50% of women randomly distributed in the exhibition hall [43]. The evacuation speed was set to 1.2–1.6 m/s for men and 1–1.4 m/s for women [8,51]. The effectiveness of the evacuation signage in scenarios 1–3 was verified by using a typical simulation result of 8000 people in the simulation as an example.
There were two main types of evacuation behavior in the exhibition hall. One was that people chose to evacuate without identifying evacuation signage. These people chose the most familiar path or evacuated in the direction of where they entered or followed others to evacuate due to stress and the neighbor behavior effect [52]. The other style of evacuation was that people evacuated by identifying the evacuation signage [20]. It was assumed that within the visibility range of the evacuation signage, the probability that people could identify the signage guidance information was 50% [44], and once the signage was identified by people, they would follow the information conveyed by the signage to choose the best path to evacuate. Additionally, according to Section 4.1, the familiarity of people with the entrances was 45% for direction 1, 20% for each of the directions 2 and 3, and 15% for direction 4. It was also important to note that this simulation did not consider the effect of smoke on the evacuation [53].

4.3.1. Evacuation Time

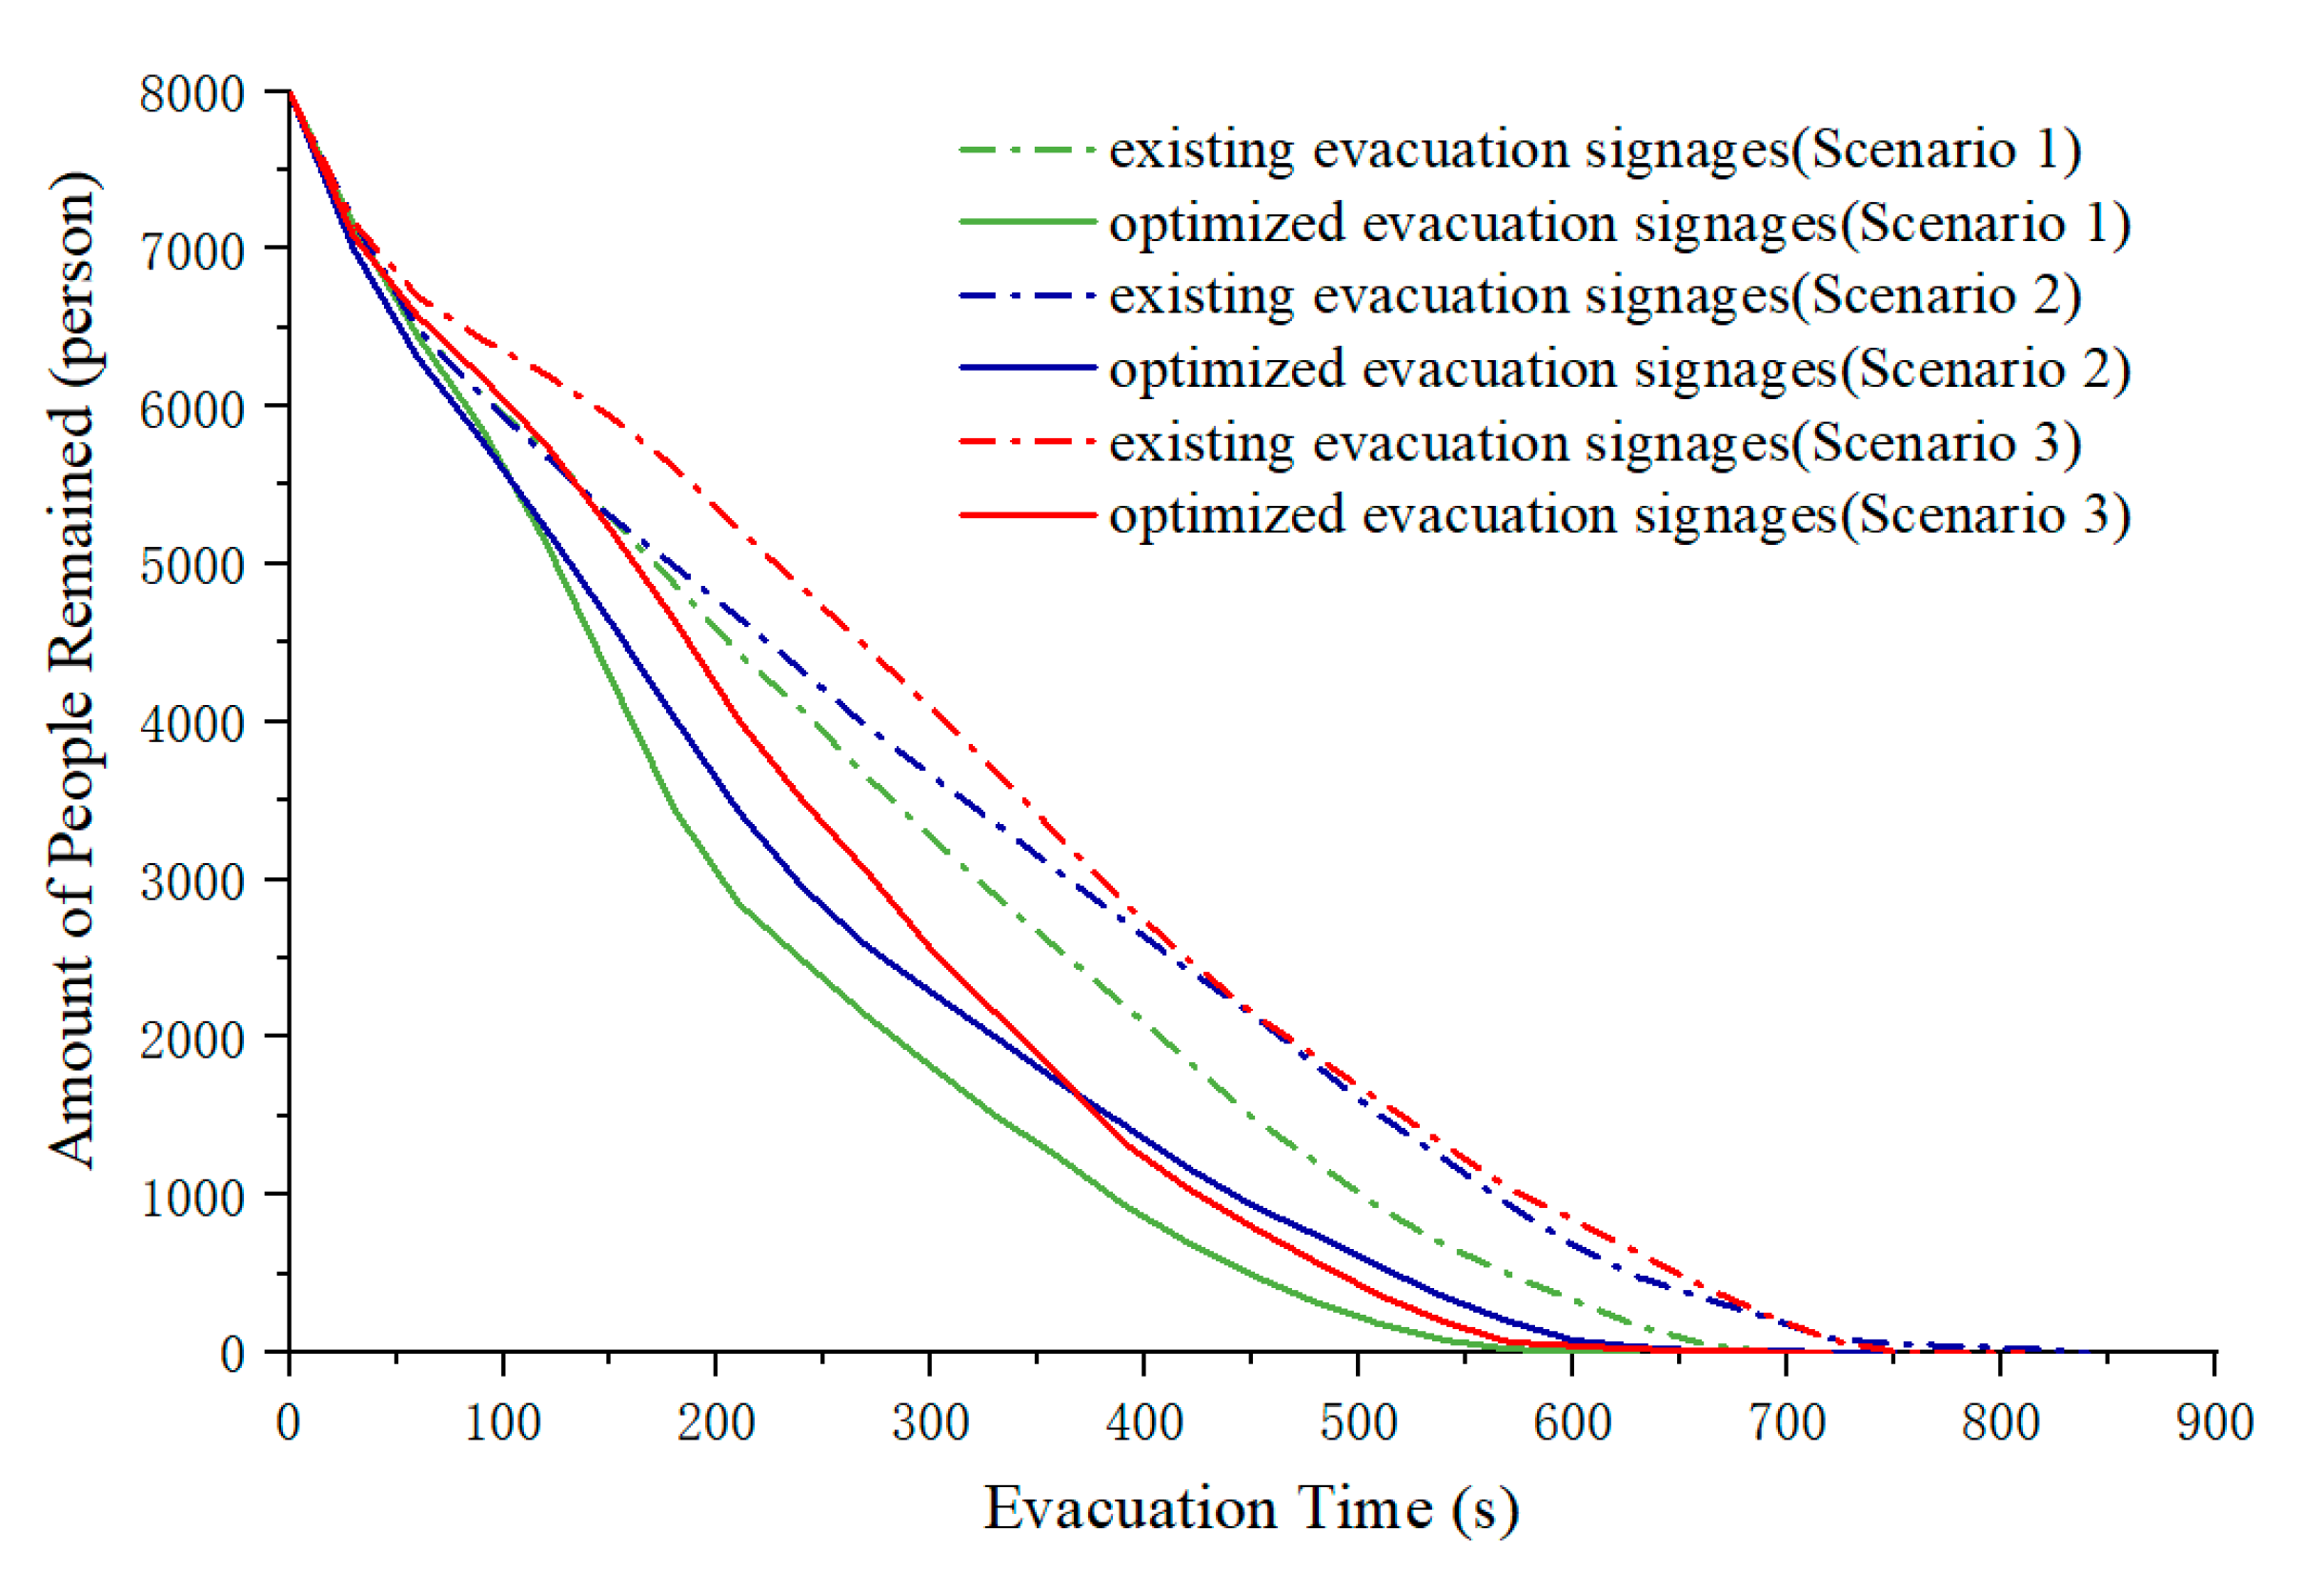
Figure 15 is based on ten simulations of the same scenario. It shows that after the layout optimization of the evacuation signage, the evacuation signage improved the evacuation efficiency, and the visibility coverage of the evacuation signage was increased through location optimization. The evacuation time before and after the layout design of scenario 1 was 847 s and 746 s, respectively, which was improved by 13.5%. The evacuation time before and after the layout design of scenario 2 was 809 s and 719 s, respectively, which was improved by 11.1%, and the evacuation time before and after the layout design of scenario 3 was 707 s and 627 s, respectively, which was improved by 11.3%. The design of the evacuation signage layout effectively solved the contradiction between the evacuation signage layout and booth arrangement in the exhibition hall. When the exhibition hall encounters an emergency, the design of the evacuation signage layout can cover all areas of evacuation passages in the exhibition hall and effectively guide evacuees to choose the shortest evacuation path and the nearest safety exit. This will improve the evacuation efficiency in the exhibition hall.

4.3.2. Utilization of Safety Exits

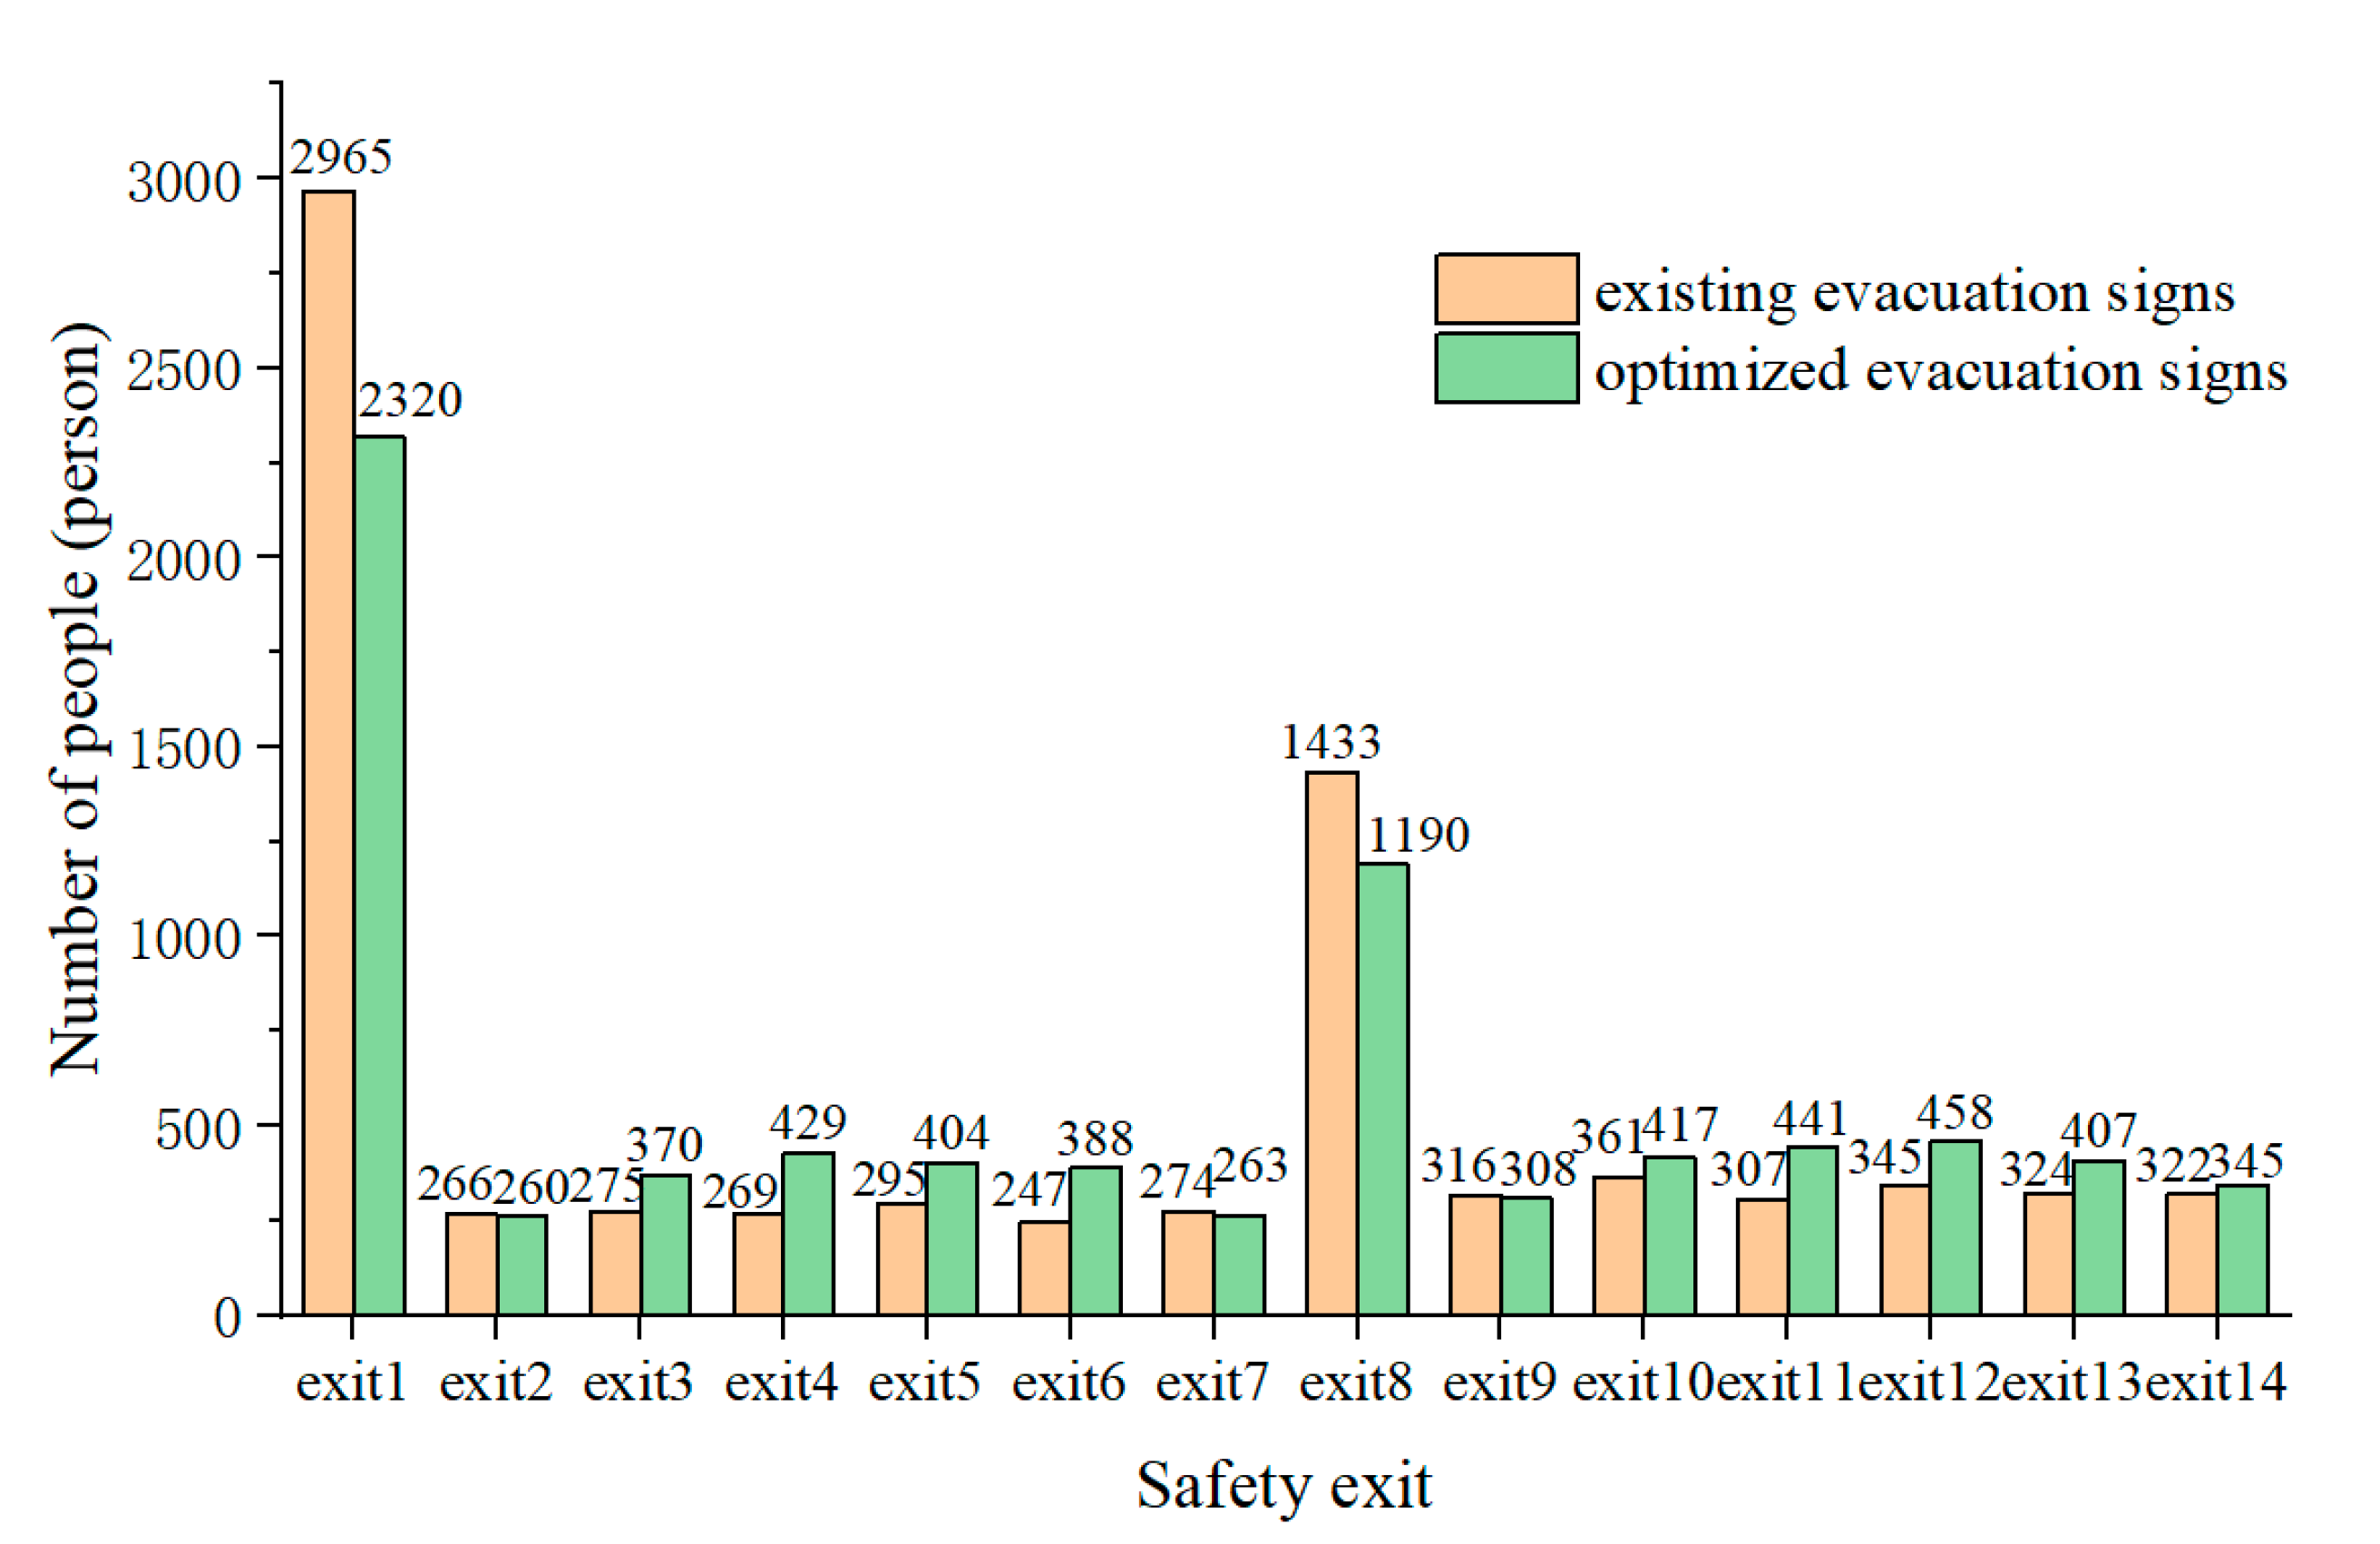
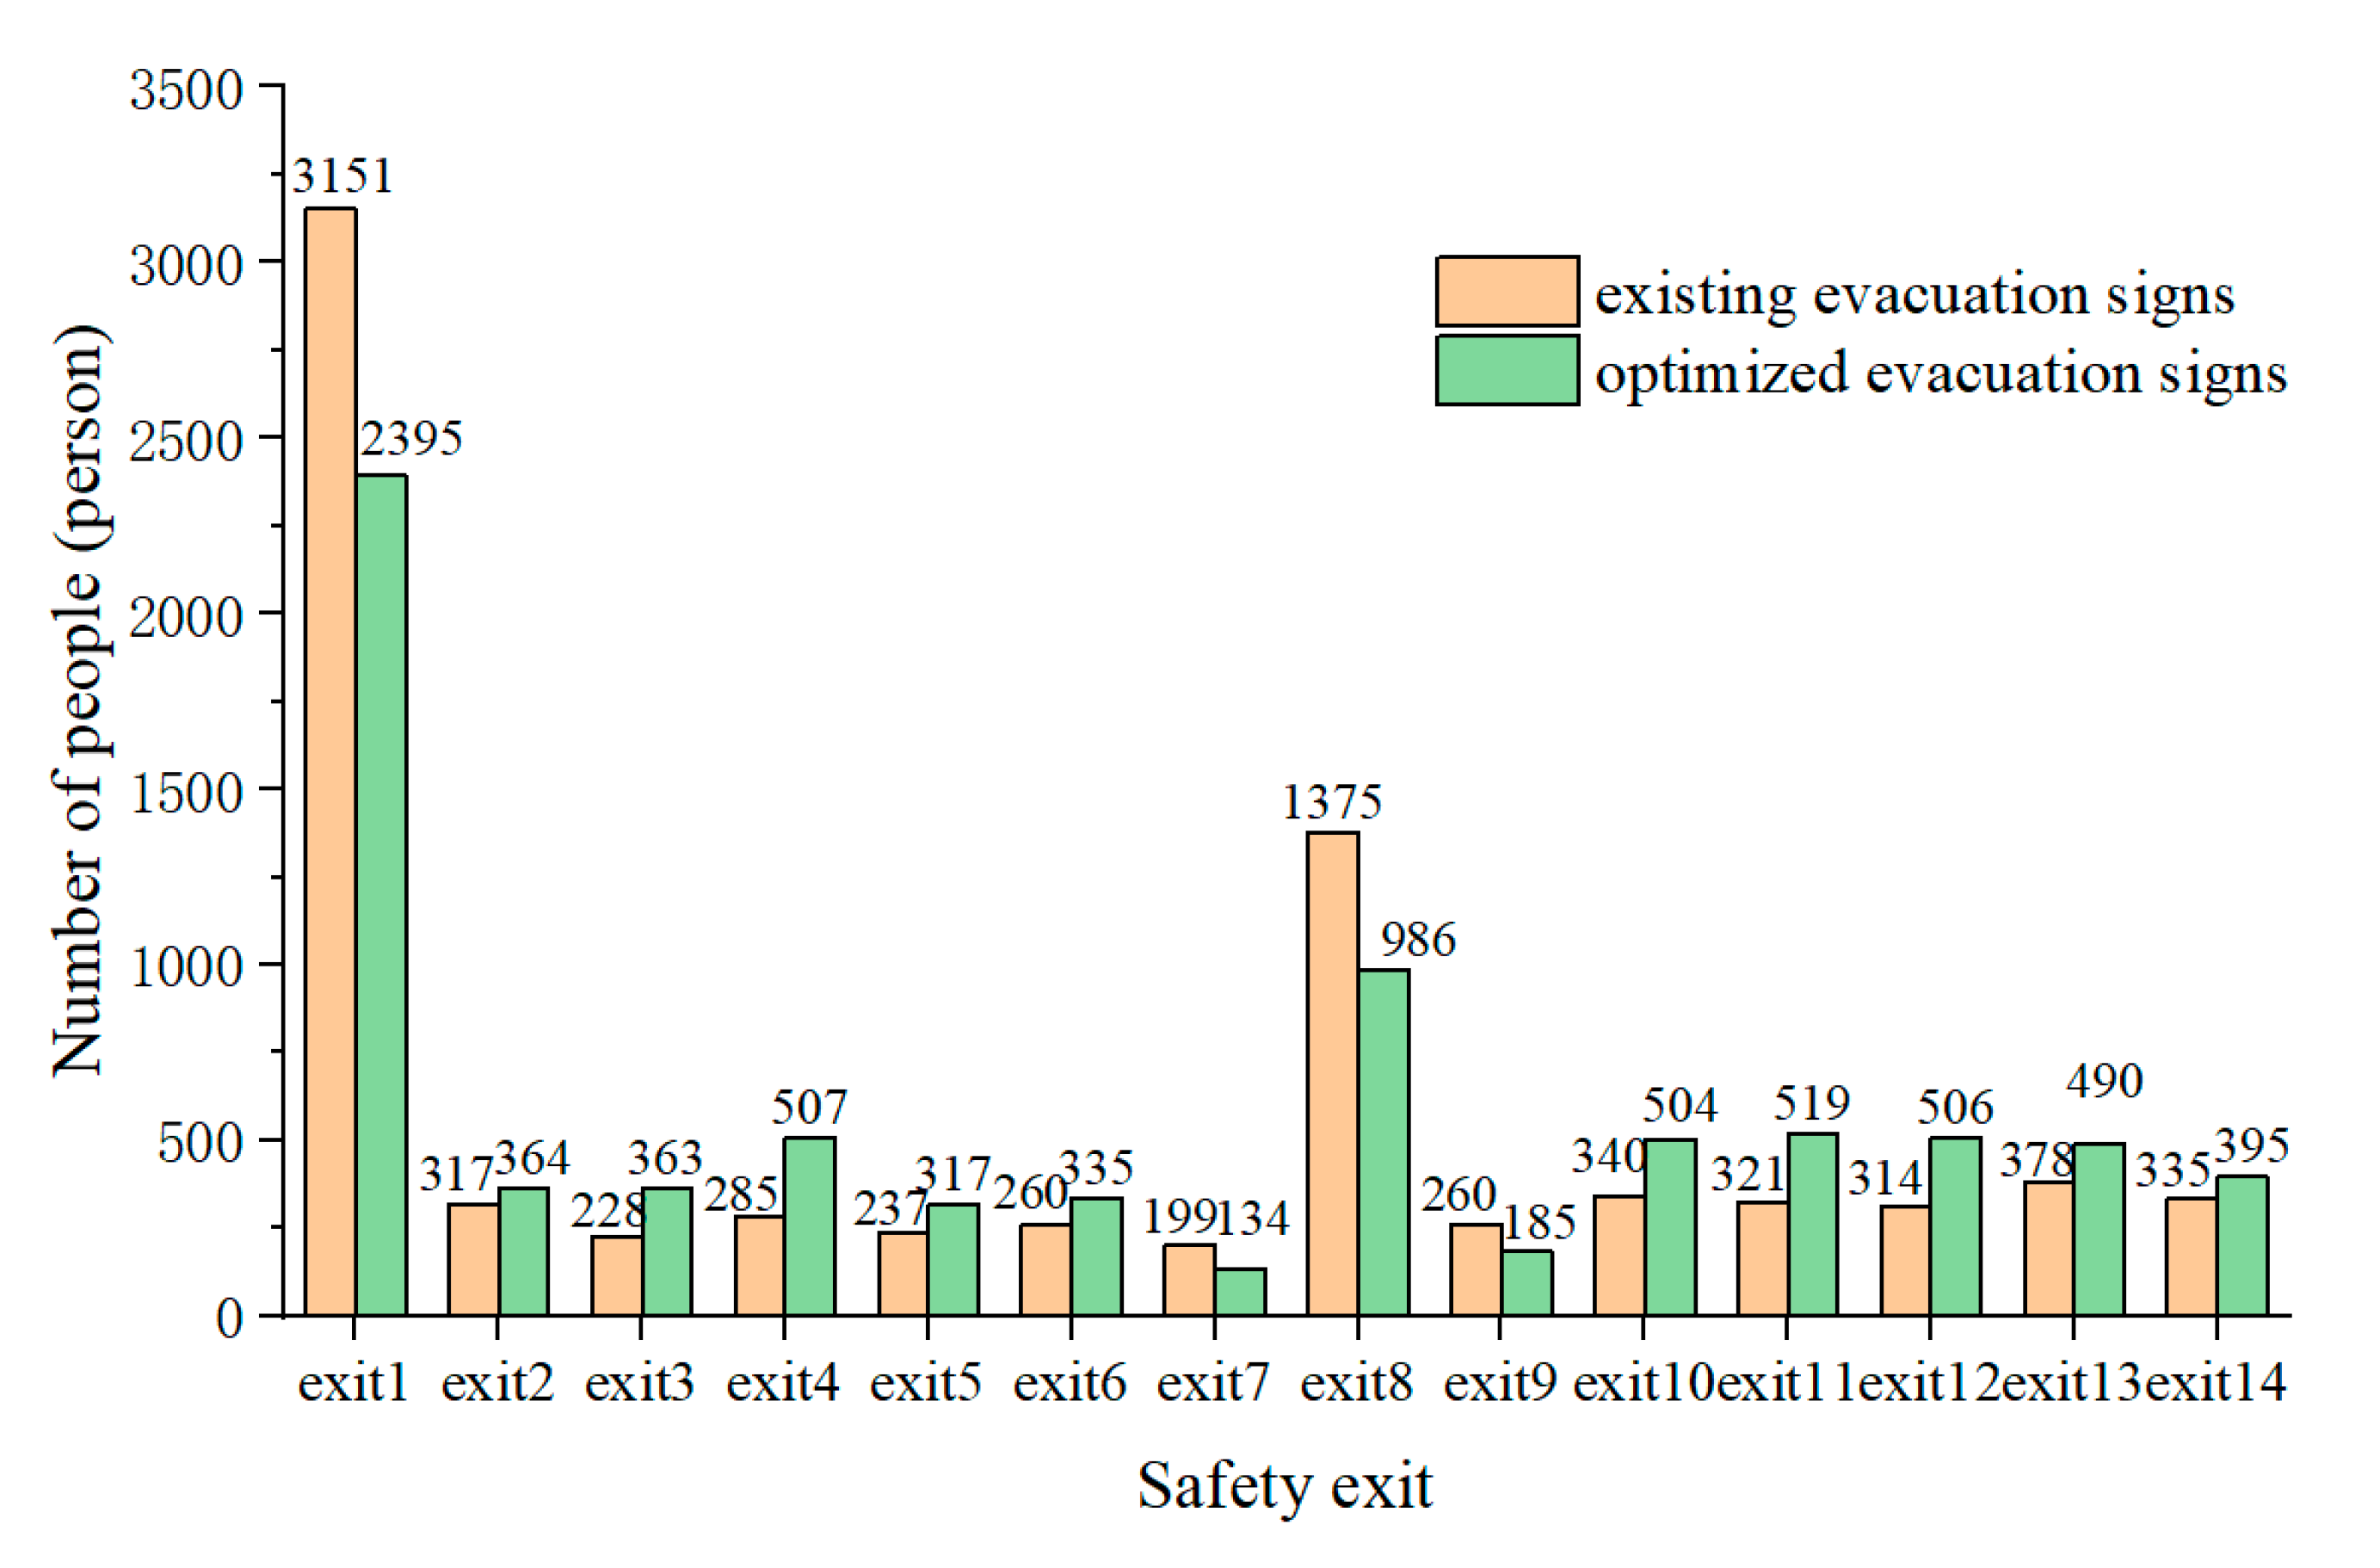
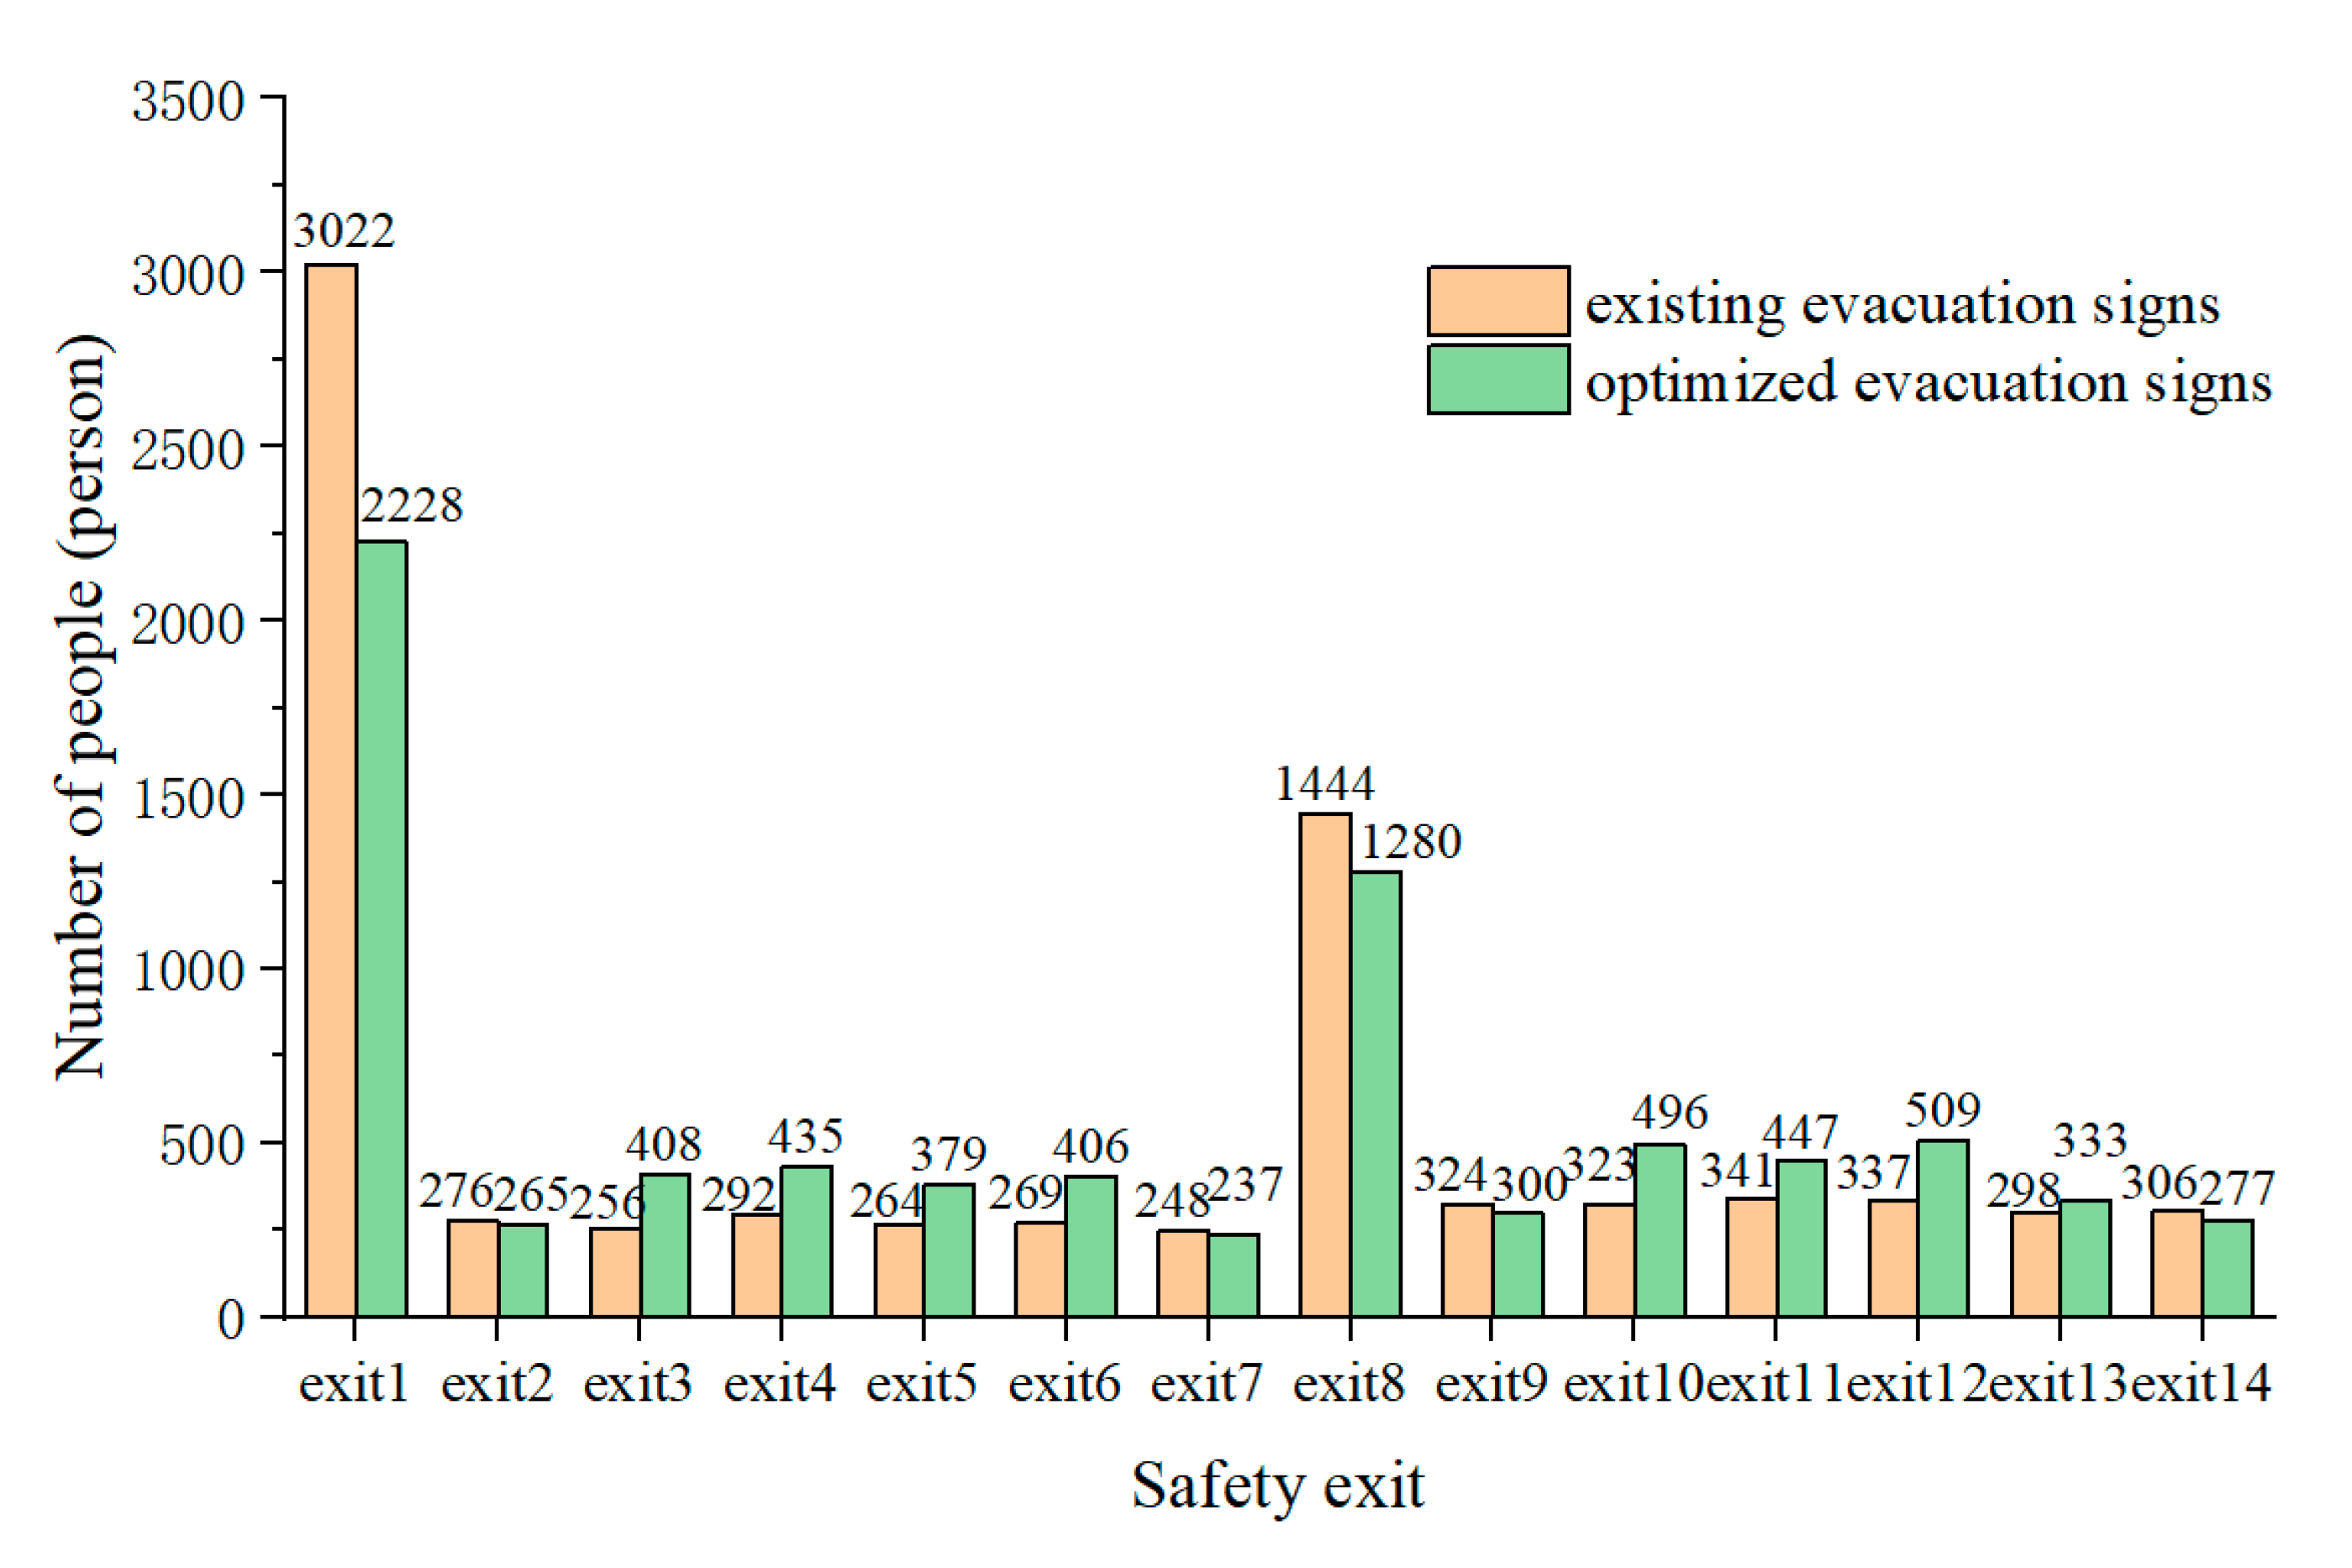
The layout of the evacuation signage played a diversion role in the evacuation. The existing layout of the evacuation signage was only set above the safety exits and not inside the exhibition hall, so the signs could only be identified within the visibility range of the evacuation signage near the safety exits. When encountering an emergency, people evacuate according to the guidance of the evacuation signage, which helps to ensure the continuity of the evacuation process. When the layout of evacuation signage was not optimized, people tended to choose their most familiar path or evacuate in the direction of the entrance because they were not within the visibility range of the evacuation signage and lacked the guidance of evacuation information. Hence, their evacuation process reflected the blind or intermittent characteristics.
People will choose the nearest safety exit to evacuate according to the guidance of the evacuation signage, spreading the evacuation pressure of the original single exit to other exits, especially to safety exits 2–7 in direction 2 and safety exits 9–14 in direction 3. It was obvious that the number of evacuees in the four directions was balanced, which demonstrated that the layout of the evacuation signage improved the unbalanced utilization of safety exits and reduced the possibility of secondary hazards such as stampeding due to the high density of people (Figure 16, Figure 17, and Figure 18).
By comparing the evacuation simulation under the signage layouts in different booth layout scenarios, it was found that, after the smart design of evacuation signage layout, both the evacuation efficiency and exit utilization rate were effectively improved.

5. Conclusions

Considering the contradiction between the variations in the exhibition booth arrangement and the lack of flexibility in the evacuation signage layout in exhibition buildings, the smart design method of evacuation signage layout proposed in this paper fully considers the mutual relationship between exhibition hall space and people’s evacuation behavior. In addition, it obtains the best location and quantity of evacuation signs in real time according to the different scenarios of exhibition hall booth arrangements without changing the existing exhibition hall structure, facilities, and booth arrangements. Additionally, this method works with the design strategy and smart evacuation signage devices to help people accurately find the safety exit location to avoid crowding and high density, thereby improving the evacuation efficiency. This method is simple to operate and easy to implement. By inputting relevant data, such as exhibition hall booth layout, the evacuation signage height, and the visibility range radius, the best evacuation signage layout optimization can be automatically and efficiently generated. This provides effective guidance and help for designers and exhibition hall managers for signage layout design, which is conducive to efficient evacuation signage layout design.
Although the application method of smart design for evacuation signage is consistent, this study primarily focused on rectangular exhibition halls, but it will be supplemented in future research by special shapes, such as uncommonly shaped and curved exhibition halls. This paper only used exhibition halls as the research object, and subsequent research should focus on other functional spaces in exhibition buildings. In addition, the evacuation signage layout of exhibition buildings is a complex systematic engineering problem. Combining BIM and VR technology, we plan to build a real-time visualization platform for the intelligent layout of evacuation signs, so as to complete the most efficient evacuation signage layout system in exhibition buildings and fully ensure people’s safety.

Author Contributions

Conceptualization, Zhanzhi Wan; methodology, Tiejun Zhou and Zhanzhi Wan; software, Zhili Tang and Yin Pan; validation, Lingfei Zhang; writing—original draft, Zhanzhi Wan; writing—review & editing, Zhanzhi Wan, Zhili Tang and Yin Pan. All authors have read and agreed to the published version of the manuscript.

Funding

This research was funded by the National Natural Science Foundation of China (grant numbers: 51878082 and 51678084).

Data Availability Statement

The data are not publicly available due to privacy.

Acknowledgments

We would like to thank the editors and anonymous reviewers for their comments and nice suggestions, which greatly improved the manuscript.

Conflicts of Interest

The authors declare no conflict of interest.

References

  1. Song, L.; Mei, Z. Solutions to Non-Conforming Fire Compartment of an Exhibition Hall. Procedia Eng. 2013, 52, 325–329. [Google Scholar] [CrossRef] [Green Version]
  2. Zhou, Z. The Exploration of Development Trend of Contemporary Convention and Exhibition Building; China Architecture & Building Press: Beijing, China, 2008; p. 300. [Google Scholar]
  3. Li, H.; Ng, J.K.; Cheng, V.C.W.; Cheung, W.K. Fast Indoor Localization for Exhibition Venues with Calibrating Heterogeneous Mobile Devices. Internet Things 2018, 3–4, 175–186. [Google Scholar] [CrossRef]
  4. Seo, D.; Hwang, E.; Kim, W. An Experimental Study on the Cognition of Evacuation Sign in Large Exhibition Space. J. Korean Soc. Hazard. Mitig. 2016, 16, 29–34. [Google Scholar] [CrossRef]
  5. Zhou, Y.; Pang, Y.; Chen, F.; Zhang, Y. Three-Dimensional Indoor Fire Evacuation Routing. Isprs. Int. J. Geo-Inf. 2020, 9, 558. [Google Scholar] [CrossRef]
  6. Tang, C.; Wu, W.; Lin, C. Using Virtual Reality to Determine How Emergency Signs Facilitate Way-Finding. Appl. Ergon. 2009, 40, 722–730. [Google Scholar] [CrossRef]
  7. Horasan, M. Occupant Evacuation and Orientation Problems in Large Halls—An Exhibition Building Case Study. Fire Mater. 1999, 23, 369–373. [Google Scholar] [CrossRef]
  8. Filippidis, L.; Galea, E.R.; Gwynne, S.; Lawrence, P.J. Representing the Influence of Signage on Evacuation Behavior within an Evacuation Model. J. Fire Prot. Eng. 2006, 16, 37–73. [Google Scholar] [CrossRef]
  9. Alizadeh, R. A Dynamic Cellular Automaton Model for Evacuation Process with Obstacles. Saf. Sci. 2011, 49, 315–323. [Google Scholar] [CrossRef]
  10. Collins, B.L. Visibility of Exit Signs and Directional Indicators. J. Illum. Eng. Soc. 2013, 20, 117–133. [Google Scholar] [CrossRef]
  11. Wong, L.T.; Lo, K.C. Experimental Study on Visibility of Exit Signs in Buildings. Build. Environ. 2007, 42, 1836–1842. [Google Scholar] [CrossRef]
  12. Kim, C.; Hur, M.; Oh, Y.; Choi, J.; Jeong, J. The Effect of the Running-Man Emergency Exit Sign and its Installed Location on Human Directional Choice. Appl Cognitive Psych. 2016, 30, 1014–1019. [Google Scholar] [CrossRef]
  13. Kinateder, M.; Warren, W.H.; Schloss, K.B. What Color are Emergency Exit Signs? Egress Behavior Differs from Verbal Report. Appl Ergon. 2019, 75, 155–160. [Google Scholar] [CrossRef] [PubMed]
  14. Olander, J.; Ronchi, E.; Lovreglio, R.; Nilsson, D. Dissuasive Exit Signage for Building Fire Evacuation. Appl Ergon. 2017, 59, 84–93. [Google Scholar] [CrossRef] [PubMed]
  15. Jin, T.; Yamada, T.; Kawai, S.; Takahashi, S. Evaluation of the Conspicuousness of Emergency Exit Signs. Fire Saf. Sci. 1991, 3, 835–841. [Google Scholar] [CrossRef] [Green Version]
  16. Jeon, G.; Na, W.; Hong, W.; Lee, J. Influence of Design and Installation of Emergency Exit Signs on Evacuation Speed. J. Asian Archit. Build. 2019, 18, 104–111. [Google Scholar] [CrossRef]
  17. Fujii, K.; Sano, T.; Ohmiya, Y. Influence of Lit Emergency Signs and Illuminated Settings on Walking Speeds in Smoky Corridors. Fire Saf. J. 2021, 120, 103026. [Google Scholar] [CrossRef]
  18. Yenumula, K.; Kolmer, C.; Pan, J.; Su, X. Bim-Controlled Signage System for Building Evacuation. Procedia Eng. 2015, 118, 284–289. [Google Scholar] [CrossRef] [Green Version]
  19. Tang, Y.; Xia, N.; Lu, Y.; Varga, L.; Li, Q.; Chen, G.; Luo, J. Bim-Based Safety Design for Emergency Evacuation of Metro Stations. Automat. Constr. 2021, 123, 103511. [Google Scholar] [CrossRef]
  20. Kobes, M.; Helsloot, I.; de Vries, B.; Post, J.G.; Oberijé, N.; Groenewegen, K. Way Finding During Fire Evacuation; An Analysis of Unannounced Fire Drills in a Hotel at Night. Build. Environ. 2010, 45, 537–548. [Google Scholar] [CrossRef]
  21. Zhu, R.; Lin, J.; Becerik-Gerber, B.; Li, N. Influence of Architectural Visual Access on Emergency Wayfinding: A Cross-Cultural Study in China, United Kingdom and United States. Fire Saf. J. 2020, 113, 102963. [Google Scholar] [CrossRef]
  22. Souza, J.C.; Brombilla, D.D.C. Humanitarian Logistics Principles for Emergency Evacuation of Places with Many People. Procedia Soc. Behav. Sci. 2014, 162, 24–33. [Google Scholar] [CrossRef] [Green Version]
  23. Turner, A.; Doxa, M.; O’Sullivan, D.; Penn, A. From Isovists to Visibility Graphs: A Methodology for the Analysis of Architectural Space. Environ. Plan. B Plan. Des. 2001, 28, 103–121. [Google Scholar] [CrossRef] [Green Version]
  24. Neill, M.J.O. Effects of Signage and Floor Plan Configuration on Wayfinding Accuracy. Environ. Behav. 1991, 23, 553–574. [Google Scholar] [CrossRef]
  25. Benthorn, L.; Frantzich, H. Fire Alarm in a Public Building How Do People Evaluate Information and Choose an Evacuation Exit. Fire Mater. 2015, 23, 311–315. [Google Scholar] [CrossRef]
  26. Lam, W.H.K.; Tam, M.; Wong, S.C.; Wirasinghe, S.C. Wayfinding in the Passenger Terminal of Hong Kong International Airport. J. Air Transp. Manag. 2003, 9, 73–81. [Google Scholar] [CrossRef]
  27. Xie, H.; Filippidis, L.; Gwynne, S.; Galea, E.R.; Blackshields, D.; Lawrence, P.J. Signage Legibility Distances as a Function of Observation Angle. J. Fire Prot. Eng. 2007, 17, 41–64. [Google Scholar] [CrossRef] [Green Version]
  28. Xie, H.; Filippidis, L.; Galea, E.R.; Blackshields, D.; Lawrence, P.J. Experimental Analysis of the Effectiveness of Emergency Signage and its Implementation in Evacuation Simulation. Fire Mater. 2012, 36, 367–382. [Google Scholar] [CrossRef]
  29. Fu, L.; Cao, S.; Song, W.; Fang, J. The Influence of Emergency Signage on Building Evacuation Behavior: An Experimental Study. Fire Mater. 2019, 43, 22–33. [Google Scholar] [CrossRef] [Green Version]
  30. Du, L. Research on Crowd Evacuation of Emergency Signs; Beijing University of Chemical Technology: Beijing, China, 2010. [Google Scholar]
  31. Zhang, Z.; Jia, L.; Qin, Y. Optimal Number and Location Planning of Evacuation Signage in Public Space. Saf. Sci. 2017, 91, 132–147. [Google Scholar] [CrossRef]
  32. Nassar, K.; Al-Kaisy, A. Assessing Sign Occlusion in Buildings Using Discrete Event Simulation. Automat. Constr. 2008, 17, 799–808. [Google Scholar] [CrossRef]
  33. Chen, C.; Li, Q.; Kaneko, S.; Chen, J.; Cui, X. Location Optimization Algorithm for Emergency Signs in Public Facilities and its Application to a Single-Floor Supermarket. Fire Saf. J. 2009, 44, 113–120. [Google Scholar] [CrossRef]
  34. Dubey, R.K.; Khoo, W.P.; Morad, M.G.; Hölscher, C.; Kapadia, M. Autosign: A Multi-Criteria Optimization Approach to Computer Aided Design of Signage Layouts in Complex Buildings. Comput. Graph. 2020, 88, 13–23. [Google Scholar] [CrossRef]
  35. Krukar, J.; Manivannan, C.; Bhatt, M.; Schultz, C. Embodied 3D Isovists: A Method to Model the Visual Perception of Space. Environ. Plan. B Urban. 2021, 48, 2307–2325. [Google Scholar] [CrossRef]
  36. Pech, A.; Lam, C.P.; Masek, M. Quantifiable Isovist and Graph-Based Measures for Automatic Evaluation of Different Area Types in Virtual Terrain Generation. IEEE Access 2020, 8, 216491–216506. [Google Scholar] [CrossRef]
  37. Kim, G.; Kim, A.; Kim, Y. A New 3D Space Syntax Metric Based On 3D Isovist Capture in Urban Space Using Remote Sensing Technology. Comput. Environ. Urban. Syst. 2019, 74, 74–87. [Google Scholar] [CrossRef]
  38. Lonergan, C.; Hedley, N. Unpacking Isovists: A Framework for 3D Spatial Visibility Analysis. Cartogr. Geogr. Inf. Sci. 2016, 43, 87–102. [Google Scholar] [CrossRef]
  39. Paliou, E.; Wheatley, D.; Earl, G. Three-Dimensional Visibility Analysis of Architectural Spaces: Iconography and Visibility of the Wall Paintings of Xeste 3 (Late Bronze Age Akrotiri). J. Archaeol. Sci. 2011, 38, 375–386. [Google Scholar] [CrossRef]
  40. Chang, D.; Park, J. Exploration of Isovist Fields to Model 3D Visibility with Building Facade. Archit. Res. 2011, 13, 19–29. [Google Scholar] [CrossRef] [Green Version]
  41. Ascensão, A.; Costa, L.; Fernandes, C.; Morais, F.; Ruivo, C. 3D Space Syntax Analysis: Attributes to be Applied in Landscape Architecture Projects. Urban. Sci. 2019, 3, 20. [Google Scholar] [CrossRef] [Green Version]
  42. Kubota, J.; Sano, T.; Ronchi, E. Assessing the Compliance with the Direction Indicated by Emergency Evacuation Signage. Saf. Sci. 2021, 138, 105210. [Google Scholar] [CrossRef]
  43. Motamedi, A.; Wang, Z.; Yabuki, N.; Fukuda, T.; Michikawa, T. Signage Visibility Analysis and Optimization System Using Bim-Enabled Virtual Reality (Vr) Environments. Adv. Eng. Inform. 2017, 32, 248–262. [Google Scholar] [CrossRef]
  44. Zhu, Y.; Chen, T.; Ding, N.; Chraibi, M.; Fan, W. Follow the Evacuation Signs or Surrounding People During Building Evacuation, an Experimental Study. Phys. A Stat. Mech. Appl. 2020, 560, 125156. [Google Scholar] [CrossRef]
  45. Chu, J.C.; Yeh, C.Y. Emergency Evacuation Guidance Design for Complex Building Geometries. J. Infrastruct. Syst. 2012, 18, 288–296. [Google Scholar] [CrossRef]
  46. Melanie, M. An Introduction to Genetic Algorithms, 5th ed.; MIT Press: Cambridge, MA, USA, 1999; p. 221. [Google Scholar]
  47. Reeves, C.; Rowe, J. Genetic Algorithms: Principles and Perspectives: A Guide to Ga Theory. Oper. Res. Comput. Sci. Interfaces Ser. 2002, 20, 1–326. [Google Scholar]
  48. Bolouri, S.; Vafaeinejad, A.; Alesheikh, A.; Aghamohammadi, H. The Ordered Capacitated Multi-Objective Location-Allocation Problem for Fire Stations Using Spatial Optimization. Isprs. Int. J. Geo-Inf. 2018, 7, 44. [Google Scholar] [CrossRef] [Green Version]
  49. Wan, Z.; Zhou, T.; Luo, N. Effect of Layout of Exhibition Hall on the Evacuation Efficiency in Exhibition and Convention Center. Saf. Environ. Eng. 2020, 27, 106–115. [Google Scholar]
  50. Cao, Y.; Luo, C.; Liu, Y.; Teng, S.; Xin, G. Path Intelligent Optimization for Dense Crowd Emergency Evacuation in Heritage Buildings. J. Cult. Herit. 2021, 47, 180–187. [Google Scholar] [CrossRef]
  51. Huang, L.; Gong, J.; Li, W. A Perception Model for Optimizing and Evaluating Evacuation Guidance Systems. Isprs. Int. J. Geo-Inf. 2021, 10, 54. [Google Scholar] [CrossRef]
  52. Kinateder, M.; Comunale, B.; Warren, W.H. Exit Choice in an Emergency Evacuation Scenario is Influenced by Exit Familiarity and Neighbor Behavior. Saf. Sci. 2018, 106, 170–175. [Google Scholar] [CrossRef]
  53. Chen, J.; Zhang, H. Analysis and Countermeasures of Smoke Control Effect for Large Space Buildings. Procedia Eng. 2014, 71, 253–260. [Google Scholar] [CrossRef]
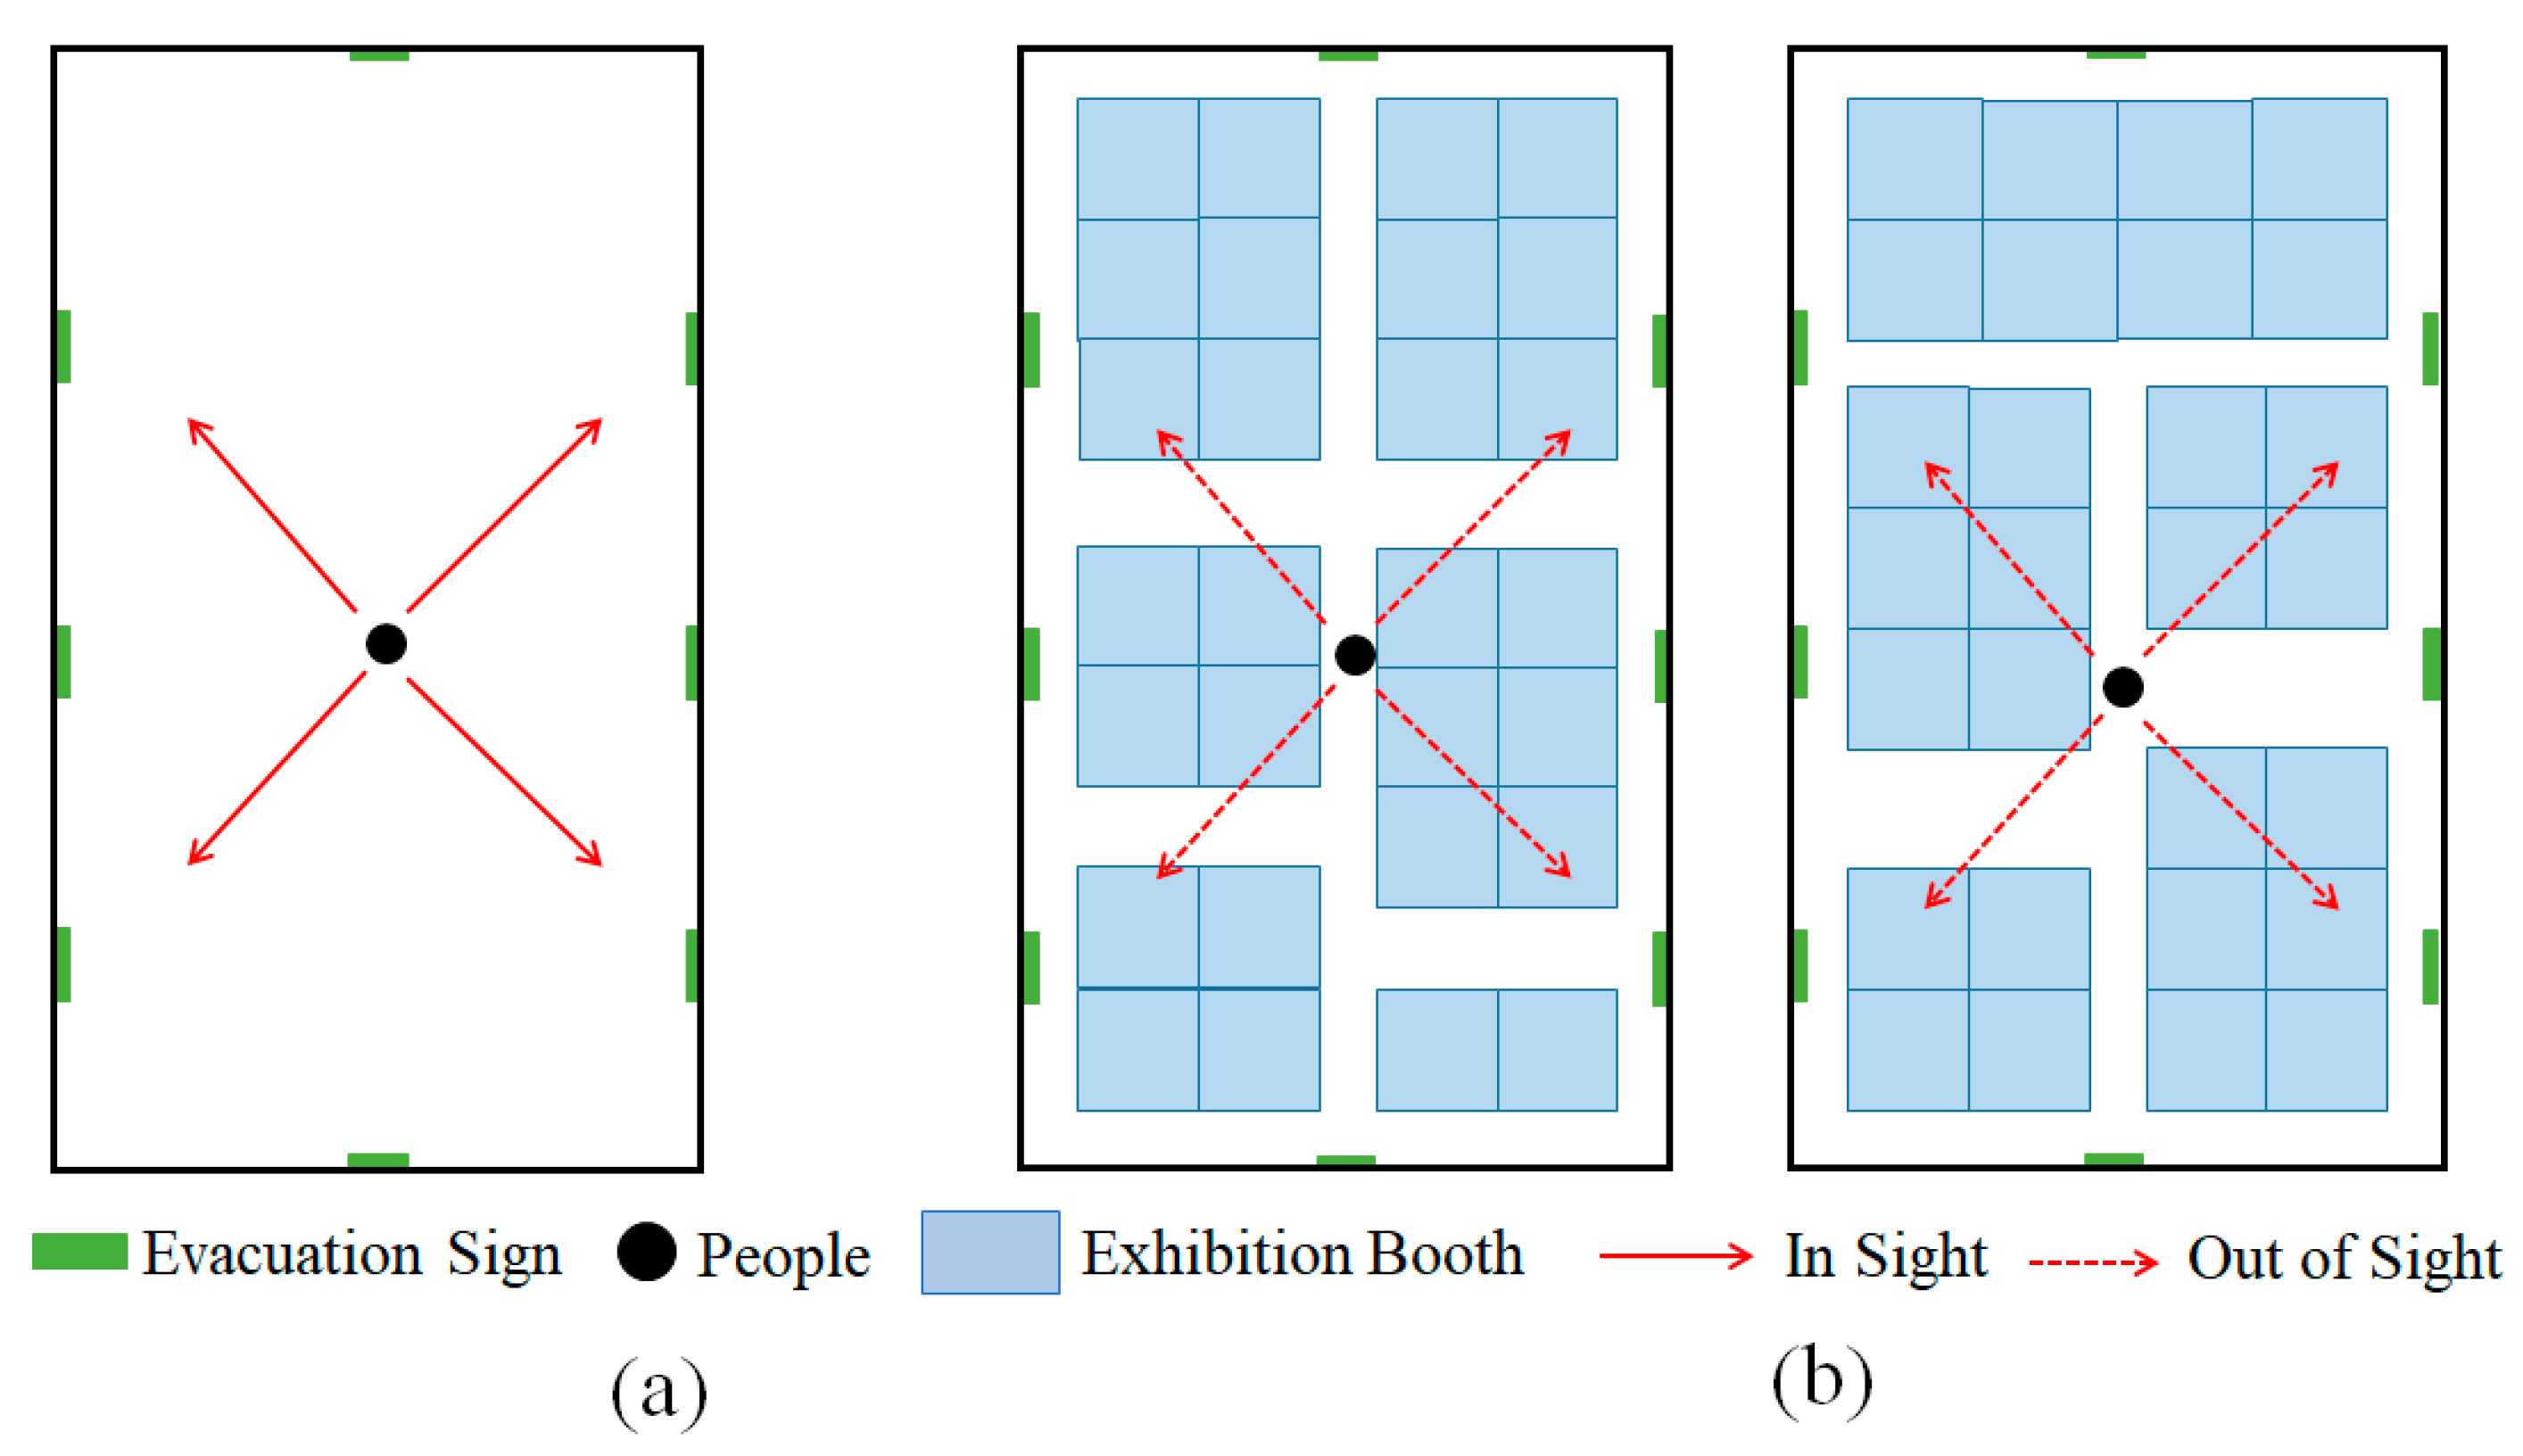
Figure 1. Visibility of evacuation signs in an exhibition hall (plan view). (a) Evacuation sign visibility in the empty hall; (b) loss of evacuation sign visibility due to installed exhibition booths.
Ijgi 10 00806 g001
Figure 2. Visibility of evacuation signs in an exhibition hall (section view). (a) Evacuation sign visibility in the empty hall; (b) loss of evacuation sign visibility due to installed exhibition booths.
Ijgi 10 00806 g002
Figure 3. Flow chart of smart design for evacuation signage layout.
Ijgi 10 00806 g003
Figure 4. The visibility range of the evacuation signs. (a) inside the exhibition hall; (b) above the safety exit or on the wall.
Ijgi 10 00806 g004
Figure 5. The relationship between evacuation signs, booths, and persons in the exhibition hall.
Ijgi 10 00806 g005
Figure 6. The spatial relationship between evacuation signs, booths, and persons.
Ijgi 10 00806 g006
Figure 7. Actual visibility range of evacuation signage blocked by booths. (a) Actual visibility range of an evacuation signage inside the exhibition hall; (b) Actual visibility range of an evacuation signage above the safety exit or on the wall.
Ijgi 10 00806 g007
Figure 8. Geometric relationship of the evacuation signage spacing.
Ijgi 10 00806 g008
Figure 9. Relationship between evacuation sign distance b and visibility range r. (a) b = r; (b) b = 0.5 r; (c) b = 0.75 r.
Ijgi 10 00806 g009
Figure 10. Floor plan of the exhibition hall.
Ijgi 10 00806 g010
Figure 11. Number of people moving in the four directions in the exhibition hall.
Ijgi 10 00806 g011
Figure 12. Scheme of the evacuation signage layout under exhibition hall arrangement scenario 1. (a) Exhibition hall booth layout; (b) evacuation signage candidate positions; (c) optimal evacuation signage layout.
Ijgi 10 00806 g012
Figure 13. Scheme of the evacuation signage layout under exhibition hall arrangement scenario 2. (a) Exhibition hall booth layout; (b) evacuation signage candidate positions; (c) optimal evacuation signage layout.
Ijgi 10 00806 g013
Figure 14. Scheme of the evacuation signage layout under exhibition hall arrangement scenario 3. (a) Exhibition hall booth layout; (b) evacuation signage candidate positions; (c) optimal evacuation signage layout.
Ijgi 10 00806 g014
Figure 15. Number of people remaining in the exhibition hall in the different scenarios.
Ijgi 10 00806 g015
Figure 16. The use of safety exits in scenario 1.
Ijgi 10 00806 g016
Figure 17. The use of safety exits in scenario 2.
Ijgi 10 00806 g017
Figure 18. The use of safety exits in scenario 3.
Ijgi 10 00806 g018
Table 1. Comparison of three scenarios in different exhibition hall booth layout.
TypeScenario 1Scenario 2Scenario 3
The area that can be covered by the visibility range of evacuation signs, S (m2)500053145230
Candidate positions, N (pcs)162139134
Actual number of evacuation signs, N1 (pcs)533838
Publisher’s Note: MDPI stays neutral with regard to jurisdictional claims in published maps and institutional affiliations.