Article

The Spatiotemporal Pattern and Driving Factors of Cyber Fraud Crime in China

1
Institute of Geographic Sciences and Natural Resources Research, Chinese Academy of Sciences, Beijing 100101, China
2
College of Resources and Environment, University of Chinese Academy of Sciences, Beijing 100049, China
3
Laboratory of Cyberspace Geography, Chinese Academy of Sciences and The Ministry of Public Security of the People’s Republic of China, Beijing 100101, China
4
Computer Network Information Center, Chinese Academy of Sciences, Beijing 100083, China
*
Author to whom correspondence should be addressed.
ISPRS Int. J. Geo-Inf. 2021, 10(12), 802; https://doi.org/10.3390/ijgi10120802
Submission received: 13 September 2021 / Revised: 20 November 2021 / Accepted: 27 November 2021 / Published: 30 November 2021

Abstract

:
As a typical cybercrime, cyber fraud poses severe threats to civilians’ property safety and social stability. Traditional criminological theories such as routine activity theory focus mainly on the effects of individual characteristics on cybercrime victimization and ignore the impacts of macro-level environmental factors. This study aims at exploring the spatiotemporal pattern of cyber fraud crime in China and investigating the relationships between cyber fraud and environmental factors. The results showed that cyber fraud crimes were initially distributed in southeastern China and gradually spread towards the middle and northern regions; spatial autocorrelation analysis revealed that the spatial concentration trend of cyber fraud became more and more strong, and a strong distinction in cyber fraud clustering between the north and the south was identified. To further explain the formative causes of these spatial patterns, a generalized additive model (GAM) was constructed by incorporating natural and social environmental factors. The results suggested that the distribution of cyber fraud was notably affected by the regional economy and population structure. Also, the high incidence of cyber fraud crime was closely associated with a large nonagricultural population, a high proportion of tertiary industry in GDP, a large number of general college students, a longer cable length, and a large numbers of internet users.

1. Introduction

With the increasing popularization of the internet and technology of communication, cyberspace has become the basis for social, political, economic, cultural, and many other aspects of human life [1]. Cyberspace also provides a new venue for criminal activities, and traditional crimes are gradually infiltrating cyberspace. While enjoying the convenience and efficiency that are brought by the internet, people continually suffer from many types of cybercrime. Globally, cybercrime incidents cost the world economy over 1 trillion dollars, which translates into 1% of the total global GDP [2]. Cyber fraud, also known as internet fraud or online fraud, is a typical economic cybercrime that makes use of the internet and could involve concealment of information or providing misleading information for the purpose of tricking victims out of money, property, or any other interest [3]. Frequent instances of cyber fraud include, but are not limited to, online purchase fraud, online romance scam, email fraud, phishing, and identity theft. These illegal actions have become increasingly rampant all over the world and have raised extensive concerns in many countries. During the COVID-19 pandemic, the use of online applications, such as online education and online payment, has grown rapidly, which also provides opportunities for criminals to steal personal information, spread illegal content and carry out cyber fraud, thereby rendering the situation even worse [4,5].
Over the last decade, cyber fraud crime in China has continued to increase year by year and has become a prominent type of crime with the fastest rise and the strongest response from the public. This new type of crime is notably characterized by regionalization, industrialization, and intellectualization within the country, and the criminal means are evolving rapidly due to the advent of new technologies. In recent years, cyber fraud crime in China has continued to occur at a high rate and has become more complex and diversified. According to the 47th China Statistical Report on Internet Development, as of the end of 2020, approximately 16.5% of internet users in China had experienced a form of cyber fraud [6]. In response, China has carried out joint law enforcement to crack down on cyber fraud and has made substantial progress. In 2020, a total of 256 thousand cases of telecom and internet fraud were cracked, 263 thousand suspects were arrested, and 120 billion yuan of economic losses were directly avoided for the individuals [7]. However, the general situation of cyber fraud control remains severe. Understanding the determinants of cyber fraud and their relationships is of great significance for preventing and fighting this kind of crime.
Criminological theories such as Rational Choice Theory (RCT), Routine Activities Theory (RAT), and Social Disorganization Theory (SDT), have been widely accepted and applied to explain conventional contact crimes (e.g., burglary, homicide, domestic violence, street robbery) [8,9,10,11]. With the prevalence of cybercrimes, these theories have also been extended to cyberspace to analyze noncontact cybercrimes. RCT assumes that offenders weigh the potential benefits and consequences associated with committing a crime and then make a rational choice based on this evaluation. RCT has been adopted to investigate cybercrimes such as digital piracy and hacker attack from the offender’s perspective [12,13,14]. As a subsidiary of RCT, RAT supposes that crime is likely to occur when three essential elements of crime converge in space and time: a motivated offender, a suitable target, and the absence of capable guardianship [15]. Although the victim and offender may not interact at the same physical location in a cybercrime, the offender is still able to reach the target through the network. Previous studies have examined the applicability of RAT for cybercrimes [16,17,18] and reported that a person’s online behaviors and individual characteristics might increase the risk of cybercrime victimization [19,20,21,22,23,24]. For instance, Holt and Bossler [25] indicated that involvement in computer crime and deviance significantly increased the risk of online harassment victimization. Reyns [26] found that online routine activities (online banking, emailing, and instant messaging) and individual characteristics (male, older, and high income) may increase the risk of identity theft victimization. Pratt et al. [27] suggested that spending time online and making online purchases increased the odds of being targeted for online fraud.
RCT and RAT focus mostly on the individual and situational characteristics that create criminal opportunities and neglect the social aspects of committing a crime, such as socioeconomic, cultural, and developmental factors. By contrast, SDT considers the physical and social environments to be the most significant determinants for the occurrences of crime instead of person’s individual characteristics. It claims that delinquency is not caused at the individual level, but is the individual’s normal response to environmental conditions. SDT provides a macro perspective on how social and economic conditions influence the overall crime and victimization. Previous studies have suggested that macro-level indicators, such as household size, unemployment rates, age structure, and economic level, may also affect opportunities for cybercrime and risk of victimization. For instance, Park et al. [28] applied SDT to examine the associations between cybercrime and socio-economic factors for the U.S. states, found that higher income, better education, lower poverty rate, and higher inequality are likely to make the Internet penetration more positively related to cybercrime. Kigerl [29] examined the effects of macro-social factors on phishing and spam cybercrime rates at the country level and found that more internet users per capita and higher unemployment are related to higher cybercrime activity. Song et al. [30] suggested that community structural characteristics, such as gender, age, ethnicity, and unemployment, can also affect internet risk and, hence, the risk of cybertheft victimization.
With regard to cyber fraud, efforts have been made to explore the influence of online activities [27,31,32] and socio-demographic factors [33,34] on cyber fraud victimization. However, these studies tended to overlook the effects of social structure and environmental conditions on cyber fraud victimization, namely, the economic, cultural, social, legal and other macro-level factors that determine the formation and evolution of cyber fraud; therefore, they had a limited effect on the practical work of cyber fraud prevention. As a complicated social phenomenon, the occurrence of cyber fraud is a result of the composite effect of many objective and subjective factors, it is necessary to combine the advantages of different theories. From the SDT perspective, the fast growth of economy and technology has deeply changed the lifestyle of human beings and the operation mode of the society. The social transformation and accompanying population movement, economic inequality, and criminal subculture have provided a breeding ground for cyber fraud crimes. According to RCT, the economic development and the improvement of people’s living standards have provided financial incentives for cyber fraudsters. The development and popularization of information and communications technologies (ICTs) have also provided various low-cost means to commit cyber fraud. From a RAT point of view, the increased number of Internet users and mobile phone users provides a wide range of potential targets for cyber fraudsters, and to some extent, the unemployment brings about a large number of potential offenders for cyber fraud crime.
Therefore, by integrating three criminological theories, the current study aims at: (1) exploring the spatiotemporal distribution and cross-regional flow of cyber fraud in China; (2) analyzing the formative reasons for the spatial differential patterns; and (3) using a generalized additive model (GAM) to examine the associations between cyber fraud victimization and macro-level factors including socio-demographic, economic and technological factors, as well as quantifying their effects on the occurrence of cyber fraud.

2. Materials and Methods

2.1. Cyber Fraud Cases

The cyber fraud case data were obtained from the China Judgements Online database (https://wenshu.court.gov.cn/, accessed on 25 July 2021), which publishes judgement documents made by courts at all levels in China, covering criminal, civil, administrative, and other types of cases. To retrieve cyber fraud cases, the keyword was set to “internet fraud (in Chinese)”, which cyber fraud, internet fraud, and online fraud are collectively referred to in Chinese. The cause of criminal action was set to “crime of property violation - fraud”. To avoid the duplicate recording of multiple trial levels for the same case, the trial level was uniformly set as “criminal first instance”, and the document type was set as “judgement”, which is the written decision made by a court to convict and sentence the defendant according to the facts and evidence found after the trial of a criminal case. After removing invalid records, a total of 6106 cyber fraud cases were included in the research. For each of the cases, detailed information was extracted from the judgement documents, which included the time of the crime, the location of the court, and the residence of the offender, among other information. Since each case could involve multiple offenders, a total of 65,817 origin-destination records of the offenders were obtained to explore the spatial flow pattern of cyber fraudsters in China.

2.2. Environmental Factors

Several environmental factors were included as candidate explanatory variables based on the theoretical basis and data availability. These environmental factors are composed of economic factors, socio-demographic factors, and technological factors. Among the economic factors, gross domestic product (GDP) was used to measure the economic development level; the proportions of primary/secondary/tertiary industry in GDP were adopted to reflect the economic structure; the loan balances of financial institutions and household deposit balances of financial institutions were used to reflect the development level of the financial industry and residents’ consumption habits; e-commerce sales was adopted to reflect the vitality of online shopping activities; telecom revenue was used to reflect the development level of the telecommunication industry. For demographic factors, the total population was used to reflect the population size; the nonagricultural population and unemployed population were used to represent the population structure; the numbers of students in general colleges and students in secondary education were used to reflect the education level. For technological factors, cable length was adopted to reflect the capacity of the information infrastructure, and the numbers of mobile phone users and internet users and the internet penetration rate were applied to represent the scale of information and communication. These factors were all acquired from the China City Statistical Yearbooks (2014–2018), which contain the social and economic development data on major prefecture-level cities in China.

2.3. Moran’s I

Moran’s I is widely adopted to measure spatial autocorrelation and consists of two types: global Moran’s I and local Moran’s I. Global Moran’s I assesses the spatial pattern of a geographical phenomenon and determines if it is dispersed, clustered, or random based on the locations and values of an associated feature [35]. The utilized tool computes Moran’s I value along with the z-score and p value to further evaluate the significance of this index [36].
Global Moran’s I ranges between −1 and +1, where −1 suggests scattering or dispersion, +1 suggests that the observed pattern is clustered spatially, and values that are close to or equal to 0 indicate the absence of autocorrelation. The final conclusions about the observed pattern are drawn only after examining the z-score and the p value of the index. In this study, global Moran’s I was applied to measure the spatial autocorrelation of all cyber fraud cases on the 370 administrative divisions of China (including 333 prefecture-level divisions, 4 municipalities, 30 provincial-controlled divisions, 2 special administrative regions, and Taiwan).
Local Moran’s I is used as a local indicator of spatial association (LISA), which is calculated for every sampling location to determine the degree of spatial autocorrelation [37]. It is also widely used to identify spatial clusters of features with high or low values and to discover spatial outliers.
A positive local Moran’s I value indicates that a location has similarly high or low values as its neighbors, and such a location is called a high-high cluster or low-low cluster. In contrast, a negative local Moran’s I value indicates a potential spatial outlier with values that differ from those of its surrounding locations, which is called a high-low outlier or low-high outlier. Local Moran’s I was applied to identify the spatial clusters and spatial outliers of cyber fraud cases.

2.4. Generalized Additive Model

A generalized additive model (GAM) is a generalization of a linear regression model in which the coefficients can be expanded as smooth functions of covariates [38]. The method uses a link function to capture the relationships between the expectations of explained variables and nonparametric explanatory variables. It is semiparametric and can account for nonlinear relationships between dependent variables and covariates. A typical GAM formulation is as follows:
E(Y|X1, X2, ⋯, Xp) = α + f1(X1) + (X2) + ⋯ + fp(Xp)
where X1, X2, ⋯, Xp represent the predictors, Y is the response variable, α is a constant and f j s are the smooth functions.
GAMs have advantages such as the ability to uncover nonlinear relationships, avoidance of overfitting by regularization, and satisfactory interpretability [39]. Therefore, we adopted a GAM to quantify multivariate relationships between the cyber fraud cases and mixed types of environmental covariates. Prior to model fitting, all candidate variables were tested for collinearity using Spearman’s correlation analysis. If high correlations (i.e., |r| > 0.6) between any two variables existed, then one of the variables was excluded to minimize collinearity [40] and the variable with larger contribution to the total variance in the model was included in the final model. In addition, variance inflation factors (VIF) were calculated to reduce the effects of multicollinearity, with VIF values above 3 being an indication of strong collinearity [40]. When fitting the GAM models, Poisson distribution was chosen to model the probability distribution for the data. A stepwise backward selection procedure was implemented to identify the best-fitting model based on the minimization of the Akaike’s information criterion (AIC) [41]. At each step of the selection procedure, the variable with the highest p-value (p > 0.05) was dropped to produce a model with a lower AIC, and the backward selection continued until the lowest AIC was reached. All GAM models were developed using the ‘mgcv’ package [42] in the R 3.6.2 [43] programming environment.

3. Results

3.1. Spatiotemporal Distribution of Cyber Fraud

The spatial and temporal distributions of cyber fraud in China are presented in Figure S1 (supplementary materials). The number of cyber fraud cases increased from 2014 to 2017 at an annual average rate of 104% and decreased slightly in 2018. From a spatial perspective, cyber fraud was initially distributed in Chongqing and southeastern coastal provinces such as Zhejiang, Fujian, and Guangdong Provinces and gradually spread to surrounding provinces and cities throughout China. More specifically, in 2014, cyber fraud was scattered only sporadically in Wenzhou, Jinhua, Taizhou and Shaoxing of Zhejiang Province; Quanzhou, Xiamen and Zhangzhou of Fujian Province; Zhongshan, Shenzhen and Zhanjiang of Guangdong Province; Wuxi of Jiangsu Province; and Beijing and Chongqing Municipalities. Subsequently, in 2015, cyber fraud crime in southeastern areas gradually expanded to neighboring areas, especially in Fujian and Zhejiang Provinces. Meanwhile, this crime began to emerge in various central regions, such as Shaanxi, Henan, Anhui, Hubei and Hunan Provinces. In 2016, the range of cyber fraud activities continued to extend, and the number of cyber fraud crime cases also increased sharply. By the end of 2017, cyber fraud crimes had developed from initial discrete cities into several contiguous regions, covering almost all prefecture-level districts of Jiangsu, Zhejiang, Fujian, Henan, Guangdong, Hunan and Hubei Provinces. Until 2018, the number of crime cases fell very slightly, while the scope of cyber fraud activities remained approximately unchanged. Previously, most cyber fraud cases were distributed in cities on the southeastern side of the Huhuanyong Line (an imaginary population demarcation line in China, as of 2015, about 94% of China’s population and GDP are concentrated on the southeastern side of this line) [44], and only a few occurred on the northwestern side. Cyber fraud cases in the top 5 provinces (Zhejiang, Guangdong, Jiangsu, Henan, and Fujian Provinces in descending order) accounted for 56% of the total cases.

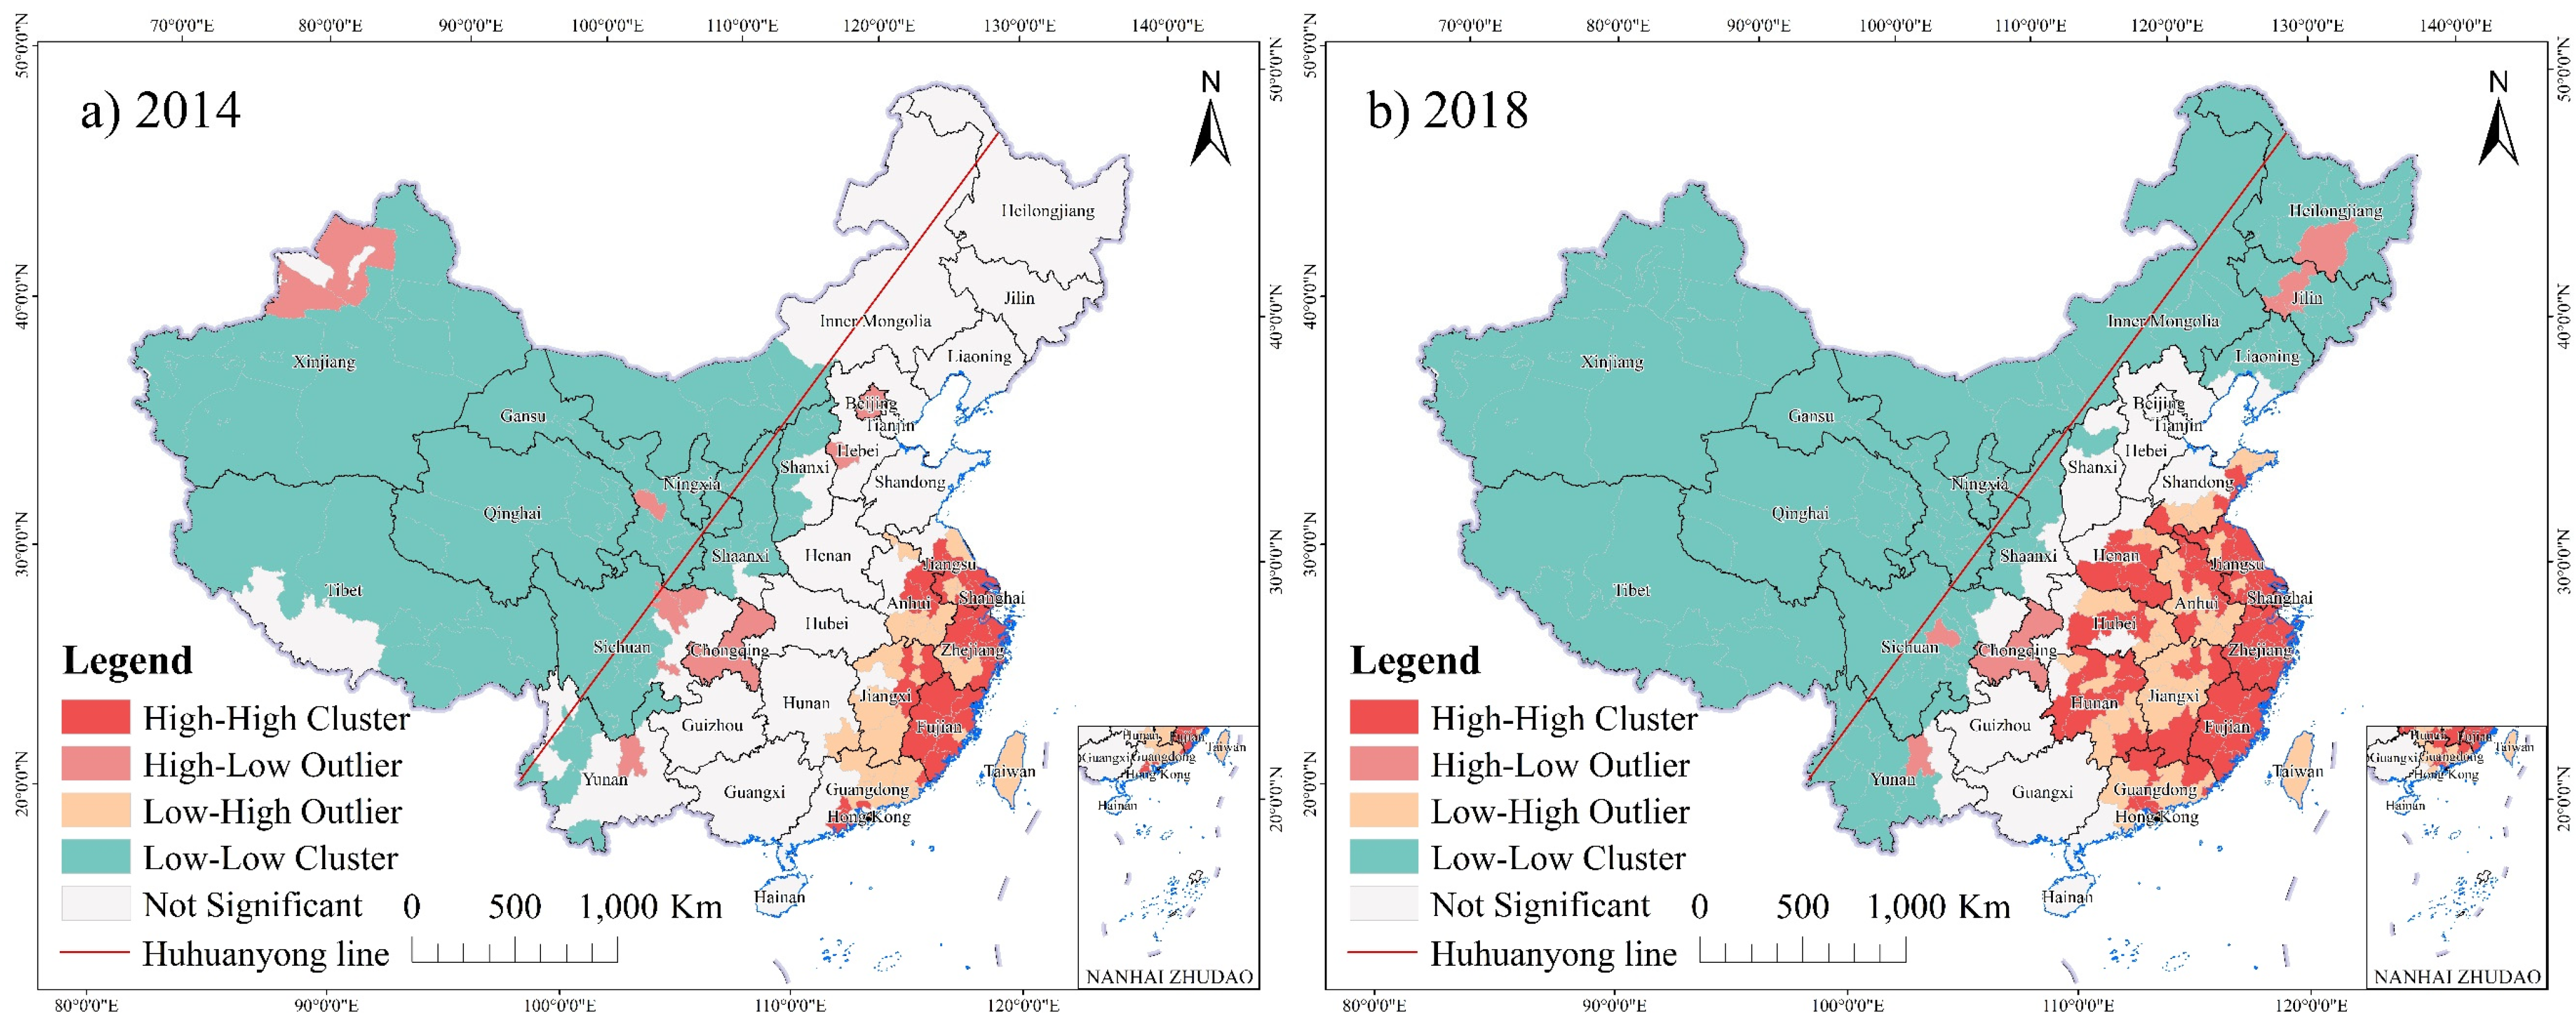
3.2. Spatial Clustering of Cyber Fraud

The global Moran’s I values that were obtained for all five years are greater than 0, which suggests that there is positive autocorrelation or a highly clustered pattern for cyber fraud cases. This is also validated by examining the p values. The obtained p value is statistically significant (p ≤ 0.05) for all five years; thus, the null hypothesis that the attribute being analysed is randomly distributed is rejected. The obtained standard deviations exceed 2.58 (z-score > 2.58) for all five years; therefore, there is less than 1% probability that the observed pattern is an outcome of a stochastic process (Table 1). Significant positive autocorrelation is observed for all five years, thereby indicating the presence of spatial clustering patterns of cyber fraud crime. The global Moran’s I increased from 2014 to 2017, which suggests that these clustering patterns became increasingly strong, despite the slight drop in 2018.
Throughout the study period, the local Moran’s I results for cyber fraud cases (Figure 1) show that the high-high clusters are located mainly in central and southeastern China and the low-low clusters are concentrated mostly on the northwestern side of the Huhuanyong Line, which agrees with the distribution of cyber fraud cases. Most of the high-low outliers are located close to the low-low clusters, and the low-high outliers are mostly adjacent to the high-high spatial clusters. The extents of both the high-high spatial clusters and low-low clusters gradually expanded from 2014 to 2018. The high-high clusters were originally limited to the southeastern coastal areas of China, such as Jiangsu, Zhejiang, and Fujian Provinces; they expanded into neighboring areas and eventually formed a relatively continuous and large cluster that consisted of Jiangsu, Zhejiang, Fujian, Guangdong, Henan, Anhui, Hubei, Hunan and Jiangxi Provinces.

3.3. Spatial Flow of Cyber Fraudsters

A Sankey diagram was then plotted to reveal the cross-regional flow of cyber fraud offenders in China. As can be seen from Figure 2, Fujian, Hubei, Henan, Guangdong, and Hunan are the major origin provinces of cyber fraudsters, which account for 46.9% of the total fraudsters nationwide; Zhejiang, Jiangsu, Guangdong, Henan, and Fujian are the major destination of cyber fraudsters, contributing 56.6% of the total. For different destination provinces, the distribution patterns of origin places of cyber fraudsters are very different from each other. Overall, the cyber fraudsters in Zhejiang and Jiangsu Provinces are mainly from outside the provinces, while the cyber fraudsters in Guangdong, Henan, Anhui, Hunan, and Hubei Provinces are mainly from local provinces. To be specific, the cyber fraudsters flow into Zhejiang are mainly from Fujian (12.5%), Hubei (10.6%), Henan (7.2%), Hunan (6.6%), Guangdong (6.1%), and Jiangxi (5.6%); cyber fraudsters in Jiangsu were mainly from Hubei (13.2%), Henan (9.2%), Jiangsu (8.8%), Jiangxi (6.2%), Guangdong (6.0%), and Guangxi (5.7%). The origin places of cyber fraudsters in Guangdong, Henan, and Anhui are relatively concentrated. The cyber fraudsters in Guangdong mainly come from local (38.3%) and neighboring provinces such as Guangxi (14.1%), Hunan (13.5%), and Fujian (6.8%), while those in Henan and Anhui are mainly from local (44.3% and 25.3%, respectively) and Hunan (8.5% and 8.7%, respectively), Hubei (7.3% and 12.6%, respectively), and Fujian (6.0% and 8.6%, respectively). The cyber fraudsters in Fujian, Hubei, and Hunan are mainly from local provinces (75.6%, 63.5%, and 64.7%, respectively). A more detailed table that shows the flow of offenders to major destination provinces is provided in Table S1 (Supplementary Materials).

3.4. Relationships between Cyber Fraud and Environmental Factors

After the procedures of the multicollinearity test and stepwise backward selection, variables with high collinearity and non-significant variables were excluded from the analysis. The best-fitting GAM model was then adopted to examine how various environmental factors may affect cyber fraud crime. The final GAM model includes six variables: nonagricultural population, unemployed population, number of students in general colleges, the proportion of tertiary industry in GDP, number of internet users, and cable length. These variables accounted for 87.4% of the total explained deviance of the GAM model, and the output of the GAM model is shown in Table 2.
The partial effects of the six statistically significant variables on cyber fraud are shown in Figure 3. Each variable shows a clear nonlinear relationship with cyber fraud. The number of cyber fraud cases showed a slight decrease when the nonagricultural population was less than 5 million; when the population was more than 5 million, the number of crime cases showed steady growth. The number of cyber fraud cases was negatively correlated with the unemployment, while it showed an approximate positive correlation with the proportion of tertiary industry in GDP, and when the proportion rose above 60%, the statistical confidence decreased. There was no significant change when the number of students in general colleges was less than 200 thousand, and a continuous increase was observed when the number of students was between 200 thousand and 650 thousand, followed by a modest drop. There was a strong positive relationship between the number of cyber fraud cases and the number of internet users, and an obvious inflection point was observed at approximately 10 million internet users, namely, when the number of internet users was more than 10 million, the number of cyber fraud cases increased slower. The number of cyber fraud cases showed a slight upward trend with the increase of cable length.

4. Discussion

During the examined five-year period, cyber fraud crime in China experienced a continuous and rapid increase, which may have resulted from the widespread use of the internet and the development of communications technology. The increasing use of internet applications such as online social networking, online shopping and online payment has increased the risk of personal information leakage and, thus, the risk of exposure to online fraudsters. Moreover, the evolution of technology has led to the constant upgrading of cyber fraud methods, which has, in turn, improved the concealment and success rate of crime, thereby posing a substantial barrier to preventing and combating cyber fraud crimes. The slight drop in the total number of cyber fraud cases in 2018 might be attributed to the nationwide campaign to crack down on cyber fraud, which is launched by public security authorities across China in the past few years [45,46]. The implementation of the Cybersecurity Law of the People’s Republic of China in 2017 could have also played a crucial role, which provided definite regulations on personal information protection and the governance of cybercrimes.
The distribution of cyber fraud is closely associated with regional economic development and population structure. In the study period, most of the cyber fraud crimes took place in the economically developed coastal areas of southeast China, such as Jiangsu, Zhejiang, Guangdong, and Fujian Provinces, and in populous areas, such as Henan, Anhui, Hunan and Hubei Provinces. This revealed the spatial pattern of cyber fraud criminal flow in China, which showed that cyber fraud criminals often choose economically developed and densely populated areas as the preferred places to commit crime. These places not only are characterized by a higher standard of living, higher level of income, and improved network communication infrastructure but also feature large immigrant populations, high mobility and inadequate management, which together provide perfect conditions and suitable targets for cyber fraud crimes. The results of the GAM model also provide positive evidence for these patterns. The number of cyber fraud cases in Chongqing Municipality remained high for all five years, which is likely because Chongqing is the largest municipality in terms of population and area and ranks 5th in terms of GDP among all cites in China.
The Global Moran’s I is growing year by year, which indicates an increasing tendency of spatial concentration of cyber fraud crime at the national level. This is consistent with the current characteristics of this crime in China, namely, cyber fraud occurs mainly in several key areas of southeastern coastal provinces. Local Moran’s I captures the spatiotemporal dynamics of cyber fraud across China and reveals a strong distinction between the north and the south. More specifically, the distribution of cyber fraud in the northern regions is more dispersed, while in the southern regions, it is more concentrated. Initially, cyber fraud was confined to the southern and eastern areas, such as Zhejiang, Fujian, and Guangdong Provinces, and gradually spread towards the middle and northern regions, such as Henan, Anhui, Hubei and Hunan Provinces. This is largely because public security authorities in Fujian, Guangdong and Zhejiang Provinces in Southeast China have carried out special operations to crack down on cyber fraud crimes in the early years and criminal gangs moved from coastal provinces to inland provinces and subsequently spread to most parts of the country. At present, cyber fraud has formed several major hard-hit clusters around Jiangsu, Zhejiang, Fujian, Guangdong, Henan, Anhui, Hubei, Hunan, Jiangxi Province and Chongqing Municipality. Measures against cyber fraud crime in these provinces should be further strengthened, for example, strengthen the publicity of anti-fraud to enhance the safety consciousness of the public, strengthen supervision and regulation over network operators and financial institutions to protect personal information of citizens, and strengthen the strike force to crackdown on cyber fraud crimes by police and judicial authorities.
The spatial flow patterns of cyber fraud offenders could provide useful information to implement more targeted and more efficient prevention and control strategies. In general, cyber fraud offenders mainly flow from moderately developed areas to more developed areas. The cyber fraud offenders in Fujian, Hubei, Hunan, and Guangdong are not only active in the local provinces but also continuously spreading to other provinces. Measures should be taken from the origins to prevent the increase and spread of the crime. It’s also important to strengthen the development of the local economy and industry, expand employment, and eliminate the soil of cyber fraud crime. For the major destination provinces of cyber fraud offenders, it is necessary to promote information sharing and regional cooperation among local public security authorities, strengthen the control over the key populations from high-risk origin provinces, and implement differentiated and precise governance strategies.
The GAM results further explain the formative causes of these geographical patterns. The nonagricultural population was positively associated with cyber fraud when the population was more than 5 million, which indicates that cyber fraud offenders tend to commit cyber fraud crime in large cities with high level of urbanization. A higher proportion of tertiary industry in GDP is generally associated with a more rational economic structure and more robust economic activity, the financial industry, internet industry, tourism, wholesale and retail trade in the tertiary industry might provide more criminal opportunities and stronger finical incentives for cyber fraud offenders. In addition, the areas with longer cable lengths and more internet users indicate developed ICT infrastructures and better communication conditions. According to RCT, such areas are more profitable and more readily to commit cyber fraud, and thus more attractive to cyber fraudsters. A positive correlation was also observed when the number of students in general colleges was less than 650 thousand, in accordance with the trend towards younger cyber fraud victims [47]; cyber fraud crimes are mostly committed through the Internet and mobile phone, the younger generation use the Internet more often and some of them have poor safety awareness, this may explain the positive correlation between the two variables. However, unemployment was negatively correlated with cyber fraud, which is contrary to our initial hypothesis; a possible explanation for this result could be the high mobility of cyber fraudsters, in another word, cyber fraudsters may come from cities with high unemployment, but they frequently change places to commit cyber fraud to escape the police.

5. Conclusions

Cyber fraud crimes severely harm the safety of people’s lives and property and pose substantial threats to social order and stability. Behind the rampant increase and wide spread of cyber fraud, there are profound sociological, economic and psychological causes. It is of great significance from both academic and practical perspectives to conduct a spatial analysis of cyber fraud on a macro scale and explore the underlying causes of this crime. This study used data from the China Judgements Online database to delineate the spatiotemporal pattern and cross-regional flow of cyber fraud, and applied GAM to examine the associations between cyber fraud and environmental factors. The results and findings from this study could provide valuable insights for understanding the formation and development of cyber fraud and provide useful references for preventing and fighting this type of crime.
However, this study has limitations due to the inherent characteristics of legal judgement document data. For instance, the released documents cover only concluded cases and exclude a substantial number of unreported, unfiled, or unreleased cases; hence, the data are biased and may not fully represent the overall sample. In addition, the most recent data on cyber fraud is unavailable due to the time lag of judgement documents. With more data becoming available, future work should focus on examining the effects of COVID-19 on cyber fraud and predicting the potential high-risk areas of cyber fraud victimization.

Supplementary Materials

The following are available online at https://www.mdpi.com/article/10.3390/ijgi10120802/s1, Figure S1: Spatiotemporal distributions of cyber fraud cases in China for (a) 2014, (b) 2015, (c) 2016, (d) 2017, and (f) 2018, Figure S2: Spatial clusters of cyber fraud cases in China for (a) 2014, (b) 2015, (c) 2016, (d) 2017, and (f) 2018., Table S1: Spatial flow of cyber fraud offenders in China.

Author Contributions

Conceptualization, Chundong Gao, Dong Jiang and Mengmeng Hao; methodology, Fangyu Ding and Shuai Chen; software, Tian Ma; validation, Shuai Chen; formal analysis, Shuai Chen, Tian Ma; data curation, Shize Zhang and Shunde Li; writing—original draft preparation, Shuai Chen; writing—review and editing, Dong Jiang, Shuai Chen and Mengmeng Hao; visualization, Shuai Chen; supervision, Dong Jiang; project administration, Chundong Gao; funding acquisition, Dong Jiang All authors have read and agreed to the published version of the manuscript.

Funding

This research was funded by the National Key Research and Development Project, grant number 2020YFB1806500 and the Key Research Program of the Chinese Academy of Sciences, grant number ZDRW-XH-2021-3.

Data Availability Statement

The data that support the findings of this study are available in the China Judgements Online database (https://wenshu.court.gov.cn, accessed on 25 July 2021) and the China City Statistical Yearbooks (http://www.stats.gov.cn/tjsj/ndsj, accessed on 25 July 2021).

Acknowledgments

We thank Qinghua Tan, Yushu Qian, and Jiping Dong for providing valuable suggestions.

Conflicts of Interest

The authors declare no conflict of interest.

References

  1. Gao, C.; Guo, Q.; Jiang, D.; Wang, Z.; Fang, C.; Hao, M. Theoretical basis and technical methods of cyberspace geography. J. Geogr. Sci. 2019, 29, 1949–1964. [Google Scholar] [CrossRef] [Green Version]
  2. McAfee. The Hidden Costs of Cybercrime. 2020. Available online: https://www.mcafee.com/enterprise/en-us/assets/reports/rp-hidden-costs-of-cybercrime.pdf (accessed on 25 July 2021).
  3. Warf, B. The SAGE Encyclopedia of the Internet; Sage: Thousand Oaks, CA, USA, 2018. [Google Scholar]
  4. Buil-Gil, D.; Miró-Llinares, F.; Moneva, A.; Kemp, S.; Díaz-Castaño, N. Cybercrime and shifts in opportunities during COVID-19: A preliminary analysis in the UK. Eur. Soc. 2021, 23, S47–S59. [Google Scholar] [CrossRef]
  5. Naidoo, R. A multi-level influence model of COVID-19 themed cybercrime. Eur. J. Inf. Syst. 2020, 29, 306–321. [Google Scholar] [CrossRef]
  6. CNNIC. The 47th China Statistical Report on Internet Development. 2021. Available online: http://www.cnnic.net.cn/hlwfzyj/hlwxzbg/hlwtjbg/202102/t20210203_71361.htm (accessed on 25 July 2021).
  7. China tMoPSotPsRo. China’s Public Security Authorities Cracked 256,000 Cases of Telecom and Internet Fraud. 2021. Available online: https://www.mps.gov.cn/n7944517/n7944597/n7945893/n7956607/c7633791/content.html (accessed on 7 November 2021).
  8. Cohen, L.E.; Felson, M. Social change and crime rate trends: A routine activity approach. Am. Sociol. Rev. 1979, 44, 588–608. [Google Scholar] [CrossRef]
  9. Messner, S.F.; Tardiff, K. The social ecology of urban homicide: An application of the “routine activities” approach. Criminology 1985, 23, 241–267. [Google Scholar] [CrossRef]
  10. Mannon, J.M. Domestic and intimate violence: An application of routine activities theory. Aggress. Violent Behav. 1997, 2, 9–24. [Google Scholar] [CrossRef]
  11. Smith, W.R.; Frazee, S.G.; Davison, E.L. Furthering the integration of routine activity and social disorganization theories: Small units of analysis and the study of street robbery as a diffusion process. Criminology 2000, 38, 489–524. [Google Scholar] [CrossRef]
  12. Stalans, L.J.; Donner, C.M. Explaining why cybercrime occurs: Criminological and psychological theories. In Cyber Criminology; Springer: Berlin/Heidelberg, Germany, 2018; pp. 25–45. [Google Scholar]
  13. Mandelcorn, S.M. An Explanatory Model of Motivation for Cyber-Attacks Drawn from Criminological Theories; University of Maryland: College Park, MD, USA, 2013. [Google Scholar]
  14. Higgins, G.E. Value and choice: Examining their roles in digital piracy. In Cyber Criminology; Routledge: Boca Raton, FL, USA, 2011; pp. 177–190. [Google Scholar]
  15. Reyns, B.W.; Henson, B.; Fisher, B.S. Being pursued online: Applying cyberlifestyle–routine activities theory to cyberstalking victimization. Crim. Justice Behav. 2011, 38, 1149–1169. [Google Scholar] [CrossRef]
  16. Grabosky, P.N. Virtual criminality: Old wine in new bottles? Soc. Leg. Stud. 2001, 10, 243–249. [Google Scholar] [CrossRef]
  17. Reyns, B.W. Routine activity theory and cybercrime: A theoretical appraisal and literature review. Technocrime Criminol. Theory 2017, 35–54. [Google Scholar] [CrossRef] [Green Version]
  18. Yar, M. The Novelty of ‘Cybercrime’ An Assessment in Light of Routine Activity Theory. Eur. J. Criminol. 2005, 2, 407–427. [Google Scholar] [CrossRef]
  19. Reyns, B.W.; Henson, B.; Fisher, B.S. Guardians of the cyber galaxy: An empirical and theoretical analysis of the guardianship concept from routine activity theory as it applies to online forms of victimization. J. Contemp. Crim. Justice 2016, 32, 148–168. [Google Scholar] [CrossRef]
  20. Ngo, F.T.; Paternoster, R. Cybercrime victimization: An examination of individual and situational level factors. Int. J. Cyber Criminol. 2011, 5, 773. [Google Scholar]
  21. Navarro, J.N.; Jasinski, J.L. Going cyber: Using routine activities theory to predict cyberbullying experiences. Sociol. Spectr. 2012, 32, 81–94. [Google Scholar] [CrossRef]
  22. Leukfeldt, E.R.; Yar, M. Applying routine activity theory to cybercrime: A theoretical and empirical analysis. Deviant Behav. 2016, 37, 263–280. [Google Scholar] [CrossRef] [Green Version]
  23. Leukfeldt, E.R. Phishing for suitable targets in the Netherlands: Routine activity theory and phishing victimization. Cyberpsychol. Behav. Soc. Netw. 2014, 17, 551–555. [Google Scholar] [CrossRef]
  24. Hutchings, A.; Hayes, H. Routine activity theory and phishing victimisation: Who gets caught in the ‘net’? Curr. Issues Crim. Justice 2009, 20, 433–452. [Google Scholar] [CrossRef] [Green Version]
  25. Holt, T.J.; Bossler, A.M. Examining the applicability of lifestyle-routine activities theory for cybercrime victimization. Deviant Behav. 2008, 30, 1–25. [Google Scholar] [CrossRef]
  26. Reyns, B.W. Online routines and identity theft victimization: Further expanding routine activity theory beyond direct-contact offenses. J. Res. Crime Delinq. 2013, 50, 216–238. [Google Scholar] [CrossRef]
  27. Pratt, T.C.; Holtfreter, K.; Reisig, M.D. Routine online activity and internet fraud targeting: Extending the generality of routine activity theory. J. Res. Crime Delinq. 2010, 47, 267–296. [Google Scholar] [CrossRef]
  28. Park, J.; Cho, D.; Lee, J.K.; Lee, B. The economics of cybercrime: The role of broadband and socioeconomic status. ACM Trans. Manag. Inf. Syst. (TMIS) 2019, 10, 1–23. [Google Scholar] [CrossRef]
  29. Kigerl, A. Routine activity theory and the determinants of high cybercrime countries. Soc. Sci. Comput. Rev. 2012, 30, 470–486. [Google Scholar] [CrossRef]
  30. Song, H.; Lynch, M.J.; Cochran, J.K. A macro-social exploratory analysis of the rate of interstate cyber-victimization. Am. J. Crim. Justice 2016, 41, 583–601. [Google Scholar] [CrossRef]
  31. Akdemir, N.; Yenal, S. Card-not-present fraud victimization: A routine activities approach to understand the risk factors. Güvenlik Bilimleri Derg. 2020, 9, 243–268. [Google Scholar] [CrossRef]
  32. Mesch, G.S.; Dodel, M. Low self-control, information disclosure, and the risk of online fraud. Am. Behav. Sci. 2018, 62, 1356–1371. [Google Scholar] [CrossRef]
  33. Bolimos, I.A.; Choo, K.-K.R. Online fraud offending within an Australian jurisdiction. J. Financ. Crime 2017, 24, 277–308. [Google Scholar] [CrossRef]
  34. Kerr, J.; Owen, R.; Nicholls, C.M.; Button, M. Research on Sentencing Online Fraud Offences; Sentencing Council: London, UK, 2013. [Google Scholar]
  35. Bivand, R.; Müller, W.G.; Reder, M. Power calculations for global and local Moran’s I. Comput. Stat. Data Anal. 2009, 53, 2859–2872. [Google Scholar] [CrossRef]
  36. Cliff, A.D.; Ord, J.K. Spatial Processes: Models & Applications; Taylor & Francis: Oxfordshire, UK, 1981. [Google Scholar]
  37. Anselin, L. Local indicators of spatial association—LISA. Geogr. Anal. 1995, 27, 93–115. [Google Scholar] [CrossRef]
  38. Hastie, T.; Tibshirani, R. Generalized Additive Models; Chapman and Hall: London, UK, 1990. [Google Scholar]
  39. Leathwick, J.; Elith, J.; Hastie, T. Comparative performance of generalized additive models and multivariate adaptive regression splines for statistical modelling of species distributions. Ecol. Model. 2006, 199, 188–196. [Google Scholar] [CrossRef]
  40. Zuur, A.F.; Ieno, E.N.; Walker, N.J.; Saveliev, A.A.; Smith, G.M. Mixed Effects Models and Extensions in Ecology with R; Springer: Berlin/Heidelberg, Germany, 2009; Volume 574. [Google Scholar]
  41. Sagarese, S.R.; Frisk, M.G.; Cerrato, R.M.; Sosebee, K.A.; Musick, J.A.; Rago, P.J. Application of generalized additive models to examine ontogenetic and seasonal distributions of spiny dogfish (Squalus acanthias) in the Northeast (US) shelf large marine ecosystem. Can. J. Fish. Aquat. Sci. 2014, 71, 847–877. [Google Scholar] [CrossRef]
  42. Wood, S.; Wood, M.S. Package ‘mgcv’. R Package Version 2015, 1, 29. [Google Scholar]
  43. R Core Team. R: A Language and Environment for Statistical Computing; R Core Team: Vienna, Austria, 2013. [Google Scholar]
  44. Chen, M.; Gong, Y.; Li, Y.; Lu, D.; Zhang, H. Population distribution and urbanization on both sides of the Hu Huanyong Line: Answering the Premier’s question. J. Geogr. Sci. 2016, 26, 1593–1610. [Google Scholar] [CrossRef]
  45. News, X. China Punishes 146,000 People for Telecom Fraud in Three Years. 2018. Available online: http://english.www.gov.cn/state_council/ministries/2018/11/29/content_281476411837636.htm (accessed on 8 November 2021).
  46. News, X. China Intensifies Crack Down on Telecom, Internet Fraud. 2017. Available online: http://english.www.gov.cn/state_council/ministries/2017/05/17/content_281475658092520.htm (accessed on 7 November 2021).
  47. CAICT. Telecom Network Fraud Governance Research Report under the New Situation. 2020. Available online: http://www.caict.ac.cn/kxyj/qwfb/ztbg/202012/t20201218_366375.htm (accessed on 25 July 2021).
Figure 1. Spatial clusters of cyber fraud cases in China for (a) 2014 and (b) 2018. See Figure S2 (Supplementary Materials) for other years.
Ijgi 10 00802 g001
Figure 2. Spatial flow of cyber fraud offenders in China.
Ijgi 10 00802 g002
Figure 3. (af) Relationships between cyber fraud cases and environmental factors. The x-axis represents the distribution of data points for each variable. The y-axis represents the partial effect of each variable. The grey shaded areas indicate the 95% confidence intervals.
Ijgi 10 00802 g003
Table 1. Global Moran’s I of cyber fraud distribution in China from 2014 to 2018.
YearMoran’s IExpected IndexVariancez-Scorep-Value
20140.065−0.00270.0000529.3520.000
20150.078−0.00270.00005510.8750.000
20160.136−0.00270.00005818.2180.000
20170.145−0.00270.00005719.4640.000
20180.121−0.00270.00005816.2150.000
Table 2. Results of the final GAM model. Family: poisson; link function: log; formula: case_counts ~ s(pop_nonagricultural) + s(unemployment) + s(GDP_tertiary) + s(pop_higher_education) + s(pop_internet) + s(length_cable); edf, estimated degrees of freedom; case_counts, cyber fraud crime counts; non-agricultural, nonagricultural population; unemployment, unemployed population; GDP_tertiary, the proportion of tertiary industry in GDP; pop_higher_education, number of students in general colleges; pop_internet, number of internet users; length_cable, cable length.
Parametric Coefficients:
EstimateStandard Errorz ValuePr(>|z|)
(Intercept)−14.413.053−4.7212.35 × 106 ***
Approximate Significance of Smooth Terms:
edfChi.sqp-Value
s(pop_nonagricultural)7.56051.58<2 × 10¹⁶ ***
s(unemployment)7.78239.201.85 × 105 ***
s(GDP_tertiary)6.82744.73<2 × 10¹⁶ ***
s(pop_higher_education)5.80539.69<2 × 10¹⁶ ***
s(pop_internet)8.67950.18<2 × 10¹⁶ ***
s(length_cable)4.87616.830.00625 **
*** 0 ≤ p ≤ 0.001, ** 0.001 < p ≤ 0.01.
Publisher’s Note: MDPI stays neutral with regard to jurisdictional claims in published maps and institutional affiliations.

