1. Introduction
Energy poverty remains one of the main challenges of sustainable development in low-income countries. The United Nations (UN) has recognized its importance through Sustainable Development Goal 7. The International Energy Agency estimates that approximately 770 million people have no access to electricity globally [
1]. Lack of access to reliable electricity leads to inadequate operation of critical services, such as healthcare facilities (HCF) in low resource settings. Healthcare is one of the main infrastructures that heavily depends on reliable electricity access for providing health services. A survey in more than 70 low- and middle-income countries suggests that nearly 60% of HCFs have no access or limited access to electricity [
2].
It is conventional wisdom that access to electricity is an enabling factor for development purposes and even insufficient access, although undesirable, still contributes to improved livelihoods. A tier-based framework developed by the World Bank sheds light on the capacity and potentials associated with limited electricity access for development [
3]. However, unreliable access to electricity in the case of health centers is unlikely to lead to improved public health. Many health services and equipment are dependent on electricity to operate. For example, unreliable electricity access may interrupt the operation of equipment, such as nebulizers and ventilators, with life threatening consequences. Similarly, interruptions in the operation of vaccine fridges and freezers could be detrimental to immunization plans in a region threatened with the risk of outbreaks. Therefore, decision makers and public health policy experts should consider reliable access to electricity a priority in the allocation of resources that aims to improve public health.
A study in rural Malawi identified that poor electricity access contributed to adverse health practices such as irregular sterilization of equipment, lack of access to clean water, and inadequate lighting for procedures [
4]. Another study in rural Nigeria identifies lack of access to electricity a “neglected barrier to effective intervention” for improved health services particularly aimed at reducing maternal and neonatal mortalities [
5]. Unreliable electricity access in HCF not only exacerbates the quality of health services in a regional scale, but it is also a potential public health threat on national and global scales as well. The COVID-19 pandemic revealed that inefficient access to electricity in HCF is a factor contributing to the spread of the disease and poses further complications to prevent it [
6].
One of the frequently used energy sources in HCF located in low resource communities is the diesel generator. Lower upfront cost and widespread availability have led to their use as the primary electricity generation in HCF. The costs of fuel, its dependence on global fossil fuel markets, challenges in consistent supply—particularly in conflict zones—and climate change concerns are the main challenges that lead to the undesirability of diesel generators as a sustainable and reliable main source of electricity for HCF [
7]. These logistical difficulties are among the main limitations to using diesel generators, particularly in remote and low-resource settings [
8].
While reliable grid electricity is the ideal source for the operation of healthcare facilities, with the lack of a grid’s presence or the unreliability of its power, distributed renewable energy (DRE) is a promising alternative. DRE—such as stand-alone solar photovoltaic (PV) systems or wind turbines—if designed properly, could provide reliable and sustainable electricity to HCF [
9]. In addition, such systems could contribute as a source of income for HCF, increasing their role in community development. The effective replacement of diesel generators with DRE for HCF in low resource communities demands thorough planning, policy support and resource allocation to ensure that these systems are reliable and sustainable.
While existing tools capture the national and regional scale planning for DRE deployment in HCF, there is no data-driven and systematic approach for granular, portfolio level decision support and resource allocation. Therefore, the objective of this study is to develop a cost-effective, portfolio level energy access planning tool that captures the context specific attributes and the unique situation of each facility for decision makers. The proposed approach in this study accomplishes this objective in three phases. In the first phase, we use a novel social study to collect data at each HCF from its non-technical staff through a cloud-based, off-line method. Using the portfolio level data, in the second phase we estimate the size and cost of DRE systems under two scenarios: one for electrifying currently existing equipment and one for supplying enough electricity if the HCF receives all of the equipment it needs for providing health services. Using the contextual and HCF level data, as well as estimated costs under each scenario, in the third phase, we rank HCF from the highest priority to receive DRE to the lowest priority. For this ranking, we apply the Technique for Order of Preference by Similarity to Ideal Solution (TOPSIS) Method—a multi-criteria decision-making tool—that evaluates each HCF against a set of decision criteria defined by decision makers. As a result, decision makers could identify the best allocation of limited resources that leads to the highest public health impact. In addition, the portfolio level data enables policy makers to identify and evaluate the effectiveness of healthcare services across their operations.
In
Section 2 of this paper, we discuss the existing state-of-the-art approaches for planning electricity access in healthcare facilities in low-resource settings. In
Section 3, we present the methodology of this study to address the gap in data driven and portfolio level analysis.
Section 4 presents the results of a case study in Uganda based on the developed multi-platform analysis. In
Section 5, we further discuss the key findings and how utilizing the presented approach could improve the quality of public health services in unserved and underserved communities.
2. Background
While investment in renewable energy is forecasted to increase significantly [
10], there remains a disconnect between the energy access sector and the health care service providers, such as governments, international NGOs, and Faith Based Organizations. Multiple approaches have been developed to provide policy level analysis for electricity access in the health sector. The World Resources Institute has developed an interactive tool that informs national and international scale policy makers with critical information needed for laying out a macro scale policy for electrification, named Energy Access Explorer. This tool integrates publicly available data in an interactive map-based platform for analyzing the electricity demand of different customers along with supply conditions and expansion plans. As a result, a holistic approach could be formed for the electrification of any kind of customer such as HCF [
11]. Another tool developed in a partnership of five universities is the Electricity Growth and Use in Developing Economies (e-GUIDE), which focuses on macro scale consumption and infrastructure. e-GUIDE integrates satellite imagery and longitudinal consumption data to predict the demand on a national scale [
12].
While solar PV systems along with other renewable sources of energy, such as wind, have the potential to provide reliable and sustainable energy access to HCF, proper system design and installation, demand estimation, load management, and effective operation and maintenance (O&M) are significantly important to ensure the longevity of electricity supply and sustainability of services. Otherwise, it is likely that renewable energy systems fail in a short time or provide inadequate electricity for the intended applications. A study by the World Bank in 2010 found that, without proper investment in O&M, most solar PV systems are likely to fail after three to five years from installation [
13]. Sustainable Energy for All (SEforAll) has developed a framework to enable decision makers to adopt a sustainability approach to electricity access initiatives particularly in the domain of off-grid electrification. The Model Sustainability Framework consists of three pillars of organizational, technical, and economic. Each pillar has four progressive phases that integrate sustainability concepts. These four phases start with the inception of ideas and goals, continues to design the systems and implement the projects, and finally lead to laying out effective O&M strategies [
14].
While the aforementioned methods provide macro scale data that inform regional, national and international electrification plans, there is a gap for systematic and data-driven portfolio level models that reflect the realities of each individual HCF systematically. A systematic approach that integrates the contextual attributes and realities on the ground at each HCF enables decision makers to allocate resources based on the potential for sustainable and reliable access to electricity, with appropriate O&M protocols, that leads to improved public health across the portfolio. The key number one insight under technical sustainability in the framework presented by SE4All recognizes this approach by emphasizing the understanding of the needs of each HCF for designing the electricity access systems [
13]. To address this gap, this article presents a tool for an HCF level solution that utilizes state-of-the-art approaches for robust data collection in data scarce settings, defines a coherent set of decision criteria and provides a priority list of HCF eligible for investments in robust stand-alone solar PV systems. The tool presented here estimates solar PV system size and storage requirements that ensure the reliability and longevity of electricity access. The integration of the effective storage unit is particularly important for enabling a renewable based generation system such as Solar PV panels to be a viable option for reliable electricity access for 24 h instead of only during the generation hours.
The next section presents the methodology used in this study followed by the results from a case study from 2020 in Uganda. After that, we discuss the power of the presented approach for regional policy and financial analysis, as well as the implications for public health planning at a site-level.
3. Methodology
3.1. Objective
The main objective of this study is to develop a resource allocation plan for investment in reliable and sustainable access to electricity across a portfolio of HCFs that reflects the realities of each facility and aims to improve public health by improved application of electricity dependent healthcare services. While resources are scarce for the electrification of HCF in low resource communities, the lack of a systematic approach in the allocation of resources and the proper design and utilization of context-appropriate technologies often leads to improper system performances. Such improper and unreliable performances of electricity generation systems in the HCF context are detrimental to the livelihoods of patients and the delivery of appropriate healthcare services.
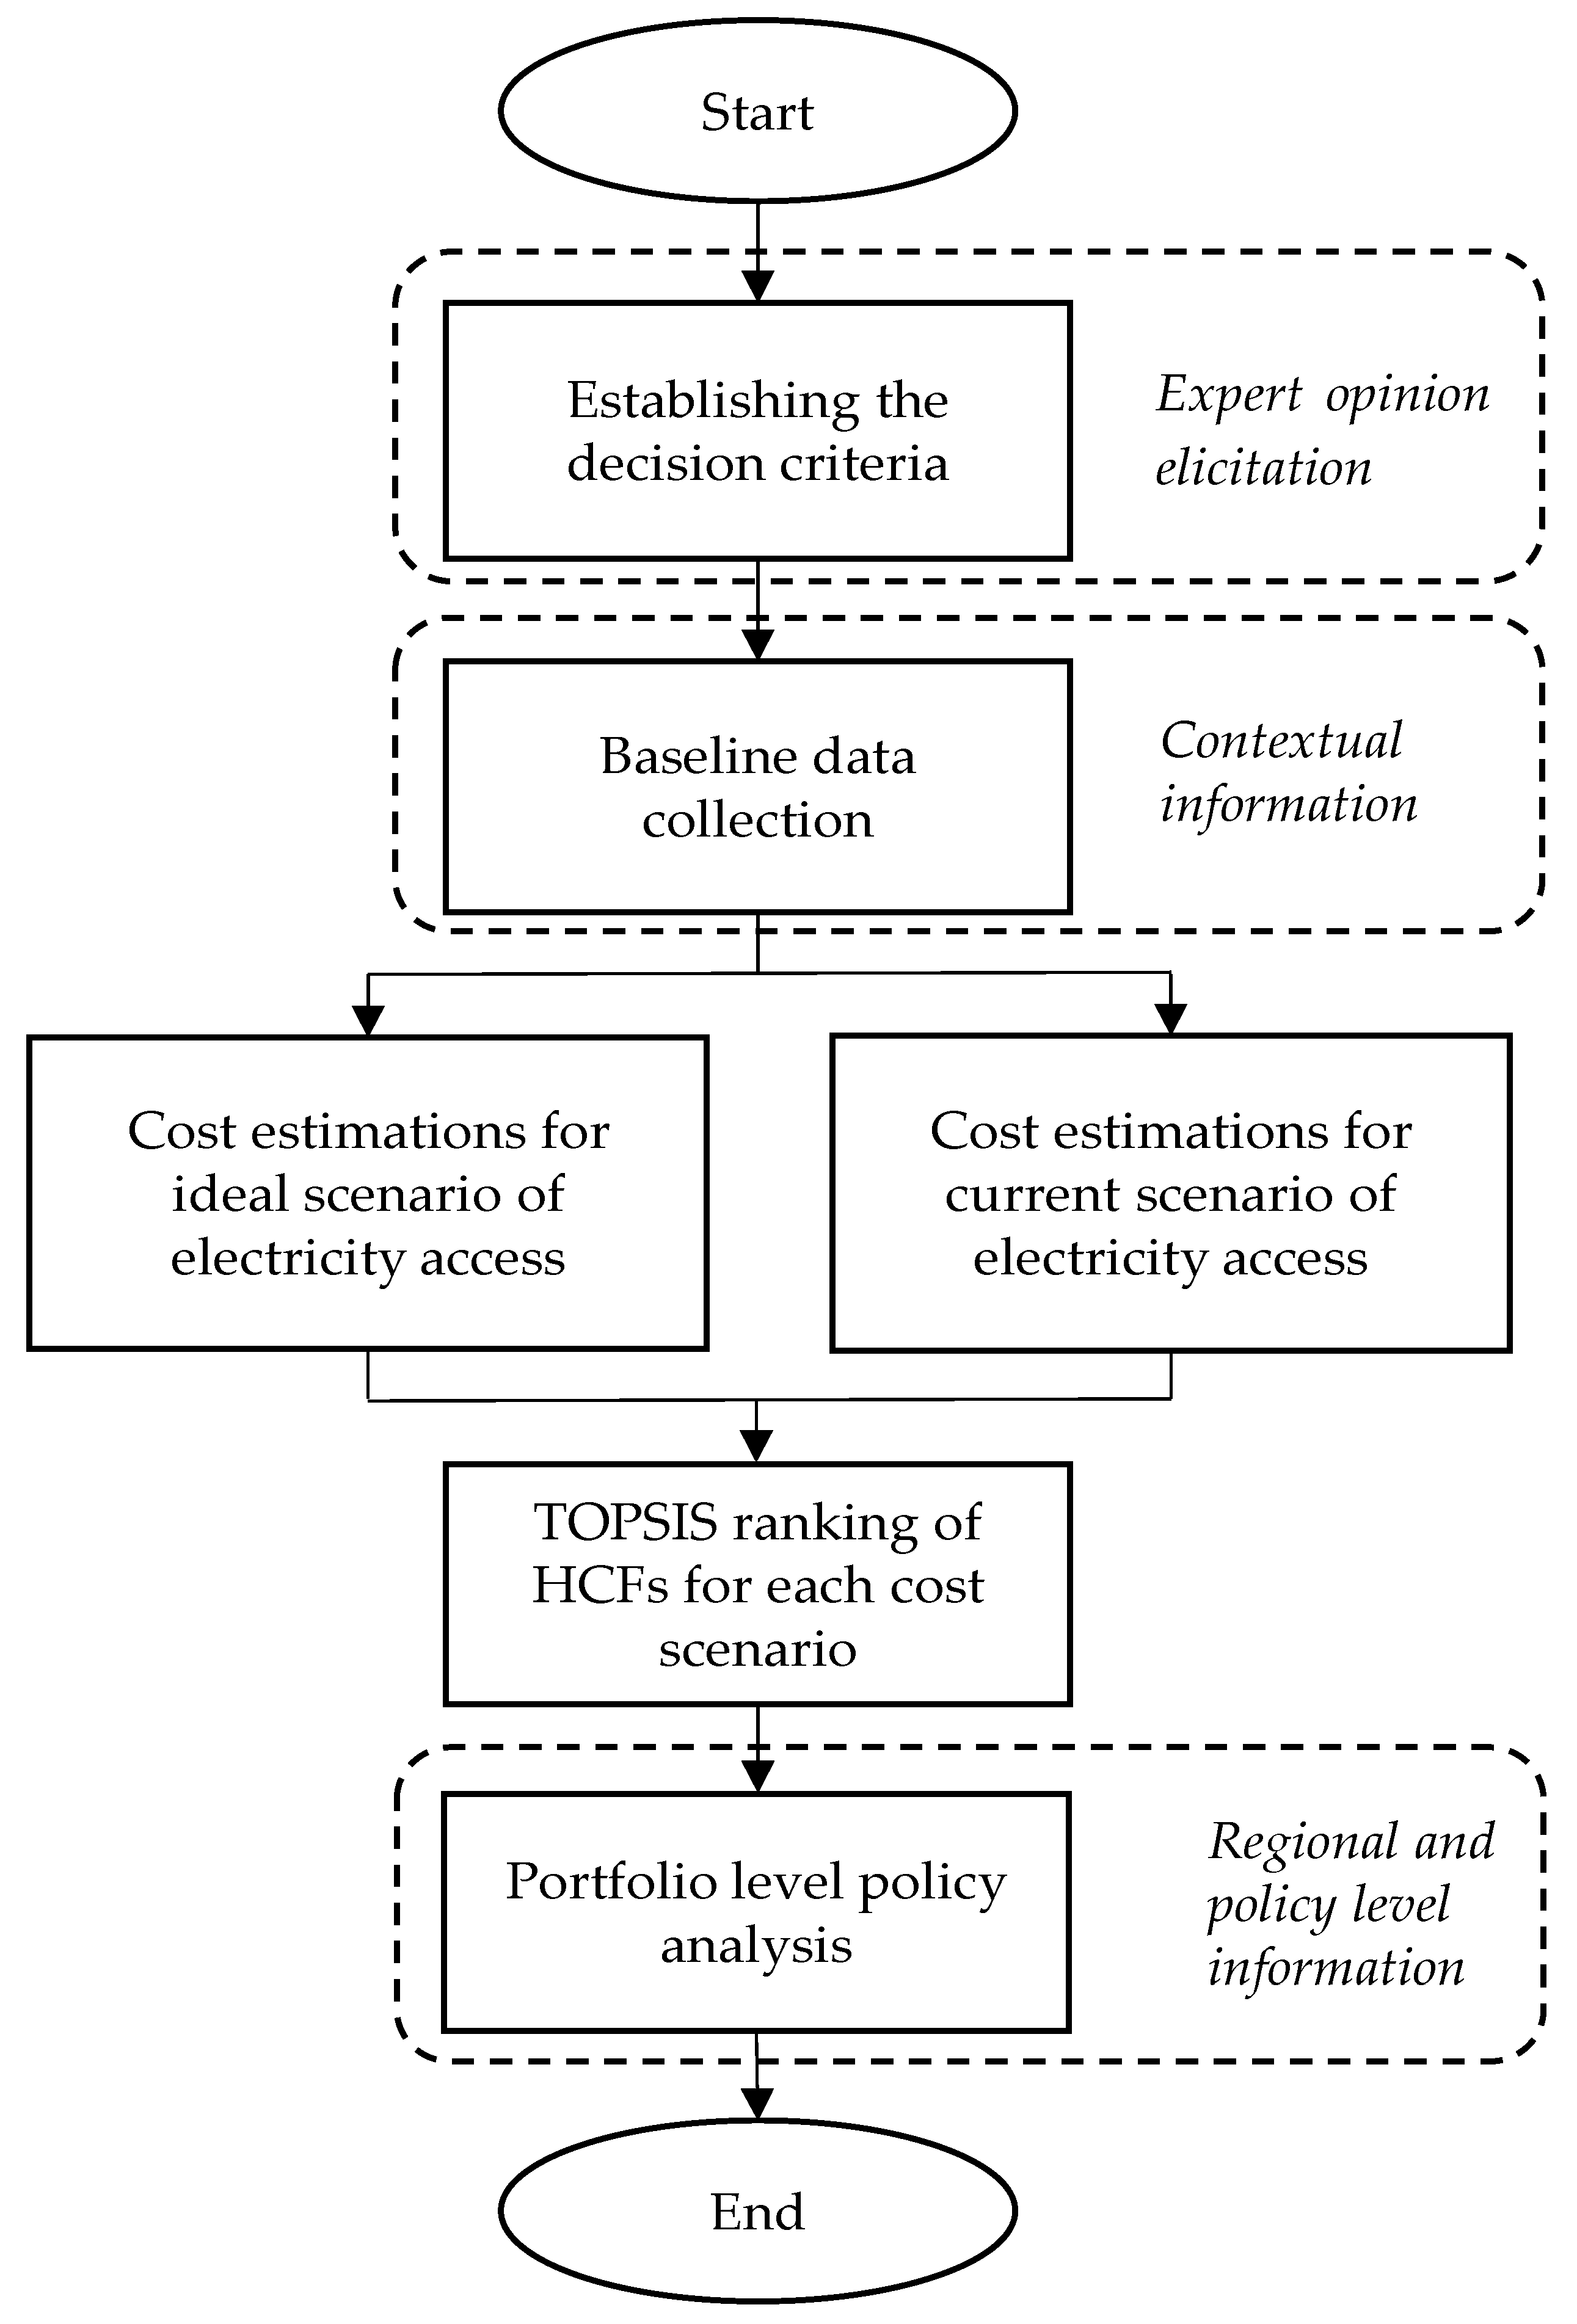
The methodology illustrated in the flowchart in
Figure 1 describes the systematic approach developed to deliver the objective of the study. The method conceptualized in
Figure 1 systematically integrates the knowledge from experts in public health and portfolio level HCF operational managers with the contextual information and field data that uniquely describe the situation at each HCF. Then, this information informs the mathematical model of the study to prioritize HCFs based on the decision criteria of the experts and managers as well as the realities on the ground at each HCF. The outcome is integrated with policy level knowledge and enables informed policy making for regional and national public health and electricity access.
In order to compare HCFs against each other to identify how the realities of each facility lead to its unique situation compared with other facilities in the portfolio, we have established a set of criteria referred to as decision factors. Collecting data at each HCF based on such criteria defines a multi-criteria decision-making problem. The Decision Response Energy Assessment Management (DREAM) tool presents portfolio-level energy information for distributed facilities. At the nexus of social study design for data scarce settings, renewable energy engineering, multi-criteria decision-making, and investment analysis, the DREAM tool develops a priority list of HCFs based on the unique characteristics of each facility.
For this purpose, the tool utilizes TOPSIS. We have discussed the TOPSIS model in
Section 3.1. The data that inform the TOPSIS model include the weighted decision factors in the ranking analysis and the HCF level data with respect to each decision factor.
Section 3.2 and
Section 3.3 describe the data collection approach used for each type of data required for formulating the TOPSIS model for portfolio-level HCF electricity access planning.
3.2. TOPSIS
The DREAM tool applies the TOPSIS analysis to rank each HCF based on the decision factors. This technique was first developed by Hwang and Yoon in 1981 and since then has been applied to a wide variety of multi criteria decision-making problems [
15,
16]. Despite numerous applications, this study is the first practice in utilizing such techniques along with portfolio level data to provide a decision support system for electrification in low-resource settings.
TOPSIS ranks alternatives—in our case health care facilities—based on a set of decision factors using a mathematical formula that calculates the position of each HCF on a line that is limited between two theoretical values referred to as the positive ideal solution and negative worst solution. The distance of each HCF from these two solutions forms the basis of ranking alternatives from the highest priority to the lowest priority. Therefore, a problem that involves multiple dimensions—equal to the number of decision factors—is transformed to a one-dimensional problem.
The decision matrix D illustrated in Equation (1) formulates the TOPSIS model used in the DREAM tool analysis. In this matrix, rows include HCF, , and columns represent decision factors (). Therefore, is the score of each clinic from the collected data for each decision factor.
There are two types of decision factors. The benefit decision factors are those where higher scores contribute to an increase in the overall priority of an alternative. For example, for two identical facilities, the HCF that has a higher number of patient visits per month has higher priority than the facility with a lower number of patient visits per month. Therefore, the decision criteria of number of patient visits per month is a benefit factor in the analysis. The second group of factors is cost factors. A higher score in cost decision factors leads to an overall decrease in the priority of an alternative. The energy retrofit costs for each HCF are a cost factor. This means that, for two identical facilities, the one with less capital cost required for reliable electricity access has the higher priority.
Once the decision matrix is developed, the normalization of the scores enables the cross comparison of each attribute with other attributes. The data structure and type of variables defines the best method of normalization [
17]. For this analysis, we used vector normalization as:
The normalized scores multiplied by the weight of each decision factor forms matrix V as described in Equation (4). In this study, we used a ranking survey from eight experts to rank 11 decision factors from the most important to the least important.
Section 4.2 presents the results of this survey as well as the weights calculated for each decision factor.
Based on the difference between the benefit factors (subset
from
) and cost factors (subset
from
), we define the positive ideal solution (PIS) and Negative worst solution (NWS). These values serve as the two ends of the range that includes each alternative’s score in between.
In the next step, we calculate the separation of each alternative from PIS or NWS using Equation (7) or Equation (8), respectively.
Finally, Equation (9) calculates the relative closeness of each alternative to PIS (or NWS) that serves as the basis for ranking HCF based on the decision factors. Sorting HCF from the highest to the lowest
value determines the ranking of each facility.
3.3. Data
3.3.1. HCF Level Data
Two separate data collections inform the TOPSIS model in the DREAM tool. HCF level data populate the matrix D in Equation (1) with
scores. Data collection at the healthcare facility level in a low-resource context is logistically challenging hence a limiting factor in statistical inference and model accuracy and performance due to small sample sizes and a lack of representative samples with respect to possible variations in the population. Most of the energy access models, including the state-of-the-art planning tools as well as ad hoc studies either integrate satellite imagery with governmental or macroscale data from governments, and/or multilateral organizations (e.g., [
11,
12]), or use categorical evaluations (e.g., [
4,
18]). The methodology developed in the DREAM tool enables researchers to collect HCF level data that capture the realities of each HCF in a relatively large sample size through the application of cloud-based data collection. As a result, the costs of data collection are reduced while the sample size could be expanded to increase the fidelity of analysis. In addition, results and the data collected in the developed method of this study could further improve the macro scale policy analysis and national planning models such as Energy Access Explorer through the systematic integration of HCF level and contextual data.
The novel approach used in this study utilizes cloud-based data collection platforms to conduct a survey at each HCF by its own staff. In this study, we collected data from 56 HCFs across Uganda. Information related to the attributes that we collected data for are presented in
Table A2 in the
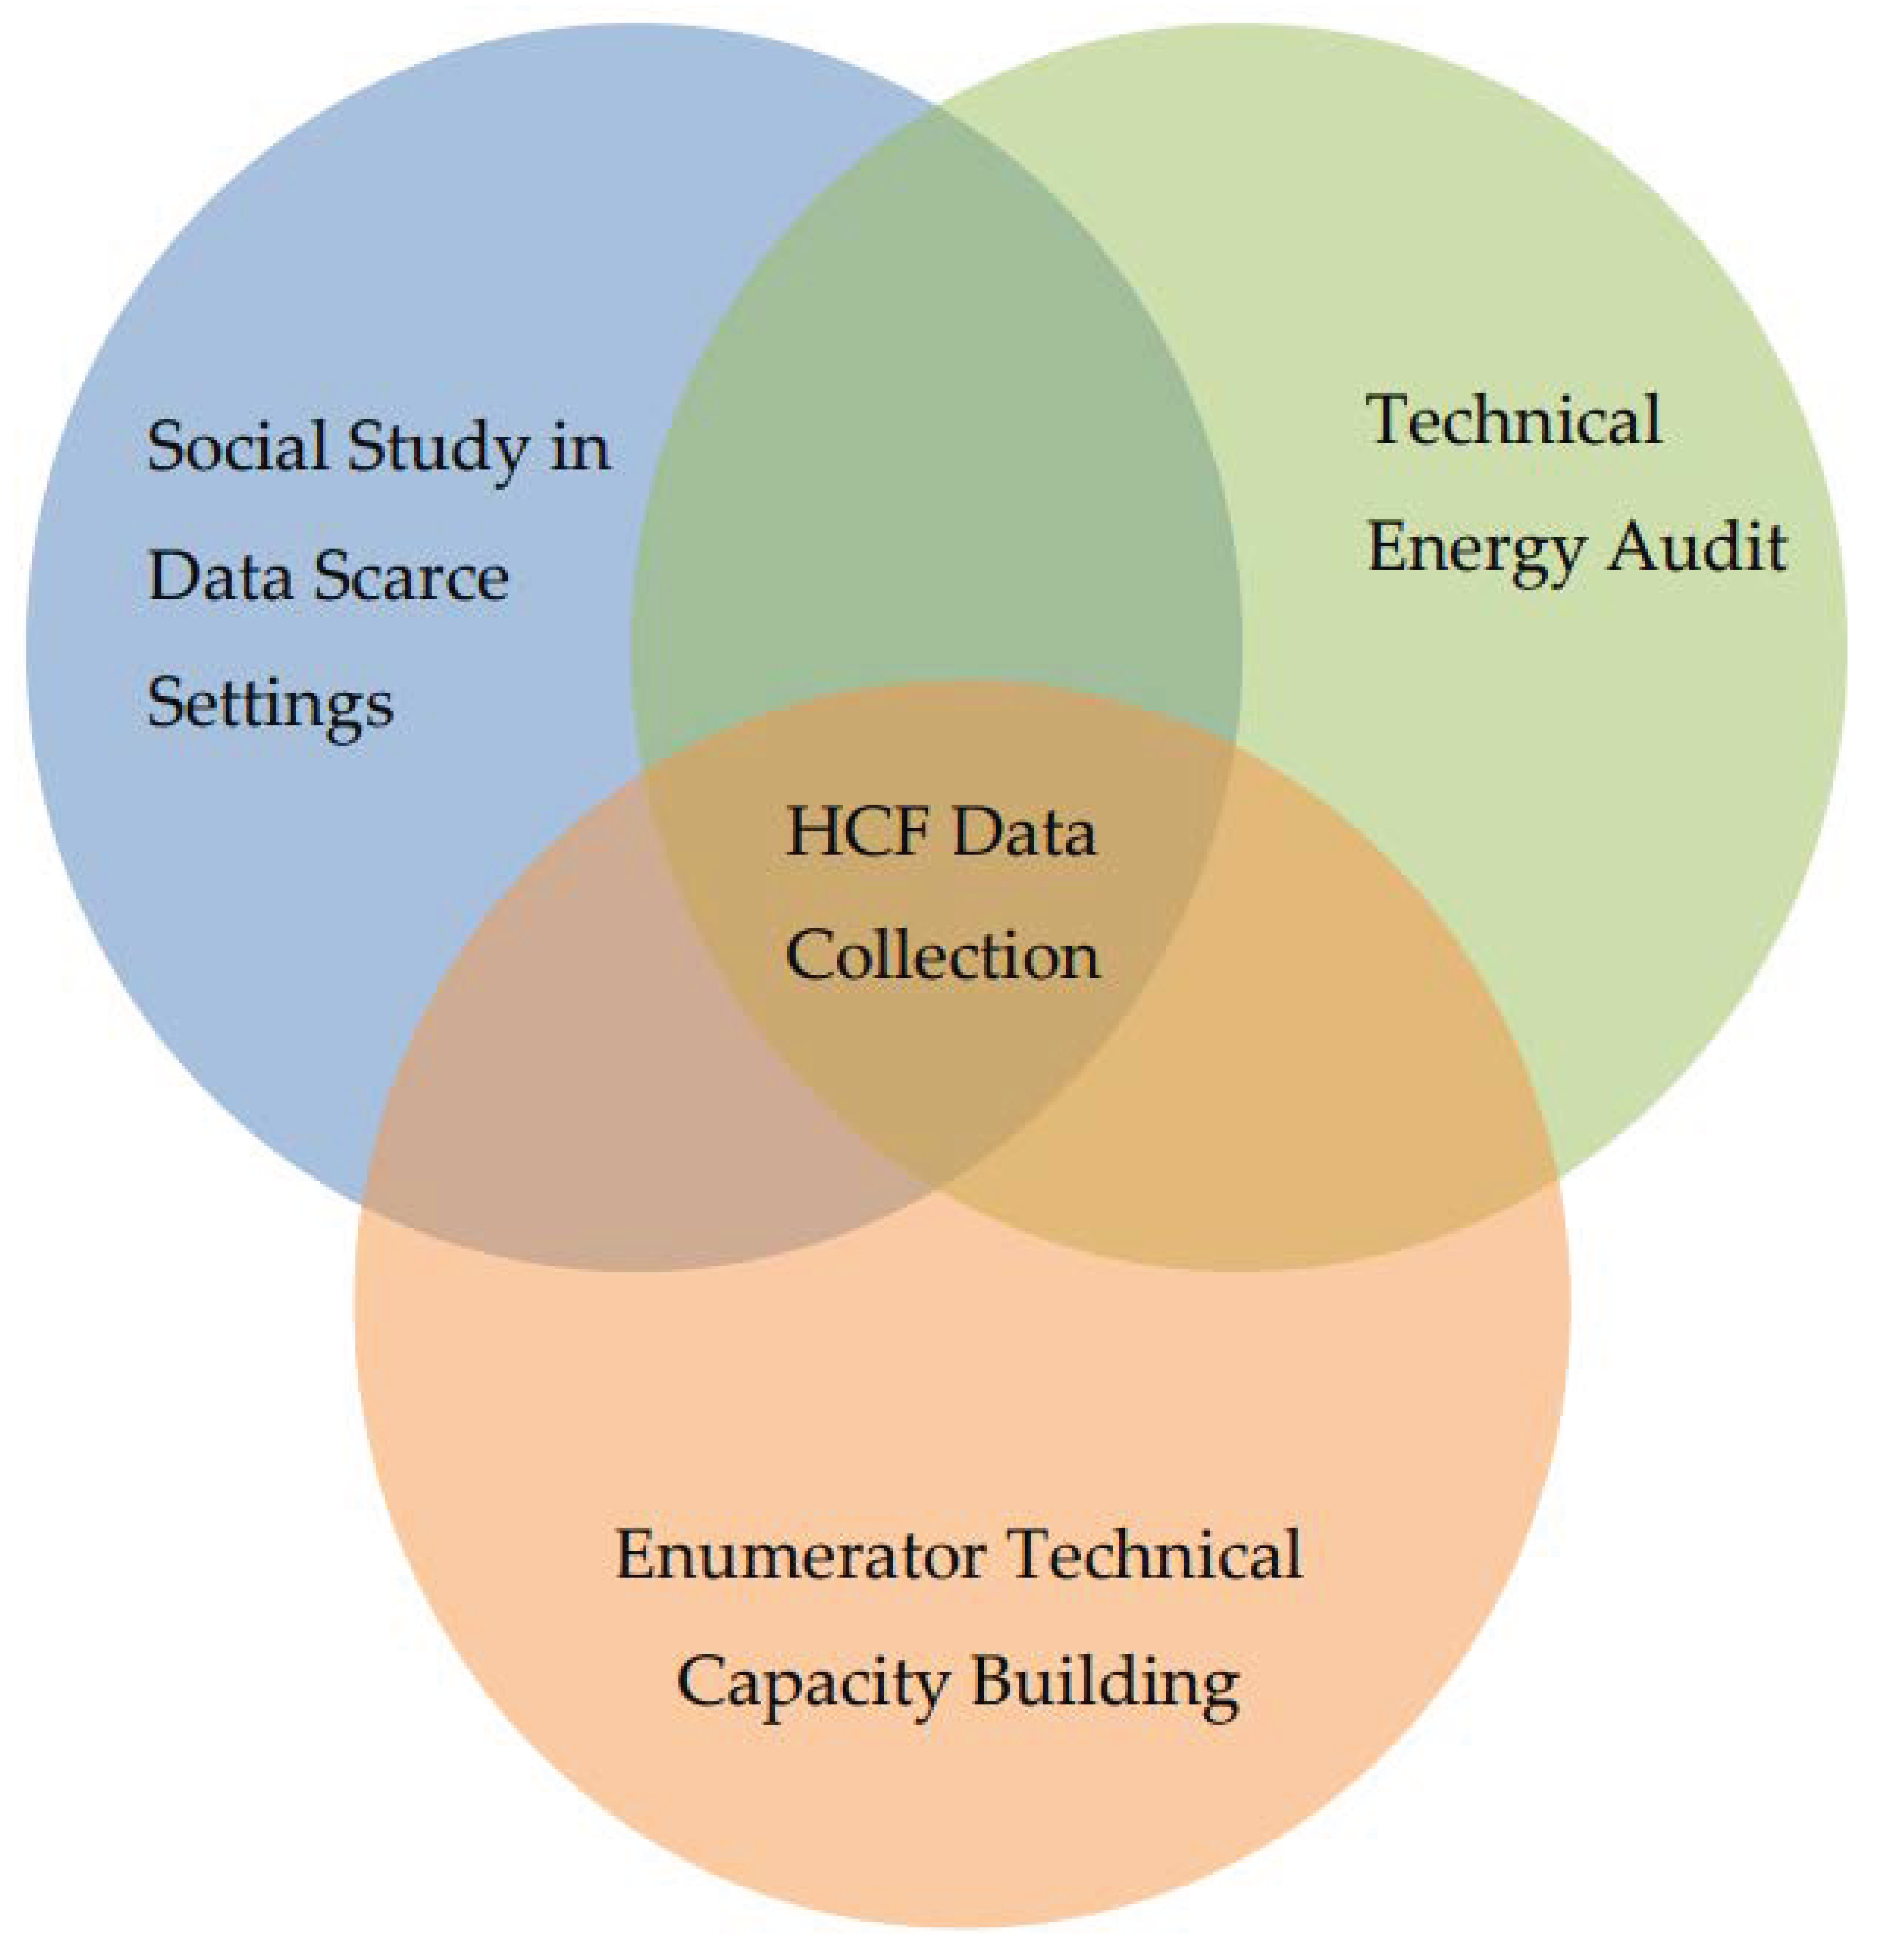
Appendix A. To ensure that the results of the survey are accurate and reliable for the analysis, we have to address three separate challenges as illustrated in
Figure 2. These challenges include the limited resources available for in-person technical data collection by the researchers in a data scarce setting, collecting technical data from enumerators without relevant technical background, and setting up a data collection platform for enumerators without in-person training and a study platform setup.
To address these challenges, we used a participatory design approach between researchers and managers of HCF at the national level. As a result, the final forms developed capture both the requirements for a systematic energy assessment as well as coherent questions and instructions for the non-technical HCF staff to conduct the survey. Then, we used translation-back-translation for validating questions in the local language and conducted a pilot from eight facilities prior to launching the final data collection campaign. We developed short videos to train the data collectors to set up the data collection platform on their smartphones and the data journey in the study, as well as the purpose of the study. For ease of access to the videos by staff, we uploaded the videos to YouTube and shared the links with every data collector.
The benefit of adopting such a cloud-based data collection approach is that, through the integration of smartphones and internet connectivity, researchers reduce the logistical barriers of collecting in-person data. The difficulties in accessing the location of many HCFs in low-income countries, such as quality of roads, weather conditions and the availability of transportation, are among the challenges that exacerbate the data scarcity in low-resource communities. Through the implementation of off-grid and cloud-based data collection, the respondent could utilize their smart phones for data collection and upload the results once they have internet access, hence removing the logistical challenges and costs of data collection in low resource communities.
3.3.2. Expert Opinion Elicitation for Decision Factor Weights
The second dataset informing the TOPSIS model is the decision factors and each decision factor’s influence on the overall priority of HCF for electrification referred to as the weights of the decision factors. The weights of each decision factor should represent the importance of that factor for the decision-makers. For this purpose, we developed a ranking survey and asked the participating decision makers including in-country healthcare professionals and international program managers overseeing the operations and resource allocations to rank 11 identified attributes from the most important to the least important one. In addition, we asked the participants for any other decision factor that they identify as important and not captured among the 11 attributes presented.
Section 4.2. presents the results of this survey and the weights calculated based on the ranks that decision makers attributed to each decision factor. The decision factors presented in
Section 4.2. populate the
vector in matrix D of Equation (1) and the weights calculated for them inform the
vector in Equation (4).
3.3.3. Data Triangulation, Missing Values, and Validation
Since the project’s resources are limited and the context of data collection is within a data scarce setting, there are limited options for validation of the data through triangulation and cross references. To address this challenge, we triangulated the data collected at the HCF level with the inventory list of equipment in each facility provided by operations management at the national level. Through this triangulation, we validated the HCF level collected data through cross-referencing the services offered in each clinic, a list of equipment currently in use, current energy access, and ICT infrastructure. Researchers addressed the discrepancies identified through direct contact with facility managers.
3.4. Electricity Demand Modeling
The electricity demand at each HCF enables us to estimate the size of solar PV plus the storage system. Based on the estimated system size, we can estimate the costs associated with the deployment of such DRE systems for each HCF. This cost estimate is among the decision factors in the TOPSIS model. This study develops two distinctive demand scenarios for each HCF. In the current demand scenario, we combined the overall demand for every major electricity consuming equipment that currently exists in each HCF. The ideal scenario captures the energy needs if each health service offered in the clinics has access to the required equipment for its services.
Table 1 presents the equipment that ideally should be available for appropriate services associated with each clinic department. This table is based on the initial case study we conducted in Uganda. Alternatively, the ideal scenario could follow the national or international guidelines.
In this case study, we did not collect the rated power of each equipment currently in use due to data collection limitations discussed in
Section 3.3.1. To model the rated power and the maximum likelihood of using each piece of equipment, we developed
Table A1 in the
Appendix A based on the energy audits conducted prior research on electronic device energy use in hospitals [
19]. However, the reported consumption values for much medical equipment in the US in this source is likely to be significantly different from low-income countries and low resource settings [
20]. To compensate for such contextual differences in energy consumption, we identified a Chinese and a US manufacturer for each piece of equipment and averaged the rated power of them for the same size systems to use in our demand estimation models. In addition, we estimated the maximum hours that each piece of equipment is likely to operate in consultation with nurses at a representative HCF in Uganda.
3.5. Cost Estimates for DRE Deployment
One of the main factors that distinguishes the electricity access of HCFs from that of other service organizations in low resource settings is the reliability and continuity of services. The reliability of access to electricity in the case of HCFs is, by definition, a matter of life and death for patients. Therefore, in this study we have focused on costs that better capture the financial resources required for the longevity of electricity access. To capture such costs, we have integrated sensor-based monitoring systems into DRE system components, allocated 5% of project capital costs for long-term operation and maintenance, and integrated maintenance logs and training procedures for technicians. However, the exact cost estimation for each clinic is not feasible at this level of analysis. An accurate cost calculation that is necessary for project implementation planning requires clinic level audits and competitive biddings by practitioners, as well as considering government/multilateral subsidies, logistics, supply conditions, and multiple other external factors that are beyond the scope of this study. Nevertheless, using the approach presented in this study, decision makers receive a reasonable range for costs associated with deployment of reliable DRE units at each facility. To ensure that the estimates are reflective of realities, we identified multiple local and international practitioners and asked them to provide the researchers with the range of costs for their most recent projects. The quotes we received suggested that most expensive projects in Uganda (due to either the highest quality technologies or the most logistically challenging locations to access to) are approximately $11 per Watt, while the most cost-effective DRE systems are likely to cost $4 per Watt. Therefore, we used three financial models for the investment needed that are likely to capture the range of costs for deploying DRE systems from the most expensive ones to the most cost-effective options.
4. Results
This section presents the results of the case study conducted across 56 HCFs in Uganda, which demonstrate the effectiveness of the developed DREAM tool. The purpose of this case study is to prioritize the HCFs for the allocation of resources for reliable electricity access based on a set of decision criteria.
Table A2 in the
Appendix A presents a summary of the data we collected in this study.
4.1. Decision Factor Weights
A short survey by eight decision makers and public health experts based in the United States and Uganda informed the weights assigned to decision factors in the TOPSIS analysis. In the survey, we asked each respondent to rank the proposed decision factors from the most important to the least important attribute. In addition, respondents could add any other attribute that was not in the proposed decision factors. Results of the survey inform the cumulative weight assigned to each decision factor as illustrated in
Table 2. In this table, rows represent the final set of decision factors in the TOPSIS analysis and columns include the ranks that each respondent has assigned to a decision factor. The letters (B) and (C) for each decision factor present whether the factor is a cost factor or a benefit factor, as discussed in
Section 3.1. Numbers in each cell represent the number of respondents that assigned a ranking from 1 to 11 to a decision factor. The relative weights presented in percentage points in the last column inform the TOPSIS analysis.
From the survey results, the number of health services offered in HCF is the most important decision factor. This means that for two facilities, with every other attribute being identical, the one with more health services offered has a higher priority for electrification than the one with fewer health services offered. Expert respondents identified the cost of electrification as the least important decision factor compared to the other attributes. The reason for this is due to the budgetary constraints, hence the role of the cost of electrification is an inherent factor for the decision makers. The whole purpose of adopting the strategy presented in this study is to best allocate such limited budgets to the facilities that have the highest need. As a result, recognizing it as the least important factor is because of the overarching role that cost plays in the decision-making and the nature of limited resources available to allocate to every HCF. This finding is in line with the key assumption of the study that acknowledging that the costs of the electrification of every facility exceed the available budget, what other factors should be incorporated in the decision-making process to achieve an optimum allocation of funds that is likely to lead to the maximum public health impact. Thus, other factors precede cost in the analysis.
4.2. Key Findings
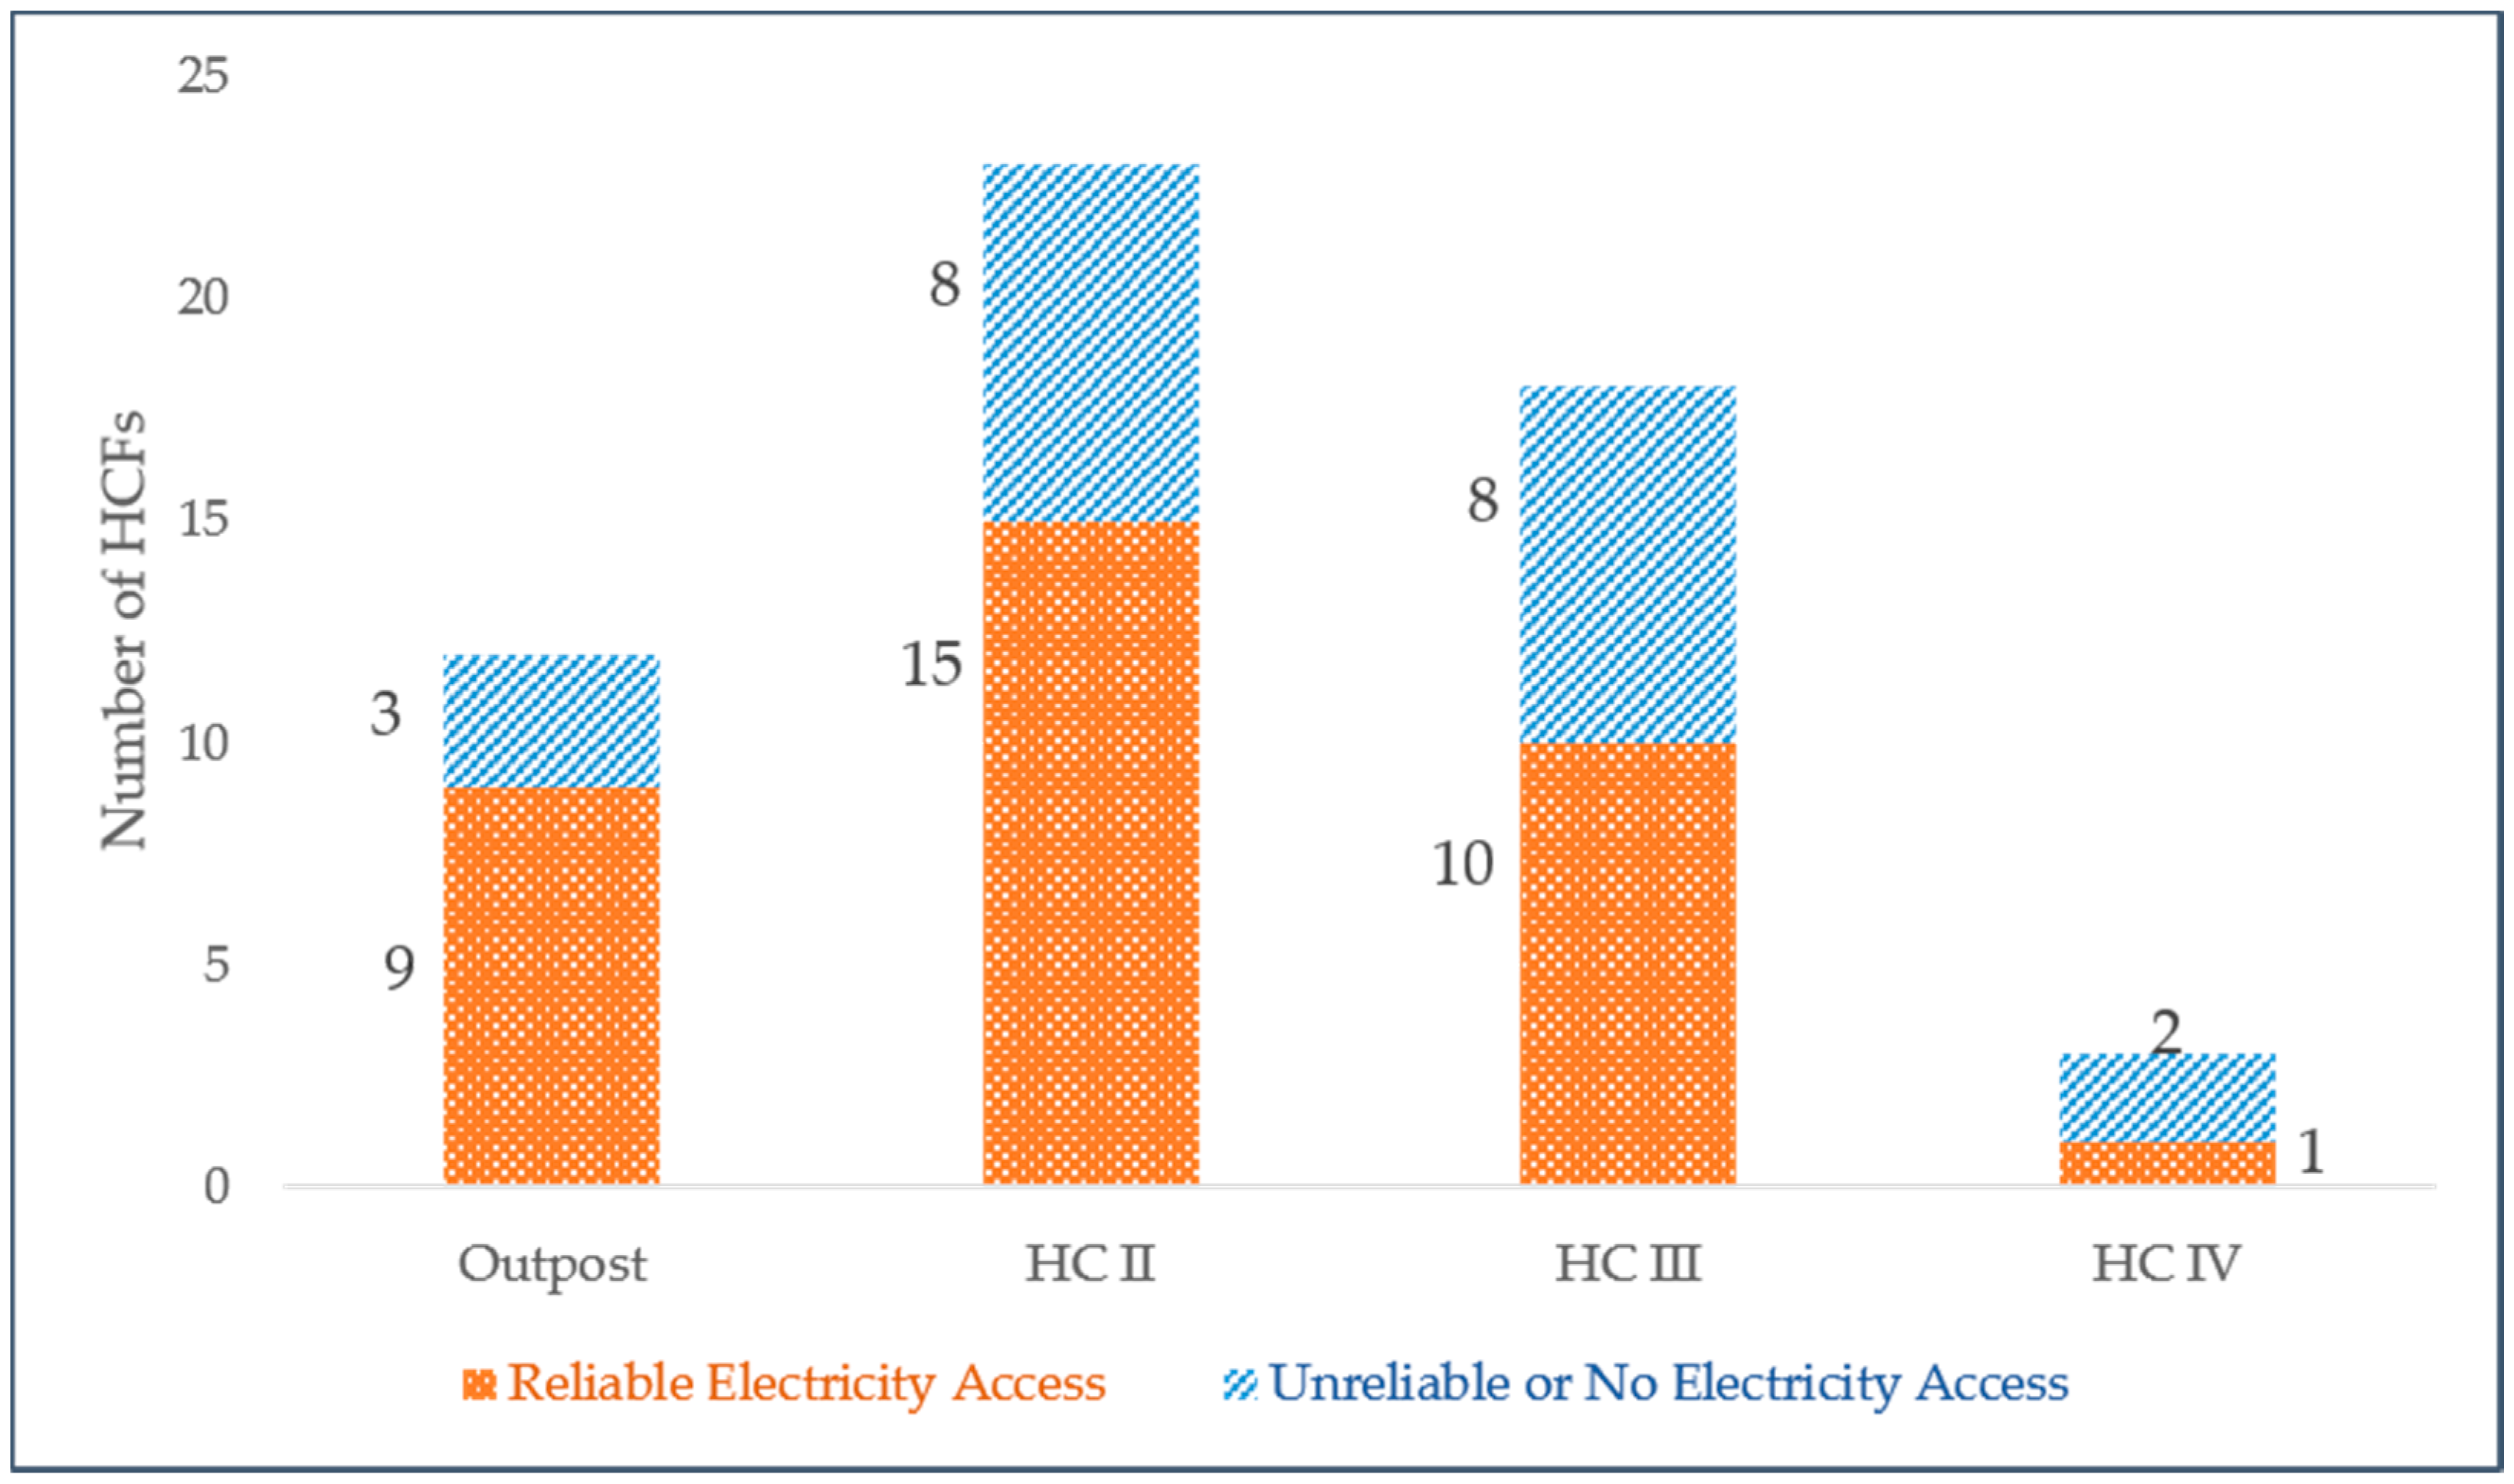
The Ministry of Health in Uganda categorizes HCF in district-based levels based on services and approximate capacity for patient visits. This study covered every category of HCF type at the district-based level including HCIV, HCIII, HCII, and outposts [
21]. Among the surveyed facilities, only 21 (38%) have reliable access to electricity as illustrated in
Figure 3. This finding is in line with [
2], which suggested that, globally, an estimated 41% of HCFs in low- and middle-income countries have reliable electricity access.
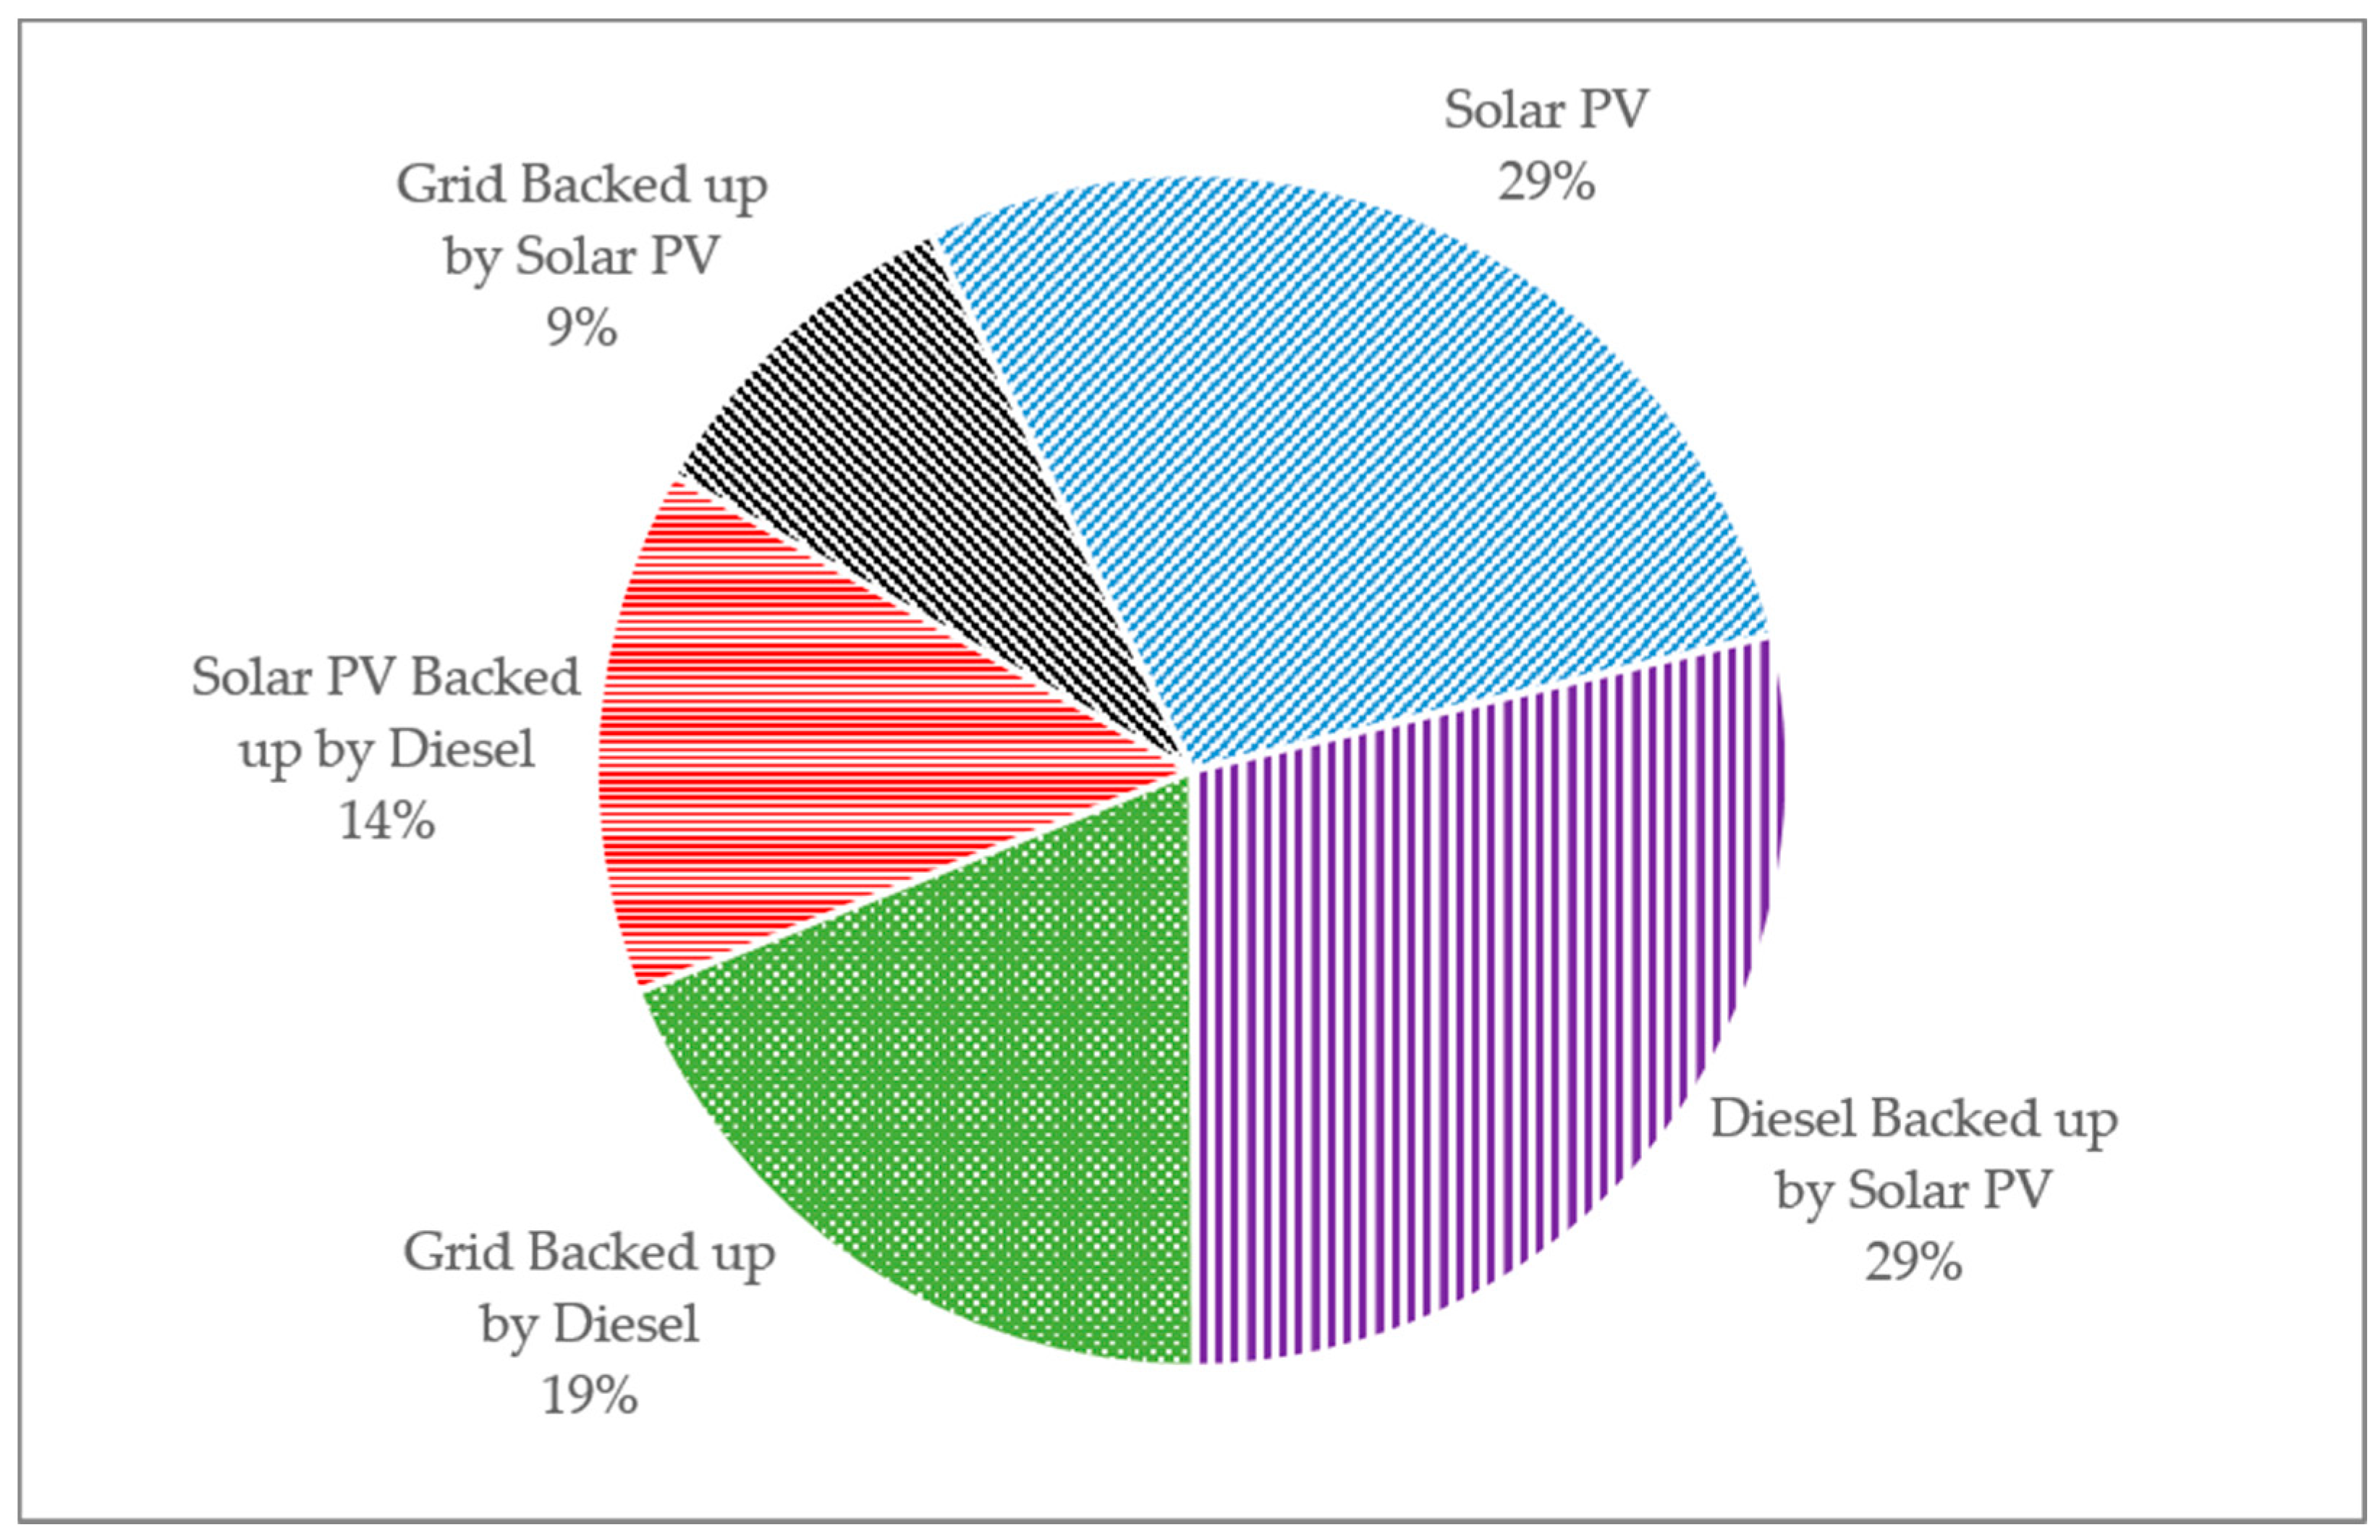
Figure 4 presents the source of reliable electricity access in these facilities.
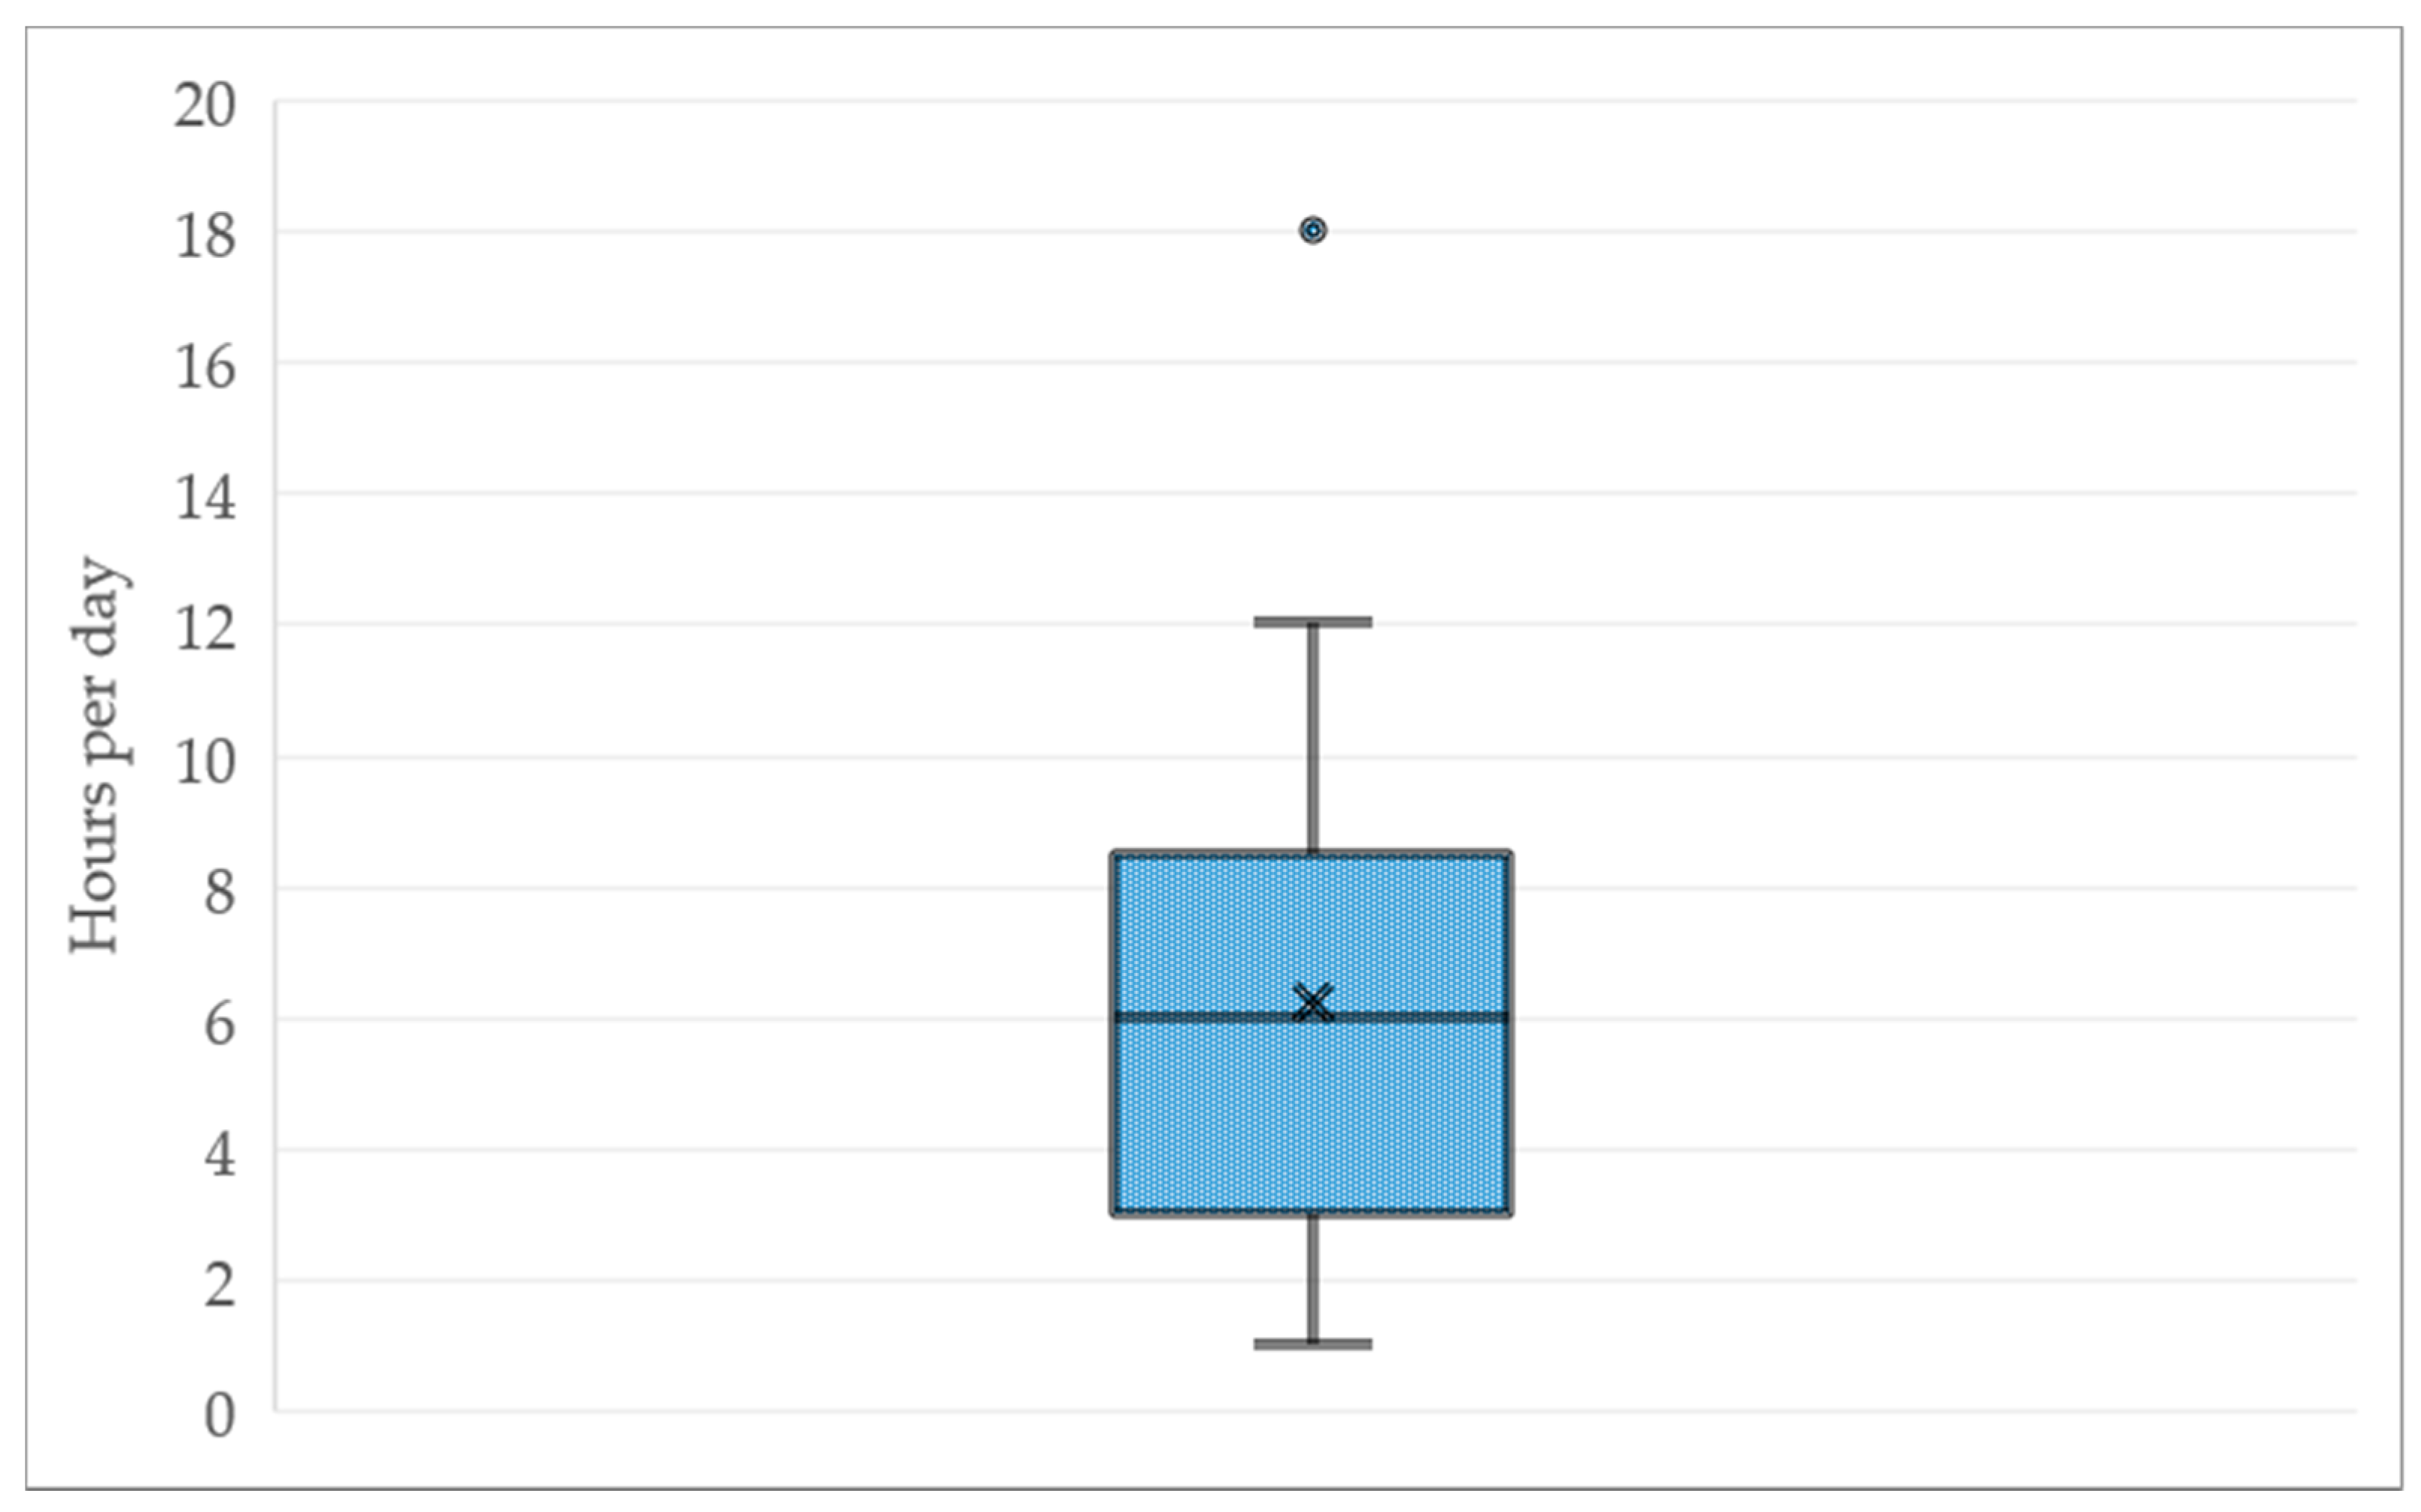
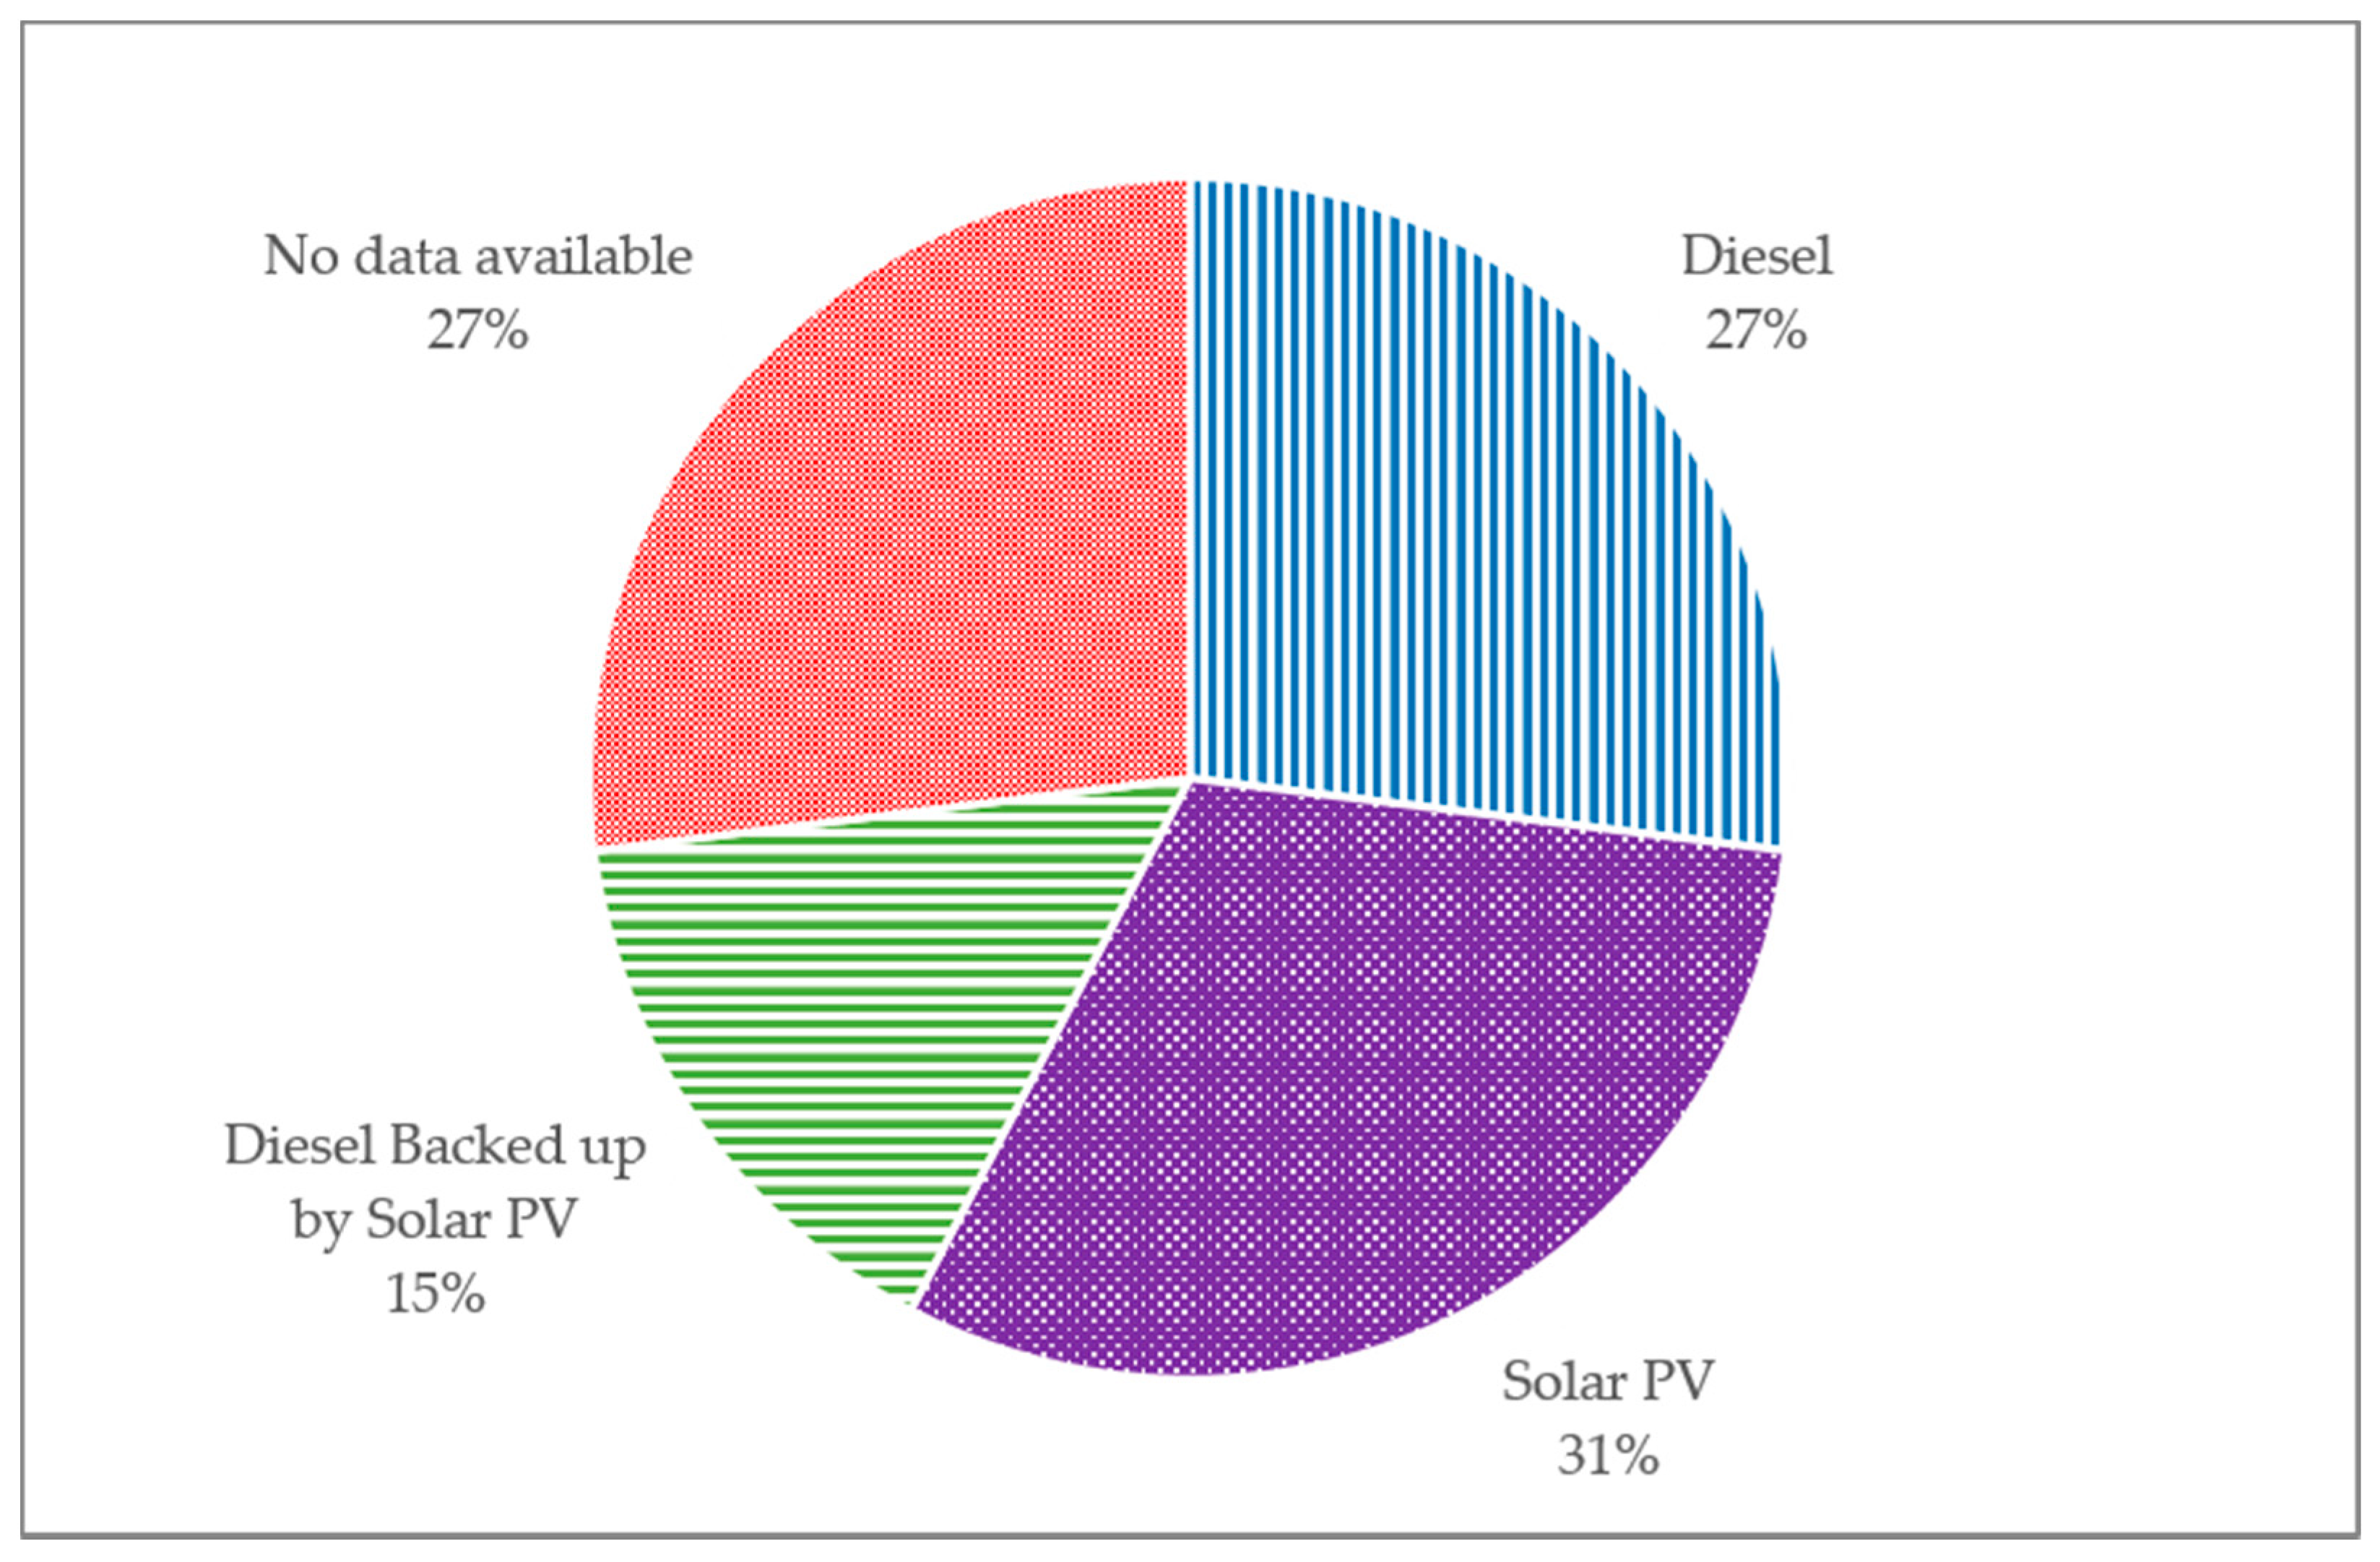
There are 35 HCFs (63%) with unreliable or no electricity at all. Among them, 26 facilities have partial access to electricity. The average hours per day with access to electricity in these facilities is approximately 6 hours with the distribution illustrated in
Figure 5. The source of electricity in these facilities is presented in
Figure 6.
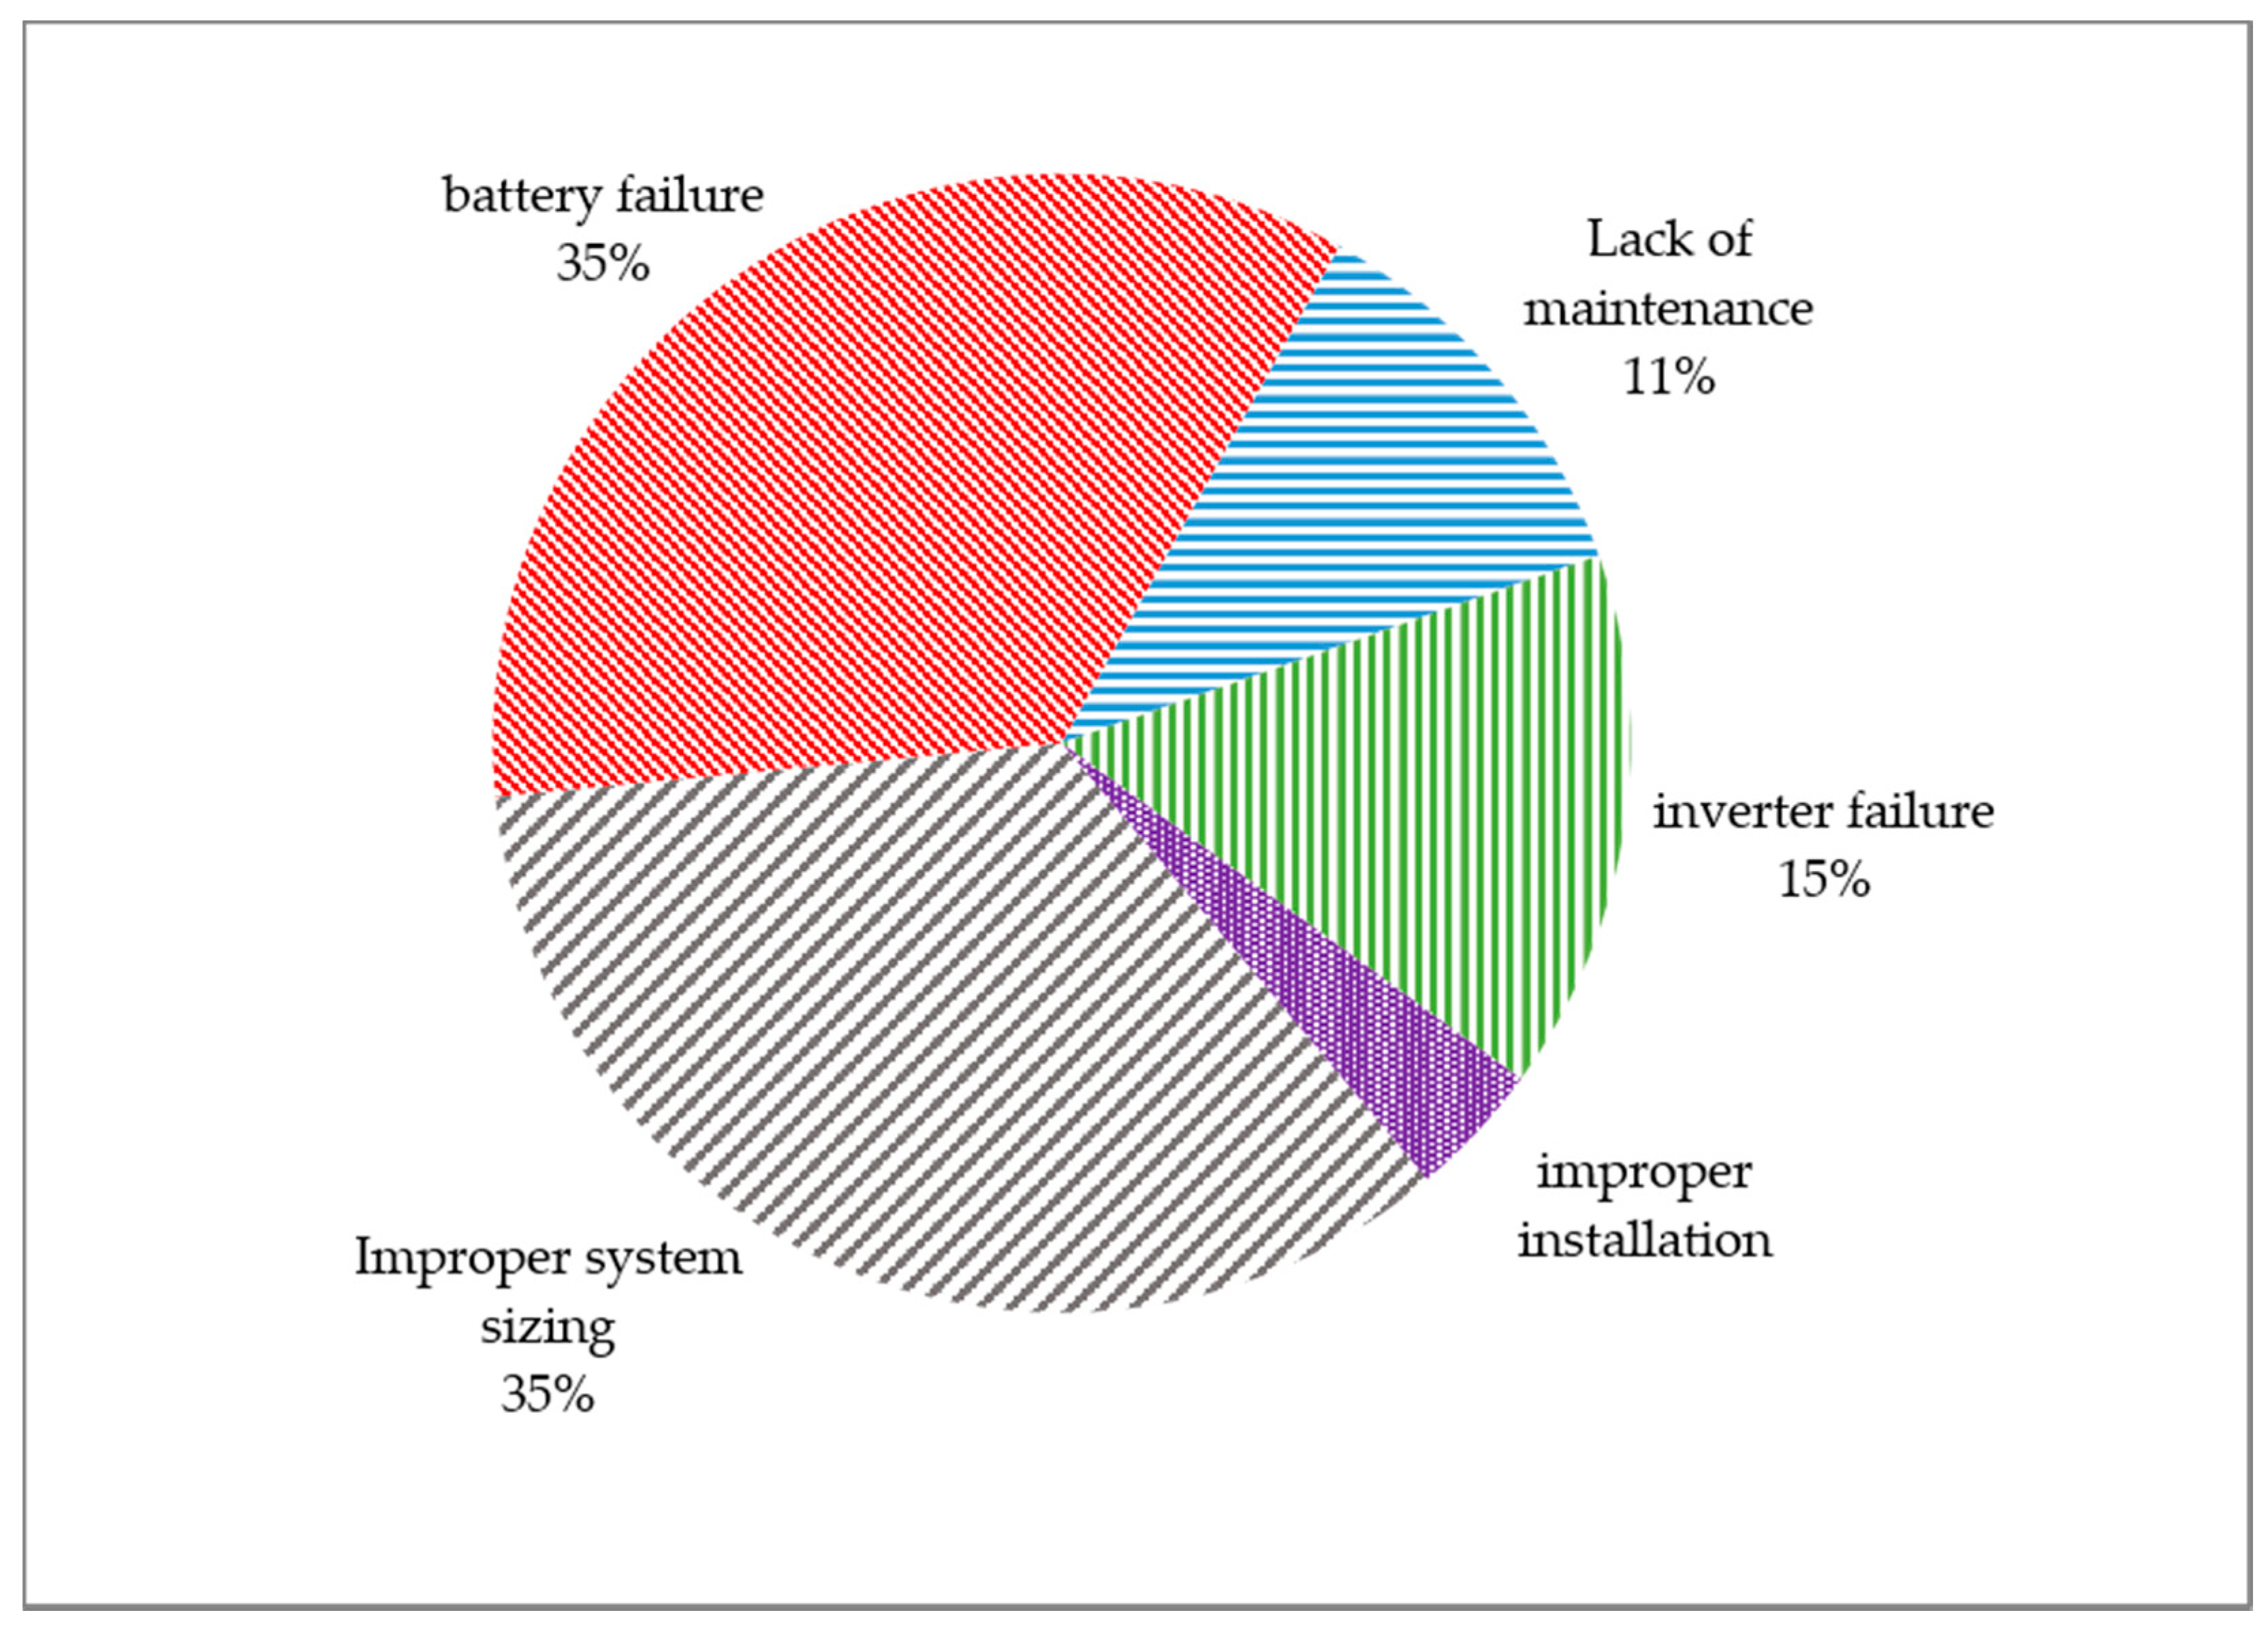
There are multiple reasons for unreliable electricity access, even though many of the evaluated HCFs are equipped with solar PV systems or diesel generators.
Figure 7 presents the main reasons causing unreliable access to electricity for each type of generation system. Among the facilities with investments in solar PV systems, two main factors that lead to unreliable access to electricity are inadequate system capacity to meet the demand, and battery system failures. All of the battery systems installed in the surveyed facilities are lead-acid based batteries. The lifetime of such batteries, by design, often varies between 300 charge cycles to 500 charge cycles [
22]. Charge cycle refers to a cycle in which a battery is fully charged and then discharged. In many cases, the storage systems are designed to complete one charge cycle in 24 h so that the batteries charge during solar PV generation hours and discharge during evening and overnight. Therefore, such batteries are likely to last up to two years by design. This finding suggests that proper O&M plans are pertinent for the continuous operation of DRE systems, without which even the most appropriately sized systems are prone to failure after a year or two of operation.
Based on the issues encountered in surveyed facilities and presented in
Figure 7, implementing a robust O&M plan that involves regular system monitoring and inspections is likely to address more than half of the root causes of unreliable electricity access through off-grid solar PV systems. About 40% of the remaining risks associated with unreliable electricity access are attributable to improper system sizing, and improper installations. While discussing proper technical system design is beyond the scope of this article, a report by the UN Foundation and SEforAll presents an approach that could lead to designing such systems to be reliable and sustainable [
14].
4.3. Prioritization of HCF Based on TOPSIS Analysis
The data collected at the HCF level provide contextual insight regarding energy requirements and operations at each facility. These data inform the TOPSIS analysis with the scores populating matrix D of Equation (1) in
Section 3.1.
Table 3 illustrates the results for the top nine HCFs in the ranking and the last nine facilities for comparison. Based on the extent that each decision factor influences the overall score of each facility with respect to the positive ideal solution and negative worst solution, the HCFs are ranked from the highest priority at the top to the lowest priority at the bottom.
The second column, Rank, presents the rank of each HCF. The first two high priority facilities are already electrified and have reliable electricity access based on a mix of grid, diesel generators, and solar PV system. Therefore, the highest priority to focus on for practical purposes is the third facility in the table that, despite its priority score, has unreliable access to electricity.
The analysis includes a cost estimate for deploying an off-grid solar PV system to each facility based on two demand scenarios. The main assumption of the current scenario is that the electricity should be sufficient for the currently available equipment in the facility. The ideal scenario assumes that the electricity access should be sufficient to enable the utilization of every piece of medical equipment that is necessary for the services offered by the facility. For example, there are HCFs in the study that have a maternity ward. However, not every facility with a maternity ward has incubators or infant warmers. The differences between current and ideal scenarios alter the system size, daily energy demand, and capital cost of deploying stand-alone PV systems as reflected in
Table 3.
The approach developed in this project enables public health policy analysis and planning for energy access in HCFs located in low resource settings. Using the portfolio level data collected in this research, policy makers could evaluate the regional distribution of certain health services. For instance, if there are resource limitations, policy makers could use this tool to identify the facilities that would maximize public health outcomes if they were to receive reliable electricity to power certain health services or equipment. This method could prioritize services, such as vaccine refrigeration, to enable vaccination plans especially in times of epidemic and to strengthen pandemic response coordination or public health initiatives that target certain health practices with a high priority in the region, such as maternal services. The methodology used in this study provides insights necessary for these decisions at a site level, such as cost estimates, logistical challenges and public outreach.
5. Conclusions
In this study, we applied a multi-criteria decision-making approach to prioritize the electrification of HCFs located in low resource areas. For this purpose, we designed a data collection approach to collect facility level data related to operations and energy demand using cloud-based data collection platforms. We used the TOPSIS technique to rank the studied facilities from the highest to lowest priority for electricity access based on thirteen different decision criteria identified by decision makers.
There are two novel contributions presented in this approach. First, a method is developed to collect clinic level technical data from the facility’s staff that lead to an informed decision support process that is cost-effective and reliable. The presented data collection method removes the logistical challenge of sending an enumerator with relevant technical background to each facility for a feasibility study. Through adopting this approach, a significantly larger number of HCFs could be surveyed remotely. Additionally, in this approach, the people with long-term experience and exposure to each facility’s operations and conditions fill out the forms and collect the data instead of a visiting enumerator. As a result, the collected data present a holistic view of the operations facilitating evidence-based decision-making and robust policy analysis.
Based on the dataset developed at a regional scale through the method presented in this study, decision makers can strategize resource allocation for electrification of the facilities so that the public health impact of such resource allocations are maximized. While in an ideal scenario reliable access to electricity at every facility contributes to the best public health outcome, in reality, the resources are limited and there are always competing priorities for decision makers.
Therefore, the main objective of this study is defined as a prioritization of HCF based on the decision criteria defined by decision makers to allocate resources for reliable electricity access to the facilities with the most need first. For this purpose, we used the TOPSIS analysis based on the collected data.
The results of this study provide insights related to the risks associated with solar PV systems, a grid’s unreliability, and costs and climate change impacts of diesel generators. One key outcome of the study is that failures in the existing solar PV systems are approximately up to 60% due to a lack of proper O&M strategy with 40% attributable to improper system design and installation. This finding, along with the other data collected at the facility level, enables decision makers to adopt a holistic approach through standardization, policy recommendations, and effective resource allocation that could lead to higher reliability of electricity access at the HCF in low resource contexts. One of the key attributes that play an important role in the reliability and sustainability of access to electricity is demand side management. While this study aims at addressing the challenges in the effective allocation of resources from the supply side, one should pay attention to user behavior, behavior change communication and demand side management for a holistic electricity access analysis (e.g., [
23]).
An additional opportunity that this approach enables is leveraging different funding streams to deploy PV + storage systems through clustering the electricity access services based on size, displacement of diesel, income generating services, location, or ownership. Such clustering is likely to facilitate large-scale interventions and investments for multilateral organizations as well as governments or the private sector. The outcome of such clustering that is based on the unique potentials and the context of operation of each HCF has two main advantages compared to existing approaches. First, the DRE systems are designed based on the requirements at each facility instead of a one-fit-all solution. Second, through a bottom-up and data-driven approach, the scaled-up investment is likely to serve as a seed for further development initiatives in a sub-national or national scale based on such services. For example, training technicians to ensure the reliability of electricity access in HCFs at a regional scale is likely to lead to the creation of more jobs and more installations of DRE inspired by the successful operations that stakeholders observe from the DRE systems operating at HCF. Such clustering not only improves the health infrastructure for a larger scale of operations, but also improves the response to health crises as well as outbreaks that could have national or global consequences.
For future works, the results of this study and the presented methodology could be integrated with national scale analysis to inform national policies. In addition, the methodology presented here enables clustering HCFs into categories that reflect the contextual conditions of healthcare operations in low resource settings, enabling multilateral organizations and public health entities to shape a realistic approach to a coordinated effort for the electrification of HCFs across the globe.
Author Contributions
Conceptualization, Mohammad H. Pakravan and Andrea C. Johnson; methodology, Mohammad H. Pakravan; formal analysis, Mohammad H. Pakravan; resources, Andrea C. Johnson; data curation, Mohammad H. Pakravan; writing—original draft preparation, Mohammad H. Pakravan; writing—review and editing, Andrea C. Johnson; visualization, Mohammad H. Pakravan; supervision, Andrea C. Johnson; project administration, Andrea C. Johnson; funding acquisition, Andrea C. Johnson. All authors have read and agreed to the published version of the manuscript.
Funding
This research was funded by the Shine Campaign, grant number G-20-12189 and the Distributed Power Fund, general support funds.
Institutional Review Board Statement
Not applicable.
Informed Consent Statement
Not applicable.
Data Availability Statement
Restrictions apply to the availability of these data. Data was obtained from Medical Teams International and are available from the authors with the permission of Medical Teams International.
Acknowledgments
The authors of this research would like to thank Medical Teams International (MTI), The Power Partnership, the Shine Campaign, and the Distributed Power Fund for their support with facilitating the development of the DREAM tool and the case study. We acknowledge the contribution of MTI’s Uganda operation and staff, every HCF staff involved in the data collection, regional monitoring and evaluation team, and national management team. Without their professional and kind support, this work could not have achieved its outcomes.
Conflicts of Interest
The authors declare no conflict of interest.
Appendix A
Table A1.
Rated power and maximum hours of use for major equipment applicable in district-based healthcare facilities.
Table A1.
Rated power and maximum hours of use for major equipment applicable in district-based healthcare facilities.
| Equipment Name | Average Rated Power | Maximum Likely Hours of Daily Operation | Daily Maximum Energy Consumption |
|---|
| Nebulizer | 105 | 9 | 945 |
| Oxygen concentrator | 426 | 9 | 3834 |
| Defibrillator | 130 | 24 | 3120 |
| TV & DVD player | 100 | 24 | 2400 |
| Baby Warmer | 792 | 12 | 19,008 |
| Electrical autoclave | 1650 | 6 | 14,850 |
| Incubator | 1035 | 24 | 24,840 |
| Phototherapy machine | 180 | 9 | 1620 |
| CPAP machine | 360 | 24 | 8640 |
| Suction machine | 283 | 6 | 2547 |
| Anesthetic Machine | 1440 | 9 | 12,960 |
| Patient monitor | 160 | 24 | 3840 |
| Diathermy machine | 500 | 9 | 4500 |
| Flat Iron | 800 | 2 | 1600 |
| Fridge | 186 | 24 | 4464 |
| Computer | 65 | 24 | 1560 |
| PIMA CD4 analyzer | 30 | 9 | 270 |
| Microscope | 310 | 8 | 2790 |
| Vortexer | 70 | 6 | 630 |
| Electric Centrifuge | 230 | 6 | 2070 |
| Rotator | 32 | 6 | 288 |
| Slide warmer | 273 | 9 | 2457 |
| Hematology analyzer | 283 | 9 | 2547 |
| Chemistry analyzer | 275 | 9 | 2475 |
| Biosafety cabinet | 400 | 9 | 3600 |
| Color printer | 50 | 4 | 200 |
| Copy machine | 300 | 4 | 1200 |
| X-ray * | 5000 | 6 | 30,000 |
| Blood Pressure Machine | 30 | 24 | 720 |
| Roller mixer | 70 | 9 | 630 |
| Blood cell counter | 225 | 2 | 450 |
| AC | 400 | 12 | 4800 |
| Operation table lamp | 154 | 9 | 1540 |
Table A2.
Summary of the data collected at HCF level.
Table A2.
Summary of the data collected at HCF level.
| Attribute | Measure | Response Summary |
|---|
| Name of the clinic | Count | 56 |
| Services/preventive | Count | 54 |
| Services/maternity | Count | 35 |
| Services/inpatient | Count | 26 |
| Services/emergency surgery | Count | 4 |
| Services/blood transfusion | Count | 5 |
| Services/lab | Count | 53 |
| Services/nutrition | Count | 51 |
| Services/pharmacy | Count | 39 |
| Services/pediatric | Count | 14 |
| Services/isolation | Count | 30 |
| Services/ANC | Count | 53 |
| Services/OPD | Count | 53 |
| Services/general | Count | 20 |
| Services/mortuary | Count | 4 |
| Services/ART-HIV | Count | 38 |
| Services/immunization | Count | 4 |
| Is respondent in charge of the clinic | Dummy | Yes 51-No 4 |
| Does the clinic have electricity access | Dummy | Yes 45-No 10 |
| Is the electricity access reliable | Categorical | Yes 21-No 14-Sometimes 10-Missing 11 |
| How many hours per day electricity is reliable | Numeric | Average 6.5-Max 18-Min 1-Median 6 |
| Main source of electricity | Categorical | Solar 9-Diesel 10-Grid 6-Missing 31 |
| Secondary source of electricity | Categorical | Solar 19-Diesel 14-Grid 0-Missing 23 |
| What is the main challenge of solar | Categorical | Capacity issues 7-Battery issues 9-Maintenance 3-Installation issues 1-Inverter issues 4 |
| What is the main challenge of grid | Categorical | Bills 2-Blackouts 4 |
| What is the main challenge of diesel | Categorical | maintenance 13-fuel supply 15-fuel cost 1-capacity 1 |
| Utility bill (UGX) | Numeric | Average 891,666-Median 700,000-Max 2,000,000-Min 350,000 |
| Cost of diesel fuel | Numeric | Average 187,815-Median 80,000-Max 480,000-Min 37,000 |
| Is the water treated? | Dummy | Yes 52-No 3 |
| Is there any cell signal? | Dummy | Yes 50-No 4 |
| Is there MTI provided laptop? | Dummy | Yes 24-No 30 |
| Is there any staff capable of working with IT equipment | Dummy | Yes 54-No 0 |
| Number of beds | Numeric | Max 130-Min 0-Average 18.40-Median 12 |
| 24 Hour operation? | Dummy | Yes 38-No 16 |
| Number of support staff | Numeric | Max 42-Min 2-Average 10.65-Median 10 |
| Number of technical staff | Numeric | Max 69-Min 2-Average 17.46-Median 13 |
| Total number of staff (technical+support) | Numeric | Max 111-Min 5-Average 27.8-Median 21 |
| Number of staff staying at the clinic over night | Numeric | Max 70-Min 0-Average 11.51-Median 6.5 |
| Number of patients in average | Numeric | Max 34,693-Min 929-Average 5396.32-Median 4180.5 |
| Number of separate buildings | Numeric | Max 23-Min 1-Average 4.76-Median 3 |
| Number of staff accommodation rooms | Numeric | Max 50-Min 0-Average 11.03-Median 8 |
| Clinic’s major needs | Open ended |
References
- IEA. SDG7: Data and Projections. Paris. 2020. Available online: https://www.iea.org/reports/sdg7-data-and-projections (accessed on 19 September 2021).
- Cronk, R.; Bartram, J. Environmental conditions in health care facilities in low- and middle-income countries: Coverage and inequalities. Int. J. Hyg. Environ. Health 2018, 221, 409–422. [Google Scholar] [CrossRef] [PubMed]
- Bhatia, M.; Angelou, N. Beyond Connections Energy Access Redefined; Energy Sector Management Assistance Program (ESMAP); World Bank: Washington, DC, USA, 2015; pp. 1–224. Available online: https://openknowledge.worldbank.org/handle/10986/24368 (accessed on 9 August 2021).
- Reuland, F.; Behnke, N.; Cronk, R.; Mccord, R.; Fisher, M.; Abebe, L.; Suhlrie, L.; Joca, L.; Mofolo, I.; Kafanikhale, H.; et al. Energy access in Malawian healthcare facilities: Consequences for health service delivery and environmental health conditions. Health Policy Plan. 2019, 35, 142–152. [Google Scholar] [CrossRef] [PubMed]
- Ani, V.A. Provision of reliable electricity to primary health care facilities in nigeria a new focus of interventions. Int. J. Energy Clean Environ. 2021, 22, 83–104. [Google Scholar] [CrossRef]
- Broto, V.C.; Kirshner, J. Energy access is needed to maintain health during pandemics. Nat. Energy 2020, 5, 419–421. [Google Scholar] [CrossRef]
- Franco, A.; Shaker, M.; Kalubi, D.; Hostettler, S. A review of sustainable energy access and technologies for healthcare facilities in the Global South. Sustain. Energy Technol. Assess. 2017, 22, 92–105. [Google Scholar] [CrossRef]
- Miku, B. Access to Modern Energy Services for Health Facilities in Resource-Constrained Settings; WHO: Geneva, Switzerland, 2018; ISBN 9789241507646. [Google Scholar]
- Olatomiwa, L.; Blanchard, R.; Mekhilef, S.; Akinyele, D. Hybrid renewable energy supply for rural healthcare facilities: An approach to quality healthcare delivery. Sustain. Energy Technol. Assess. 2018, 30, 121–138. [Google Scholar] [CrossRef] [Green Version]
- IEA. Net Zero by 2050; IEA: Paris, France, 2021; Available online: https://www.iea.org/reports/net-zero-by-2050 (accessed on 11 May 2021).
- Mentis, D.; Odarno, L.; Wood, D.; Jendle, F.; Mazur, E.; Qehaja, A.; Gassert, F. Energy Access Explorer: Data and Methods; World Resources Institute: Washington, DC, USA, 2019; Available online: www.wri.org/publication/energy-access-explorer (accessed on 9 August 2021).
- Fobi, S.; Deshpande, V.; Ondiek, S.; Modi, V.; Taneja, J. A longitudinal study of electricity consumption growth in Kenya. Energy Policy 2018, 123, 569–578. [Google Scholar] [CrossRef]
- Africa Renewable Energy Access Program. Photovoltaics for Community Service Facilities; World Bank: Singapore, 2010. [Google Scholar] [CrossRef]
- Sustainable Energy for All. Lasting Impact, Sustainable Off-Grid Solar Delivery Models to Power Health and Education. 2019, p. 84. Available online: www.unfoundation.org (accessed on 26 August 2021).
- Hwang, C.-L.; Yoon, K. Multiple Attribute Decision Making; Springer: Berlin/Heidelberg, Germany, 1981. [Google Scholar] [CrossRef]
- Behzadian, M.; Otaghsara, S.K.; Yazdani, M.; Ignatius, J. A state-of the-art survey of TOPSIS applications. Expert Syst. Appl. 2012, 39, 13051–13069. [Google Scholar] [CrossRef]
- Margarita, C.; Soto, A.; Liern, V.; Pérez-Gladish, B. Normalization in TOPSIS-based approaches with data of different nature: Application to the ranking of mathematical videos. Ann. Oper. Res. 2018, 296, 541–569. [Google Scholar] [CrossRef]
- Adair-Rohani, H.; Zukor, K.; Bonjour, S.; Wilburn, S.; Kuesel, A.C.; Hebert, R.; Fletcher, E.R. Limited electricity access in health facilities of sub-Saharan Africa: A systematic review of data on electricity access, sources, and reliability. Glob. Health Sci. Pract. 2013, 1, 249–261. [Google Scholar] [CrossRef] [PubMed] [Green Version]
- Black, D.R.; Lanzisera, S.M.; Lai, J.; Brown, R.; Singer, B.C. Evaluation of miscellaneous and electronic device energy use in hospitals. World Rev. Sci. Technol. Sustain. Dev. 2013, 10, 113. [Google Scholar] [CrossRef] [Green Version]
- Stottlemyer, J.; Hacker, S.; Collins, B.J. Medical Equipment and Clinic Electrification Report. 2021. Available online: https://www.clasp.ngo/research/all/medical-equipment-and-clinic-electrification-report/# (accessed on 26 October 2021).
- Uganda Ministry of Health. Health Sector Strategic & Investment Plan, Promoting People’s Health to Enhance Socio-Economic Development 2010–2014. 2010. Available online: www.health.go.ug (accessed on 14 May 2021).
- Jaiswal, A. Lithium-ion battery based renewable energy solution for off-grid electricity: A techno-economic analysis. Renew. Sustain. Energy Rev. 2017, 72, 922–934. [Google Scholar] [CrossRef]
- Wei, J.; Zhang, Y.; Wang, J.; Wu, L. Distribution LMP-Based Demand Management in Industrial Park via a Bi-Level Programming Approach. IEEE Trans. Sustain. Energy 2021, 12, 1695–1706. [Google Scholar] [CrossRef]
| Publisher’s Note: MDPI stays neutral with regard to jurisdictional claims in published maps and institutional affiliations. |
© 2021 by the authors. Licensee MDPI, Basel, Switzerland. This article is an open access article distributed under the terms and conditions of the Creative Commons Attribution (CC BY) license (https://creativecommons.org/licenses/by/4.0/).


