Article

Extraction and Visualization of Tourist Attraction Semantics from Travel Blogs

School of Computer Sciences, Universiti Sains Malaysia, Penang 11800, Malaysia
*
Author to whom correspondence should be addressed.
ISPRS Int. J. Geo-Inf. 2021, 10(10), 710; https://doi.org/10.3390/ijgi10100710
Submission received: 23 July 2021 / Revised: 14 September 2021 / Accepted: 10 October 2021 / Published: 18 October 2021
(This article belongs to the Special Issue Geospatial Semantic Web: Resources, Tools and Applications)

Abstract

:
Travel blogs are a significant source for modeling human travelling behavior and characterizing tourist destinations owing to the presence of rich geospatial and thematic content. However, the bulk of unstructured text requires extensive processing for an efficient transformation of data to knowledge. Existing works have studied tourist places, but results lack a coherent outline and visualization of the semantic knowledge associated with tourist attractions. Hence, this work proposes place semantics extraction based on a fusion of content analysis and natural language processing (NLP) techniques. A weighted-sum equation model is then employed to construct a points of interest graph (POI graph) that integrates extracted semantics with conventional frequency-based weighting of tourist spots and routes. The framework offers determination and visualization of massive blog text in a comprehensible manner to facilitate individuals in travel decision-making as well as tourism managers to devise effective destination planning and management strategies.

1. Introduction

The widespread usage of information and communication technologies (ICTs) [1,2] in the tourism domain has significantly evolved fundamental travel processes [3], such as data search and sharing [4], originating collaborative information [5], purchases, and travel practices [6]. ICT has ultimately shifted the paradigm to heavy reliance on massive online data, otherwise known as user-generated content (UGC) [7]. Besides multimedia [8] and location-based data [9], a large proportion of UGC is available in textual form that includes online travel reviews, tweets, tour guidebooks, and travel blogs. The primitive challenge is the inherent unstructured format of text data, usually multi-faceted containing references to geographic [10], temporal [11], and thematic attributes [12] associated with places. Thus, effective text processing and representation techniques are inevitable for a meaningful transformation of data to knowledge.
In contrast to online reviews, regarded as short text and exhaustively utilized for tourism-related information extraction [13,14,15,16,17], travel blogs have been paid less attention [18,19,20]. This is largely due to the amount of text contained in a blog narration; multiple tourist attractions and variety of related topics are discussed in a single thread. Nevertheless, blog writing is typically considered diary-style in its approach [5,21,22], which motivates to consider an inherent sequence in its content. The idea has been applied to extract popular movement patterns of bloggers and arrange them in the form of a points of interest graph (POI graph) used for trip planning. However, trip planning is one of the problems that requires an explicit understanding of the target destination. Owing to the presence of rich geospatial and topical clues, travel blogs are a notable source for modeling human travelling behavior and understanding space in the context of tourism, which formalizes the representation of ‘space’ as a ‘place’ [23].
Place semantics is a prominent research domain that seeks to understand places based on how humans sense, describe, and interact with places [24,25,26,27]. The purpose here is to transform unstructured textual data into a formal and structured representation as depicted by a semantic model to conceptually define a place. In the case of a tourist attraction, it is certain that travelers tend to describe spatial connectivity of POIs in natural language; the other salient information is how they perceive places, which is highly connected with the phenomenon of place affordance [25,28] that ultimately lets travelers form an opinion and image about the visited place [29]. Hence, place semantics can broadly characterize a number of relevant attributes of a tourist attraction, ranging from its general and physical features (geo-features) to associated things, events, and opinions (qualifiers). While there are previous studies that focused on evaluating tourist places, there is a lack of systems that could provide an aggregated and consolidated view of key semantic features on top of popular travel patterns. Such an application would eliminate the need to go through massive content online that usually causes an inability to comprehend and take efficient decisions, the problem also termed information overload [30,31].
To formulate an effective solution for above-defined problems, this study aims to utilize travel blogs to first identify semantic information of popular tourist spots in a region including offered activities, features with geographic indication, and travelers’ sentiments, and then construct a multi-criteria-weighted POI graph. The proposed method “Sem_POI” performs place semantics extraction using a fusion of contextual and syntactical analysis. Initially, semantic model of a POI is proposed that illustrates the required features to define a POI. Following this, content analysis [32,33] and dependency parsing [6,34] techniques are utilized to extract semantic features related to potential POIs. Finally, conventional frequency or popularity-based weighting of POIs and routes in a POI graph are cumulated with the extracted place semantics, resulting in multi-criteria weighting and consequently an enhanced aggregated tourism profile of the target tourist attraction.
This work contributes to the existing studies on semantics extraction and representation for tourism in certain ways. The presented multi-criteria weighted graph model is a major improvement over previous graph-based information representations from travel blogs. Visualization of data is a powerful mechanism that aids human interpretation in terms of analysis, reasoning, and generating knowledge about the subject under study [35]. Here, the resultant graph representation not only contains more information as compared to previous models, but is also more focused towards users; the output graphs are constructed as to facilitate travel information understanding rather than mining and unclearly representing the semantics in graphs. Secondly, it is a multi-level approach for information integration and weight computation. Most of the existing methodologies resorted to frequency-based approaches for POIs and route recommendation. However, frequency may not be a sole and adequate indicator of the characteristic image of a tourist spot. Frequency can signify the relative importance of a place in terms of visit; nevertheless, acquiring distinguished qualifiers related to the place would better delineate its preference among travel bloggers. Hence, if frequency is a measure of likeness, then there must be some adjunct themes associated with the place that can clearly exhibit a tendency of likeness in linguistic terms and should be aggregated with frequency parameter to better illustrate place popularity factors. From semantic similarity perspective, existing approaches extracted word co-occurrences using N-grams based on the principle that words that are used and occur in the same context convey similar meanings, but the N-gram model usually does not extract correlations between non-consecutive words in a sentence [36]. Therefore, in this work, natural language processing (NLP) is integrated for semantic correlation that is capable of handling word associations at greater granularity.
In summary, the objective of this study is to answer the following research questions in the context of travel blog text analysis and representation:
(1)
What kind of information would a blog reader be potentially interested in the massive unstructured text and how do we organize those distinct information chunks in a POI graph to facilitate travel planning?
(2)
How do we extract the most representative semantic features related to a POI that would not only improve frequency-based treatment of blog texts but also enhance visualization from an end user’s perspective?
In the following, Section 2 describes travel blogs and their utilization for pattern mining and place semantics extraction. Section 3 presents the overall framework of a multi-criteria-weighted POI graph and methodology adopted for semantic information extraction of POIs. Section 4 covers the experimental case study and results. Section 5 elaborates on the achieved results and implication of this research. Section 6 concludes the paper with potential future research directions.

2. Background

2.1. Travel Blogs and Tourists’ Movement Patterns

Sigala et al. [37] elucidate blogs as “free, public, web-based entries in reverse chronological order presented in a diary-style format”. Hence, travel blogs being “personal online diaries” [5,21,22] are an informal sort of digital journaling [38]. Through blog writing, tourists aspire to connect with people and communicate persuasive travel information and advice. Travel blog data essentially contain the five V’s properties of Big Data: “large scale (volume), content diversity (variety), quickly changing (velocity), authenticity (veracity), and application value (value)” [33]. With the escalation of UGC, people are sharing their travel memories on various blogging platforms [39,40], which signifies the volume, variety, and velocity features of travel blog data. Veracity and value are evident in the sense that researchers recognize the significance of tourist experiences narrated in blogs and their impact on travel decision-making and destination image [40,41,42].
Banyai and Glover [43] proposed two ways to study travel blogs, content, and narrative analysis. Content analysis tends to explore blog narration in a thematic context, which includes the recreation options and services associated with tourist places, tourists’ perception, and destination identities. Narrative analysis provides meanings to blogger’s travel experiences using temporal and spatial aspects that correspond to scene-recall or spatio-temporal occurrence of travel events. Both modes of analysis provide valuable information on tourist travelling and consumption behavior [44], which include but are not limited to their movement patterns, activities, interests, and degree of contentment with the overall travel experience.
For analyzing tourists’ movement pattern, scholars have fundamentally resorted to the diary-style structure of blog text, which implies that the experiences are recorded in a sequence. Besides, the occurrence frequency of a POI or a POI–POI correlation indicates popularity. In this principle, bloggers’ mobility has been analyzed and visualized to identify popular tourist landmarks, routes, departure cities, and local features using frequent pattern mining technique. Kori et al. [45] made use of sequential pattern mining to propose popular travel routes from travel blogs where the routes are suggested based on the user supplied query-keyword, and the system also extracts route context for the selected path. Xu et al. [46] applied frequent pattern mining to deduce popular POIs and their correlations, where a correlation corresponds to the adjacent position of two place names in a pattern mining transaction. In contrast to the route context [45], the method proposed by Xu et al. [46] determines things-of–interest (ToI) related to a POI based on the individual and collective occurrence of a {POI, ToI} pair. Guo et al. [47] introduced the application of frequent pattern mining on structured tourism blogs in which bloggers’ travel information is appropriately labeled as “title”, “cities”, and “travel routes”. The system extracts popular tourist spots, routes, and departure cities, whereas spot-associated services are identified using compact pattern mining.
The above-defined related works visualized POI graphs and POI features based on frequent pattern mining and its variants. Yuan et al. [20] enhanced this by segmenting a frequent itemset word network into tourism areas of geographically close tourist attractions, whereas a route within a tourist area is popular based on the measure of correlation between two attractions and their local features. Shou et al. [33] counted co-occurrences to represent the degree of association between POIs and illustrate a map of multi-destination choices of bloggers. In contrast, Haris et al. [48] studied the relationship between frequent co-occurrences of tourist place names in travel blogs and their geographic closeness and extracted natural language qualifiers associated with place names to populate frequent patterns-based POI graphs with spatial information.

2.2. Semantic Information Extraction and Representation

In traditional text mining, a textual document is treated as a bag of words (BOW) [27,49,50]. The BOW approach is primarily exploited as an underlying text representation scheme in various methods that aim to find useful, and relevant features from text data. The simplest method is to count the frequency of a word’s appearance, also known as term frequency (TF) and then remove unintended terms to get keywords. Shou et al. [33] developed a semantic network diagram from travel blogs to visualize scenic spots and related features based on a keyword count. Term frequency–inverse document frequency (TF–IDF) is another weighting scheme that determines the importance of a word with respect to a document in a corpus [51]. Murakami et al. [52] exploited TF–IDF measure to determine the word-of-mouth (WOM) from travel blogs written after the 2011 Tohoku earthquake. In contrast, Li et al. [53] studied destination image formation through travel blogs using TF–IDF for word weighting and generated an affective network to visualize travelers’ sentiments. Nonetheless, TF–IDF suffers from a shortcoming that it does not count interesting word correlations in which the terms have a lower IDF value [46,54].
Frequent pattern mining is a well-known correlation analysis technique. Referring to Section 2.1, it has been heavily adopted to extract and represent semantic features associated with tourist spots and routes. It defines frequent patterns as itemsets or subsequences present in a stream of data with an occurrence frequency greater than a predefined threshold [55]. However, a smaller threshold value may not be suitable for the analysis of travel blog text since a popular POI is usually mentioned more frequently in contrast to its associated attributes; hence, it may result in both relevant and irrelevant features as output while performing word correlation analysis [20]. An application of frequent pattern mining is association rule mining; Kurashima et al. [56] applied it to visualize bloggers’ travel activities and impressions at a particular time and space in the form of a map of experience.
Topic modeling is a statistical technique used for semantic structure discovery in text data. The essence of topic modeling is the idea that a document is a collection of latent topics and topics are associated with distribution over the words contained in the document [46,57]. Hence, topic models are good at discovering themes associated with documents at a word-level. Hao et al. [58] applied a location topic model [59] to travel blogs for destination recommendation, which classifies local topics of a POI and global topics common among other POIs, while a location similarity graph illustrates similar POIs. In comparison, Adams and McKenzie [60] employed topic modeling to study places in a thematic context that resulted in identifying and visualizing places of thematic distinction and thematic changes over time. However, typical topic models treat documents as BOW, which results in a high-dimensional feature space, and outcomes lack word-to-word association [27,50].
In NLP, a dependency parser analyzes the relationship structure of words to extract sequences of dependencies (grammatical relations, Section 3.2.2) and encode the given sentence into a dependency tree [25,61]. Nakatoh et al. [62,63] carried out extraction and disambiguation of place names from travel blogs using dictionaries and dependency structure analysis, whereas a classification network visualizes the polysemy of place names. Zhu et al. [36] extracted semantic knowledge associated with tourist spots in travel blogs by exploiting lexical dependencies to first perform semantic parsing and then constructed a location representative concept network. There can be many different types of dependency relations in a sentence; however, not all of them provide appropriate semantic information.

3. Methodology

A graph data structure essentially consists of two components, nodes and edges. In the case of a POI graph, nodes primarily represent tourist attractions or POIs, while edges represent the connection between two POIs called routes. The idea of a multi-criteria-weighted POI graph has been established and elaborated in a previous work [64], and the proposed framework has been broken down into two parts. The first part deals with the edges, and the second part handles the nodes. It should also be noted that the first part has been successfully studied [48] that enriched routes of a POI graph with spatial information. This paper specifically focuses on the second part of the graph model where POI enrichment is implemented. Thus, this work is closely linked with the previous two studies and they will be referenced accordingly in the rest of the paper. At the end, the results of Haris et al. [48] will be integrated with the results obtained in this work, thereby combining the edge and node semantics to realize a multi-criteria-weighted POI graph. While the integration of the results is necessary, the method proposed in this study for semantics extraction is comprehensive and standalone. Moreover, it has been substantially expanded and improved compared to previous proposals for POI enrichment [64].
The overall methodology to construct a multi-criteria-weighted POI graph is illustrated in Figure 1. As mentioned above, stages 1 and 2 have been successfully accomplished earlier, which correspond to the construction of a conventional POI graph from frequent sequential patterns and transforming it into a spatially enriched POI graph. Here, stages 3 and 4 are to be developed in which semantic features of POIs are to be extracted first and the results of stage 2 are to be combined. Finally, node and edge weighting functions as shown in stage 4 are computed, resulting in a multi-criteria-weighted POI graph. The methodological details for stages 3 and 4 are explained in the following sections.

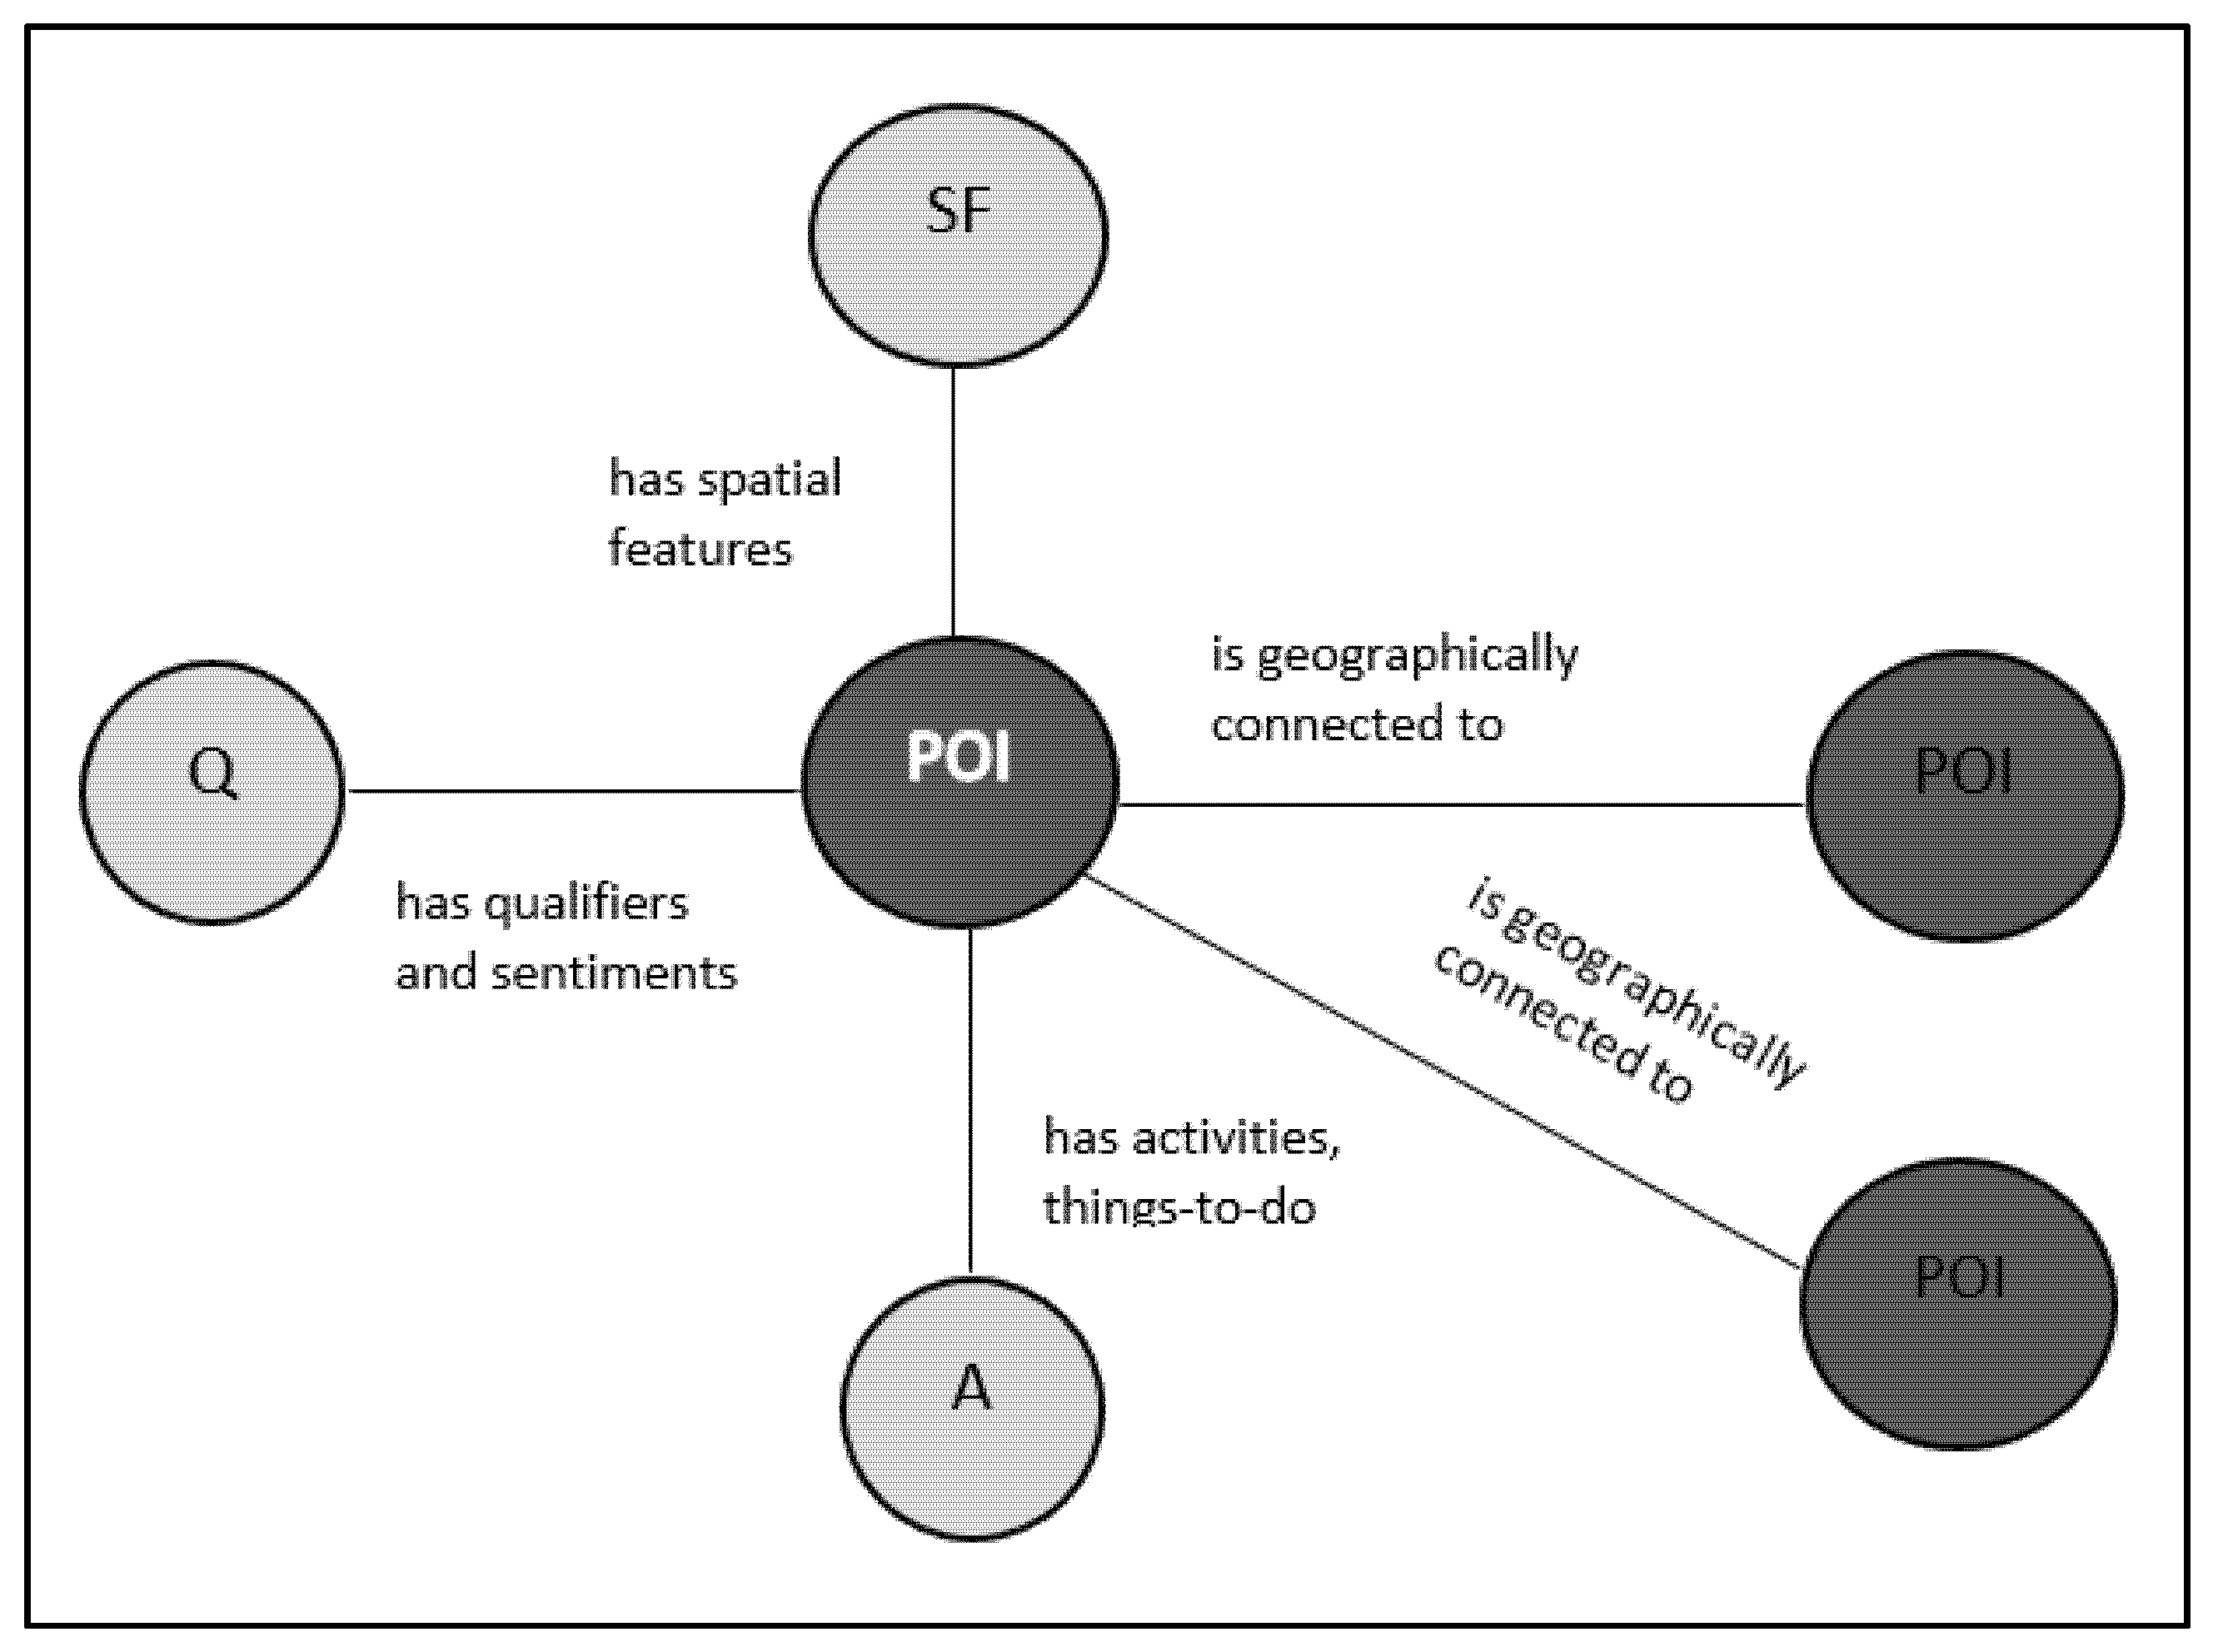
3.1. Semantic Model of a POI

An abstract semantic model of a POI can be derived based on content and narrative analysis techniques of travel blog mining. Hobel and Fogliaroni [25] and Zhu et al. [36] provide a reference to construct cognitive models of a place. Scheider and Janowicz [65] discuss essential kinds of place inferences to construct a place reference system. Based on the identified place features from these references, Figure 2 is developed that depicts the proposed semantic model where a place POI is to be geographically associated with other POIs. This part of the model (dark shade nodes) was developed earlier [48], which is now aggregated here to propose a complete semantic representation. Continuing with the definition, this POI has certain spatial features SF that define its topographic footprint. A POI in general affords a number of activities and things-to-do, symbolized as A. Lastly, besides a popularity or frequency score, a POI is linguistically recalled by qualifiers and subjective terms Q. Through this model, the idea would be extended to other POIs and finally construct a multi-criteria-weighted POI graph. The proposed model incorporates spatial relations that can explicitly inform about the location where an activity can be performed or a geographic feature can be located. Secondly, different types of semantic dependency relations (as will be discussed later) allow us to define a POI in a more detailed fashion.

3.2. Sem_POI: Proposed Method for Place Semantics Extraction

In the proposed method Sem_POI, travel blog analysis is performed using a combination of text mining and NLP techniques. T-Lab software [66] is used for text mining and information visualization (Section 3.2.1). It is a comprehensive tool for statistical, lexical, and graphical analysis, providing a combination of qualitative and quantitative measurements [67]. The Stanford NLP toolkit [68] is exploited for the syntactic analysis part (Section 3.2.2). It is all-inclusive language processing software that is used here in particular to parse and transform unstructured text into a formal representation.

3.2.1. Content Analysis for Frequency-Based Weighting

Co-word analysis is a notable content analysis technique to identify correlations or association between significant terms called keywords. This analysis allows a direct interpretation of the results with respect to their semantics [69]. Co-word analysis is fundamentally driven by the frequency of word occurrences in the text, as it is presumed that high-frequency words are more meaningful for the analysis than the lower frequency ones [70]. This frequency factor determines the importance of various terms and topics, which are designated as keywords. The frequency of two co-occurring keywords indicates the strength of their semantic relationship. Keywords can potentially reveal the major concepts and underlying themes in a corpus. Hence, in the given case, keywords can range from POIs to their associated features and qualifiers.
Co-word analysis is performed in two steps: the first step employs frequency-based analysis, such as TF; the second step focuses on identifying term co-occurrences using various association indexes such as cosine similarity, Jaccard similarity, and others. The resultant correlations are subjected to multidimensional scaling (MDS) representation or correspondence analysis. Co-word analysis has been effectively utilized to uncover hidden or trending topics and the formation of domain-oriented concepts [69].

Travel Blog Data Preprocessing

The first step involves the preprocessing and compilation of travel blog pages into a corpus. Corpus preparation involves a sequence of steps that include checking for stop words, normalization, which includes tasks such as eliminating excess blank spaces, marking apostrophes, reducing capital letters, recognizing proper nouns, and converting recognized multiword raw expressions into a single string (such as in the given case, “bird park” and “walking distance” become “bird_park” and “walking_distance”, respectively). Then, text segmentation is performed, which analyzes lexical units (words and lemma) and contextual units (elementary context). An elementary context defines the unit of analysis (i.e., sentences, chunks or paragraphs). Here, text fragments or chunks have been used as an elementary context. Finally, selection of key terms (also called keywords) is carried out based on either TF–IDF or Chi-square analysis. Keywords generally correspond to any of the lexical units made up of content words such as nouns, adjectives, verbs, and adverbs and are selected based on a threshold value. Table 1 shows the statistics obtained by preprocessing the blog corpus, which is prepared from a set of travel blog entries collected for the city of Kuala Lumpur (KL) [71]. The motivation behind the analysis of this dataset is snippet-level processing, which means one or more sentences that contain at least one spatial relation of the form <source, spatial relation, destination> and one POI about which semantics are described. For instance, consider the example: “Thirteen kilometers north-east of Kuala Lumpur is the National Zoo. It contains hundreds of different species of animals, birds, and reptiles”. This example contains a spatial relation between Kuala Lumpur and National Zoo plus some description about what to expect in National Zoo. It is possible that a snippet may or may not contain any spatial relation. Hence, both the spatial and semantic features are dealt with separately. A total of 700 spatial relations are manually labeled in the dataset available online, the details of which can be found in previous work [48]. It is certain that the same dataset has to be used for semantics extraction as well, for which T-Lab software is utilized here to extract text snippets with POI context. Hence, for each POI, a separate small corpus is to be maintained containing all the snippets in which that POI is mentioned in the blog dataset.

Keyword Co-Word Analysis

Before proceeding to determine the semantic relatedness between keywords using the co-word analysis technique, the resultant keywords of previous steps are further processed as required. For instance, first, all lemmas were discarded for further analysis. Second, the keyword frequency threshold was reduced, and the list was manually traversed so that frequent but irrelevant keywords could be replaced by less frequent but required terms. Finally, keywords were grouped in order to merge similar terms such as “Petronas Twin Towers”, “Twin Towers”, “Towers”, “Petronas Towers”, and “Petronas”, which were all grouped into a single keyword “Petronas Towers”.
Finally, a maximum of 100 allowed keywords are utilized for the co-word analysis and concept mapping technique. The unit of co-occurrence analysis is the elementary context as defined above in corpus preparation while the association measure used for finding semantic relatedness is mutual information (MI). Co-occurrences are defined as patterns indicating the number of times two or more lexical units appear in the same elementary contexts. Resultant matrices of proximity values or dissimilarities between the lexical units can be plotted for easy interpretation using MDS as described below.

MDS Representation

MDS is a well-known data analysis technique that allows a visual interpretation of the similarity matrices revealing relationships among the data within reduced dimensions. T-Lab offers MDS Sammon’s method to represent the relationships among the lexical units [66]. The input tables are square matrices, which contain proximity values (dissimilarities) obtained from calculating the association index (MI in this case). The graphical results facilitate interpretation of co-occurrence relationships between the units as well as the dimensional space containing the patterns. The extent of comparability between the distances among points in the MDS map and the input matrix is measured by a stress function. The lower the stress value, the better the result. The stress formula (Sammon’s method) is the shown in Equation (1):
S = i j d i j d i j 2 d i j
where d*ij is the distance between two points (ij) within the input matrix and dij is the distance between the same points (ij) within Sammon’s map [66]. Figure 3 (bubble plot) and Figure 4 (dominant words) visualize MDS representation of POI (proper nouns) and feature (nouns, adjective) semantic relatedness. In Figure 3, the thematic similarity of different keywords is represented in different colors.

3.2.2. Dependency Parsing for Semantics Extraction

The phenomenon of dependency is a binary asymmetric definition that elucidates the relationship between words [34]. A dependency relationship comprises a governor word and a dependent word. For instance, the term “splendid mosque” consists of “mosque” as the governor word (head) and “splendid” as a dependent (modifier). The nodes in a dependency tree mark the syntactical class of each word whereas the labeled edges denote the ordered structure of grammatical relations between the words. There are about 50 dependency relations in CoreNLP libraries [68] represented as triplets of the form “relation name, governor term, dependent term”. As an example, in the sentence “the view is fantastic!”, there is a nominal subject relationship nsubj (fantastic, view) between the words “view” and “fantastic”.
Exploiting appropriate dependency relations contributes to the discovery of potential noun phrase semantic features, sentiment-bearing word pairs, and other useful terms. For example, Zhu et al. [36] utilized two types of dependency relations, a noun compound (nn) and adjectival modifier (amod), for identifying conceptual terms related to a tourist location, while Zhou et al. [6] exploited a nominal subject (nsubj) and adjectival complement (acomp) to extract information about hotel quality parameters. Hobel and Fogliaroni [25] targeted a verb and its context associated with a place; hence, they extracted an open clausal complement (xcomp) and a verbal modifier (vmod) for verbs and a direct object (dobj) for the context part besides amod. In the proposed framework Sem_POI, the purpose is to extract semantics as depicted in Section 3.1. Hence, the selected dependencies include the nominal subject (nsubj), direct object (dobj), adjective and adverbial modifier (amod, advmod), nominal modifier (nmod), adjective and clausal complement (xcomp), and negation (neg). These are the suitable dependency relations that have the ability to identify potential semantic features and qualifiers. A compound modifier (compound) is also chosen as it facilitates the identification of noun phrase or multi-word phrases [72]. For each dependency relation identification, certain conditions need to be fulfilled (Cause) that trigger the extraction process (Action). In the following, each utilized dependency relation has been elaborated with examples based on the description provided by Poria et al. [73,74].
i.
Nominal subject (nsubj)
Cause–Action: the target token is a syntactic subject of a verb, which means if a word ‘a’ is in a subject–noun relationship with a word ‘b’, then the relation (b, a) is extracted.
Example: (1) The views are stunning. In this example, “views” is in a subject–noun relation with “stunning”. Here, the relation (stunning, views) is extracted.
ii.
Direct object (dobj)
Cause–Action: the target token is a head verb of a direct object, which means if a word ‘a’ is in a direct nominal object relationship with a word ‘b’, then the relation (a, b) is extracted.
Example: (2) We also visited the amusement park inside this shopping centre. In this example, the relation (visited, park) is extracted.
iii.
Negation (neg)
Negation conveys important linguistic information since it generally flips the intended meaning. This condition is defined to identify a negated sense of a word.
Cause–Action: if a word is negated explicitly, which means if a word ‘a’ is negated by a negation specifier ‘b’, then the relation (b, a) is extracted.
Example: (3) The locals are not friendly. In this example, “friendly” is the head of the negated dependency, with “not” denoting the dependent. Thus, the relation (not, friendly) is extracted.
iv.
Modifiers
a. Compound modifier (compound)
Cause–Action: a noun made up of more than one noun. A noun compound modifier is a noun that modifies the head noun, which means if a noun word ‘a’ is modified by another noun word ‘b’, then the relation (b, a) is extracted.
Example: (4) We watched the fountain show at the lake. In this example, the relation (fountain, show) is extracted.
b. Adjectival and adverbial modifiers (amod, advmod)
The conditions for the targets modified by adjectives or adverbs are the same.
Cause–Action: a target token is modified by an adjective or an adverb, which means if a word ‘a’ is modified by a word ‘b’, then the relation (b, a) is extracted.
Example: (5) The square is also surrounded by some stunning colonial architecture. In this example, the relation (stunning, architecture) is extracted.
c. Nominal modifier (nmod)
Cause–Action: used for nominal modifiers of nouns or clausal predicates, which means if a noun word ‘a’ is modified by a word ‘b’ then the relation (b, a) is extracted.
Example: (6) There are many macaques around the cave temple. In this example, the relation (temple, macaques) is extracted.
v.
Adjective and clausal complement (xcomp)
These conditions are applied to verbs with either an adjective or a closed clause (having its own subject) as a complement.
Cause–Action: the target token is head verb of a complement relation, which means if a word ‘a’ is in a direct nominal object relationship with a word ‘b‘ then the relation (a, b) is extracted.
Example: (7) The tower looks spectacular at night. In this example, “looks” is the head of a clausal complement dependency, with “spectacular” denoting the dependent. Hence, the relation (looks, spectacular) is extracted.
Now consider the example blog text snippet below. Figure 5 gives a visual result of extracted dependencies by the Stanford parser [68], whereas Table 2 lists the set of selected dependency relations according to the above described rules, where each dependency relation contains the governor and modifier terms with their relevant position in the text.
“Visit the historic Hindu temples in Batu Caves.
Located 13 km north of KL, the Batu Caves are an intriguing place.
A massive limestone outcrop houses a series of caves and cave temples.
Get ready to climb the 272 steps to the main cave temple.”
Before performing dependency parsing, all blog text snippets related to one POI are accumulated in a single corpus. Then, each blog snippet is decomposed into sentences. Finally, the structure of each sentence is analyzed using a dependency parsing module. Based on the above-defined criteria, selected dependency relations are retained and the remaining ones are discarded. In each dependency pair, the governor and modifier terms can collectively conceptualize a semantic feature. However, even in the list of extracted pairs, not all features are of primary concern. Hence, a pruning step is to be applied to filter less important features and retain the stronger ones for the final graph nodes. The classic way to do this is to remove infrequent features since the terms with rare occurrences are not expected to be plausible features [75]. Another level of pruning is to determine the degree of semantic similarity of a feature with the main entity. Referring to Section 3.2.1, frequent keyword terms and their semantic relatedness with POIs have already been computed. Therefore, co-occurrence association of both governor and dependent terms in a dependency pair is determined with the respective POI. The pair is retained if the governor and dependent terms pass the defined frequency threshold, which is set to 4. This value is chosen to strike a balance between the occurrence of a POI name in the blog text, which is more than its features’ occurrences. Hence, to ensure the selection of important features, neither a very high nor a very low threshold value should be chosen Finally, the resultant dependencies are further checked to determine whether they convey same information, such as the following two dependencies compound (temples-12, cave-11) and compound (temple-12, cave-11) from two different sentences, which provide the same information with a subtle difference in the terms “temples” and “temple”. Hence, string similarity is computed, and all such similar dependencies are aggregated into a single dependency along with a mention of its occurrence score.
In order to computer a POI-centric opinion score for multi-criteria weighting, the selected dependencies “nsubj”, “amod”, “advmod”, and “xcomp” are checked as they modify the POI entity. The SentiWordNet 3.0 English lexical resource [76] is utilized to deduce the sentiment of modifier terms. It is openly available for sentiment analysis and opinion mining research. The underlying lexical database WordNet comprises nouns, adjectives, verbs, and adverbs in various cognitive concepts and associated sentiment scores [6].

3.3. POI Graph and Geographic Feature Association

Up to this point, the spatial components [48] shown in the dark shade in Figure 2 and dependency analysis-based POI features as nodes are coupled in the semantic model (Section 3.1). With semantic parsing, the narrative concepts extracted as features are multi-word expressions and hence have more informative for the end user. However, in the extracted list of dependencies, some features can be made more informative by incorporating their geographic clues. Although prepositional modifier (case) dependency provides a major hint about spatial indicators, prepositions are usually filtered at preprocessing stage during the keyword extraction process and thus cannot be extracted as a unit of information in later stages. Another useful yet rarely used dependency, a numeric modifier (nummod), can contribute to provide valuable quantitative information about tourist spots. In the proposed model (Figure 2), geographic indications about POIs and their features are required. While spatial information between POIs has been dealt with, the same framework [48] has also led to extraction of spatial feature triplets. A feature triplet is one in which the location of a feature is described with respect to some other POI or feature. For example: <hawker stalls in Jalan Alor>, <golden statue at entrance>, where the three components of a triplet are the trajector, spatial indicator, and landmark. Thus, the extracted dependency pairs <governor, modifier> are matched with the triplet table <trajector, spatial indicator, landmark>. Finally, dependency pairs that contain geo-locatable features will be replaced by the matched triplet. For example, a pair (skybridge, floor) will be transformed to (skybridge, at, 41st floor) and (monkeys, steps) to (monkeys, on, steps).

3.4. Weighted-Sum Equation Model for Multi-Criteria Weight Computation

Multi-criteria weighting is primarily based on the weighted-sum model, a popular and compelling approach to ranking alternatives against multiple criteria [77]. It presents the quantitative evaluation of the options without any bias and lets the decision-makers judge the options based on their disposition [78]. In order to evaluate options, a weighted-sum model provides an aggregated rating system that comprises the entire set of criteria. Applying this description of multi-criteria weighting approach [78] to the proposed work, the task is to formulate a collective weighting system for the nodes and edges of the POI graph, where the available POIs and routes are the options/alternatives and the different types of information attributes (popularity, spatial, and semantic content) are the criteria that would be assigned some weighting to compute a final aggregated value. It should be noted that the purpose of this step is to formulate an equation model to assign a score to graph components, not to perform an evaluation of alternatives, which is a different task. Referring to the description provided about the weighted-sum equation model [64], Equations (2) and (3) for node and edge importance, respectively, are mentioned below. The necessary details are rewritten here; the previous study should be referred to for detailed understanding of the equations.
Definition: A multi-criteria-weighted POI graph G = (V, E) with a set of nodes V and edges E and weighting functions Wnode and Wedge is defined as follows:
1)
  POI i   V   , Wnode =   { w POI i   ,   w x   , R_count, B_rate}
where w(POIi) represents the popularity of attraction POI i measured as its frequency of occurrence in the frequent sequential pattern mining (FSPM) transactions. w x is the aggregated polarity score of modifier terms. R_count is the number of reviews, and B_rate is the bubble rating retrieved from credible travel websites for attraction POI i .
W POI i = Degree Count FSPM 1   ·   w Degree , Polarity   ·   w Polarity , Rating 1   ·   w Rating ,   No .   of   Reviews Max .   Reviews   ·   w Review
Below is the pointwise detail of the weight assignment for Equation (2).
  • The function value ranges from 0 to 100, where the first two factors will be assigned 50 points and the succeeding two will be assigned the rest of the 50 points.
  • The first two factors are to be computed using travel blog data, while the other two are to be retrieved from social media.
  • Each factor is to be separately assigned a unique weight to further distribute the 50 points.
  • First, wDegree and wpolarity are assigned values of 20 and 30, respectively. Here, we want more influence of sentiment analysis than frequency-based popularity, which is why wpolarity has a higher value than wDegree.
  • Second, wRating and wReview are equally assigned a value of 10 because a greater value would not return a score in the range of 50.
  • Since the rating parameter can have a value from 1 to 5 stars, the minimum value this factor can return now is 0 and the maximum value is 40. The review ratio parameter is normalized based on the description of Yahi et al. [79] and it can return a maximum of score of 10.
  • The greater the value of W POI i , the more popular the POI.
2)
  e ij =   POI i   POI j   E, Wedge =   { w e ij   ,   w uv }
where w(eij) represents the popularity of the correlation between attractions POI i and POI j , and w u v represents the presence of any spatial information unit for the route.
W e ij =   Correlation   ·   w Correlation ,   Spatial Information   ·   w SI
  • This function value also ranges from 0 to 100, where WCorrelation and WSI are assigned values of 50 and 25, respectively.
  • The values are decided so that both factors could contribute half of the points out of 100.
  • The attribute SpatialInformation can range from 0 to 2 based on the presence or absence of spatial indicators for a route; hence, in order to have the maximum value of 50, WSI has to be equal to 25.
  • The greater the value of W e ij , the more popular the route.

4. Experiments and Results

4.1. Performance Comparison Case Study

For performance evaluation of the proposed and benchmark methods, a prominent POI named “Batu Caves” has been chosen. It is a very popular tourist attraction in the Kuala Lumpur itinerary and is consistently ranked as one of the top attractions on TripAdvisor [80] and other platforms. To begin with, a set of text snippets containing “Batu Caves” in context has been first compiled into a corpus, the details of which are mentioned in Table 3.
For a given POI, the performance outcome of a semantic feature extraction method can be classified into four possibilities as depicted in the confusion matrix (Table 4).
Using the above stated possibilities, one can define the well-known measures of Precision and Recall for the given task as shown in Equations (4) and (5):
Precision = tp tp + fp
Recall = tp tp + fn
Since there is a lack of ground truth or expert-annotated data for the exact number of semantic features for a POI computed as tp + fn; hence, a suitable solution is to use TripAdvisor review tags for Batu Caves [80]. TripAdvisor uses a sophisticated algorithm [81] for determining POI popularity rating and ranking based on reviews. The algorithm considers the quality, quantity, and recency of reviews to credibly rank a POI. The review tags are listed under the heading “Popular mentions” for each POI on the TripAdvisor website, which means that these tags are not merely for review browsing; they are actually the important keywords associated with a POI, mentioned frequently by a majority of the review writers. These tags contain a mix form of information as shown in Figure 6 for the selected POI, Batu Caves.
In order to keep relevant tags, the approach of Xu et al. [46] is adopted here, which defines two types of noises in the extracted contents, where the first type of noise is the common things, i.e., things that can be seen somewhere else. For example, ‘street’, ‘subway’, ‘shop’, etc. This noise is already dealt with if we carefully view the tags in Figure 6. The second rule is relevant to the given task, according to which one POI cannot be used as a semantic feature of another POI. Secondly, as the extraction methods are compared in terms of semantic features such as those proposed in the semantic model (Section 3.1), ten out of seventeen tags in Figure 6 have been chosen as tp. Finally, though TripAdvisor serves as a feature benchmark here, it is certain that the blog corpus would contain some true features not tagged by TripAdvisor; hence, we intuitively do not discard the tags extracted by any method if that tag corresponds to a proper entity or qualifier. Such terms are counted as tp.
The proposed method Sem_POI is compared in terms of precision and recall with naive TF, TF–IDF, frequent item-set mining, and topic models. Table 5 shows the extracted semantic terms, resultant precision, and recall of each method.

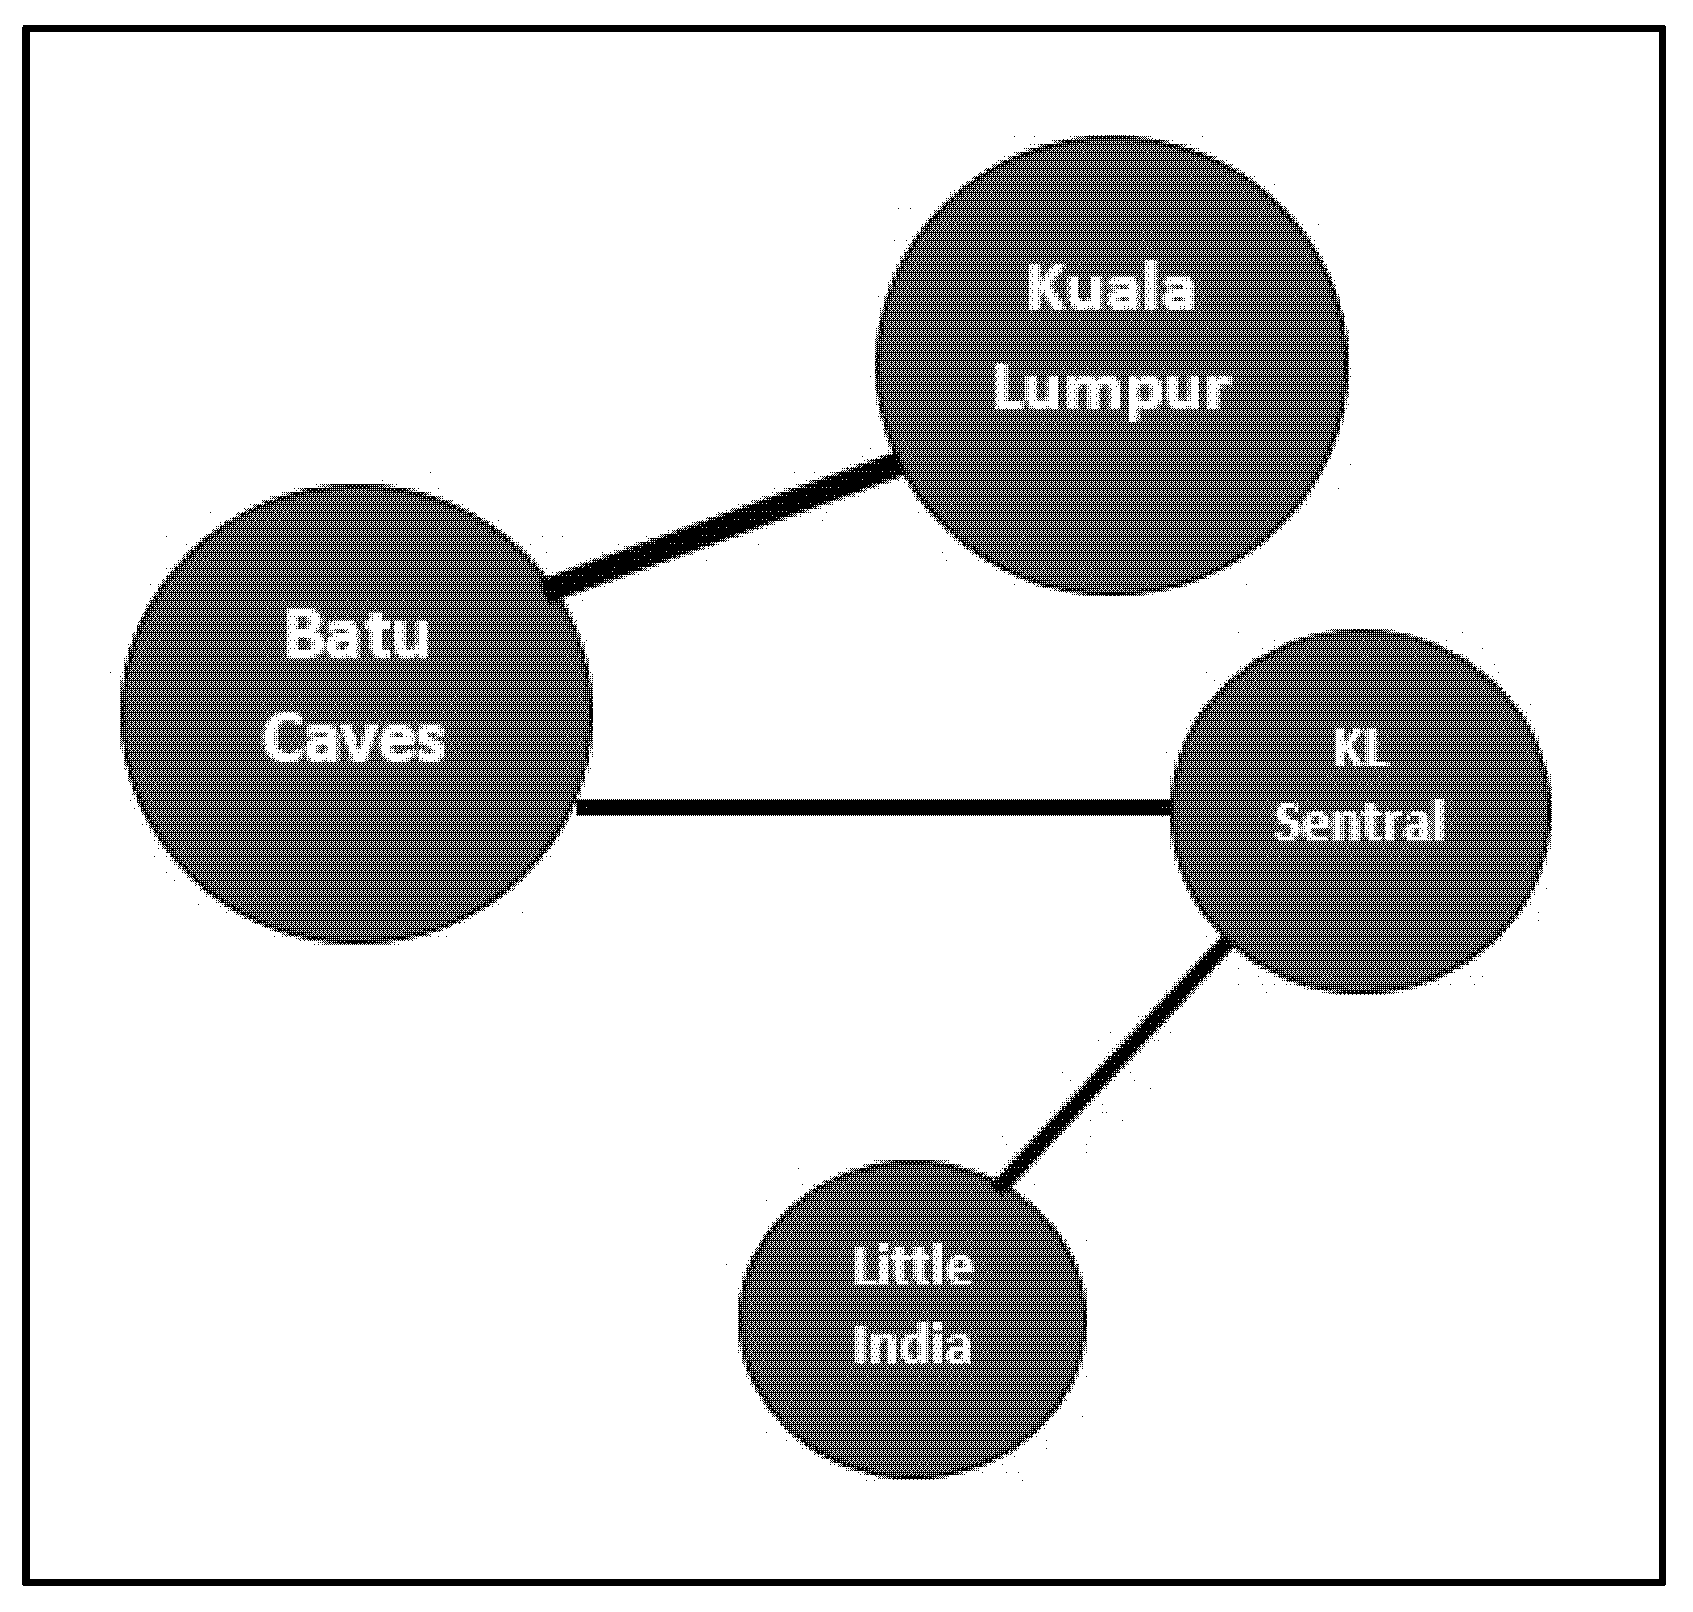
4.2. Multi-Criteria-Weighted POI Graph

For the given case study POI, Batu Caves (Section 4.1), a final multi-criteria-weighted POI graph will be constructed now using a number of steps and extracted results. They include the corresponding spatially-enriched components, dependency analysis-based POI features, and geo-features coupled into the semantic model (Section 3.1).
Finally, with the use of Equations (2) and (3), multi-criteria weights will be computed for nodes and edges, respectively (computation details provided previously [64]). Table 6 and Table 7 contain details about the parameters computed for Equations (2) and (3), respectively.
With the above-defined parameters and details, Figure 7 finally illustrates the multi-criteria-weighted POI graph for the selected POI, Batu Caves. Besides the weighting (POI weighting: node size, route weighting: edge thickness) for the POI node “Batu Caves” and the outgoing directed edges to other POI nodes “Kuala Lumpur” and “KL Sentral”, the graph also represents the selected top semantic features associated with Batu Caves. The strength or importance of a semantic feature is represented by the thickness of the node’s border. The graph components are realized based on the numeric weighting assigned to each parameter in Table 6 and Table 7; hence, changing the weighting scheme would eventually influence the importance of these parameters (influence of quantitative and qualitative parameters) in computing the multi-criteria weight. In general, the higher the value of these parameters, the greater the strength of a graph component. For instance, the higher the “Correlation Weight”, the more popular a travel pattern it would be, whereas the lower the value of the “Spatial Information” parameter, the less geographic knowledge available for that travel pattern.

4.3. Comparative Results for Other POIs

In this section, the semantics extraction results are presented for two more POIs. The first POI is the Petronas Towers and second is the KL Bird Park. Both POIs are popular landmarks but with a different semantic category. The first POI is an architectural attraction whereas the second is an outdoor, nature-oriented spot. A similar experimental evaluation approach is adopted for these POIs as presented in Section 4.1 and Section 4.2. Figure 8 and Figure 9 represent the TripAdvisor review tags for Petronas Towers [82] and KL Bird Park [83] used for computing the tp, tf, and fp for each extraction result. The final outputs are presented in Table 8 and Table 9 for Petronas Towers and KL Bird Park, respectively. Here, the top 10 tags extracted by each method are mentioned. The performance of Sem_POI is better than the benchmark BOW and frequency-based methods in these two cases as well. While TF–IDF performs better than other methods, the lack of semantic dependence is visible from the extracted tags, where the results of Sem_POI are expressive and meaningful in describing the potential features of both POIs. Section 5 presents a detailed analysis of the extracted tags, resultant graph, and their significance, which provides a clear outline for analyzing the results presented here.

5. Discussion and Implications

The discussion section elaborates on the results and outlooks in three parts. First is the proposed semantics extraction methodology. Next is the visualization of the results, and last is the practical implications of the study for the tourism domain at large.

5.1. Semantics Extraction

The theoretical idea emphasized in this research is that POIs’ occurrence frequency is a depiction of their popularity, which provides the rationale for semantics extraction. The typical frequency-based analysis of travel blog content is considerably improved by incorporating contextual and syntactical analysis. This approach genuinely illustrates the popularity of a POI in terms of its associated features and opinions on top of frequency. Moreover, the presence of semantic correlation among the extracted concepts eventually enhances the resultant graph representation (discussed in the next section).
On a methodical level, the results presented in Table 5, Table 8 and Table 9 show that the proposed semantics extraction approach Sem_POI outperforms the other methods. TF, TF–IDF, and frequent pattern mining gave average outcome; however, the topic model suffered from poor performance. There are certain reasons for the poor performance of the baseline approaches. With typical vector space representation of a text document, each word is considered a single unit of information, which disregards the contextual dependencies of words on each other [27,50,84]. The extracted knowledge will be less meaningful as a result of ignoring the relation between words. Hence, BOW-based approaches lack the ability to express the semantic structure of text. In existing methods utilized in tourism and related research areas, such as those proposed by Hao et al. [58], Adams and McKenzie [60], Pang et al. [85], Kim, Ihm and Myaeng [86], and Liu et al. [87], the extracted information units are independent and are unable to convey unified semantic meaning. Hence, natural language techniques are inevitable to overcome this drawback and accurately model textual content. Here, semantic dependencies between words are parsed to generate multiword information chunks for better understanding of the end user [36].
Additionally, the semantic parsing approaches in the tourism domain usually utilized noun and adjectival dependencies, stating them as the most conceptual relations [6,36]. However, in the case of a tourist attraction, a number of attributes need to be known for planning an optimal trip. This not only includes the knowledge of frequently visited attractions that are geographically accessible from the target attraction, but also the topical themes, activities, sentiments, and prominent geo-features associated with them. The proposed method Sem_POI utilized eight dependency relations and resulted in better semantic feature extraction. Nonetheless, Sem_POI still suffered a slight drop in recall when taking TripAdvisor as the benchmark. This is because in the end, features are filtered based on keyword frequency, and this is highly dependent on underlying data about what features are popularly discussed. It is possible that certain important terms are not mentioned frequently [27]. As an example, the feature “dark cave” has not been extracted by Sem_POI for Batu Caves since this feature is not mentioned frequently in collected blogs, while reviews are continuously generated on a daily basis and are updated accordingly on travel platforms, so it is certain that “dark cave” would be a popular feature among travelers these days.

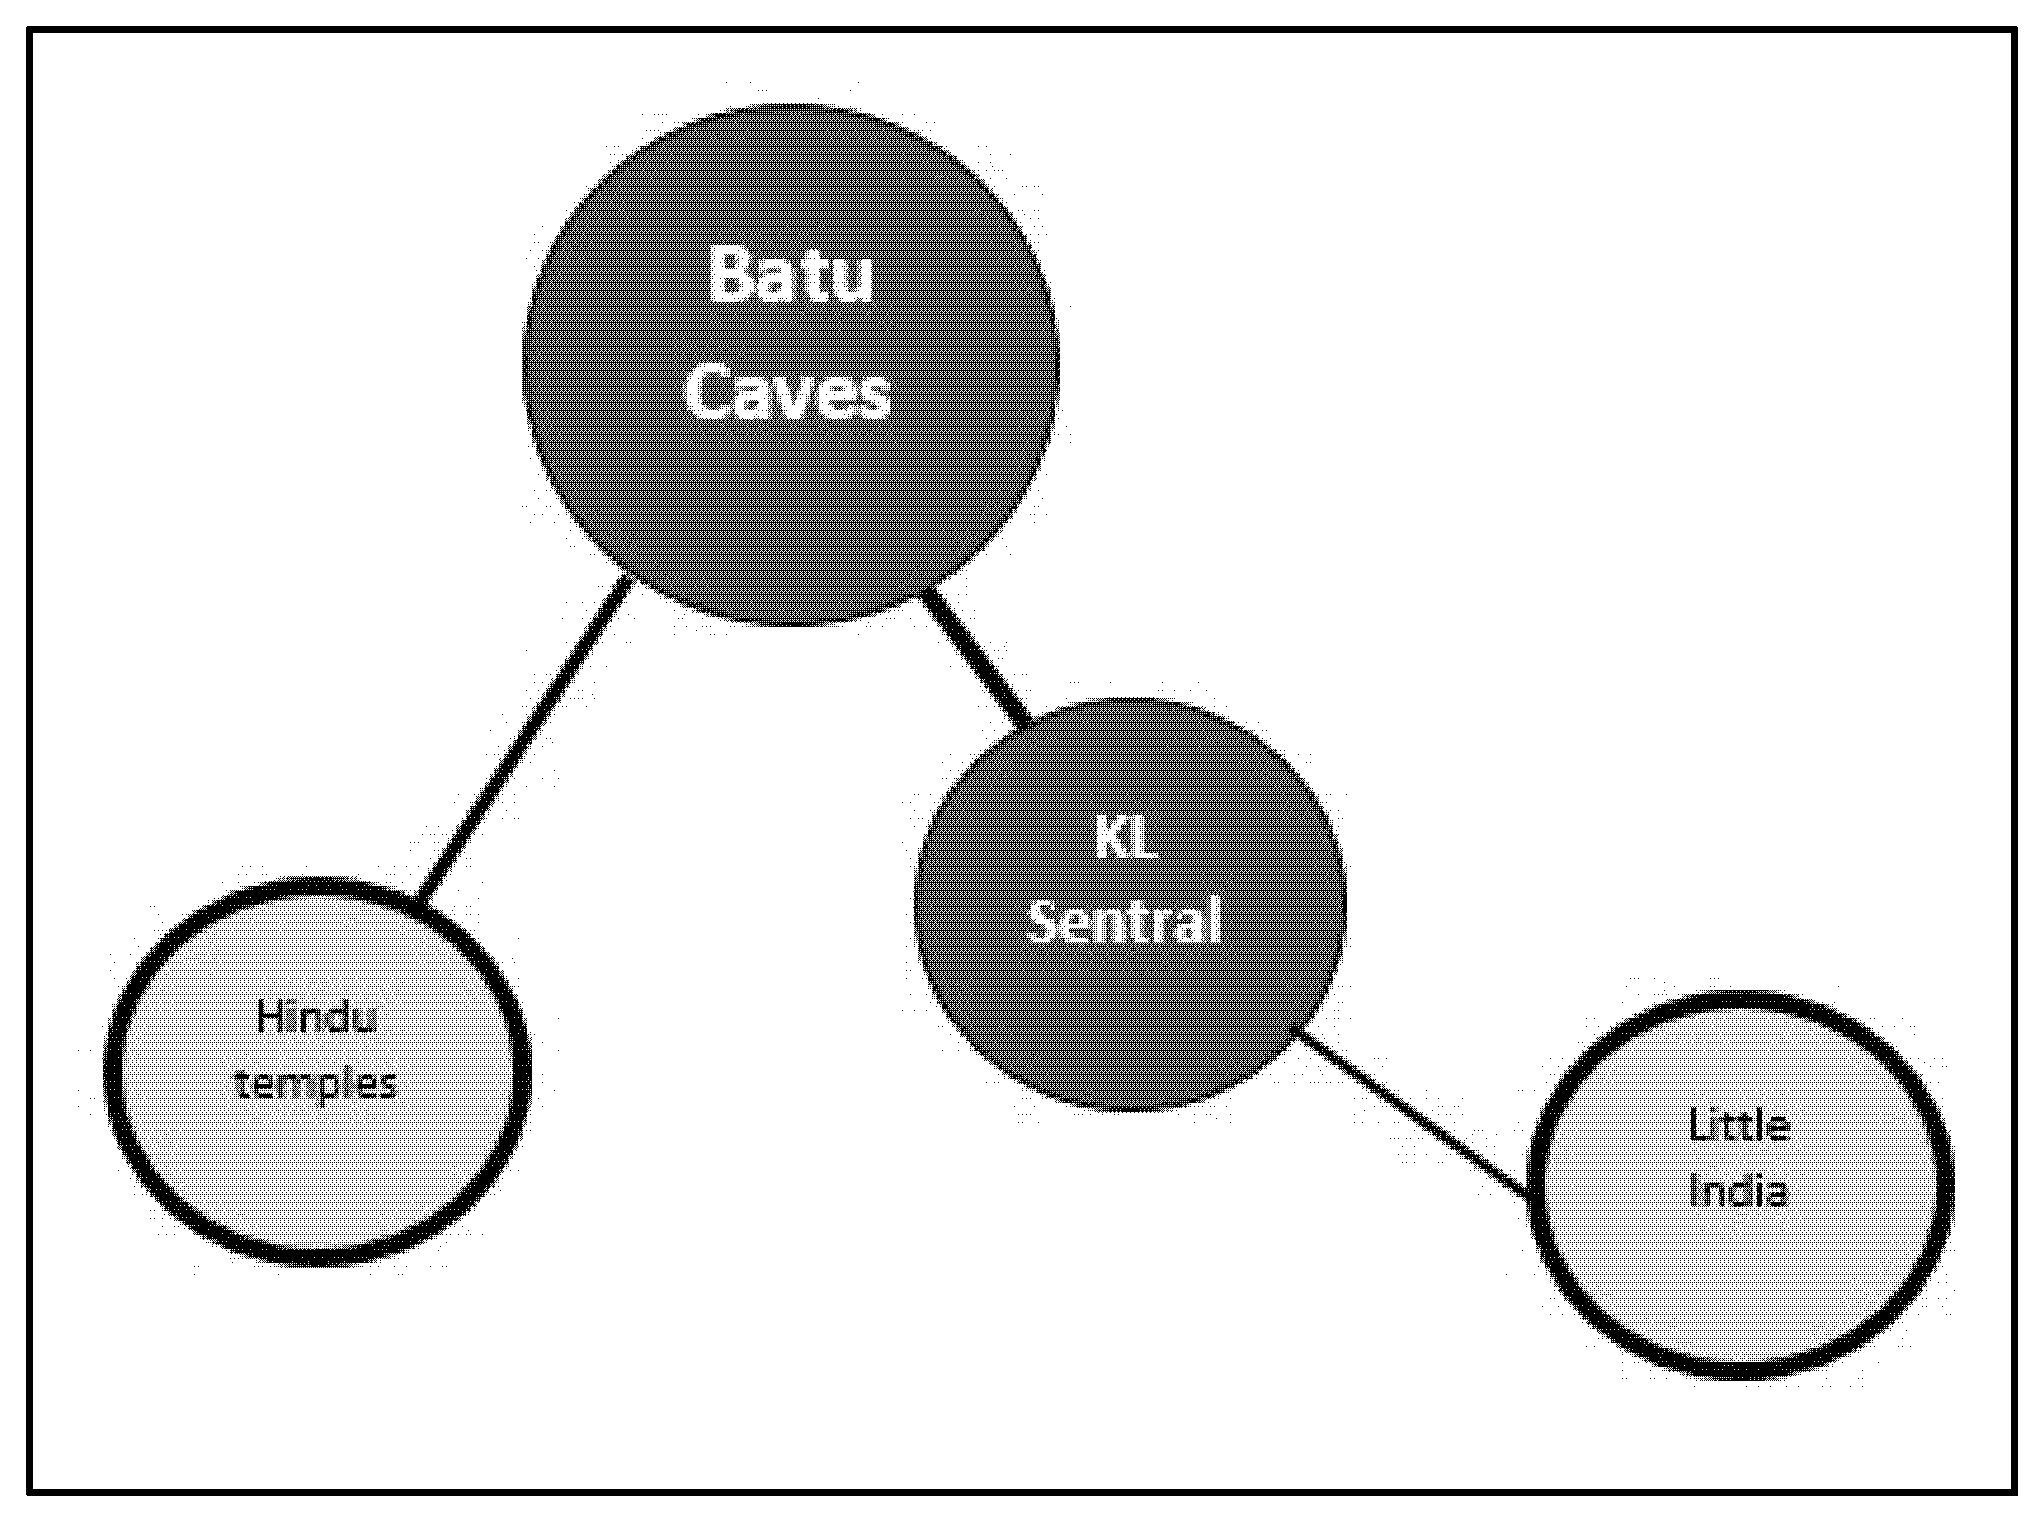
5.2. Graph Visualization

The final result of the proposed workflow is the representation of extracted semantics. For a user-centered outcome, comprehensive visualization is indispensable as it turns the tedious text description into interesting and compelling images to facilitate identification of key information [17], whereas an inappropriate application of a visualization method can pervert the understanding of readers [27]. In the case of tourism information visualization, it is necessary to examine the presence of relationships between various concepts. The relationship is then generally modeled as a network or property graph such as the conventional frequency-based POI graph (Section 2.1). The other way is to emphasize the semantic concepts using word clouds, heatmaps, concept graphs, MDS or similar techniques (Section 2.2). The significance of resultant visualization in Figure 7 is justified from the fact that it encompasses both forms of information representations. The narrative focus is reflected from the sequential movement patterns with spatial knowledge, whereas contextual focus is illustrated through semantic attributes. Together, they contribute to the enrichment of the edges and nodes of a typical frequency-based POI graph that consequently leads to the development of a multi-criteria-weighted POI graph. The formulation of weight computation for the nodes and edges is driven by defining scoring functions that include both the quantitative and qualitative measures of knowledge and popularity.
The multi-criteria-weighted POI graph is a significant enhancement over the approaches described in Section 2.1. The closest baselines for comparison from the perspective of graph representation are the contributions of Kori et al. [45], Xu et al. [46], Guo et al. [47] and Yuan et al. [20]. The mentioned baselines proposed variants of frequent pattern mining and created graphs of popular POIs while specific representations are the route context [45], frequent departure cities [47], things-to-do [46,47], and geographically close POIs [20]. The graph models of each method are redrawn in Figure 10, Figure 11 and Figure 12 according to the case study POI, Batu Caves to provide an abstract idea; actual graph images in respective papers should be referred to for accurate analysis. The difference can be perceived in terms of the level of knowledge a graph possesses about POIs and routes, and ease in interpretation, which means the structure and organization of knowledge in the graph to enable understanding and facilitate travel planning. Table 10 also concisely presents the differences between the proposed and existing POI graph representations.
In comparison, the proposed scheme of multi-criteria-weighted POI graph has not only focused on information extraction methodology for edges [48] and node enrichment, it has also focused on the completeness of extracted results that would enhance representation of the overall graph. The latter point provides an improved semantic illustration in contrast to the literature described in Section 2.2. The frequency and relatedness of graph components should not be the sole concern; an output graph should simplify travel decision-making. The choice of POIs or route while itinerary planning is influenced by a variety of factors besides popularity. The geographic proximity of tourist attractions is yet another key consideration, such as for planning a walking or self-guided tour under cost or time restrictions or during the transit time of a flight. Another example can be derived from the given case study (Figure 7); the feature “272 stairs to top” indicates that one needs to climb 272 stairs to reach the cave temple. While this feature would be an adventure for most of the people, it may revert some travelers from planning to visit the top in the case of time or weather constraints, physical disability, age or health-associated issues. One more important implication can be drawn by visualizing the tourism profile of Batu Caves as a tourist attraction, which would generally appeal to visitors with cultural, historical, and religious interests. Finally, it should be noted that the results of semantics extraction have realized the consequent graph. Thus, it is necessary to exploit sophisticated methods that can consider the worth of less-frequent semantic features, such as “dark cave” (as discussed in Section 5.1); the contextual similarity of features, such as “shrines” and “temples”; and the inference of features. The inference can be explained by an example that Batu Caves is a sacred site, which would certainly be associated with some traditional event or festival at some point of time during the year, such as the “Thaipusam Festival”, which should be extracted as a semantic feature. Hence, visualizing such information would further smooth travel decision-making.

5.3. Tourism Research and Practice

The implications of this study for the tourism domain are linked to its multiple areas. From the utilization of travel blogs and application of textual analysis techniques, to studying tourists’ mobility and portrayed attraction profile, there are possible insights for tourists as well as tourism practitioners.
Travel blogs serve as a potential and influential resource for tourism industry, both at individual and managerial levels. Studies have referred to travel blogs as a sound medium to promote information exchange among travelers [5,20,37,88]. Andrade and Sobata [89] identified blogs as the second most important resource in travel products and services consumption; the results deduced “Itineraries and Attractions” along with “Transportation and Locomotion” to be the most relevant aspects of travel blog content. The utilization of any online information source influences travel planning decisions, which consequently affect opinions regarding tourist destinations [90]. Travel blogs appear to be a persuasive channel to assess destination image [40,89] along with consumer behavior. To sum up, our study has analyzed travel blogs to efficiently exploit the travel experience as the postconsumption behaviour of bloggers, their knowledge, opinion, and key preferences about the attractions and produced outcomes that can clearly indicate the essential and relevant information needed while planning travel itineraries.
The next important aspect is the selection of suitable techniques to achieve acceptable results. The abundant content of travel blogs has attracted scholars to conduct a variety of analytical studies. While most of the approaches have now adopted content analysis and text mining techniques instead of typical customer survey methods for accurate interpretation, unstructured text processing is still a challenge owing to language flexibility and vagueness [27]. Depending on the underlying objectives, sophisticated analysis methods are inevitable to make sense of travel data. Li et al. [50] pointed out the feasibility of applying NLP in tourism recommendations and decision-making. Our framework sets the integration of content analysis and NLP. The keywords co-word analysis has determined high-frequency tourist hotspots, thematic topics, and sentiments terms, whereas NLP allowed us to incorporate a semantic sense in the independent pieces of information. The eventual graph visualization together with spatially enriched tourist movement patterns illustrates findings in a constructive manner, enabling us to bypass layers of texts. It will expedite the cognitive process of end-users and facilitate faster manipulation of travel information leading to effective decisions. The study-specific examples and suggestions are discussed in Section 5.1 and Section 5.2. Effective visual summaries can be generated for other types of tourism domain texts such as travel guidebooks, descriptions on official tourism websites, and lengthy online reviews. The resultant semantics represent various characteristics of a trip; hence, one more useful implication is to combine these characteristics with individual travelers’ attributes to propose personalized trip plans. Similarly, the results can be effectively integrated with the knowledge of nearby accommodations and transportation hubs since tourist attractions are usually referred to with respect to the lodging and transport options in proximity. The results would be highly beneficial for service providers in developing complete traveling packages. Below is an account of the practical implications of our framework in greater areas of tourism management.
Tourist movement patterns communicate and convey a lot more insight than merely a connection between visited attractions. The knowledge of bloggers’ mobility and projected attraction profile has possible applications to improve tourism service provisions and destination management activities, such as providing accommodation facilities, revamping transport infrastructure in areas with high tourist flow or planning shopping centers [91,92]. A plausible analysis will assist tourism practitioners in areas such as adjusting resource allocation, predicting tourism demand, and market composition of tourist areas [50]. In summary, it is apparent that tourism is a socio-economic practice with evident impact on the space where it takes place [93]. Thus, we need such systems that can facilitate understanding of the geospatial and semantic aspects of tourist places. Finally, there is a noteworthy connection between tourists’ mobility and tourism sustainability owing to the environmental impacts of travelling. Bloggers’ spatial patterns manifest their behavior, perception, and interaction with places [94]. Hence, extracting information regarding their trips, preferred attractions, transit modes, and played activities will help identify the influence of tourism on the environment and mandating effective policies for attraction management to foster sustainable tourism. Another relevant discipline is the urban morphology [95], which is relevant here in terms of examining the functionality of urban tourist areas. Tourist spots are an essential part of urban spaces; hence, studying tourists’ trajectories and their attributed semantic sense to places at large will assist in sustainable urban development.

6. Conclusions

The theoretical notion emphasized in this research is that POIs’ occurrence frequency depicts their popularity, which provides rationale for semantics extraction. Our proposed framework offers the extraction of semantic features using content analysis along with NLP and output visualization as a multi-criteria-weighted POI graph. The keywords co-word analysis has determined high-frequency tourist hotspots, thematic topics, and sentiments terms, whereas NLP allowed us to incorporate semantic sense in the independent pieces of information. The approach genuinely illustrates the popularity of a POI in terms of its associated features and opinions on top of frequency. The final multi-criteria-weighted POI graph is a significant enhancement over typical frequency-based analysis and visualization of tourist attractions and routes. Though weighted sum is a simple technique, it is a compelling and non-biased multi-criteria weighting method used to date and is applied here in the context of a POI graph’s component weighting. The results are of profound importance for planning a trip to a new destination when information overload may overwhelm the readers. Besides, there are potential insights for practice in domains where analysis of tourists’ movement and preferences is necessary to explore new possibilities of improving tourism service systems.
The study has some limitations that provide workable directions for future research. First, the lack of a benchmark dataset with labeled place semantic features has limited the evaluation of our framework. Second, the semantics extraction can further be improved in the direction of feature-specific opinion mining. Finally, the resultant multi-criteria-weighted POI graph has not been subjected to a qualitative user study to assess its usefulness for travel decision-making in the real world. Although the effectiveness of the multi-criteria-weighted POI graph can be perceived by comparing with the existing graph representations, it is ideal to subjectively evaluate the graph using primitive trip planning parameters.

Author Contributions

Erum Haris: Conceptualization, data curation, formal analysis, methodology, software, validation, writing—original draft, review and editing. Keng Hoon Gan: Conceptualization, supervision, validation, writing—review. All authors have read and agreed to the published version of the manuscript.

Funding

The APC is covered by School of Computer Sciences, Universiti Sains Malaysia.

Institutional Review Board Statement

Not applicable.

Informed Consent Statement

Not applicable.

Data Availability Statement

The dataset created for this study [71] is openly available in Mendeley Data Repository at https://data.mendeley.com/datasets/9wb5rv45j5/1, accessed on 19 September 2021.

Conflicts of Interest

The authors have no conflict of interest to declare.

References

  1. Gretzel, U.; Zhong, L.; Koo, C. Application of smart tourism to cities. Int. J. Tour. Cities 2016, 2. [Google Scholar] [CrossRef]
  2. Pesonen, J.; Neidhardt, J. Special issue: Perspectives on eTourism. Inf. Technol. Tour. 2020, 22, 1–3. [Google Scholar] [CrossRef] [Green Version]
  3. Bizirgianni, I.; Dionysopoulou, P. The influence of tourist trends of youth tourism through social media (SM) & information and communication technologies (ICTs). Procedia-Soc. Behav. Sci. 2013, 73, 652–660. [Google Scholar]
  4. Xiang, Z.; Wang, D.; O’Leary, J.T.; Fesenmaier, D.R. Adapting to the Internet: Trends in travelers’ use of the Web for trip planning. J. Inf. Sci. 2014, 54, 511–527. [Google Scholar] [CrossRef]
  5. Wu, M.Y.; Pearce, P.L. Tourism blogging motivations: Why do Chinese tourists create little “Lonely Planets”? J. Travel Res. 2016, 55, 537–549. [Google Scholar] [CrossRef]
  6. Zhou, X.; Wang, M.; Li, D. From stay to play–A travel planning tool based on crowdsourcing user-generated contents. Appl. Geogr. 2017, 78, 1–11. [Google Scholar] [CrossRef]
  7. Ukpabi, D.C.; Karjaluoto, H. What drives travelers’ adoption of user-generated content? A literature review. Tour. Manag. Perspect. 2018, 28, 251–273. [Google Scholar] [CrossRef]
  8. Leung, R.; Vu, H.Q.; Rong, J. Understanding tourists’ photo sharing and visit pattern at non-first tier attractions via geotagged photos. Inf. Technol. Tour. 2017, 17, 55–74. [Google Scholar] [CrossRef]
  9. Liu, Y.; Sui, Z.; Kang, C.; Gao, Y. Uncovering patterns of inter-urban trip and spatial interaction from social media check-in data. PLoS ONE 2014, 9, e86026. [Google Scholar] [CrossRef] [PubMed]
  10. Wallgrün, J.O.; Klippel, A.; Baldwin, T. Building a corpus of spatial relational expressions extracted from web documents. In Proceedings of the 8th Workshop on Geographic Information Retrieval, Dallas, TX, USA, 4–7 November 2014. [Google Scholar]
  11. Kuzey, E.; Weikum, G. Extraction of temporal facts and events from Wikipedia. In Proceedings of the 2nd ACM Temporal Web Analytics Workshop, Lyon, France, 17 April 2012; pp. 25–32. [Google Scholar]
  12. Toral, S.L.; Martínez-Torres, M.R.; Gonzalez-Rodriguez, M.R. Identification of the unique attributes of tourist destinations from online reviews. J. Travel Res. 2018, 57, 908–919. [Google Scholar] [CrossRef]
  13. Kasper, W.; Vela, M. Sentiment analysis for hotel reviews. In Proceedings of the Computational Linguistics-Applications Conference, Jachranka, Poland, 17–19 October 2011; pp. 45–52. [Google Scholar]
  14. Garcia-Pablos, A.; Cuadros, M.; Linaza, M.T. Automatic analysis of textual hotel reviews. Inf. Technol. Tour. 2016, 16, 45–69. [Google Scholar] [CrossRef]
  15. Guo, Y.; Barnes, S.J.; Jia, Q. Mining meaning from online ratings and reviews: Tourist satisfaction analysis using latent Dirichlet allocation. Tour. Manag. 2017, 59, 467–483. [Google Scholar] [CrossRef] [Green Version]
  16. Marine-Roig, E.; Soto, M.T.R.; Clavé, S. Cognitive city maps through user-generated content. In Proceedings of the 5th Interdisciplinary Tourism Research Conference, Cartagena, Spain, 6–11 June 2017; pp. 483–488. [Google Scholar]
  17. Hou, Z.; Cui, F.; Meng, Y.; Lian, T.; Yu, C. Opinion mining from online travel reviews: A comparative analysis of Chinese major OTAs using semantic association analysis. Tour. Manag. 2019, 74, 276–289. [Google Scholar] [CrossRef]
  18. Mena, R.A.; Ornelas, E.L. Geo information extraction and processing from travel narratives. In Proceedings of the 14th International Conference on Electronic Publishing, Helsinki, Finland, 16–18 June 2010; pp. 363–373. [Google Scholar]
  19. Bosangit, C.; Hibbert, S.; McCabe, S. If I was going to die I should at least be having fun: Travel blogs, meaning and tourist experience. Ann. Tour. Res. 2015, 55, 1–14. [Google Scholar] [CrossRef] [Green Version]
  20. Yuan, H.; Xu, H.; Qian, Y.; Li, Y. Make your travel smarter: Summarizing urban tourism information from massive blog data. Int. J. Inf. Manag. 2016, 36, 1316–1319. [Google Scholar] [CrossRef]
  21. Puhringer, S.; Taylor, A. A practitioner’s report on blogs as potential sources for destination marketing intelligence. J. Vacat. Mark. 2008, 14, 177–187. [Google Scholar] [CrossRef]
  22. Nanba, H.; Taguma, H.; Ozaki, T.; Kobayashi, D.; Ishino, A.; Takezawa, T. Automatic compilation of travel information from automatically identified travel blogs. In Proceedings of the ACL-IJCNLP Conference Short Papers, Singapore, 4 August 2009; pp. 205–208. [Google Scholar]
  23. Blaschke, T.; Merschdorf, H.; Cabrera-Barona, P.; Gao, S.; Papadakis, E.; Kovacs-Györi, A. Place versus space: From points, lines and polygons in GIS to place-based representations reflecting language and culture. ISPRS Int. J. Geo-Inf. 2018, 7, 452. [Google Scholar] [CrossRef] [Green Version]
  24. Purves, R.; Edwardes, A.; Wood, J. Describing place through user generated content. First Monday 2011, 16. [Google Scholar] [CrossRef] [Green Version]
  25. Hobel, H.; Fogliaroni, P. Extracting semantics of places from user generated content. In Proceedings of the 19th AGILE International Conference on Geographic Information Science, Helsinki, Finland, 14–17 June 2016. [Google Scholar]
  26. Hu, Y. Geospatial semantics. In Comprehensive Geographic Information Systems; Huang, B., Cova, T.-J., Tsou, M.-H., Eds.; Elsevier: Oxford, UK, 2017. [Google Scholar]
  27. Hu, Y. Geo-text data and data-driven geospatial semantics. Geogr. Compass 2018, 12, e12404. [Google Scholar] [CrossRef] [Green Version]
  28. Alazzawi, A.; Abdelmoty, A.; Jones, C. What can I do there? Towards the automatic discovery of place-related services and activities. Int. J. Geogr. Inf. Sci. 2012, 26, 345–364. [Google Scholar] [CrossRef] [Green Version]
  29. Marine-Roig, E. Destination image analytics through traveller-generated content. Sustainability 2019, 11, 3392. [Google Scholar] [CrossRef] [Green Version]
  30. Park, D.H.; Lee, J. eWOM overload and its effect on consumer behavioral intention depending on consumer involvement. Electron. Commer. Res. Appl. 2008, 7, 386–398. [Google Scholar] [CrossRef]
  31. Rodriguez, M.G.; Gummadi, K.; Schoelkopf, B. Quantifying information overload in social media and its impact on social contagions. In Proceedings of the Eighth International AAAI Conference on Weblogs and Social Media, Ann Arbor, MI, USA, 1–4 June 2014. [Google Scholar]
  32. Kim, H.Y.; Yoon, J.-H. Examining national tourism brand image: Content analysis of Lonely Planet Korea. Tour. Rev. 2013, 68, 56–71. [Google Scholar]
  33. Shao, J.; Chang, X.; Morrison, A.M. How can big data support smart scenic area management? An analysis of travel blogs on Huashan. Sustainability 2017, 9, 2291. [Google Scholar] [CrossRef] [Green Version]
  34. Kao, A.; Poteet, S.R. Natural Language Processing and Text Mining; Springer: Berlin/Heidelberg, Germany, 2007. [Google Scholar]
  35. Andrienko, G.; Andrienko, N.; Weibel, R. Geographic data science. IEEE Comput. Graph. Appl. 2017, 37, 15–17. [Google Scholar] [CrossRef] [Green Version]
  36. Zhu, Z.; Shou, L.; Chen, K. Get into the spirit of a location by mining user-generated travelogues. Neurocomputing 2016, 204, 61–69. [Google Scholar] [CrossRef]
  37. Sigala, M.; Christou, E.; Gretzel, U. Social Media in Travel, Tourism and Hospitality: Theory, Practice and Cases; Ashgate: Farnham, UK, 2012. [Google Scholar]
  38. Blaer, M.; Frost, W.; Laing, J. The future of travel writing: Interactivity, personal branding and power. Tour. Manag. 2020, 77, 104009. [Google Scholar] [CrossRef]
  39. Munar, A.M.; Jacobsen, J.K.S. Trust and involvement in tourism social media and web-based travel information sources. Scand. J. Hosp. Tour. 2013, 13, 1–19. [Google Scholar] [CrossRef]
  40. Tang, Y.; Zhong, M.; Qin, H.; Liu, Y.; Xiang, L. Negative word of mouth about foreign lands: Dimensions of the shared discomforts narrated in travel blogs. J. Glob. Fash. Mark. 2019, 29, 311–329. [Google Scholar] [CrossRef]
  41. Chandralal, L.; Rindfleish, J.; Valenzuela, F. An application of travel blog narratives to explore memorable tourism experiences. Asia Pac. J. Tour. Res. 2014, 20, 680–693. [Google Scholar] [CrossRef]
  42. Tseng, C.; Wu, B.; Morrison, A.M.; Zhang, J.; Chen, Y.C. Travel blogs on China as a destination image formation agent: A qualitative analysis using Leximancer. Tour. Manag. 2015, 46, 347–358. [Google Scholar] [CrossRef]
  43. Banyai, M.; Glover, T.D. Evaluating research methods on travel blogs. J. Travel Res. 2012, 51, 267–277. [Google Scholar] [CrossRef]
  44. Cohen, S.A.; Prayag, G.; Moital, M. Consumer behaviour in tourism: Concepts, influences and opportunities. Curr. Issues Tour. 2014, 17, 872–909. [Google Scholar] [CrossRef] [Green Version]
  45. Kori, H.; Hattori, S.; Tezuka, T.; Tanaka, K. Automatic generation of multimedia tour guide from local blogs. In Proceedings of the 13th International Conference on Multimedia Modeling, Singapore, 9–12 January 2007; pp. 690–699. [Google Scholar]
  46. Xu, H.; Yuan, H.; Ma, B.; Qian, Y. Where to go and what to play: Towards summarizing popular information from massive tourism blogs. J. Inf. Sci. 2015, 41, 830–854. [Google Scholar] [CrossRef]
  47. Guo, L.; Li, Z.; Sun, W. Understanding travel destinations from structured tourism blogs. In Proceedings of the 14th Wuhan International Conference on e-Business, Hubei, China, 19–21 June 2015; p. 80. [Google Scholar]
  48. Haris, E.; Gan, K.H.; Tan, T.-P. Spatial information extraction from travel narratives: Analyzing the notion of cooccurrence indicating closeness of tourist places. J. Inf. Sci. 2020, 46, 581–599. [Google Scholar] [CrossRef]
  49. Gabrilovich, E.; Markovitch, S. Feature generation for text categorization using world knowledge. In Proceedings of the 19th International Joint Conference on Artificial Intelligence, Edinburgh, UK, 30 July–5 August 2005; pp. 1048–1053. [Google Scholar]
  50. Li, Q.; Li, S.; Zhang, S.; Hu, J.; Hu, J. A review of text corpus-based tourism big data mining. Appl. Sci. 2019, 9, 3300. [Google Scholar] [CrossRef] [Green Version]
  51. Kumar, M.; Vig, R. Term-frequency inverse-document frequency definition semantic (TIDS) based focused web crawler. In Global Trends in Information Systems and Software Applications. ObCom 2011. Communications in Computer and Information Science; Krishna, P.V., Babu, M.R., Ariwa, E., Eds.; Springer: Berlin/Heidelberg, Germany, 2012; Volume 270. [Google Scholar]
  52. Murakami, K.H.; Kawamura, H.; Suzuki, K. Earthquake’s influence on inbound tourism: Voices from the travel blogs. Sustain. Tour. V WIT Trans. Ecol. Environ. 2012, 161, 43–53. [Google Scholar]
  53. Li, Y.R.; Lin, Y.C.; Tsai, P.H.; Wang, Y.Y. Traveller-Generated Contents for destination image formation: Mainland China travellers to Taiwan as a case study. J. Travel Tour. Mark. 2015, 32, 518–533. [Google Scholar] [CrossRef]
  54. Pons-Porrata, A.; Berlanga-Llavori, R.; Ruiz-shulcloper, J. Topic discovery based on text mining techniques. Inf. Process. Manag. 2007, 43, 752–768. [Google Scholar] [CrossRef]
  55. Fournier-Viger, P.; Lin, J.C.-W.; Kiran, R.U.; Koh, Y.S.; Thomas, R. A survey of sequential pattern mining. Data Sci. Pattern Recognit. 2017, 1, 54–77. [Google Scholar]
  56. Kurashima, T.; Tezuka, T.; Tanaka, K. Blog map of experiences: Extracting and geographically mapping visitor experiences from urban blogs. In Proceedings of the 6th International Conference on Web Information Systems Engineering, New York, NY, USA, 20–22 November 2005; pp. 496–503. [Google Scholar]
  57. Blei, D.M.; Ng, A.Y.; Jordan, M.I. Latent Dirichlet Allocation. J. Mach. Learn. Res. 2003, 3, 993–1022. [Google Scholar]
  58. Hao, Q.; Cai, R.; Wang, C.; Xiao, R.; Yang, J.M.; Pang, Y.; Zhang, L. Equip tourists with knowledge mined from travelogues. In Proceedings of the 19th International World Wide Web Conference, Raleigh, NC, USA, 26–30 April 2010; pp. 40–410. [Google Scholar]
  59. Wang, C.; Wang, J.; Xie, X.; Ma, W.Y. Mining geographic knowledge using location aware topic model. In Proceedings of the 4th ACM Workshop on Geographic Information Retrieval, Lisbon, Portugal, 9 November 2007; pp. 65–70. [Google Scholar]
  60. Adams, B.; McKenzie, G. Inferring thematic places from spatially referenced natural language descriptions. In Crowdsourcing Geographic Knowledge: Volunteered Geographic Information (VGI) in Theory and Practice; Sui, D., Elwood, S., Goodchild, M., Eds.; Springer: Dordrecht, The Netherlands, 2013; pp. 201–221. [Google Scholar]
  61. Schuster, S.; Manning, C.D. Enhanced English universal dependencies: An improved representation for natural language understanding tasks. In Proceedings of the Tenth International Conference on Language Resources and Evaluation, Portorož, Slovenia, 23–28 May 2016. [Google Scholar]
  62. Nakatoh, T.; Yin, C.; Hirokawa, S. Extraction and disambiguation of name of place from tourism blogs. In Proceedings of the First ACIS International Symposium on Software and Network Engineering, Seoul, Korea, 19–20 December 2011; pp. 73–78. [Google Scholar]
  63. Nakatoh, T.; Yin, C.; Hirokawa, S. Analysis and visualization of tourism blog. In Proceedings of the IIAI International Symposium on Applied Informatics, Fukuoka, Japan, 20–22 September 2012; pp. 26–27. [Google Scholar]
  64. Haris, E.; Gan, K.H. Framework of blog data based multi-criteria weighted points of interest graph for trip planning. Intell. Decis. Technol. 2018, 12, 1–10. [Google Scholar] [CrossRef]
  65. Scheider, S.; Janowicz, K. Place reference systems. Appl. Ontol. 2014, 9, 97–127. [Google Scholar] [CrossRef]
  66. Lancia, F. T-LAB Tools for Text Analysis. 2017. Available online: http://tlab.it/en/presentation.php (accessed on 5 May 2018).
  67. Benites-Lazaro, L.L.; de MelloThéry, N.A.; Lahsen, M. Business storytelling in energy and climate change: The case of Brazil’s ethanol industry. Energy Res. Soc. Sci. 2017, 31, 77–85. [Google Scholar] [CrossRef]
  68. Manning, C.D.; Surdeanu, M.; Bauer, J.; Finkel, J.; Bethard, S.J.; McClosky, D. The Stanford CoreNLP natural language processing toolkit. In Proceedings of the 52nd Annual Meeting of the Association for Computational Linguistics: System Demonstrations, Baltimore, MD, USA, 23–24 June 2014; pp. 55–60. [Google Scholar]
  69. Zhao, W.; Mao, J.; Lu, K. Ranking themes on co-word networks: Exploring the relationships among different metrics. Inf. Process. Manag. 2018, 54, 203–218. [Google Scholar] [CrossRef]
  70. Khasseh, A.A.; Soheili, F.; Moghaddam, H.S.; Chelak, A.M. Intellectual structure of knowledge in iMetrics. Inf. Process. Manag. 2017, 53, 705–720. [Google Scholar] [CrossRef]
  71. Haris, E.; Gan, K.H. Kuala Lumpur Travel Blogs Dataset; V1. Mendeley Data: London, UK, 2018. [Google Scholar] [CrossRef]
  72. Shafie, A.S.; Sharef, N.M.; Murad MA, A.; Azman, A. Aspect extraction performance with POS tag pattern of dependency relation in aspect-based sentiment analysis. In Proceedings of the IEEE Fourth International Conference on Information Retrieval and Knowledge Management, Kota Kinabalu, Malaysia, 26–28 March 2018. [Google Scholar]
  73. Poria, S.; Ofek, N.; Gelbukh, A.; Hussain, A.; Rokach, L. Dependency tree based rules for concept-level aspect-based sentiment analysis. In Semantic Web Evaluation Challenge. SemWebEval 2014. Communications in Computer and Information Science; Presutti, V., Stankovic, M., Cambria, E., Cantador, I., di Iorio, A., di Noia, T., Lange, C., Recupero, D.R., Tordai, A., Eds.; Springer: Cham, Switzerland, 2014. [Google Scholar]
  74. Poria, S.; Hussain, A.; Cambria, E. Concept extraction from natural text for concept level text analysis. In Multimodal Sentiment Analysis; Springer: Cham, Switzerland, 2018; pp. 79–84. [Google Scholar]
  75. Kang, Y.; Zhou, L. RubE: Rule-based Methods for Extracting Product Features from Online Consumer Reviews. Inf. Manag. 2017, 54, 166–176. [Google Scholar] [CrossRef]
  76. Baccianella, S.; Esuli, A.; Sebastiani, F. SentiWordNet 3.0: An enhanced lexical resource for sentiment analysis and opinion mining. In Proceedings of the Seventh International Conference on Language Resources and Evaluation, Valletta, Malta, 17–23 May 2010; pp. 2200–2204. [Google Scholar]
  77. Hazelrigg, G.A. A note on the weighted sum method. J. Mech. Des. 2019, 141, 100301. [Google Scholar] [CrossRef]
  78. Dhanisetty, V.S.V.; Verhagen, W.J.C.; Curran, R. Multicriteria weighted decision making for operational maintenance processes. J. Air Transp. Manag. 2018, 68, 152–164. [Google Scholar] [CrossRef]
  79. Yahi, A.; Chassang, A.; Raynaud, L.; Duthil, H.; Chau, D.H. Aurigo: An interactive tour planner for personalized itineraries. In Proceedings of the 20th International Conference on Intelligent User Interfaces, Atlanta, GA, USA, 29 March–1 April 2015; pp. 275–285. [Google Scholar]
  80. TripAdvisor. Batu Caves. 2018. Available online: https://www.tripadvisor.com.my/Attraction_Review-g3198092-d317520-Reviews-Batu_Caves-Batu_Caves_Selangor.html (accessed on 10 April 2018).
  81. TripAdvisor. Changes to the TripAdvisor Popularity Ranking Algorithm. 2016. Available online: https://www.tripadvisor.com/TripAdvisorInsights/n2701/changes-tripadvisorpopularity-ranking-algorithms (accessed on 2 May 2016).
  82. TripAdvisor. Petronas Towers. 2020. Available online: https://www.tripadvisor.com/Attraction_Review-g298570-d317521-Reviews-Petronas_Twin_Towers-Kuala_Lumpur_Wilayah_Persekutuan.html (accessed on 1 November 2020).
  83. TripAdvisor. Kuala Lumpur Bird Park. 2020. Available online: https://www.tripadvisor.com/Attraction_Review-g298570-d455105-Reviews-Kuala_Lumpur_Bird_Park-Kuala_Lumpur_Wilayah_Persekutuan.html (accessed on 1 November 2020).
  84. Vazirgiannis, M. Graph of Words: Boosting text mining tasks with graphs. In Proceedings of the 26th International Conference on World Wide Web Companion, Perth, Australia, 3–7 April 2017; p. 1181. [Google Scholar]
  85. Pang, Y.; Hao, Q.; Yuan, Y.; Hu, T.; Cai, R.; Zhang, L. Summarizing tourist destinations by mining user-generated travelogues and photos. Comput. Vis. Image Underst. 2011, 115, 352–363. [Google Scholar] [CrossRef]
  86. Kim, E.; Ihm, H.; Myaeng, S.H. Topic-based place semantics discovered from microblogging text messages. In Proceedings of the 23rd International World Wide Web Conference, Seoul, Korea, 7–11 April 2014; pp. 561–562. [Google Scholar]
  87. Liu, K.; Qiu, P.; Gao, S.; Lu, F.; Jiang, J.; Yin, L. Investigating urban metro stations as cognitive places in cities using points of interest. Cities 2020, 97, 102561. [Google Scholar] [CrossRef]
  88. Hu, T.; Marchiori, E.; Kalbaska, N.; Cantoni, L. Online representation of Switzerland as a tourism destination: An exploratory research on a Chinese microblogging platform. Stud. Commun. Sci. 2014, 14, 136–143. [Google Scholar] [CrossRef]
  89. Andrade, J.; Sobata, M.F. Most important contents in travel blogs: A perspective from Brazilian tourists. In Advances in Tourism, Technology and Smart Systems. Smart Innovation, Systems and Technologies; Rocha, Á., Abreu, A., de Carvalho, J.V., Liberato, D., González, E., Liberato, P., Eds.; Springer: Singapore, 2020. [Google Scholar]
  90. Litvin, S.W.; Goldsmith, R.E.; Pan, B. Electronic word-of-mouth in hospitality and tourism management. Tour. Manag. 2008, 29, 458–468. [Google Scholar] [CrossRef]
  91. McKercher, B.; Lau, G. Movement patterns of tourists within a destination. Tour. Geogr. 2008, 10, 355–374. [Google Scholar] [CrossRef]
  92. Hu, F.; Li, Z.; Yang, C.; Jiang, Y. A graph-based approach to detecting tourist movement patterns using social media data. Cartogr. Geogr. Inf. Sci. 2019, 46, 368–382. [Google Scholar] [CrossRef]
  93. Vega, R.R.S. Special Issue: Smart Tourism: A GIS-Based Approach. 2020. Available online: https://www.mdpi.com/journal/ijgi/special_issues/smart_tourism (accessed on 27 February 2020).
  94. Gao, Y.; Ye, C.; Zhong, X.; Wu, L.; Liu, Y. Extracting spatial patterns of intercity tourist movements from online travel blogs. Sustainability 2019, 11, 3526. [Google Scholar] [CrossRef] [Green Version]
  95. Crooks, A.; Pfoser, D.; Jenkins, A.; Croitoru, A.; Stefanidis, A.; Smith, D.; Karagiorgou, S.; Efentakis, A.; Lamprianidis, G. Crowdsourcing urban form and function. Int. J. Geogr. Inf. Sci. 2015, 29, 720–741. [Google Scholar] [CrossRef]
Figure 1. Proposed methodology to construct a multi-criteria-weighted points of interest graph (POI graph).
Ijgi 10 00710 g001
Figure 2. Proposed semantic model of a POI.
Ijgi 10 00710 g002
Figure 3. Bubble plot multidimensional scaling (MDS) representation for POI–Feature keywords.
Ijgi 10 00710 g003
Figure 4. Dominant word MDS representation for POI–Qualifiers keywords.
Ijgi 10 00710 g004
Figure 5. Dependency parsing of the example blog snippet.
Ijgi 10 00710 g005
Figure 6. TripAdvisor reviews’ tags for the case study POI, Batu Caves.
Ijgi 10 00710 g006
Figure 7. Multi-criteria-weighted POI graph for the case study POI, Batu Caves.
Ijgi 10 00710 g007
Figure 8. TripAdvisor reviews’ tags for Petronas Towers.
Ijgi 10 00710 g008
Figure 9. TripAdvisor reviews’ tags for KL Bird Park.
Ijgi 10 00710 g009
Figure 10. A typical POI graph with popular POIs and routes [46,47].
Ijgi 10 00710 g010
Figure 11. A POI graph with route context [45].
Ijgi 10 00710 g011
Figure 12. A POI graph of geographically close locations with local features [20].
Ijgi 10 00710 g012
Table 1. Corpus statistics.
ParameterValue
Texts60
Contexts1536
Words7893
Lemma6341
Occurrences (Tokens)72,967
Threshold10
Table 2. Extracted dependencies list.
Dependency TypeGrammatical Triples
compoundcompound (temples-5, Hindu-4)
compound (Caves-8, Batu-7)
compound (north-4, km-3)
compound (Caves-10, Batu-9)
compound (outcrop-4, limestone-3)
compound (temples-12, cave-11)
compound (temple-12, cave-11)
dobjdobj (Visit-1, temples-5)
dobj (Located-1, north-4)
dobj (houses-5, series-7)
dobj (climb-4, steps-7)
nsubjnsubj (place-14, Caves-10)nsubj (houses-5, outcrop-4)
amodamod (place-14, intriguing-13)
amod (outcrop-4, massive-2)
amod (temples-5, historic-3)
amod (temple-12, main-10)
nmodnmod (Visit-1, Caves-8)
nmod (north-4, KL-6)
nmod (series-7, caves-9)
nmod (climb-4, temple-1)
Table 3. Batu Caves corpus statistics.
ParameterValue
Texts70
Contexts68
Words999
Lemmas887
Occurrences3296
Threshold4
Table 4. Confusion matrix.
ExtractedNot Extracted
Semantic features related to a POItrue positive (tp)false negative (fn)
Semantic features not related to a POIfalse positive (fp)true negative (tn)
Table 5. Extracted top semantic terms of the baseline and proposed methods.
MethodExtracted Top Semantic Features for Batu CavesPrecisionRecall
Term frequency (TF)cave
temple
India
hindu
top
site
minute
hindu god
dedicate
steps
world
0.540.6
Term frequency–inverse document frequency (TF–IDF)temple
top
site
minute
dedicate
hindu god
hindu shrines
impressive
lord Murugan
famous
feature
0.630.53
Frequent item-set miningcave
limestone
kl
north
India
visit
hindu
temple
train
minute
steps
0.540.5
Topic modelkuala lumpur
city
train
day
visit
petronas
monkeys
air
things
hindu
towers
0.270.3
Sem_POIhindu temples
popular shrines
golden statue
limestone hill
train ride
wild monkeys
lord Murugan
climb steps
kl Sentral
ride minute
main cave
0.810.75
Table 6. Multi-criteria weight for POI.
Popular POIDegree RatioPolarityRatingReview RatioMulti-Criteria Weight
Batu Caves0.50.8754176
Table 7. Multi-criteria weight for routes.
POIs
Sequence (n = 2)
Correlation WeightSpatial Indictor(s)Spatial InformationMulti-Criteria Weight
{Batu Caves,
Kuala Lumpur}
0.913 km north295
{Batu Caves,
KL Sentral}
0.830 min165
Table 8. Extracted top semantic terms of the baseline and proposed methods.
MethodExtracted Top Semantic Features for Petronas TowersPrecisionRecall
TFtwin
lumpur
kuala
city
world
ticket
visit
klcc
bridge
night
0.40.4
TF–IDFklcc
lumpur
kuala
tallest
ticket
skyline
bridge
malaysia
mall
deck
0.60.5
Frequent item-set miningcity
world
ticket
klcc
sky
lumpur
kuala
bridge
things
walk
0.40.36
Topic modelworld
waiting
highest
hour
malaysia
light
entire
visually
petrosains
hotel
0.30.23
Sem_POItwin towers
skybridge floor
observation deck
night view
park towers
impressive towers
klcc park
tickets Petronas
shopping mall
skyline city
0.80.67
Table 9. Extracted top semantic terms of the baseline and proposed methods.
MethodExtracted Top Semantic Features for KL Bird ParkPrecisionRecall
TFbirds
park
kl
garden
aviary
world
free-flight
lumpur
kuala
largest
0.30.27
TF–IDFkl
free-flight
aviary
parrot
botanical
lumpur
kuala
Perdana
walk-in
garden
0.40.33
Frequent item-set miningbirds
aviary
largest
world
free
garden
lumpur
kuala
visit
flight
0.30.27
Topic modelpark
bird
birds
kl
world
free
gardens
aviary
flight
largest
0.30.27
Sem_POIfree flight
aviary walk
largest aviary
birds hornbill
aviary flight
lake gardens
botanical garden
bird species
home park
bird shows
0.70.538
Table 10. Comparison between the proposed and existing POI graph representations.
Graph RepresentationMethodologySpatial InformationSemantic Information
POI graph
[45]
FSPM×Route context
POI and Things of Interest (ToI) graph
[46]
FSPM, correlation analysis×POI services
POI and ToI graph
[47]
Frequent pattern mining, compact pattern mining×Things-to-do
Word network
[20]
FSPM, word correlation analysisGeographically close POIsLocal features
Multi-criteria-weighted POI graph
(Proposed Model)
Keywords co-word analysis, dependency parsing Geographically close POIs with precise spatial informationGeo-features, activities, sentiments
Publisher’s Note: MDPI stays neutral with regard to jurisdictional claims in published maps and institutional affiliations.

