
A Visual Analytics Web Platform for Detecting High Wind Energy Potential in Urban Environments by Employing OGC Standards


Abstract
:1. Introduction
2. State of the Art
3. Problem Statement, Motivation, and Novelty
4. System Architecture
4.1. Architecture
- = scalar horizontal velocity in a cell;
- N = number of simulations in a cell;
- S = number of spatial events in a cell;
- v = horizontal velocity;
- t = number of a single simulation temporal events in a cell;
- T = number of all temporal events in a cell.
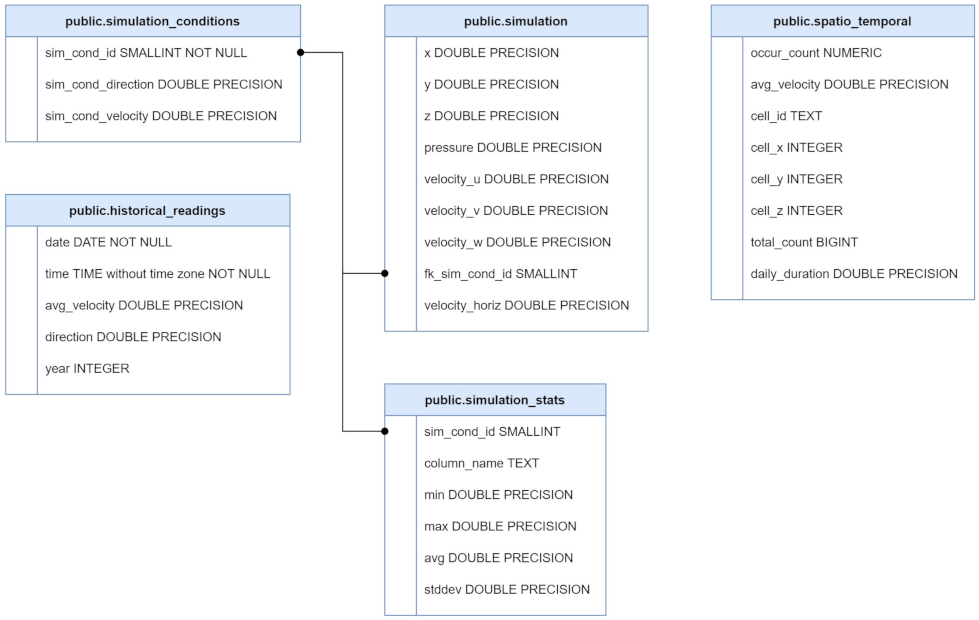
4.2. System Components
5. Implementation
5.1. Preprocessing of the Historical Wind Data
5.2. Server Side Implementation
- calculate_stats is a procedure that calculates the descriptive statistics, i.e., minimum, maximum, average, and standard deviation for each attribute in each simulation. Although this procedure could be implemented as a trigger function in order to be called every time new simulations are imported into the database, it is invoked on demand.
- prepare_conditions is a procedure that receives as input the wind direction/velocity offsets from the spatio-temporal query, calculates the upper/lower limits of the wind direction and the wind velocity for each simulation condition, and stores the result in a temporary table.
- prepare_total_events is a procedure that counts and stores in a temporary table the number of readings in the historical_readings table.
- prepare_occurrences is a procedure that associates the historical readings with a simulation condition only when a reading’s wind direction and velocity is inside the limits of a simulation’s condition. The results are stored in a temporary table.
- prepare_simulation_bounding_volume is a procedure that receives as input the bounds and the velHoriz parameters from the spatio-temporal query. A spatial filter is applied to all simulation vector fields using as limits the bounds parameter and a high-pass attribute filter to the horizontal component of each vector, i.e., the horizontal velocity, using the velHoriz parameter. Then, for each filtered record, the cell id components are calculated utilizing the container_grid_cell_component function. The cell id is created using the generate_cell_id function. This id is constructed by concatenating the cell id components using the empty character as delimiter. The results are stored in a temporary table.
- cell_aggregation_by_simulation_id is a procedure that performs the first step of a two step aggregation. When a grid cell contains more than one vector of the same simulation, they get reduced to a single representation using a database aggregation function (AVG) for the horizontal velocity. The results are stored in a temporary table.
- cell_aggregation_by_cell_id is a procedure that performs the second step of a two step aggregation. It aggregates the representations inside a cell coming from all the simulations. The cell velocity is averaged. The daily duration (in minutes) is a normalized value coming from the ratio between the historical occurrences inside a cell and the total amount of readings in the historical data.
- container_grid_cell_component is a function that finds component-wise in which grid cell a simulation point is enclosed.
- daily_duration_high_pass is a function that returns records from a table where the daily duration is above a threshold.
- generate_cell_id is a simple function that concatenates a cell’s location indices using the empty character as delimiter.
- tag_cell_with_simulation_id is a simple function that concatenates a cell’s id with a simulation’s id using the underscore character as delimiter.
5.3. Client Side Implementation
- A 3D city model to support the visualization since it can give a better perspective in identifying city areas and relative locations between buildings and high potential areas. It can also assist in reasoning in cases of low potential areas because of building occlusion.
- An interactive formulation of queries to give the opportunity for investigating a city area in an easy manner, allowing multiple and fast “questioning”.
- Definition of time and space properties is an essential part of a query, as mentioned before, since we want to apply filtering in four dimensions, i.e., three dimensions for space and one dimension for time.
- Augmentation of the 3D city models with the query results gives a better insight of the potential of an area in three space dimensions. The capabilities of the 3D engine enables an interactive navigation in all areas that might show high potential.
- A multi-layer visualization design can further assist or reason the analysis results. Information coming from separate layers, where query results are stored, can be combined in the same 3D scene to better empower the analysis.
6. Evaluation
7. Critical Review
Author Contributions
Funding
Institutional Review Board Statement
Informed Consent Statement
Data Availability Statement
Acknowledgments
Conflicts of Interest
Abbreviations
| 3DPS | 3D Portrayal Service |
| API | Application Programming Interface |
| CFD | Computational Fluid Dynamics |
| CityGML | City Geography Markup Language |
| CPU | Central Processing Unit |
| DSM | Digital Surface Model |
| DTM | Digital Terrain Model |
| glTF | Graphics Language Transmission Format |
| HTTP | Hypertext Transfer Protocol |
| I3S | Indexed 3D Scene |
| MVC | Model View Controller |
| MVCC | Multiversion Concurrency Control |
| OGC | Open Geospatial Consortium |
| REST | Representational State Transfer |
| SQL | Structured Query Language |
Appendix A
Appendix A.1. Historical Wind Data

Appendix A.2. API Endpoints
- Endpoint: /spatialThis endpoint is used for accessing the spatial data of single CFD simulation and supports the visualization on the client side. When combined with filtering and the multi-layer design on the client, qualitative insights can be retrieved in an area of interest, e.g., high turbulence areas coming from different wind directions.
- −
- Method: GET.
- −
- Usage: Get data related to a simulation result.
- −
- Query parameter id: The simulation condition id.
- −
- Query parameter position: This is a comma separated list of the column names that defines the spatial information for the primitives used in the client side: in case of a point primitive, the X, Y, and Z information; in case of a line primitive, the startX, startY, startZ, endX, endY, and endZ information.
- −
- Query parameter attribute: The name of the simulation attribute of which the values will be color encoded in the client.
- −
- Query parameter filter: A high-pass filter threshold for the values of the selected simulation attribute.
- −
- Query parameter bounds: This parameter defines the spatial domain of the area the end-user is interested to request simulation data. It is a comma separated list of offsets, in meters, (left, right, back, front, bottom, top) that creates a buffer zone around the bounding volume of the 3D city model.
- Endpoint: /spatiotemporalThis endpoint is used for finding locations where the wind velocity is higher than a velocity threshold and the daily duration, which is a normalized value, is higher than a temporal threshold. The time span of the historical wind data is assumed to be of at least one calendar year. The result of the analysis is visualized as a spatio-temporal grid on the client.
- −
- Method: GET.
- −
- Usage: Get data related to a spatio-temporal analysis.
- −
- Query parameter cellSize: This is the size, in meters, of the cell of the regular 3D grid.
- −
- Query parameter dirNegOffset: This parameter defines the negative offset, in decimal degrees, of the a similarity range for each direction in the CFD boundary conditions.
- −
- Query parameter dirPosOffset: This parameter defines the positive offset, in decimal degrees, of the a similarity range for each direction in the CFD boundary conditions.
- −
- Query parameter velPosOffset: This is the positive offset, in meters per second, of the a similarity range for each velocity in the CFD boundary conditions.
- −
- Query parameter velHoriz: A high-pass filter, in meters per second, for the horizontal wind velocities in the simulation results.
- −
- Query parameter dailyDuration: A high-pass filter, in minutes, for the daily duration of the wind.
- −
- Query parameter bounds: This parameter defines the spatial domain of the area the end-user is interested to investigate. It is a comma separated list of offsets, in meters, (left, right, back, front, bottom, top) that creates a buffer zone around the bounding volume of the 3D city model.
- Endpoint: /attributesThis endpoint returns the attribute names coming from a CFD simulation. These metadata are used in the client for selecting the values of the attribute which are used for color encoding either the simulation results or the spatio-temporal grid. In addition, the selection of a geometric primitive (point, line, etc.) requires the selection of the attributes with the spatial information. Thus, the client is agnostic of the exposed attributes at compile time and is decoupled from the server-side.
- −
- Method: GET.
- −
- Usage: Get attribute names.
- −
- Query parameter type: Specifies the type of attribute names to be retrieved. Can be simulation or spatio-temporal.
- Endpoint: /slugThis endpoint is used during a spatial query definition in order to make the selection of a simulation result easier. It generates an identifier of a CFD simulation by combining its boundary conditions.
- −
- Method: GET.
- −
- Usage: Returns a list of user friendly identifiers for a simulation condition by concatenating the wind direction with the wind velocity and their units using the underscore character as delimiter (e.g., 215 deg_4 m/s).
- Endpoint: /statsThis endpoint is used during a spatial query definition in order to select a meaningful value for the high-pass filter of the attribute that is visualized in the client.
- −
- Method: GET.
- −
- Usage: Get descriptive statistics, i.e., minimum, maximum, average, and standard deviation, for an attribute coming from a specific simulation.
- −
- Query parameter id: The simulation condition id.
- −
- Query parameter attribute: The name of the simulation attribute.
References
- Keim, D.; Kohlhammer, J.; Ellis, G.; Mansmann, F. (Eds.) Mastering the Information Age: Solving Problems with Visual Analytics; Eurographics Association: Goslar, Germany, 2010. [Google Scholar]
- Blocken, B. Computational Fluid Dynamics for urban physics: Importance, scales, possibilities, limitations and ten tips and tricks towards accurate and reliable simulations. Build. Environ. 2015, 91, 219–245. [Google Scholar] [CrossRef] [Green Version]
- Gröger, G.; Plümer, L. CityGML—Interoperable semantic 3D city models. ISPRS J. Photogramm. Remote Sens. 2012, 71, 12–33. [Google Scholar] [CrossRef]
- Suomisto, J.; Airaksinen, E.; Bergstrom, M.; Heinonnen, H.; Lahti, K.; Kaisla, K. The Kalasatama Digital Twins Project; Technical Report, Helsinki 3D+; Helsinki Urban Environment Division: Helsinki, Finland, 2019. [Google Scholar]
- Franke, J.; Baklanov, A. Best Practice Guideline for the CFD Simulation of Flows in the Urban Environment: COST Action 732 Quality Assurance and Improvement of Microscale Meteorological Models; Meteorological Institute, University of Hamburg: Hamburg, Germany, 2007. [Google Scholar]
- Islam, M.; Mekhilef, S.; Saidur, R. Progress and recent trends of wind energy technology. Renew. Sustain. Energy Rev. 2013, 21, 456–468. [Google Scholar] [CrossRef]
- Hand, B.; Cashman, A. Conceptual design of a large-scale floating offshore vertical axis wind turbine. Energy Procedia 2017, 142, 83–88. [Google Scholar] [CrossRef]
- Borg, M.; Shires, A.; Collu, M. Offshore floating vertical axis wind turbines, dynamics modelling state of the art. part I: Aerodynamics. Renew. Sustain. Energy Rev. 2014, 39, 1214–1225. [Google Scholar] [CrossRef] [Green Version]
- Balduzzi, F.; Bianchini, A.; Carnevale, E.A.; Ferrari, L.; Magnani, S. Feasibility analysis of a Darrieus vertical-axis wind turbine installation in the rooftop of a building. Appl. Energy 2012, 97, 921–929. [Google Scholar] [CrossRef]
- Tabrizi, A.B.; Whale, J.; Lyons, T.; Urmee, T. Performance and safety of rooftop wind turbines: Use of CFD to gain insight into inflow conditions. Renew. Energy 2014, 67, 242–251. [Google Scholar] [CrossRef] [Green Version]
- Mithraratne, N. Roof-top wind turbines for microgeneration in urban houses in New Zealand. Energy Build. 2009, 41, 1013–1018. [Google Scholar] [CrossRef]
- Lee, K.Y.; Tsao, S.H.; Tzeng, C.W.; Lin, H.J. Influence of the vertical wind and wind direction on the power output of a small vertical-axis wind turbine installed on the rooftop of a building. Appl. Energy 2018, 209, 383–391. [Google Scholar] [CrossRef]
- Ledo, L.; Kosasih, P.; Cooper, P. Roof mounting site analysis for micro-wind turbines. Renew. Energy 2011, 36, 1379–1391. [Google Scholar] [CrossRef]
- Rezaeiha, A.; Montazeri, H.; Blocken, B. A framework for preliminary large-scale urban wind energy potential assessment: Roof-mounted wind turbines. Energy Convers. Manag. 2020, 214, 112770. [Google Scholar] [CrossRef]
- Al-Quraan, A.; Stathopoulos, T.; Pillay, P. Comparison of wind tunnel and on site measurements for urban wind energy estimation of potential yield. J. Wind. Eng. Ind. Aerodyn. 2016, 158, 1–10. [Google Scholar] [CrossRef] [Green Version]
- Hausdorff, F. Grundzuege der Mengenlehre; Chelsea: New York, NY, USA, 1965. [Google Scholar]
- Beller, C. Urban Wind Energy. Ph.D. Thesis, Technical University of Denmark, National Laboratory for Sustainable Energy, Roskilde, Denmark, 2011. [Google Scholar]
- Moeng, C.H.; Sullivan, P. Numerical Models|Large-Eddy Simulation. In Encyclopedia of Atmospheric Sciences, 2nd ed.; North, G.R., Pyle, J., Zhang, F., Eds.; Academic Press: Oxford, UK, 2015; pp. 232–240. [Google Scholar] [CrossRef]
- Blocken, B. LES over RANS in building simulation for outdoor and indoor applications: A foregone conclusion? Build. Simul. 2018, 11, 1–50. [Google Scholar] [CrossRef] [Green Version]
- Wang, B.; Sun, S.; Duan, M. Wind potential evaluation with urban morphology—A case study in Beijing. Energy Procedia 2018, 153, 62–67. [Google Scholar] [CrossRef]
- Juan, Y.H.; Wen, C.Y.; Chen, W.Y.; Yang, A.S. Numerical assessments of wind power potential and installation arrangements in realistic highly urbanized areas. Renew. Sustain. Energy Rev. 2021, 135, 110165. [Google Scholar] [CrossRef]
- Chtibi, A.; Touzani, A. Actual wind energy use situation worldwide and in Morocco: Case of small vertical axis wind turbine market offers. In Proceedings of the 4th International Conference on Big Data and Internet of Things, Tangier-Tetuan, Morocco, 23–24 October 2019; pp. 1–7. [Google Scholar] [CrossRef]
- Wilkinson, S.; Bradbury, G.; Hanna, S. Approximating Urban Wind Interference. In Proceedings of the Symposium on Simulation for Architecture & Urban Design; Society for Computer Simulation International: San Diego, CA, USA, 2014. [Google Scholar]
- Ágota Szűcs. Wind comfort in a public urban space—Case study within Dublin Docklands. Front. Archit. Res. 2013, 2, 50–66. [Google Scholar] [CrossRef] [Green Version]
- Keim, D.A.; Bak, P.; Bertini, E.; Oelke, D.; Spretke, D.; Ziegler, H. Advanced Visual Analytics Interfaces. In Proceedings of the International Conference on Advanced Visual Interfaces; Association for Computing Machinery: New York, NY, USA, 2010; pp. 3–10. [Google Scholar] [CrossRef] [Green Version]
- Cybulski, J.; Keller, S.; Saundage, D. Metaphors in Interactive Visual Analytics. In Proceedings of the 7th International Symposium on Visual Information Communication and Interaction; Association for Computing Machinery: New York, NY, USA, 2014; pp. 212–215. [Google Scholar] [CrossRef]
- Ferreira, N.; Lage, M.; Doraiswamy, H.; Vo, H.T.; Wilson, L.; Werner, H.; Park, M.; Silva, C.T. Urbane: A 3D framework to support data driven decision making in urban development. In Proceedings of the 2015 IEEE Conference on Visual Analytics Science and Technology (VAST), Chicago, IL, USA, 25–30 October 2015; Curran Associates: New York, NY, USA; pp. 97–104. [Google Scholar]
- Deininger, M.E.; von der Grün, M.; Piepereit, R.; Schneider, S.; Santhanavanich, T.; Coors, V.; Voß, U. A Continuous, Semi-Automated Workflow: From 3D City Models with Geometric Optimization and CFD Simulations to Visualization of Wind in an Urban Environment. ISPRS Int. J. Geo-Inf. 2020, 9, 657. [Google Scholar] [CrossRef]
- Gaillard, J.; Vienne, A.; Baume, R.; Pedrinis, F.; Peytavie, A.; Gesquière, G. Urban Data Visualisation in a Web Browser. In Proceedings of the 20th International Conference on 3D Web Technology; Association for Computing Machinery: New York, NY, USA, 2015; pp. 81–88. [Google Scholar] [CrossRef] [Green Version]
- Patterson, D. Interactive 3D Web Applications for Visualization of World Health Organization Data. In Proceedings of the Australasian Computer Science Week Multiconference; Association for Computing Machinery: New York, NY, USA, 2016. [Google Scholar] [CrossRef]
- Schilling, A.; Bolling, J.; Nagel, C. Using GlTF for Streaming CityGML 3D City Models. In Proceedings of the 21st International Conference on Web3D Technology; Association for Computing Machinery: New York, NY, USA, 2016; pp. 109–116. [Google Scholar] [CrossRef]
- Handsaker, S.; Ogbonna, I.; Volkov, K. CFD Prediction of Performance of Wind Turbines Integrated in the Existing Civil Infrastructure. Sustainability 2021, 13, 8514. [Google Scholar] [CrossRef]
- Stadtklima-stuttgart.de. Download von Messdaten der Station S-Mitte, Schwabenzentrum. 2020. Available online: https://www.stadtklima-stuttgart.de/index.php?luft_messdaten_download (accessed on 8 June 2021).
- Hagedorn, B.; Thum, S.; Reitz, T.; Coors, V.; Gutbell, R. 3D Portrayal Service Version 1.0. 2017. Available online: http://docs.opengeospatial.org/is/15-001r4/15-001r4.html (accessed on 25 August 2021).
- Guttman, A. R-Trees: A Dynamic Index Structure for Spatial Searching. In Proceedings of the 1984 ACM SIGMOD International Conference on Management of Data; Association for Computing Machinery: New York, NY, USA, 1984; pp. 47–57. [Google Scholar] [CrossRef]
- Ramsey, P. Spatial Indexing—Introduction to PostGIS. 2021. Available online: https://postgis.net/workshops/postgis-intro/indexing.html (accessed on 27 August 2021).
- Cozzi, P.; Lilley, S.; Getz, G. 3D Tiles Specification. 2018. Available online: https://github.com/CesiumGS/3d-tiles/tree/master/specification (accessed on 26 August 2021).
- ESRI. I3S Specification. 2019. Available online: https://github.com/Esri/i3s-spec (accessed on 26 August 2021).


| Wind Atlases | Statistical Analysis | On-Site Measurement | Wind Tunnel | CFD | |
|---|---|---|---|---|---|
| Spatial Resolution | low | low/high | high | high | high |
| Spatial range | large | small/large | low | low | low |
| Temporal resolution | low | high | high | high | high |
| Temporal range | high | high | high | low | low |
| Visual representation | 2D | 2D/graph | graph | graph | 2D/3D/graph |
| Expertise | low | high | modest | high | high |
| Accessibility | easy | easy | easy | hard | hard |
| Endpoint | HTTP Method | Parameters | Usage |
|---|---|---|---|
| spatial | GET | id, position, attribute, filter, bounds | Get data related to a simulation |
| spatiotemporal | GET | cellSize, dirNegOffset, dirPosOffset, velPosOffset, velHoriz, dailyDuration, bounds | Perform a spatio-temporal analysis |
| attributes | GET | type | Get attribute names |
| slug | GET | - | Returns a list of user friendly identifiers for a simulation condition |
| stats | GET | id, attribute | Get descriptive statistics for a simulation |
| Name | Type | Invoke |
|---|---|---|
| calculate_stats | procedure | on demand |
| prepare_conditions | procedure | dynamic |
| prepare_total_events | procedure | dynamic |
| prepare_occurrences | procedure | dynamic |
| prepare_simulation_bounding_volume | procedure | dynamic |
| cell_aggregation_by_simulation_id | procedure | dynamic |
| cell_aggregation_by_cell_id | procedure | dynamic |
| container_grid_cell_component | function | dynamic |
| daily_duration_high_pass | function | dynamic |
| generate_cell_id | function | dynamic |
| tag_cell_with_simulation_id | function | dynamic |
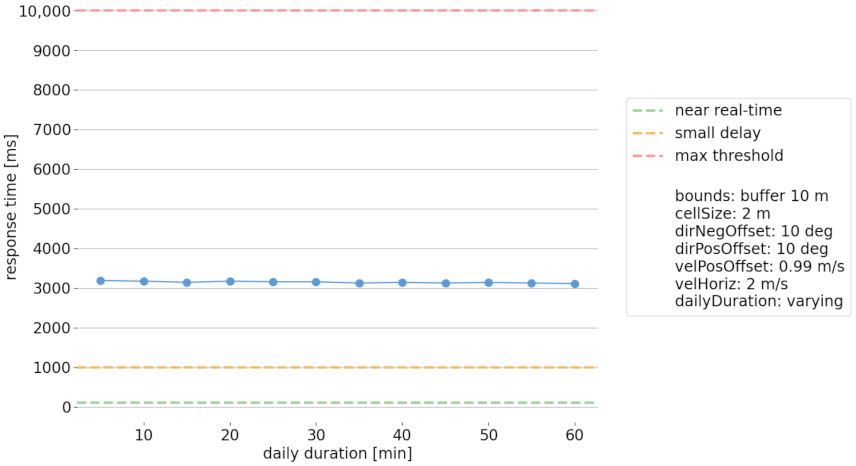
| Plan | Bounds | cellSize | dirNegOffset | dirPosOffset | velPosOffset | velHoriz | dailyDuration |
|---|---|---|---|---|---|---|---|
| bounds_plan | varying | 2 m | 10 deg | 10 deg | 0.99 m/s | 2 m/s | 30 min |
| cell_plan | 10 m (buffer) | [1–10] m | 10 deg | 10 deg | 0.99 m/s | 2 m/s | 30 min |
| direction_plan | 10 m (buffer) | 2 m | [1–20] deg | [1–20] deg | 0.99 m/s | 2 m/s | 30 min |
| velocity_plan | 10 m (buffer) | 2 m | 10 deg | 10 deg | 0.99 m/s | [1–4] m/s | 30 min |
| duration_plan | 10 m (buffer) | 2 m | 10 deg | 10 deg | 0.99 m/s | 2 m/s | [5–60] min |
| Feature | Value |
|---|---|
| Operating System | Windows 10 |
| CPU | Intel i5-8500 |
| CPU Base Frequency | 3.00 GHz |
| # of cores | 6 |
| # of threads | 6 |
| RAM | 16 GB |
| Database version | PostgreSQL v12.0 |
| Server Side Framework | Node v12.18.2 |
Publisher’s Note: MDPI stays neutral with regard to jurisdictional claims in published maps and institutional affiliations. |
© 2021 by the authors. Licensee MDPI, Basel, Switzerland. This article is an open access article distributed under the terms and conditions of the Creative Commons Attribution (CC BY) license (https://creativecommons.org/licenses/by/4.0/).
Share and Cite
Koukofikis, A.; Coors, V. A Visual Analytics Web Platform for Detecting High Wind Energy Potential in Urban Environments by Employing OGC Standards. ISPRS Int. J. Geo-Inf. 2021, 10, 707. https://doi.org/10.3390/ijgi10100707
Koukofikis A, Coors V. A Visual Analytics Web Platform for Detecting High Wind Energy Potential in Urban Environments by Employing OGC Standards. ISPRS International Journal of Geo-Information. 2021; 10(10):707. https://doi.org/10.3390/ijgi10100707
Chicago/Turabian StyleKoukofikis, Athanasios, and Volker Coors. 2021. "A Visual Analytics Web Platform for Detecting High Wind Energy Potential in Urban Environments by Employing OGC Standards" ISPRS International Journal of Geo-Information 10, no. 10: 707. https://doi.org/10.3390/ijgi10100707
APA StyleKoukofikis, A., & Coors, V. (2021). A Visual Analytics Web Platform for Detecting High Wind Energy Potential in Urban Environments by Employing OGC Standards. ISPRS International Journal of Geo-Information, 10(10), 707. https://doi.org/10.3390/ijgi10100707