Article

Which Gridded Population Data Product Is Better? Evidences from Mainland Southeast Asia (MSEA)

1
Institute of Geographic Sciences and Natural Resources Research, Chinese Academy of Sciences, Beijing 100101, China
2
College of Resources and Environment, University of Chinese Academy of Sciences, Beijing 100049, China
*
Author to whom correspondence should be addressed.
Co-first author, these authors contributed equally to this work.
ISPRS Int. J. Geo-Inf. 2021, 10(10), 681; https://doi.org/10.3390/ijgi10100681
Submission received: 23 August 2021 / Revised: 1 October 2021 / Accepted: 4 October 2021 / Published: 9 October 2021

Abstract

:
The release of global gridded population datasets, including the Gridded Population of the World (GPW), Global Human Settlement Population Grid (GHS-POP), WorldPop, and LandScan, have greatly facilitated cross-comparison for ongoing research related to anthropogenic impacts. However, little attention is paid to the consistency and discrepancy of these gridded products in the regions with rapid changes in local population, e.g., Mainland Southeast Asia (MSEA), where the countries have experienced fast population growth since the 1950s. This awkward situation is unsurprisingly aggravated because of national scarce demographics and incomplete census counts, which further limits their appropriate usage. Thus, comparative analyses of them become the priority of their better application. Here, the consistency and discrepancy of the four common global gridded population datasets were cross-compared by combing the 2015 provincial population statistics (census and yearbooks) via error-comparison based statistical methods. The results showed that: (1) the LandScan performs the best both in spatial accuracy and estimated errors, then followed by the WorldPop, GHS-POP, and GPW in MSEA. (2) Provincial differences in estimated errors indicated that the LandScan better reveals the spatial pattern of population density in Thailand and Vietnam, while the WorldPop performs slightly better in Myanmar and Laos, and both fit well in Cambodia. (3) Substantial errors among the four gridded datasets normally occur in the provincial units with larger population density (over 610 persons/km2) and a rapid population growth rate (greater than 1.54%), respectively. The new findings in MSEA indicated that future usage of these datasets should pay attention to the estimated population in the areas characterized by high population density and rapid population growth.

1. Introduction

Global gridded population datasets have become one of the most essential inputs for quantifying the impacts of human beings on the Earth and understanding the human-nature interrelationship in the face of climate change, disaster risk and epidemic spreading [1,2,3]. World Population Prospects 2019 showed that the global population is projected to reach approximately 9.7 billion by 2050, with a net increment over 1/4 [4]. The booming population not only puts increasingly intense pressure on the Earth, but also requires timely and updated accurate demographics for different purposes at various scales. For example, the demographics serve as the fundamental data for fulfilling the Sustainable Development Goals (SDGs) and evaluating the mankind’s impacts on the planet [5,6]. Ever since the first release of the Gridded Population of World (GPW) version 1.0 in 1995 [7], several continental to global gridded population datasets were successively publicized. Among them, four of them are commonly applied in well-known academic journals and thematic reports or books, including the GPW [8], the Global Human Settlement Layer-Population (GHS-POP) [9], the WorldPop program [10] and the LandScan [11]. These spatially-explicit demographics were widely utilized in the studies of nature and humanities, e.g., environmental change and sustainable development [12,13], urban expansion and planning [14,15], household surveys and public health management [16,17], and disaster risk assessment and reduction [18,19], despite the critical significance of the national census.
Data comparison always comes along with the release of new datasets of gridded population density. For example, the Web of Science (WoS) shows that hundreds of peer-reviewed journal papers used the datasets, but only a few focus on comparative analysis of dataset itself. In fact, huge differences in input data and modeling approaches make these raster population datasets vary prominently in accuracy, quality and timeliness, hence the limitation of appropriate usage of them [7,20]. Leyk et al. [20] further pointed out that none of them fits for entire situations of varied population development. Then, it would not be surprising that researchers make informed decisions according to their needs. Usually, empirical research at the country level collects and utilizes population counts from census and/or yearbooks as actual value to assess the accuracy of gridded population datasets [18,21,22,23,24]. For example, Bai et al. [21] evaluated the data accuracy of the GPW, Global Rural-Urban Mapping Project (GRUMP), Worldpop, and China 1 km Gridded Population (CnPop) datasets in China, and found that the Worldpop had the highest estimation accuracy. Also, Sweden, as the case by comparing five global gridded population datasets, was used to show that highly modeled datasets exhibited lower errors, e.g., the Worldpop and LandScan [22]. Additionally, Mohanty et al. [18] compared four datasets in understanding population flood exposure in Canada, and noticed that the Worldpop and LandScan had an excellent performance. In their pursuit of robust and reliable comparison, however, previous studies tended to be conducted under the context of stable population countries (e.g., Canada [18], China [21], and Sweden [22]). In contrast, the gridding estimation or modeling of population density for a dynamic population generally incurs discrepancy. Differing from the stable type of population development, the dynamics featured by rapid population growth particularly in the regions with high population density, e.g., Mainland Southeast Asia (MSEA), can provide a better angle for cross-comparison and accuracy assessment.
MSEA is experiencing rapid population changes with a high population growth rate and accelerating urbanization since the 1950s [25,26,27]. A two-decade (2000–2019) average of total population increment in Cambodia, Laos, Myanmar, Thailand, and Vietnam were 35.6%, 34.67%, 15.68%, 10.6%, and 20.71%, respectively. In addition, Thai and Vietnamese capitals and their big cities (e.g., Ho Chi Minh) as well as their counterparts (i.e., Phnom Penh, Vientiane, Naypyidaw and Yangon) in Cambodia, Laos, and Myanmar underwent extensive urbanization and rapid population growth or immigration [28,29,30,31]. For example, Vietnam, the most populous country in MSEA, is experiencing rapid population migration from rural to urban areas [32], which greatly elevates the urbanization rate from 23.7% (1999) to 34.4% (2019), or a growth rate of nearly 50%. What’s more, MSEA is also a poor-data area, especially for Cambodia, Laos, and Myanmar. For example, Myanmar has only conducted three censuses since 1948 (i.e., 1973, 1983, and 2014), which has brought great challenges to the study of population changes of this country, so, time-series raster population data can cover this shortage to a great extent.
Thus, MSEA serves as one of the most ideal regions for exploring and assessing the consistency, discrepancy and suitability of various gridded population datasets in the setting of rapid changing population. In combination with the provincial statistical population data in 2015 from national census and yearbooks, the error-comparison statistical methods, including the mean absolute error (MAE), root mean squared error (RMSE), and error rate, were used for comparative analysis. In particular, we explored the error characteristics of the datasets in the provinces of different population densities and growth rates. We try to answer the following questions: (1) Do variations in the accuracy and suitability of gridded population datasets exist within countries in MSEA? (2) Where and why do variations and discrepancies (e.g., estimation errors) across gridded population datasets occur in MSEA at the provincial level? The results and conclusions may provide necessary guidance for the usage of gridded population datasets in the ongoing impact-response analyses related to climate change, disaster risk and epidemic spreading.

2. Materials and Methods
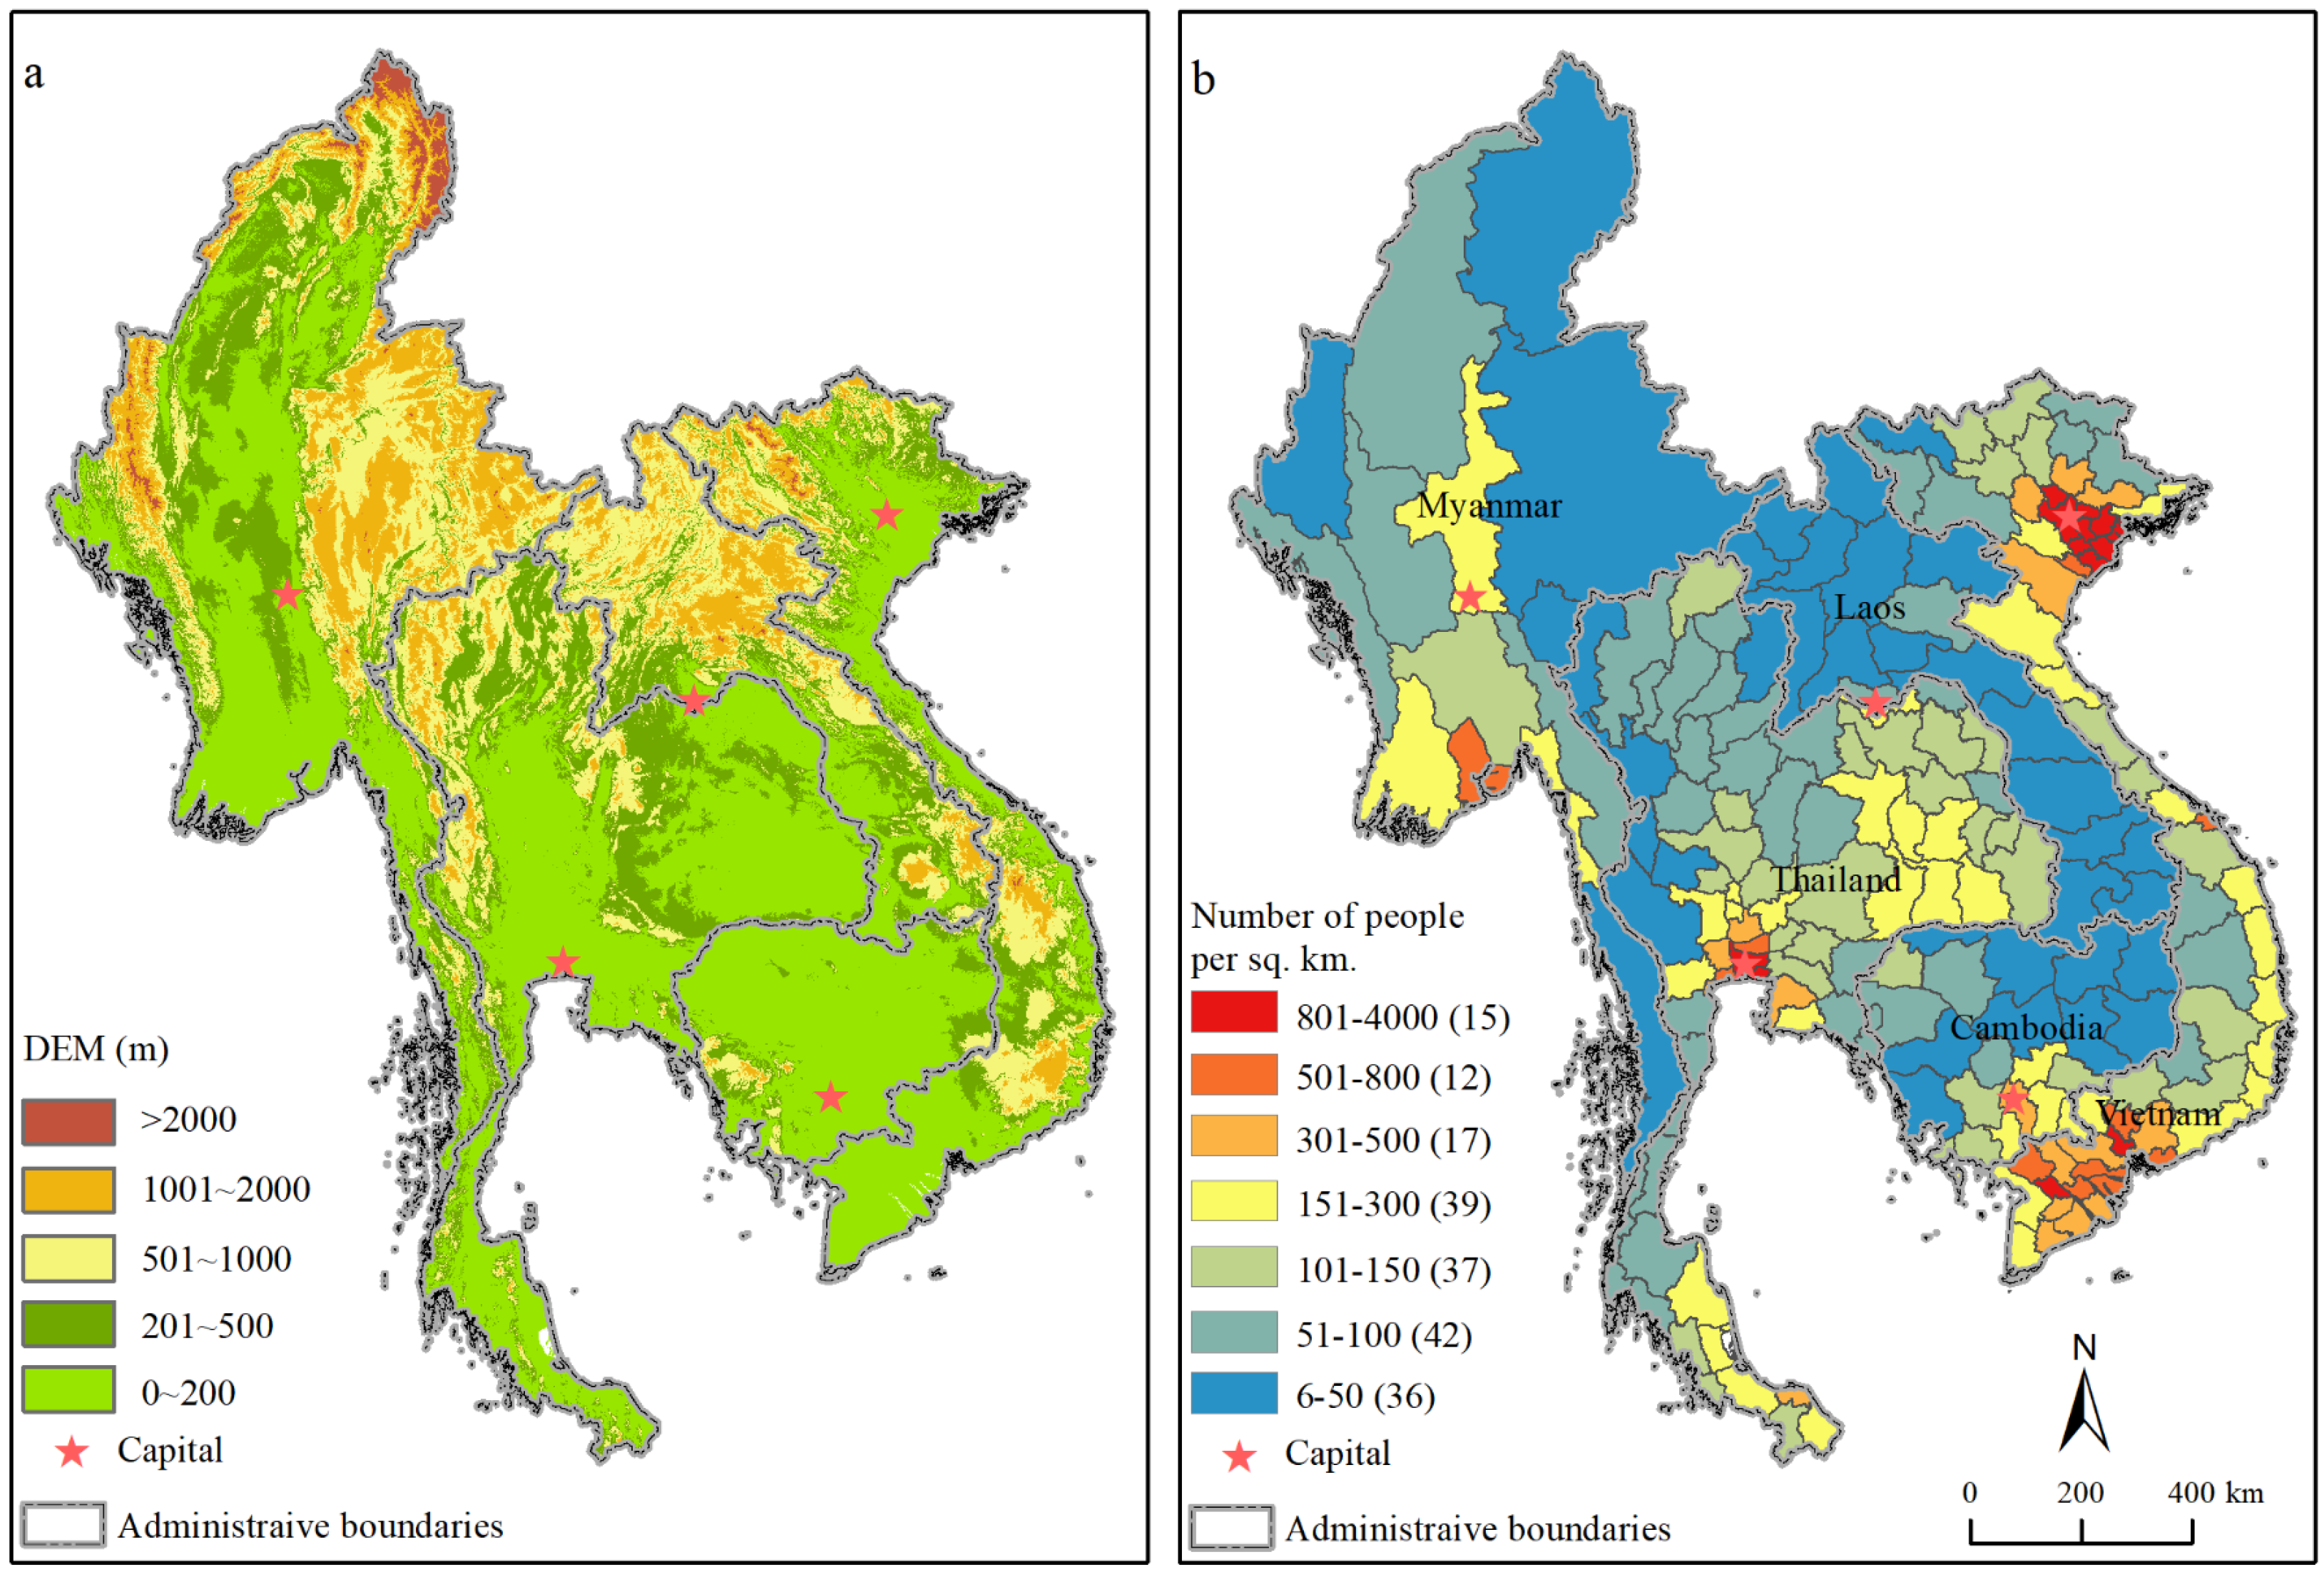
2.1. Study Area

Mainland Southeast Asia (MSEA), in this study, refers to the five countries including Cambodia, Laos, Myanmar, Thailand, and Vietnam, with a topography (Figure 1a) dominated by mountains and plains [33]. The nearly dichotomous landforms play a crucial role in population distribution, migration and development. As a typical region of tropical monsoon climate, terrain can be viewed as a decisive physical factor for sparse and dense, rural and urban, and lowland and upland population. The densely populated regions of MSEA are mainly concentrated in the coastal plains and delta areas of the four major rivers, such as the Chao Phraya, Irrawaddy, Mekong and Red River. For instance, more than 80% of the gridded population of MSEA settles in the elevation range below 200 m. The sparse population is closely related to remote mountains and/or isolated plateaus, such as the Annamite Chain, the Cardamom Mountains, the Shan Highland, and the Thanon Thong Chai mountain range, etc. In recent times, the ethnic majority groups such as the Kinh (Vietnam), the Thai (Thailand), the Burma (Myanmar), the Khmer (Cambodia) and the Lao (Laos) dominantly inhabit the lowlands across each country, whereas the minority and/or border-crossing ethnic ones including the Hmong-Mien, Ahka, Khmu, Lahu, and Lisu still dwell in the upland environments.
MSEA, occupying a land area of 1.93 million km2, had a population of 239.3 million by 2019, with the population density of 124 people/km2, or more than twice as much as the world average (58 people/km2). This is a densely populated region, however, the national variations in population density are huge, with the population density of Cambodia, Laos, Myanmar, Thailand, and Vietnam equaling to 93, 30, 80, 135, and 293 people/km2, respectively. In terms of population counts and growth rate, Vietnam ranks the first with 96.2 million and an annual population growth rate of 0.96%, followed by Thailand with 68.7 million and 0.28%, Myanmar with 52.4 million and 0.63%, Cambodia with 15.3 million and 1.46%, and Laos ranks the last with 6.9 million but with the largest growth rate of 1.53%. However, national urbanization rates are much lower than that of global average (55.72%) in 2019, or 51%, 39.4%, 36%, 34.4% and 31% in Thailand, Cambodia, Laos, Vietnam and Myanmar, respectively.

2.2. Data

2.2.1. National Statistical Data and Its Pre-Processing

As a data-poor region, MSEA lacks long-term or time-series datasets available from the World Bank (https://data.worldbank.org/ (accessed on 3 October 2021)) in the low-income countries (Cambodia, Laos, and Myanmar). Despite this, the provincial statistics, including total population and land area, were collected from the official statistical websites of each country (with the exception of Cambodia) in 2010 and 2015. Regarding Cambodia, the corresponding data in the census years of 2008 and 2019 were applied as alternatives. The two-stage data was also used to calculate the average annual population growth rate for each province for the correlation analysis with estimated errors of gridded population. In consideration of the accessibility, availability and feasibility, all statistical data were gathered, processed and analyzed at the provincial level. It should be noted that some provincial administrative units were newly established in the early 2010s. They were: (1) Bueng Kan province in Thailand was separated from Nong Khai Mansion in 2011; (2) Teben Kemun province in Cambodia was precipitated from Kampong Cham province in 2013; and (3) Xaysomboon province in Laos was separated from Vientiane and Xieng Khouang provinces in the same year. We interpolated the population data of these three provinces in 2010 based on the governmental statistical bulletin to obtain continuous data from 2010 to 2015. Figure 1b displays the distribution differences in population density at the provincial level. There are 198 provincial units in MSEA regardless of land area, including 25, 18, 15, 67 and 63 in Cambodia, Laos, Myanmar, Thailand and Vietnam, respectively. Additionally, the administrative (e.g., provincial to national) boundaries of MSEA and its five countries are freely available from the Database of Global Administrative Areas (GADM) version 3.6 (https://gadm.org/ (accessed on 3 October 2021)).

2.2.2. Four Gridded Population Datasets

The scientific community has made great effort to disaggregate census data at the pixel level, based on different modeling methods and auxiliary data to generate several global and regional gridded population data products. According to the complexity of modeling methods and auxiliary input data, these datasets can be divided into unmodeled (e.g., the GPW), lightly modeled (e.g., the GHS-POP), and highly modeled (e.g., the WorldPop and LandScan). Although the similarities among them are apparent, their differences are substantial and have critical implications for ongoing research involving the datasets. Table 1 presents the primary characteristics (including methods, input data, geographical reference, and spatial-temporal resolution) of the four gridded population datasets. We noticed that these datasets all have gridded population results in 2000 and 2015, for which both can be considered for cross-comparative years because of the data consistency. However, as previously stated, earlier (2000 and before) statistical data from census and/or yearbooks is either unavailable or inaccessible. Considering the availability and timeliness of gridded and/or statistical population data, the year 2015 was finally selected as the base year for further analysis in this study. For spatial resolution, in Section 3.1, we used 30 arc seconds (approximately 1 km at the equator) of all datasets, while in order to compare the highest accuracy of the four datasets, the finest resolution was adopted in the Section 3.2 and Section 3.3, that is 100 m for the WorldPop and 250 m for the GHS-POP, respectively.

2.3. Methodology

2.3.1. GIS-Based Consistent Spatial Comparison

Geographic Information System (GIS) based methods (e.g., overlay analysis, spatial statistics analysis) were adopted to visually cross-compare the spatial performance of accuracy among the four gridded population datasets with the same coordinate system and spatial resolution across MSEA. Next, a wall-to-wall comparison of spatial differences in population density of the major cities (e.g., Bangkok and Phnom Penh) was also carried out in Section 3.1. Moreover, the zonal statistics tool via the ArcGIS10.2 software was used to count total population or its density at provincial and national levels in Section 3.2, so as to make comparison with statistical data. Moreover, when a grid cell spans multiple provinces, the principle to allocate the population is based on the tool’s default to assign pixels only to the boundary in which the pixel’s centroid resides.

2.3.2. Estimated Errors Comparison

Error comparison statistical methods were used to calculate the errors between the statistical and gridded population at the provincial level in MSEA. Ratio error (RE) is one of the most common indicators to estimate forecasting accuracy [21]. MAE and RMSE can be used to measure the difference between the actual and estimated population. Smaller values of MAE and RMSE represent a better quality of gridded population datasets. In contrast, RMSE focuses more on individual outliers when compared with MAE, while MAE would be better in delineating the average error among the four datasets [34]. Finally, the correlation coefficient (CC) is used to analyze the correlation of the actual and estimated populations. The formulas of RE, MAE, RMSE and CC are given as follows.
RE = f i r i r i
MAE = 1 N i = 1 N | f i r i |
RMSE = 1 N i = 1 N ( f i r i ) 2
CC = cov ( f , r ) σ f σ r
where f i is the statistical population of province i, r i is the estimated population of province i, N is the number of provinces in Mainland Southeast Asia (MSEA), cov (f, r) is the covariance of the statistical and estimated population, σ f is the standard deviation of the estimated population, and σ r is the standard deviation of statistical population. Furthermore, RE was classified into seven types according to the distribution of their values, including ±20%, ±10%, and ±5%. Those above 20% or below −20% are defined as extreme outliers.

3. Results

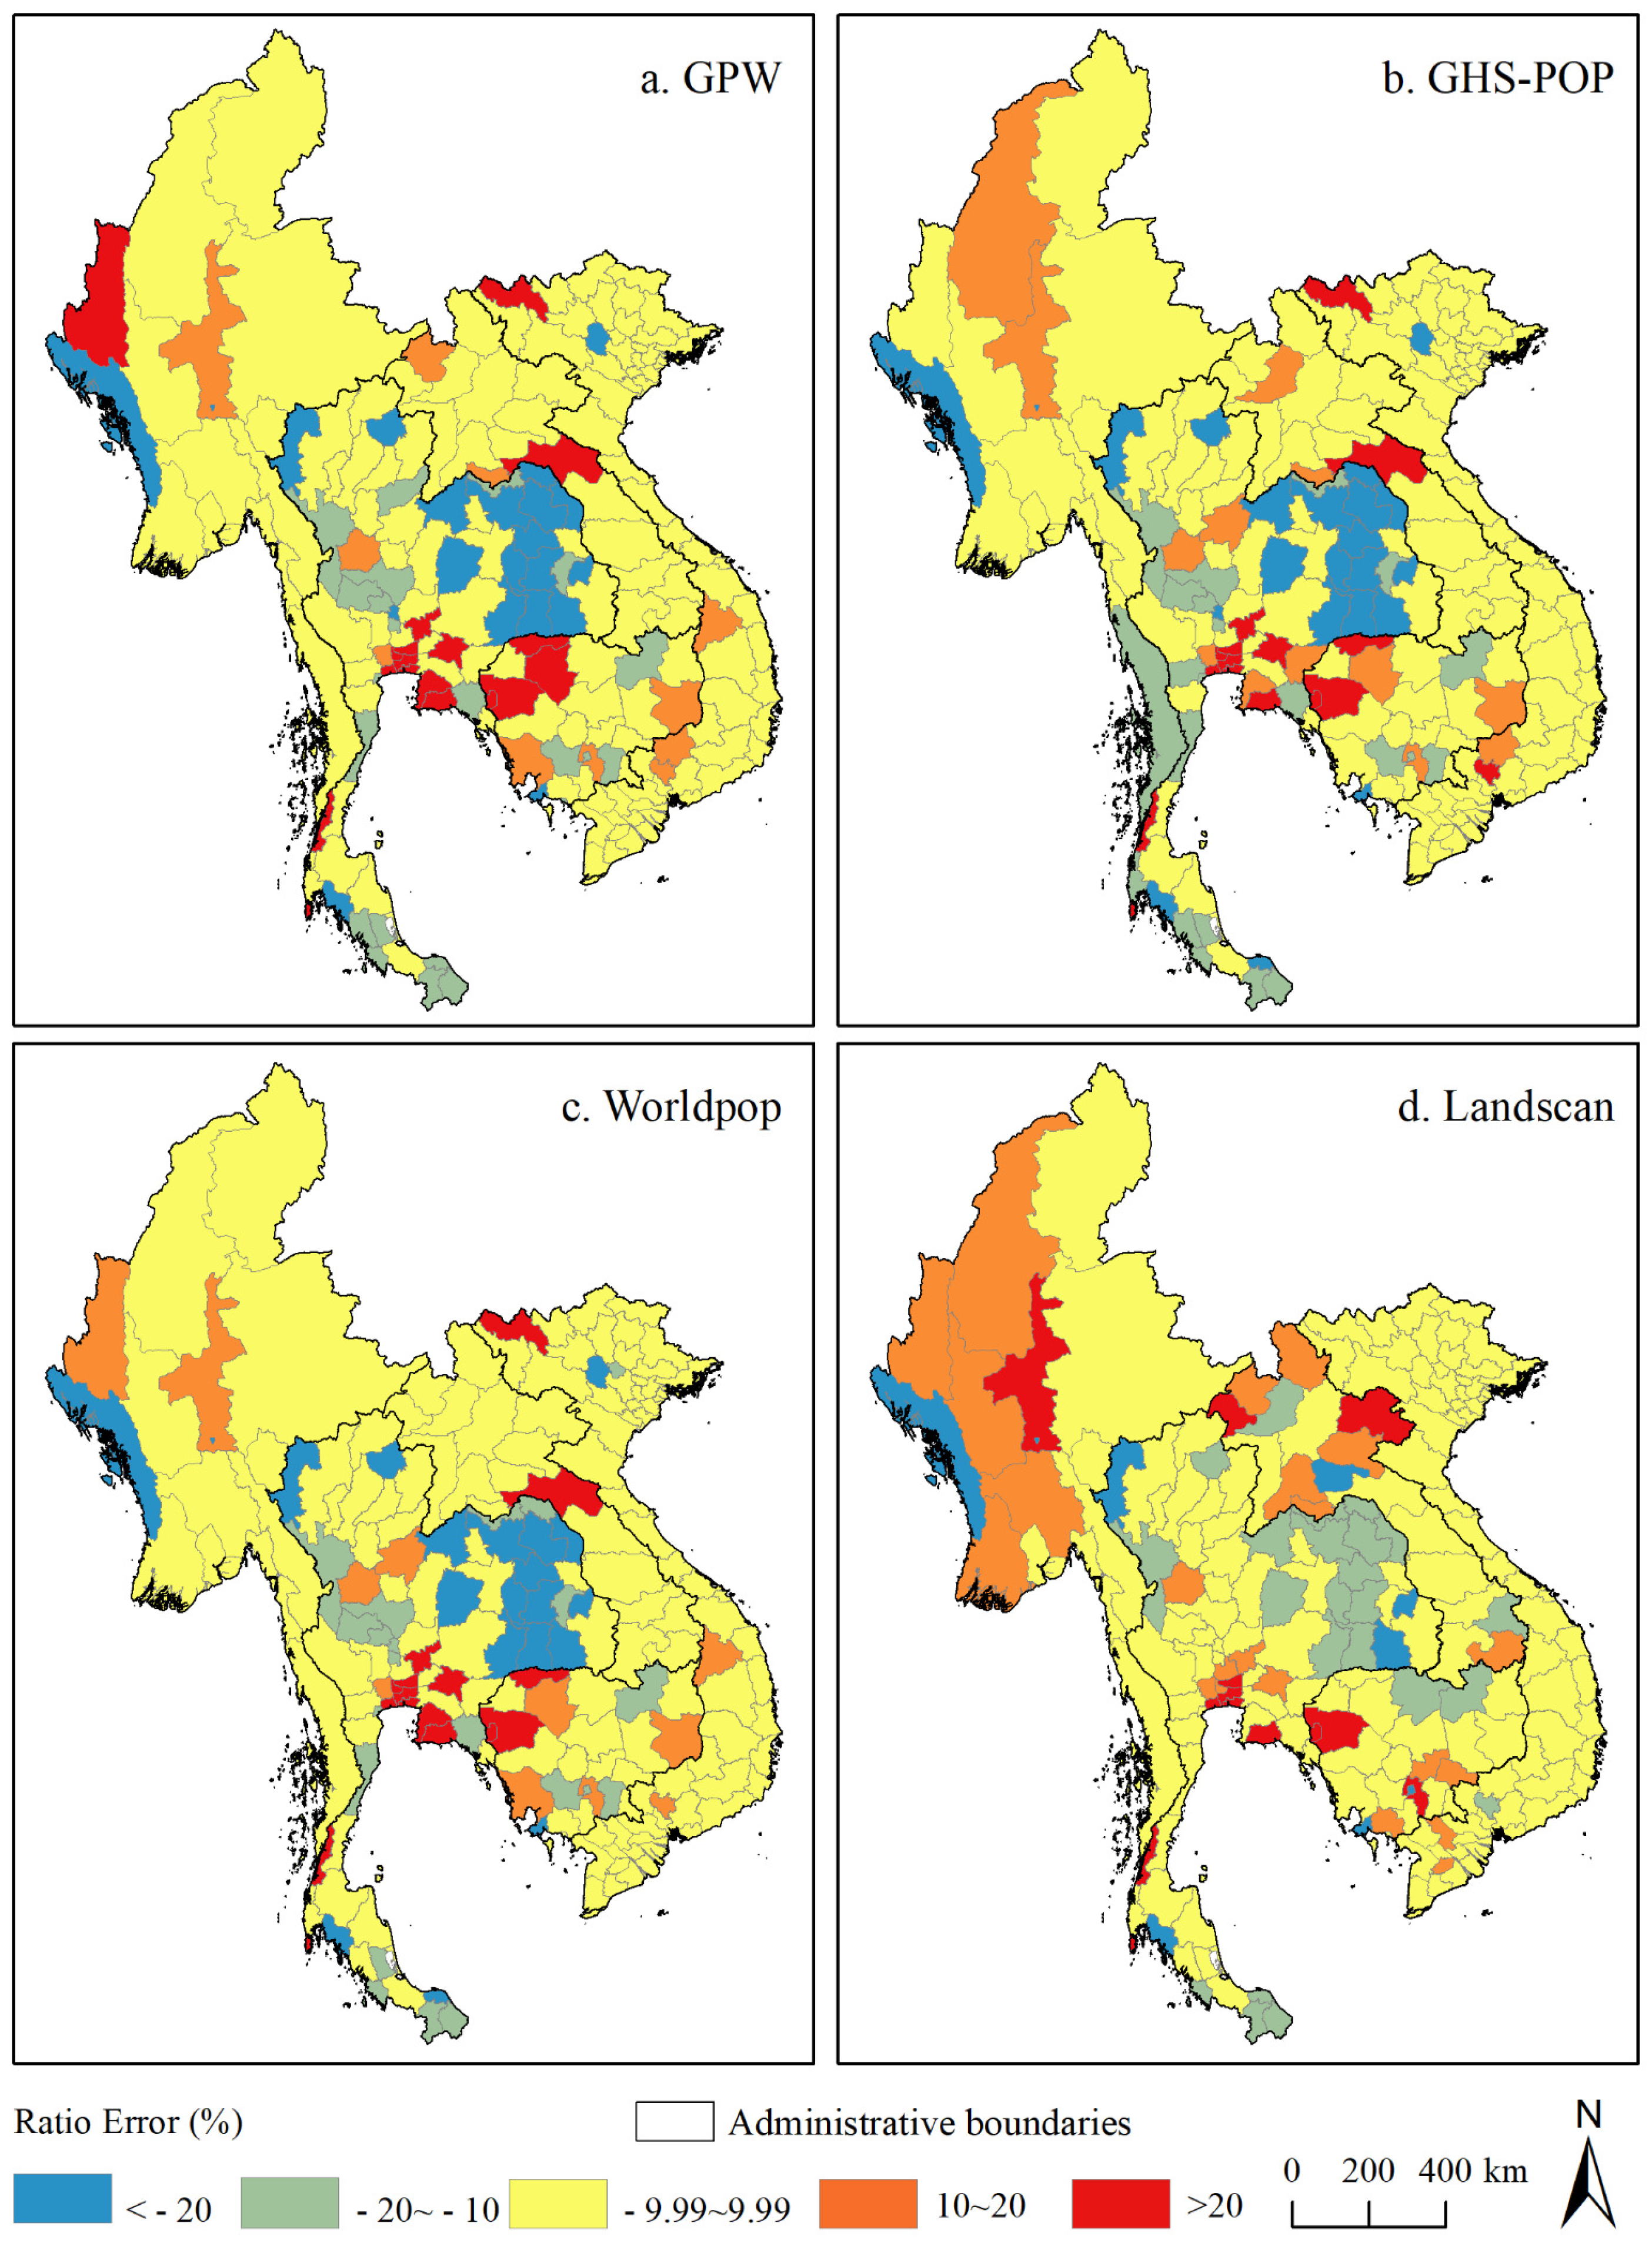
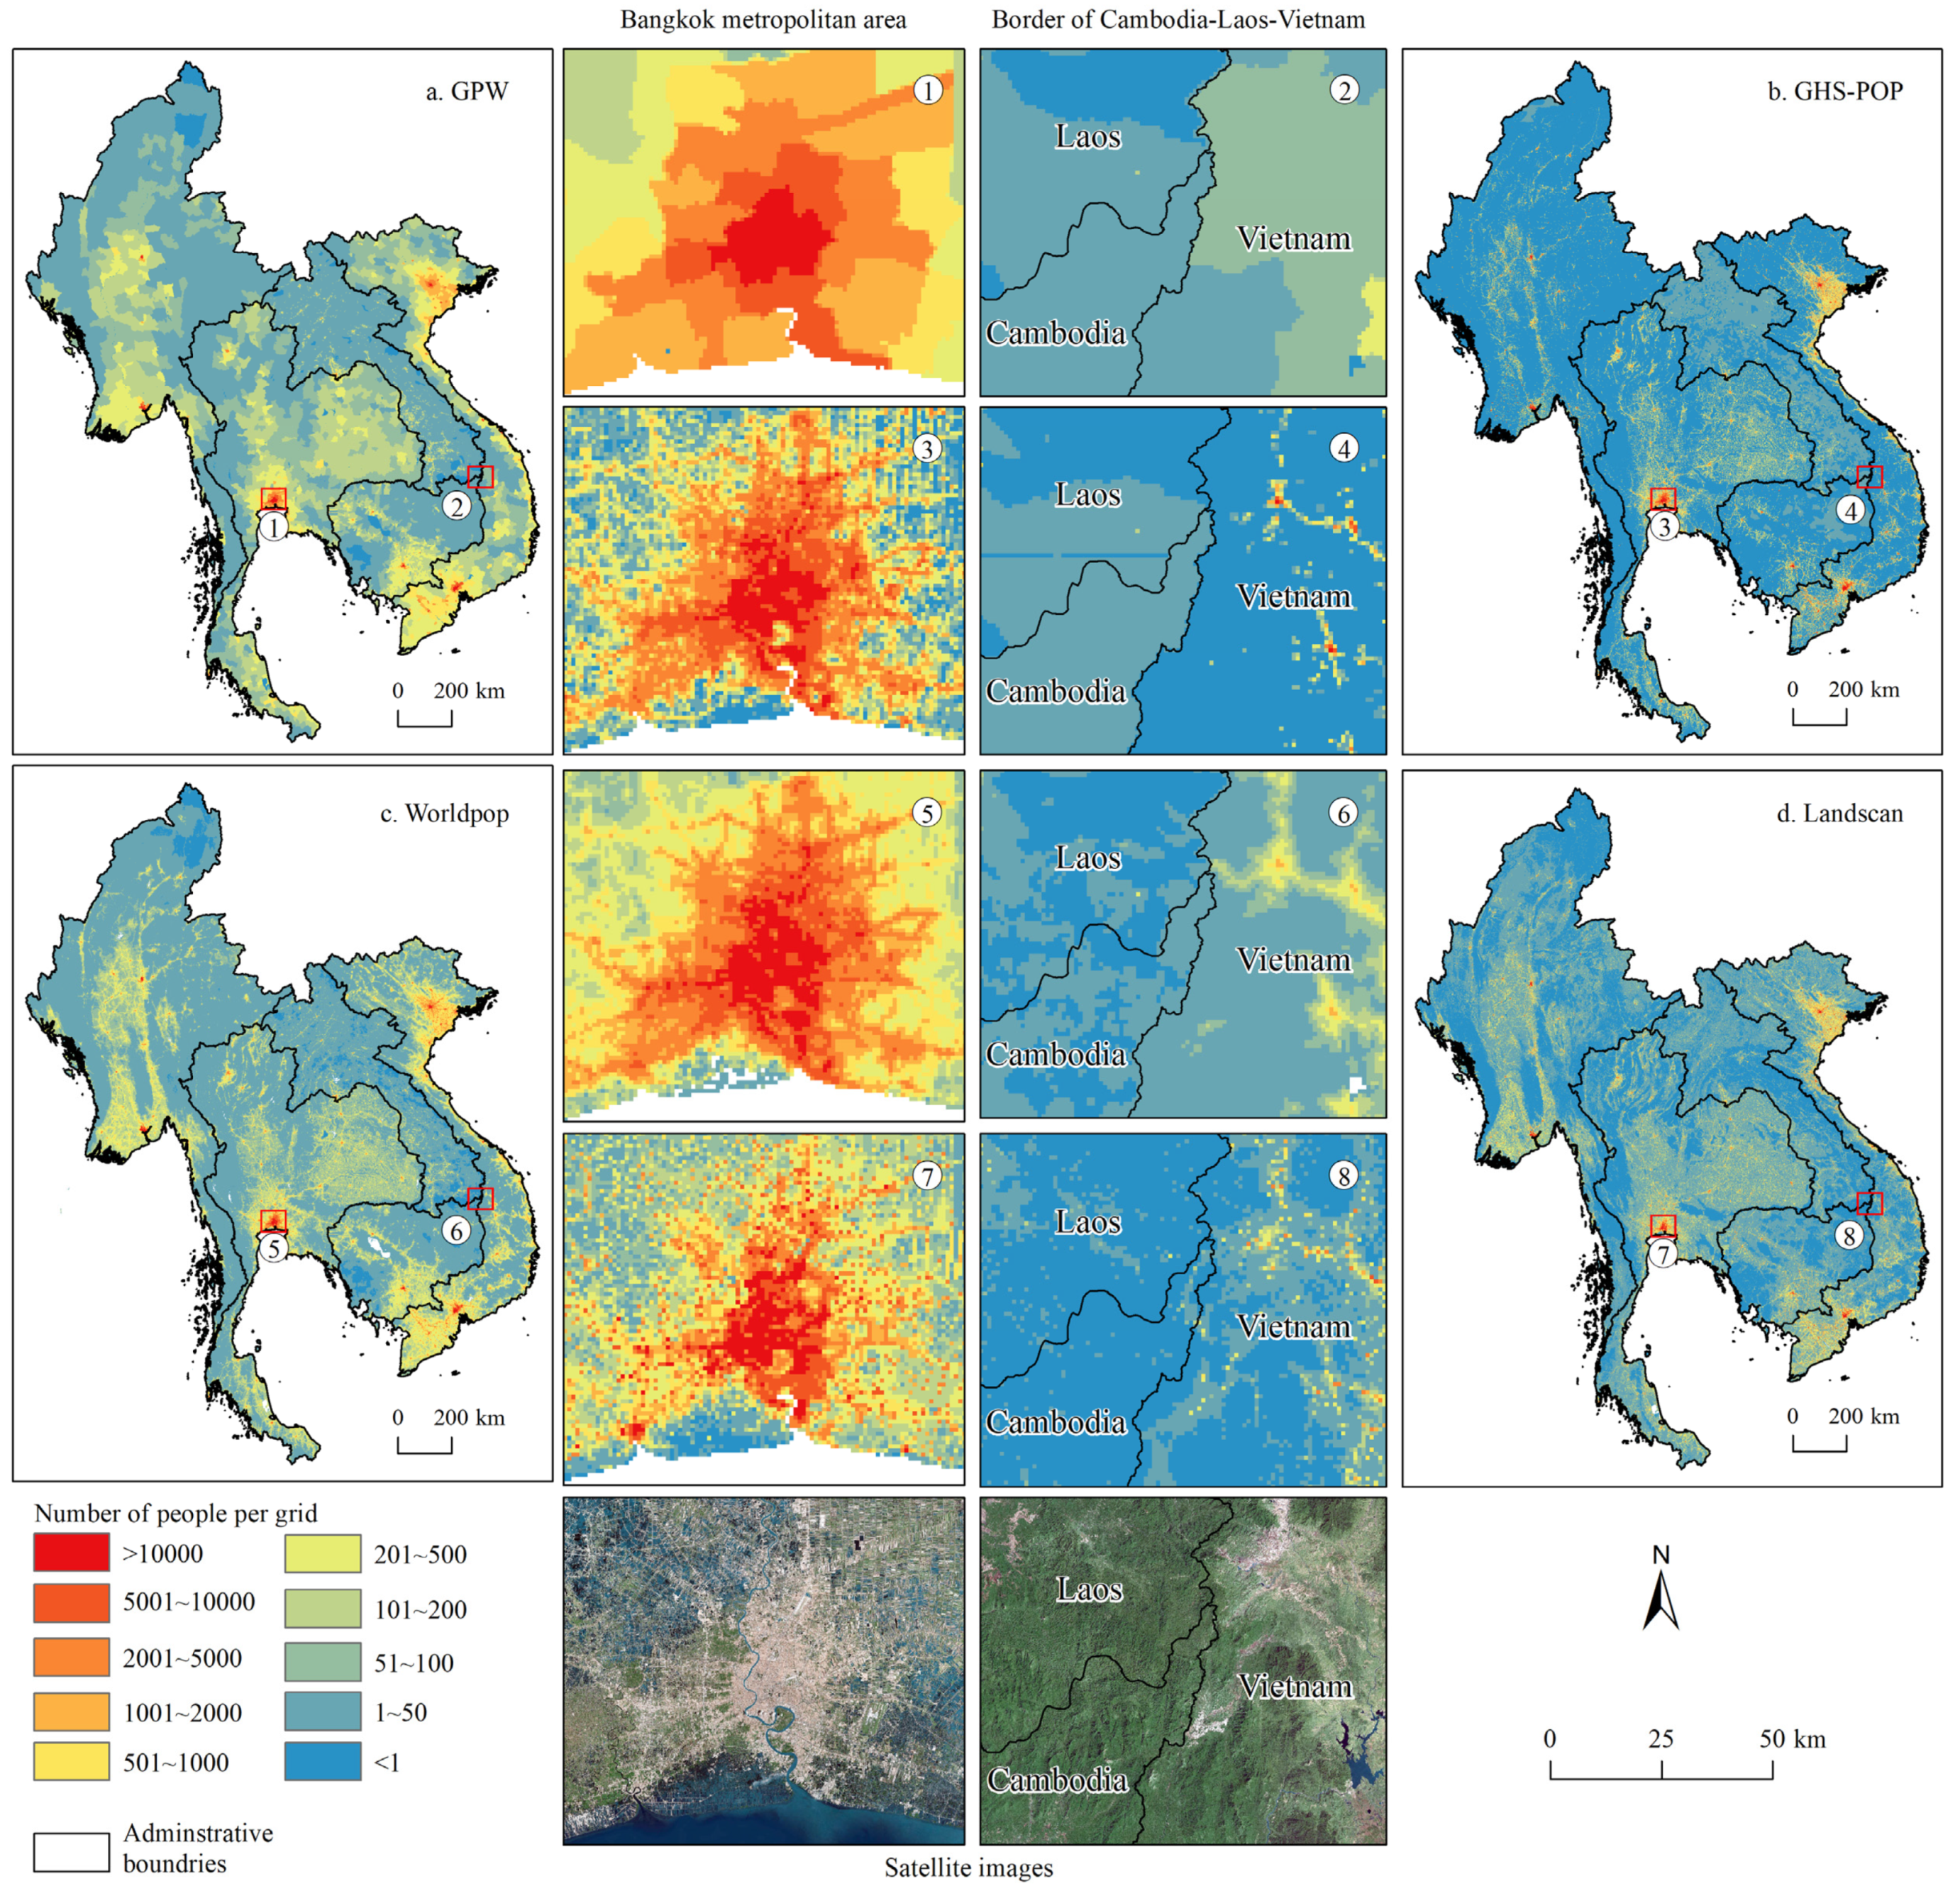
3.1. Spatial Differences in the Four Gridded Population Datasets

Figure 2 presents the differences in the spatial distribution of the four gridded population datasets across MSEA, using the same classification scheme. Visual comparison indicates that the GPW has the roughest spatial performance. With respect to the unpopulated areas (or population density <1 person per km2), the LandScan has the best performance. The GHS-POP clearly overestimates the area of the depopulated zone, indicating that the estimation of sparsely populated areas is rough, as well. This may relate to the auxiliary data input (i.e., built-up area) of the GHS-POP dataset. The distribution and its weight of built-up area have direct contribution to the insufficient accuracy for low population density. The WorldPop dataset seems to underestimate the area of uninhabited land, with a poor recognition of sparsely populated areas. It may have a close relation to the spillover effect of night time light (NTL) as auxiliary input data of the WorldPop [7,10]. In addition, in terms of unpopulated areas (e.g., mountainous regions), the LandScan has the best performance, followed by the WorldPop, GHS-POP and GPW.
Furthermore, two typical areas in MSEA were selected to compare the variations in the densely and sparsely populated area among the four gridded population datasets (Figure 2). The Bangkok metropolitan area, where most pixels contain more than 500 people, was selected as the densely populated case area. In contrast, the border area of Cambodia, Laos and Vietnam, where most pixels contain less than 50 people, was selected as the sparsely populated case area. First, the GPW shows obvious influence of the administrative boundaries on the gridded population estimation. Second, the impacts of varied man-made construction (including infrastructure) on gridded population estimates are very notable. For example, the WorldPop has the larger population density due to expanded urban extent because of the spillover effect of NTL [7,10]. Similarly, the LandScan tends to reveal the variations because of the roads, settlements and small towns or villages in the suburbs of the cities, while the GHS-POP maintains a high consistency with the built-up area.

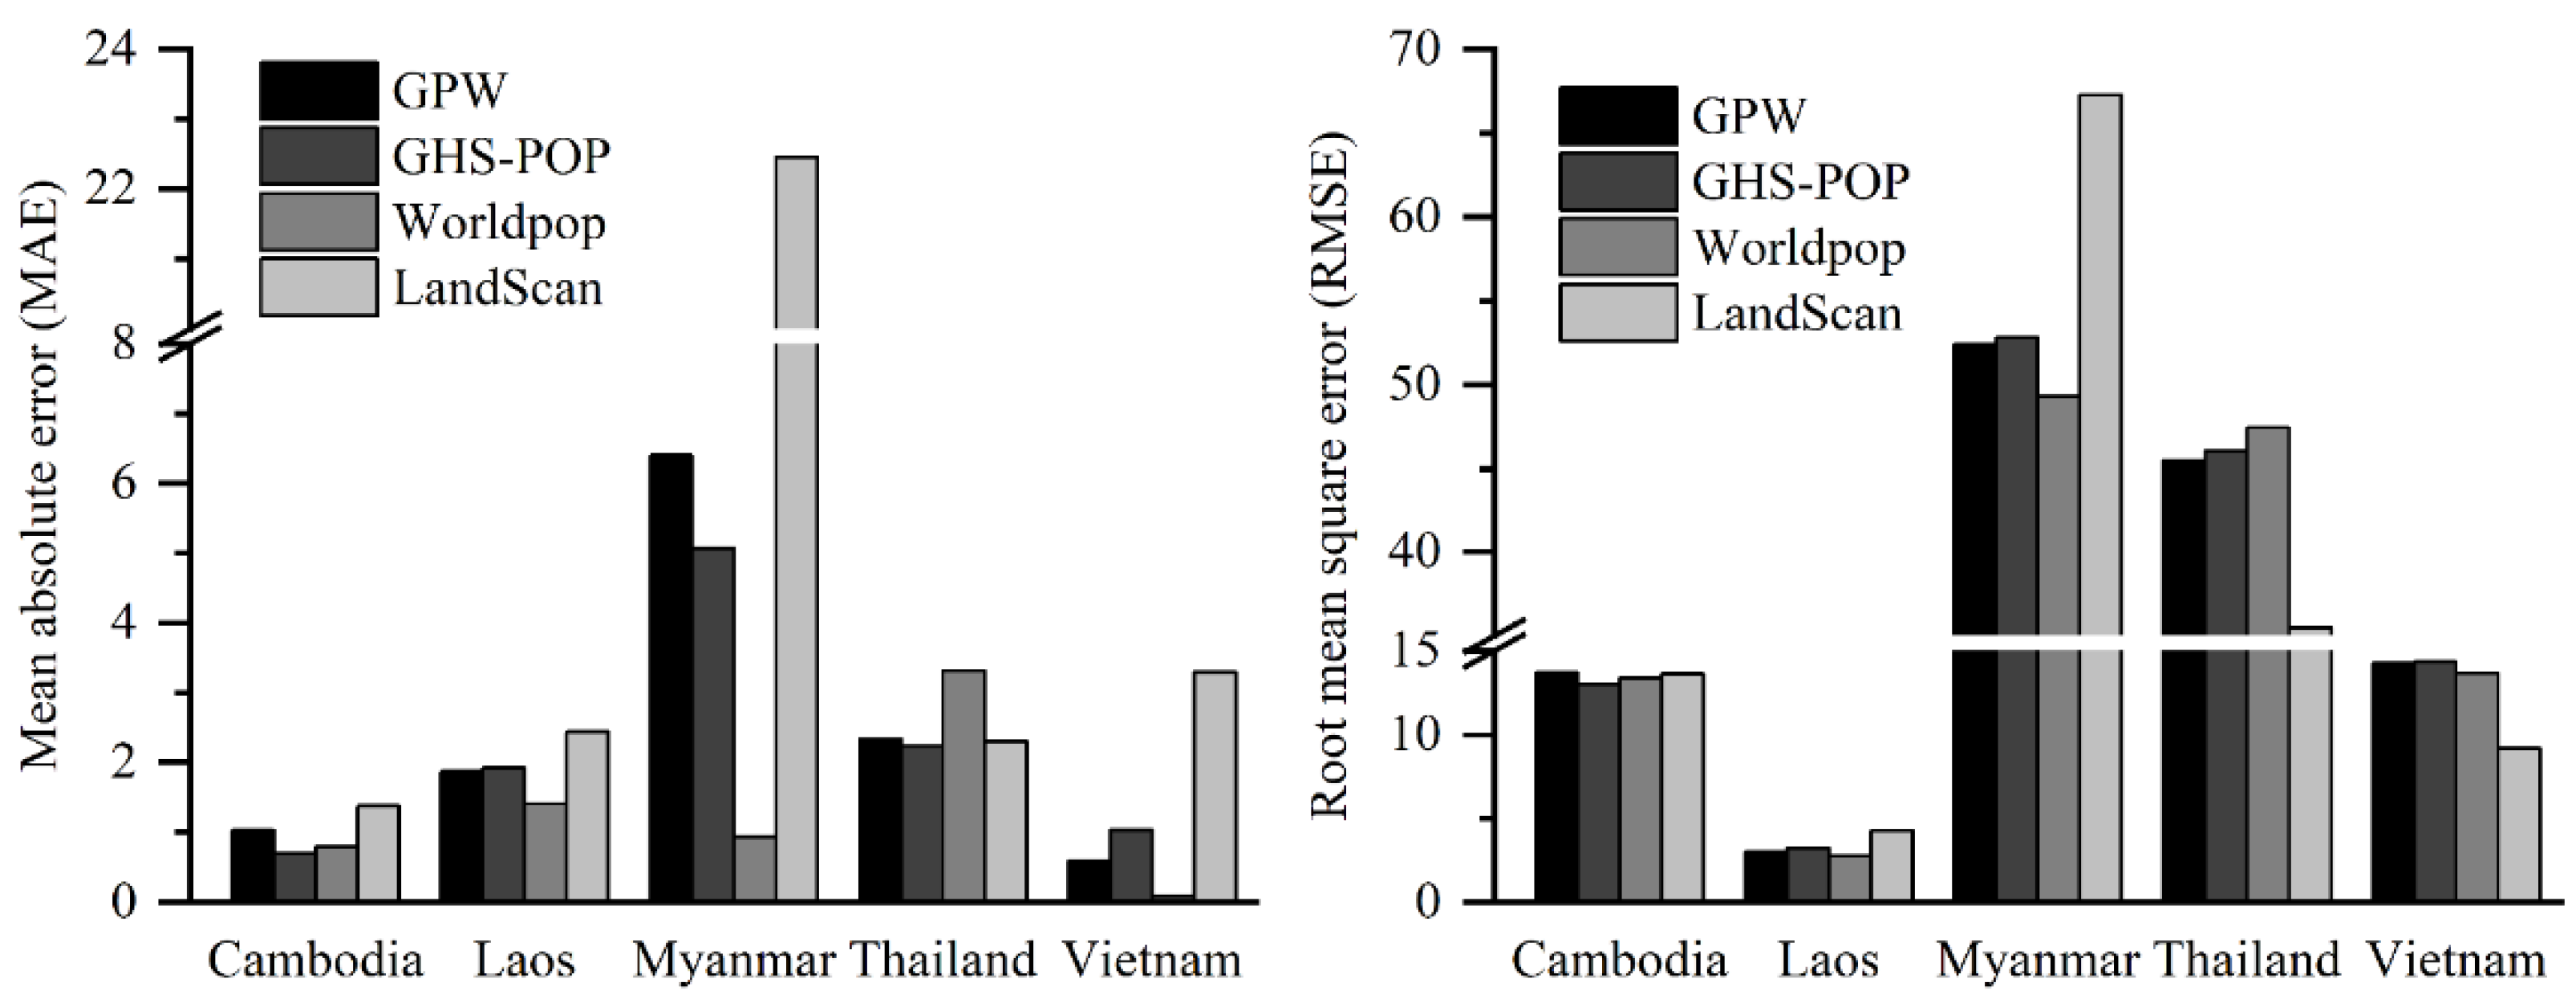
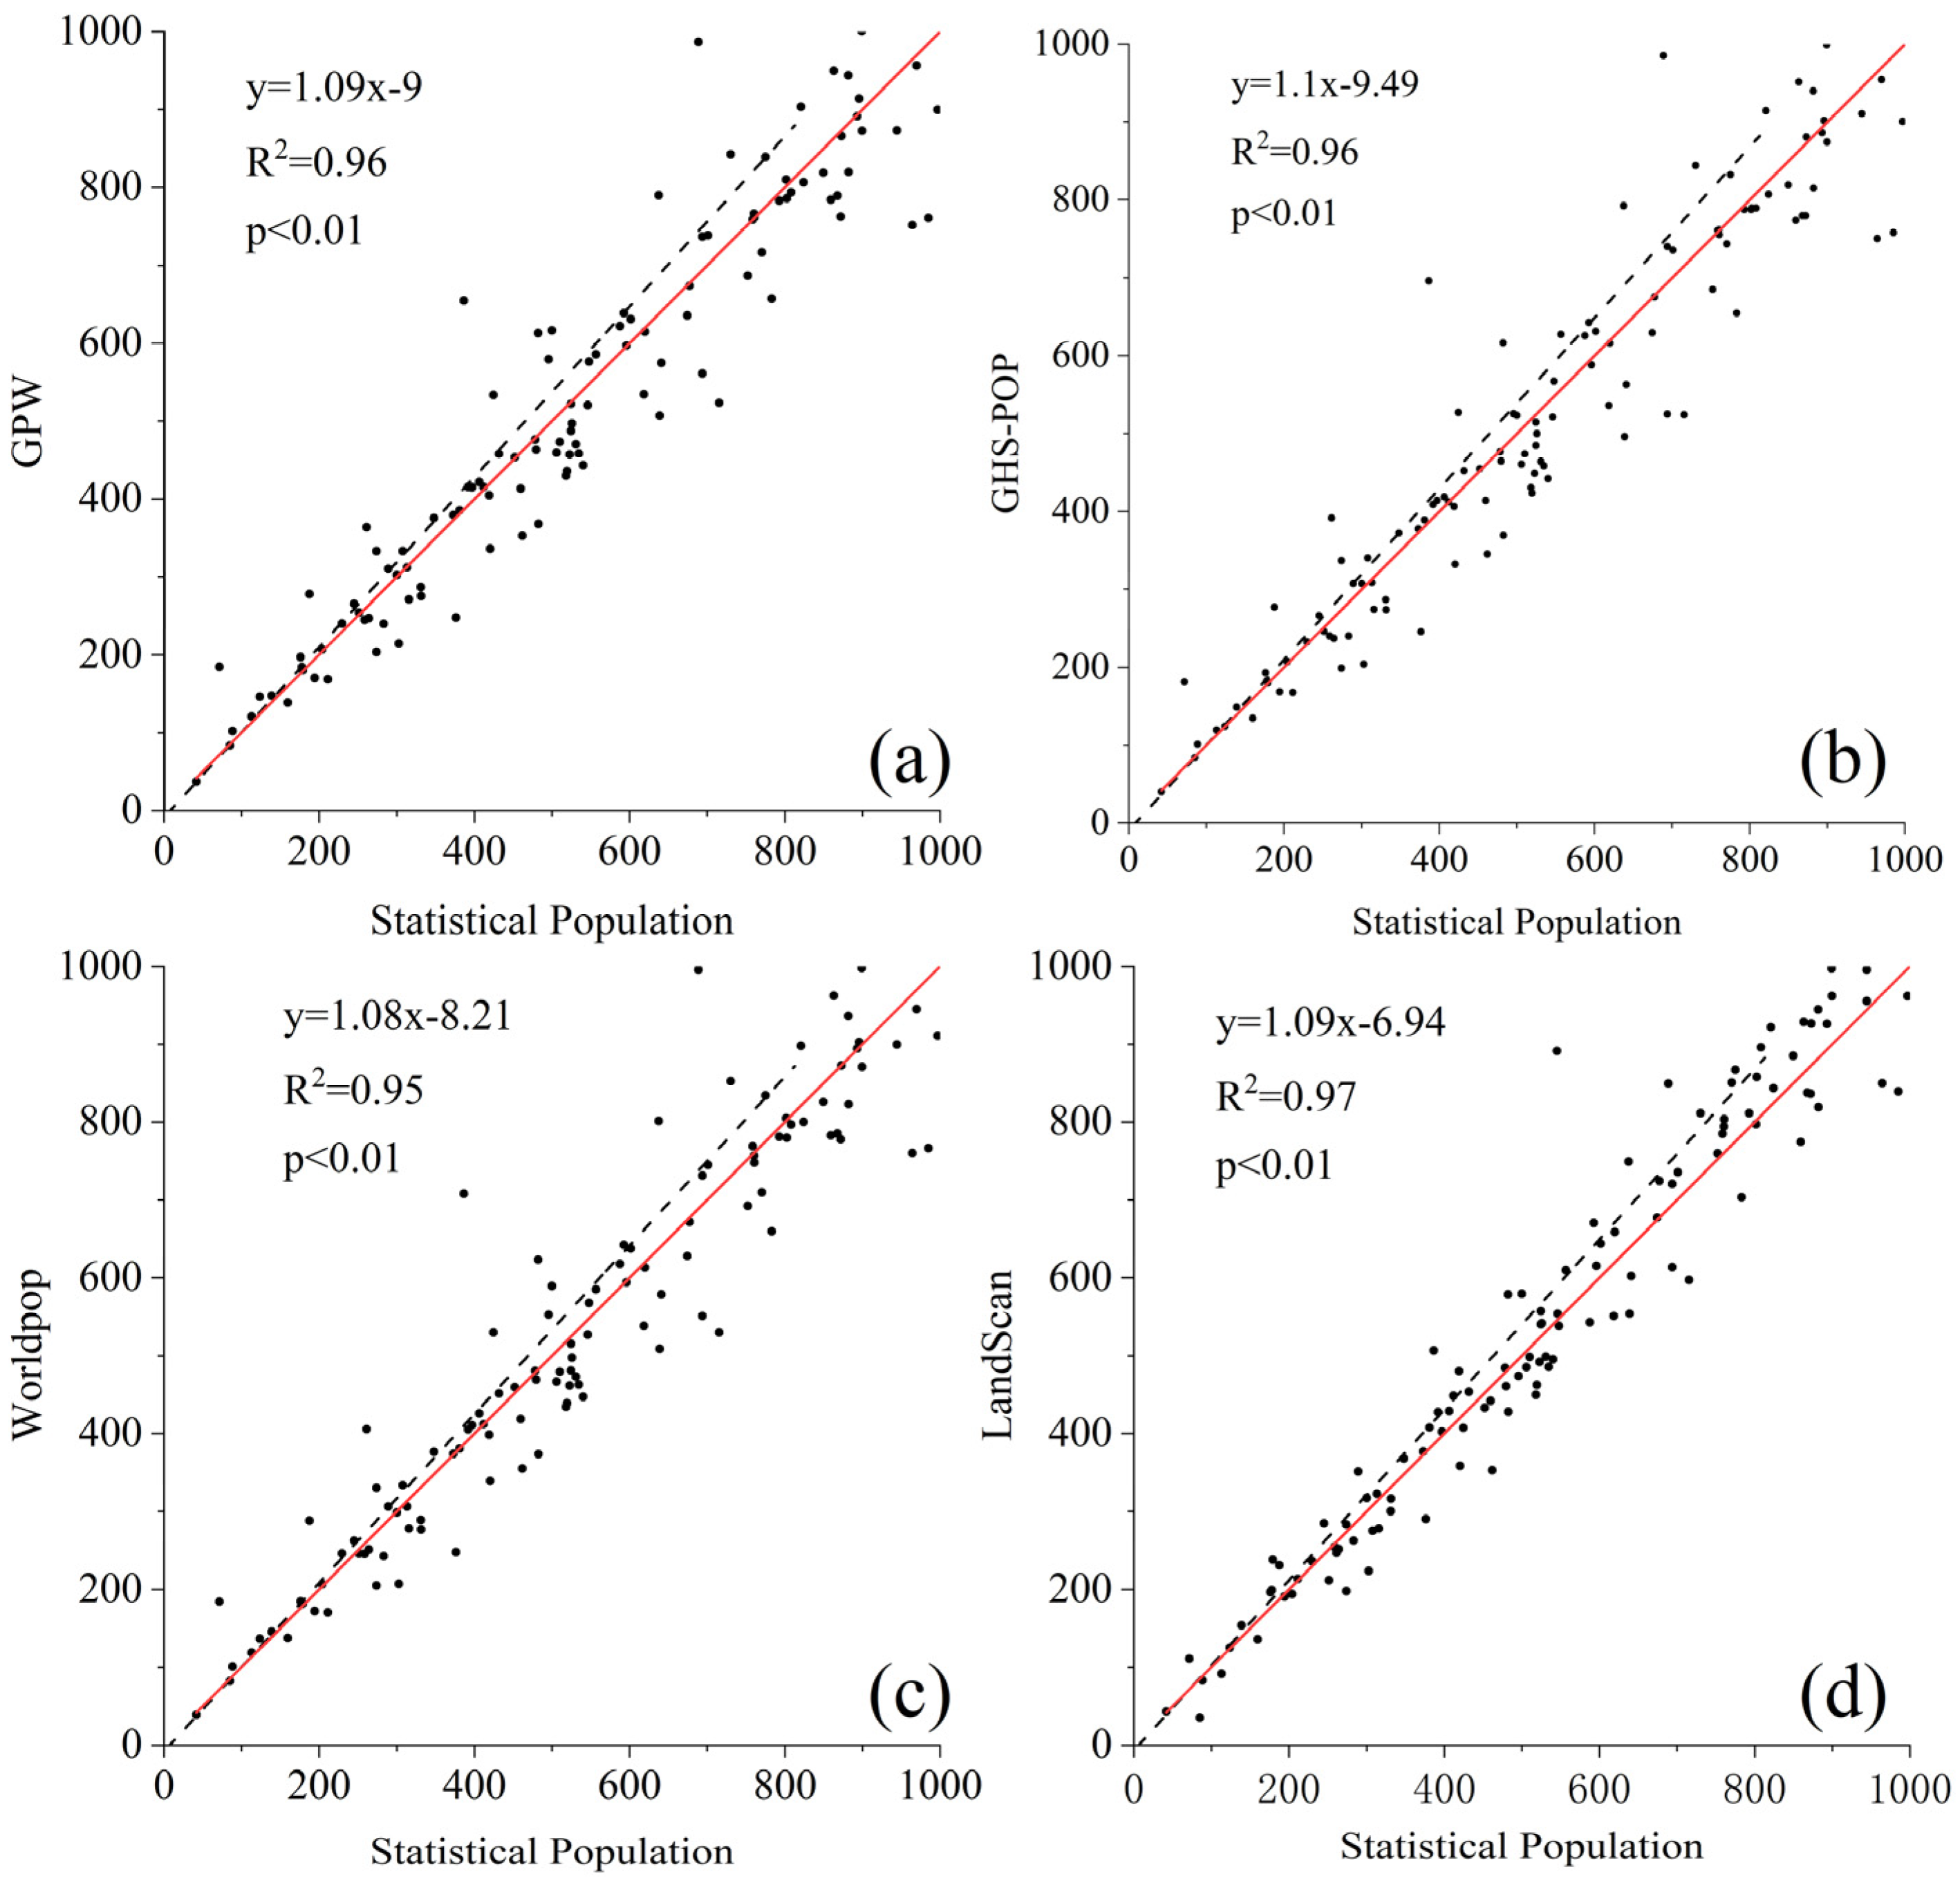
3.2. The Consistency and Discrepancy of the Four Datasets at the Provincial Level

Table 2 shows the results of accuracy assessment between statistical and gridded population datasets. First, the MAE and RMSE fluctuated in the ranges of 12~14 and 30~34, respectively, while their correlation coefficients were consistently greater than 0.95 (Figure 3). In particular, although the GHS-POP and WorldPop use higher spatial resolutions (e.g., 250 m for the GHS-POP and 100 m for the WorldPop), the LandScan has the smallest estimated errors (e.g., MAE and RMSE) and a slightly larger correlation coefficient (CC), showing the best performance among them. From the perspective of relative error distribution (Table 3), more than 60% of the number of provincial administrative regions and approximately 70% proportion of the total population have relative errors within ±10%, indicating that the estimation of the four datasets perform well in the majority of provinces. In terms of the difference in four datasets, the LandScan and WorldPop have the largest number of provinces within a relative error of ±10%, then followed by the GHS-POP and GPW, while the LandScan has the smallest proportion of total population, showing its lowest accuracy within a relative error of ±10%. On the other hand, for large errors (beyond ±20%), the LandScan has the lowest proportion of total population (12.28%), especially for the lowest underestimation (4.13%), but the other three are not much different (i.e., the proportion of total population of the WorldPop, GHS-POP, and GPW is 15.98%, 16.45%, and 16.6%, respectively). Overall, the WorldPop performed the best in terms of small error rates, but the LandScan performed the best in terms of large error rates.
The provincial distribution of ratio errors among the four gridded datasets are huge (Figure 4). First, all provinces in the MSEA are divided into high, medium and low errors with the breakpoints of 10% and 20%. Moreover, in terms of ratio errors in different countries, the LandScan is significantly better than the other three in Thailand, with the proportion of total population beyond the range of ±20% is 18.96%, comparing to the GPW (43.8%), GHS-POP (42.64%), and WorldPop (43.9%), respectively), while in Myanmar and Laos, the WorldPop performed best (the proportion of total population within the range of ±10% is 78.57% and 95.78%, respectively). For Vietnam and Cambodia, the four datasets did not show significant differences. On the other hand, Figure 5 showed the MAE and RMSE of the four datasets in these countries. According to Figure 5, in different countries, the MAE and RMSE of the four datasets in Cambodia and Laos are much close. However, for Myanmar and Vietnam, the WorldPop performed better, and the LandScan may be a better choice for Thailand because of the smallest RMSE. To sum up, the LandScan is relatively more suitable for Thailand and Vietnam, and the WorldPop performs well in Myanmar and Laos, while for Cambodia, the accuracy of both LandScan and WorldPop are acceptable.

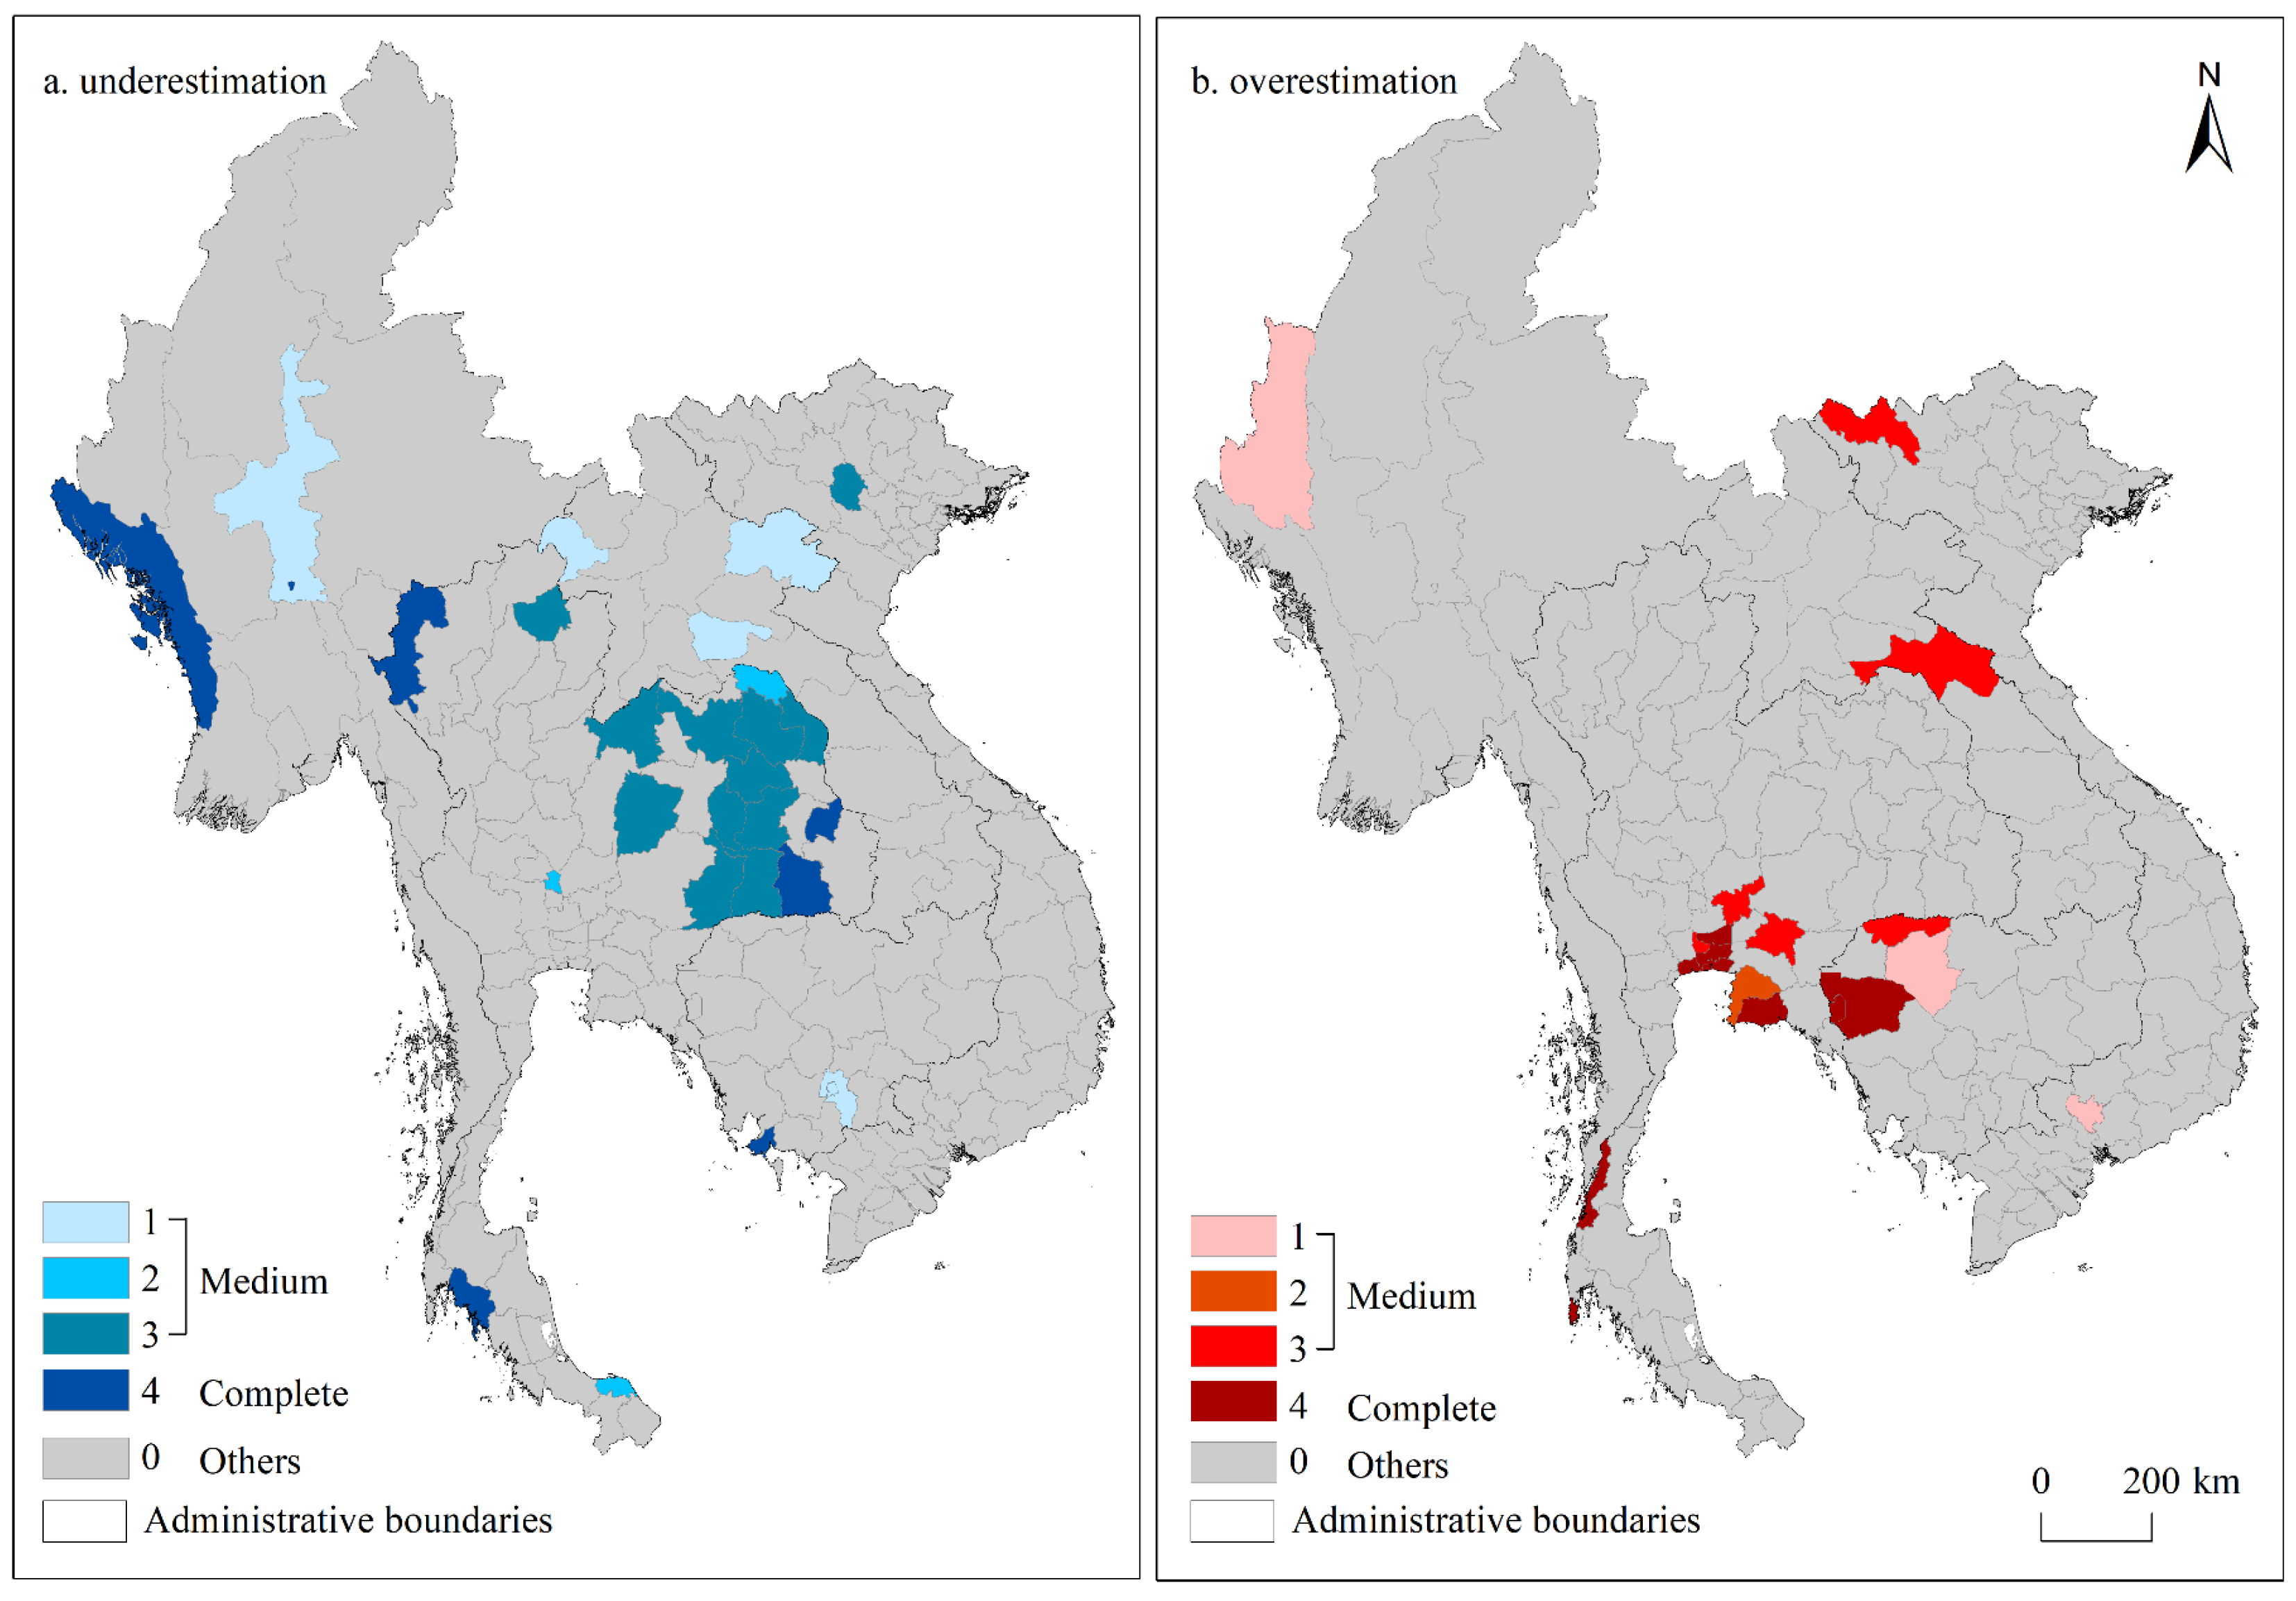
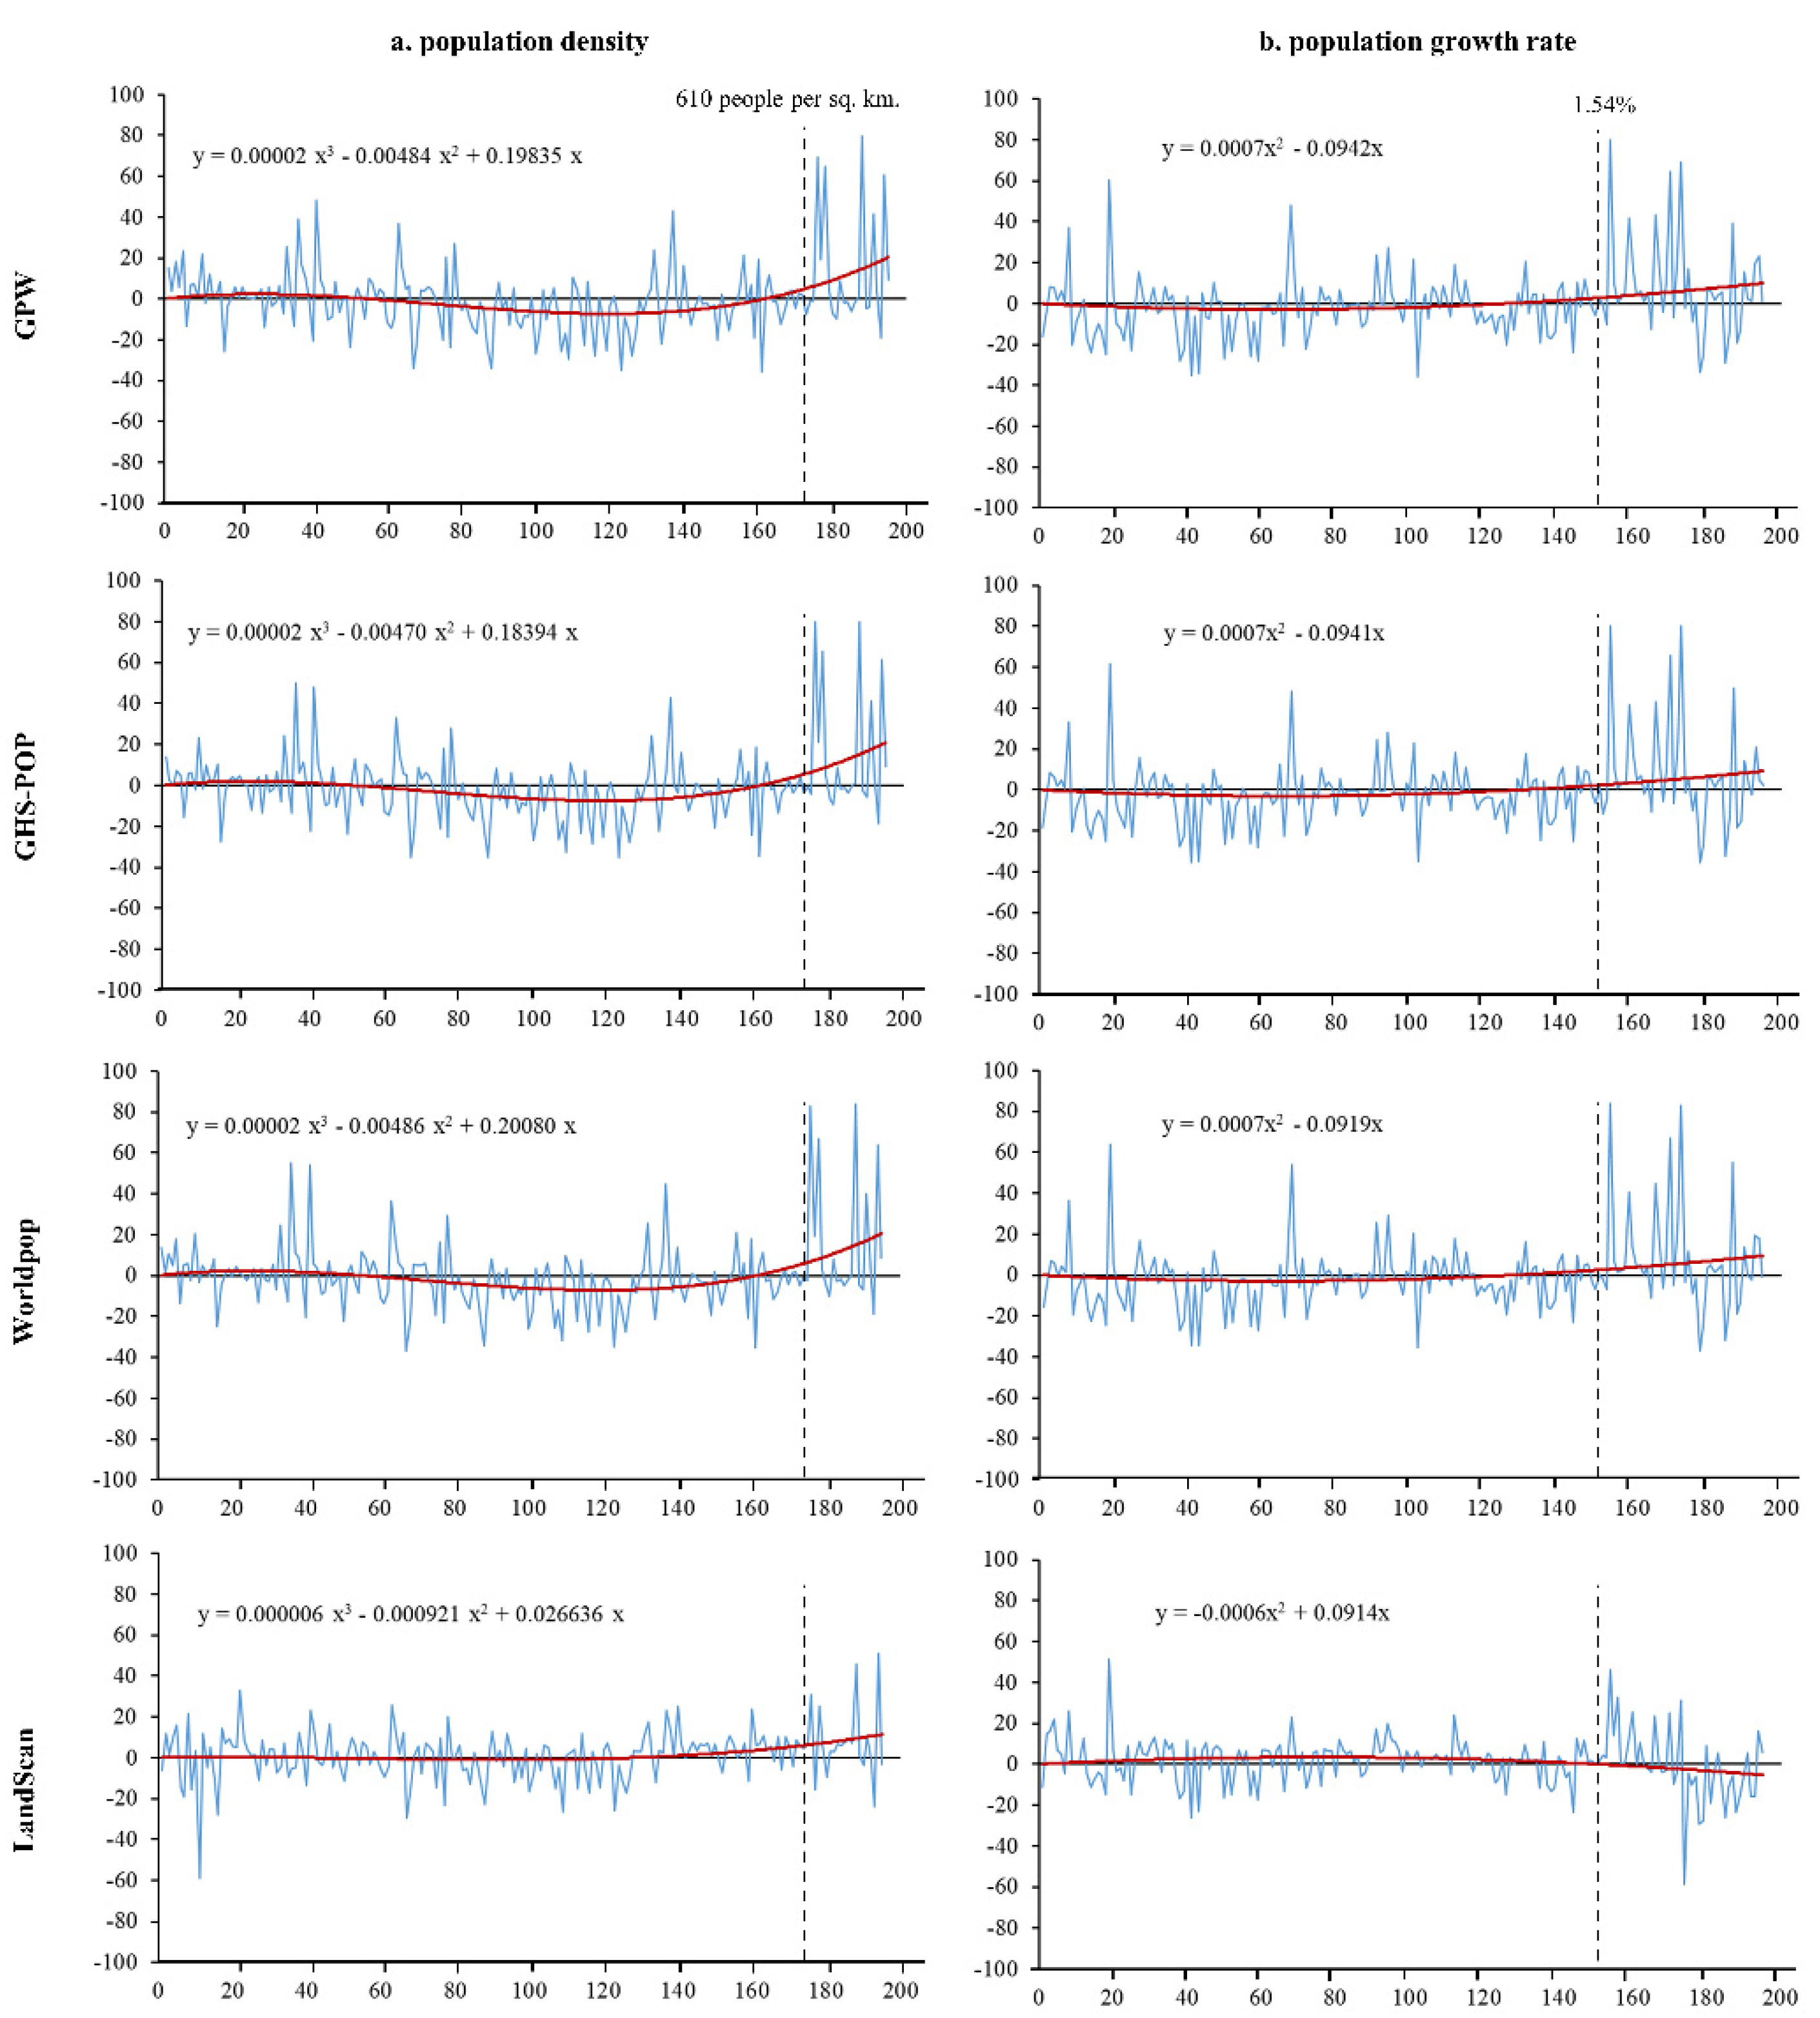
3.3. Large Errors in Different Population Density and Changing Area

Estimated errors of the four gridded datasets increase with the increment of population density and population growth rate, with the key threshold values of approximately 610 persons/km2 and 1.54% (Figure 6, Table 4), respectively. There is a consistent tendency of the errors rising with the increase of population density among the four datasets, and the ratio errors of the four datasets are very small for the Type A, especially for the WorldPop and LandScan. When the population density is over 610 persons/km2 (usually considered to be densely populated [4,22], Type B), the errors of the gridded population datasets increase significantly which clearly shows an overestimated population. It is worth to note that ratio errors of the LandScan dataset is significantly smaller than those of the other three datasets, although the GHS-POP and WorldPop use higher spatial resolution (e.g., 250 m for the GHS-POP, and 100 m for the WorldPop). Similar change features are also seen in the estimated errors of the four gridded datasets along with the increase of population growth rate (the right panels in Figure 6), and the ratio errors of the four gridded datasets are very small (Table 4). However, as the population growth rate exceeds 1.54% (usually considered to be rapid population growth [4,22], Type D), the errors gradually increase, showing the poor estimation of the gridded population datasets. Also, the LandScan performed slightly better than the other three datasets.
Next, we further discussed the spatial distribution of outliers. Firstly, this research defined the provinces with estimated errors exceeding ±20% as outliers, and assigned them with value “1”; if not, it was assigned with “0”. Secondly, the four datasets were summed and analyzed for consistency, that is, when the sum equaled “1~3”, it was classified as “medium consistency”, while those equaling to “4” were considered as “complete consistency”. Finally, a map for spatial distribution of underestimation and overestimation outliers was generated. From Figure 7a, the provinces with underestimating outliers account for 14.14%; and those of “medium consistency” occupied 10.61% are mainly concentrated in the northeast Thailand. Regarding the type of “complete consistency”, the provincial proportion was merely 8.08%, showing a scattered distribution in border and coastal areas. For overestimating outliers (Figure 7b), the proportion is about 9.6%. The provincial ratios of both “medium consistency” and “complete consistency” are about 5.05%. Spatially, the former shows dispersed distribution, while the latter are mostly concentrated on the Bangkok metropolis.

4. Discussion

4.1. Comparative Summaries with the Previous Studies

With the continuous enrichment of gridded population products and increasing application fields, accuracy assessment of the datasets has become the focus of current research. Leyk et al. [20] reviewed the fitness of many gridded population datasets in the perspective of methods for population redistribution and input data. Their results indicate that data users should fully consider the differences according to one’s purposes, for instance, the spatial and temporal resolution, urban or rural and residential or ambient population, etc. Our research is an empirical study echoing their appeal by assessing the errors between statistical population and the four estimated gridded population datasets in MSEA in 2015, which also supports their viewpoints. Similar results were also presented in Archila Bustos et al. paper [22] in Sweden, which further gave an in-depth analysis of data accuracy, and pointed out that even the highly modeled datasets had certain errors showing trade-offs of accuracy and suitability. Our findings also showed that the datasets employed highly complex modeling techniques present lower errors. This is in line with the conclusions that the LandScan and WorldPop, which are highly modeled, have smaller errors than the GPW and GHS-POP [18,22,23,35].
Compared with the earlier research, however, the novelty of this research is reflected in the following two parts: firstly, the cross-comparison of the gridded datasets is an important attempt in MSEA, or a demographics-poor area accounting for rapid population change. Through the cross-comparison of the four datasets for five countries in MSEA, we found that the two highly modeled datasets, the WorldPop and LandScan, have different suitable countries, this finding is instructive for exploring the best fitting gridded population datasets in different regions. Secondly, the exploration of large error characteristics deepens existing research. Through evaluating the accuracy of gridded population datasets at the provincial level, we were able to quantify the consistency and discrepancy in different population density and growth rate areas, and explored where the over- or under-estimation errors were relatively larger.

4.2. Outlook for Future Cross-Comparison and Applications of the Gridded Datasets

Expanding the focus much more broadly, we discussed future cross-comparison and application of the gridded datasets because of the large estimation errors. As previously revealed, the errors rose accordingly along with the increase of population density and growth rate for all gridded datasets, with two key thresholds of 610 persons/km2 and 1.54%. Of course, we believe that these thresholds would be diverse at various spatio-temporal scales, which alert us in actual applications.
For the sake of better understanding the discrepancy of the existing gridded population datasets, this study provides a reference for similar cross-comparative analysis in other countries, especially the densely populated ones, such as Indonesia, India, and Mexico. It is highly recommended to pay attention to two potential challenges. One is to collect statistical census or yearbooks (true values) as much as possible, and the finer statistical units (e.g., a county or district level), the better. The fact that only provincial level census and/or yearbooks can be available in 2015, as well as the Modifiable Area Unit Problem (MAUP) caused by provincial administrative units [36], limits the finer and in-depth investigation in this study. Thus, further research in other demographics-rich countries can be an optimum choice. We note that time-series finer statistical population data can produce much better results. The other, also a pressing issue at present, would be the mechanism research on the causes, extent, and countermeasures of the endless estimation errors. In the regions of rapid changing population like MSEA, why large errors (either over- or under-estimation) of the gridded datasets occur in the parts of high population density and rapid growth; such uncertainties are very worthy to study in the future.

4.3. Suggestions for the Gridded Datasets’ Producers and Users

For data producers, they might pay more attention to the modeling in areas with high population density and growth rate. Large errors increase significantly when the population density and growth rate are higher than 610 persons/km2 and 1.54% in this research, respectively. Similarly, another study also confirmed that the GHS-POP underestimates the population in densely populated regions [26]. Therefore, we appeal that the gridded population data producers would value highly the high population density and growth rate regions when they distribute the population. Moreover, future exploration of the drivers and/or causes are needed, so as to modify the models or add or remove auxiliary input data for better estimation of gridded population.
For data users, they might had better choose the most suitable datasets instead of the most accurate one. As Leyk et al. [20] pointed out, no single gridded population dataset can satisfy all application scenarios. In addition, more ancillary data and more complex modeling methods would incur unexpected errors. Thus, the GPW seems to be more appropriate because it does not use any ancillary data [22]. So, the user community might adopt the lens of the “fitness for use” concept, and choose the appropriate gridded population datasets based on their actual demand. For example, if one is more concerned about the urban population rather than rural population, the GHS-POP, which uses information on built-up areas in the modeling, would be a better choice.

5. Conclusions

Human beings are the key factor of climate change, disaster risk and epidemic spreading, and global gridded population datasets have become the foundational data source for conducting research on the human-nature interrelationship. Thus, reliable and suitable gridded population datasets are very important for the academic community. However, from the perspective of existing research, the applicability of data in areas with rapidly changing populations has received little attention, which is of great significance for improving the quality of datasets.
In this study, Mainland Southeast Asia (MSEA), or a typical area of rapid changing population, was selected to evaluate the accuracy assessment among the four most commonly used datasets, e.g., the GPW, GHS-POP, WorldPop, and LandScan and statistical population (census and/or yearbooks). We found that: Firstly, the LandScan performs the best both in spatial fineness and estimated errors, followed by the WorldPop, GHS-POP, and GPW in the whole region. In regard to an individual country, the LandScan is the best choice in Thailand and Vietnam. The WorldPop better suits the situation for Myanmar and Laos. Similarly, both the LandScan and WorldPop are suitable for Cambodia. Moreover, the analysis of relative errors show that the high population density and rapid population growth area have larger errors for the gridded population datasets. Specifically, when the population density and growth rate are higher than 610 persons/km2 and 1.54%, respectively, the errors of the population raster datasets increase significantly, but for four datasets, the LandScan performs better than the others.

Author Contributions

Conceptualization, Peng Li, Zhiming Feng and Xu Yin; methodology and software, Xu Yin; validation, Peng Li, Yanzhao Yang and Zhen You; formal analysis, investigation, resources, and data curation, Xu Yin; writing—original draft preparation, Xu Yin; writing—review and editing, Peng Li and Chiwei Xiao; visualization and supervision, Peng Li and Zhiming Feng; project administration and funding acquisition, Zhiming Feng, Peng Li and Chiwei Xiao. All authors have read and agreed to the published version of the manuscript.

Funding

This research was funded by the Strategic Priority Research Program of the Chinese Academy of Sciences, grant number XDA20010203; the National Natural Science Foundation of China, grant numbers 41971242 and 42001226; and the Youth Innovation Promotion Association of the Chinese Academy of Sciences, grant number 2020055. The APC was funded by XDA20010203.

Acknowledgments

We are grateful to our team for their advice and encouragement.

Conflicts of Interest

The authors declare no conflict of interest.

References

  1. Abel, C.; Horion, S.; Tagesson, T.; Keersmaecker, D.W.; Seddon, A.W.R.; Abdi, A.M.; Fensholt, R. The human–environment nexus and vegetation–rainfall sensitivity in tropical drylands. Nat. Sustain. 2021, 4, 25–32. [Google Scholar] [CrossRef]
  2. Feng, Z.; Xiao, C.; Li, P.; You, Z.; Yin, X.; Zheng, F. Comparison of spatio-temporal transmission characteristics of COVID-19 and its mitigation strategies in China and the US. J. Geogr. Sci. 2020, 30, 1963–1984. [Google Scholar] [CrossRef]
  3. Sarkar, P.; Debnath, N.; Reang, D. Coupled human-environment system amid COVID-19 crisis: A conceptual model to understand the nexus. Sci. Total Environ. 2021, 753, 141757. [Google Scholar] [CrossRef]
  4. United Nations. World Population Prospects 2019; United Nations Press: New York, NY, USA, 2019. [Google Scholar]
  5. Naidoo, R.; Fisher, B. Sustainable Development Goals: Pandemic reset. Nature 2020, 583, 198–201. [Google Scholar] [CrossRef]
  6. Ribeiro, H.V.; Rybski, D.; Kropp, J.P. Effects of changing population or density on urban carbon dioxide emissions. Nat. Commun. 2019, 10, 1. [Google Scholar] [CrossRef] [Green Version]
  7. Kugler, T.A.; Grace, K.; Wrathall, D.J.; de Sherbinin, A.; Van Riper, D.; Aubrecht, C.; Comer, D.; Adamo, S.B.; Cervone, G.; Engstrom, R.; et al. People and Pixels 20 years later: The current data landscape and research trends blending population and environmental data. Popul. Environ. 2019, 41, 209–234. [Google Scholar] [CrossRef]
  8. Center for International Earth Science Information Network (CIESIN). Gridded Population of the World, Version 4 (GPWV4): Population Count Adjusted to Match 2015 Revision of un wpp Country Totals, Revision 11; Center for International Earth Science Information Network (CIESIN): New York, NY, USA, 2018. [Google Scholar]
  9. Melchiorri, M.; Pesaresi, M.; Florczyk, A.; Corbane, C.; Kemper, T. Principles and Applications of the Global Human Settlement Layer as Baseline for the Land Use Efficiency Indicator—SDG 11.3.1. ISPRS Int. J. Geo-Inf. 2019, 8, 96. [Google Scholar] [CrossRef] [Green Version]
  10. Tatem, A.J. WorldPop, open data for spatial demography. Sci. Data. 2017, 4, 1. [Google Scholar] [CrossRef] [PubMed]
  11. Dobson, J.E.; Bright, E.A.; Coleman, P.R.; Durfee, R.C.; Worley, B.A. LandScan: A global population database for estimating populations at risk. Photogramm. Eng. Remote Sens. 2000, 66, 849–857. [Google Scholar]
  12. Burke, M.; Driscoll, A.; Lobell, D.B.; Ermon, S. Using satellite imagery to understand and promote sustainable development. Science 2021, 371, 6535. [Google Scholar] [CrossRef] [PubMed]
  13. Chen, M.; Sui, Y.; Liu, W.; Liu, H.; Huang, Y. Urbanization patterns and poverty reduction: A new perspective to explore the countries along the Belt and Road. Habitat Int. 2019, 84, 1–14. [Google Scholar] [CrossRef]
  14. Li, Y.; Derudder, B. Dynamics in the polycentric development of Chinese cities, 2001–2016. Urban Geogr. 2020, 42, 1–21. [Google Scholar] [CrossRef]
  15. Nguyen, L.H.; Nghiem, S.V.; Henebry, G.M. Expansion of major urban areas in the US Great Plains from 2000 to 2009 using satellite scatterometer data. Remote Sens. Environ. 2018, 204, 524–533. [Google Scholar] [CrossRef]
  16. Flies, E.J.; Williams, C.R.; Weinstein, P.; Anderson, S.J. Improving public health intervention for mosquito-borne disease: The value of geovisualization using source of infection and LandScan data. Epidemiol. Infect. 2016, 144, 3108–3119. [Google Scholar] [CrossRef] [PubMed] [Green Version]
  17. Nieves, J.J.; Stevens, F.R.; Gaughan, A.E.; Linard, C.; Sorichetta, A.; Hornby, G.; Patel, N.N.; Tatem, A.J. Examining the correlates and drivers of human population distributions across low- and middle-income countries. J. R. Soc. Interface 2017, 14, 20170401. [Google Scholar] [CrossRef] [Green Version]
  18. Mohanty, M.P.; Simonovic, S.P. Understanding dynamics of population flood exposure in Canada with multiple high-resolution population datasets. Sci. Total Environ. 2021, 759, 143559. [Google Scholar] [CrossRef]
  19. Wu, J.; Li, Y.; Li, N.; Shi, P. Development of an Asset Value Map for Disaster Risk Assessment in China by Spatial Disaggregation Using Ancillary Remote Sensing Data. Risk Anal. 2018, 38, 17–30. [Google Scholar] [CrossRef]
  20. Leyk, S.; Gaughan, A.E.; Adamo, S.B.; de Sherbinin, A.; Balk, D.; Freire, S.; Rose, A.; Stevens, F.R.; Blankespoor, B.; Frye, C.; et al. The spatial allocation of population: A review of large-scale gridded population data products and their fitness for use. Earth Syst. Sci. Data. 2019, 11, 1385–1409. [Google Scholar] [CrossRef] [Green Version]
  21. Bai, Z.; Wang, J.; Wang, M.; Gao, M.; Sun, J. Accuracy Assessment of Multi-Source Gridded Population Distribution Datasets in China. Sustainability 2018, 10, 1363. [Google Scholar] [CrossRef] [Green Version]
  22. Archila Bustos, M.F.; Hall, O.; Niedomysl, T.; Ernstson, U. A pixel level evaluation of five multitemporal global gridded population datasets: A case study in Sweden, 1990–2015. Popul. Environ. 2020, 42, 255–277. [Google Scholar] [CrossRef]
  23. Xu, Y.; Ho, H.C.; Knudby, A.; He, M. Comparative assessment of gridded population data sets for complex topography: A study of Southwest China. Popul. Environ. 2021, 42, 360–378. [Google Scholar] [CrossRef]
  24. Chen, R.; Yan, H.; Liu, F.; Du, W.; Yang, Y. Multiple Global Population Datasets: Differences and Spatial Distribution Characteristics. ISPRS Int. J. Geo-Inf. 2020, 9, 637. [Google Scholar] [CrossRef]
  25. Dayley, R. Southeast Asia in the New International Era; Routledge: New York, NY, USA, 2019. [Google Scholar]
  26. Calka, B.; Bielecka, E. GHS-POP Accuracy Assessment: Poland and Portugal Case Study. Remote Sens. 2020, 12, 1105. [Google Scholar] [CrossRef] [Green Version]
  27. Gaughan, A.E.; Stevens, F.R.; Linard, C.; Jia, P.; Tatem, A.J. High resolution population distribution maps for Southeast Asia in 2010 and 2015. PLoS ONE. 2013, 8, e55882. [Google Scholar] [CrossRef]
  28. Robins, L. A policy dialogue on rice futures: Rice-based farming systems research in the Mekong region. In Proceedings of the A Policy Dialogue on Rice Futures: Rice-Based Farming Systems Research in the Mekong Region, Phnom Penh, Cambodia, 7–9 May 2014; ACIAR Proceedings No. 142. Australian Centre for International Agricultural Research: Canberra, Australia, 2014; p. 158. [Google Scholar]
  29. Langill, J.C.; Willis, A.S. The critical need for reciprocity between educational migrants and communities for continuing education and socio-cultural capital in Laos. Asia Pac. Viewp. 2020, 61, 118–133. [Google Scholar] [CrossRef]
  30. Rungmanee, S. Unravelling the Dynamics of Border Crossing and Rural-to-Rural-to-Urban Mobility in the Northeastern Thai-Lao Borderlands. Popul. Space Place. 2016, 22, 693–704. [Google Scholar] [CrossRef]
  31. Sari, B.R. Borders and Beyond: Transnational Migration and Diaspora in Northern Thailand Border Areas with Myanmar and Laos; Yayasan Pustaka Obor Indonesia: Jakarta, Indonesia, 2018. [Google Scholar]
  32. Giang, L.T.; Nguyen, C.V.; Nguyen, H.Q. The impacts of economic growth and governance on migration: Evidence from Vietnam. Eur. J. Dev. Res. 2020, 32, 1195–1229. [Google Scholar] [CrossRef]
  33. Xiao, C.; Li, P.; Feng, Z. Re-delineating mountainous areas with three topographic parameters in Mainland Southeast Asia using ASTER global digital elevation model data. J. Mt. Sci. Engl. 2018, 15, 1728–1740. [Google Scholar] [CrossRef]
  34. Willmott, C.J.; Matsuura, K. Advantages of the mean absolute error (MAE) over the root mean square error (RMSE) in assessing average model performance. Clim. Res. 2005, 30, 79–82. [Google Scholar] [CrossRef]
  35. Smith, A.; Bates, P.D.; Wing, O.; Sampson, C.; Quinn, N.; Neal, J. New estimates of flood exposure in developing countries using high-resolution population data. Nat. Commun. 2019, 10, 1814. [Google Scholar] [CrossRef] [Green Version]
  36. Klotz, M.; Kemper, T.; Geiß, C.; Esch, T.; Taubenböck, H. How good is the map? A multi-scale cross-comparison framework for global settlement layers: Evidence from Central Europe. Remote Sens. Environ. 2016, 178, 191–212. [Google Scholar] [CrossRef] [Green Version]
Figure 1. Topography (a) of MSEA and population density (b) at the provincial level of the five countries (2015). Note: the number in the brackets in (b) represents the count of provincial units.
Ijgi 10 00681 g001
Figure 2. Differences in the spatial distribution of the four gridded population datasets in MSEA in 2015. Note that the two satellite images are sourced from Google Earth (2015).
Ijgi 10 00681 g002
Figure 3. Comparation of statistical and estimated population of the four datasets: (a) the GPW, (b) the GHS-POP, (c) the WorldPop, (d) the LandScan in MSEA. (Unit: thousand persons).
Ijgi 10 00681 g003
Figure 4. The distribution of ratio errors of the four gridded population datasets in MSEA.
Ijgi 10 00681 g004
Figure 5. Column charts of estimated errors of the four gridded population datasets for countries in MSEA.
Ijgi 10 00681 g005
Figure 6. Changes in the ratio errors of the four gridded datasets with the increment of population density (a) and growth rate (b). The red line refers to the fitting line of the errors, and the formula in each figure is the fitting equation without considering the outliers.
Ijgi 10 00681 g006
Figure 7. Maps for spatial distribution of the outliers’ consistency (a) underestimation; (b) overestimation in MSEA.
Ijgi 10 00681 g007
Table 1. Characteristics of the four gridded population datasets used in this study.
VersionProducersSpatial ResolutionYearsSimulation MethodsPopulation Sources and
Auxiliary Data
Publications Indexed by the
WoS (as of 27 September 2021)
UnmodeledGPW v4.11
UNWPP-adjusted population count
Columbia University and Center for International Earth Science Information Network (CIESIN)1 km2000, 2005, 2010, 2015, and 2020Areal weightingCensus, administrative boundaries, and World Population Prospects (2015 Revision)31
Lightly modeledGHS-POP
R2019A
European Commission250 m and 1 km1975, 1990, 2000, and 2015Dasymetric refinementGPW v4 and remote sensing imagery72
Highly modeledWorldPop
population count
University of Southampton and other organizations100 m and 1 km2000–2020 (time series)Multivariate dasymetricCensus, geographic data, night-time lights, and volunteer geographic information70
LandScanOak Ridge National Laboratory1 km1998 and 2000–2019 (time series)Smart interpolationCensus, geographic data, and remote sensing imagery133
Table 2. Accuracy assessment between gridded and statistical population datasets.
DatasetsMAERMSECC
GPW13.74 33.18 0.973
GHS-POP13.78 33.52 0.973
WorldPop13.29 33.80 0.971
LandScan11.88 29.74 0.978
Table 3. The ratio errors of the four gridded population datasets by different classification in MSEA.
Error Rate/%GPWGHS-POPWorldPopLandScan
Number
of Provinces
Proportion of Total Population/%Number
of Provinces
Proportion of
Total Population/%
Number
of Provinces
Proportion of
Total Population/%
Number
of Provincse
Proportion of
Total Population/%
<−20219.19229.48209.2294.13
−20~−10225.68226.27215.61238.01
−10~1012571.8212568.4113072.3213165.70
10~20125.90138.87116.092214.01
>20187.41166.97166.76138.15
Table 4. Accuracy assessment of the four gridded datasets in the high and low-to-medium population density.
ClassificationDatasetsMAERMSECC
Population
Density
(People per sq. km.)
Type A
(≤610)
GPW10.2519.440.980
GHS-POP10.2019.370.980
WorldPop9.6518.600.980
LandScan9.4921.160.982
Type B
(>610)
GPW37.8478.150.927
GHS-POP38.4979.380.928
WorldPop38.4681.560.924
LandScan28.4462.510.932
Population growth rate/%Type C
(≤1.54)
GPW10.4330.560.958
GHS-POP10.4530.920.958
WorldPop10.1431.660.955
LandScan9.2226.330.975
Type D
(>1.54)
GPW25.3041.060.965
GHS-POP25.4141.360.965
WorldPop24.3240.390.964
LandScan21.1939.420.964
Notes: We defined the population of more than 610 persons per sq. km. as the low-to-medium category (Type A), otherwise as the high-density category (Type B), followed by the slow—(Type C) and fast—(Type D) growth categories according to the threshold (1.54%) of population growth rate.
Publisher’s Note: MDPI stays neutral with regard to jurisdictional claims in published maps and institutional affiliations.

