1. Introduction
The rapid, unplanned growth of cities along with the excessive growth in population during the past few decades have led to the use of land that is susceptible to seismic movement. The lack of suitable urban land for the accommodation of this population has resulted in the increased vulnerability of cities to natural disasters, especially earthquakes and landslides. According to the United Nations (UN) and the World Bank, earthquakes are the foremost factor causing life and financial losses around the world [
1,
2,
3]. This is also true in Iran, which is prone to landslides due to its specific geological and climatic conditions, as well as its topography. This has caused the country to experience incredible yearly losses [
4,
5,
6].
The risk of earthquakes resulting in natural disasters has always existed for human beings. Despite advances in science and technology, earthquakes are still unpredictable, and frequently cause life and financial losses [
7,
8,
9,
10]. According to the World Health Organization (WTO), 1150 major earthquakes have occurred in the current century alone [
11]. Although natural disasters usually occur in developing areas, developed countries tend to have sufficient resources and equipment to help survivors. However, these are not always available in developing countries [
12,
13].
Iran is a developing country that has experienced major earthquakes which have caused the collapse of many urban and rural houses, and have taken many lives. For example, in the last few years, more than 170,000 people died during large earthquakes in Bam, Ahar, Varzaghan, Larijan, Rudbar, Tabas, Kerman, and Torbat Heidarriyeh [
14]. The earthquake of Sare-Pol Zahab, Kermanshah, for example, destroyed most of the villages in the area and caused great damage to the city. In total, 620 people died [
15]. Recently, a few large earthquakes also occurred which have caused huge damage to cities—e.g., the Si-Sakht earthquake in Bandar Genaveh [
16].
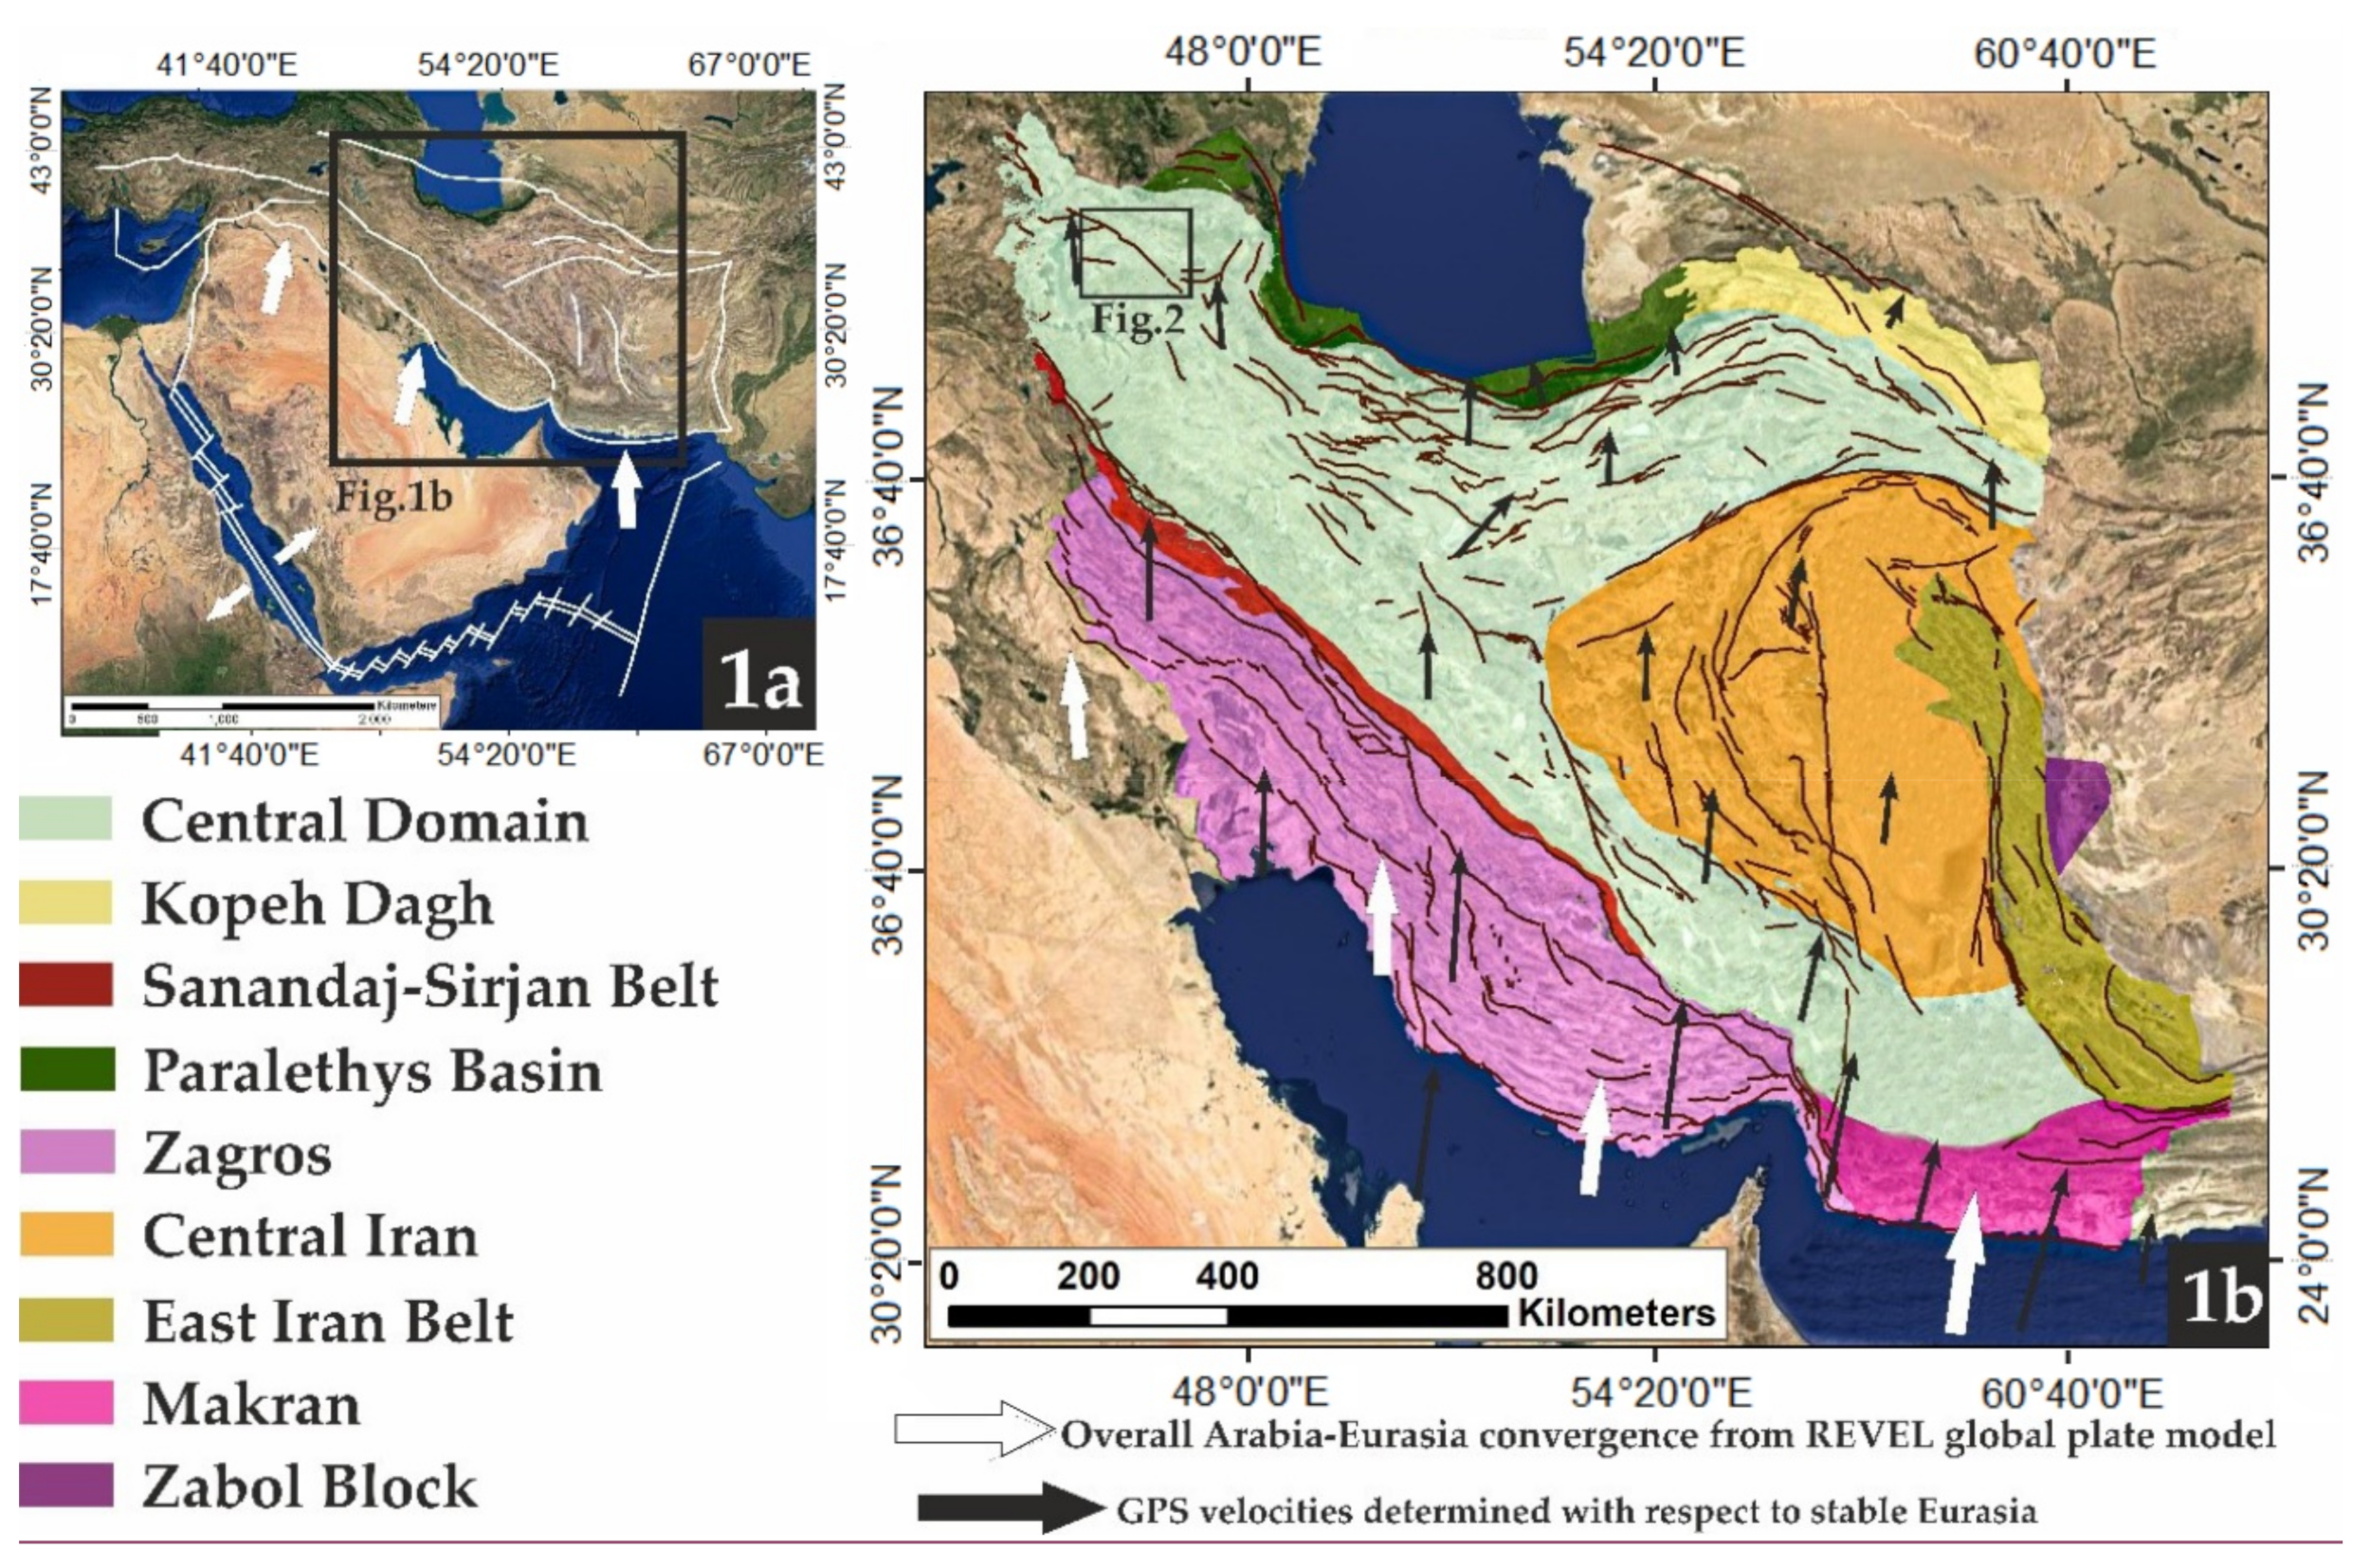
Iran is located on the Alpine–Himalayan folded belt, as well as the compression zone resulting from the convergence of the Arabian and Eurasian plates. The convergence of these two plates has caused a regional deformation of the continental crust, with an area of approximately 3,000,000 km
2, making the area one of the largest convergence-bounded deformed areas on Earth [
17]. The convergence of the Arabian and Eurasian plates at a rate of 2 mm/year has created a complex system of reverse and strike-slip faults (
Figure 1a) [
18]. Strike-slip faults are among the most important structural elements at the boundary of the plates [
19]. These faults, which have a length of more than 100 km, have been observed and reported in many seismic continental areas [
20].
The core of the formation of the city of Tabriz was near the Tabriz Fault, and over time, with the growth of the city, it has become closer to the fault, so that today part of the city is located on the fault.
The 1721 Tabriz earthquake occurred on April 26th, with an epicenter near the west of the city of Tabriz, Iran, at approximately 7:00 in the morning, one and a half hours after sunrise. The earthquake was estimated to have a 7.3 magnitude on the Richter Scale. The earthquake occurred along the North Tabriz Fault (NTF). The population of Tabriz in 1721 was about 500,000 people. Over 80,000 deaths occurred as a result of the earthquake, killing over one-sixth of the population [
21,
22,
23,
24].
The largest historical earthquake in Tabriz, in 1780, occurred on January 8, Friday night, in the southeast of Tabriz. The earthquake was estimated to have a 7.3 magnitude on the Richter Scale. The earthquake occurred along the Tabriz Fault (NTF), in which all of the buildings that had been affected by the 1721 earthquake collapsed, and many buildings were destroyed. As a result of this earthquake, the palace of the ruler collapsed and all of its inhabitants were killed. The death toll was estimated at approximately 50,000 [
21,
22,
23,
24]. Alisha Ark, Kaboud Mosque, and Sahib Al-Amr Mosque were damaged due to the mentioned earthquakes, and repairs have been performed; however, there are traces of the earthquake in them.
SEISMOCARE is also a model that runs on an Arc map, and was developed in Greece to estimate the extent of the damage and vulnerability of an area. This model is used as a database for storing information [
25]. SELENA is a type of software that can be used to estimate the seismic risk in urban areas using the Capacity Spectrum Method (CSM). The data required for the software are statistics and data related to buildings, the population, and the earthquake scenario, etc. This model constructs a shake map and calculates the probability of economic damage, and the number of lives lost [
26,
27].
As the vulnerability diagrams differ for different regions of the world, each country needs to have its specific model to assess vulnerability and carry out rapid damage assessments. In Iran, the Karmania Hazard Model (KHM) was developed in 2013 by Hassanzadeh et al. for the city of Kerman. This model has an interactive environment that provides layers of spatial data and the vulnerability coefficients of buildings and the population in order to estimate the amount of damage to buildings and facilities that are necessary to care for survivors and the injured. In this model, surface and subsurface data, as well as building vulnerability diagrams and resident population statistical data, are used for the estimation of vulnerability [
28].
Based on the above-mentioned statements, the main objective of this research is to identify vulnerabilities and estimate losses/damages for planning to reduce them. For this goal, all of the effective parameters—including the geoid shape, topography, lithology, alluvial thickness, groundwater level, sediments, shear wave velocity, and the predominant period of the site—were used through interpolation or conversion to GIS layers to obtain a site amplification map for different areas using the Saati hierarchical weighting method [
29,
30].
Then, to obtain the maximum seismic intensity map, the site amplification map was combined with the modified Mercalli map for both the 1780 and 1721 earthquakes, and the maximum seismic intensity map was obtained. The information about the types of buildings in the city of Tabriz was updated using detailed and comprehensive plans and field observations. Finally, the vulnerability levels of buildings in the city of Tabriz were calculated for all of the districts for both scenarios of Tabriz’s historical earthquakes.
2. Study Area
The study area is the entire metropolis of Tabriz. Tabriz is located in the center of East Azarbaijan province. It is the most populous city in the northwest of the country, and the fifth-largest city in Iran. The city is located 636 km away from the capital city of Tehran. The average altitude of Tabriz is 1351 m above sea level, and its area is approximately 625 km
2. Tabriz city is located at the eastern end of the Tabriz plain in the Sahand foothills. It is bordered by the Inali Mountains on the north, the northern slopes of the Sahand Volcanic Massif on the south, the trails of the Eynali Mountains on the east, and the Tabriz Plain on the west. Tabriz is like a massive pit surrounded by mountains on three sides. The area to the west is mainly formed by salt marshes. The altitude of the city is 1350 to 1550 m, the general slope of which decreases towards the center and west [
31,
32,
33].
The city of Tabriz was developed mainly based on young alluvium. In addition, the city spread across sandstone and Miocene marl in the north, and especially the northeast. It also lies on different areas of Plio-Pleistocene hard conglomerates, sandstones, igneous rocks, Pleocene tuff, and clastic deposits in the south, southeast, and part of the southwest, as well as young alluvium in the southwest. The bedrock of alluvium is composed of Miocene or Pleocene sediments [
34,
35,
36,
37].
The northern part of the city has been eroded by alluvial fans, including young or relatively old alluvial masses of relatively steep slopes and foothills. Upstream, these sediments join the Miocene (upper red formations). Oun Ibn Ali Mountain, with its red color due to red marls and sandstones, forms the northern heights of the city. Tabriz’s northern fault passes between these hard sediments and relatively loose alluvial fans [
38,
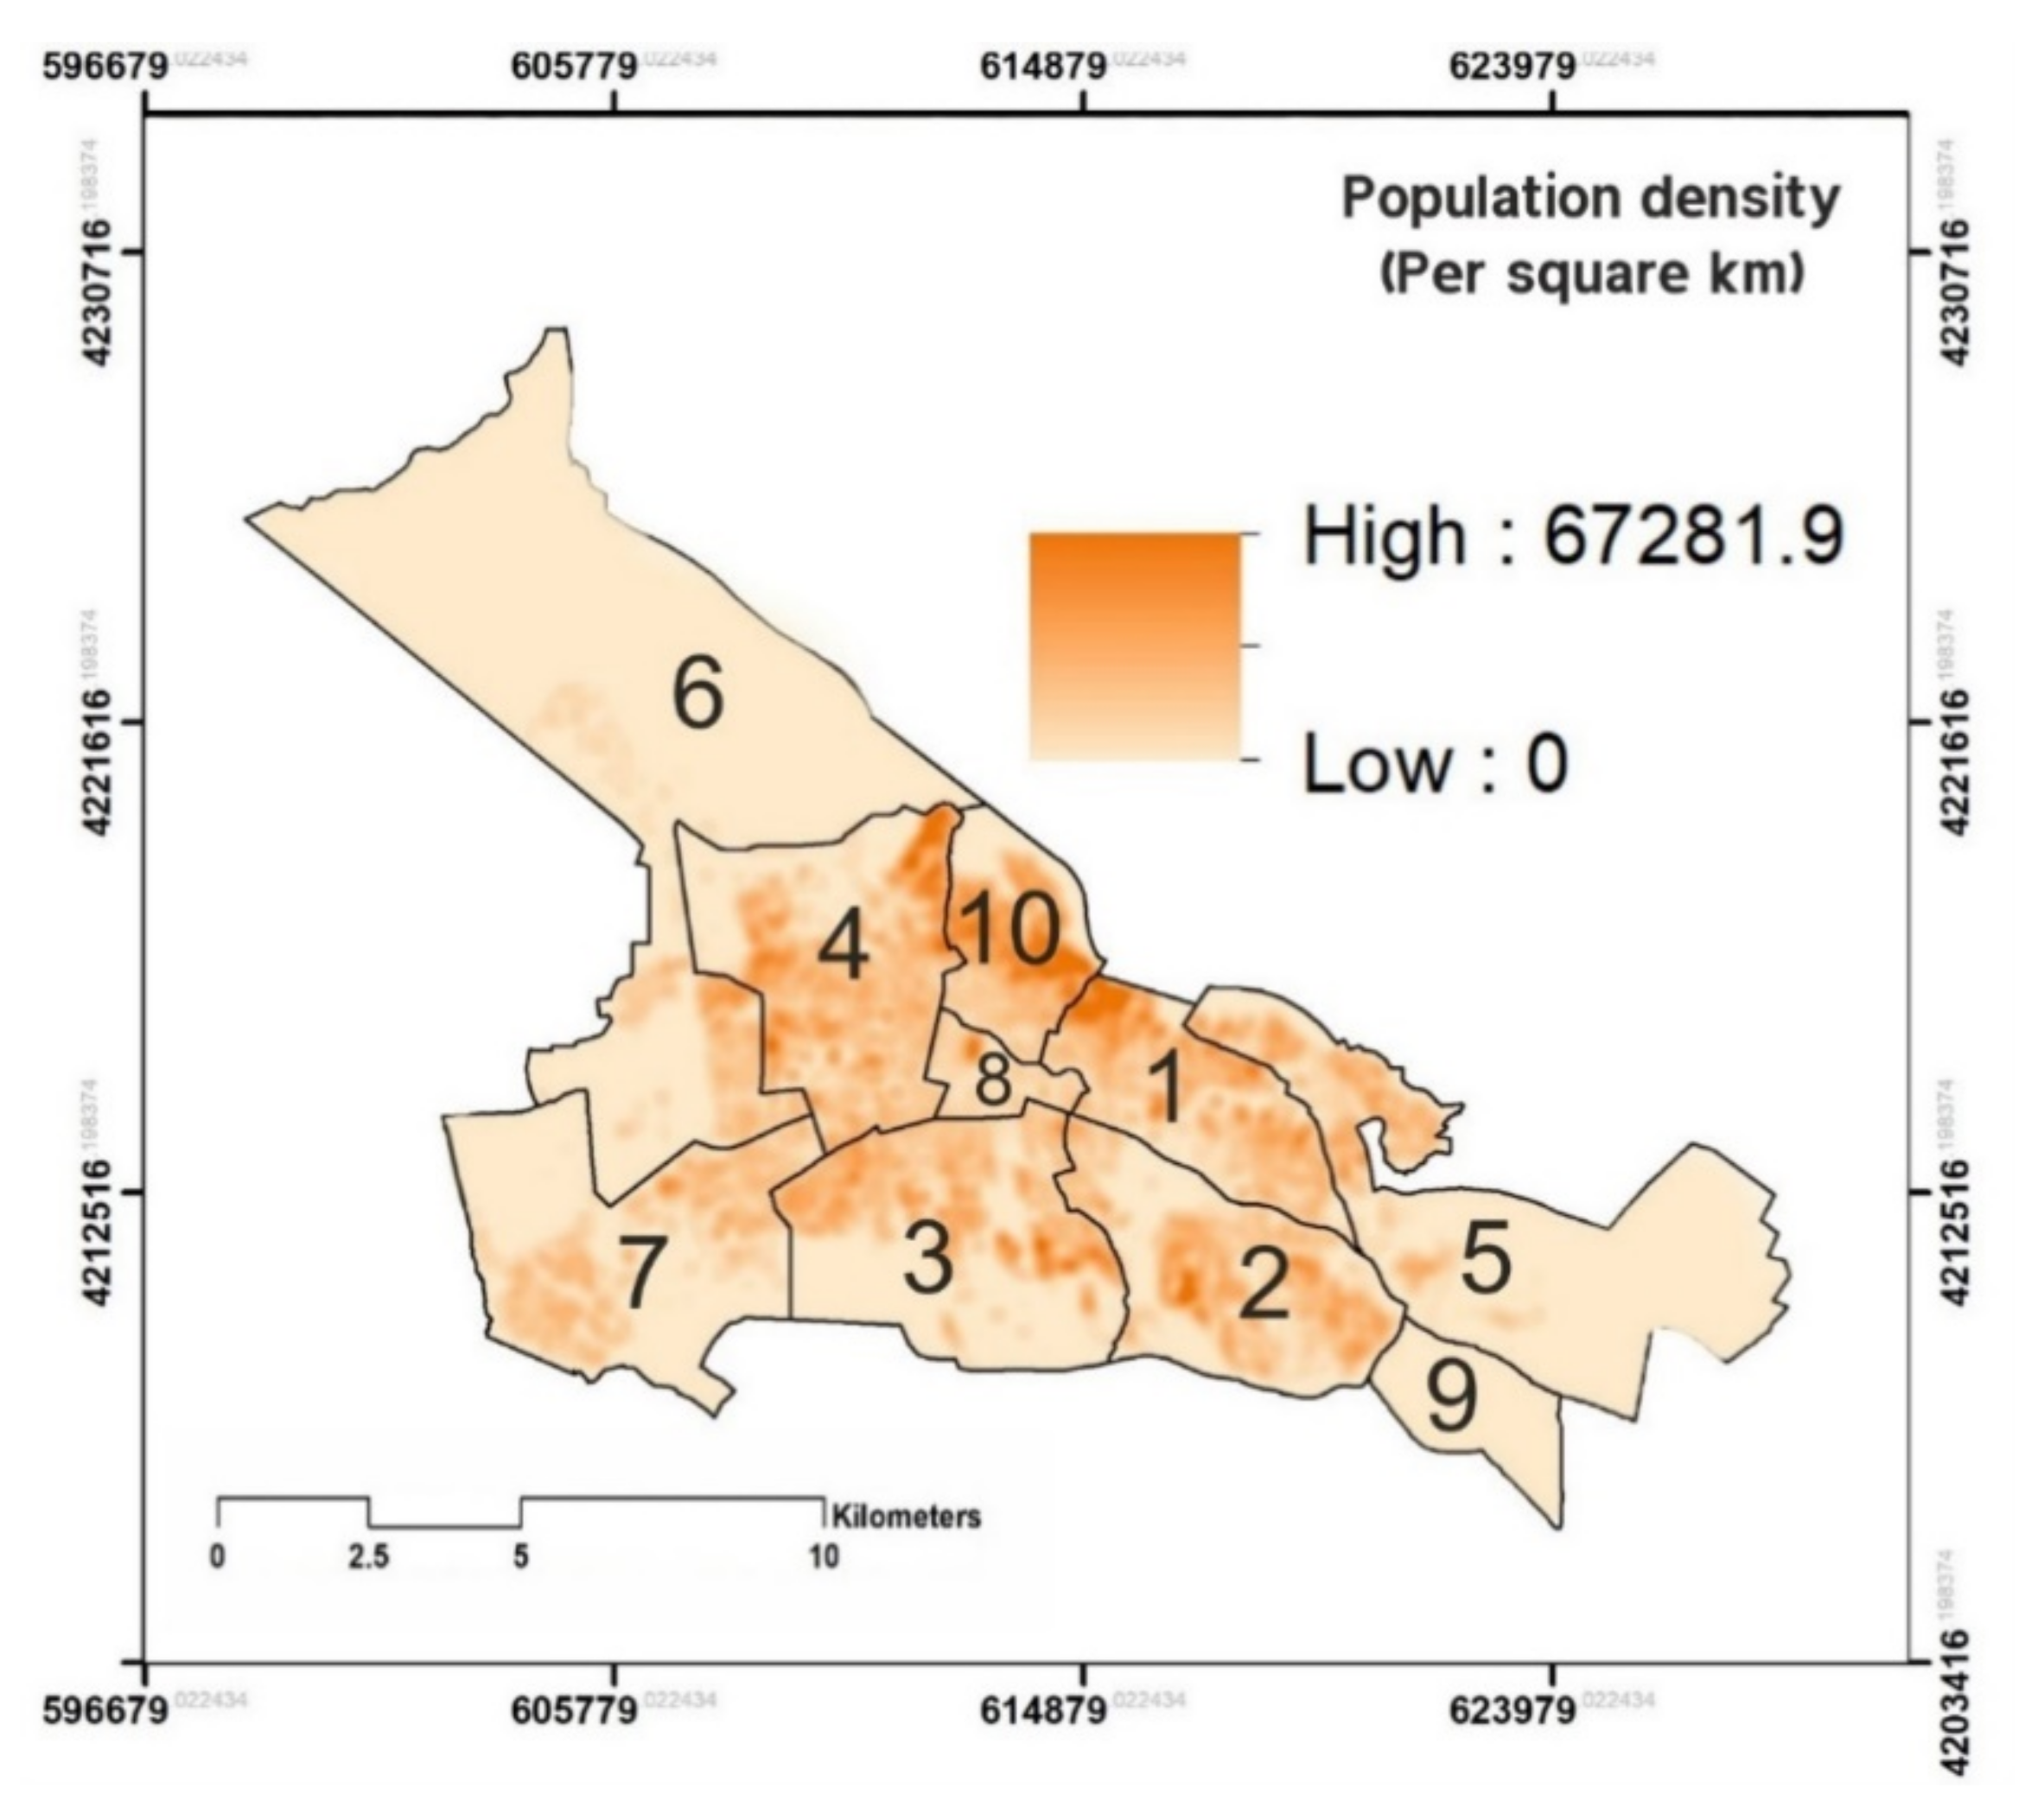
39]. The city of Tabriz has ten districts, the most populous of which is District 4. District 9 is an uninhabited area [
32].
Figure 1a indicates the movement of the Saudi plate towards the plateau of Iran, while
Figure 1b shows the sedimentary and structural conditions of earthquakes in the country. For a better analysis, Iran has been divided into several segments. This segmentation was modified by [
40,
41], and depicts the large fault of Iran.
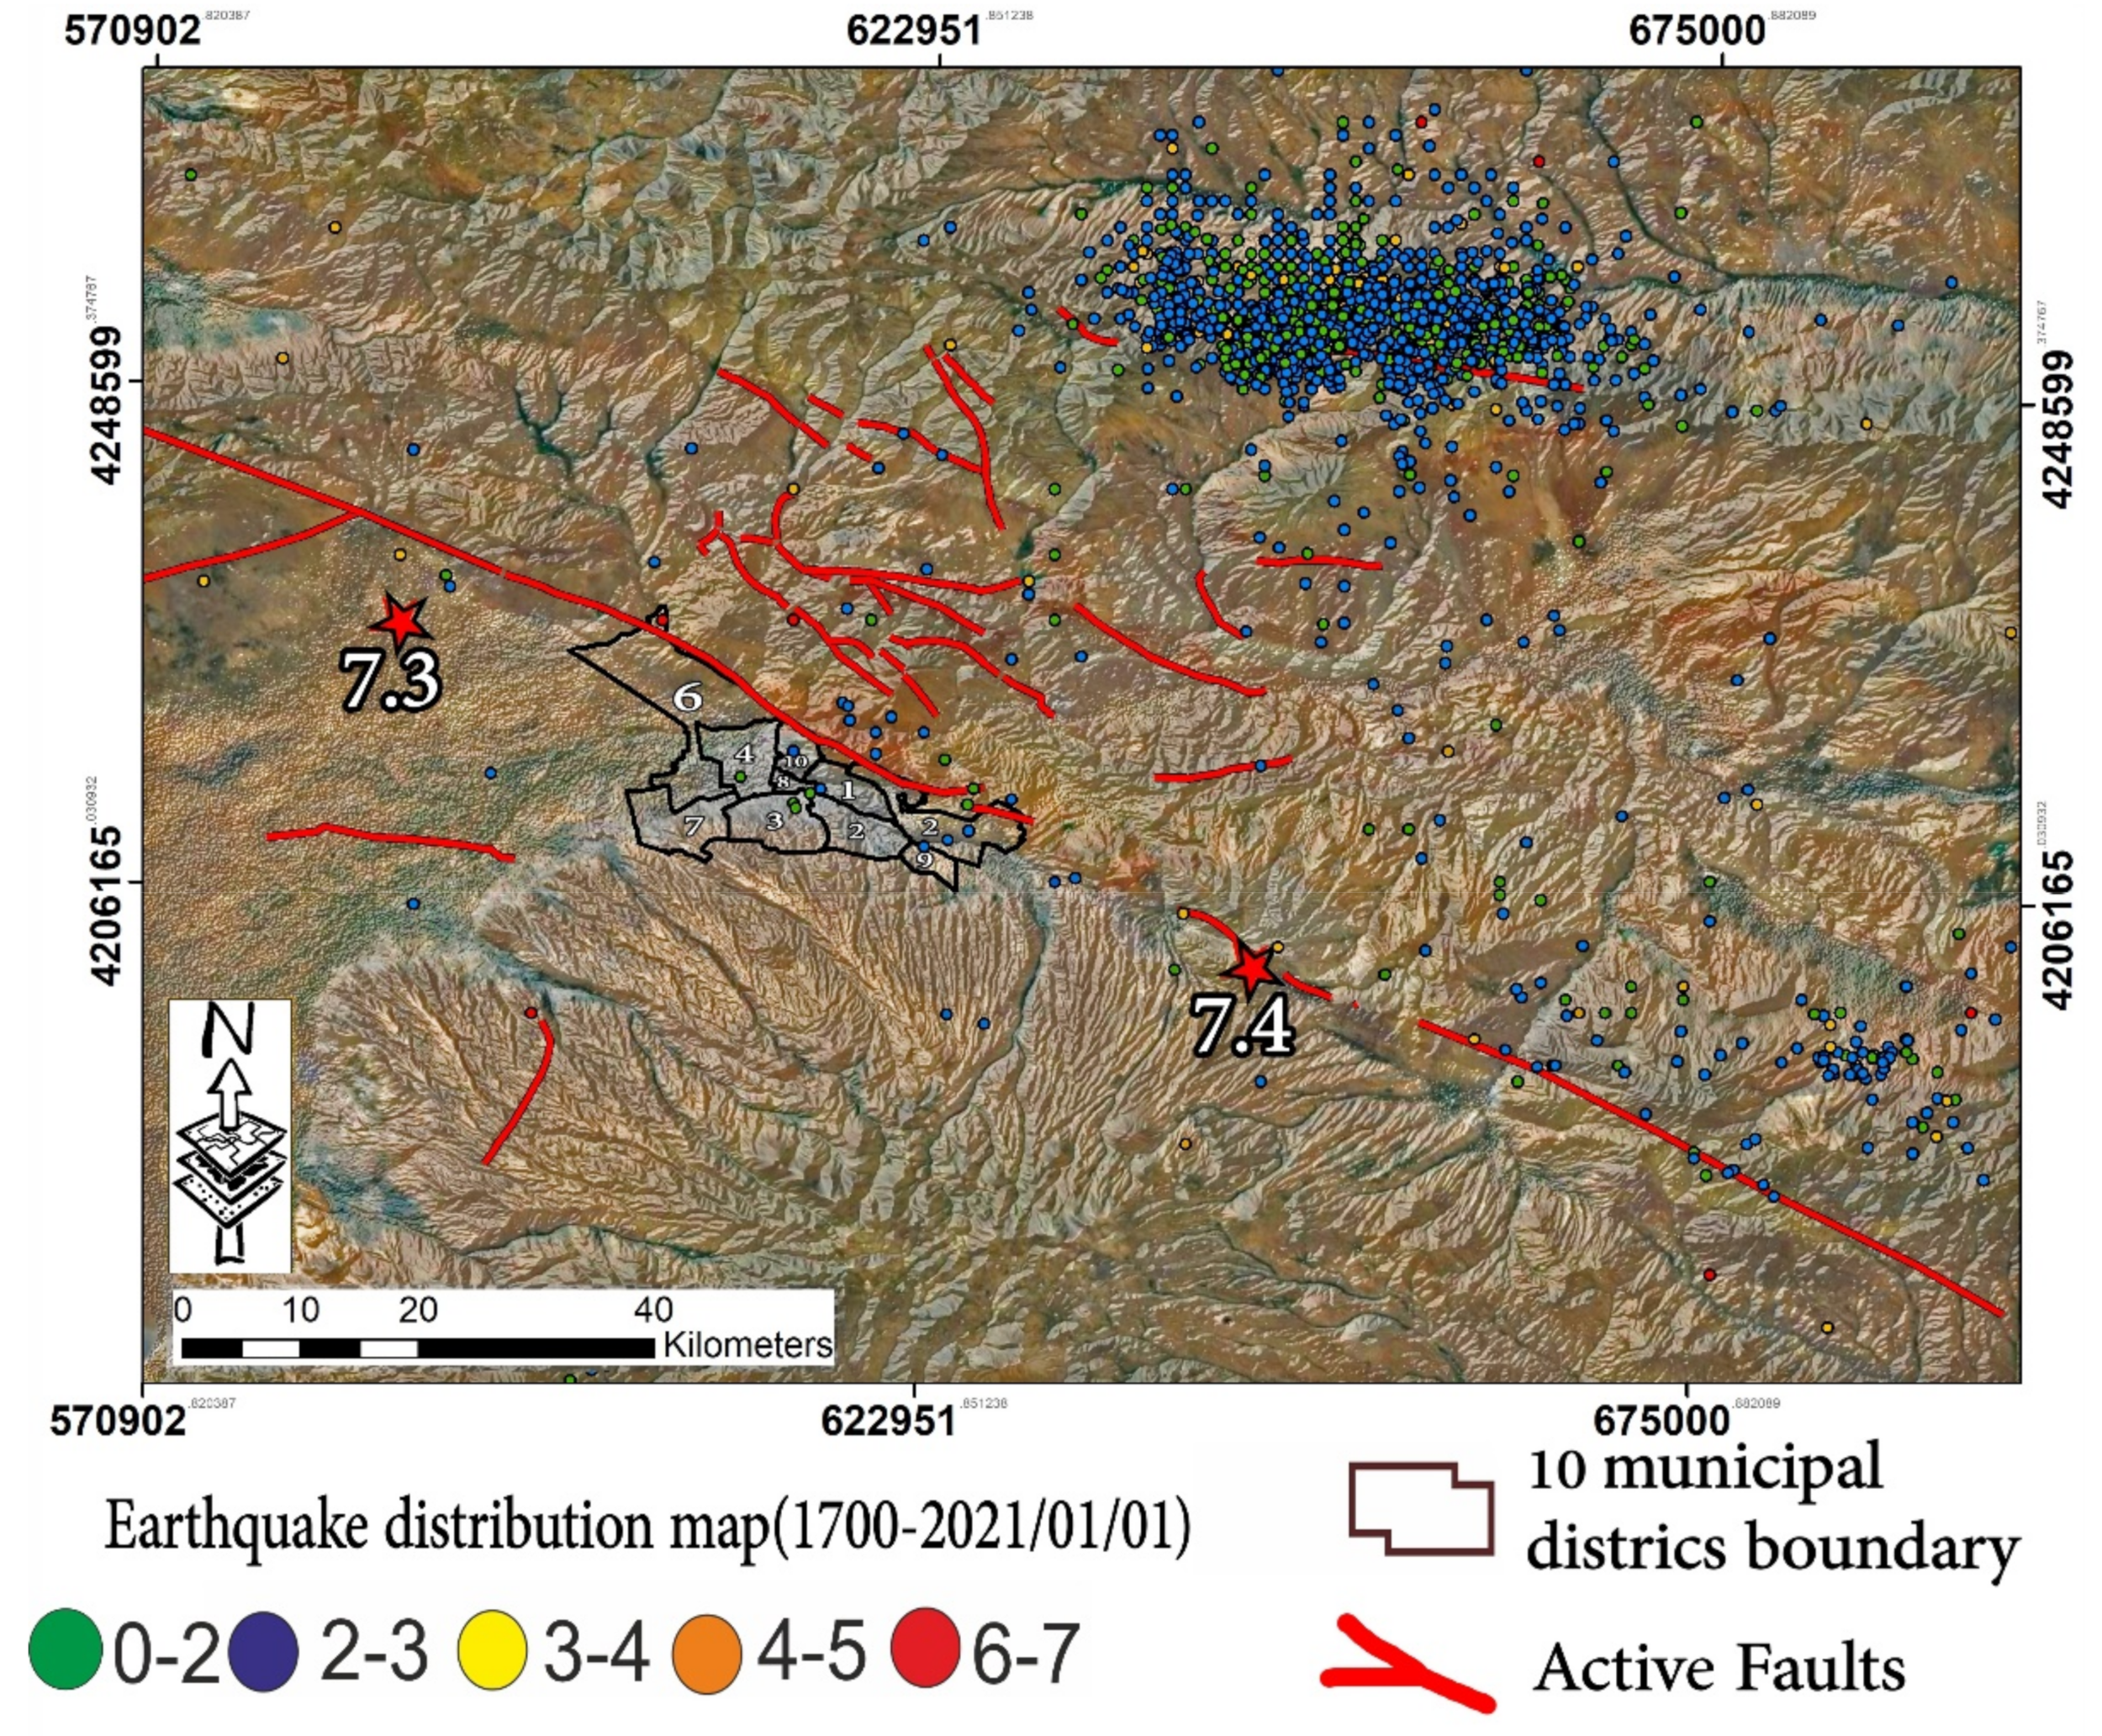
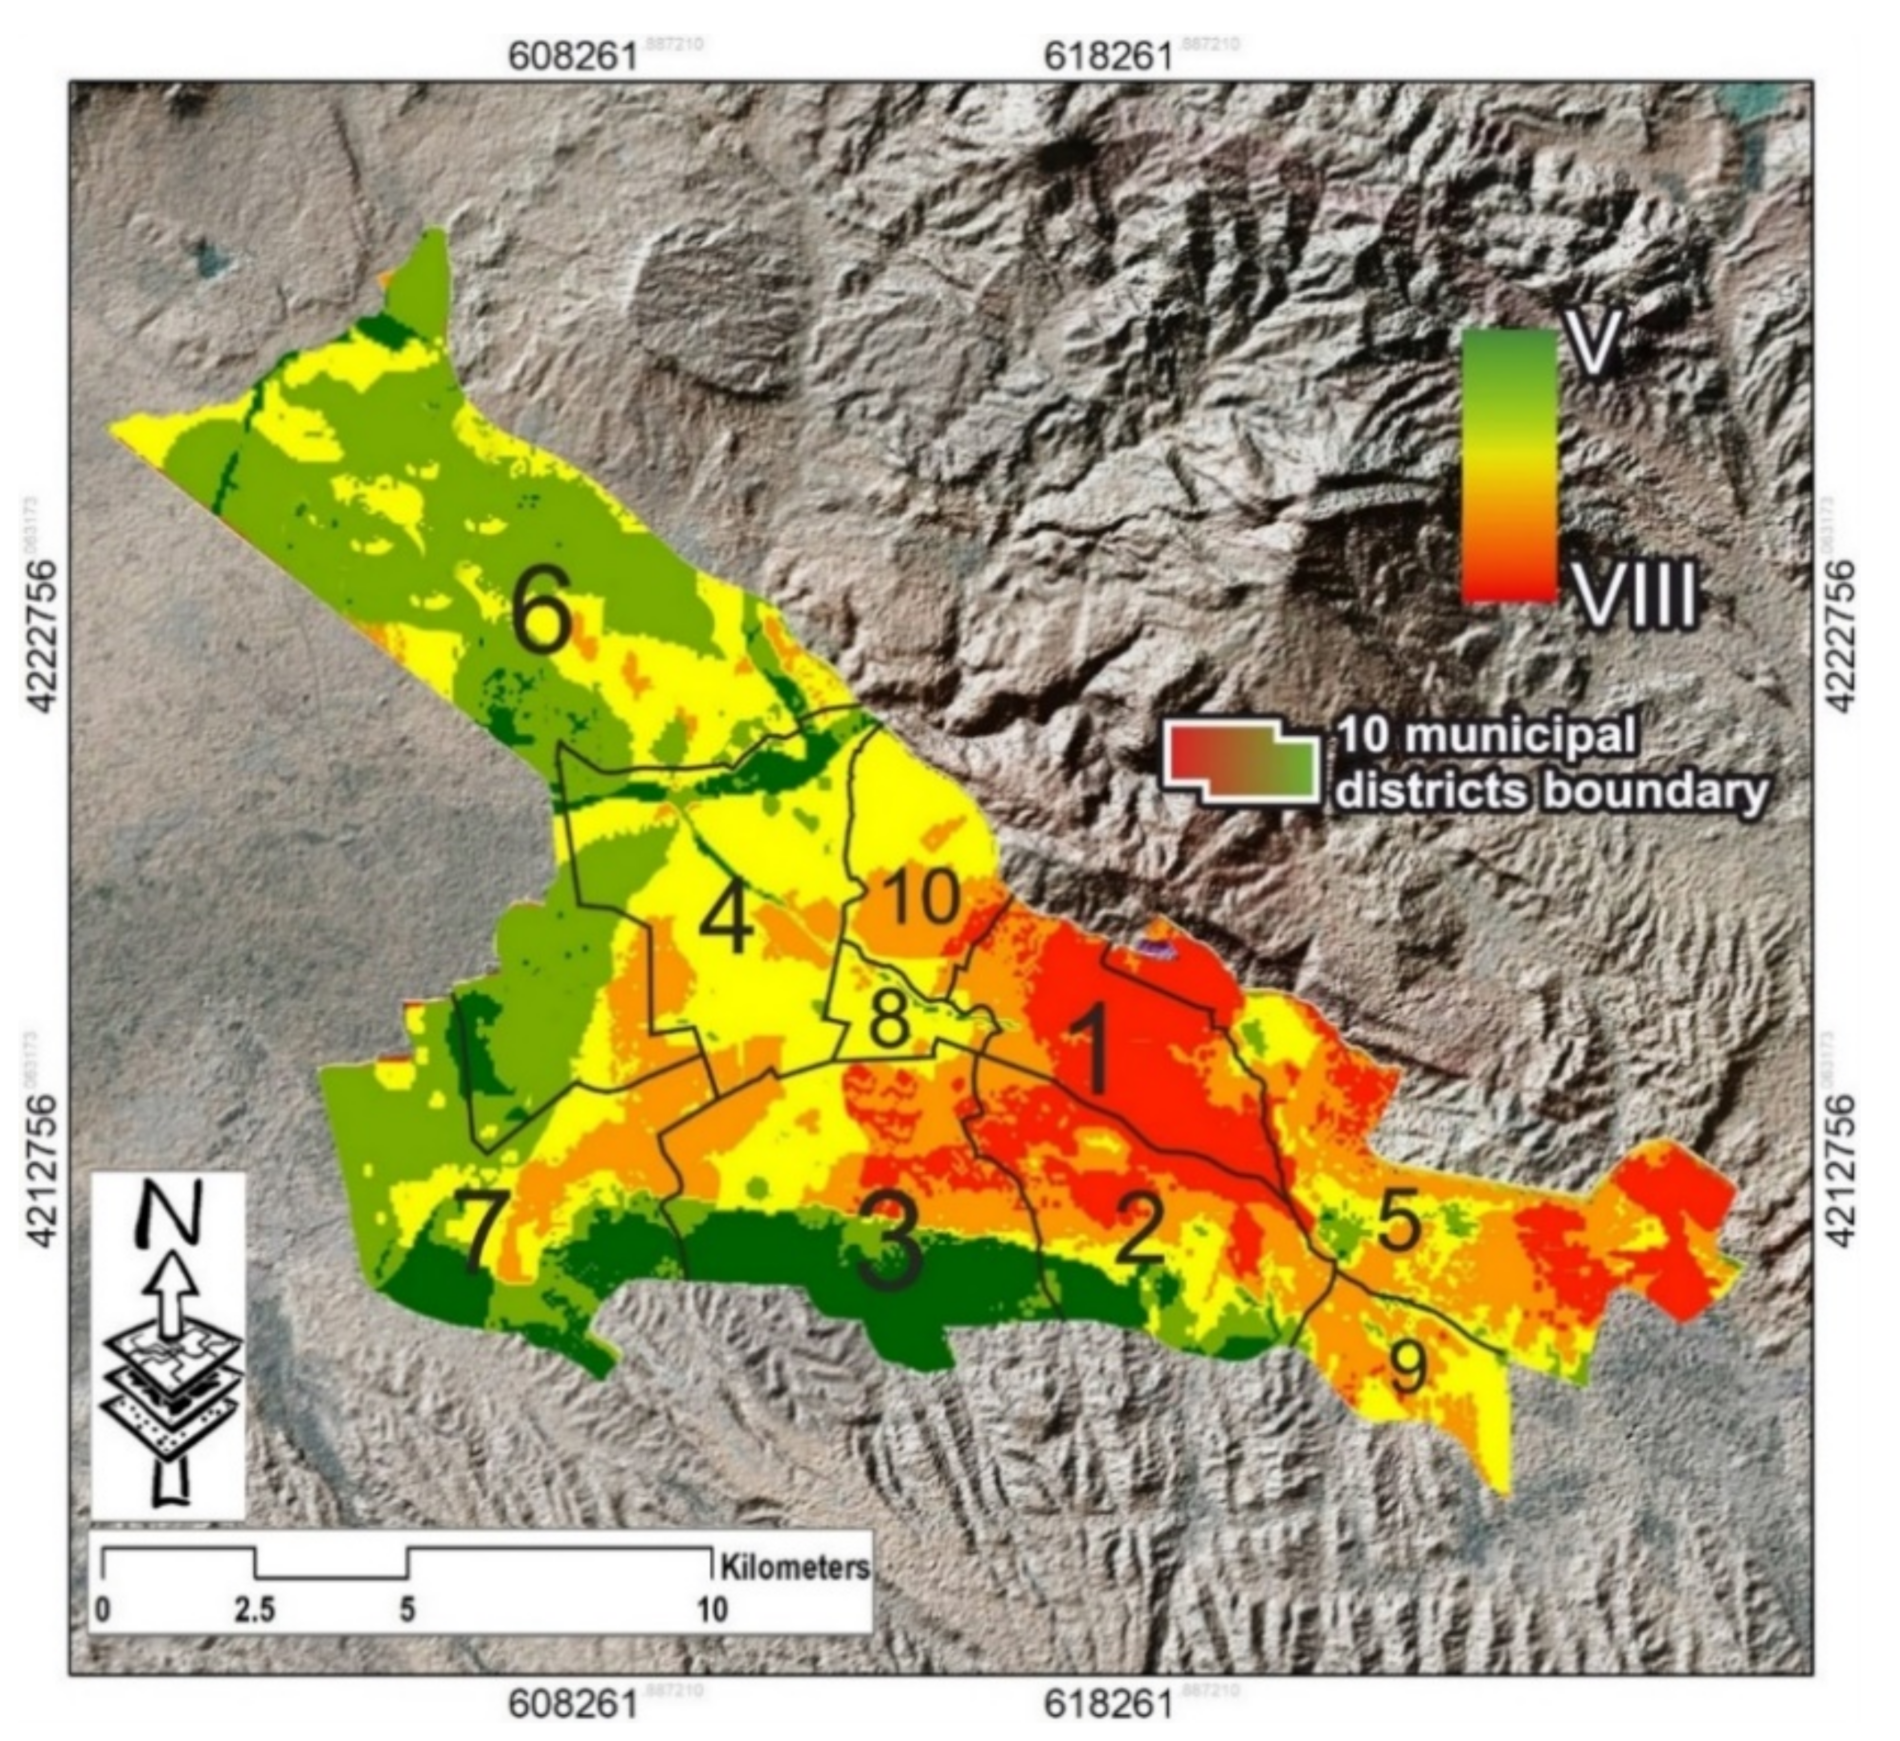
Figure 2 indicates the location of the faults in the vicinity of the city of Tabriz, and other faults around the city. This fault has caused earthquakes with high destructive power. The epicenter of the earthquakes in Tabriz and the surrounding area from 1700 to 2021 [
16] is shown in the figure, and the locations of the different districts of the Tabriz municipality are also depicted. In order to create the relevant scenario, it is necessary to gain full knowledge of the status of the faults and earthquakes. Due to the different natural features of each district of Tabriz, it is necessary to explain their environmental characteristics individually.
The active tectonics in the study area, as in other parts of Iran, result from the convergence of the Arabian and Eurasian plates, which, as can be seen in
Figure 1, affects the whole country.
The North Tabriz Fault (NTF) is a complex active fault system that lies below the city of Tabriz in NW Iran (
Figure 1 and
Figure 2). It has an average strike of NW–SE over a length of about 150 km, and appears to be generally close to vertical in the dip. The NTF merges northwest and southeast with zones of reverse faults, the strikes of which have more of a tendency toward east–west [
42]. Right-lateral movement along this fault has been documented from the study of aerial photographs and GPS measurements, and can also be seen clearly in the field [
43,
44,
45,
46]. Geomorphic features and paleo seismological studies northwest of Tabriz city show evidence for repeated surface faulting events along the NTF [
47].
The results of these studies indicate a return period of about 300 years for the Tabriz earthquake [
48,
49]. All of the studies conducted have pointed to the right-lateral strike-slip movement of the NTF due to the general movement of the area, which is the movement of the Arabian plate to the north [
18,
42,
44,
48,
49,
50,
51,
52,
53,
54]. In terms of tectonics, there are several different theories regarding the city of Tabriz.
Based on the studies of Berberian, Iran is divided into regions with similar characteristics, including Zagros of Central Iran, Alborz, and Köpet Dag [
31,
36]. In terms of the seismicity in the city of Tabriz, the northern fault has been the source of many large earthquakes. Studies have shown that two large earthquakes have occurred here that have almost destroyed the city. The first occurred in 1721 in the west of Tabriz, with a magnitude of 7.3, while the second occurred in 1780 in the east of Tabriz, with a magnitude of 7.4. According to Berberian, in the last 76 years, the fault has shown no activity, which indicates the possibility that a large earthquake could occur [
38,
43,
55]. Hesami et al. (2003) found the average return period of large earthquakes to be 820 years based on age and the seismic events observed in the excavated trenches. The fact that the last major earthquake occurred in Tabriz in 1780 AD indicates that there is an increased seismic hazard in this area [
47].
In
Figure 2, above, the positions of the 1721 and 1780 earthquakes and their corresponding faults are marked. However, in order to assess the initial seismic hazard, it is necessary to calculate the magnitude of a potential earthquake in a particular area due to a particular fault. The estimated value and perceived intensity in Tabriz were calculated for the fault dataset using various experimental equations. These are summarized in
Table 1.
Two historic earthquakes with the same destructive power were simulated in the same situation [
59,
60]. This value is 10 in the modified Mercalli intensity scale, which amounts to a huge level of destruction. Due to the location of the fault near the northern part of Tabriz and the location of the southern fault relatively far from Tabriz, there is the possibility that a devastating earthquake could take place. A time-series analysis of radar images of Tabriz from 2004 to 2010 indicates the accumulation of energy in this area, increasing the possibility of an earthquake with a high destructive power occurring along the Tabriz fault [
61]. Based on the data obtained from earthquakes that occurred in the northwest of Tabriz, these earthquakes usually occur at a depth of 20 km [
58].
3. Method
Seismic microzoning evaluation is a major factor in the identification of the earthquake impact on the area. Thus, the effect of earthquakes on the site is assessed using various factors that determine the site properties. In the process of seismic microzonation assessment, the most important factors are the geology of the area [
62]. The estimation of the seismic hazard for different parts of the world requires different methods and parameters. Therefore, a standard approach to assess damage has been lacking. This study benefits from a relational geodatabase for queries. In this study, we used different parameters and methods with proven accuracy that were utilized in previous studies in Iran. Two previous earthquakes in Tabriz in 1721 and 1780 were used as the scenarios. In order to prepare different parameters for the microzonation stages, it is necessary to create a rich database based on sources from different reputable organizations which include different parameters. The more we increase the number of effective parameters, the higher the accuracy will be. The various parameters obtained were collected using field methods and research. The database could affect other steps of seismic microzonation. However, some information that was obtained from different organizations is discrete, and this increases the uncertainty of our calculations. Therefore, we used the shear wave velocity method close to the surface (down to a depth of 30 km) to reduce the uncertainty [
63].
This paper deals with the relationship between a hybrid domain map (micro zoning) and a definite risk model in Tabriz. Initially, the primary hazard map and local data were collected from various organizations and stored in a suitable database. The domain map was obtained with the Vs30 measurements, geological components, and recent reports of the geotechnical research group of the subway project.
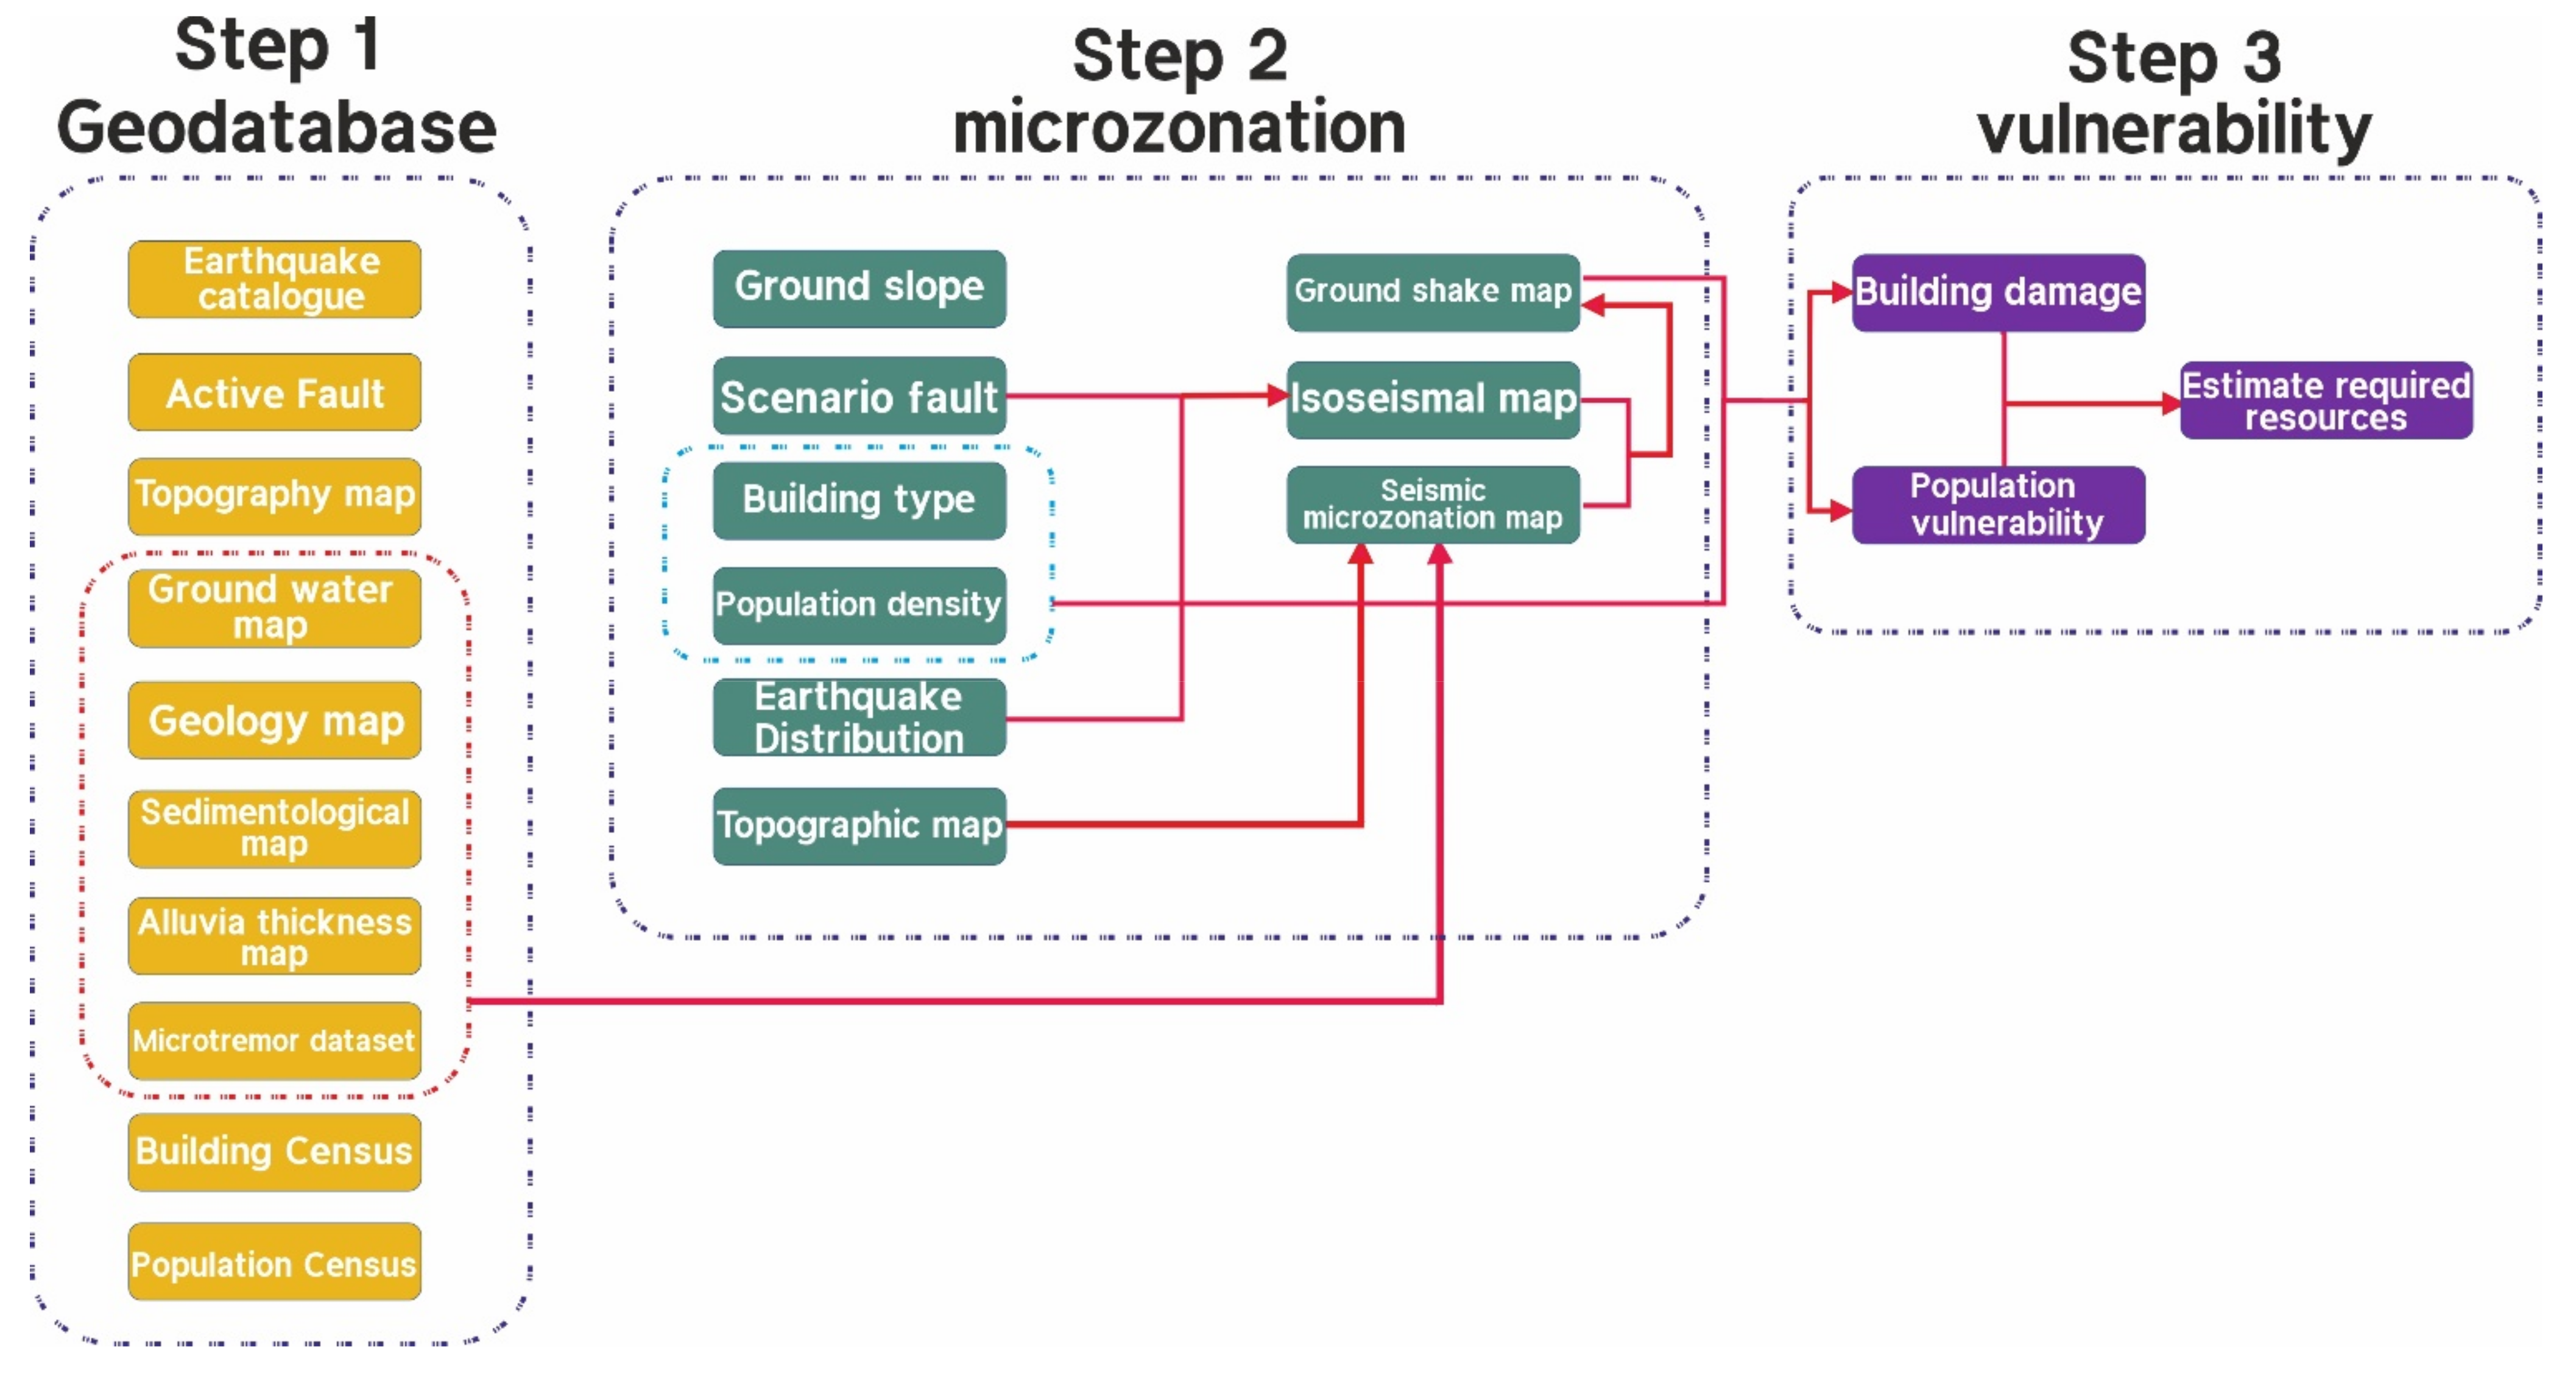
Consequently, each parameter for a hierarchy process approach requires a specific weight based on expert judgments. We used the KHM (Karmania Hazard Model) standard method, which was designed to assess building and human losses in Iran. Based on a GIS-upheld database, the principal tasks of the presented earthquake scenario can be followed in 3 steps (
Figure 3).
The main steps of the scenario are provided in the flowchart below.
Our first step was the construction of a database based on different resources; this study deals with the relationship between a hybrid domain map (microzoning) and a definite risk model in Tabriz. Initially, the hazard map and local data were collected from various organizations and stored in a suitable database. The domain map was obtained with the Vs30 measurements, geological components, and a recent report of the geo-technical research group of the subway project [
28].
The catalog of ancient earthquakes was obtained from the studies of Berberian, while the catalog of contemporary earthquakes was obtained from the International Institute of Earthquake Engineering and Seismography based on the spatial coordinates of magnitude and depth according to the day/month/year; these are provided in
Figure 2 [
16,
59].
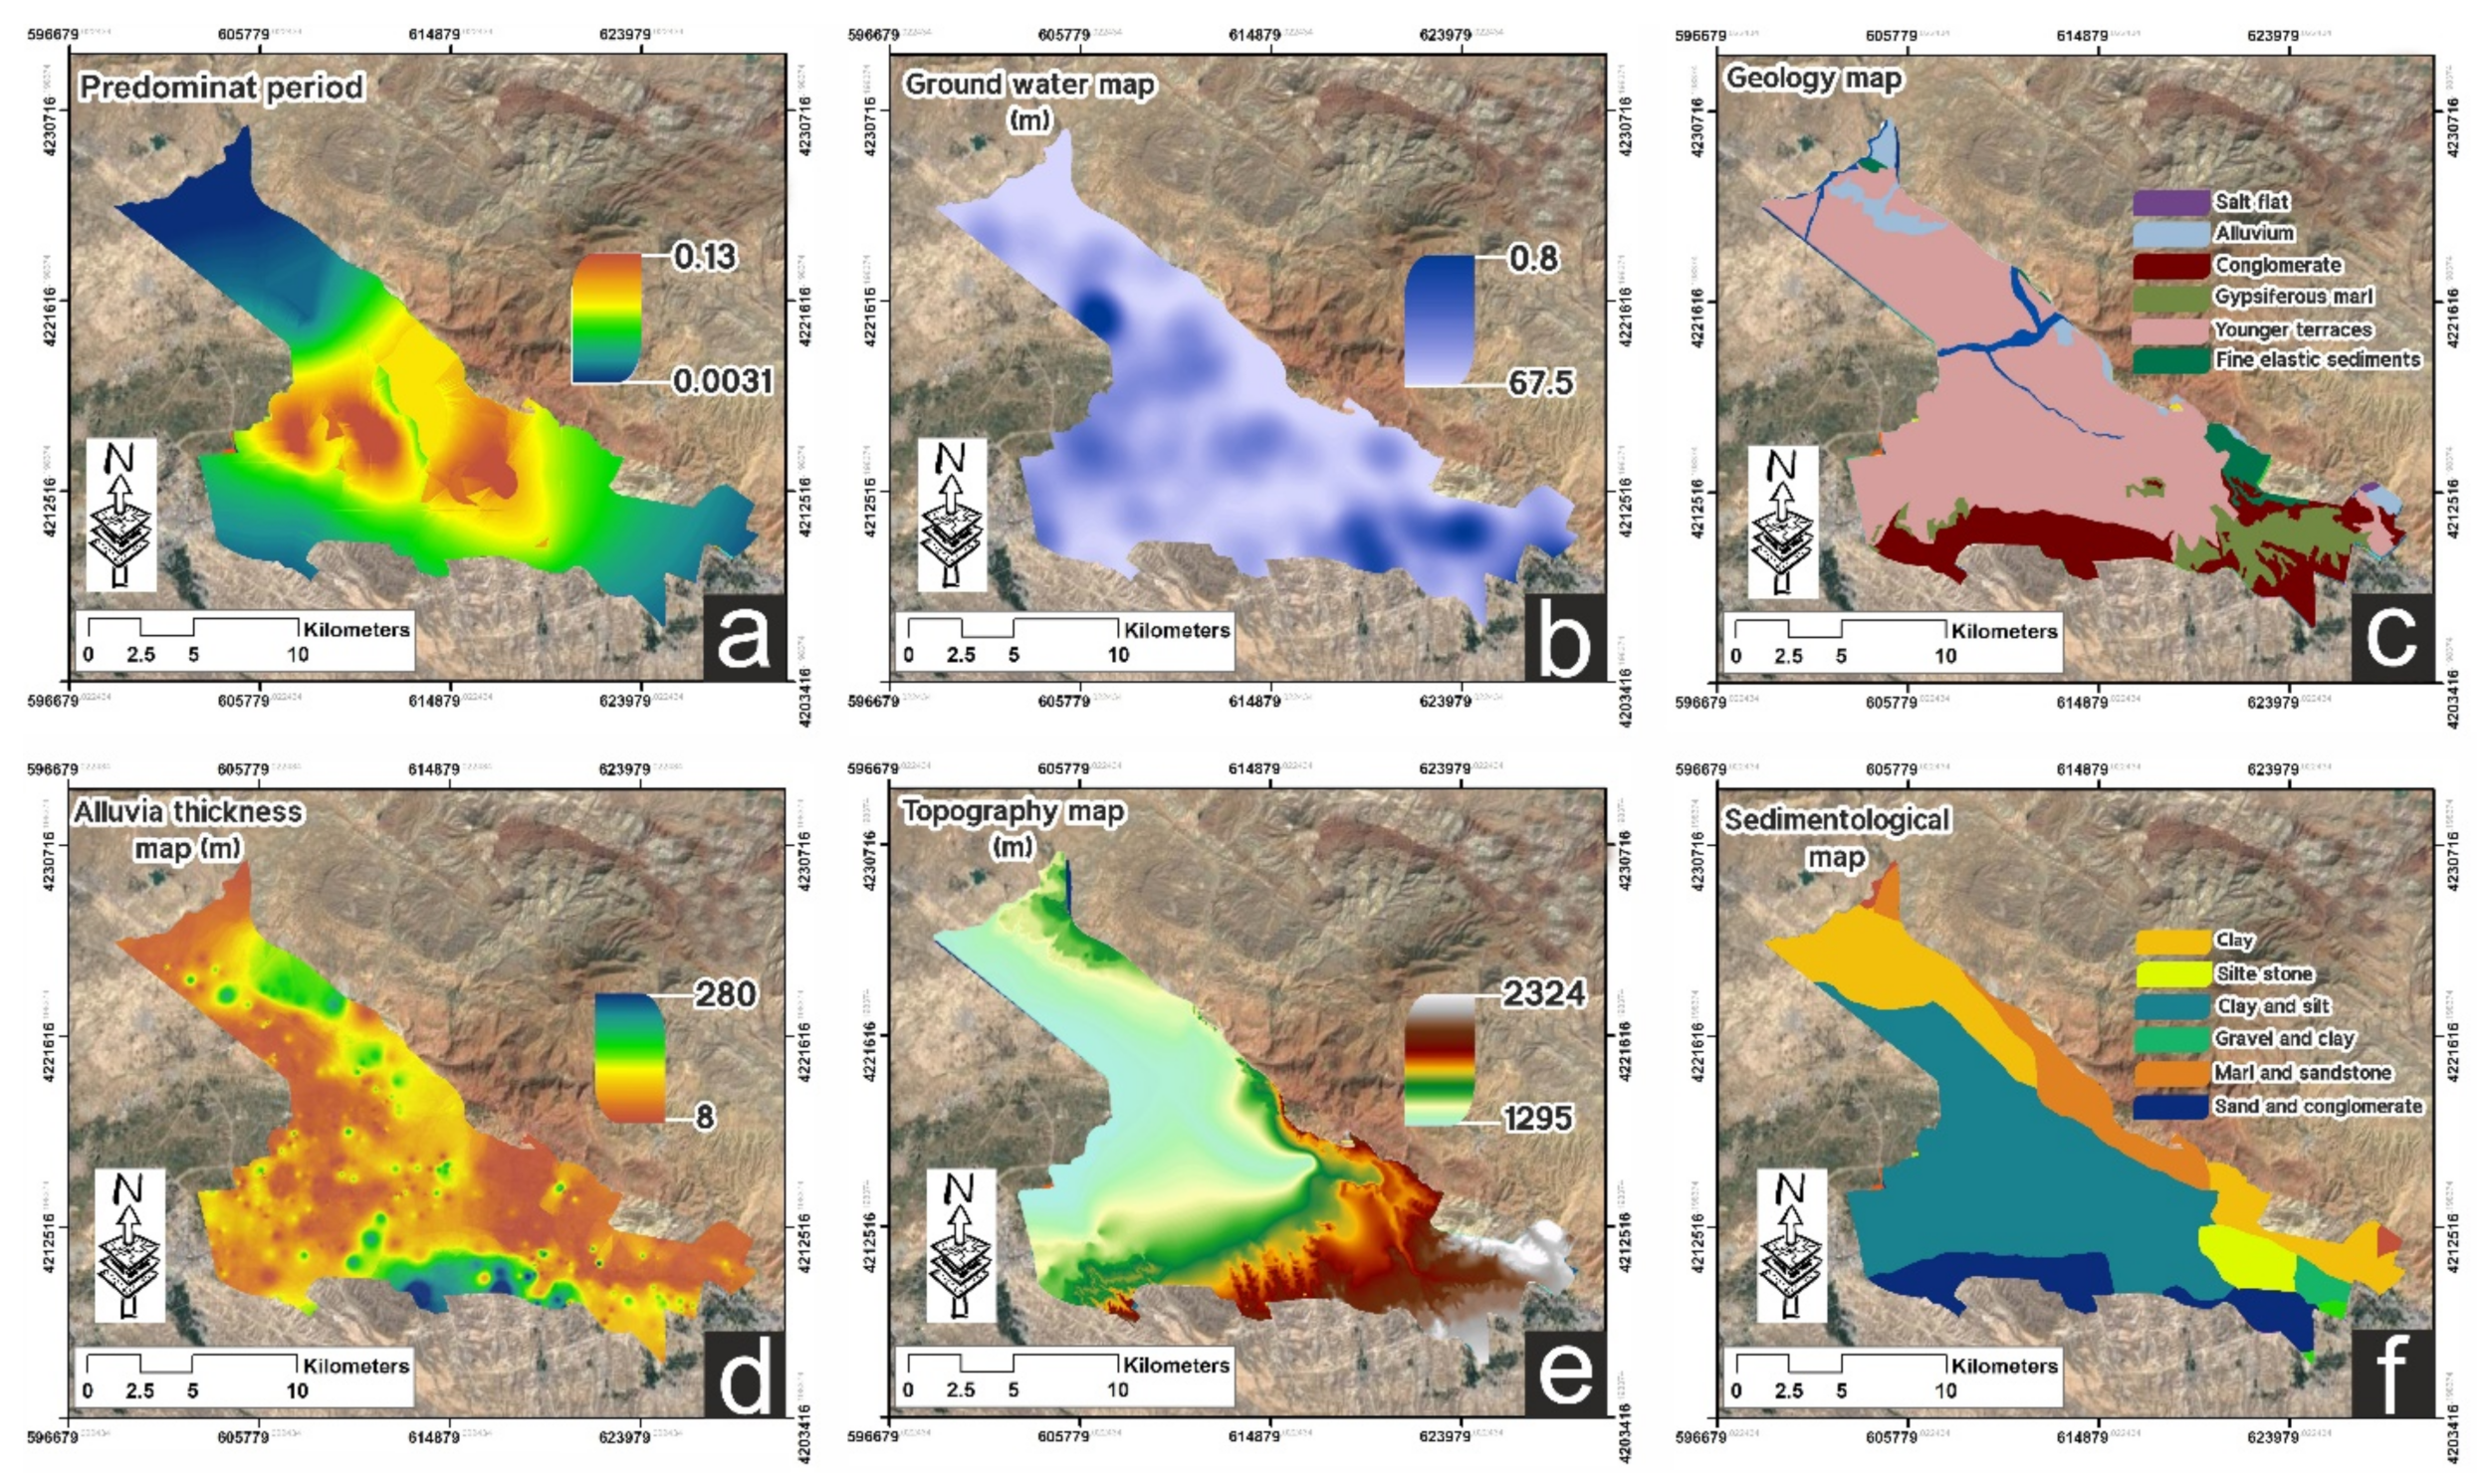
Since the type of land involved is one of the important factors in intensity transmission in seismic areas, in order to prepare the land layer, a 1:100,000 geological map was obtained from the Geological Survey of Iran and converted into a GIS layer. This shows that the lands in the southern and southwestern parts of Tabriz have a special geological uniformity. The southern lands are located on the Plio-Pleistocene Formation, which is a combination of conglomerates with volcanic components with high strength (
Figure 4c). While the northern part of Tabriz has a complex composition due to the fault, and is composed of Miocene sediments with a red conglomerate on Paleozoic rocks, as shown in
Figure 4f, the central part of Tabriz was destroyed by old earthquakes. It is located on young alluvium and has a low strength (
Figure 4f) [
39,
60,
61,
64,
65,
66].
In order to evaluate the slope of the region, we used the ALOS 12.5 m digital elevation model (DEM). Based on the obtained data, it can be seen that the city of Tabriz has a lower slope in the city center, and an average slope from west to east. The slope of the southern parts is 5 to 10 degrees [
67].
Tabriz is a mountainous city with a high altitude. The altitude of the city starts from 1300 meters and reaches 1750 meters. The central part of Tabriz is located in the low-altitude range of 1350 meters. The southern parts have an average height of 1700 meters due to being located at the foothills of Sahand [
31,
33] (
Figure 4e).
Geoid mapping is another important aspect of seismology. Studies have shown that there is a significant spatial relationship between slopes and earthquakes. A geoid slope map was prepared by the International Center for Global Earth Models (ICGEM). To put it simply, a geoid is a specific equipotential surface of the Earth’s gravitational field that generally corresponds to the surface of open waters, and not the Earth’s crust. The amount of geoid in the northwest of Iran—i.e., the study area—is 15 to 25 m [
68,
69].
Other important parameters used in this study are the thickness of the alluvium layer and the groundwater layer, which were obtained using the Tabriz district water organization. In general, 149 shallow wells (average depth: 30 m) were drilled in Tabriz based on the district’s water information (
Figure 4b). It should be noted that—according to the experts of the water organization—due to illegal drilling, the number of wells is greater than this. In this study, we used the wave-cut methodology to investigate the effect of earthquake waves on the soil conditions in 21 stations in different areas of Tabriz (
Figure 4). Simply put, when an earthquake occurs, its waves start moving, and when they reach the Earth’s surface, the geological conditions of the soil and topographic slope affect the velocity and shear wave of the propagated earthquake. The surface layers are mainly formed in the central and northern regions of alluvial sediments, while in some boreholes, there are weak rock layers such as clay and conglomerate. According to these data, the regional soil can be divided into three general categories, which are listed in
Table 2 [
65,
70,
71].
The southern part of Tabriz has conglomerate igneous rocks and, as shown in
Table 2, they have a high thickness and can resist earthquakes. The central area of Tabriz, which is similar to a pit, generally consists of soft sediments with a low thickness that is not resistant to earthquakes.
The data collected from different organizations have discrepancies and shortcomings, reducing their accuracy. These shortcomings, such as the distribution of earthquakes and water wells, which are discrete spatial data and show the trend of changes in a particular context within the environment, should be ameliorated. However, these are place-bound and only give information about one place. They can be converted into networks through interpolation to show the changes across the whole surface. In this research, the Kriging method was used, which is the most well-known method used in soil science and geology. Kriging is a geostatistical estimation method based on a weighted moving average that estimates unknown values using the values of known points and a semi-variogram. The semi-variogram is the spatial distance-based variance that represents spatial correlation.
The estimated values for unknown points are a linear combination of the values of adjacent samples (1); therefore:
where
is the Kriging estimate and
is the weight vector assigned to the sample. In other words, a Kriging or estimated value is obtained by assigning
weights to known values measured at adjacent points. In this method, after measuring the value of the variable for multiple samples, along with its position, the value of the variable in the unsampled points can also be estimated according to its position and distance from the known points. This study was performed using the Kriging interpolation tool in ArcGIS software [
73,
74,
75].
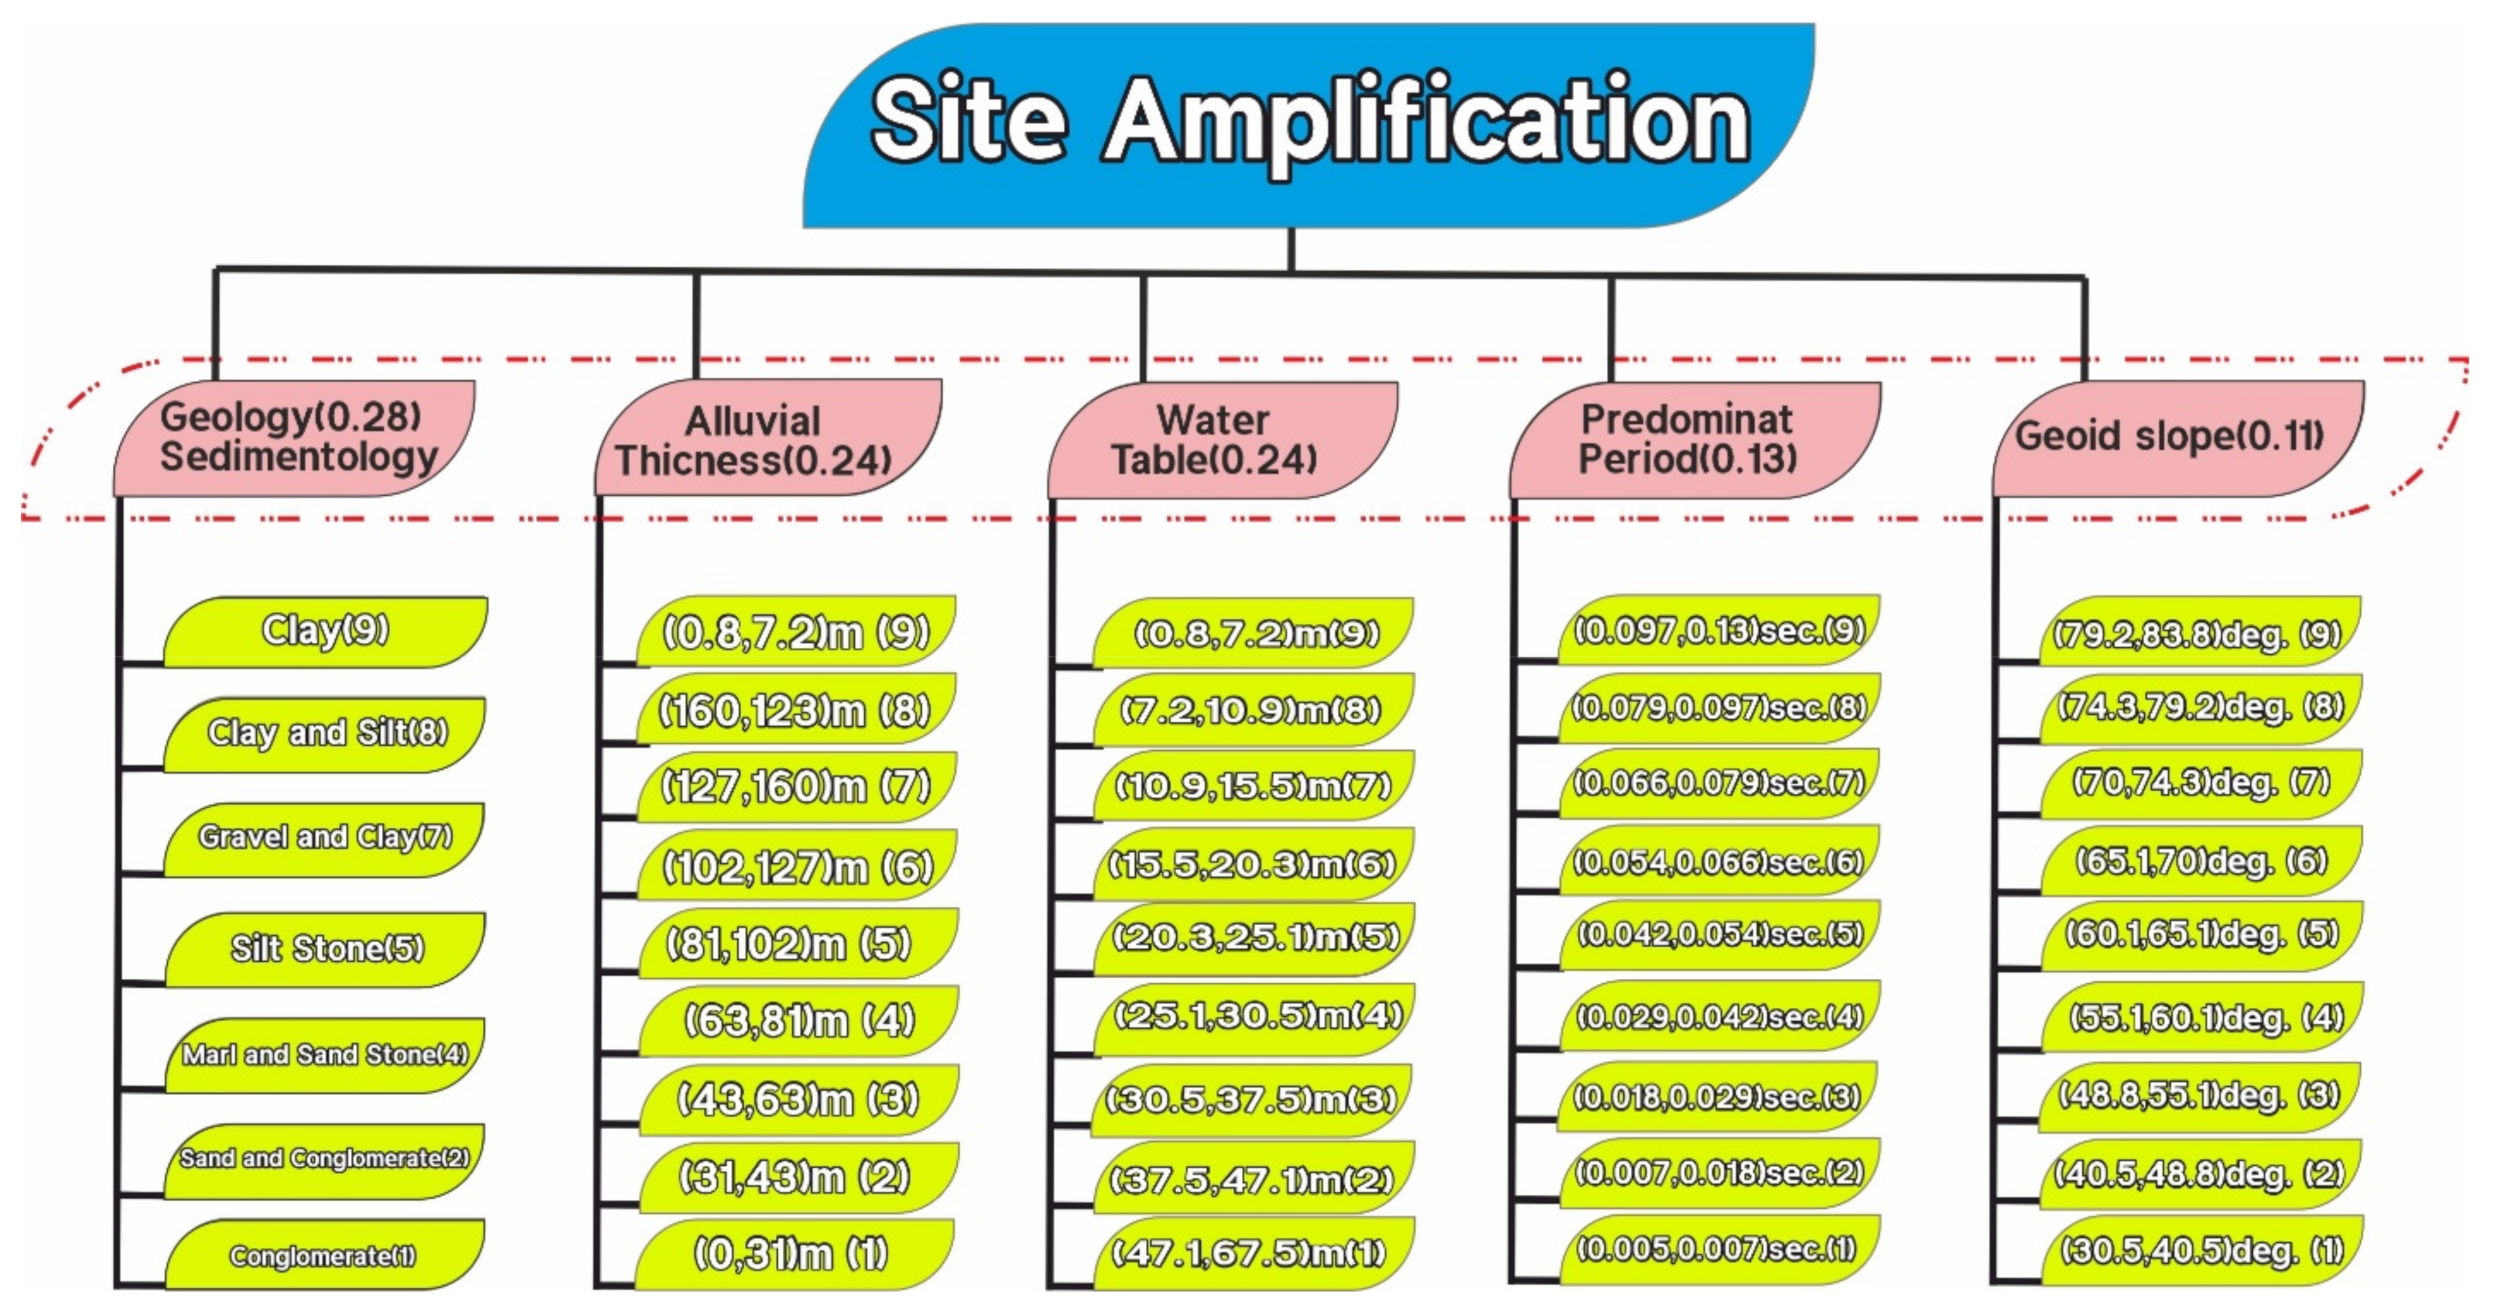
Based on the parameters required in the KHM model, in order to produce the site resonance map the various parameters mentioned above were used, and the map was produced using the AHP weighting method [
29,
30,
76]. The results were weighted based on expert opinions (
Figure 5). According to Saaty’s methodology, in order to calculate the parameter weights the values of the columns were added together and divided by the sums of the columns. Thus, the numbers were normalized. Then, the averages of the rows of the normalized table were the relative weight of the measures. The binary comparison of the indicators shows that the geological characteristics and alluvium thickness will have the highest impact and importance. The other parameters are on the next level. In the next step, using the results of pairwise comparisons, a score of between 1 and 9 was assigned to each of the parameter elements (
Figure 5), and they were weighted.
One of the advantages of hierarchical analysis is the consistency control in decision-making; in other words, in the process of hierarchical analysis, the consistency of the decisions can always be calculated and judged as good, bad, acceptable, or unacceptable. The acceptable range of inconsistency in any system depends on the decision-maker, but in general, Saaty suggests that if the decision inconsistency is higher than 0.1, the decision-maker should reconsider their judgment. In order to produce a site amplification map, the weights obtained from the hierarchical method were applied, these layers were added together, and then the generated map was normalized; the seismic microzonation map (
Figure 6) is produced by overlaying and combining the five layers (
Figure 5, obtained from Equation (2)).
where,
I is the seismic amplitude map in area
I, G
i is the geology and sedimentology in area
I,
Wi is the ground water level in area
i,
Ti is the alluvial thickness in area
i,
Mi is the Microtremor measurement in area
I, and
Si is the slope map in area
i.In the weighting of the elements of the site, geological elements with a weight of 0.28 were more important than the other elements (
Figure 5). The alluvial thickness follows the geological characteristics in terms of importance, but unfortunately the alluvial thickness layer did not address all of the details due to some uncertainties. Other factors were placed on the next level.
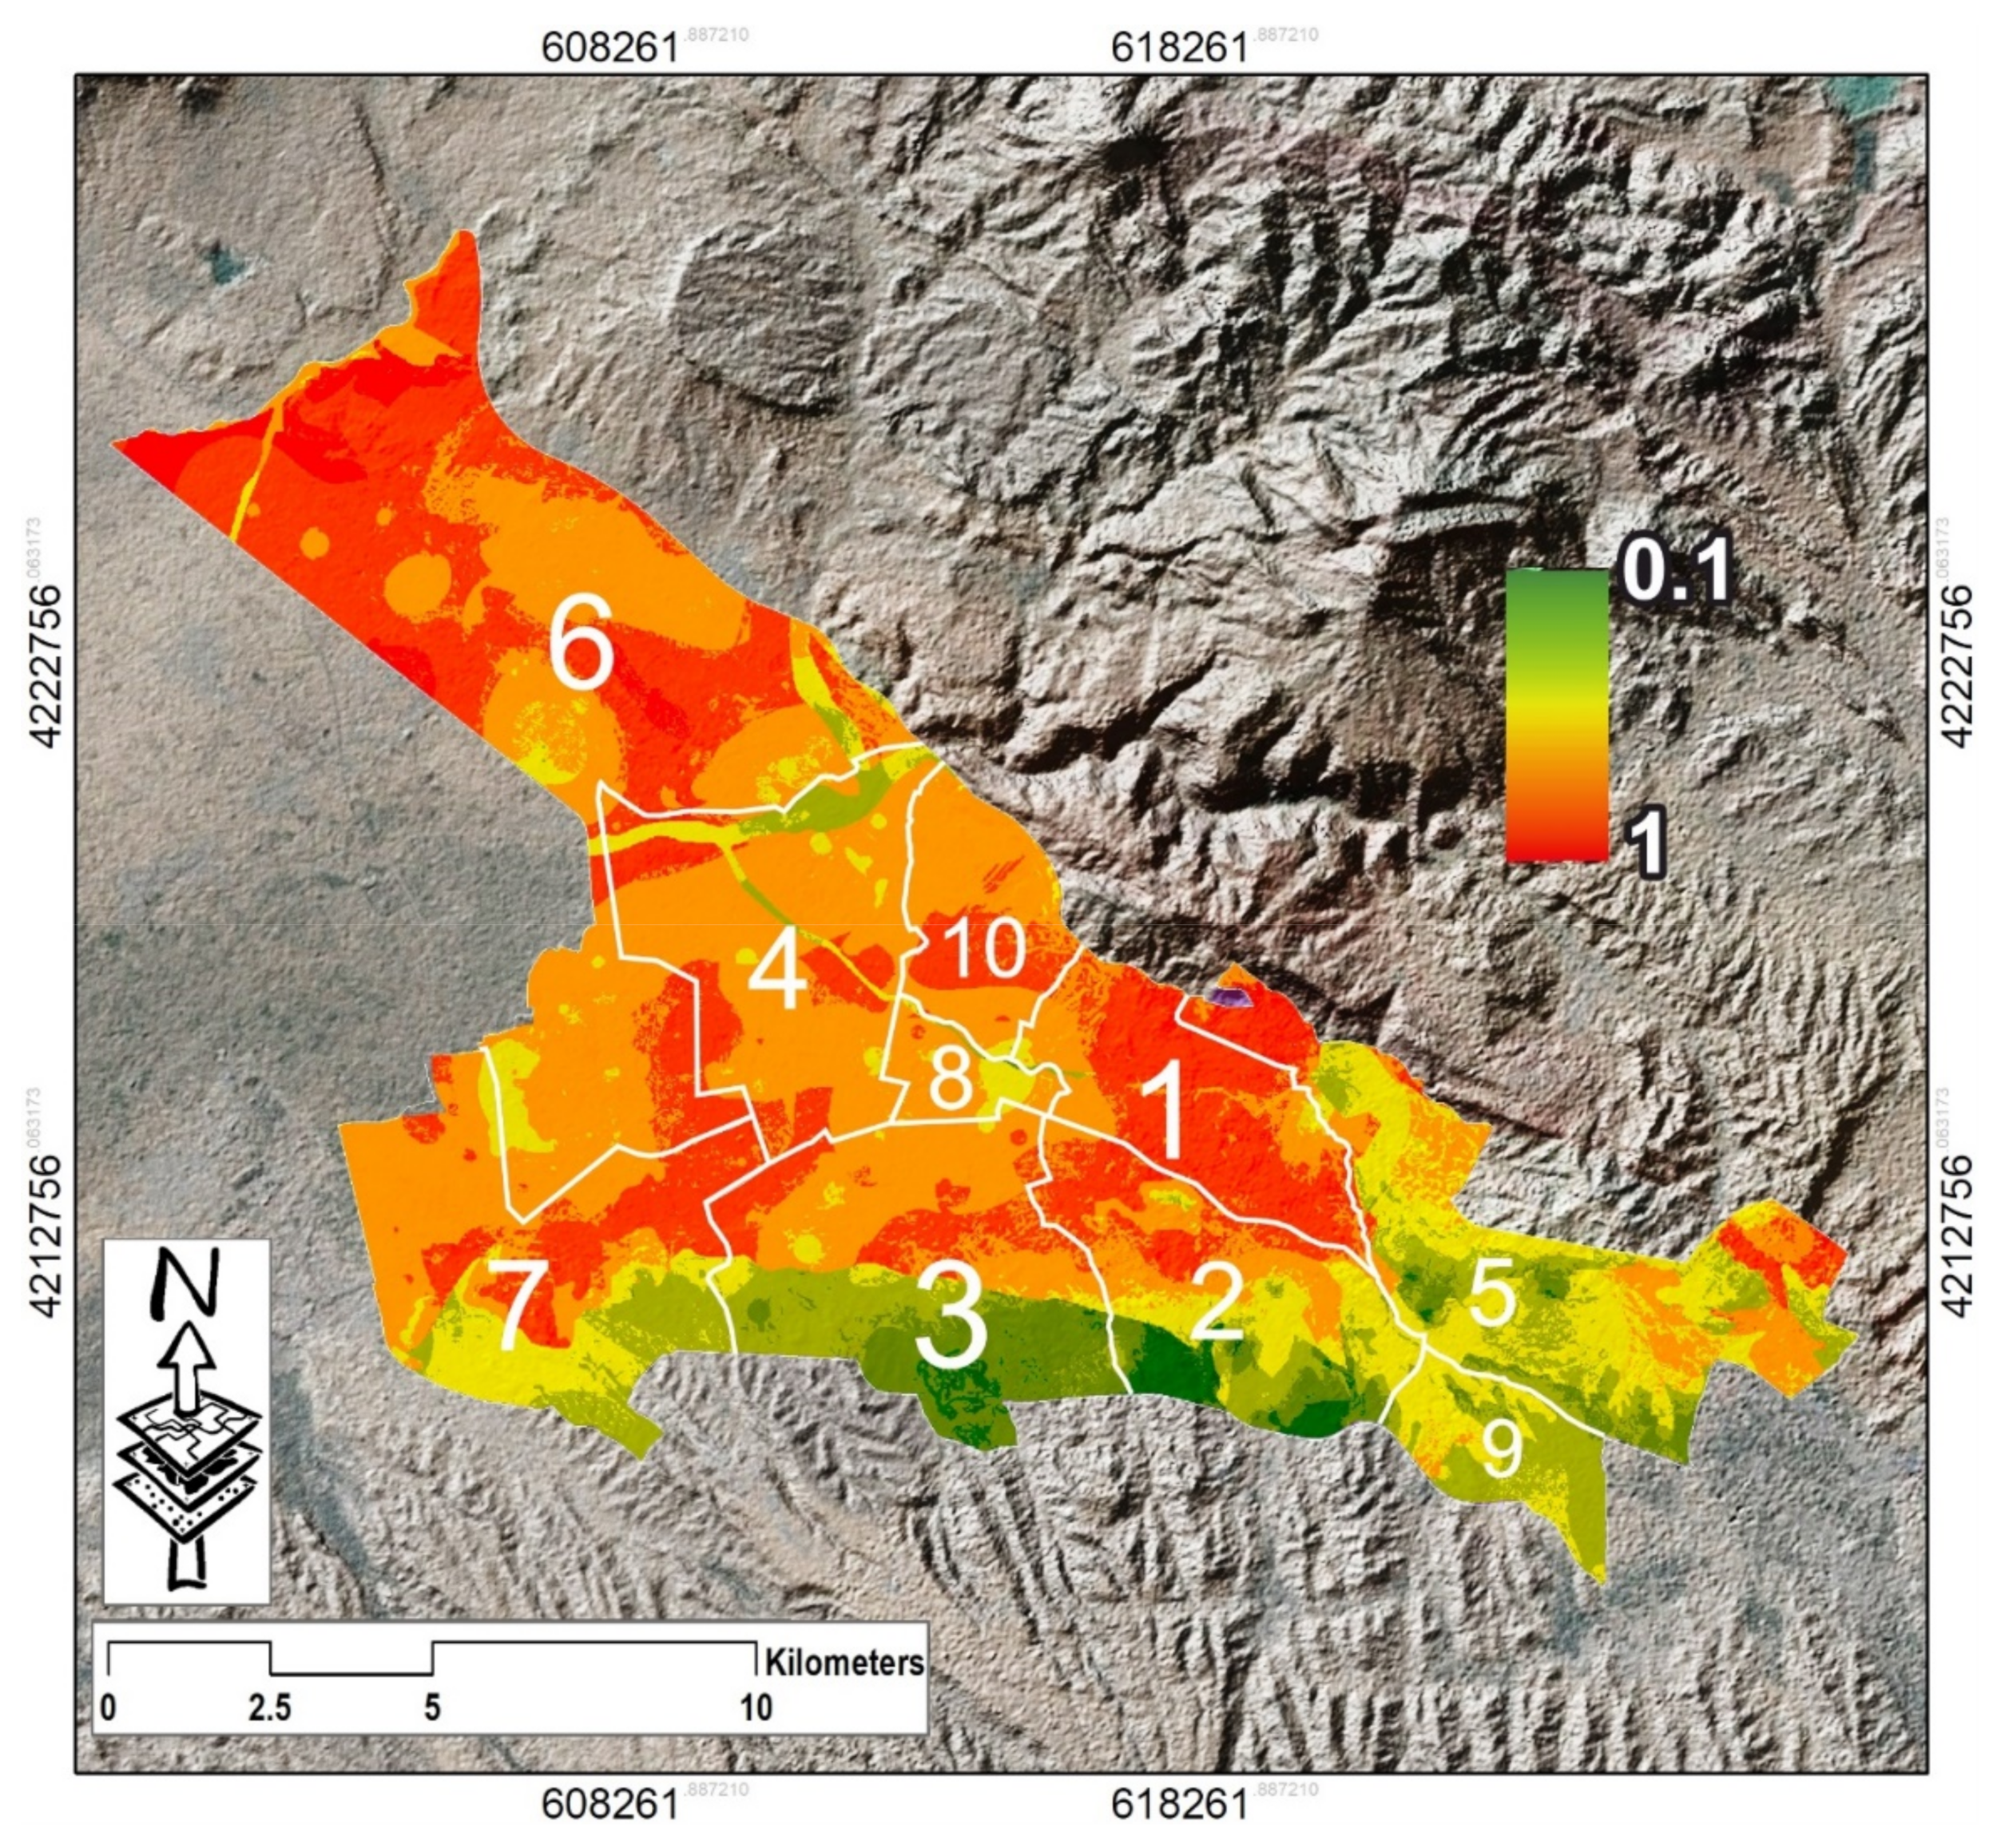
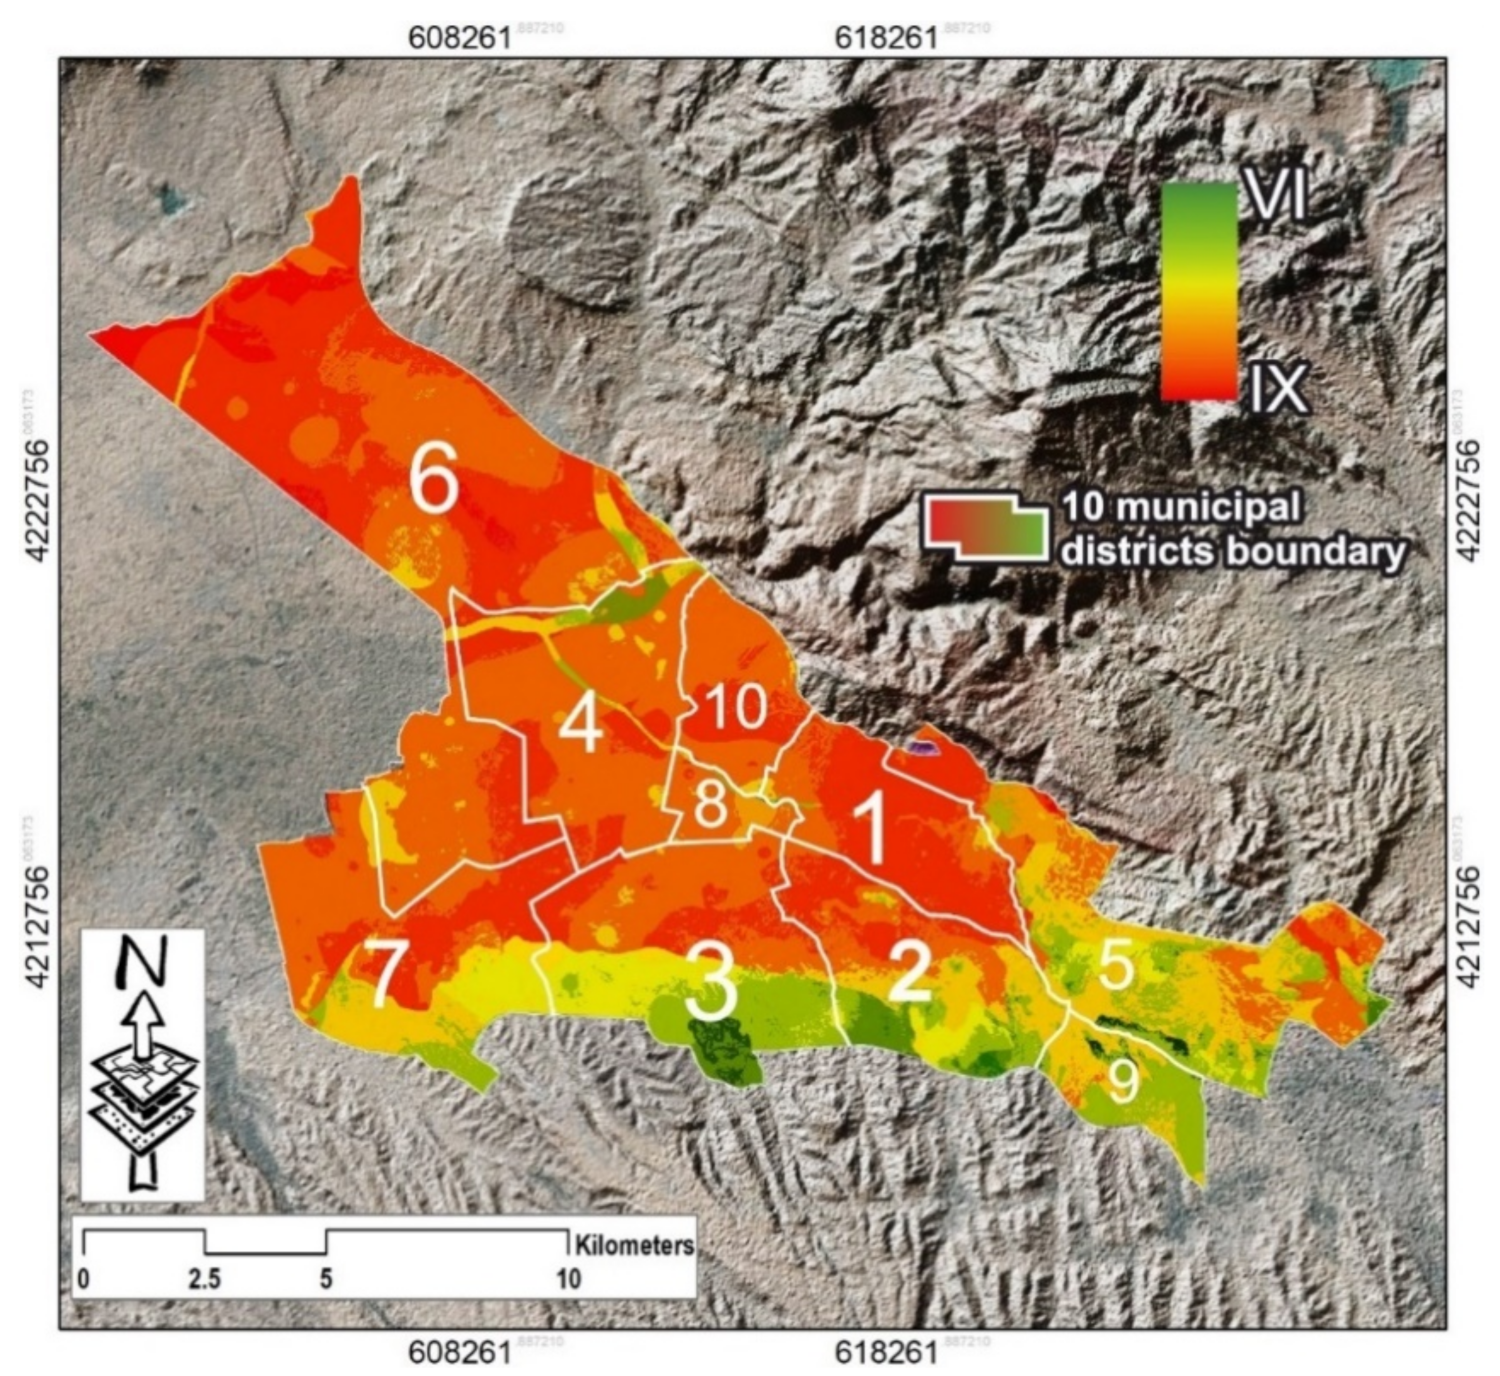
As shown in
Figure 6, the northern regions have less strength than the southern ones, as is shown in Equation (2). The areas next to the fault are not in a good position in terms of the site characteristics, and they have the highest level of vulnerability. The highest strength is related to the southern regions of Districts 2 and 3, while the lowest is related to Districts 1 and 6, which have the highest level of vulnerability.
3.1. Seismic Analysis
As observed, the Tabriz fault is adjacent to the city of Tabriz. Due to the high seismic activity of this fault, an earthquake would strongly affect the buildings and inhabitants of the city.
Table 1 also provides information about this fault. The random seismic analysis method has already been used in Tabriz to investigate ground movements during an earthquake using the logic tree method. The minimum and maximum Peak Ground Acceleration (PGA) found were 0.13 g/0.17 g, 0.22 g/0.33 g, and 0.30 g/0.8 g for the return periods of 75, 475, and 2475 years, respectively. The results also showed that the PGA values were highest above the bed and lowest in the northwestern and southeastern parts of Tabriz, respectively [
64].
The seismic hazard is the hazard associated with potential earthquakes in a particular area. According to the updated hazard maps, the Tabriz fault could bring about a large earthquake of between 6.7 and 7.6 Richter; this is shown in
Table 1. Although the Probabilistic Seismic Hazard Analysis (PSHA) is well known to be the best method for seismic hazard studies [
77], it is mostly theoretical, and may lead to overly conservative public policy [
54,
63]. This is in contrast with the deterministic method, which is easily applicable in the GIS environment. Deterministic Seismic Hazard Analysis (DSHA) will be more useful due to fault consideration, especially in cases where the tectonic features are fully active and defined, as they are in the Tabriz region. In this approach, the method considers the largest and most valid ground movement [
34,
54,
78,
79,
80].
In order to prepare the fault parameters before defining the seismic scenario, the fault angle was calculated through the azimuth angle and the Linear Directional Mean (
Table 3).
Then, using the information obtained in
Table 3, we simulated the same fault with the same characteristics as the earthquakes of 1721 and 1780 using the Euclidean distance tool. Additionally, this distance describes the relationship between a cell and a source, and the distance will be used as a corresponding damping coefficient. The distance is 150 km from the fault. In this study, we used the modified intensity. The seismic intensity was obtained using specific formulae for the region. Each region has its specific coefficients. In Iran, the decrease in intensity has been investigated in some studies; the results of the most important of these were used in this study. The equations of Ambraseys, Melville, and Chandra were used for the study area [
81,
82,
83]:
In (3, 4), is the intensity at a distance of R km from the surface fault, is the magnitude of the earthquake at the surface wave magnitude scale, is the earthquake intensity at each arbitrary point.
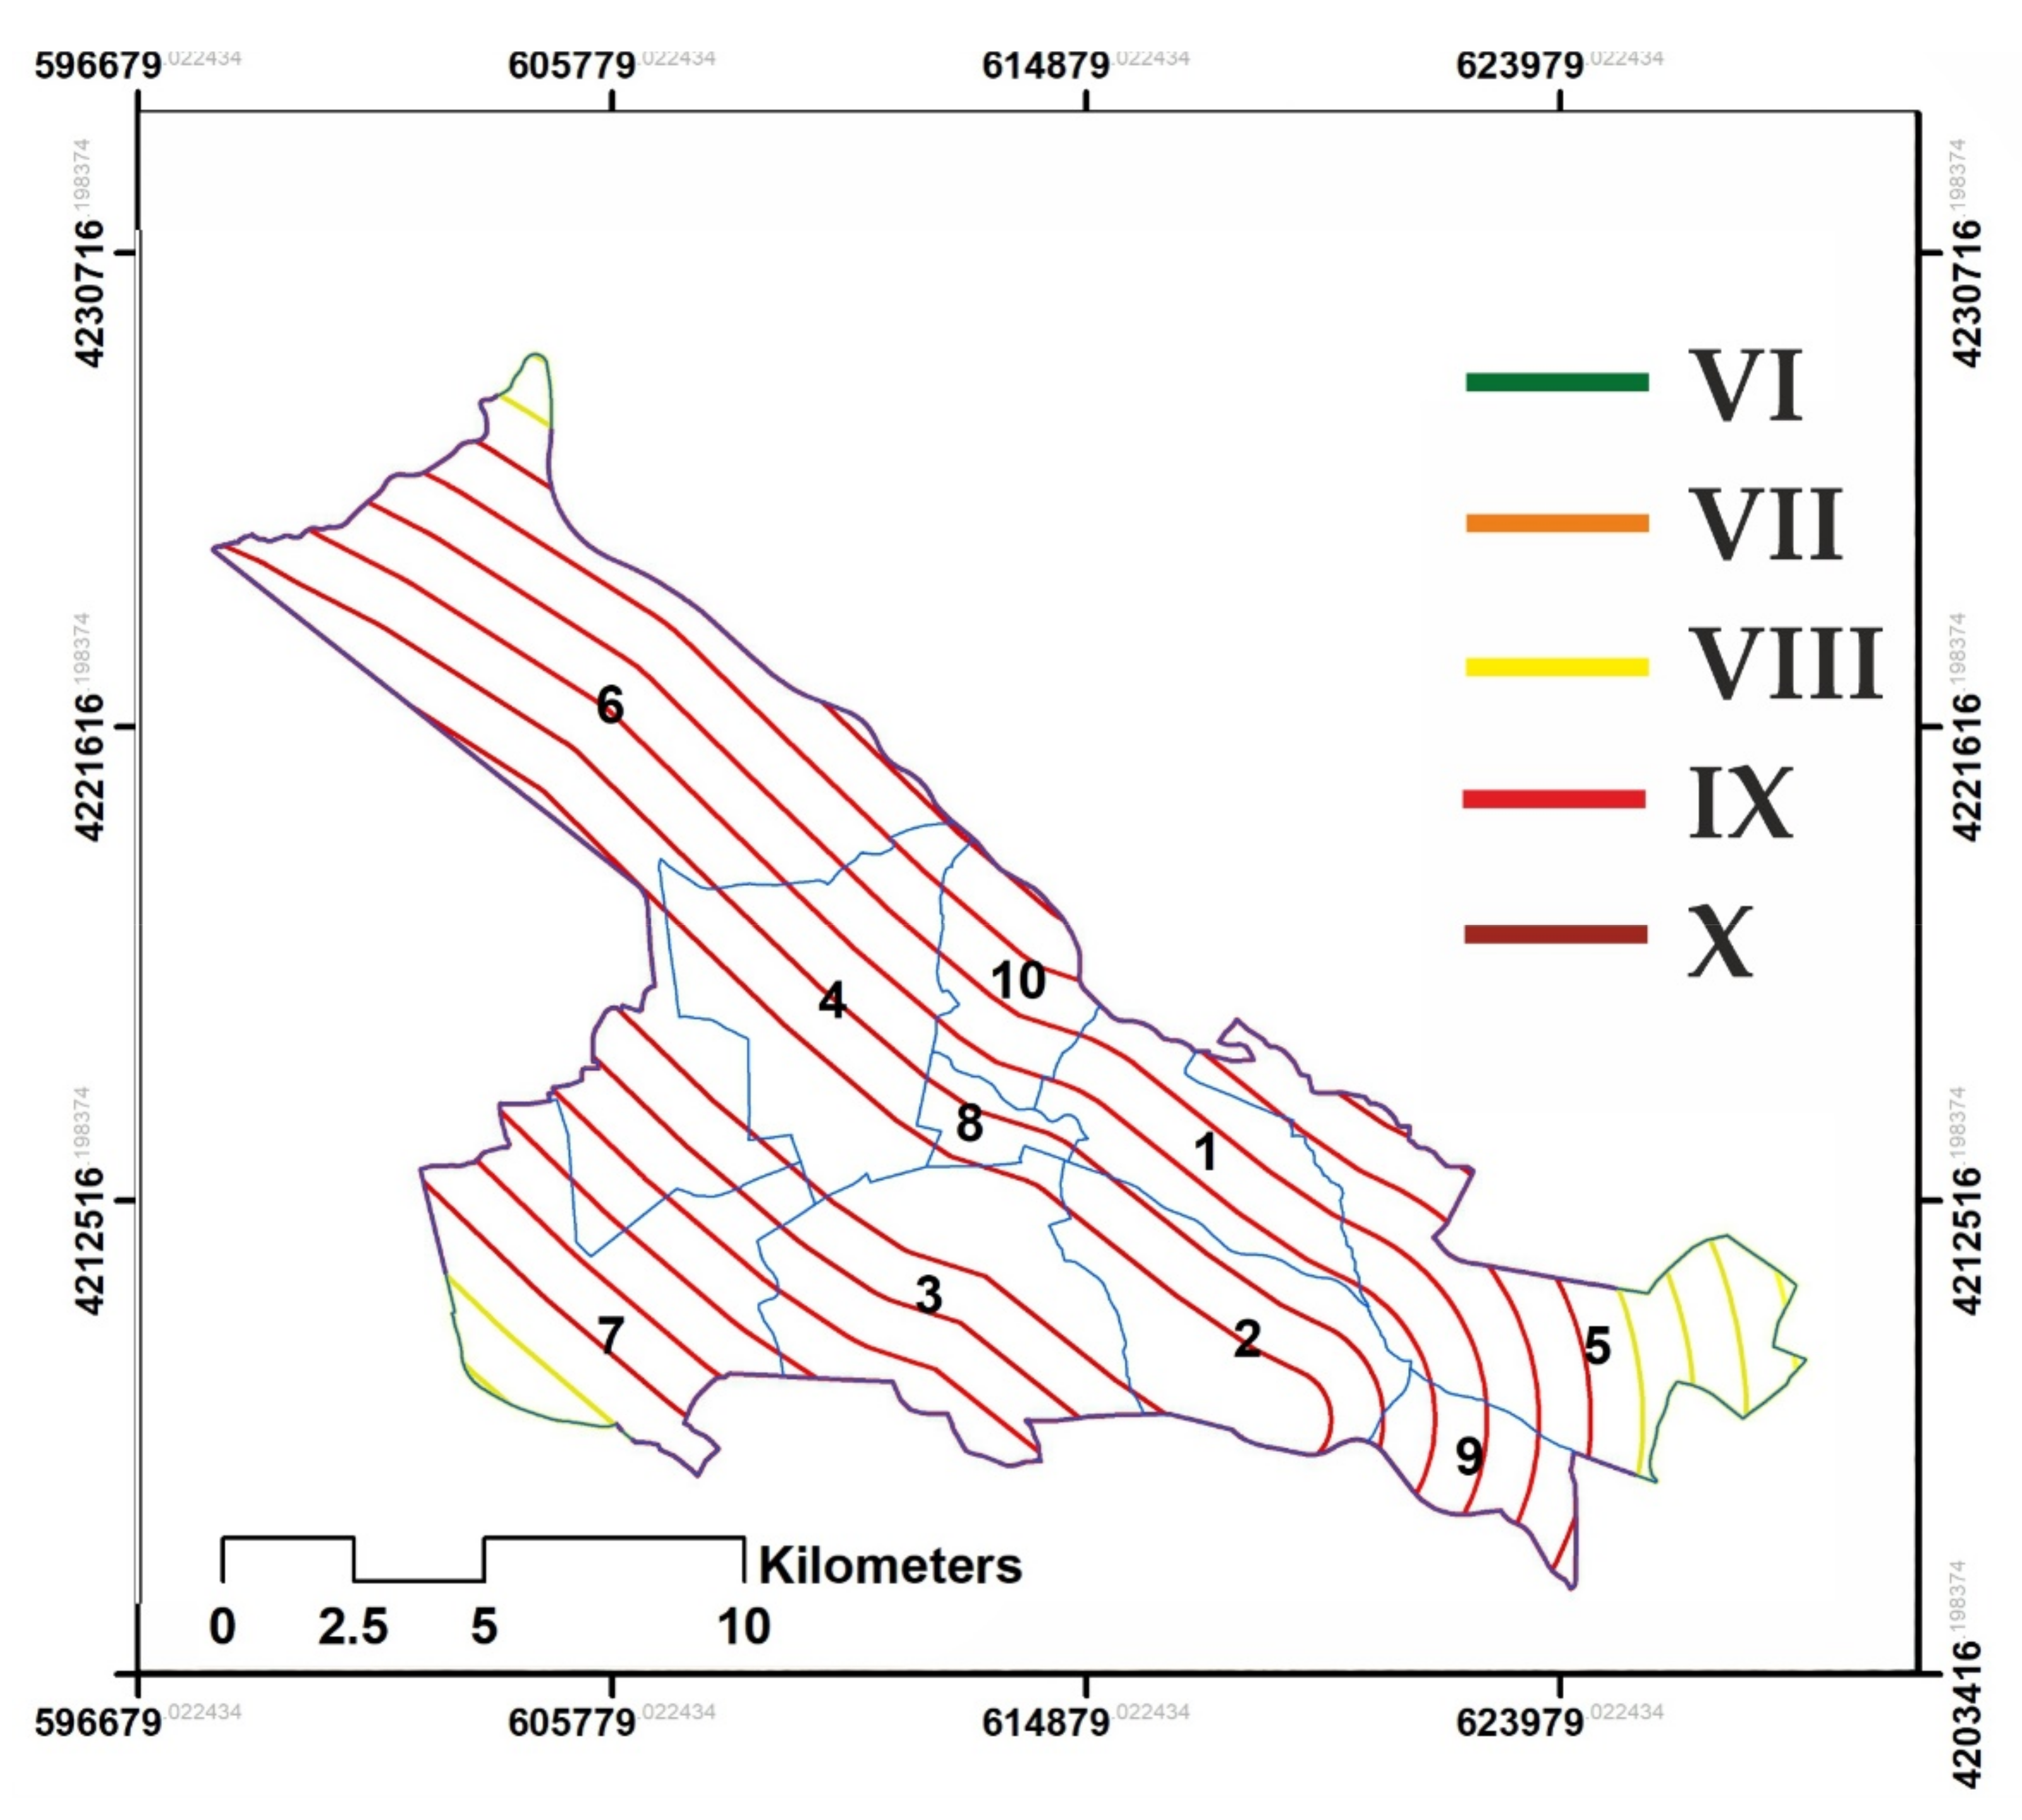
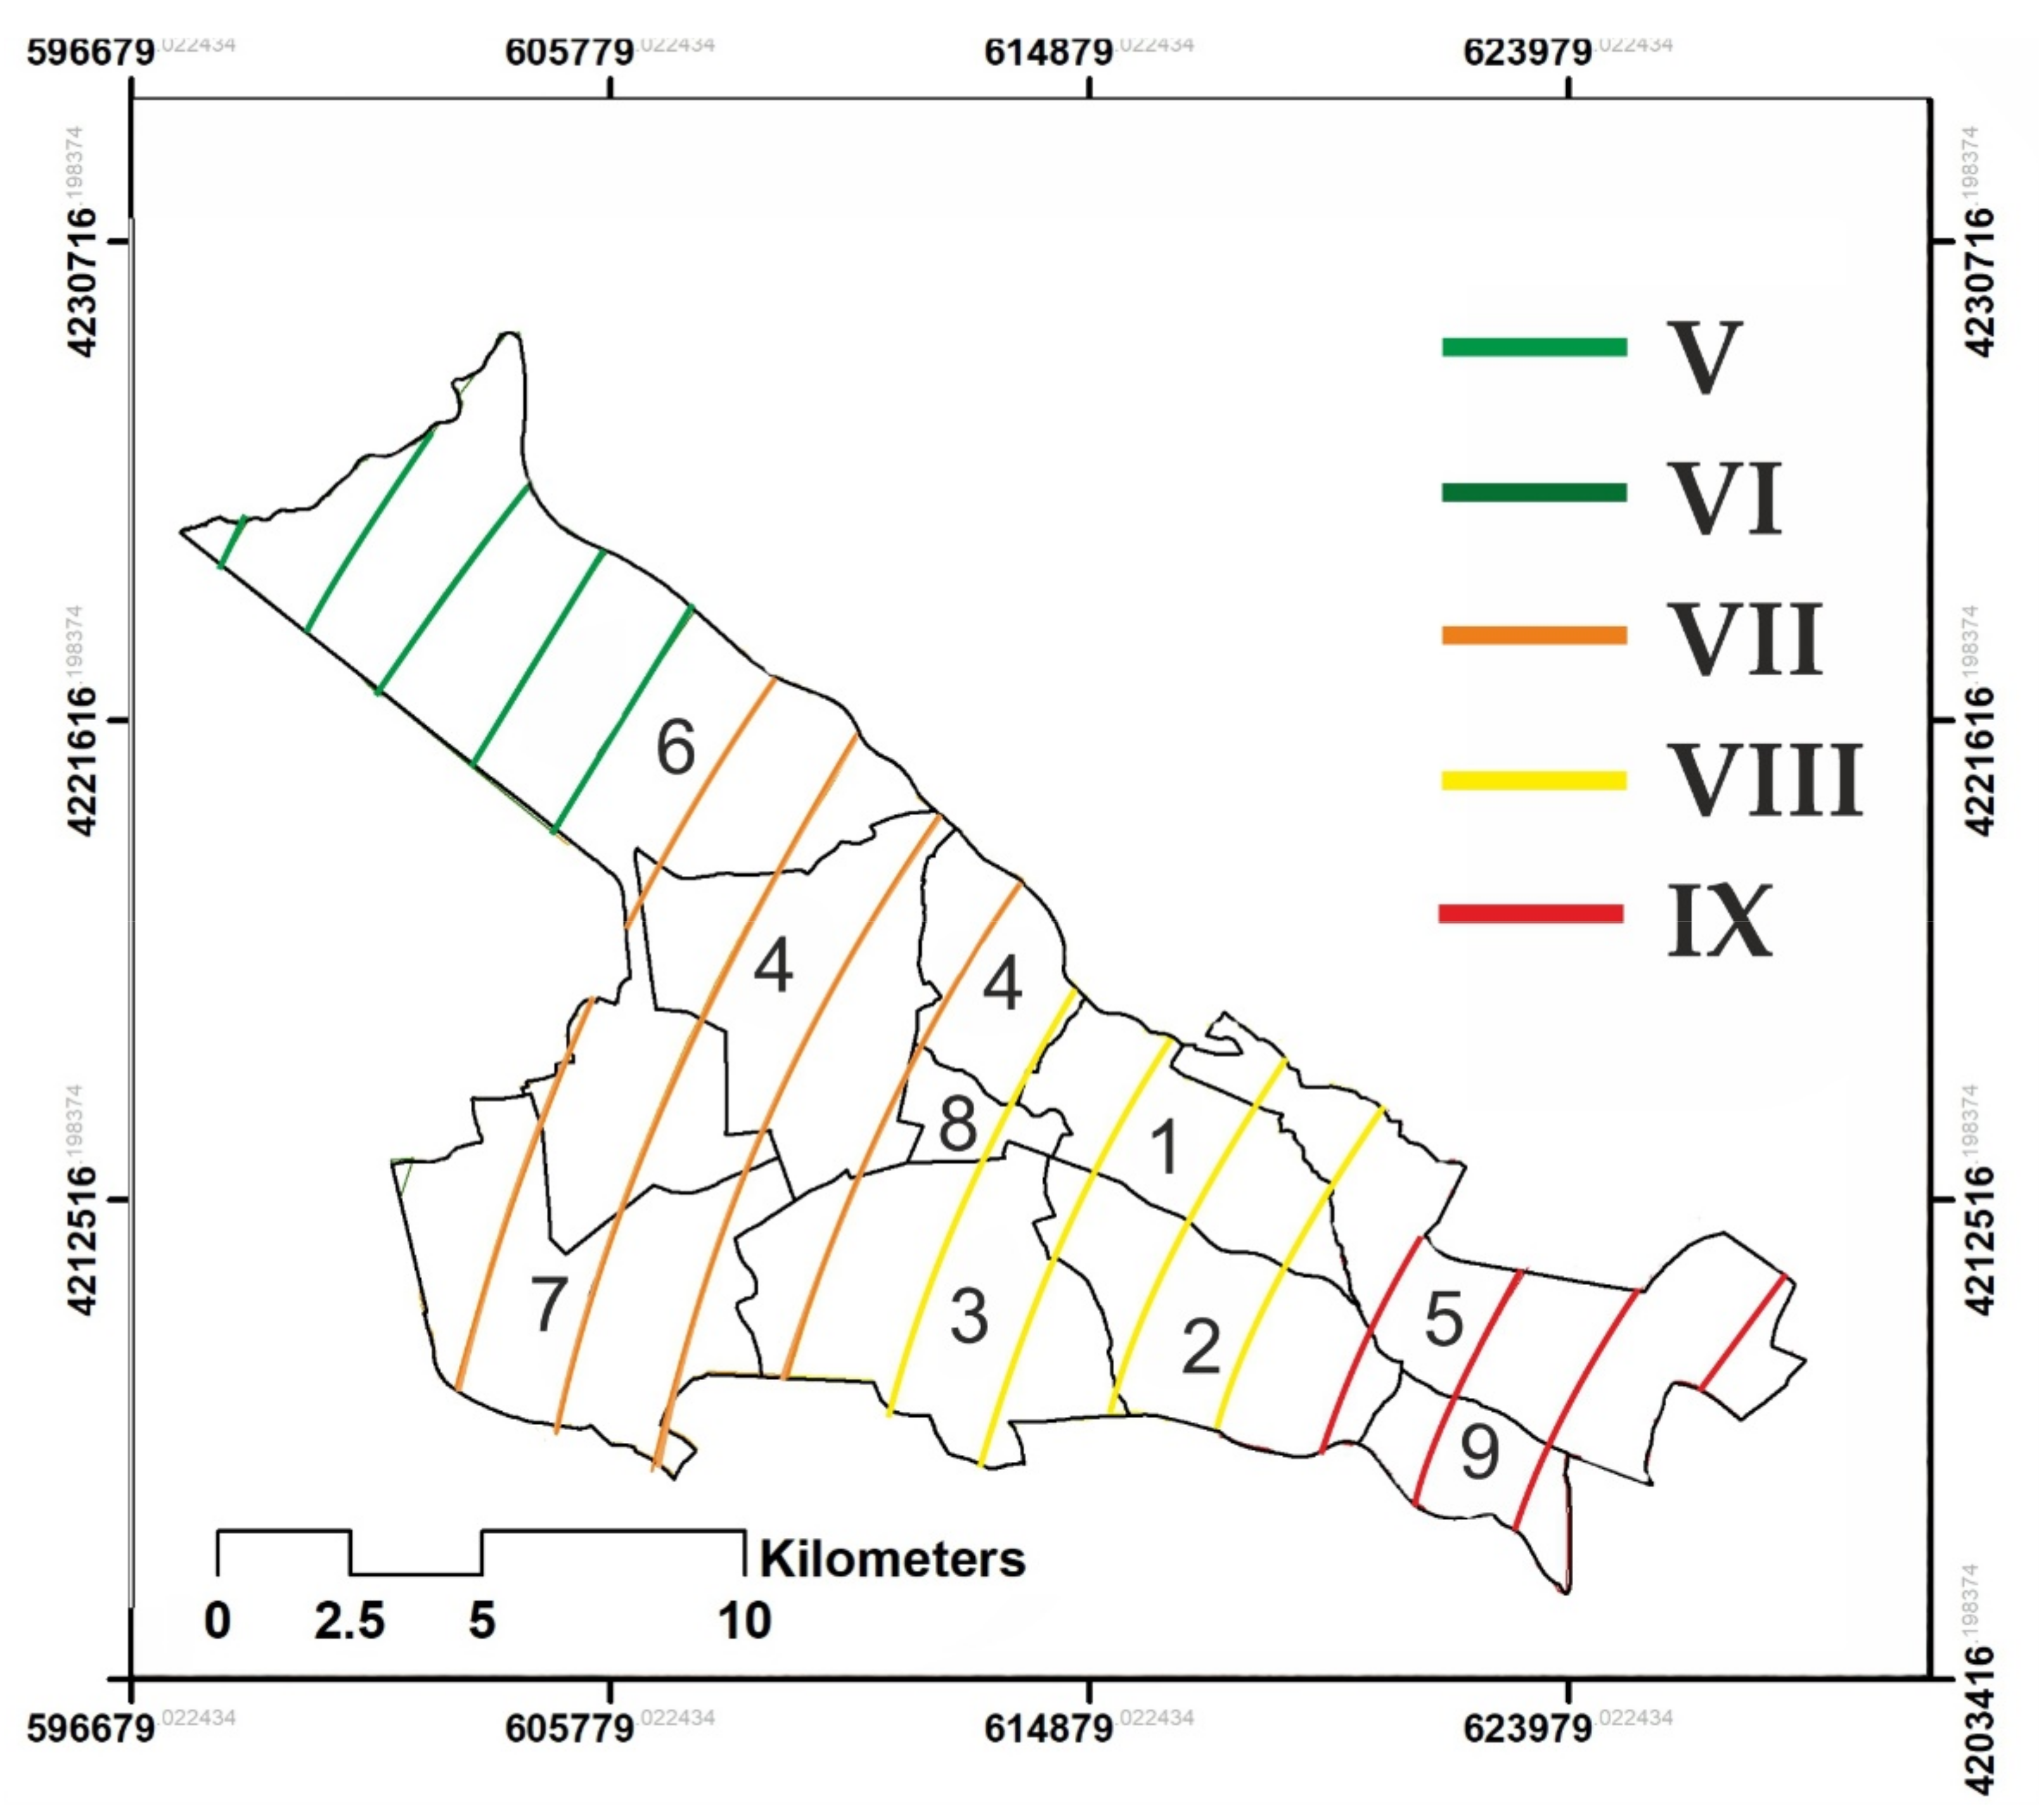
Figure 7 and
Figure 8 show the raw intensity of the seismicity.
Figure 7 shows an earthquake with a magnitude of 7.3, which is due to the proximity of the fault to the site, causing a high destructive power or a modified Mercalli power of 9, which is also very destructive. However, the 1780 earthquake, despite its magnitude of 7.4, had a lower modified Mercalli power due to the distance of the fault from Tabriz.
Therefore, for the deterministic seismic analysis in Tabriz, an intensity reduction equation compatible with the site should be selected, and then the magnitude of the earthquake should be calculated. Using damping equations, it can be shown how strongly the earthquake is felt in each area. The vulnerability diagram is used to analyze the vulnerability of buildings in Iran as a function of the Modified Mercalli intensity. Therefore, instead of using damping equations based on PGA or PGV, the damping equations based on the MMI, which are given in Equitation 1, were used. The results are plotted in
Figure 7 and
Figure 8 for the 1721 and 1780 earthquakes, respectively. This shows the high magnitude of the earthquake that took place in 1721.
In order to produce the final map of the magnitude of the earthquake in the city of Tabriz, it is also necessary to take into account the effect of the site. For this purpose, a site intensity map was first prepared and then combined with the earthquake intensity map in
Figure 7 and
Figure 8 for the 1721 and 1780 earthquakes.
where
GSM is the ground shaking map,
S is the seismic amplitude map, and
I is the intensity map.
The ground shaking map of the earthquake, which is shown in
Figure 7 for the 1721 earthquake and
Figure 8 for the 1780 earthquake, was combined with the seismic amplitude map in
Figure 6, and the final map was obtained.
3.2. Vulnerability
Vulnerability is generally used to determine the ways in which buildings and communication networks are damaged in an event. The examination of the vulnerability of existing buildings is a way of predicting the damage from possible earthquakes [
84]. Vulnerability analysis is the process of estimating the vulnerability of certain elements that are potentially at risk due to catastrophic hazards. The most important factors that increase the vulnerability of cities include being located on faults, having a high population, not observing construction standards, having large amounts of informal housing, having unprincipled high-rise buildings, using low-quality materials, having an absence of crisis management programs, and having a lack of general training [
85,
86,
87].
The following is an analysis of the vulnerability of buildings and the population to the two earthquake scenarios of 1721 and 1780.
3.2.1. Vulnerability Analysis of the Buildings
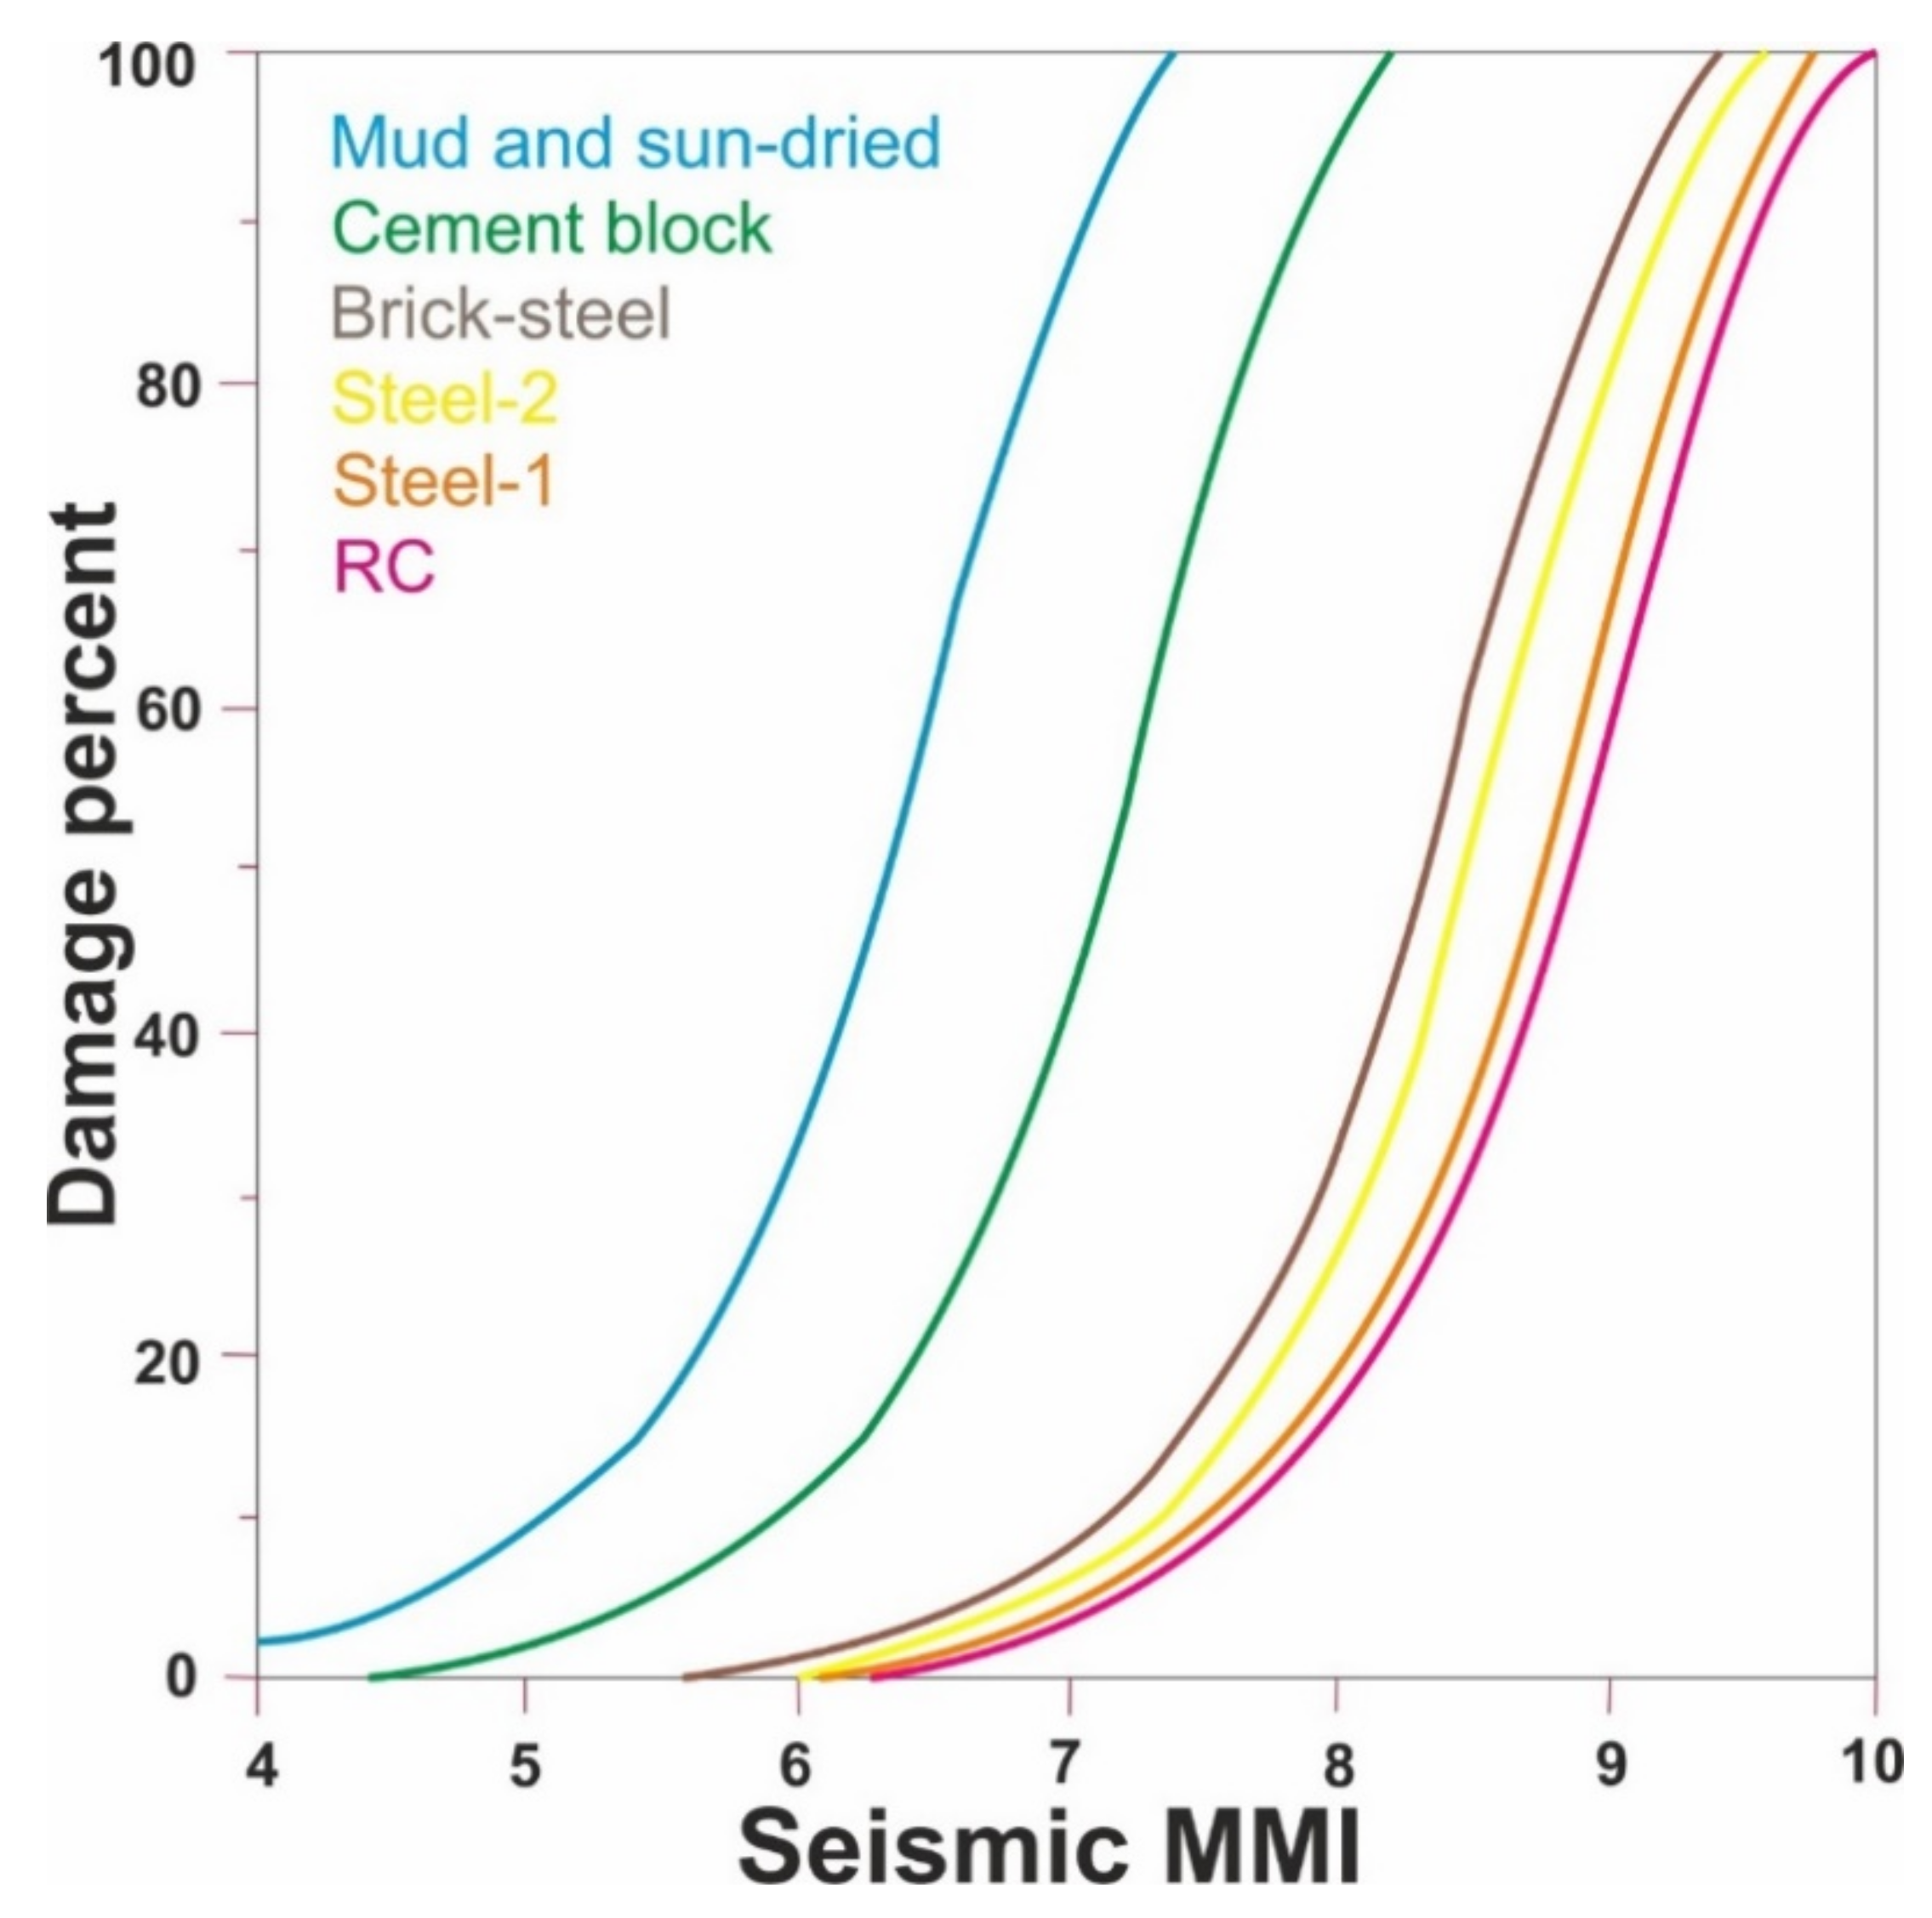
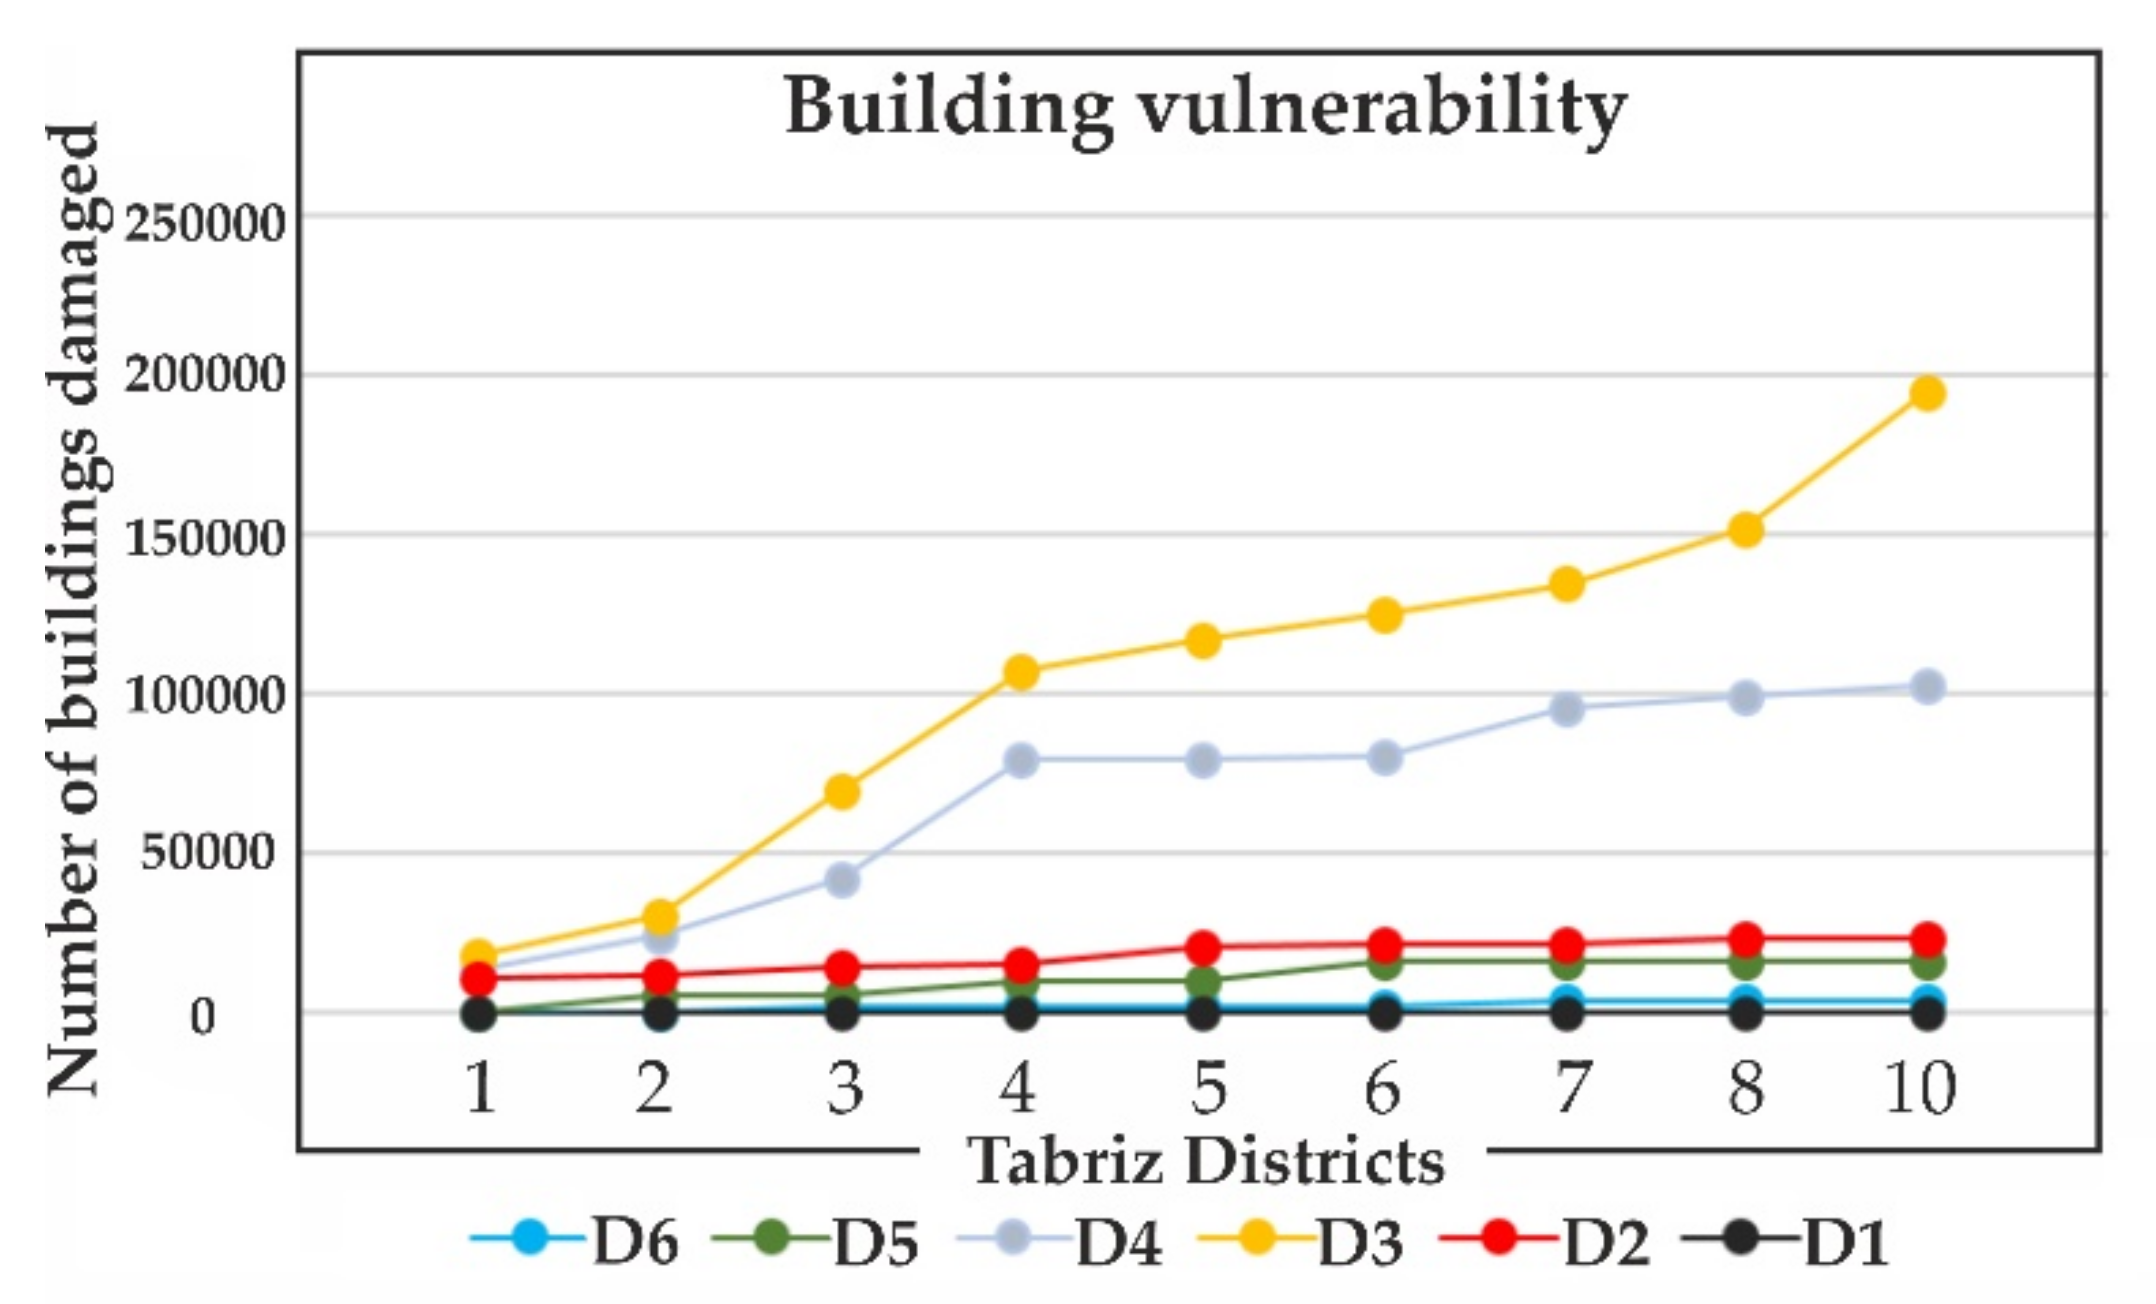
The earthquake resistance of buildings varies from region to region and from country to country. Even if the buildings are similar in appearance to each other, they may be different in terms of their earthquake resistance characteristics. The relationship between the earthquake and the damage ratio is not always the same. Therefore, collecting records of catastrophic earthquakes and extracting the damage function based on local experience is one of the best methods for estimating damage. When the relationship between earthquake motion and the damage ratio is determined, it becomes possible to estimate the damage caused to a large number of buildings in a large city according to these criteria. In order to evaluate the buildings in Tehran based on the information of buildings in such earthquakes as Ghaenat, Lordegan, and Ardakan, and based on the evaluation of JICA experts, vulnerability diagrams were devised for different types of buildings. The Modified Mercalli Intensity Scale (MMI) was used to produce JICA vulnerability diagrams according to the type of structure, the year of construction, and the number of floors of the buildings. The building vulnerability diagram based on JICA studies is provided in the following [
88].
Figure 9 was obtained using the vulnerability diagram made by Hassanzadeh et al. [
28] based on their observations of earthquakes in Iran. It was modified based on the Mercalli magnitude scale. It shows the extent of the building destruction based on the Mercalli magnitude scale and the type of structure involved. It also classifies the extent of the building destruction into six general categories, as shown in
Table 4 [
28,
88].
According to
Table 4, level D1 is the highest level of destruction, meaning that all of the walls and roofs of the structure are destroyed. Level D2 is the next level, meaning a very high rate of destruction, with a large area of the structure being destroyed (at least 60% of the structure is destroyed; all or part of the roof may be destroyed). Then, level D3 means a high level of destruction, causing >20 mm cracks in the walls and ceilings. The cracks widen due to aftershocks. The destruction rate of the structure is at least 30%. Level D4 is the average level of destruction, damaging at least 11% of the structure and leaving 5–20 mm cracks. Level D5 brings about very few cracks, and its destruction rate is 3–10%. At level D6, there is no damage to the building. This condition generally occurs for structures made of reinforced concrete and located at a great distance from the epicenter.
For this study, we collected information from municipality buildings and field observations. This information is in the form of readable maps in the Arc GIS software. The information that was prepared in the field was in the form of the IDs of buildings and data columns in Excel. Then, using the tools available in Arc GIS, we joined new data with the existing data through a common field. Descriptive tables can be used to identify the type of structures (using editor tools and update and intersect commands). The current data included descriptive and spatial information that was updated through the tools used for Arc GIS. In general, the conditions of the structures in Tabriz are provided separately in different municipality areas in the form of tables and maps.
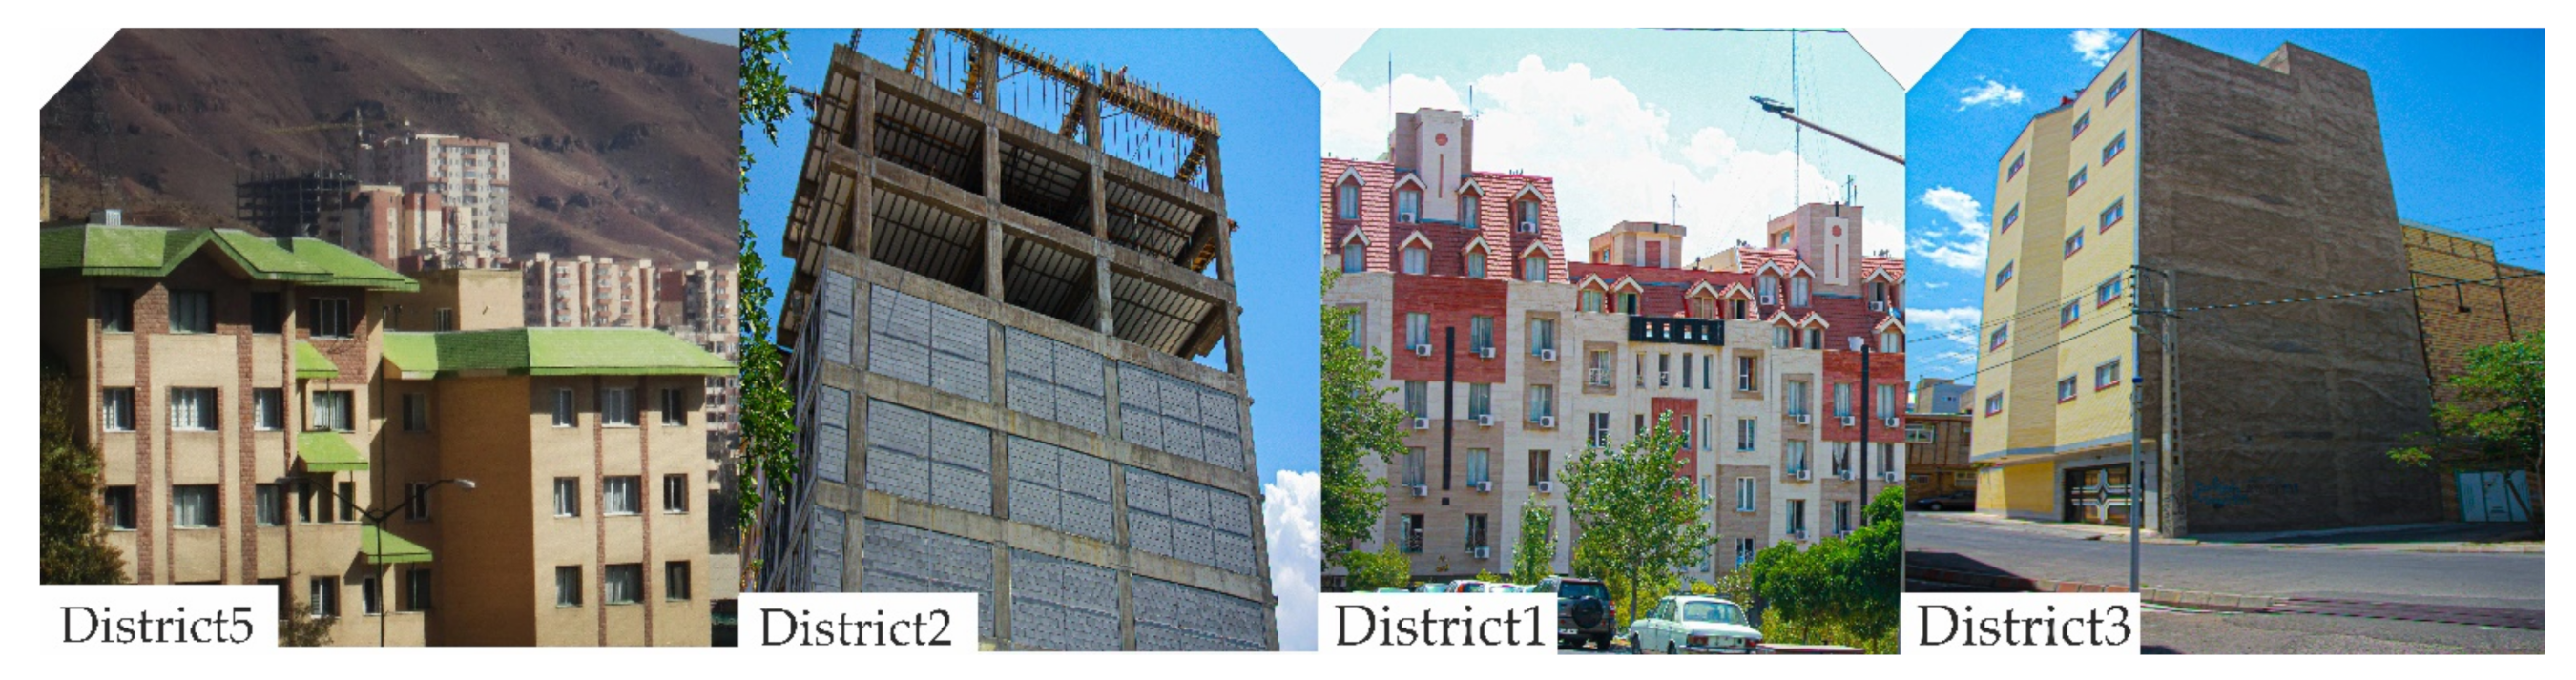
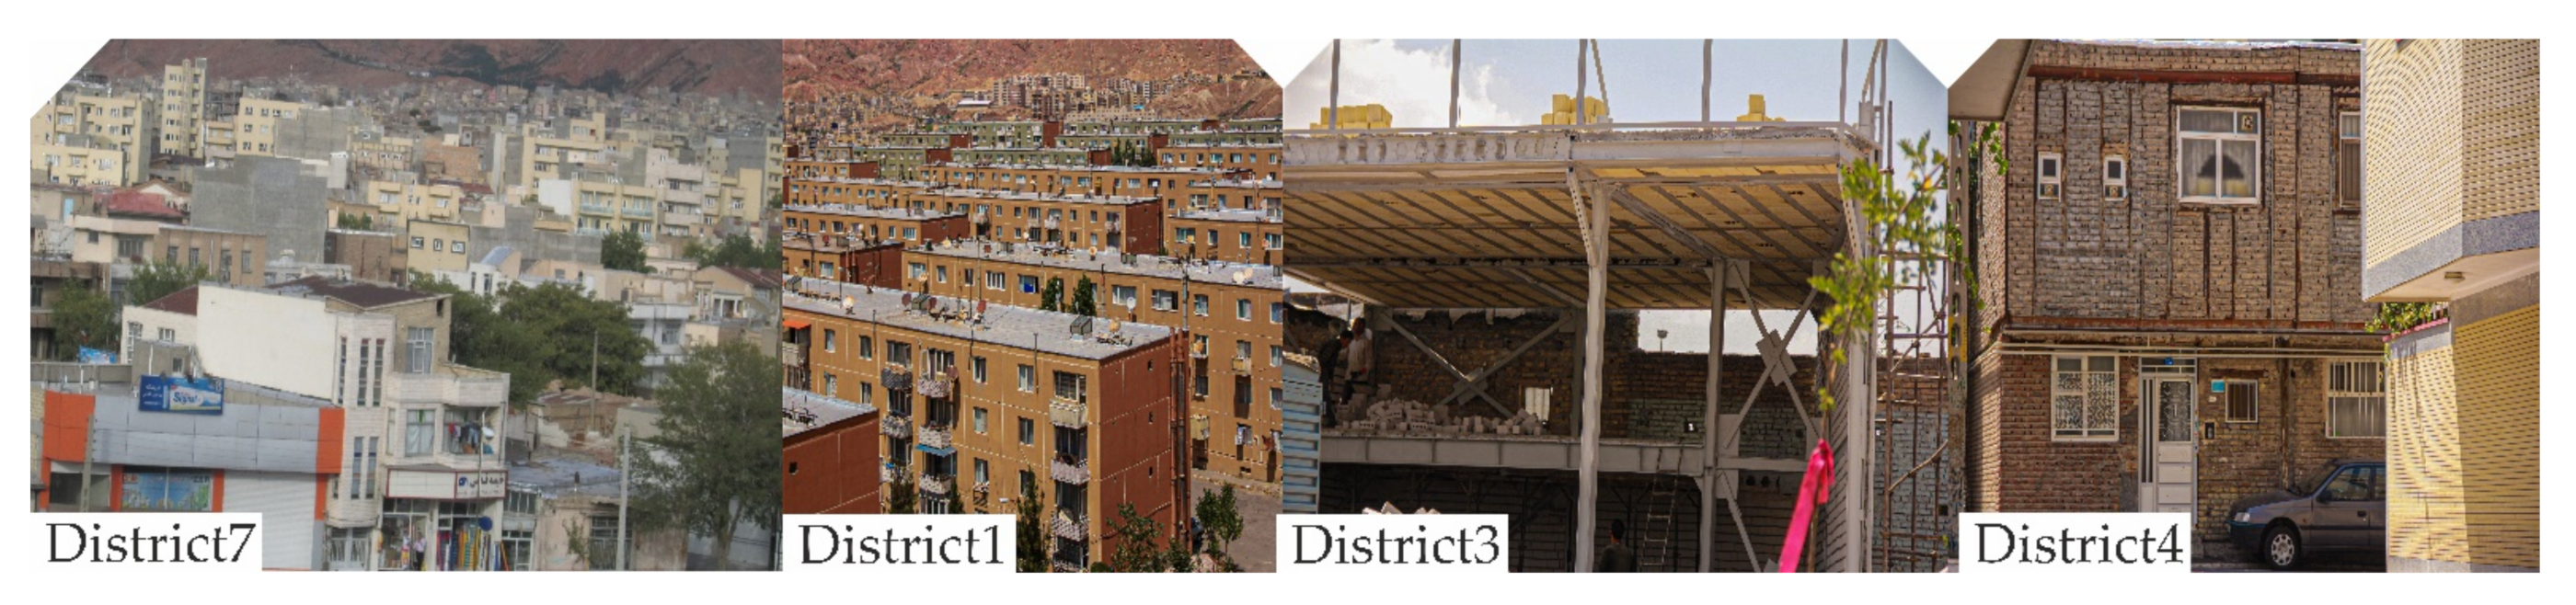
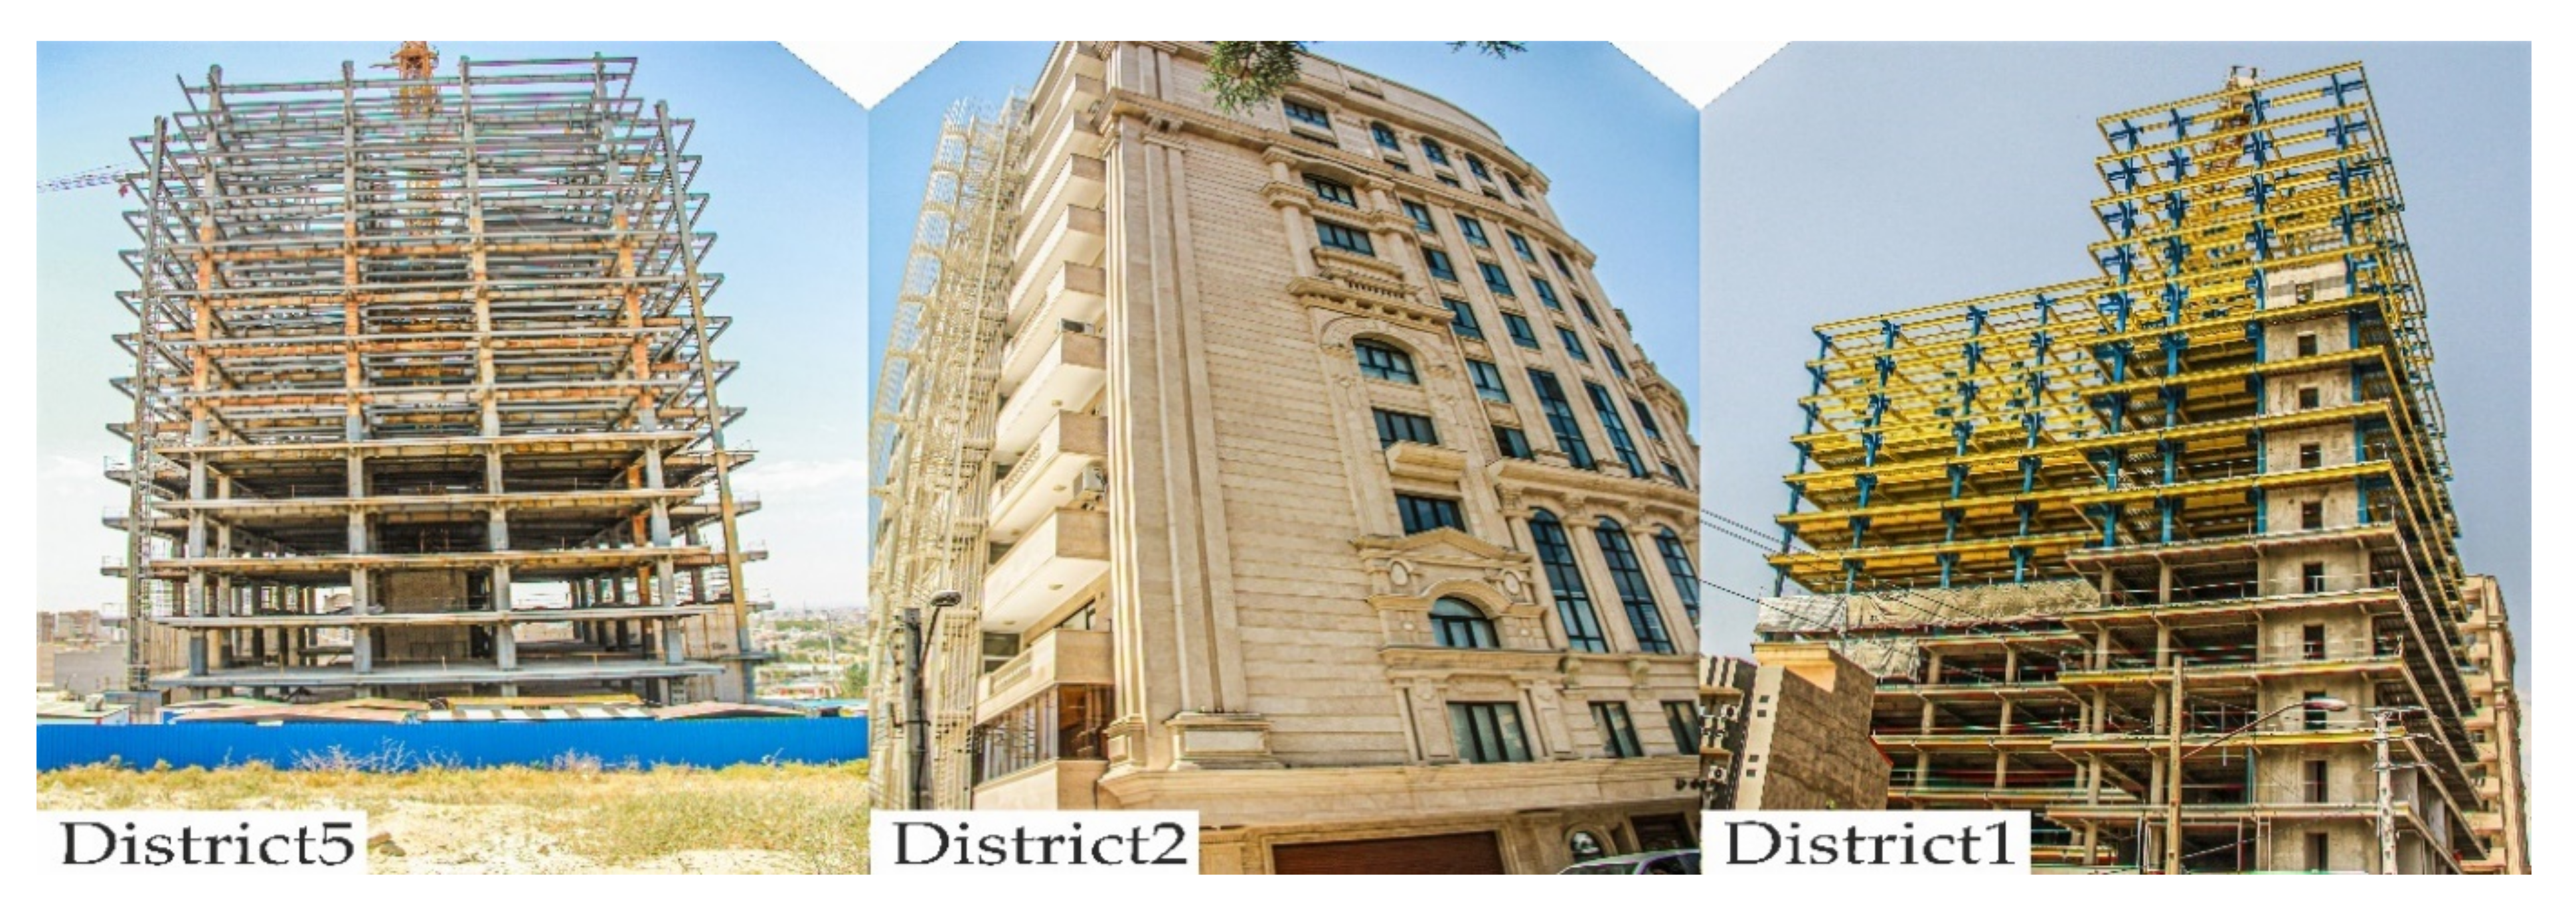
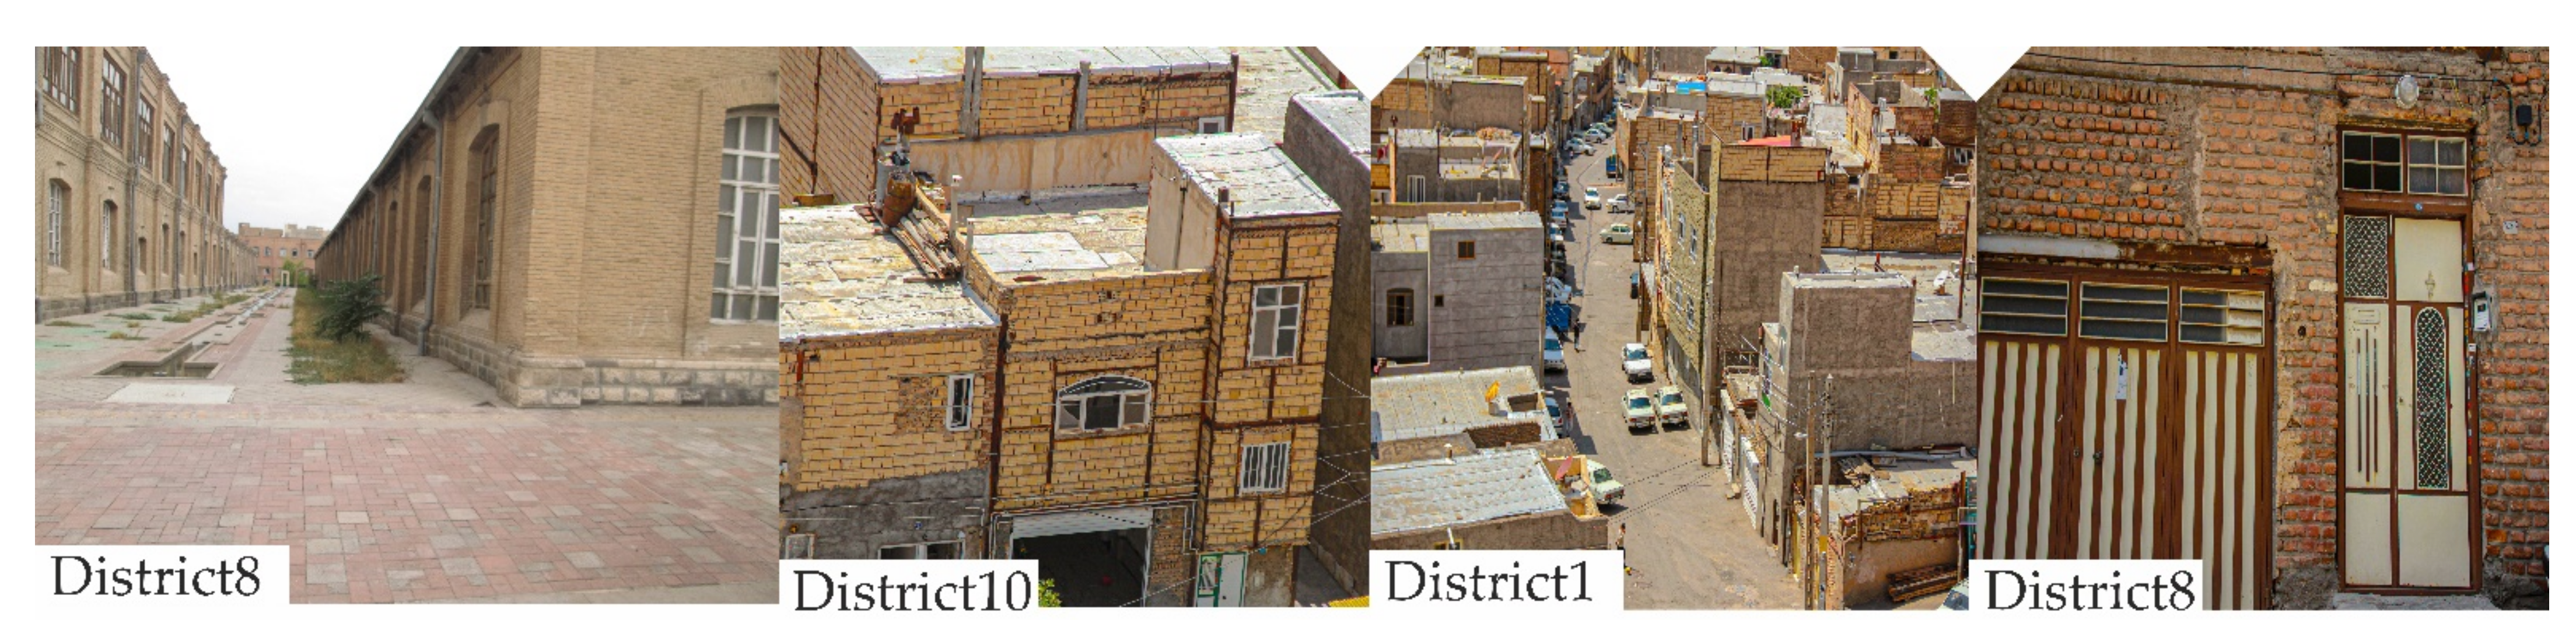
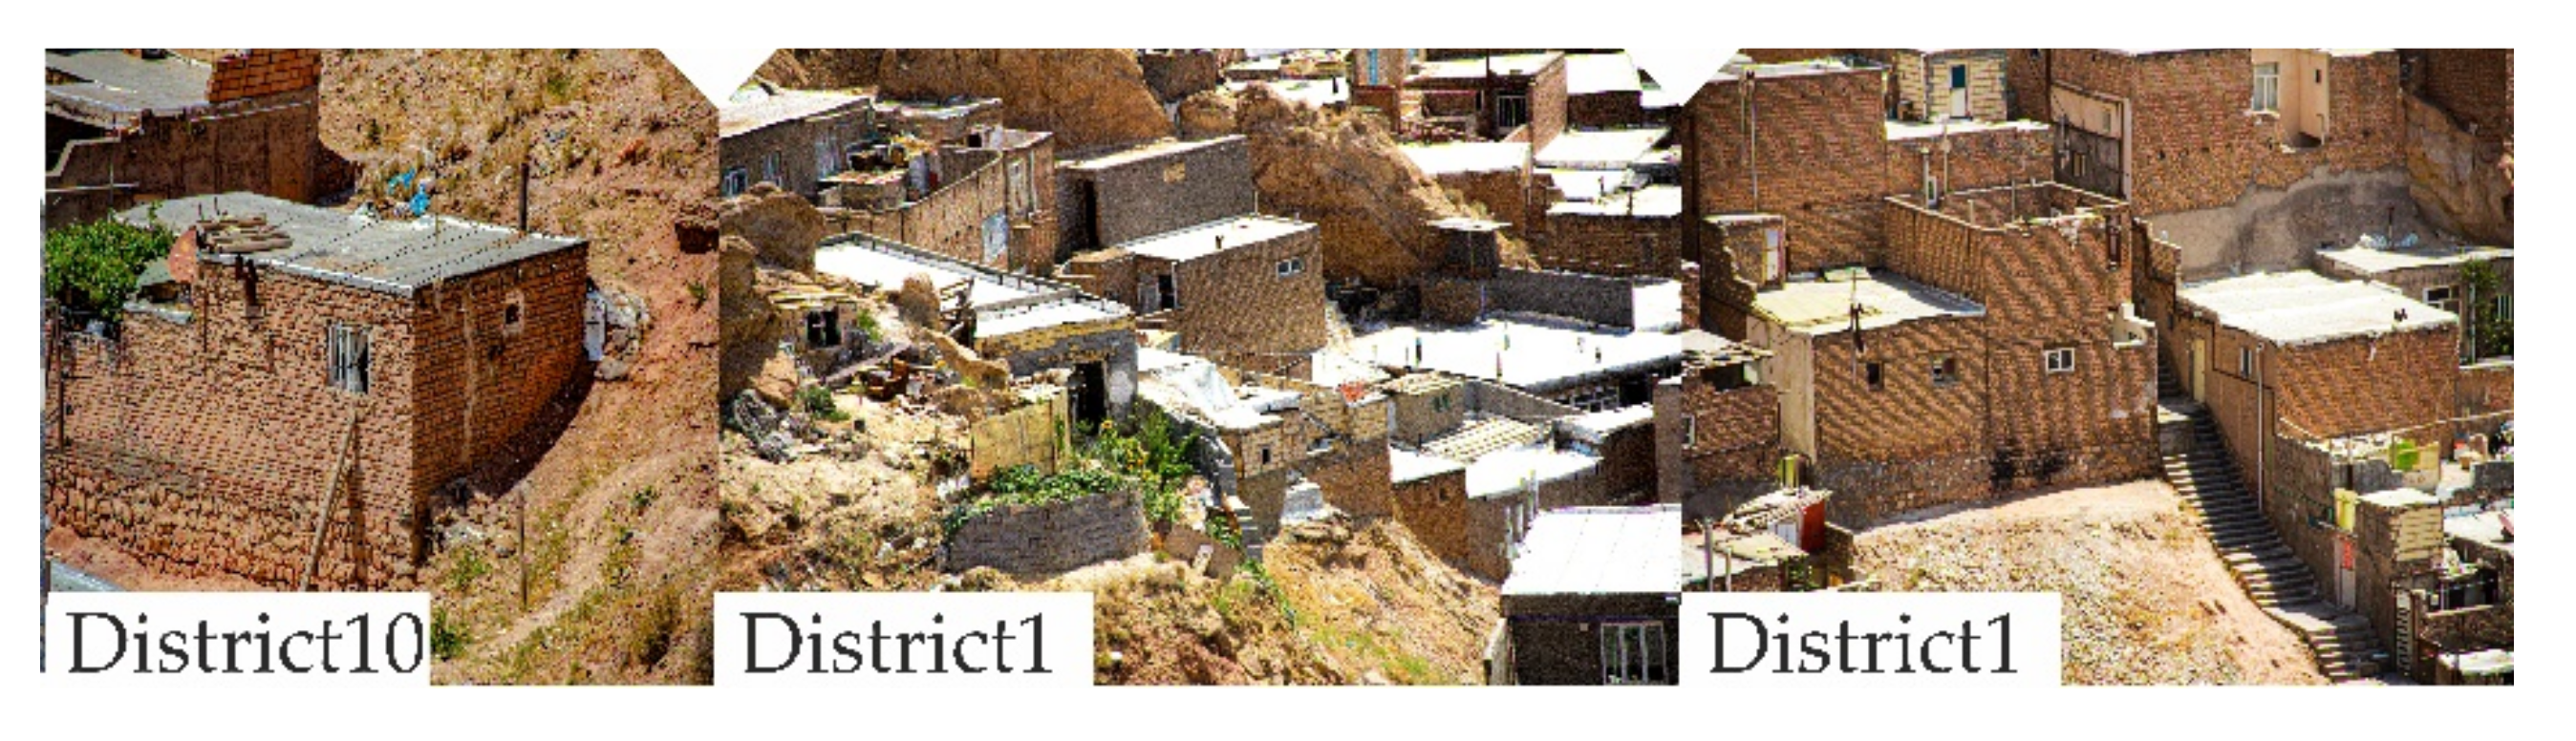
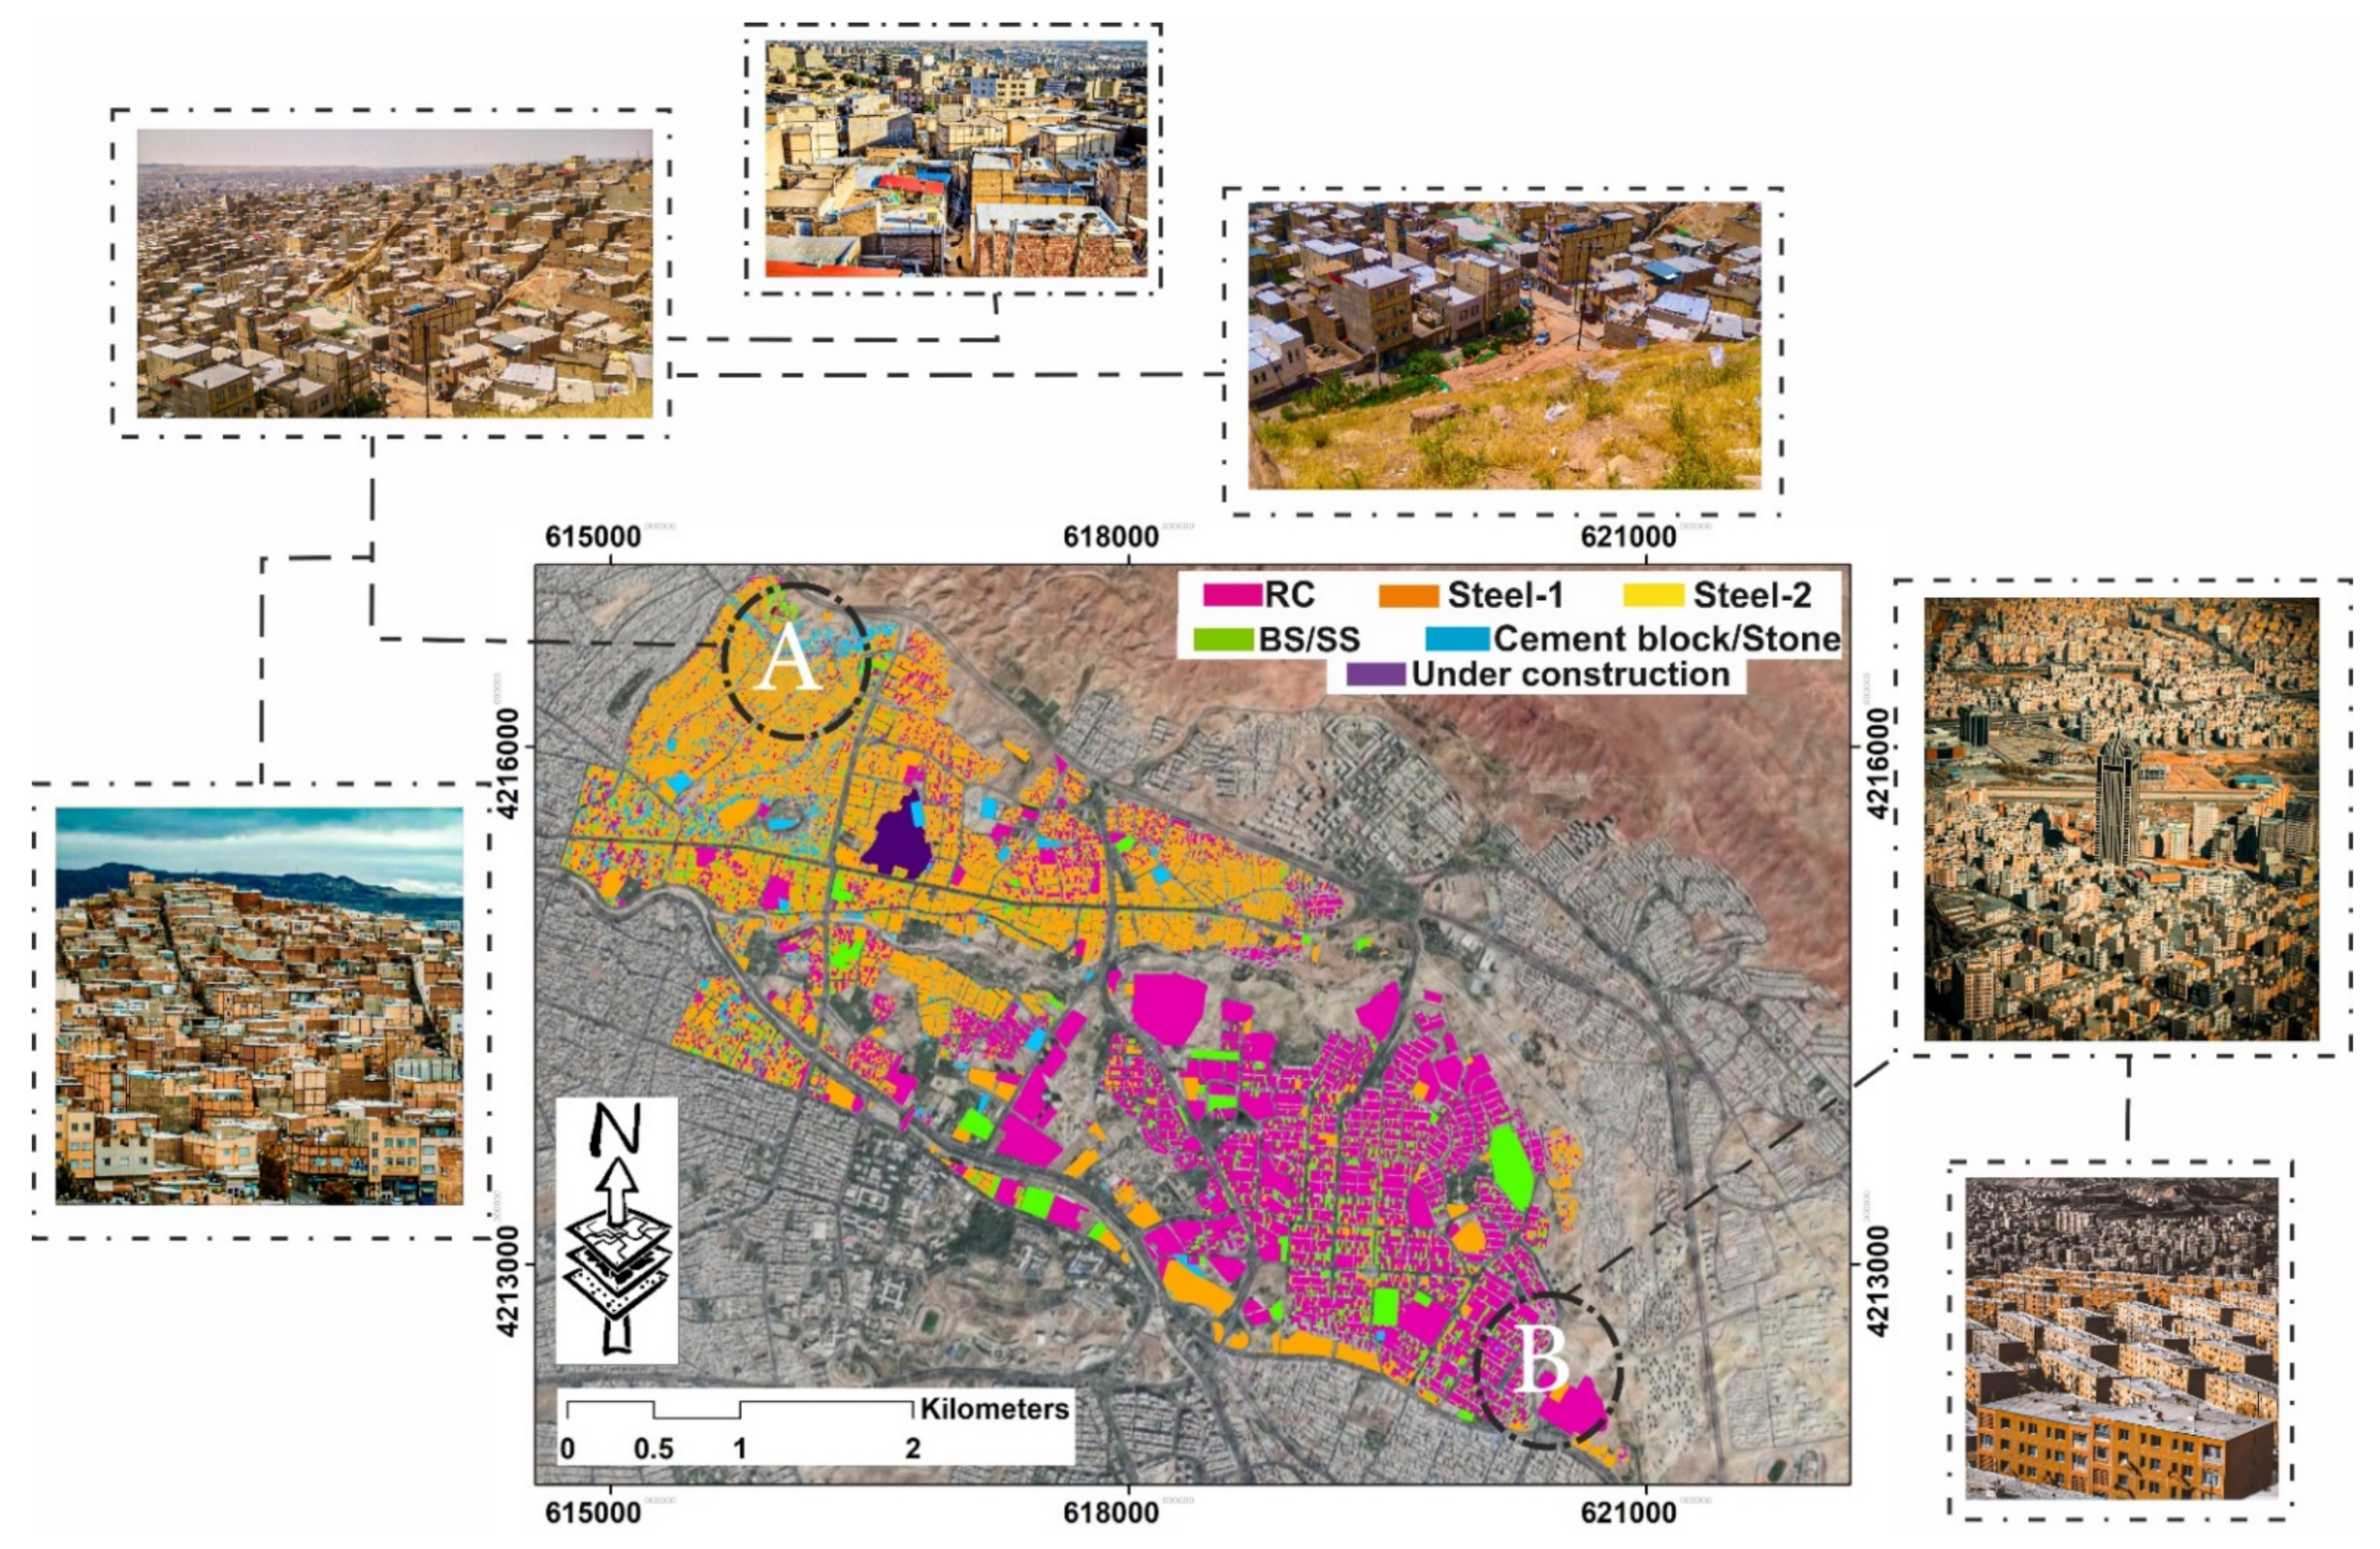
In the city of Tabriz, there is no known and fixed model for the construction of buildings in urban areas or towns. As a result, in each district of the city, we are facing different shapes and types of structures, which have been constructed throughout time. This makes it impossible to relate each area to one type of structure. Accordingly, this study has based its study criteria on the five main classifications of the structure types that are reflected in Figure 17 by collecting information about the type of structure of the buildings in each district. Sample images of each of these classifications are given in
Figure 10,
Figure 11,
Figure 12,
Figure 13 and
Figure 14. These images will give you an idea about each category.
Table 5 shows the conditions of the structures in the city of Tabriz and its different districts. In
Table 5, RC means reinforced concrete for all buildings with any number of floors. shows several examples in the city of Tabriz. District 3 of Tabriz is ranked first among all of the districts of Tabriz. The neighborhoods of Shahrivar, Kooche Mehran, Saeb, and Pasteur consist of new buildings with strong structures due to developments and renovations. The second type of structure is Steel-1 structures, which are made of steel. They are up to three floors high. These structures are the most frequent ones encountered. In terms of frequency, this type of structure is the most common in District 4. As mentioned previously, this area is densely populated, and all kinds of urban textures can be observed in it. Older structures have been renovated in the last twenty years. Most of the structures are made of steel, which is both less expensive and more resistant than older structures. The third type of structure again includes steel buildings, but with the difference that these types of structures generally have more than three floors. shows several examples of this type of building, mostly in areas that began to develop apartments twenty years ago. This type of structure is more frequently seen in District 1. The fourth type of structure is those that have been built with masonry walls, and that generally do not observe safety principles. These structures are mostly found in suburban areas, and are used by those who only seek shelter. They can be found in other areas as well, but only in very small numbers. These structures are generally old. These structures were far more common before 2011 [
31], with their number decreasing due to population growth, the development of the city, and growing awareness of the importance of building safety. New buildings have since replaced them.
Figure 13 shows two examples of these structures. These are structures that are made entirely of cement blocks. This type of structure is very rare in the city of Tabriz. More examples are shown in
Figure 14.
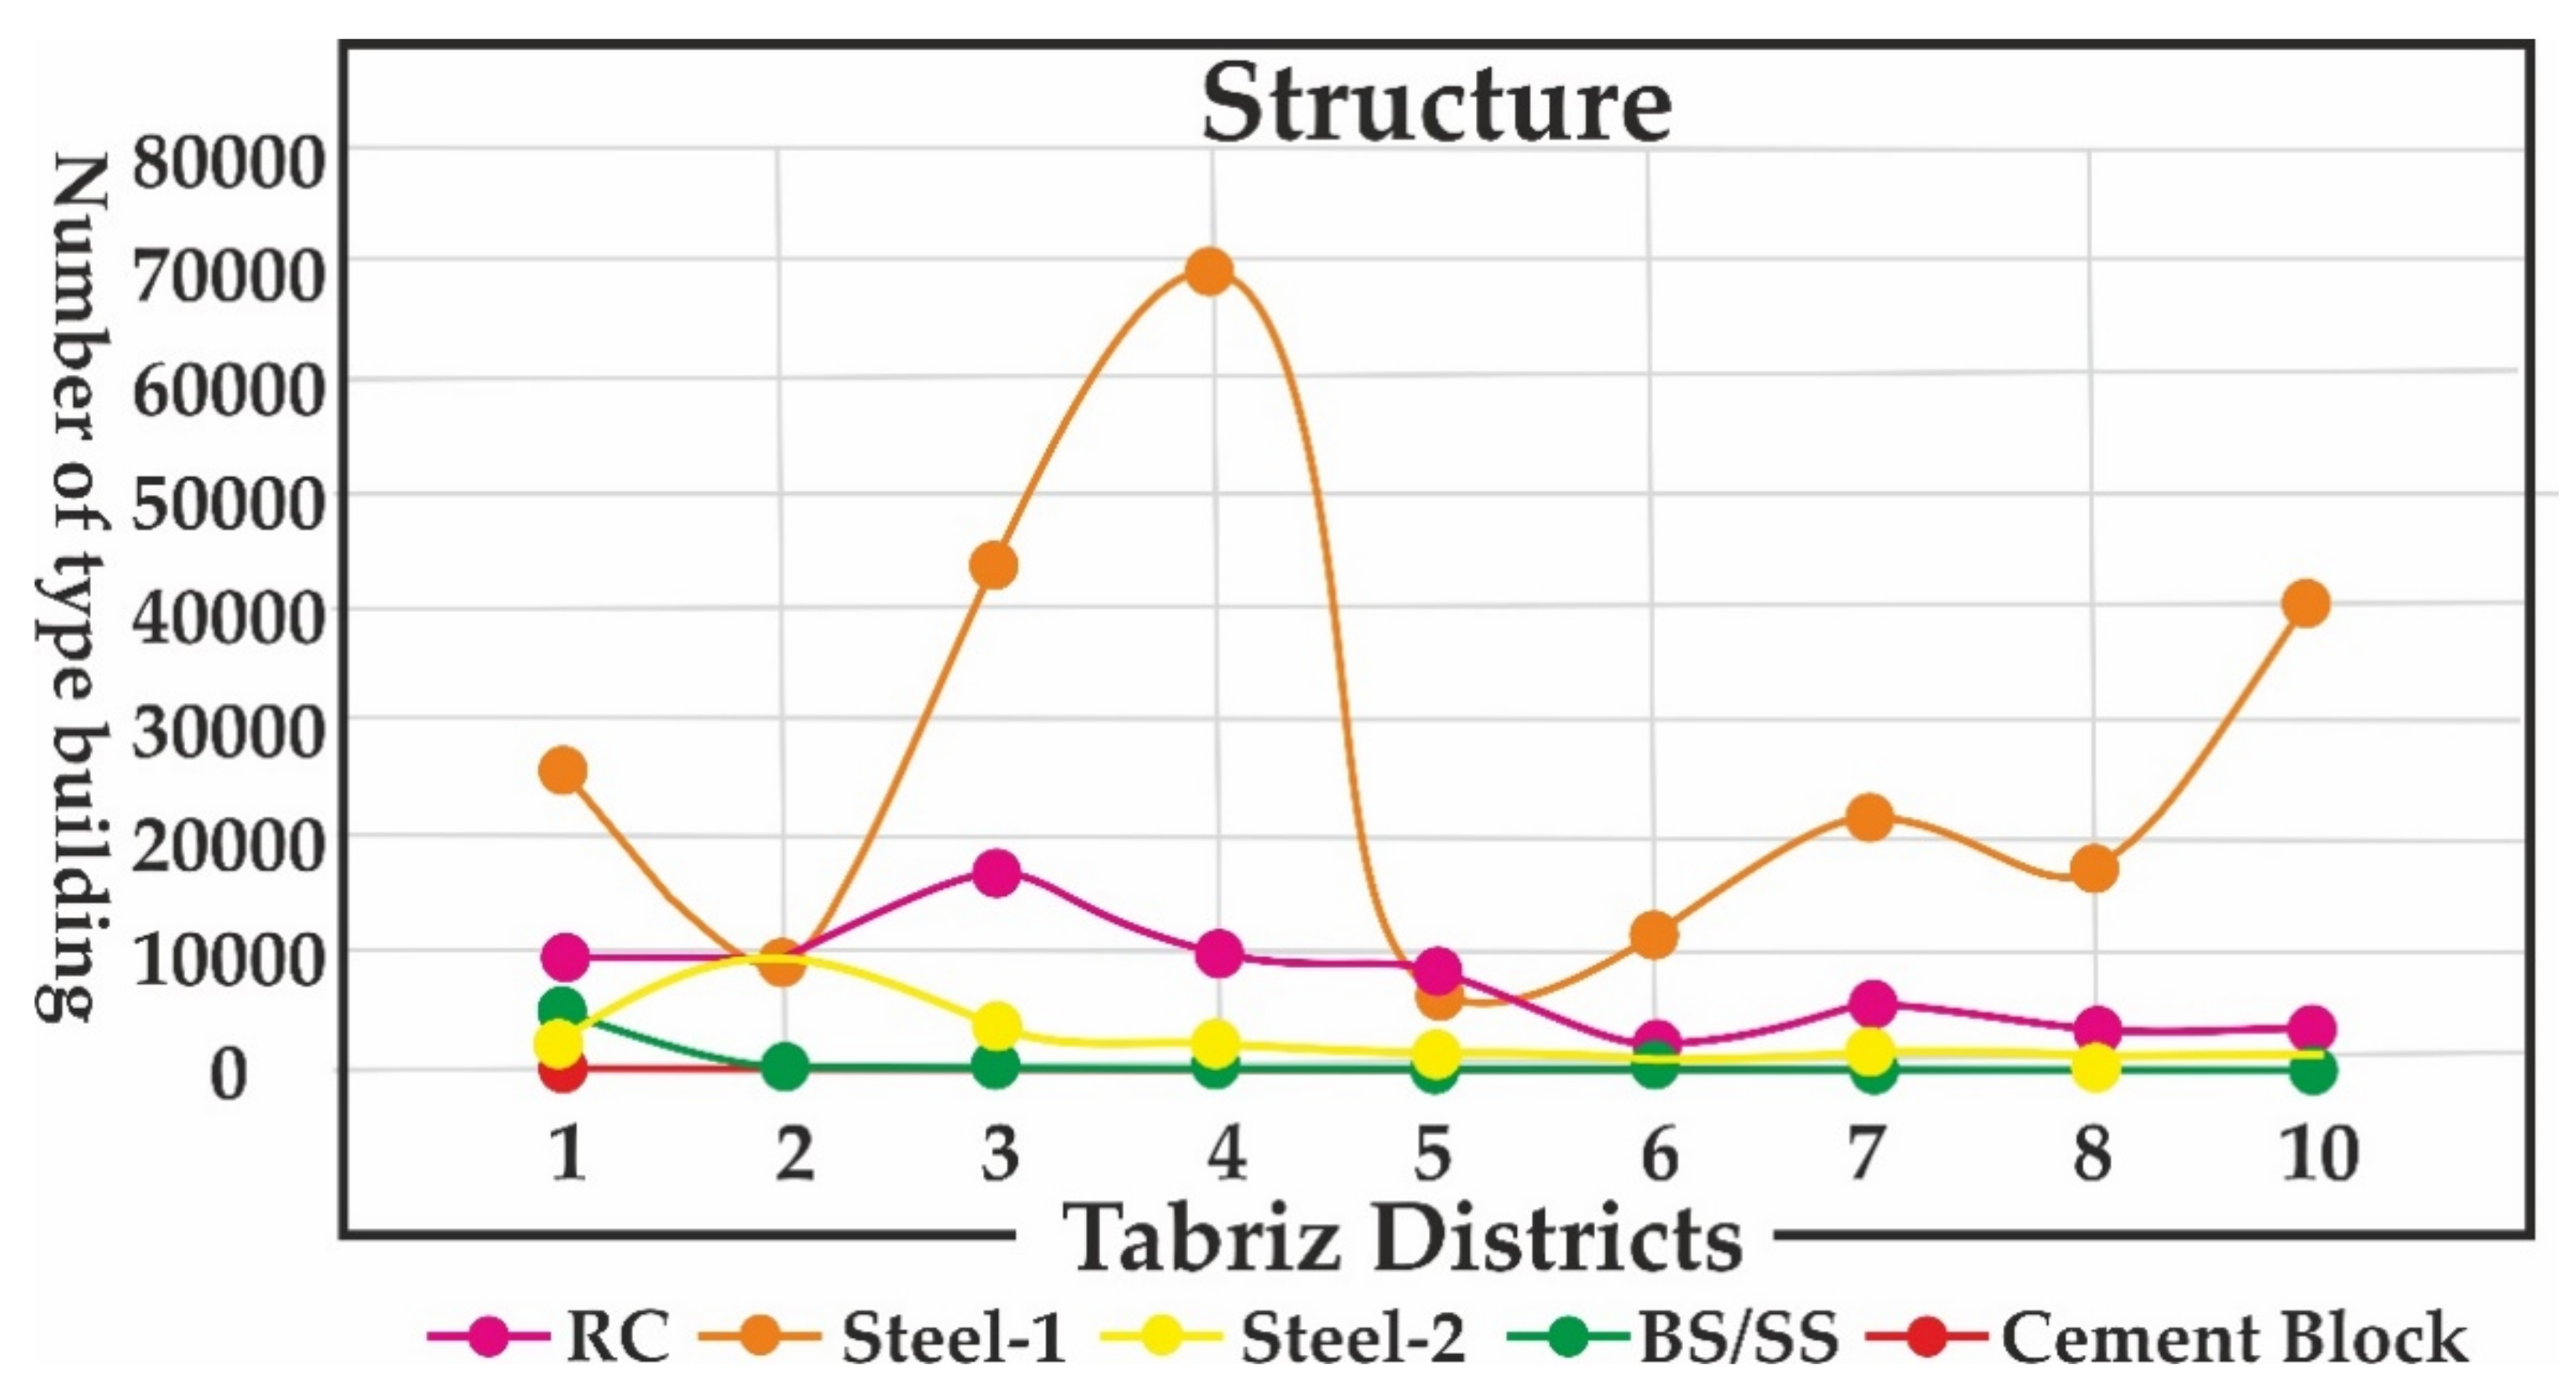
According to the statistical information shown in
Table 5 and
Figure 15, District 4 has the largest number of buildings (79,804), as well as the largest population among the 10 districts of Tabriz. A total of 12% of these buildings are made of reinforced concrete, 84% are of type-1 steel, and 2% are of type-2 steel. Less than 1% of the buildings are made of other materials which do not observe engineering principles, using masonry walls. Due to its great age, District 8 (the core of the city, including important historical monuments which survived the historic earthquake of Tabriz, such as the Blue Mosque) is of great importance both inside and outside the country. In this district, 15% of the structures are made of reinforced concrete, mostly in the south of the district. A total of 78% are type-1 steel structures that have been renovated in the last 10 to 20 years. Next, 5% are type-2 steel structures. Additionally, <1% are other types of structures.
In general, the city of Tabriz has the highest number of type-1 and -2 steel structures, which has greatly improved the seismic conditions of the city compared to the last 10 years [
33].
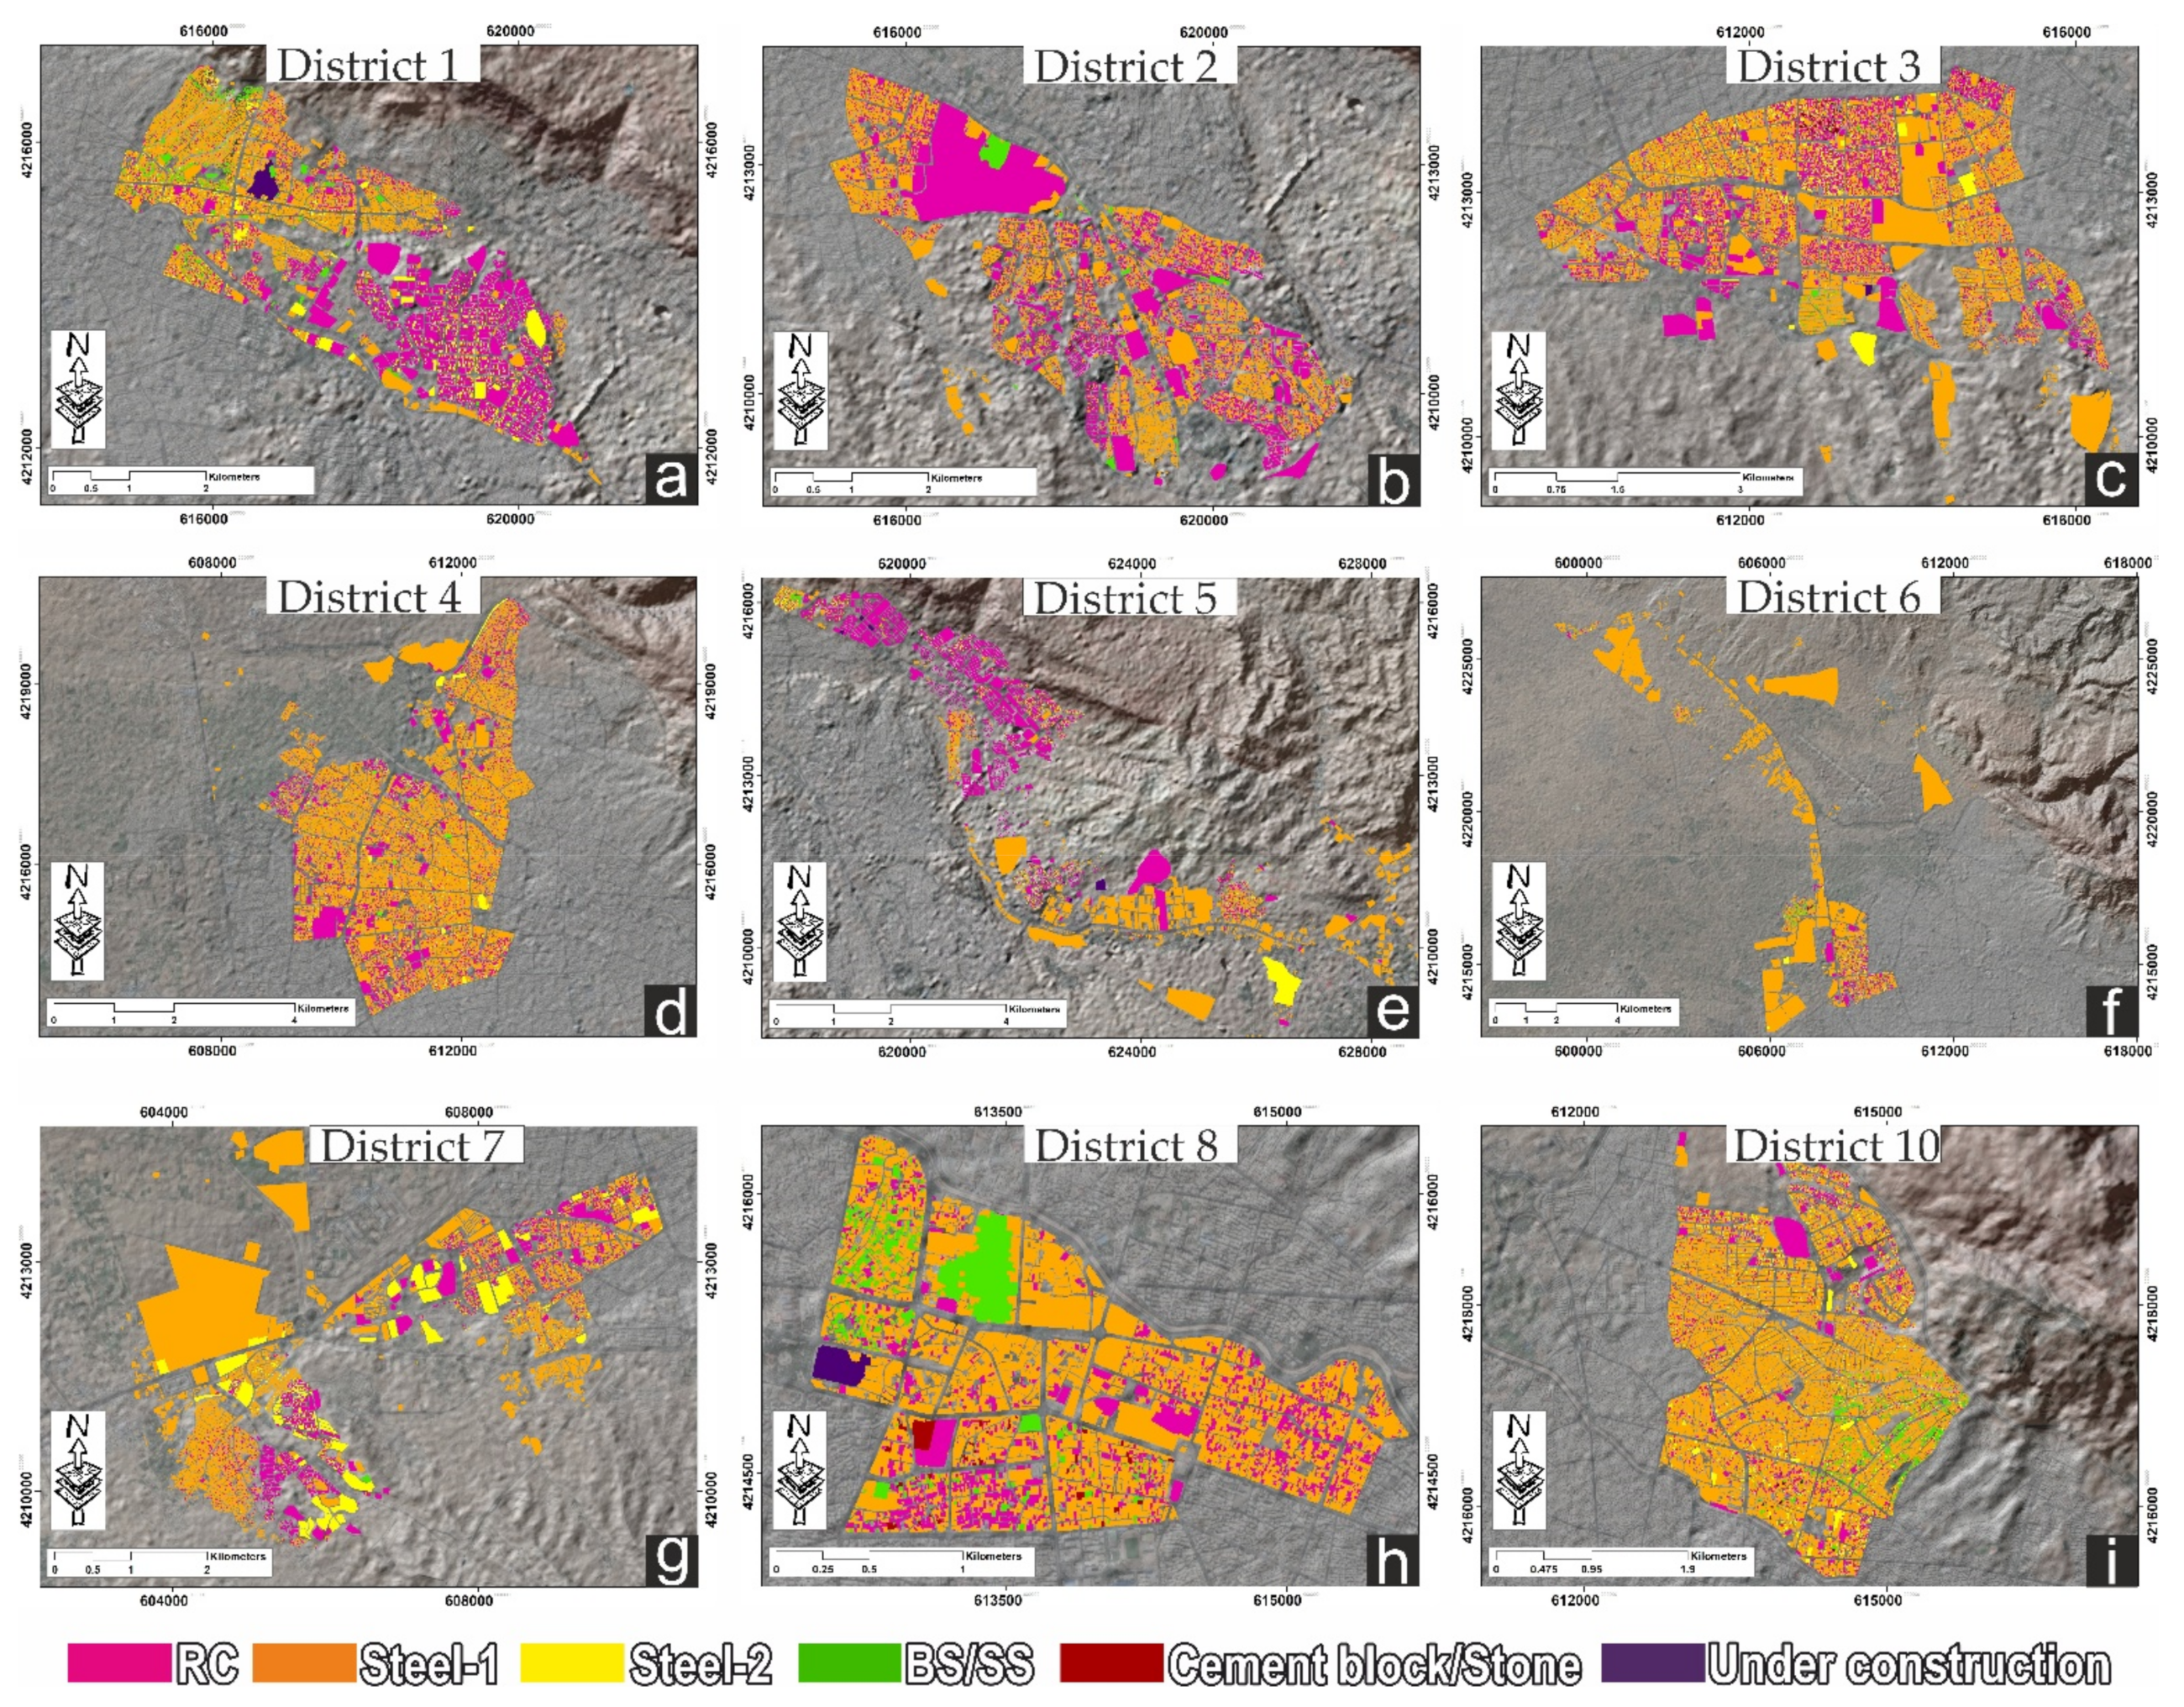
Figure 16 shows the distribution of different types of buildings in various districts of Tabriz. These are located in all of the regions, with the exception of District 9. As can be seen, District 5 (
Figure 16e) is in better condition than the other districts; most of the buildings in this district are made of concrete. This is because this is one of the affluent neighborhoods of Tabriz, and the buildings here are completely suitable and newly constructed. District 1 (
Figure 16a) of Tabriz has 42,230 structures. The majority of the structures in the eastern part are concrete, while in the western part most of the structures are type-1 steel. District 2 (
Figure 16b) of Tabriz, with 30,400 structures, has a better structural condition, and is improving this situation currently. District 3 (
Figure 16c) of Tabriz has the highest number of structures, with 16,351 concrete structures. District 4 (
Figure 16d) of Tabriz is in first place in terms of the number of structures, with 79,804. Of these, 67,627 are type-1 steel structures. Additionally, District 6 (
Figure 16e) of Tabriz is in a similar situation to District 4 of Tabriz, with most of the structures in this area being type-1 steel. District 7 (
Figure 16g) of Tabriz, because it has mostly been used for residential complexes, has type-1 steel structures. It is over 45 years old. District 8 (
Figure 16h) of Tabriz is a historical area with 22,097 structures, most of which are type-1 steel. District 10 (
Figure 16i) of Tabriz, with 46,257 structures, is one of the smallest areas, and is the most marginalized.
Figure 17 shows the altitude of Tabriz, especially in the suburbs. As shown, the buildings in these areas do not have enough strength, and create an unsuitable urban fabric. Three areas in the northwest of Districts 1 and 10, and the north of District 4 were organically and quickly filled by immigrants; the structures here are largely unacceptable.
3.2.2. Population Vulnerability Estimation
The consequences of accidents include mortality, injury, and damage to property, products, services and infrastructure. These cause impacts on lifestyles and social and psychological dimensions.
Three-quarters of the world’s population has experienced at least one of the four leading causes of death in recent decades. The number of people injured in the last two decades has risen to more than 1.5 million. A total of 1 in every 3000 people who are at risk are killed [
90,
91].
The most effective way to manage these crises is risk management. Risk management is a process that identifies the level of influence of a hazard in a community; this information is used to decide on measures to reduce the effects of hazards and deal with them. This process is conducted according to the benefits and costs of risk reduction.
The scenario presented in this report provides a basis for the estimation of the casualties caused by these earthquakes. The number of casualties could be effectively used in planning the preparation and adjustment of response operations in crises [
91].
In this study, the results of the fragility function presented by the JICA were used. In that report, the solution presented by Coburn et al. was used [
92].
The casualties of an earthquake occur due to various mechanisms, such as the collapse of buildings, car accidents, heart attacks, and others. Coburn et al. showed that, in most earthquakes, casualties are mainly caused by the collapse of buildings. This factor causes more than 75% of casualties. If we exclude secondary accidents following an earthquake, this figure could reach approximately 90%. The remaining 25% of the casualties are caused by non-structural factors or subsequent hazards [
92].
The rate of casualties in earthquakes that cause low or moderate damage to <5000 buildings is very variable. In these earthquakes, the number of people injured and killed due to non-structural and medical causes makes up a significant share of the total number of casualties. This is due to a combination of different factors, and is largely unpredictable. In more devastating earthquakes, which this study focuses on, the collapse of buildings or landslides account for the majority of deaths [
93]. According to JICA studies [
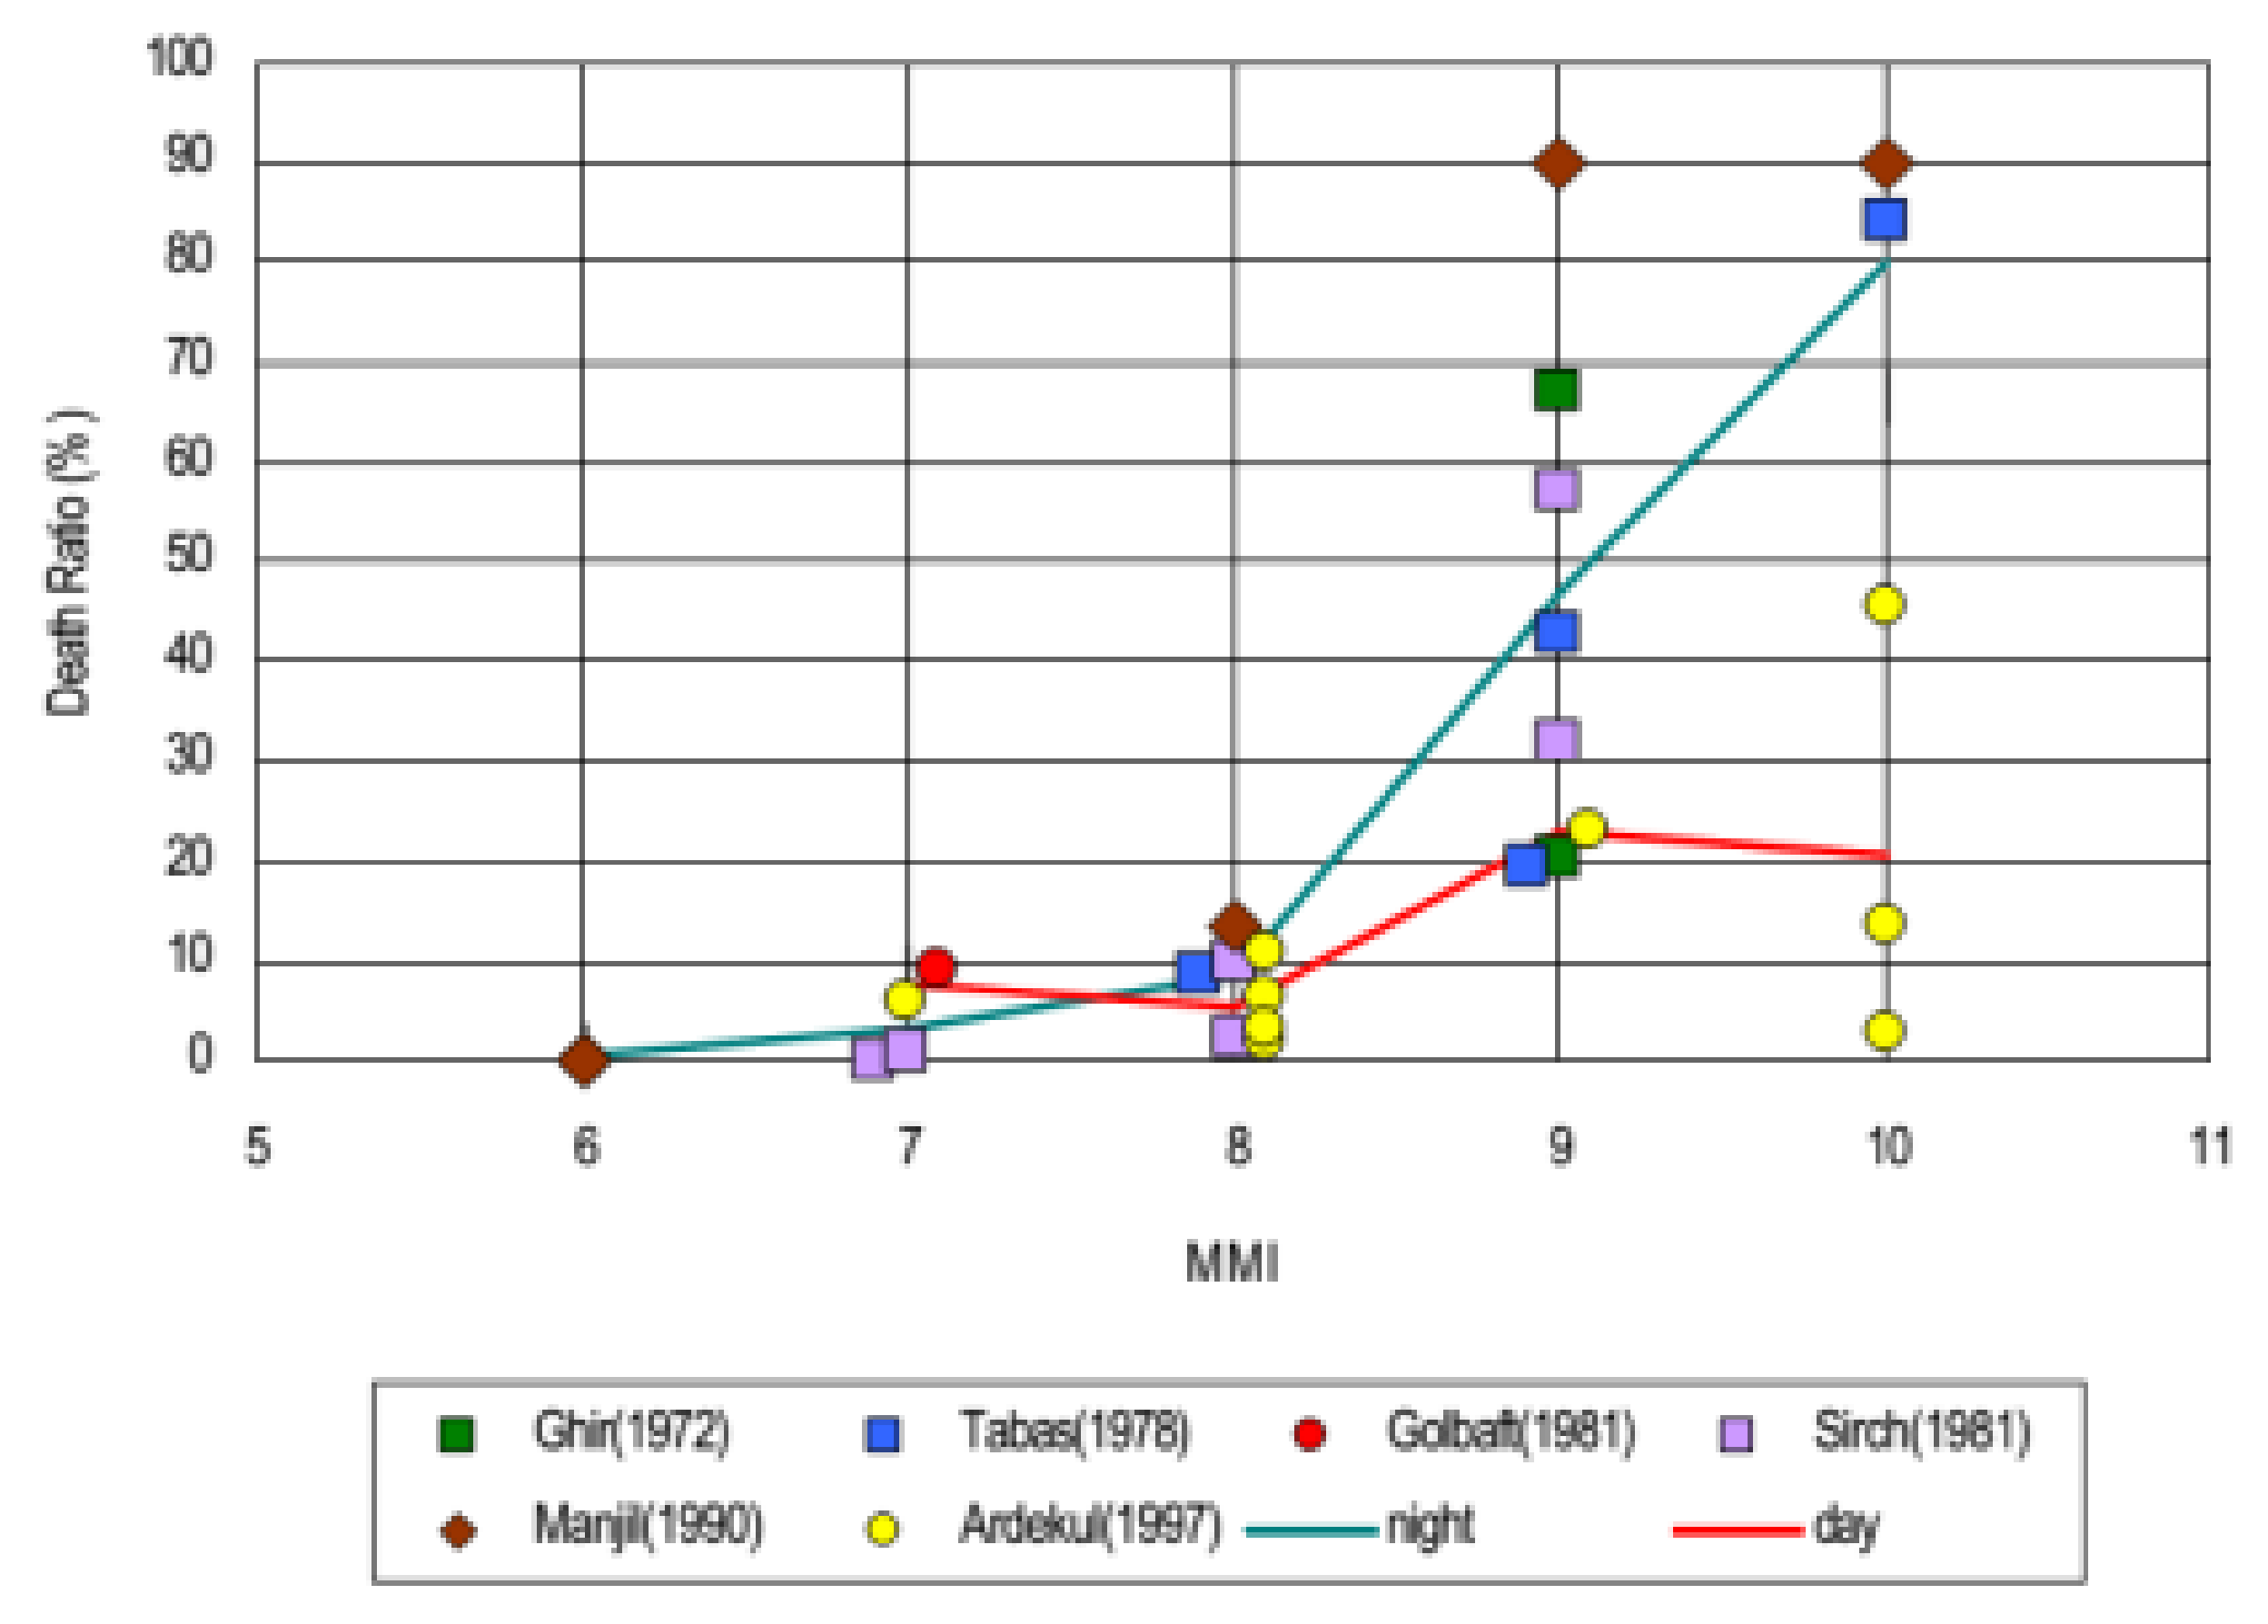
88] (
Figure 18), the coefficients are such that their relationship with the number of casualties holds for the past earthquakes in Iran. These studies also assume that the earthquake occurs at night, and that all residents are at home. Considering the diagrams below, it is interesting that the resulting losses are low (about ten percent) up to a magnitude of eight, and this value reaches 50% and 80% at magnitudes of 9 and 10. Another point is the difference between the loss numbers during the day and night. Casualties are much higher at night, when all of the occupants are indoors, than during the day, when the occupants are more likely to be outdoors or in the more resistant structures of work buildings, etc.
3.3. The Proportion of Casualties in Past Earthquakes in Iran
Considering the above items, as shown in
Figure 19, relief aid reduces the amplitude of the diagrams, and thus the proportion of casualties is reduced accordingly. Once the building classes and the number of individuals affected are identified, the probability of casualties (the number of deaths, hospitalized injured, and non-hospitalized population) can be considered, based on questionnaire surveys and reports of previous earthquakes. This is summarized in
Table 6. The human vulnerability function (Equation (5)) can then be found for the categories of the buildings and the number of people exposed to an injury level.
where H is the population vulnerability, BPi is the number of people in the buildings in each specific damaged zone, and PKi is the injury probability state (died, hospitalized injured, non-hospitalized, and not injured).
According to the statistics of 2015, the city of Tabriz is the most populous region in northwestern Iran [
31] and, according to the statistics published in the statistical yearbook of 2019, the population of Tabriz will see a growth rate of 1.1 percent, based on the statistical estimates of the Plan and Budget Organization [
94]. A statistical rate of population growth of 1.1% estimates that the population will be 1,842,904, of which the majority will live in District 4, with a population of 444,443, as shown in
Figure 19. District 10 also has a high density, with a population of 321,519, who are generally marginalized. The western area of District 1 also has a high density. District 9 is empty of inhabitants because it was constructed only recently. It can be concluded that areas with time-worn and marginal textures have higher population densities. In the south of Tabriz, in District 2, a certain small area also has a high density. This area is a village that has turned into an urban texture. It has a high population density, and demonstrates the direct relationship between marginalized areas and population density: wherever there is marginalization, a high population density can also be observed. The reported population is related to the neighborhoods of urban areas. In this study, using the building block data obtained, we matched the population of each neighborhood to the building blocks based on the average numbers of households, families, and floors, in order to obtain an estimation of the vulnerability of the population.
4. Results and Discussion
The model applied to the scenario of the two historical earthquakes in the city of Tabriz shows the affected area, while the level of destruction of the buildings shows the levels of day and night casualties for the entire city of Tabriz. These results allow decision-makers to plan what actions must be taken.
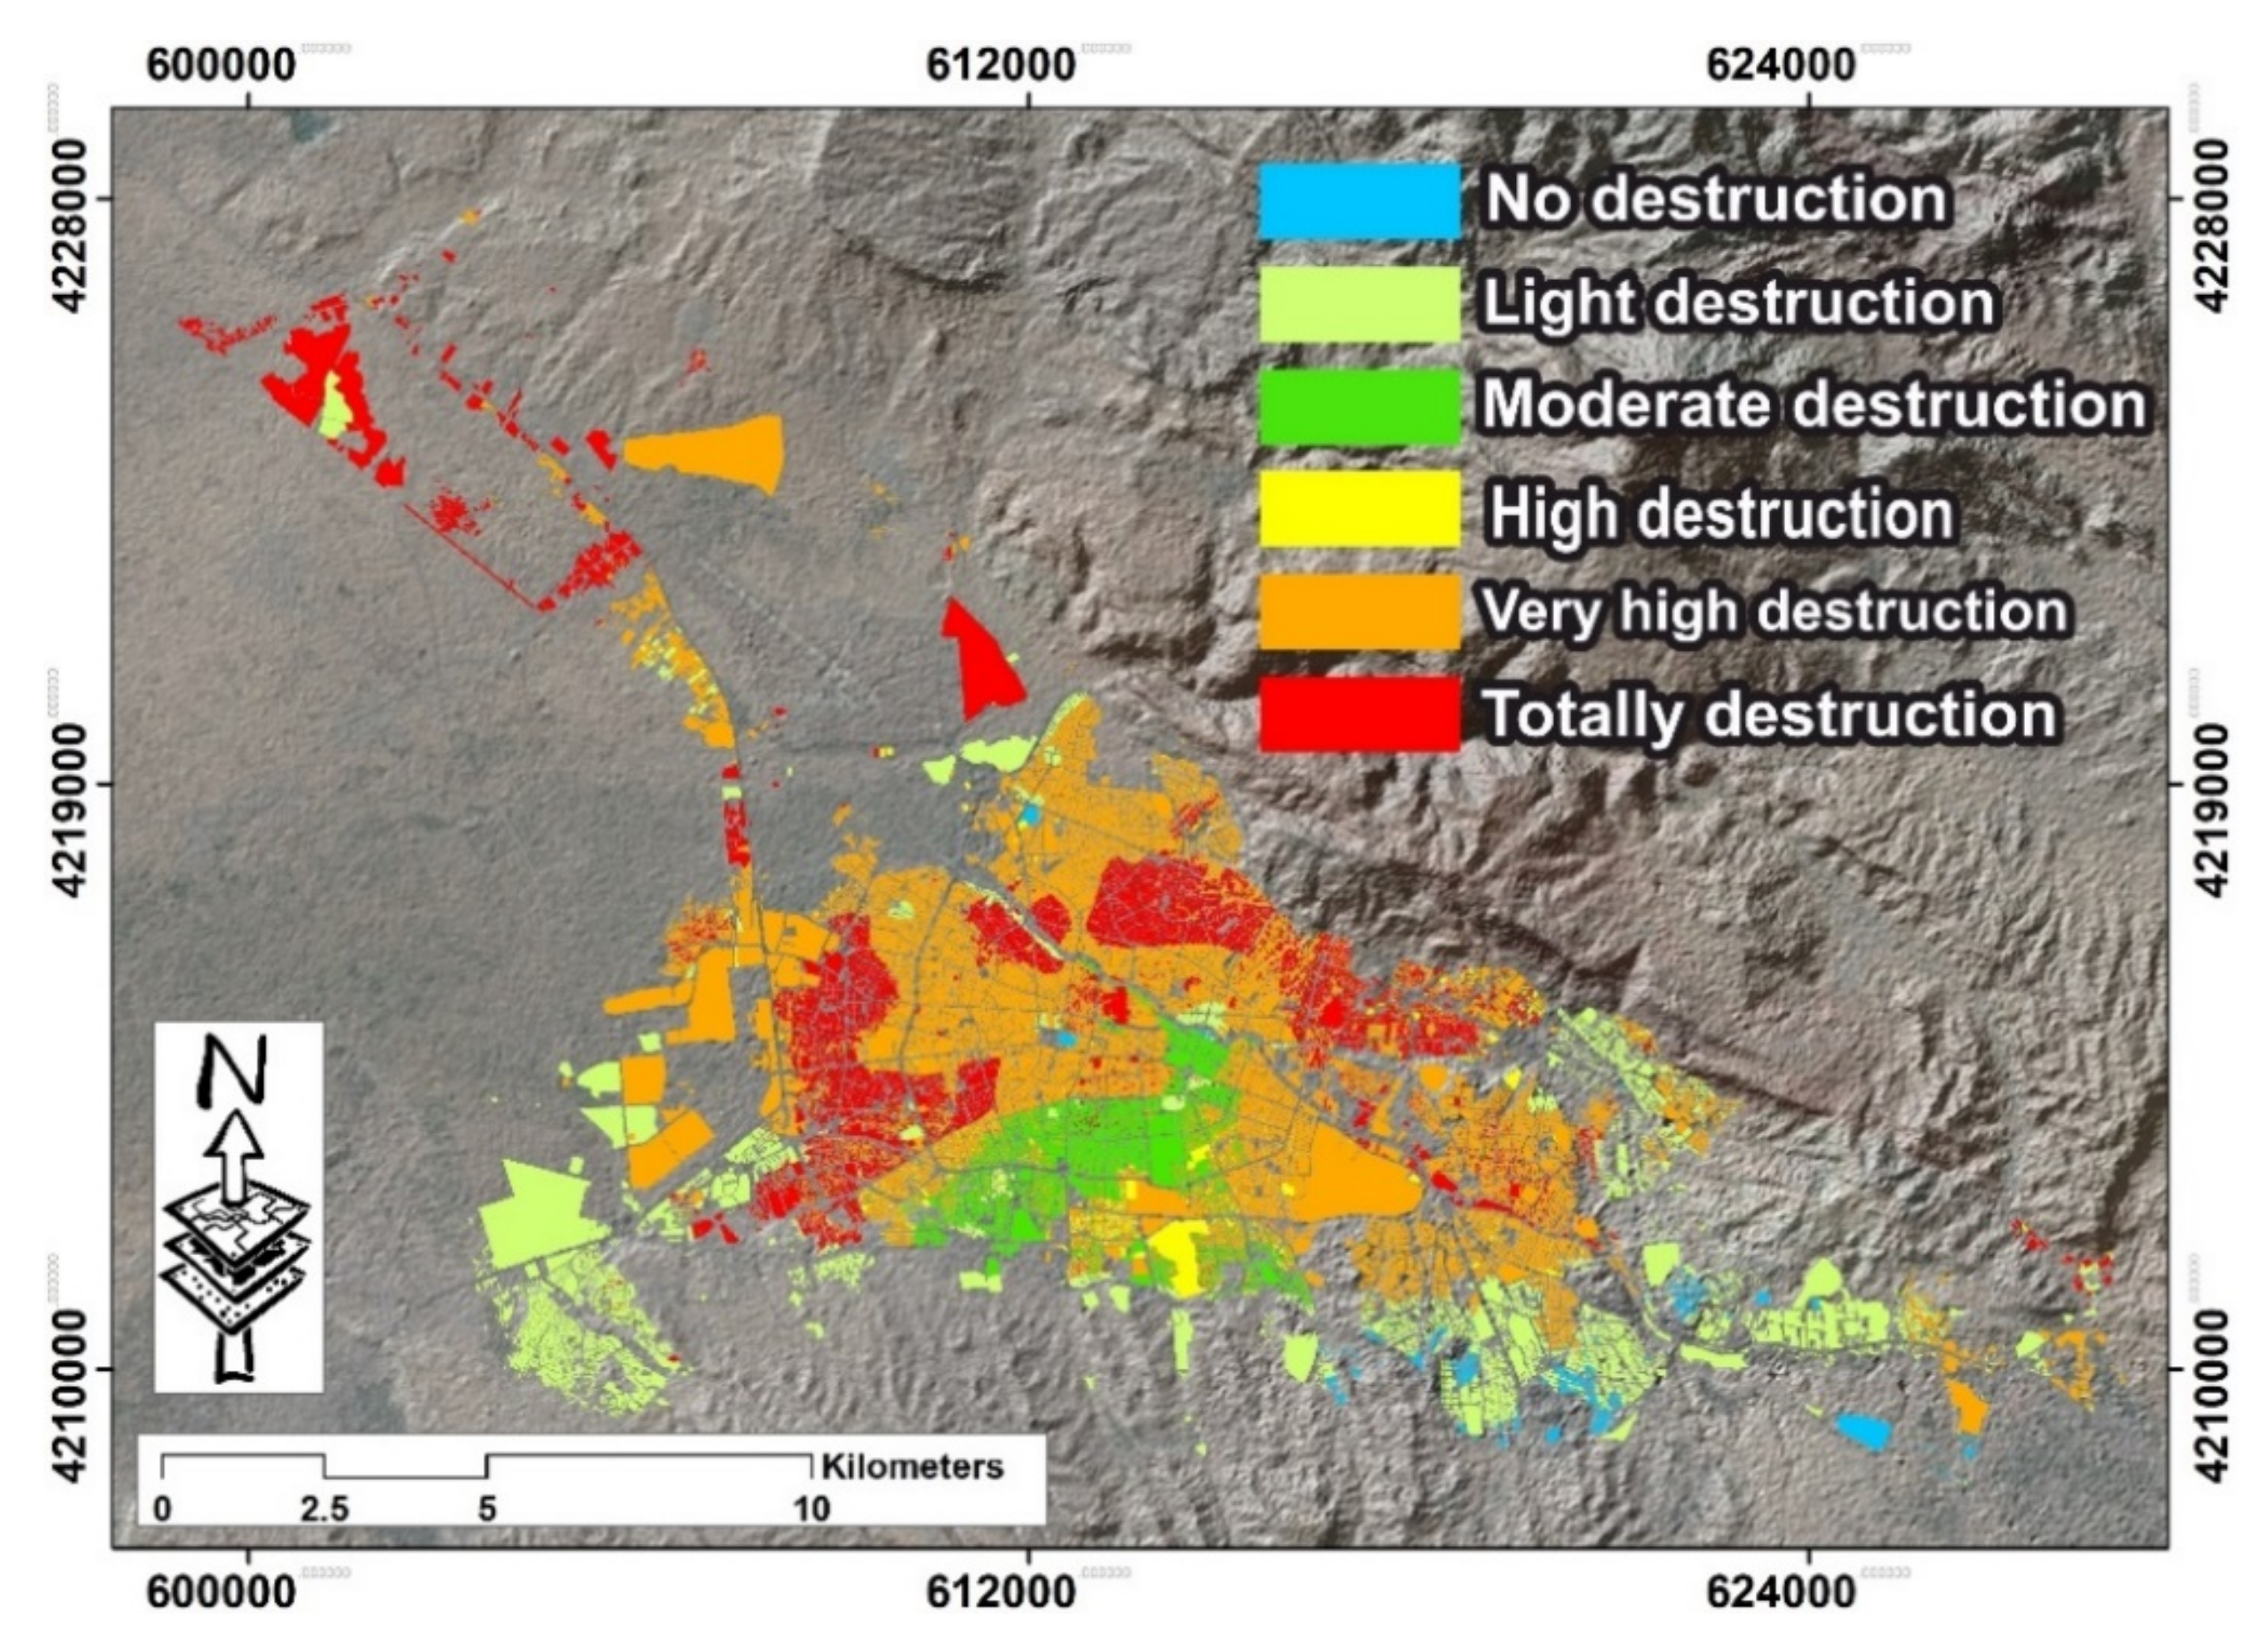
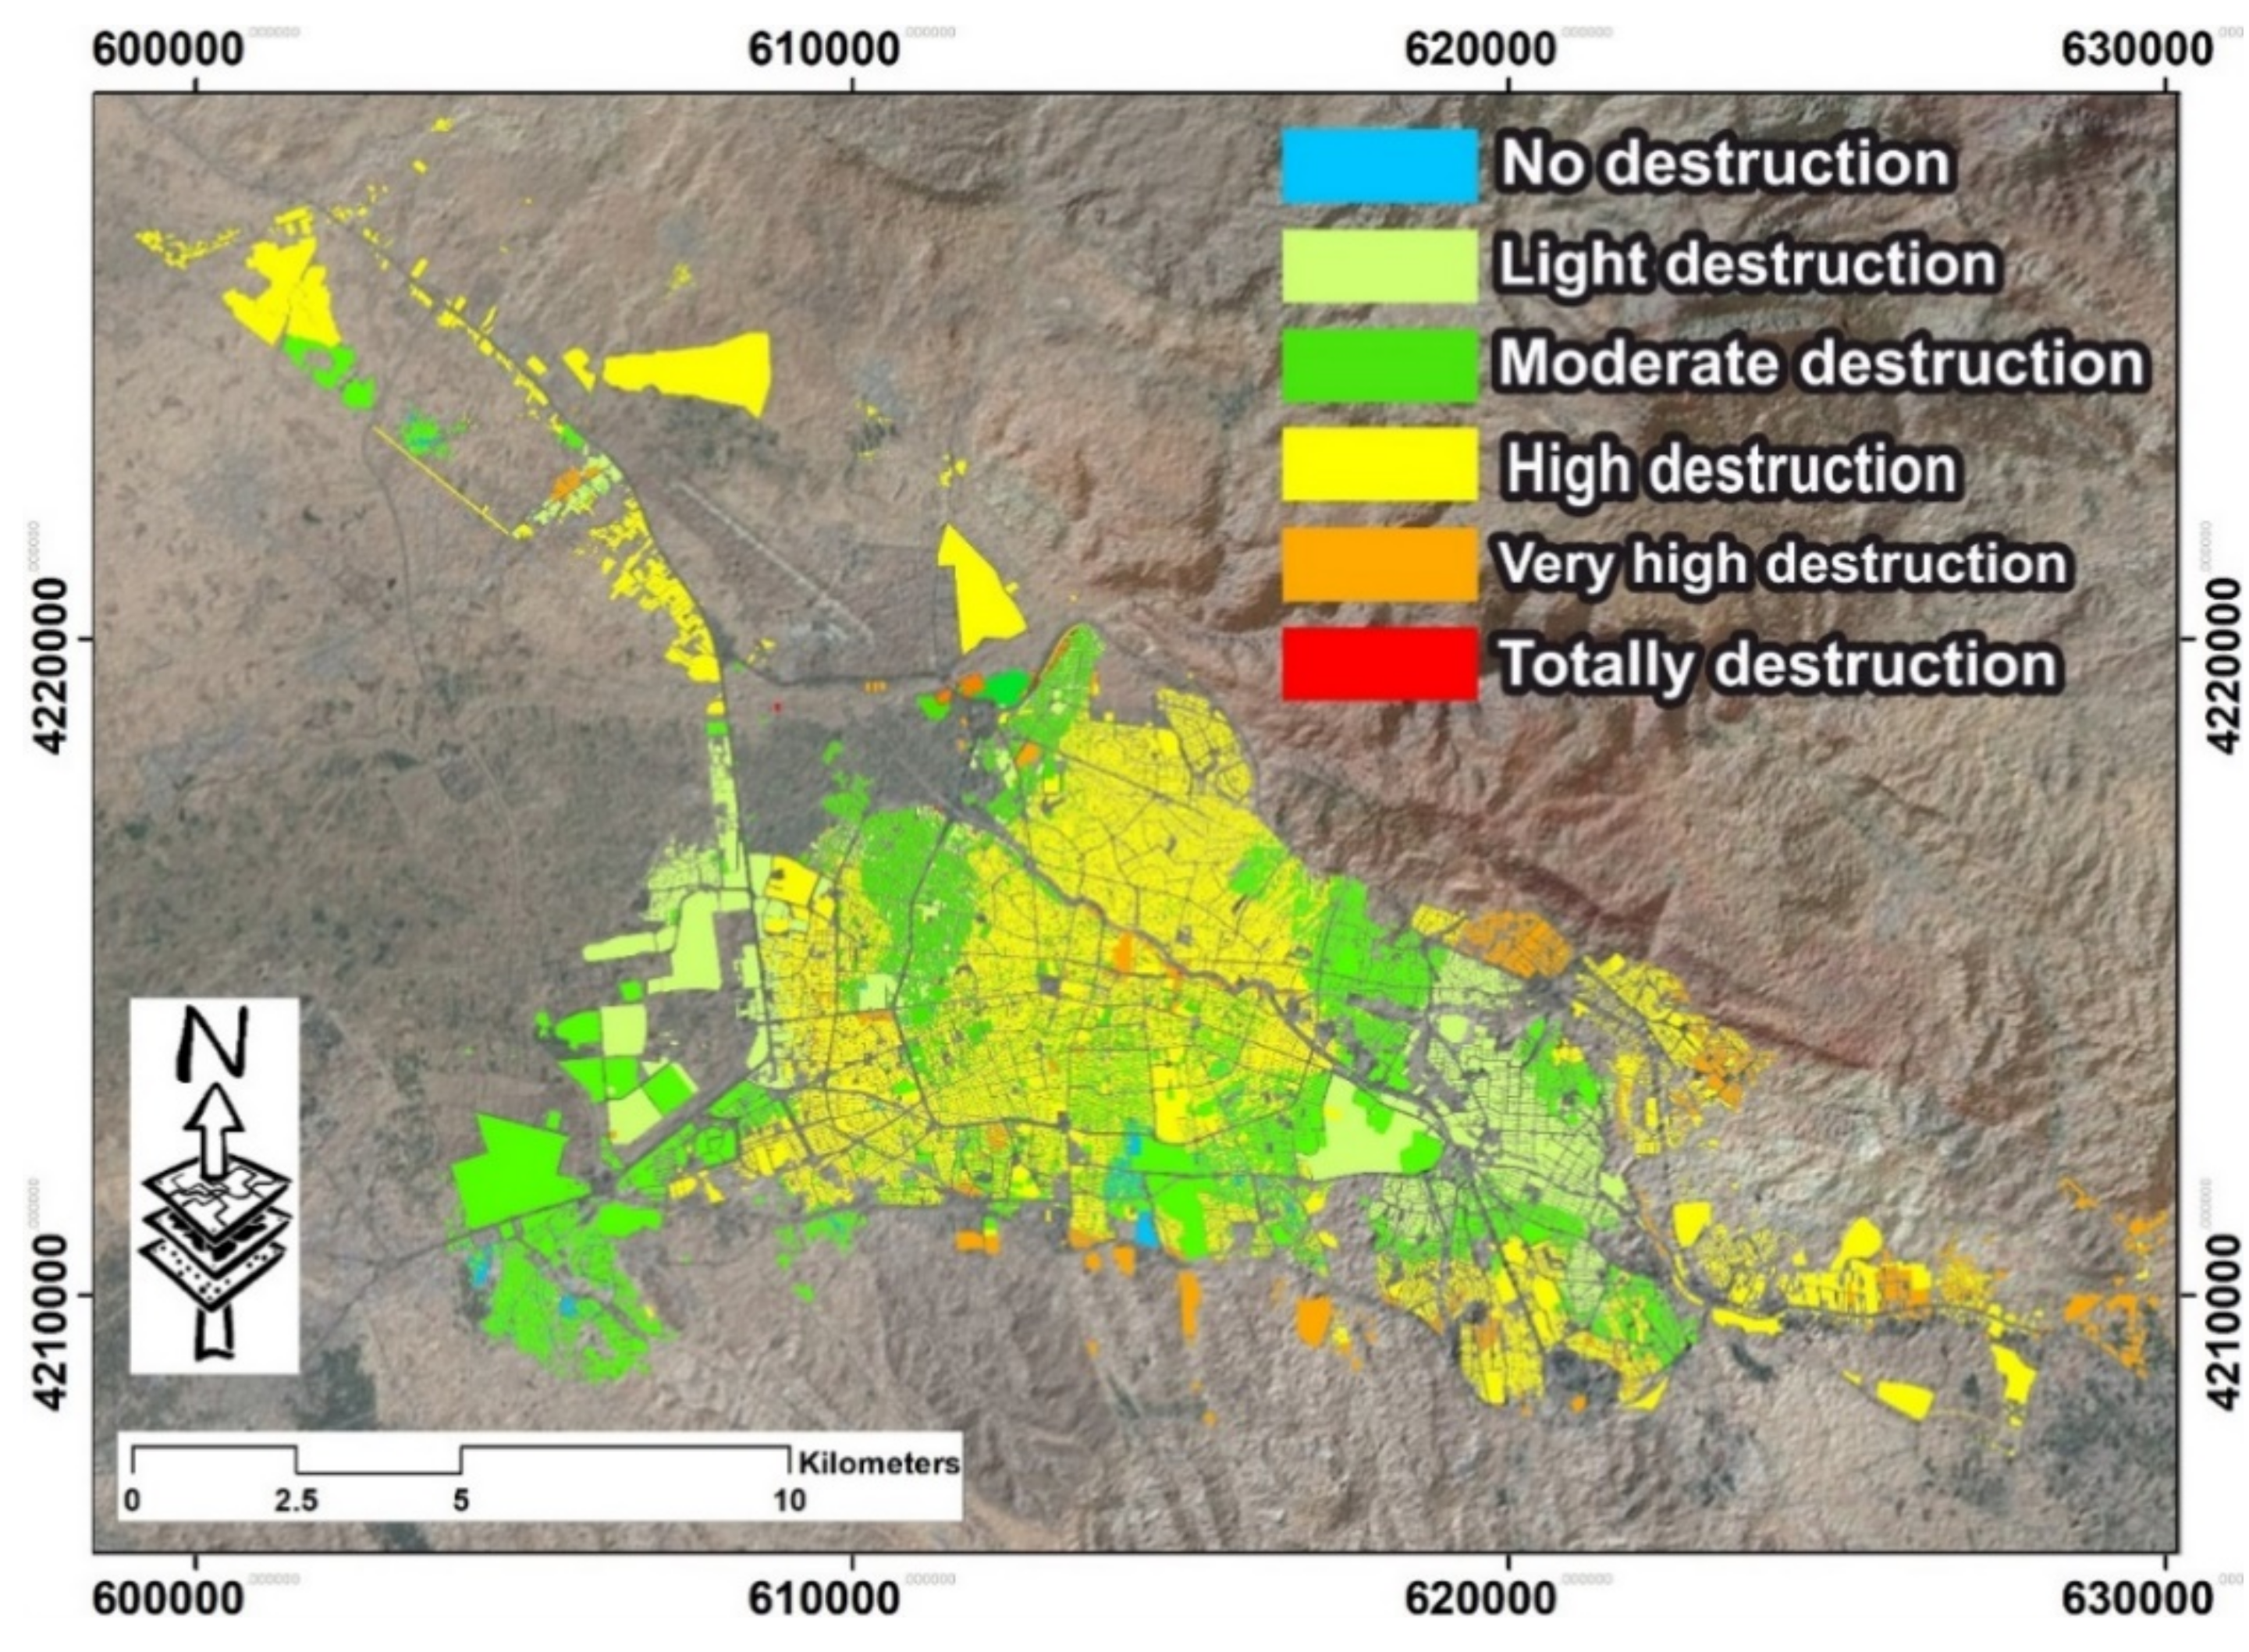
Figure 20, which illustrates the 1721 earthquake, shows that the northern part of Tabriz mostly has a high vulnerability to a modified Mercalli magnitude of 9 in the north and a magnitude of 5 in the south. As stated above, District 10 is not in a good condition, and is one of the most marginalized areas of Tabriz. District 1 is located in an area with a maximum intensity of 9, and it has a high level of vulnerability. According to the above, the eastern part of the district is in a better condition in terms of its structures and population, but the western part is in an unfavorable situation. District 9 of Tabriz is uninhabited, and has only a small number of buildings, so it was ignored in this study. Districts 2 and 3 are in good condition, and, as we go up, the vulnerability rate increases. The reasons for this are the conditions of both the sites and structures in these areas, which are generally old structures with low strength.
According to
Figure 21, an intensity of 5 to 8 was obtained in the 1780 earthquake. The Modified Mercalli Intensity of 8 is generally observed in Districts 1 and 5. Other districts are in better condition. Districts 2 and 3 are better than the others in terms of their vulnerability. In general, the intensity decreases from the center and northeast to the south and northwest. The lowest intensity can be found in District 5.
4.1. Estimation of the Structural Vulnerability to the Tabriz Earthquake in 1721 with a Magnitude of 7.3 Richter
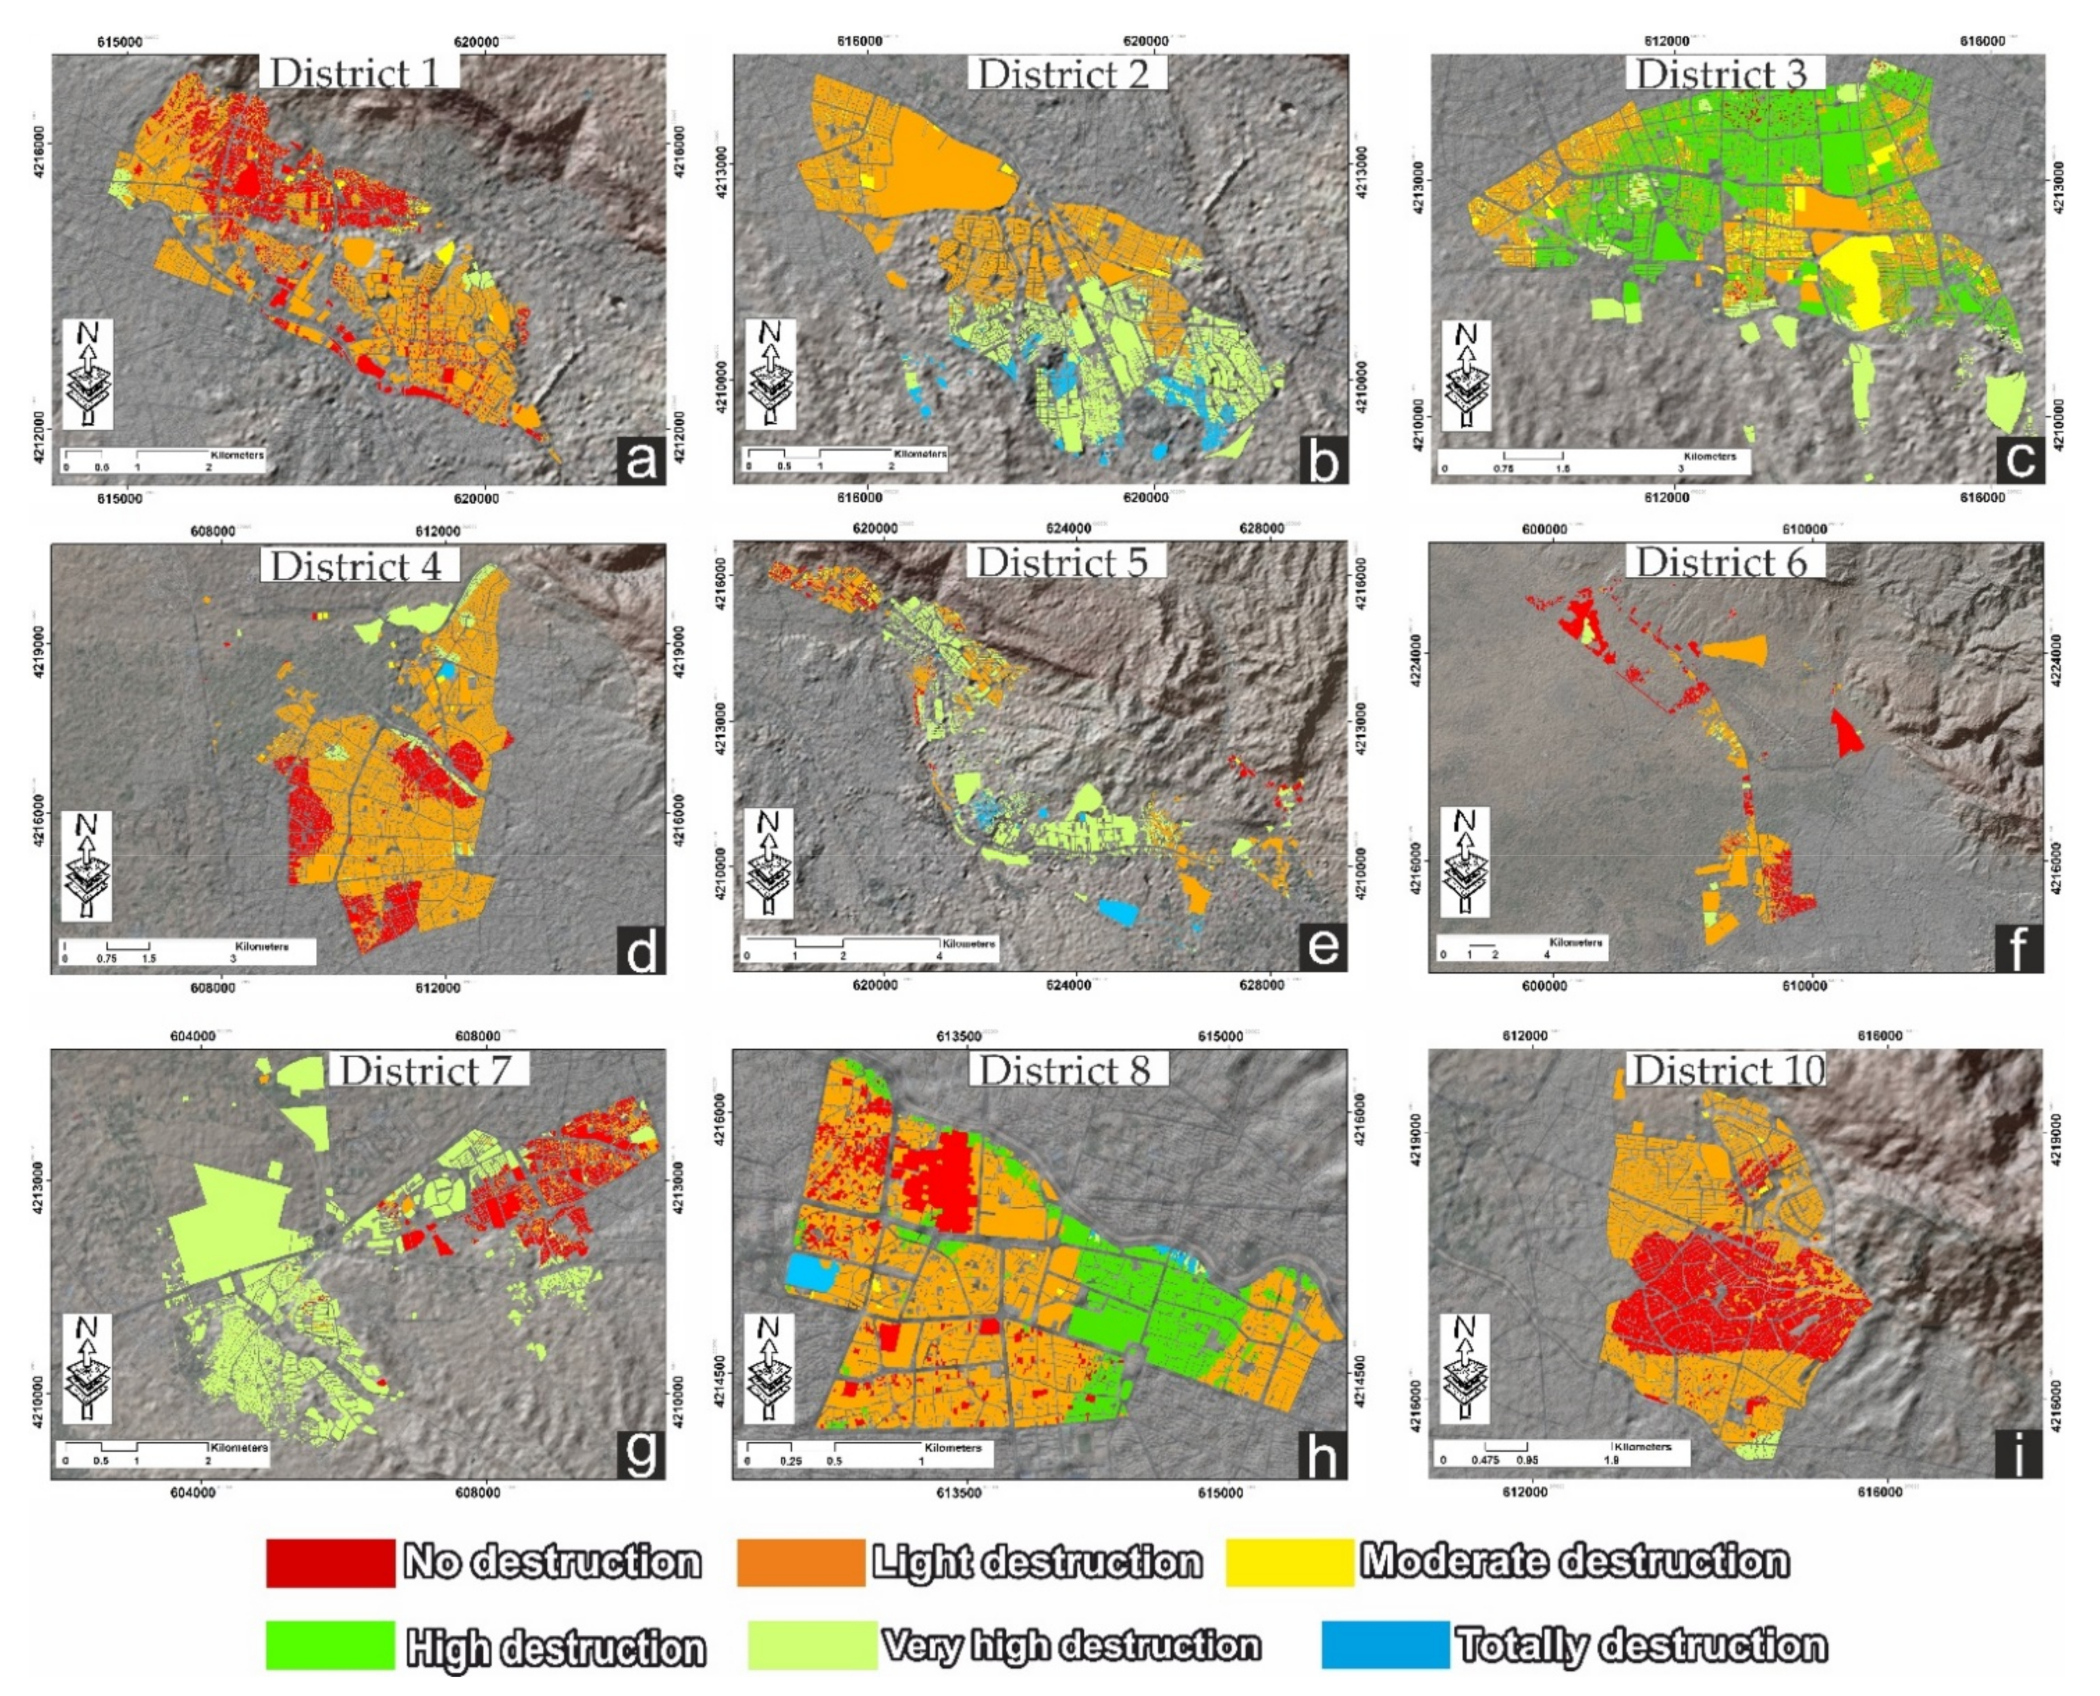
Figure 22 indicates the damage caused to buildings based on the earthquake scenario in the west of Tabriz. As shown in
Figure 22, the southern part of Tabriz has a low destruction rate, the main reason for this being the presence of the foothills of Sahand Mountain and the existing natural conditions—i.e., strong bedrock—as well as other factors influencing its vulnerability. The southeast of Tabriz is generally a very suitable area, both ecologically and tectonically, and the buildings located in this area are generally engineered strong buildings. This area of the city is generally highly developed, but the neighboring areas are still being developed due to the conditions mentioned. These are some of the most dynamic urban areas in Tabriz. The south of Tabriz includes District 2, which is the most developed and dynamic area of Tabriz. This area is located in the south of Tabriz, and has structures of acceptable quality. This district is the most developed area of Tabriz after District 1, and it is the second district in terms of its many floors. Only a small part of this district has unsuitable urban textures, which is the region that was transformed from a rural area to an urban area only recently, and which is currently under construction to improve its conditions [
33]. District 3 is a very wide area that includes three types of textures: old textures, new and engineered textures, and marginal textures. It includes the areas of Maralan and Imamiyeh. Under these conditions, the texture becomes older as you move from the south of the district to the north. However, extensive renovation has been carried out in this area. As we travel towards the south, although the tectonic conditions become better, the buildings can be seen to be increasingly unacceptable in terms of urban planning. This has caused a great deal of damage to these buildings, and in general, the center of District 3 in Tabriz is in a more favorable condition due to the renovations that have been performed.
District 10 is a suburban area where unprincipled construction is generally dominant, with masonry walls and poor access ways. There are very unfavorable conditions in this district. Generally, this district was developed by suburban inhabitants, and it is considered to be the most marginalized region of Tabriz. The structures are in unfavorable conditions, the access ways are unpromising, and the education quality here is low. The inhabitants of this region generally migrated from the villages of East Azerbaijan and settled in these areas, causing its very high density.
District 1 (
Figure 23a), with the highest number of unsuitable structures, was damaged at a rate of 81–100%. According to our field visits, it was observed that all of the structures in this area were of very low quality, and were expected to have unsuitable conditions during earthquakes. It should be noted that the western part of District 1 is in a poor condition. However, the eastern part of this district is in a better condition. As expected, the most favorable building conditions could be seen in District 2 (
Figure 23b), which has suitable, high-strength structures for dealing with an earthquake scenario. District 7 (
Figure 23g) is important, as it is in a good condition due to both its natural conditions and durable, suitable buildings. The residential complexes of this area are typically durable and newly constructed, and show a good performance. This area generally has suitable structures. It was originally a rural area that evolved into an urban one. It was able to quickly adapt to urbanization, and now features numerous residential complexes. Some marginalized areas still exist there, but the buildings have been somewhat rehabilitated [
33]. District 8 of Tabriz has an old texture and encompasses the Tabriz bazaar, which hosts a large population who come to buy from the bazaar. The existence of a market or bazaar doubled the importance of this area in terms of vulnerability. There are many important buildings in this area that are recognized globally (as a world hertitage), including the Grand Bazaar of Tabriz; the Blue Mosque, most of which was destroyed by a serious historical earthquake in Tabriz; and the Arg Alishah, which is a remnant of the historical period of Iran. Additionally, there are many museums in this district. Despite its small population, this area is very important due to the existence of historical sites, necessitating appropriate measures to be taken to protect them from destruction. These valuable buildings form a large part of the identity of the city [
33]. This area of Tabriz is being renovated very slowly, and the relief process would be very difficult if an earthquake were to occur. In District 8 (
Figure 23h) of Tabriz, a large number of structures were destroyed, with the main reason for this being the natural conditions and, most importantly, high numbers of old structures in this area.
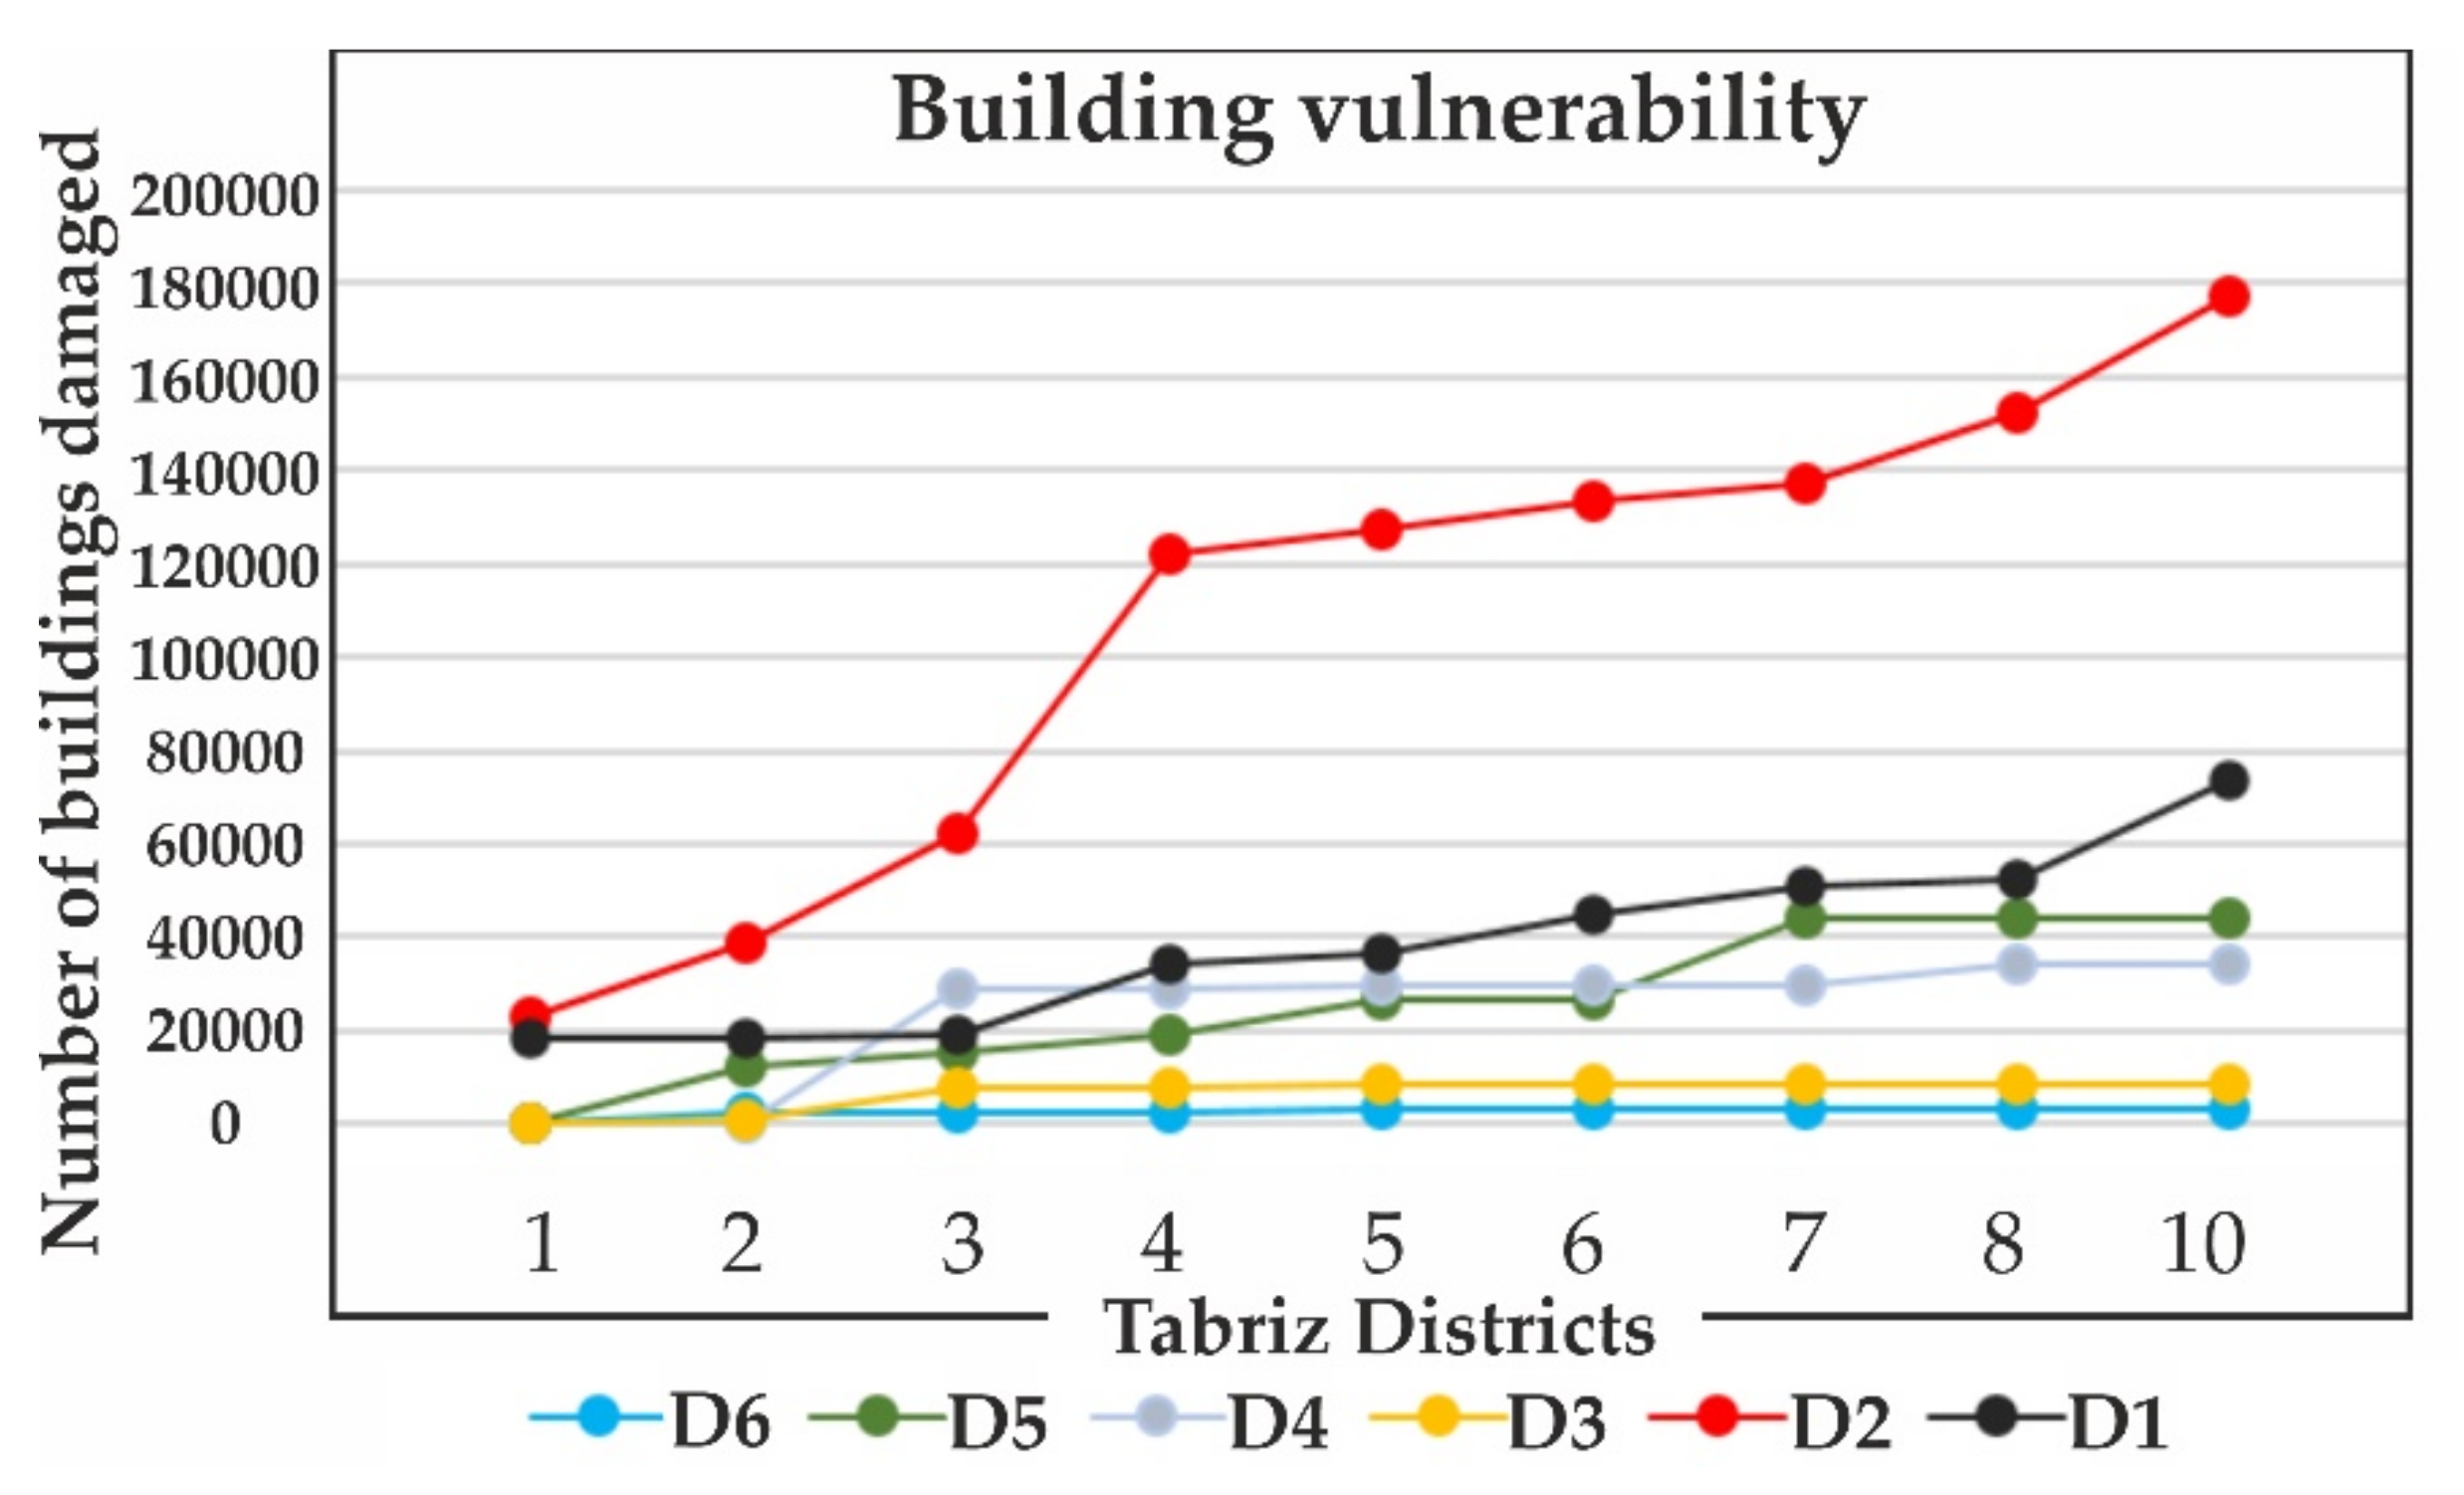
Figure 24 and
Figure 25, and
Table 7, indicate the structural destruction status in different districts of Tabriz. For example, District 4 (
Figure 23d) has unfavorable conditions. We found a 60–80% destruction rate for 60,205 buildings. These values are very high compared to those for the other areas. In this district, these are typical buildings that are old, with weak structures, meaning that they could not resist the earthquakes.
As can be seen in
Figure 25 (area B), District 1 has two different textures. In the east, a completely standard texture is observed, with new buildings and large houses. The inhabitants of this area are generally rich. However, the more distance we travel from the east to the west, the more suburban textures we can observe. This area has a completely non-standard urban fabric. The access here is highly unsuitable, and the structures are completely non-standard and made of low-quality materials. Despite being close to rich neighborhoods, poor inhabitants reside in this area who are not economically capable of improving the conditions of their structures. As can be seen in
Figure 25 (area A), the buildings west of District 1 are generally suitable and strong buildings; in contrast, in the marginal area, the buildings are generally unsuitable. Thus, this area contains two completely separate and unequal regions. Faced with the 1721 earthquake, the eastern part has a high resistance, access to aid, and better access ways, while the western part has inadequate access to aid and is more likely to face serious problems.
4.2. Estimation of the Structural Vulnerability to the Tabriz Earthquake in 1780 with a Magnitude of 7.4 Richter
As can be seen in
Figure 26 and
Figure 27, and
Table 8, in the southeast of Tabriz the earthquake induces the lowest amount of damage compared to the 1721 earthquake. Accordingly, the highest amount of damage is likely to occur in the east of Tabriz, which would be closer to the center of the earthquake. Districts 1, 2, and 5 would be exposed to the highest magnitude of the earthquake, but due to the high quality of the structures in these areas and the suitable natural conditions, they would have a low rate of destruction. The highest level of destruction is 31–60% for Districts 10, 3, and 4, which would experience a higher level of destruction than the others. In general, District 6 has a lower destruction rate than the other regions due to its distance from the epicenter. According to field visits, it was observed that the main factor causing District 6 to be safe from damage is its distance from the epicenter. Therefore, a less severe earthquake would hit this area, meaning that it would be in better condition. Although District 10 is also far from the epicenter, it would suffer a D3 destruction level due to the existence of time-worn buildings in the suburban area.
4.3. Estimation of the Human Casualties of the 1721 Earthquake in Tabriz, with a Magnitude of 7.3
Table 9,
Table 10,
Table 11,
Table 12,
Table 13,
Table 14,
Table 15,
Table 16,
Table 17 and
Table 18 shows the number of casualties in the city of Tabriz after the 1721 earthquake. As can be seen, the death rate would be 22,280 at night. According to
Table 10,
Table 13,
Table 15, and
Table 18, a large number of these casualties would come from Districts 1, 4, 6, and 10, which accommodate most of the population and have largely unsuitable structures. A total of 802,087 people would remain healthy and not be injured; most of these people would be residents of Districts 2 and 3, which, as can be seen from
Table 9 and
Table 17, have suitable structures. Districts 4, 3, and 10, due to their high population, would have high rates of casualties. District 4 would have the highest mortality rate. The inappropriate structures, old textures, and poor access ways in this area make it a primary target for improvements to crisis management. District 3 is generally a suitable area, and is close to areas with an old texture, meaning that it will have a higher mortality rate according to
Figure 27. This necessitates the creation of a comprehensive plan to renovate this area. The south of Tabriz, due to its large areas of open space, could be a good area in which to establish relief bases. The existence of several large parks, as well as large amounts of unused land in the south of District 3, makes this area a much more suitable place than District 4 for carrying out relief operations. District 10 would experience serious effects in an emergency due to the compact texture of its completely un-engineered structures and large population. Therefore, this area is in a completely unfavorable condition, and will face serious problems in providing aid. Due to the small width of the passageways in this area, it will require aid from the air. Despite its low mortality rate, District 8 needs proper planning for aid due to its old fabric, poor access ways, and small number of street ways.
The important point about District 8 is that it is generally a commercial area and, at night, is generally empty of inhabitants. However, in the morning a large number of people from different parts of Tabriz, and even other cities, come to this area to shop or for other reasons. Tabriz Bazaar is located in this area, and it hosts a large number of people every day. Therefore, in the event of an earthquake in the morning, the area will face extensive life and financial losses. Sending aid to this area through mechanized means will be virtually impossible. Because Tabriz Bazaar is a covered area, in addition to the historical significance of the region, the need for saving people doubles the importance of this area, meaning that a proper plan is required for crisis management.
4.4. Estimation of the Human Casualties of the 1780 Earthquake in Tabriz, with a Magnitude of 7.4
Table 19 shows the proportion of casualties in Tabriz. There would be fewer casualties caused by the 1780 earthquake than the number caused by the earthquake that occurred in 1721. As previously mentioned, the distance of the fault from the site and the conditions of the areas close to the epicenter indicate the good conditions of the city. Less than ten percent of Tabriz’s population would be affected by this earthquake. However, according to
Table 19,
Table 20,
Table 21,
Table 22,
Table 23,
Table 24,
Table 25,
Table 26,
Table 27 and
Table 28, District 1, which would experience 364 deaths in an earthquake taking place at night, would have the highest death rate among all of the districts, followed by District 4, with 283 deaths.


