1. Introduction
As a geographic product, a city is characterized by various social activities and material resources. Continuous developments encourage cities to undergo changes in their structure and function; these changes gradually form different functional regions, including commercial, residential, and industrial regions [
1]. The accurate and timely identification and analysis of urban functional areas and structures are essential to measure the status of urban development and support the planning and management of cities accurately. The traditional method for identifying and dividing urban functional areas involves field research, which requires considerable human and material resources and time. Moreover, the reliability and comprehensiveness of the data obtained cannot meet requirements and are easily influenced by human factors [
2]. These issues render the accurate quantification or reasonable identification of the nature of urban land use and functional areas, especially the dynamic use of urban functional areas, quite challenging.
Many scholars in China and elsewhere have used multi-source data to explore the spatial distributions of cities and delineate the boundaries of functional areas. For example, using crowd-sourced data, Crooks et al. [
3] analyzed urban spatial function information to capture the evolving nature of urban form and function. Wu et al. [
4] used taxi data to count the number of ODs in various plots at different periods and proposed different functional area index factors and calculation methods based on OD characteristics; the authors also conducted a functional area identification analysis of their study area. Shan et al. [
5,
6] used kernel density analysis and the local Getis-OrdGi* index method in combination with a geographically weighted regression and spatial measurement model to explore the distribution patterns of urban facilities on the basis of geographic big data. Xue et al. [
7] introduced the current economic structures of various cities in detail and discussed the spatial characteristics of these cities from an industrial perspective by using POI data. Gao et al. [
8] developed a statistical framework to help discover semantically meaningful topics and functional regions based on the co-occurrence patterns of POI types; this strategy realized the supplement of social perception view of urban space based on human activities. Using crawling POI data, Gil et al. [
9] identified trends in the distribution of POIs in three urban centers in Seoul and explored the attractiveness of different tourist destinations to visitors.
The above research focuses on the identification and analysis of the overall functional structure of cities. The factors driving individual industries or special regions in cities have also become a research focus for many scholars. For example, Yao et al. [
10] used 20 million gourmet consumption data records collected from 31 provincial capitals in mainland China to calculate the sugar consumption in urban areas, understand the spatial distribution of sugar consumption in the modern Chinese diet, and identify the related factors. Gao et al. [
11] used kernel density estimation and buffer analysis to characterize the spatial agglomeration state and regional focus of the retail industry in Xi’an. Here, the spatial clustering relationships among retail industries were explored by using bivariate spatial autocorrelation and nearest-neighbor analysis. Using spatial point-level data for nine types of urban public service facilities in Beijing, Zhan et al. [
12] employed the cumulative opportunity method to measure the accessibility of urban public service facilities in Beijing and then further analyzed the mixed functions and influencing factors of urban public service facilities. María Henar Salas-Olmedo et al. [
13] extracted the digital footprint of tourists in Madrid, Spain, by using cluster and spatial autocorrelation analyses based on three data sources—namely, Panoramio, Foursquare, and Twitter; the group then compared the results of these three data sources to analyze their individual accuracy.
The above studies generally discuss the spatial structures and driving factors of a given city as a whole or explore facility elements individually. However, the identification and analysis of urban functional areas from multiple angles remain necessary to explore the dynamic use of urban functional areas at a finer scale.
Big data are widely used in various industries and fields to promote the progress and development of society. Some examples of big data include Weibo check-in data, Tencent location data, and point of interest (POI) data. POI data record the spatial and attribute information of geographical entities, including their names, categories, addresses, and coordinates. Using POI data, we can reliably identify the type of urban land and analyze the functional structures of a city [
14]. Tencent location data are based on Tencent’s global coverage and high-precision positioning data, which feature the advantages of a large number of users, high spatial-temporal resolution, and close association with daily life. Thus, big data are widely used in studies of inter-city population flows, urban spatial connection modes, and population distributions [
15,
16].
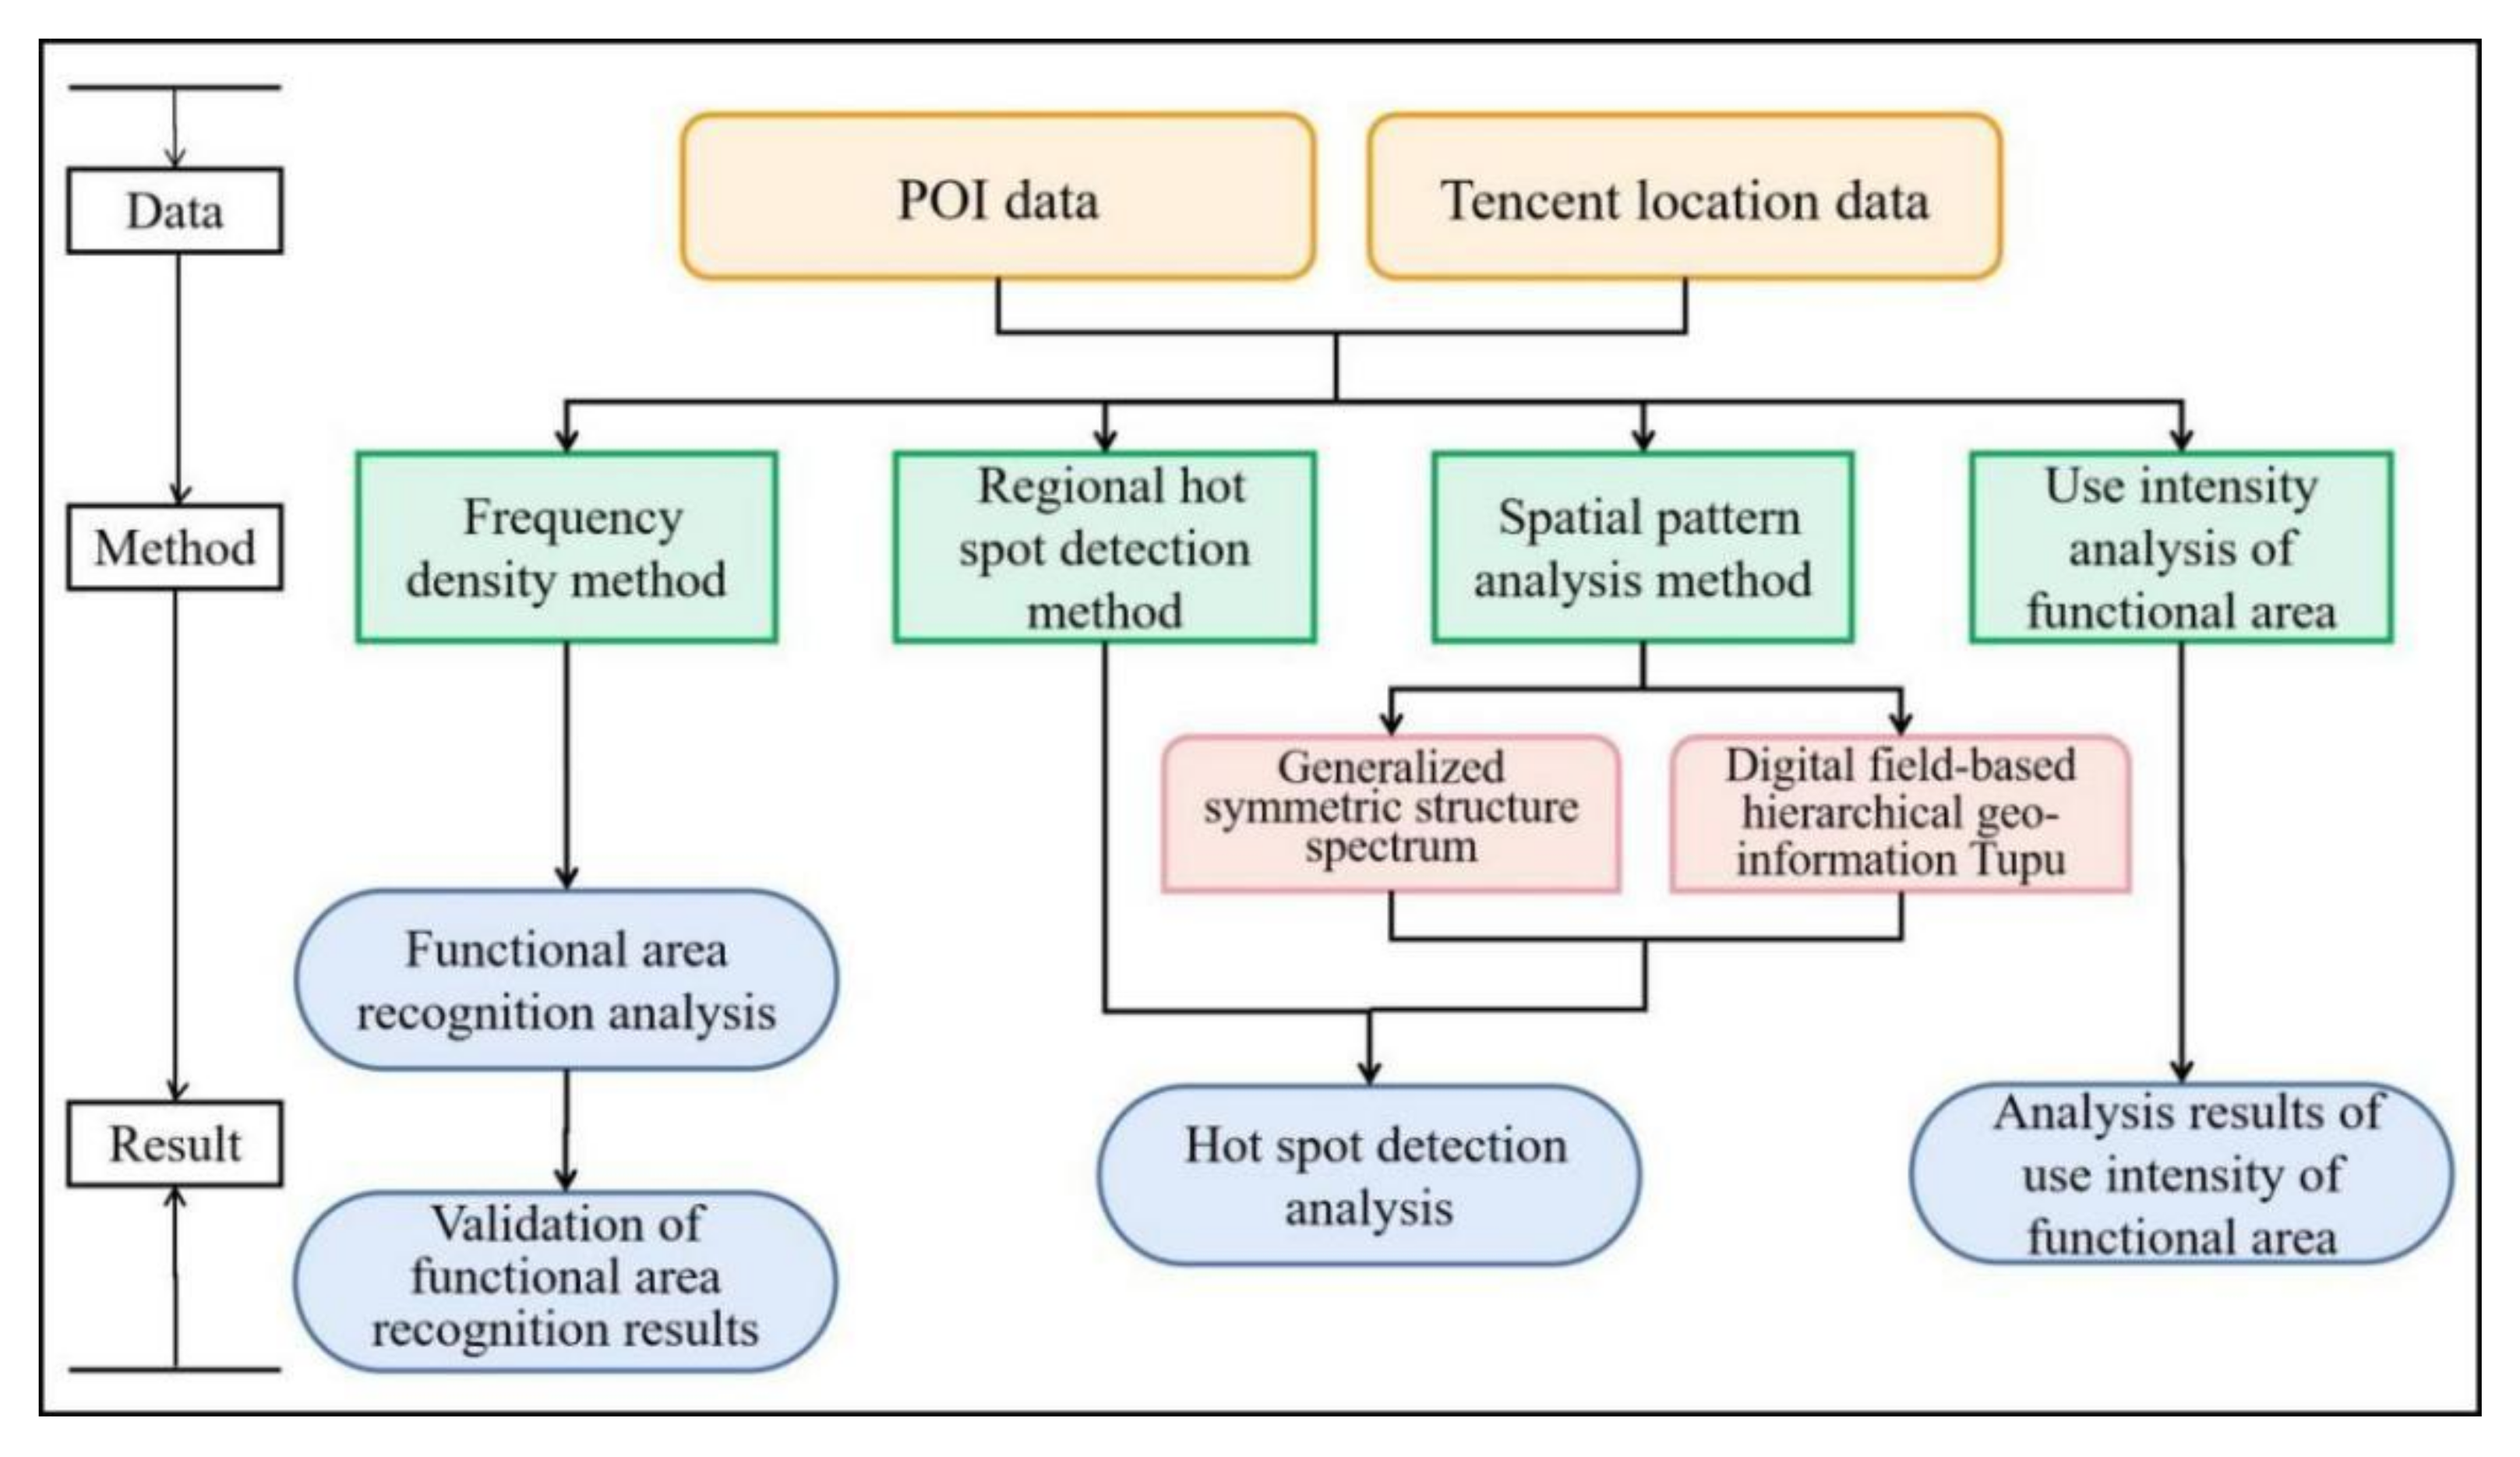
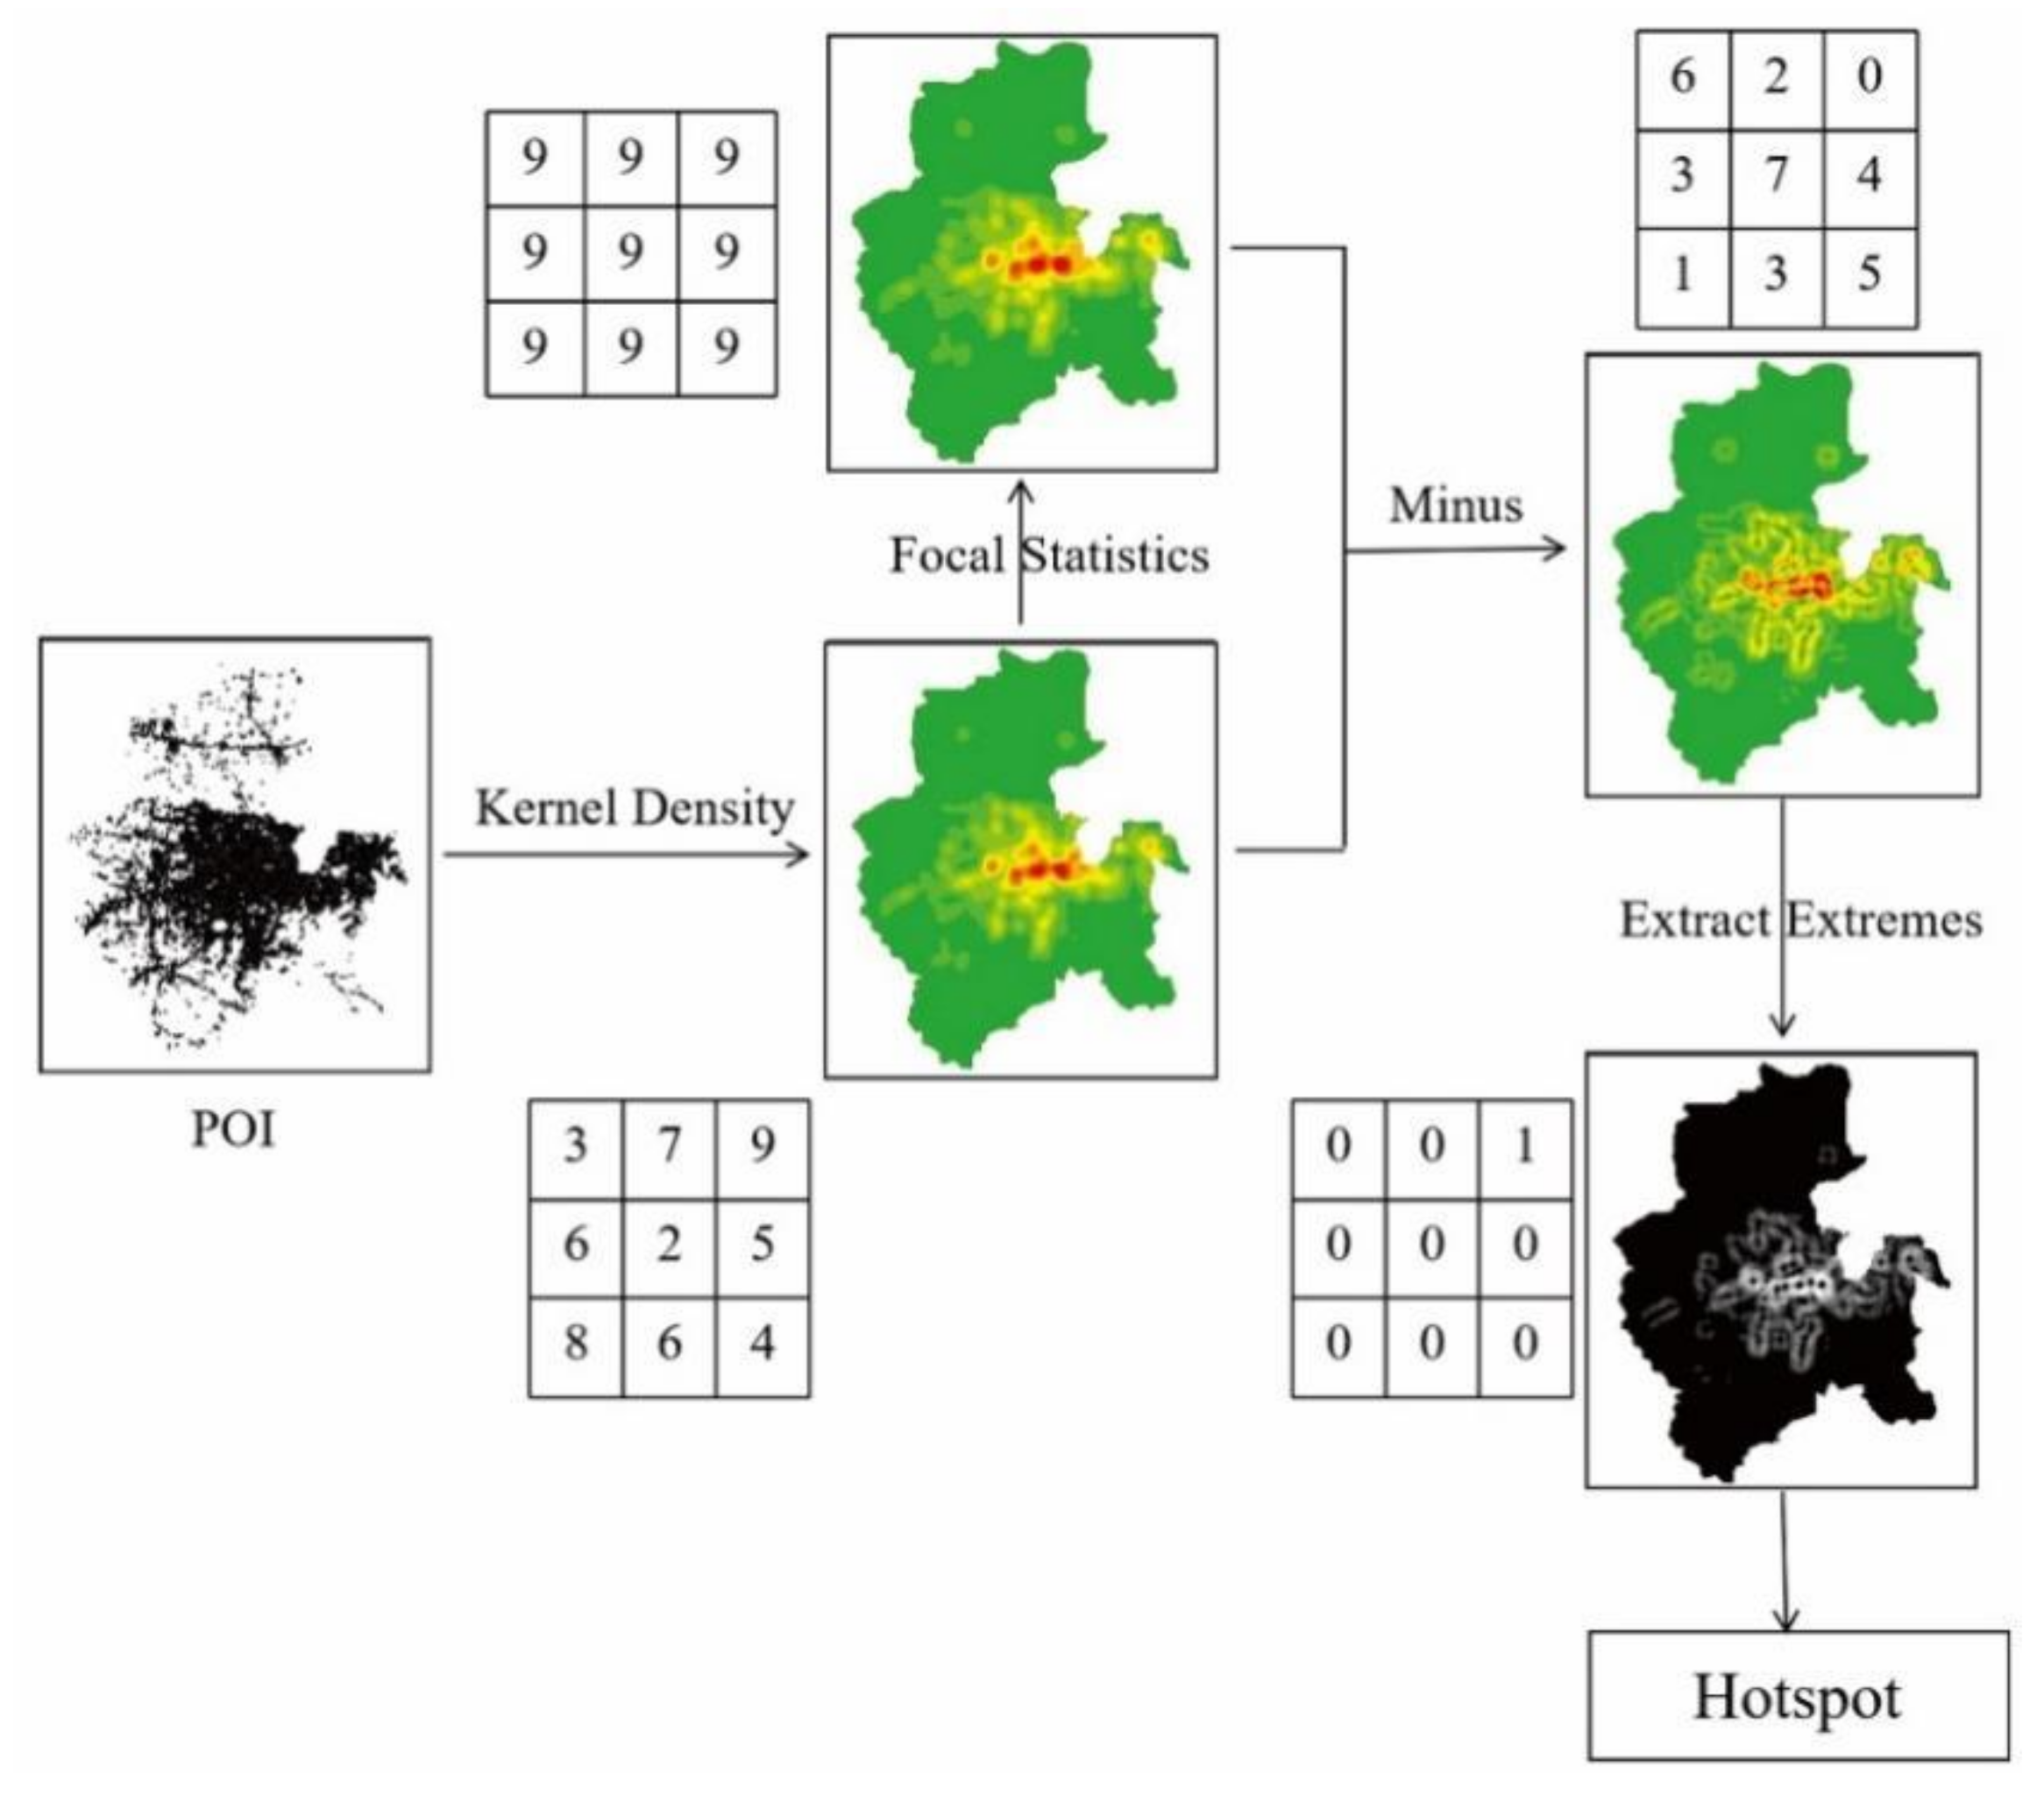
The present paper proposes a GIS-based field model for hot-spot extraction based on POI data and then analyzes the use intensity of functional areas by using Tencent location data [
17]. Taking the city of Jinan as an example, we first used the frequency density (FD) method to identify different functional areas [
18,
19]. Then, we comprehensively verified the rationality and accuracy of the identification of functional areas by using remote sensing images and a map of Jinan. We introduced a GIS-based field model for hot-spot extraction and constructed a generalized symmetric structure spectrum and digital field hierarchical geo-information Tupu to explore the spatial patterns and agglomeration conditions of the four central districts of Jinan at the horizontal and vertical levels [
20,
21,
22,
23,
24]. Finally, Tencent location data were used to quantify differences in the use intensity of functional areas between workday and weekend, as well as between daytime and nighttime. Our work reveals the composition and characteristics of urban functional areas from different dimensions, such as time and space. This research contributes to the understanding of the spatial distribution patterns of various functional facilities in Jinan by developing a research model of future urban development via a systematic study of urban functional areas and the use intensity of these areas.
3. Results and Discussion
3.1. Functional Area Recognition Analysis
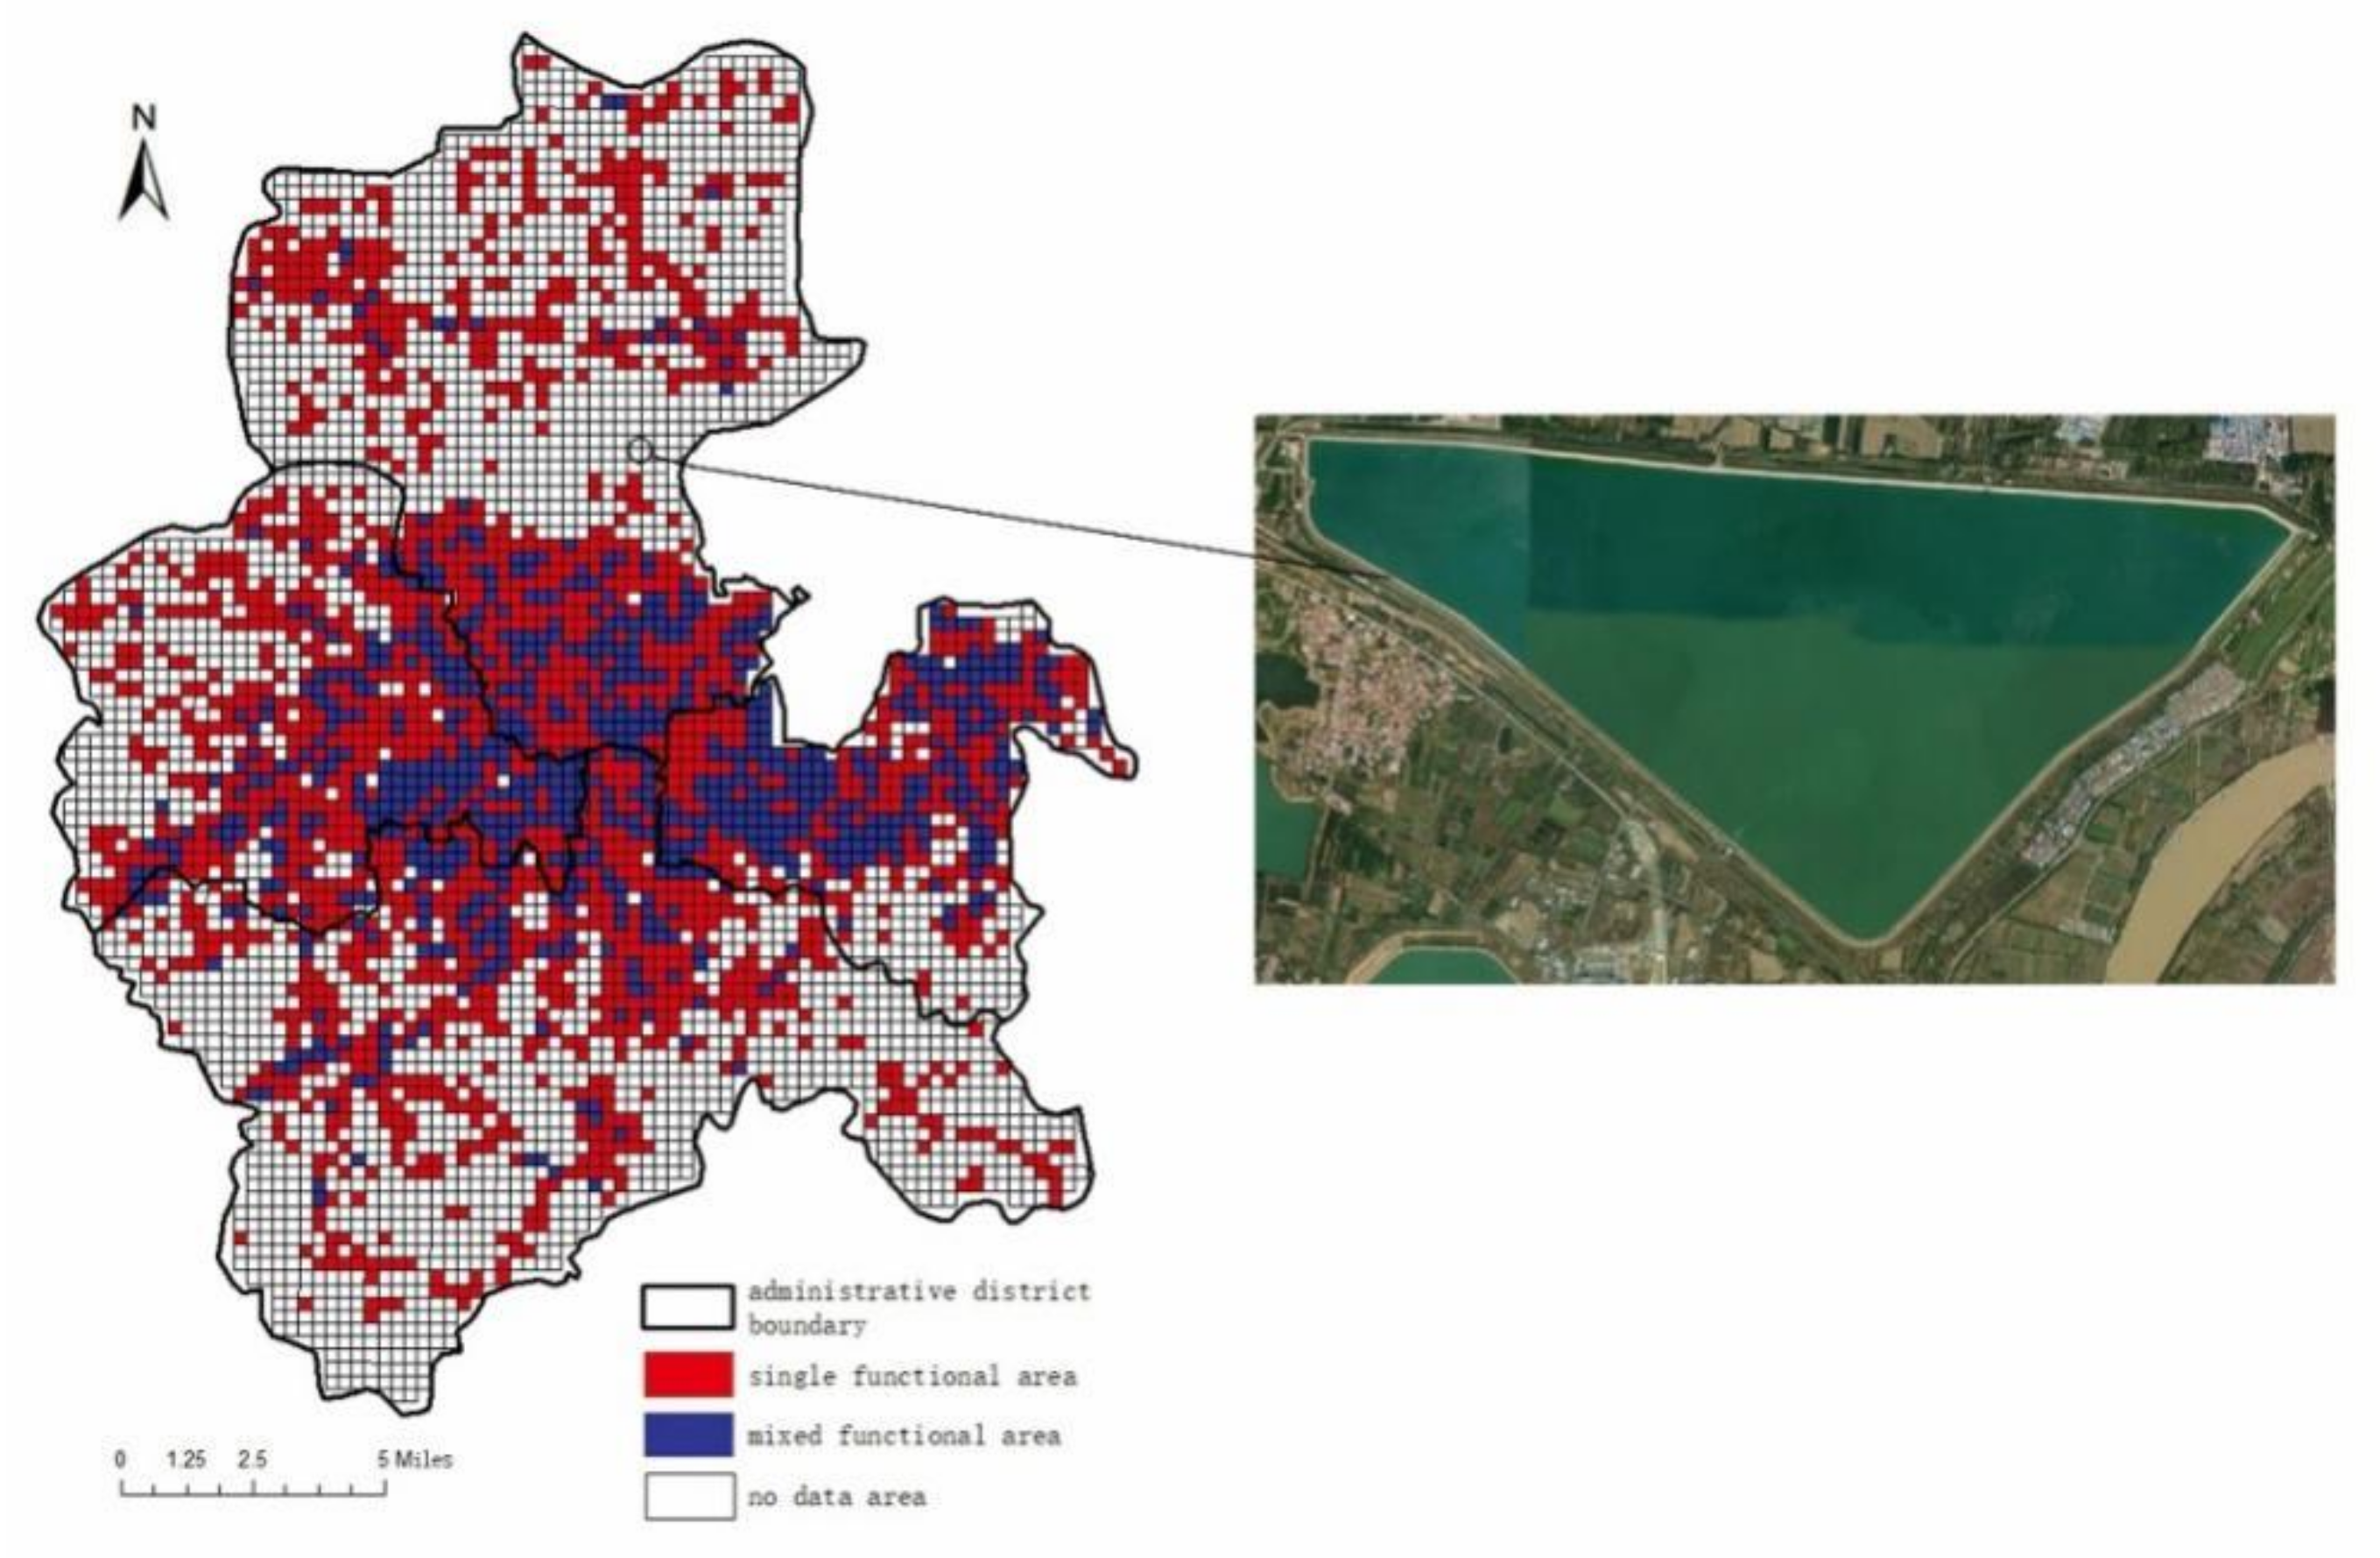
The three levels of single-function areas, mixed-function areas, and no-data areas were visualized with maps by using ArcGIS. The distributions of single and mixed-function areas in the four districts of Jinan City Center are shown in
Figure 6.
The figure shows single-function areas in red, mixed-function areas in blue, and no-data areas in gray. The crossovers between single- and mixed-function areas are mainly distributed at the centers of Jinan’s four districts and concentrated in the northern part of Shizhong District, the eastern part of Luoyin District, the southern part of Tianqiao District, and the northern part of Lixia District (
Figure 6). No-data areas are distributed at the peripheries of these four districts. The numbers of units in the three functional areas were counted, and the highest proportion of units was found in no-data areas (2272 units, 48.9% of the total number of units). These units are mostly distributed across cultivated land, lakes, and woodlands. Mixed-function areas account for 735 units, representing only 15.8% of the total number of units. Single-function areas account for 1643 units, representing 35.3% of the total number of units; these units are concentrated in the center of each study area.
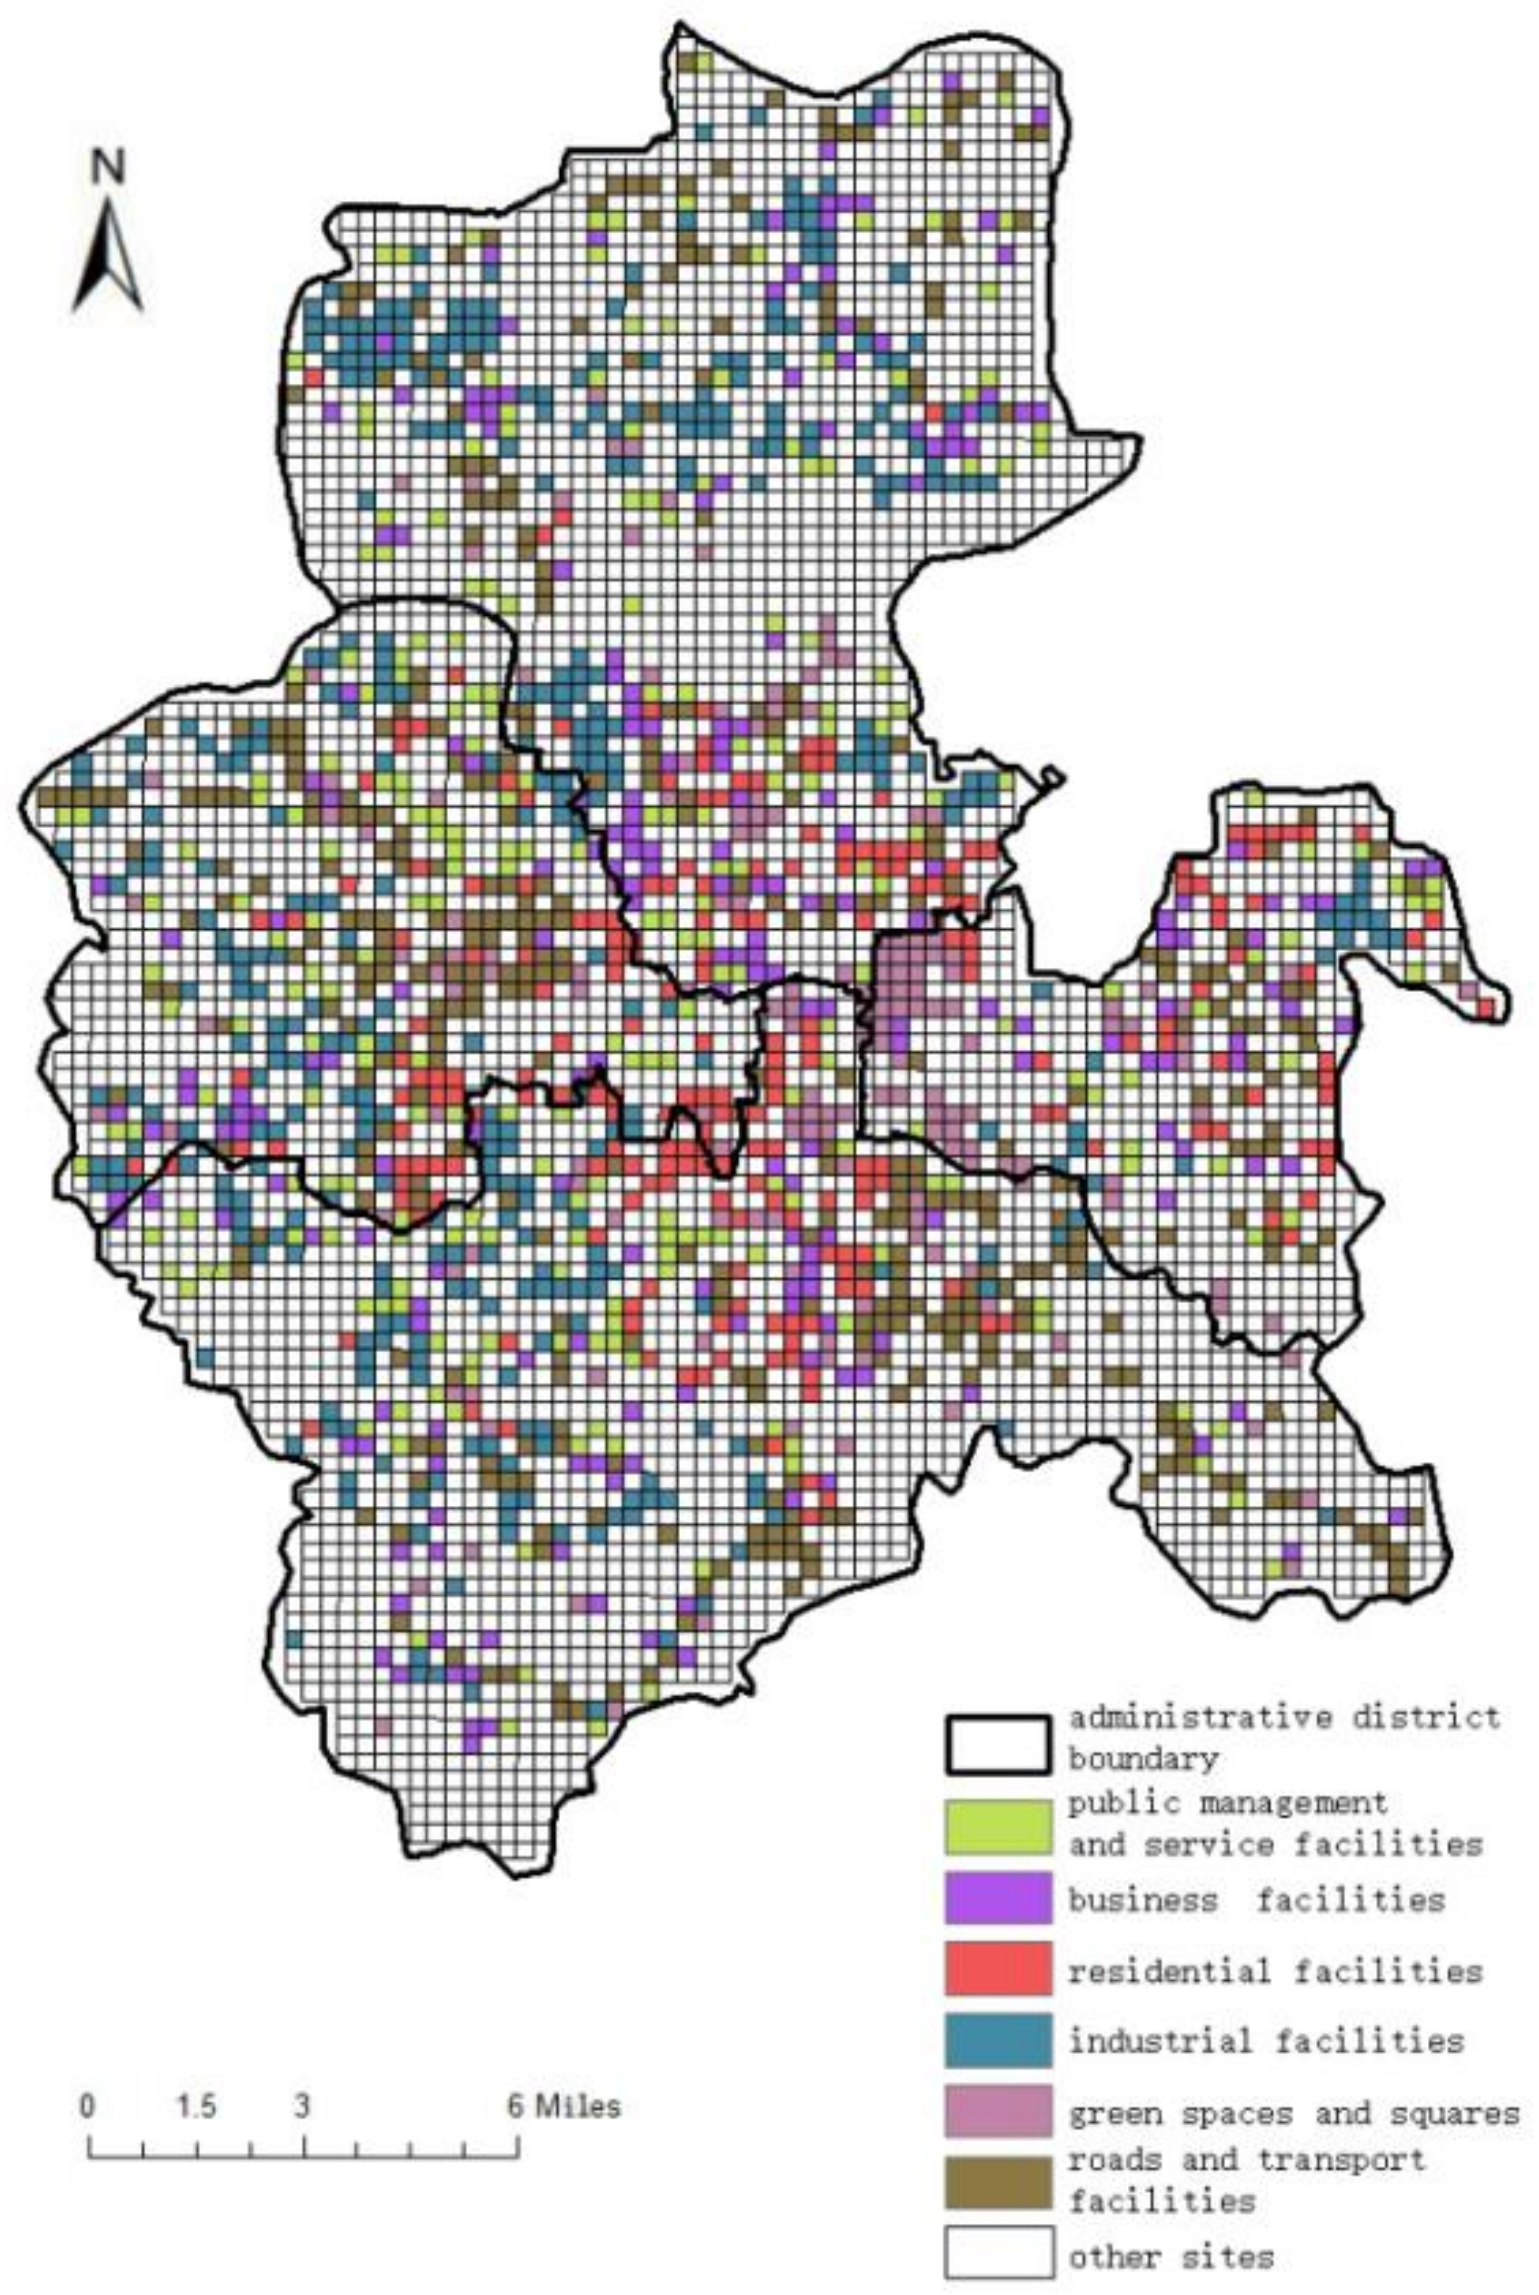
In this study, single-function areas were divided into six categories—namely, residential land, public management and service facilities land, business facilities land, industrial land, road and transport facilities land, and green space and square land.
Figure 7 shows the distribution of single-function areas in the four districts of Jinan City Center. Industrial land is distributed in Tianqiao District, mainly in Qilu Science and Technology City and Dingzhuangju Industrial Park. Residential land is concentrated in the southern part of Tianqiao District, the eastern part of Huaiyin District, and the northeastern part of Shizhong District. Moreover, in Lixia District, expansion toward the east, mainly in the vicinity of Dinghao Square, may be observed. Land used for business facilities is less concentrated and more evenly distributed in the main urban areas of the study area; the Jiguang Expressway in Tianqiao District, Jingshi Road in Huaiyin District, Second Ring Road South in Shizhong District, and Aoti Middle Road in Lixia District serve as the boundaries of spread to the surrounding areas. Roads and transport facilities show multicentric development trends in the four districts and are distributed in the east in Huaiyin District, Shizhong District, and Lixia District; these facilities are more scattered in Tianqiao District. Sites used for public management and service facilities are also widely distributed in the four districts, with the highest density found in the southern part of the Jingguang Expressway. Green space and square lands are highly concentrated and continuously distributed in Tianqiao District, Lixia District, and Shizhong District, particularly at Daming Lake, near Baotu, in scenic areas, or near square parks.
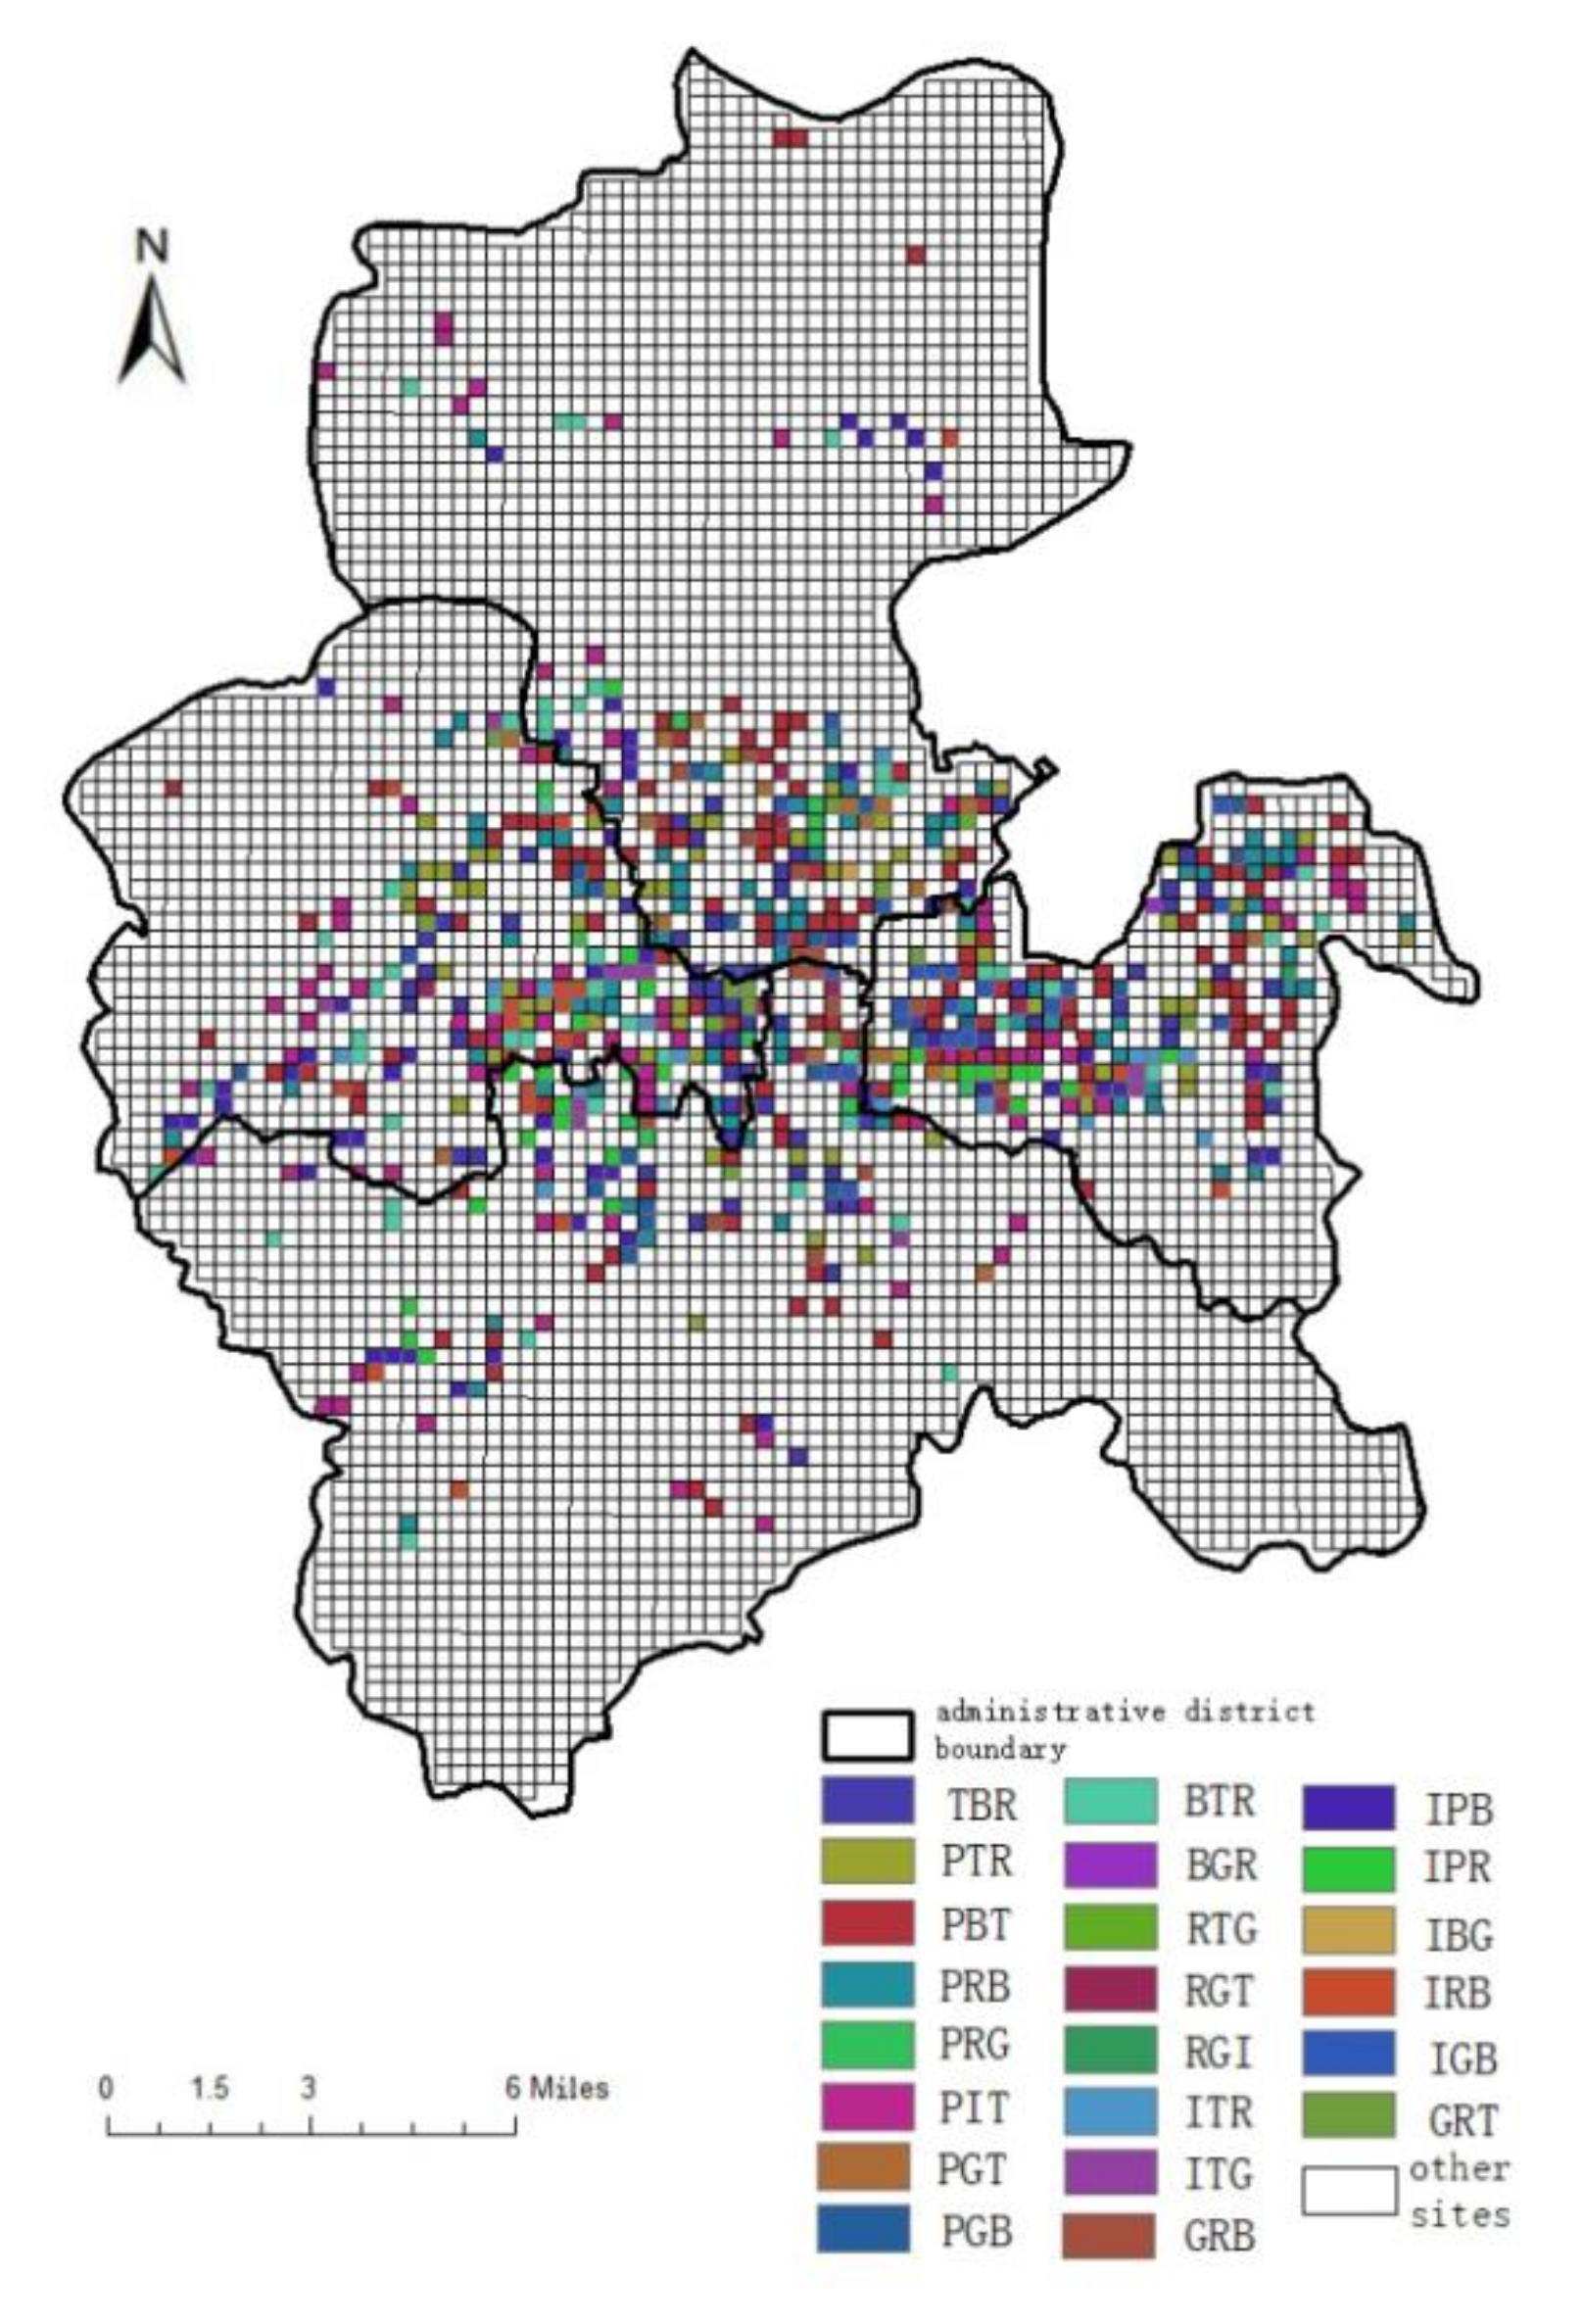
A mixed-function area is a unit in which the proportions of all POI categories are less than 50%. In this study, the three types of POIs with the highest proportions were selected on the basis of the nature of the functional area of the unit. After mixing the three POI types, 23 mixed-function areas are obtained. For example, a mixed unit of industrial land, residential land, and road and transport services land is referred to as industrial housing and expressed as ITR. A total of 22 mixed-land use types are found in the four districts of Jinan.
The mixed-function areas are mainly concentrated in the central areas of the four districts—namely, in the southern part of Tianqiao District, the southeastern part of Huaiyin District, Shizhong District, and the northern part of Lixia District. The distribution results are reflected in
Figure 8. In Tianqiao District, most of the mixed-function areas are categorized as IBTs (industrial, business, and road and transport facilities). In Huaiyin District and Shizhong District, most areas are labeled IPB (industrial, public management and service, and business facilities). Lixia District has more units of IGB and PBT areas than other districts; as a result, business facilities, public management and service facilities, and industrial facilities are more widely distributed across this district than in other districts.
3.2. Hot-Spot Detection Analysis
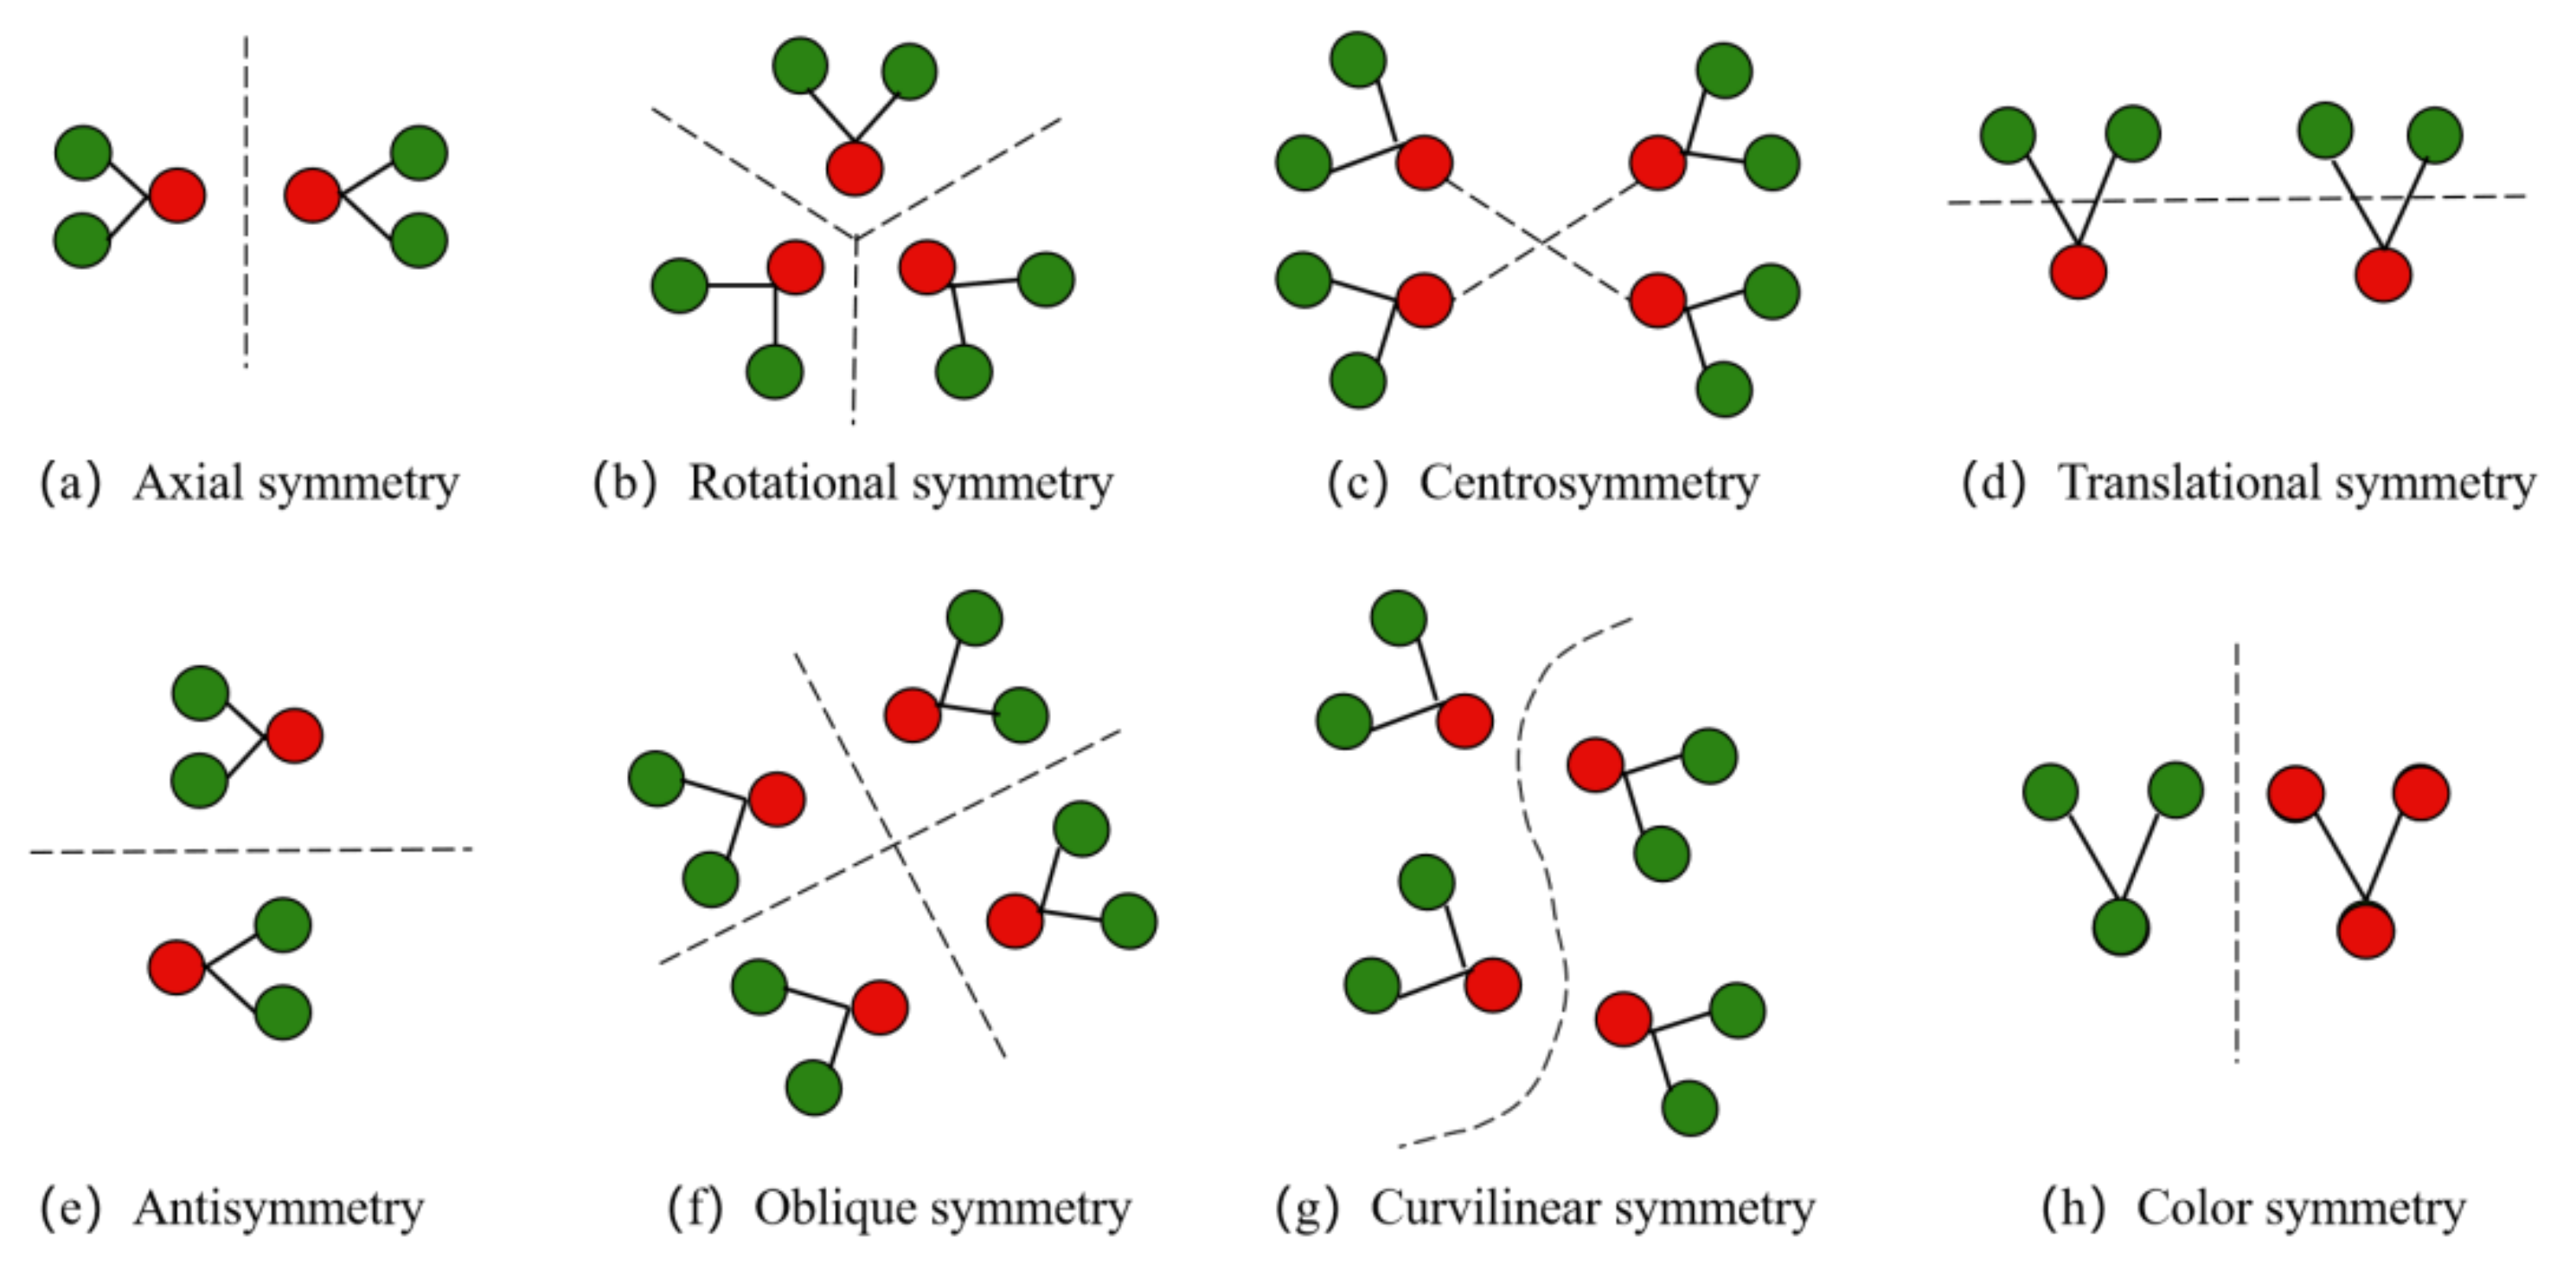
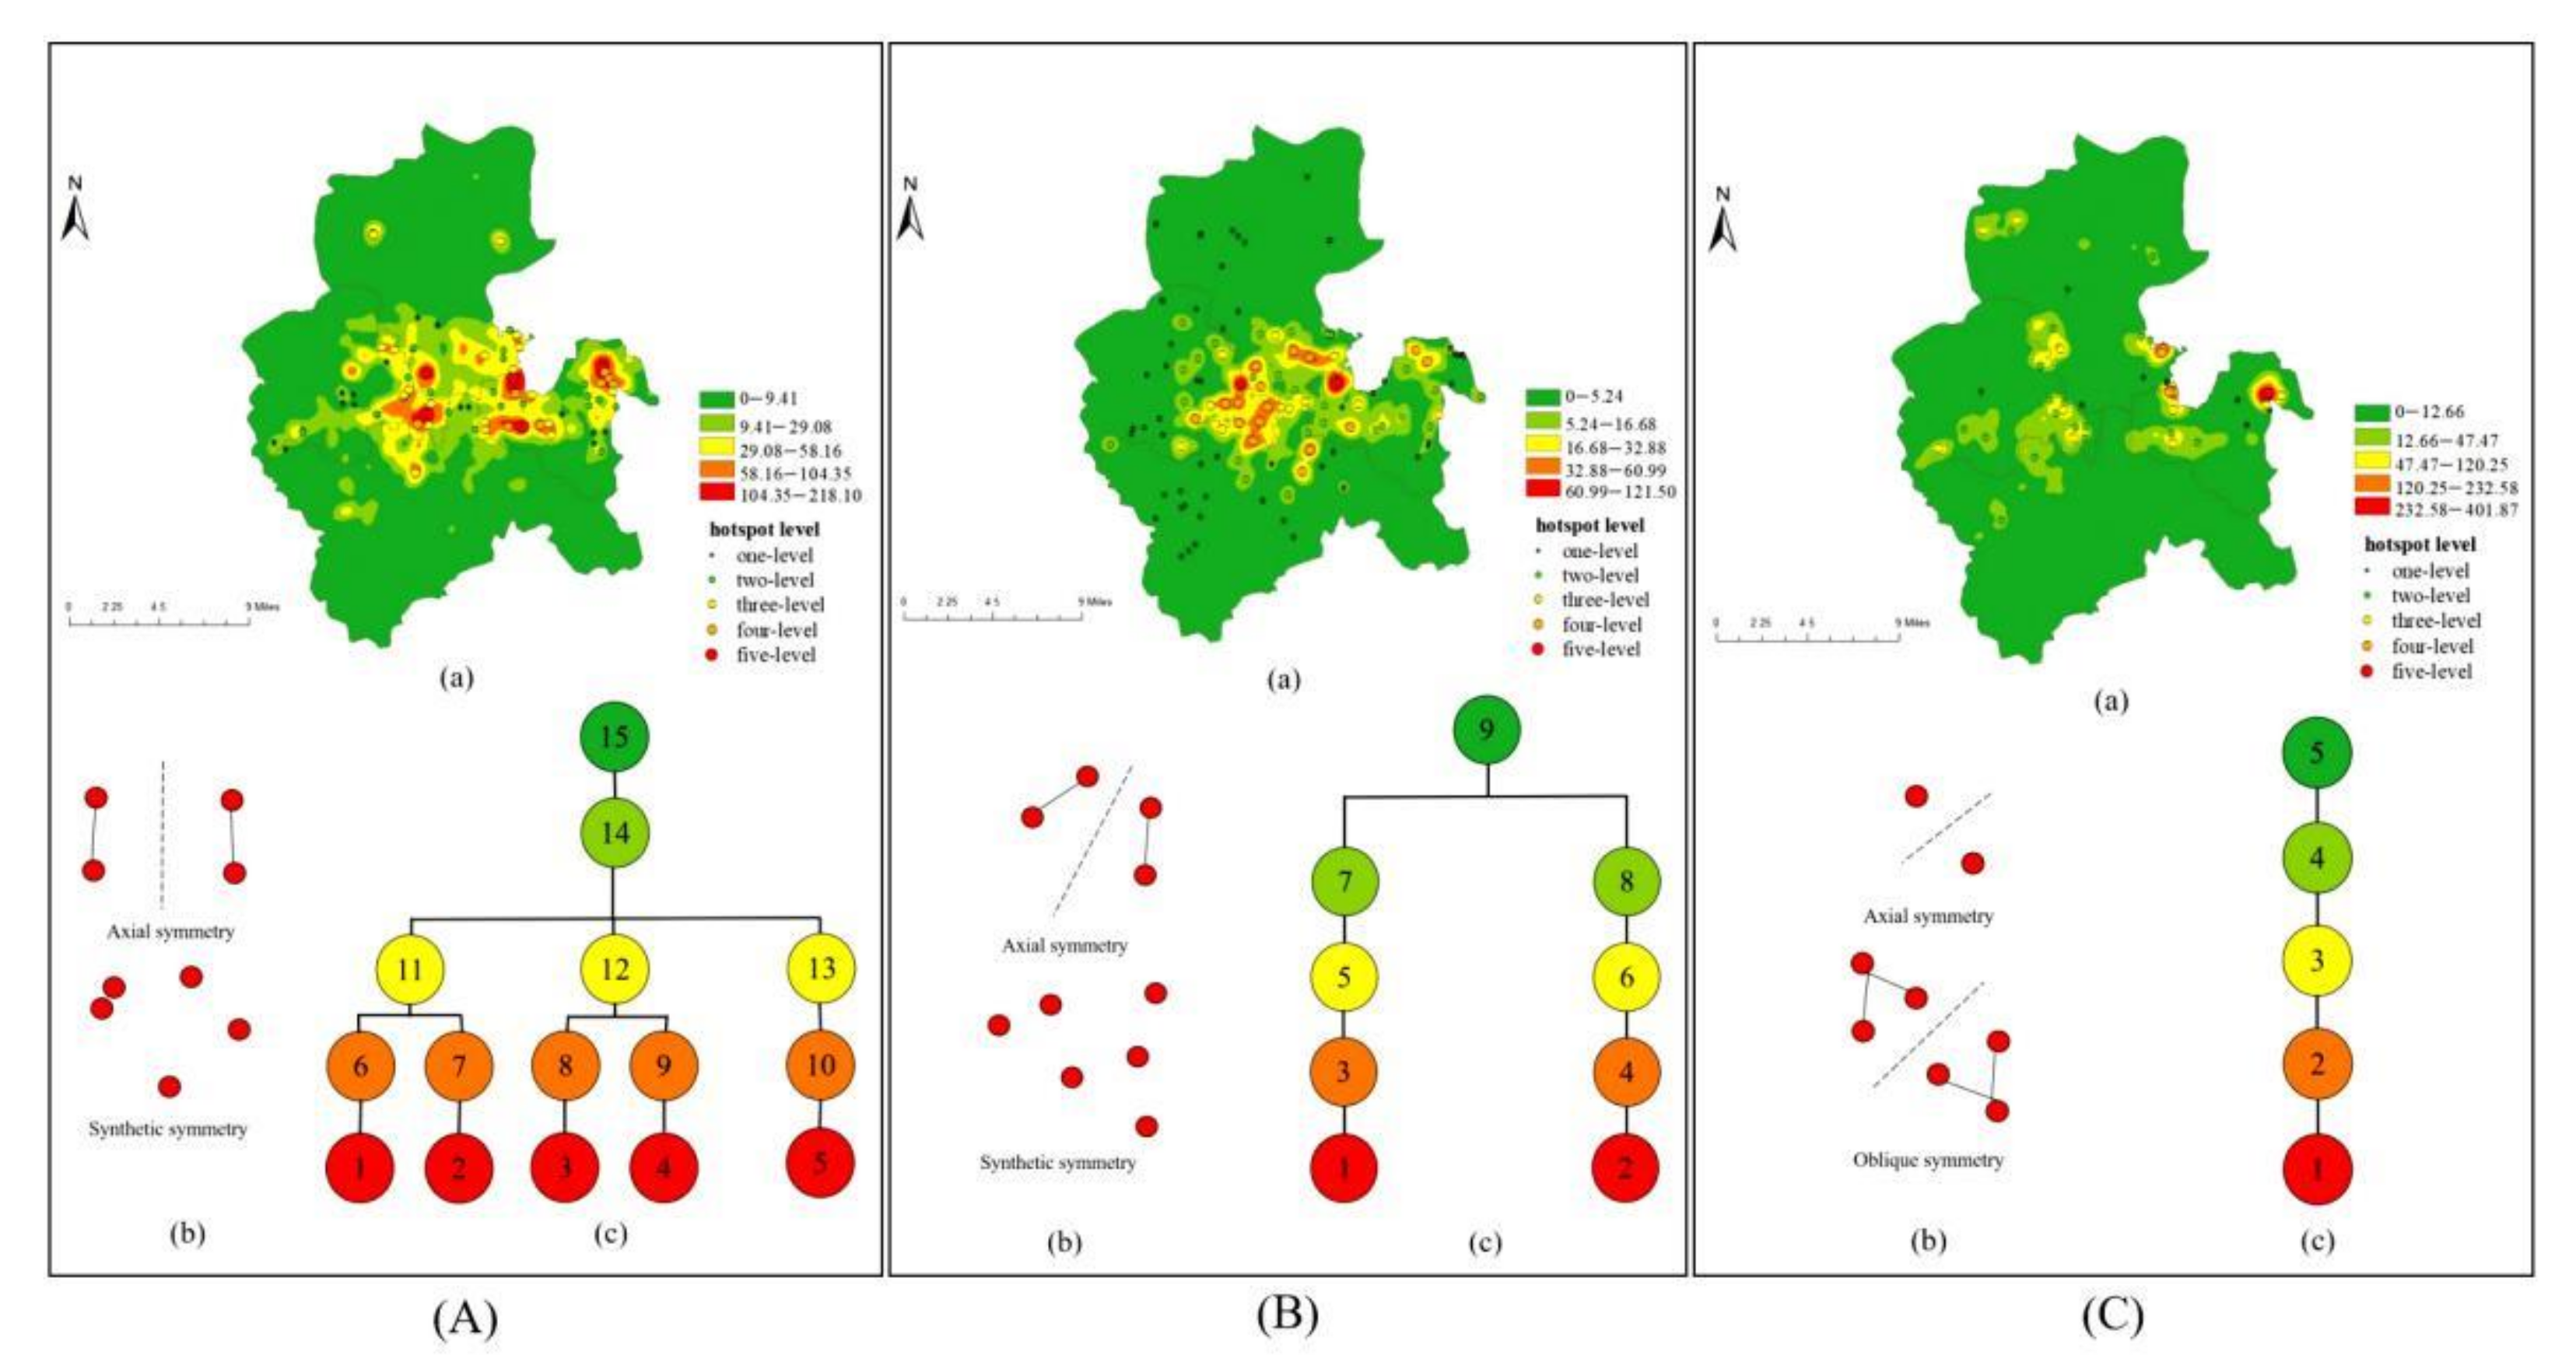
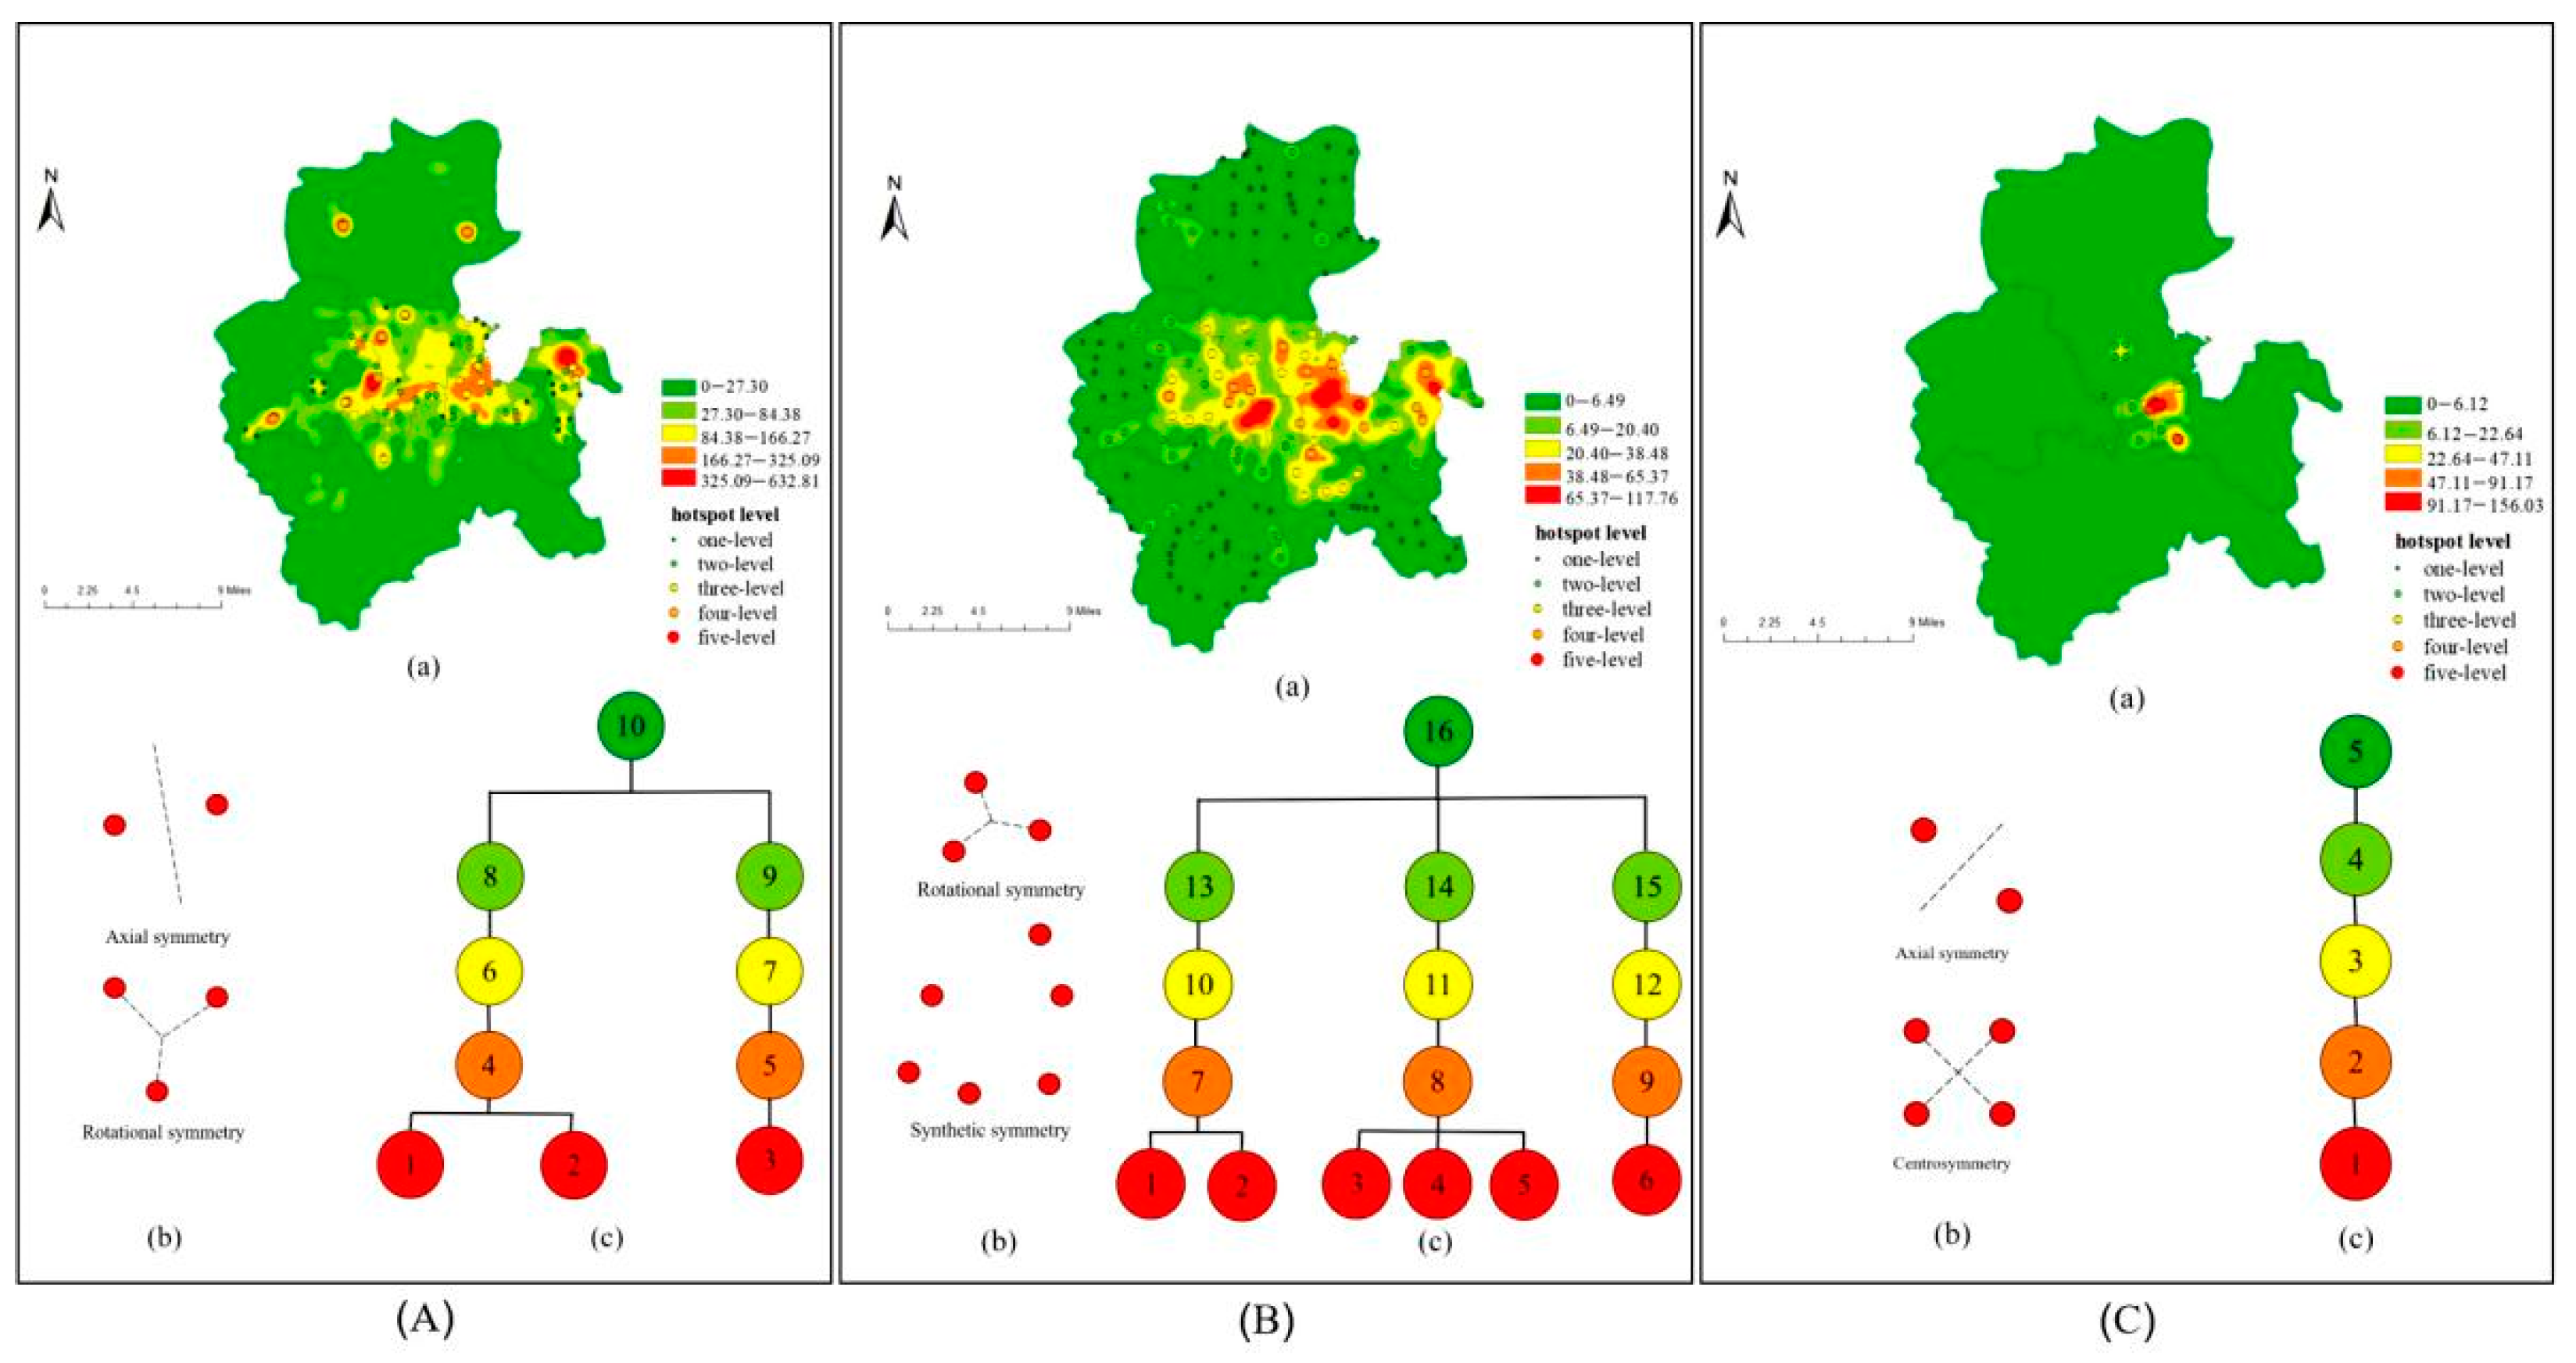
The spatial distributions and structural features of POI hot spots are presented using the generalized symmetric structure spectrum and digital field-based hierarchical geo-information Tupu defined from a geographic perspective. The hot-spot detection results for public management and service facilities, residential land, and industrial land are shown in
Figure 9. In this figure, the distribution hotspots of these three types of functional facilities form an axial–symmetrical structure. In addition, public management and service facilities and residential land hotspots present a synthetic symmetrical structural distribution.
However, only one large-scale hot spot for public management and service facilities could be observed in the western region of the research area; hot spots of four levels and below show a synthetic symmetrical structure. In terms of digital field hierarchy, five-level hot spots in the east, numbered 5, show an independent hierarchical structure at different scales, thereby indicating that this level forms the only hot spot in the region. In addition, the four other large hot spots are distributed in the form of a double nucleus, with five-level hot spots mainly distributed at the intersection of Jingshi Road and Nanxinzhuang West Road at Qilu Normal College and Dinghao Square. For residential facilities, the smallest hot-spot levels are distributed around the central region and show an overall symmetrical structural trend. Digital field-based hierarchical geo-information Tupu shows only two large hot spots among the distributed residential facilities in the four districts; these hot spots manifest relatively independent single-core characteristics and tend to extend eastward, mainly in the central regions of the districts. The hot-spot detection results for industrial facilities show a small number of hot spots at all levels, and the distributions of two- and four-level hot spots are axially symmetric. Only one large hot spot with an obvious single-nucleus distribution structure could be observed at the eastern region of Boardwalk Plaza.
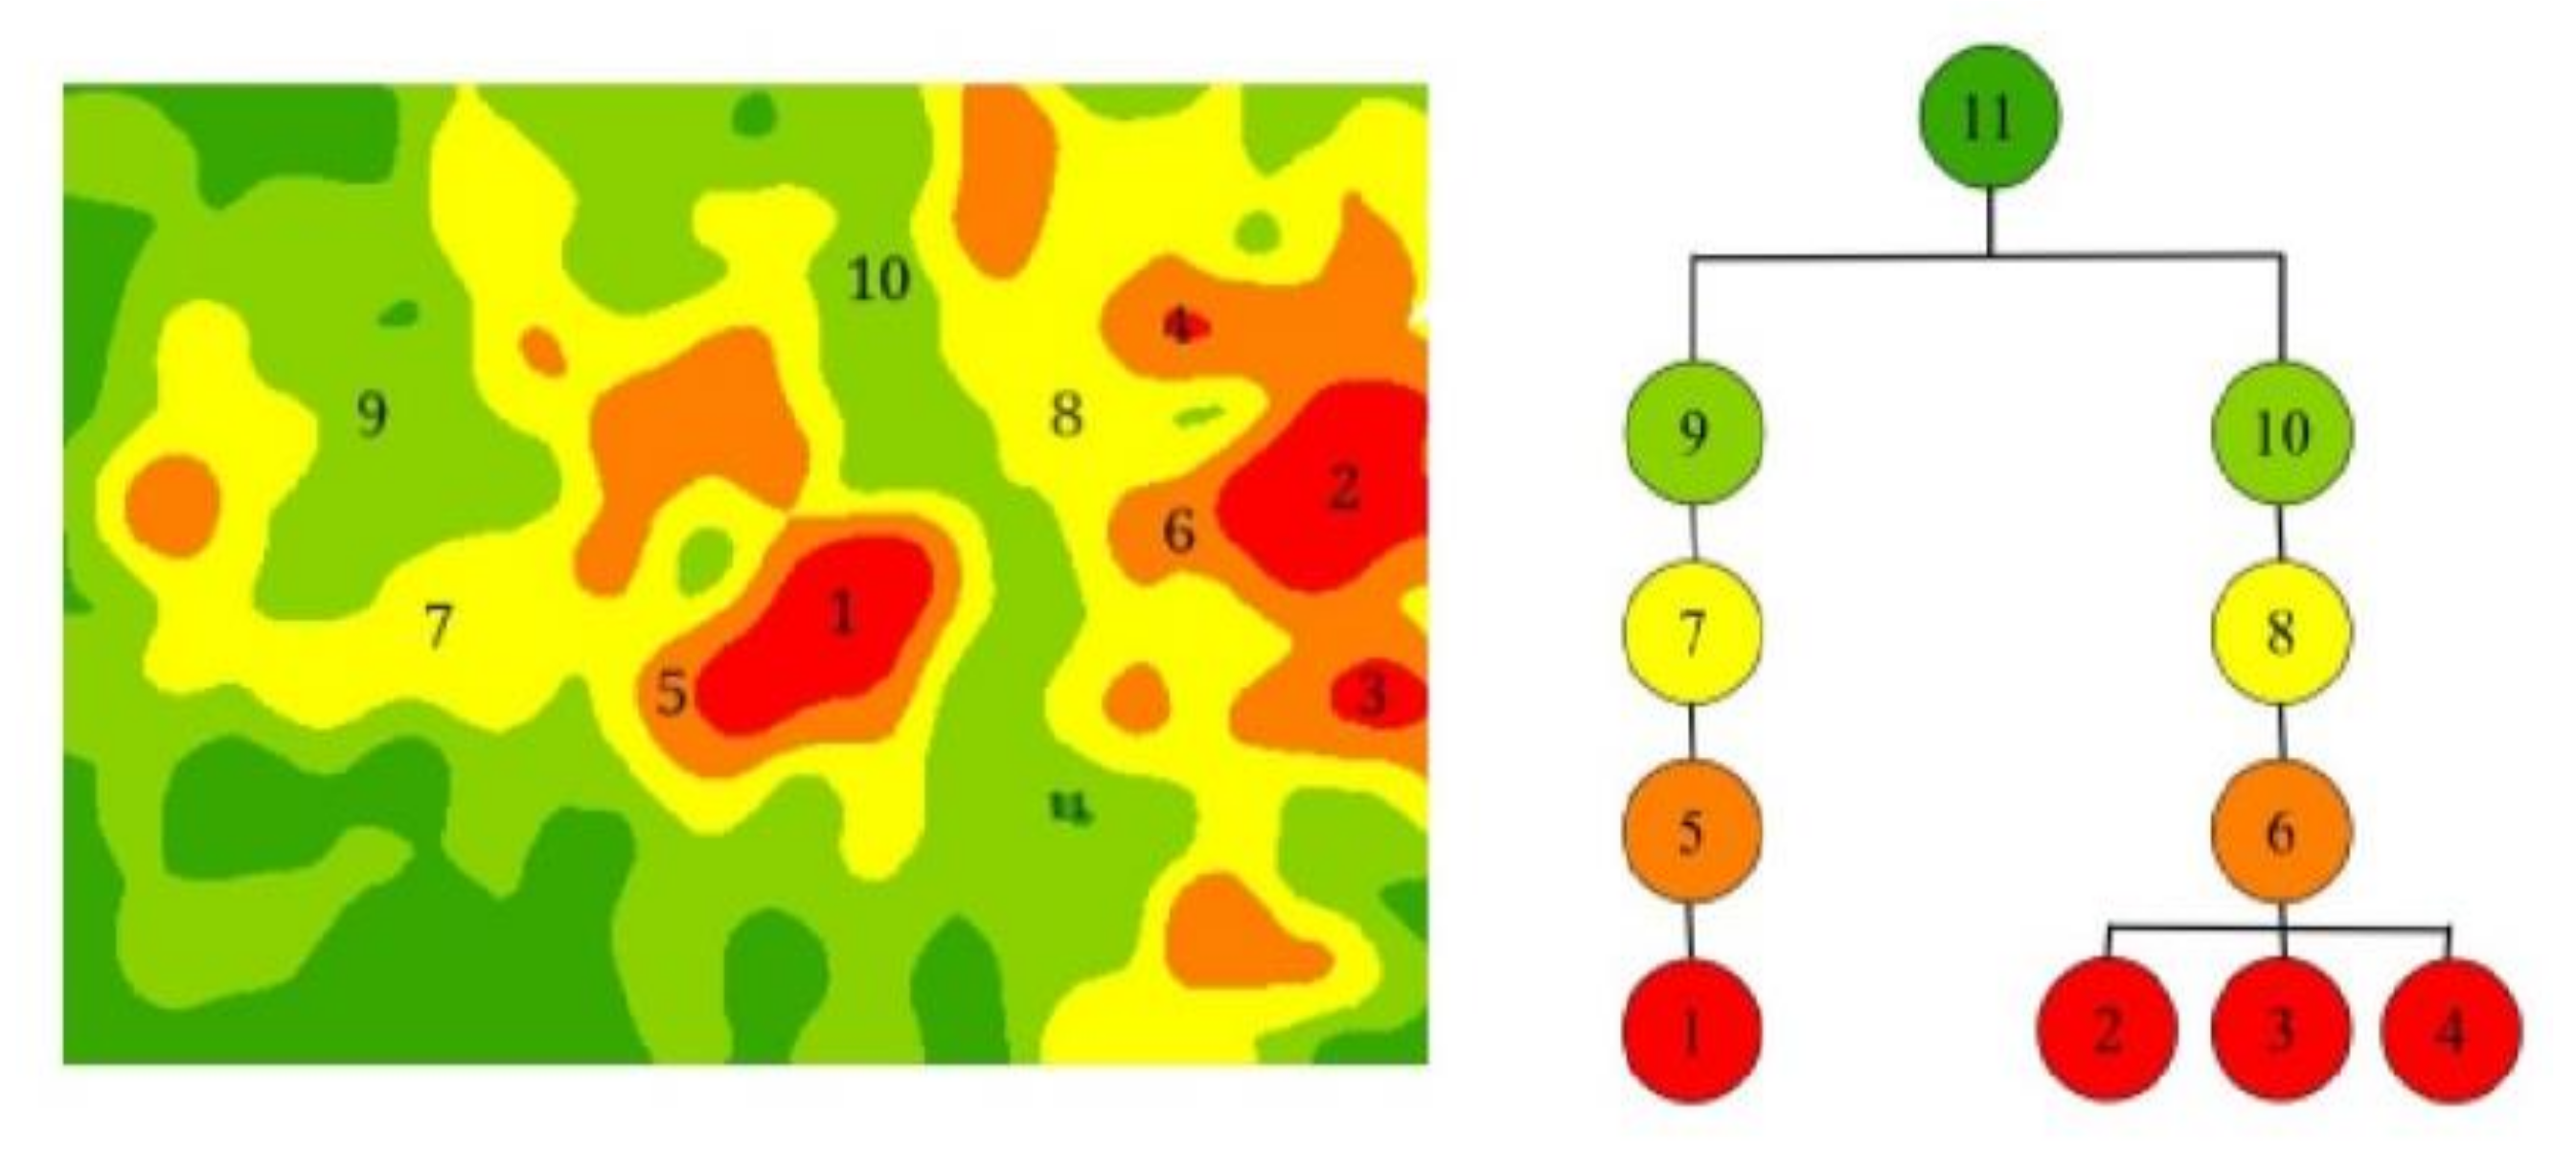
The hot-spot detection results for roads and transport facilities reveal six five-level hot spots in the four districts, as well as an obvious multinuclear hot spot group structure (
Figure 10). Among these six five-level hot spots, three show rotational–symmetrical distributions, and the remaining hot spots mainly show overall symmetrical structures. The digital field-based hierarchical geo-information Tupu results show the discrete and aggregated features of the hot-spot distribution. A total of six large road and transport facility hot spots (i.e., five-level hot spots of road and transport facility) are observed, and all six areas have independent hierarchies at different scale levels; these findings indicate that these five levels form the only hot spots in the corresponding regions. The number of secondary hot spots is relatively small, and the five levels numbered 1 and 2 are aggregated at the fourth level through node 13, thereby indicating that these five levels form the only hot spots around the region (
Figure 10B). The five levels numbered 3, 4, and 5 are aggregated at the fourth level through node 14, indicating higher concentrations of roads and transport facilities in regions with greater numbers of hot spots of lower levels. Gathering areas are mainly located in the Lashan Overpass, Yanshan Overpass, and Qilu Software Park areas. The distribution structures of green space and square land facilities show four-level hot spots mainly distributed in an axial–symmetrical pattern and two-level hot spots distributed in an overall symmetrical pattern. Among the four central districts studied in this work, green space and square land facilities exhibit the fewest hot spots. Only one independent small-scale single-core gathering area could be observed, and this area is mainly distributed around the Baotu Spring scenic area.
Overall, business facilities, public management and service facilities, road and transport facilities, and residential land show the distribution characteristics of contiguous clusters, thereby reflecting the spatial structure of the clustering distribution of these facilities in the four districts of Jinan City Center. Industrial facilities and green space and square land facilities show multi-pole nuclear cluster-like distribution patterns; each of these types of facilities is found in the central city area. Various types of functional facilities are distributed according to the available geographical resources. Overall, compared with those in other regions, business facilities, public management and service facilities, road and transport facilities, and residential land are more densely distributed in the southern part of Tianqiao District, the eastern part of Huaiyin District, Shizhong District, and the northern part of Lixia District, where most of the busiest areas of Jinan are located. This finding demonstrates the considerable spatial overlap of various functional facilities in the four central districts of Jinan.
3.3. Validation of Functional Area Recognition Results
The functional area distribution map obtained from the experiment was compared to the remote sensing images obtained from USGS National Map Viewer (
http://viewer.nationalmap.gov/viewer/, accessed on 15 April 2019) to test the accuracy of the functional area recognition results, and four typical areas were used as examples for validation analysis. The identification results are shown in
Table 3.
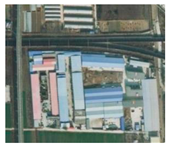
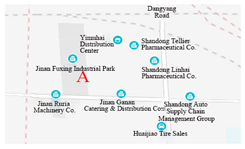
- (1)
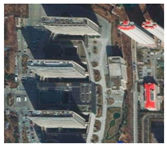
The northern part of Shizhong District—in this study, area A is identified as industrial land, including companies and enterprises. Compared with the Amap and a remote sensing image, area A includes various companies and enterprises, such as the Jinan Fuxing Industrial Park and Shandong Linhai Pharmaceutical Company.
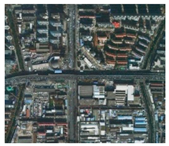
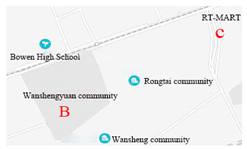
- (2)
The southern part of Tianqiao District—we selected two zones, that is, B and C, in the southern region of Tianqiao District. According to the distribution of the functional areas explored in this study, area B is identified as residential land, including residential areas, and area C is identified as business facilities land, including supermarkets and banks. Compared with the Amap and a remote sensing image, area B is located in the Wanshengyuan area, and area C is located near an RT-Mart supermarket.
- (3)
The central region of Huaiyin District—we selected central area D of Huaiyin District. In this study, area D is identified as a mixed-function area, including roads and transport facilities, business facilities, and residential land. According to the Amap and a remote sensing image, area D includes the Jinan West Station, Xicheng Tower, and Qilu Gate, which are indicated as green land in the residential area. As the area has clear mixed-function characteristics, the identification results could be considered accurate.
- (4)
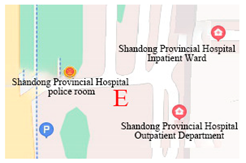
The eastern region of Lixia District—we selected region E, located in the eastern part of Lixia District. From the distribution of functional areas explored in this study, area E is identified as a mixed-function area for public management and service facilities, business facilities, and roads and transport facilities. Compared with the Amap and a remote sensing image, area E shows evident mixed-function characteristics, with the main facilities including the Jinan City Postal Administration, Shandong Provincial Hospital East Hospital, and the major Aoti Middle Road.
Considering the verification results described above, the identification results could be considered to be accurate.
3.4. Analysis Results of Use Intensity of Functional Area
We superimposed and analyzed the results of functional area identification with the 1 km × 1 km grid of Tencent data and then statistically analyzed and selected the functional facilities with the largest proportions in the grid to obtain the temporal and spatial characteristics of the use intensity of various functional facilities.
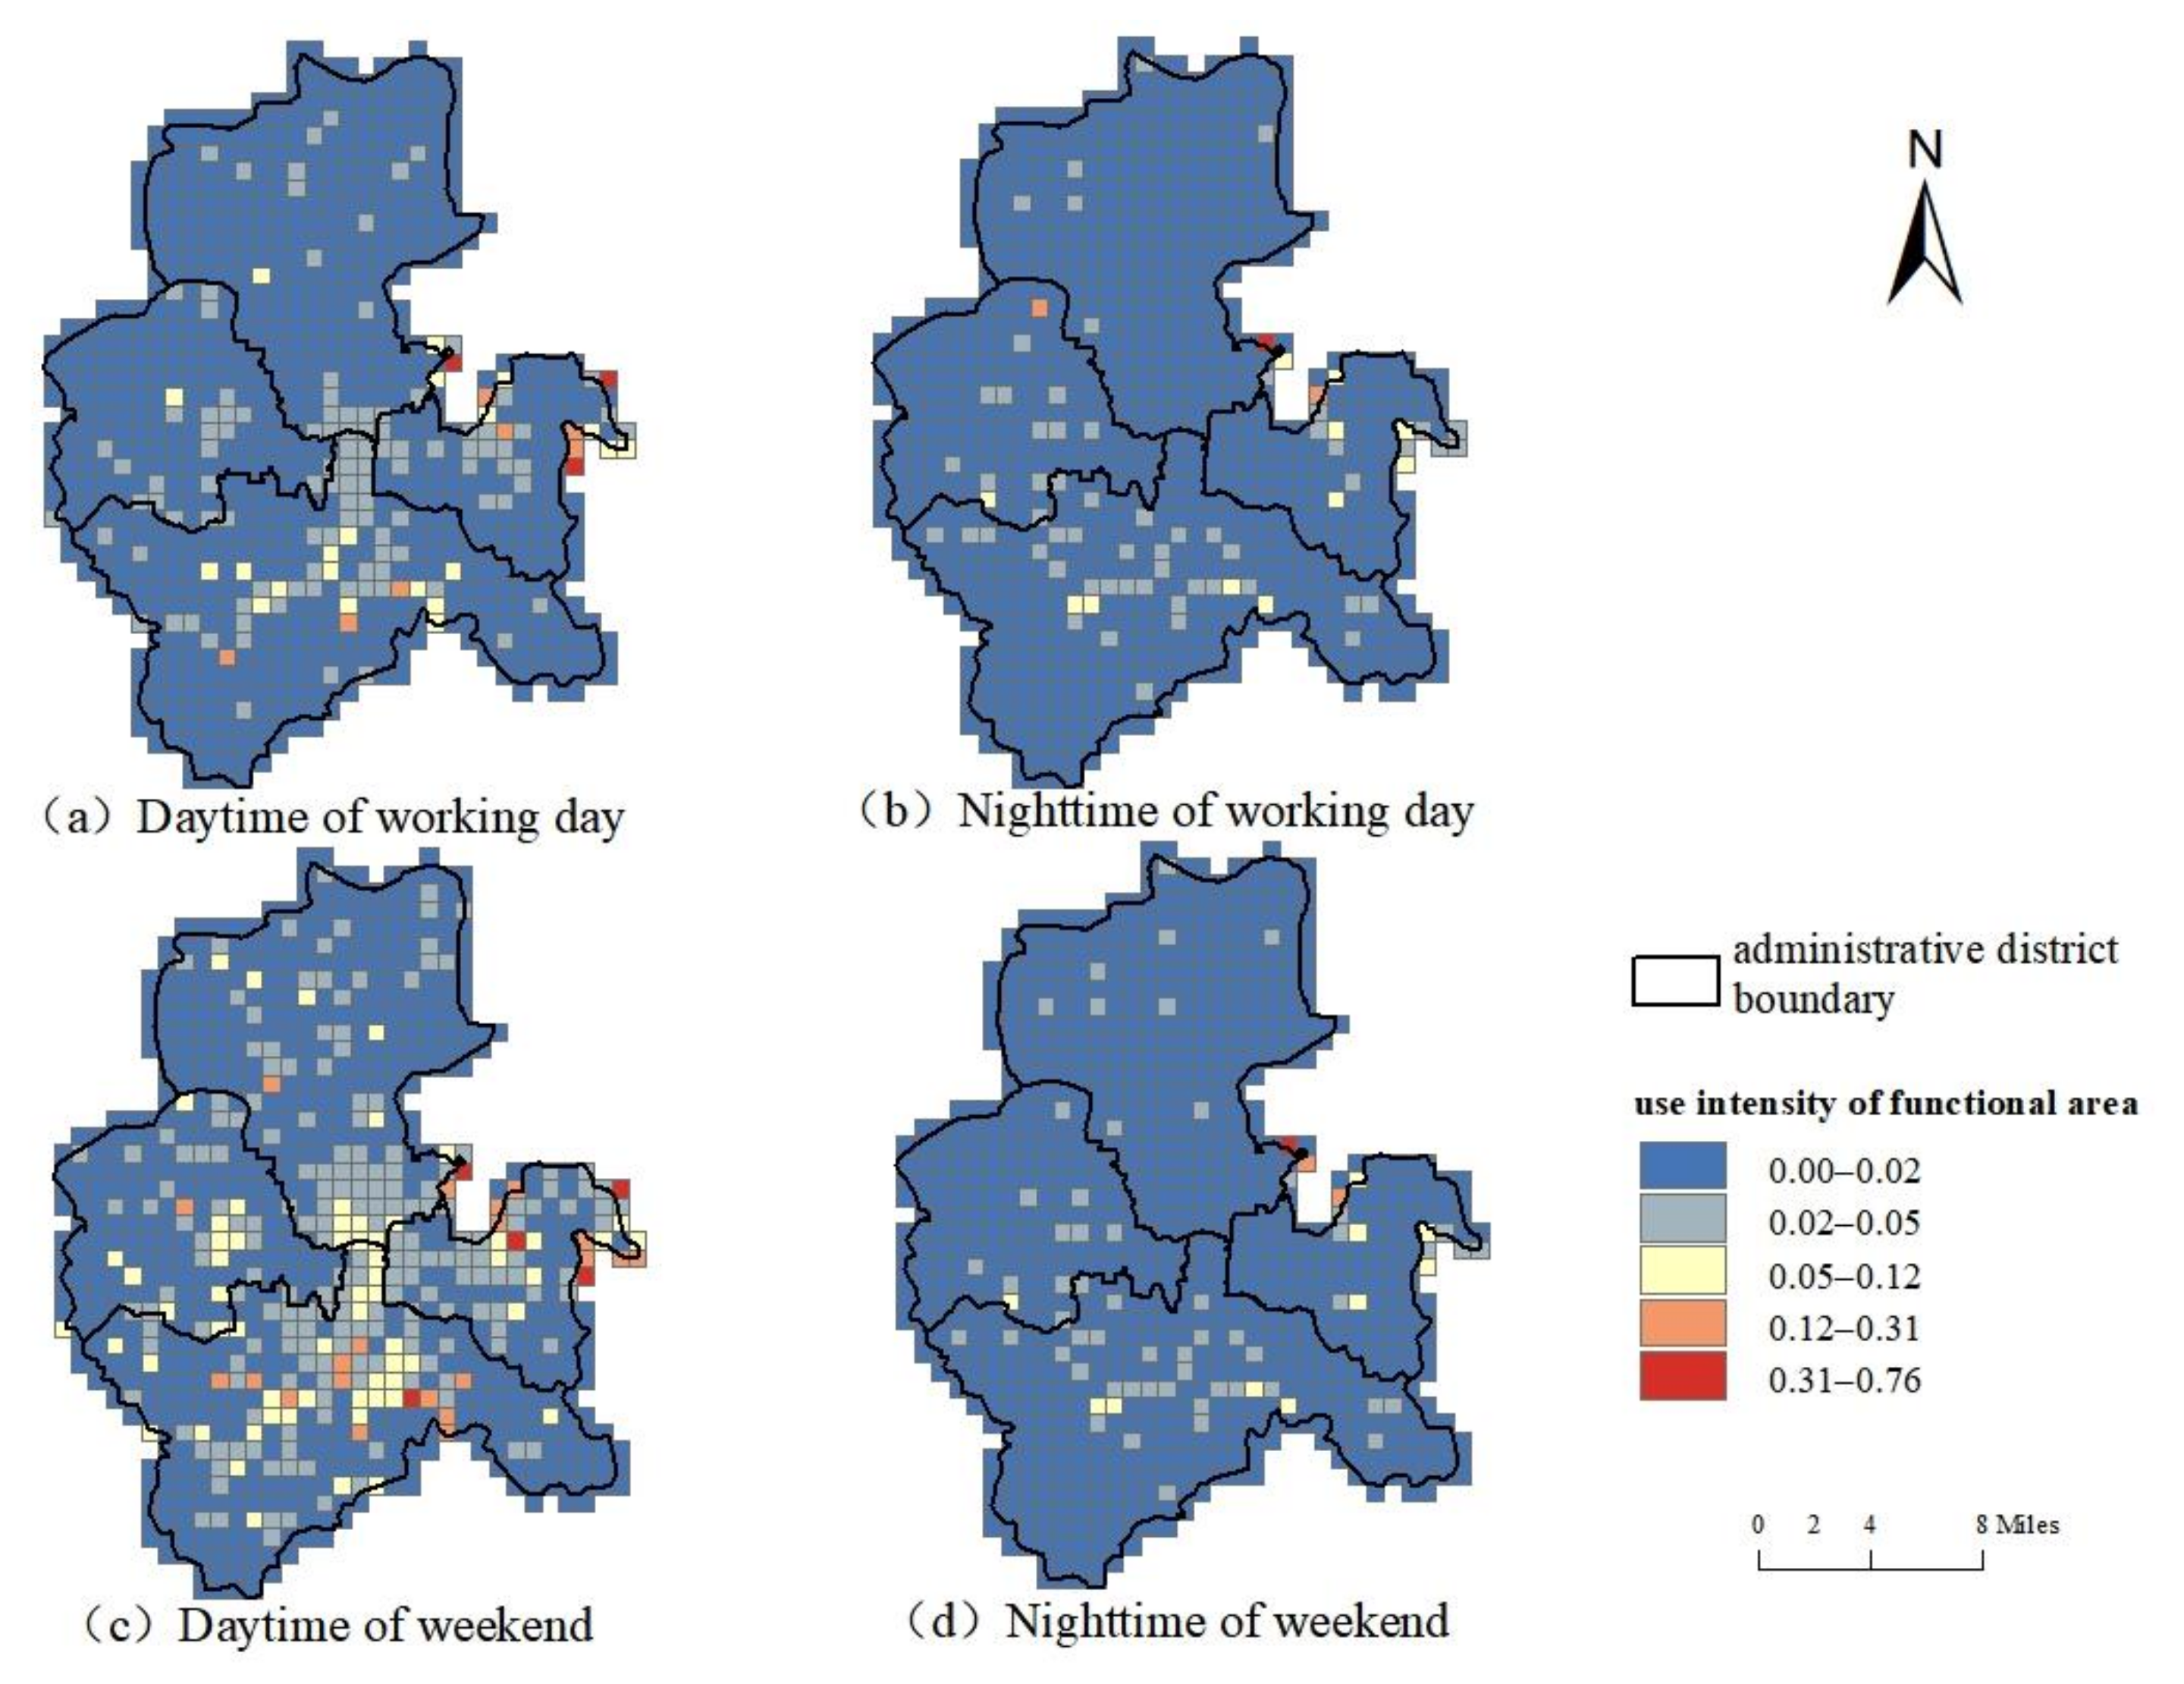
In terms of spatial distribution, in the daytime, the use intensity of functional areas in the central area is much higher than that in the surrounding areas, and high-use intensity areas are formed in business districts, such as the World Trade Center.
Figure 11 shows the results of the spatial distribution of the use intensity of various functional areas. Areas with low use intensity are distributed at the periphery of the study area, while areas with higher use intensity are mainly distributed within the inner regions of the city. Regardless of whether the day is a weekday or part of the weekend, the area of high use intensity during the day is much larger than that at night and mainly concentrated at the junction of the four districts. This finding may be explained by a large number of tourist attractions in this area, including Daming Lake Park, Qianfoshan Scenic Area, and Bao Tuquan Park, which have strong population absorption capacities. Compared with that during workdays, the use intensity of functional areas during weekends is significantly increased and mainly located in functional areas related to business facilities. This finding confirms that, compared with that of the five other types of functional facilities, the development of business facilities in Jinan City is at a higher level. The central and northern parts of the four districts show weak performance in the use intensity of functional areas. This finding is mainly due to the fact that fewer functional areas and large areas of land to be developed are available in these areas. In fact, in 2021, the Jinan Municipal Government proposed the building of a new and old kinetic energy conversion starting area in these locations to drive the quality of regional development and promote the coordinated development of the four districts.
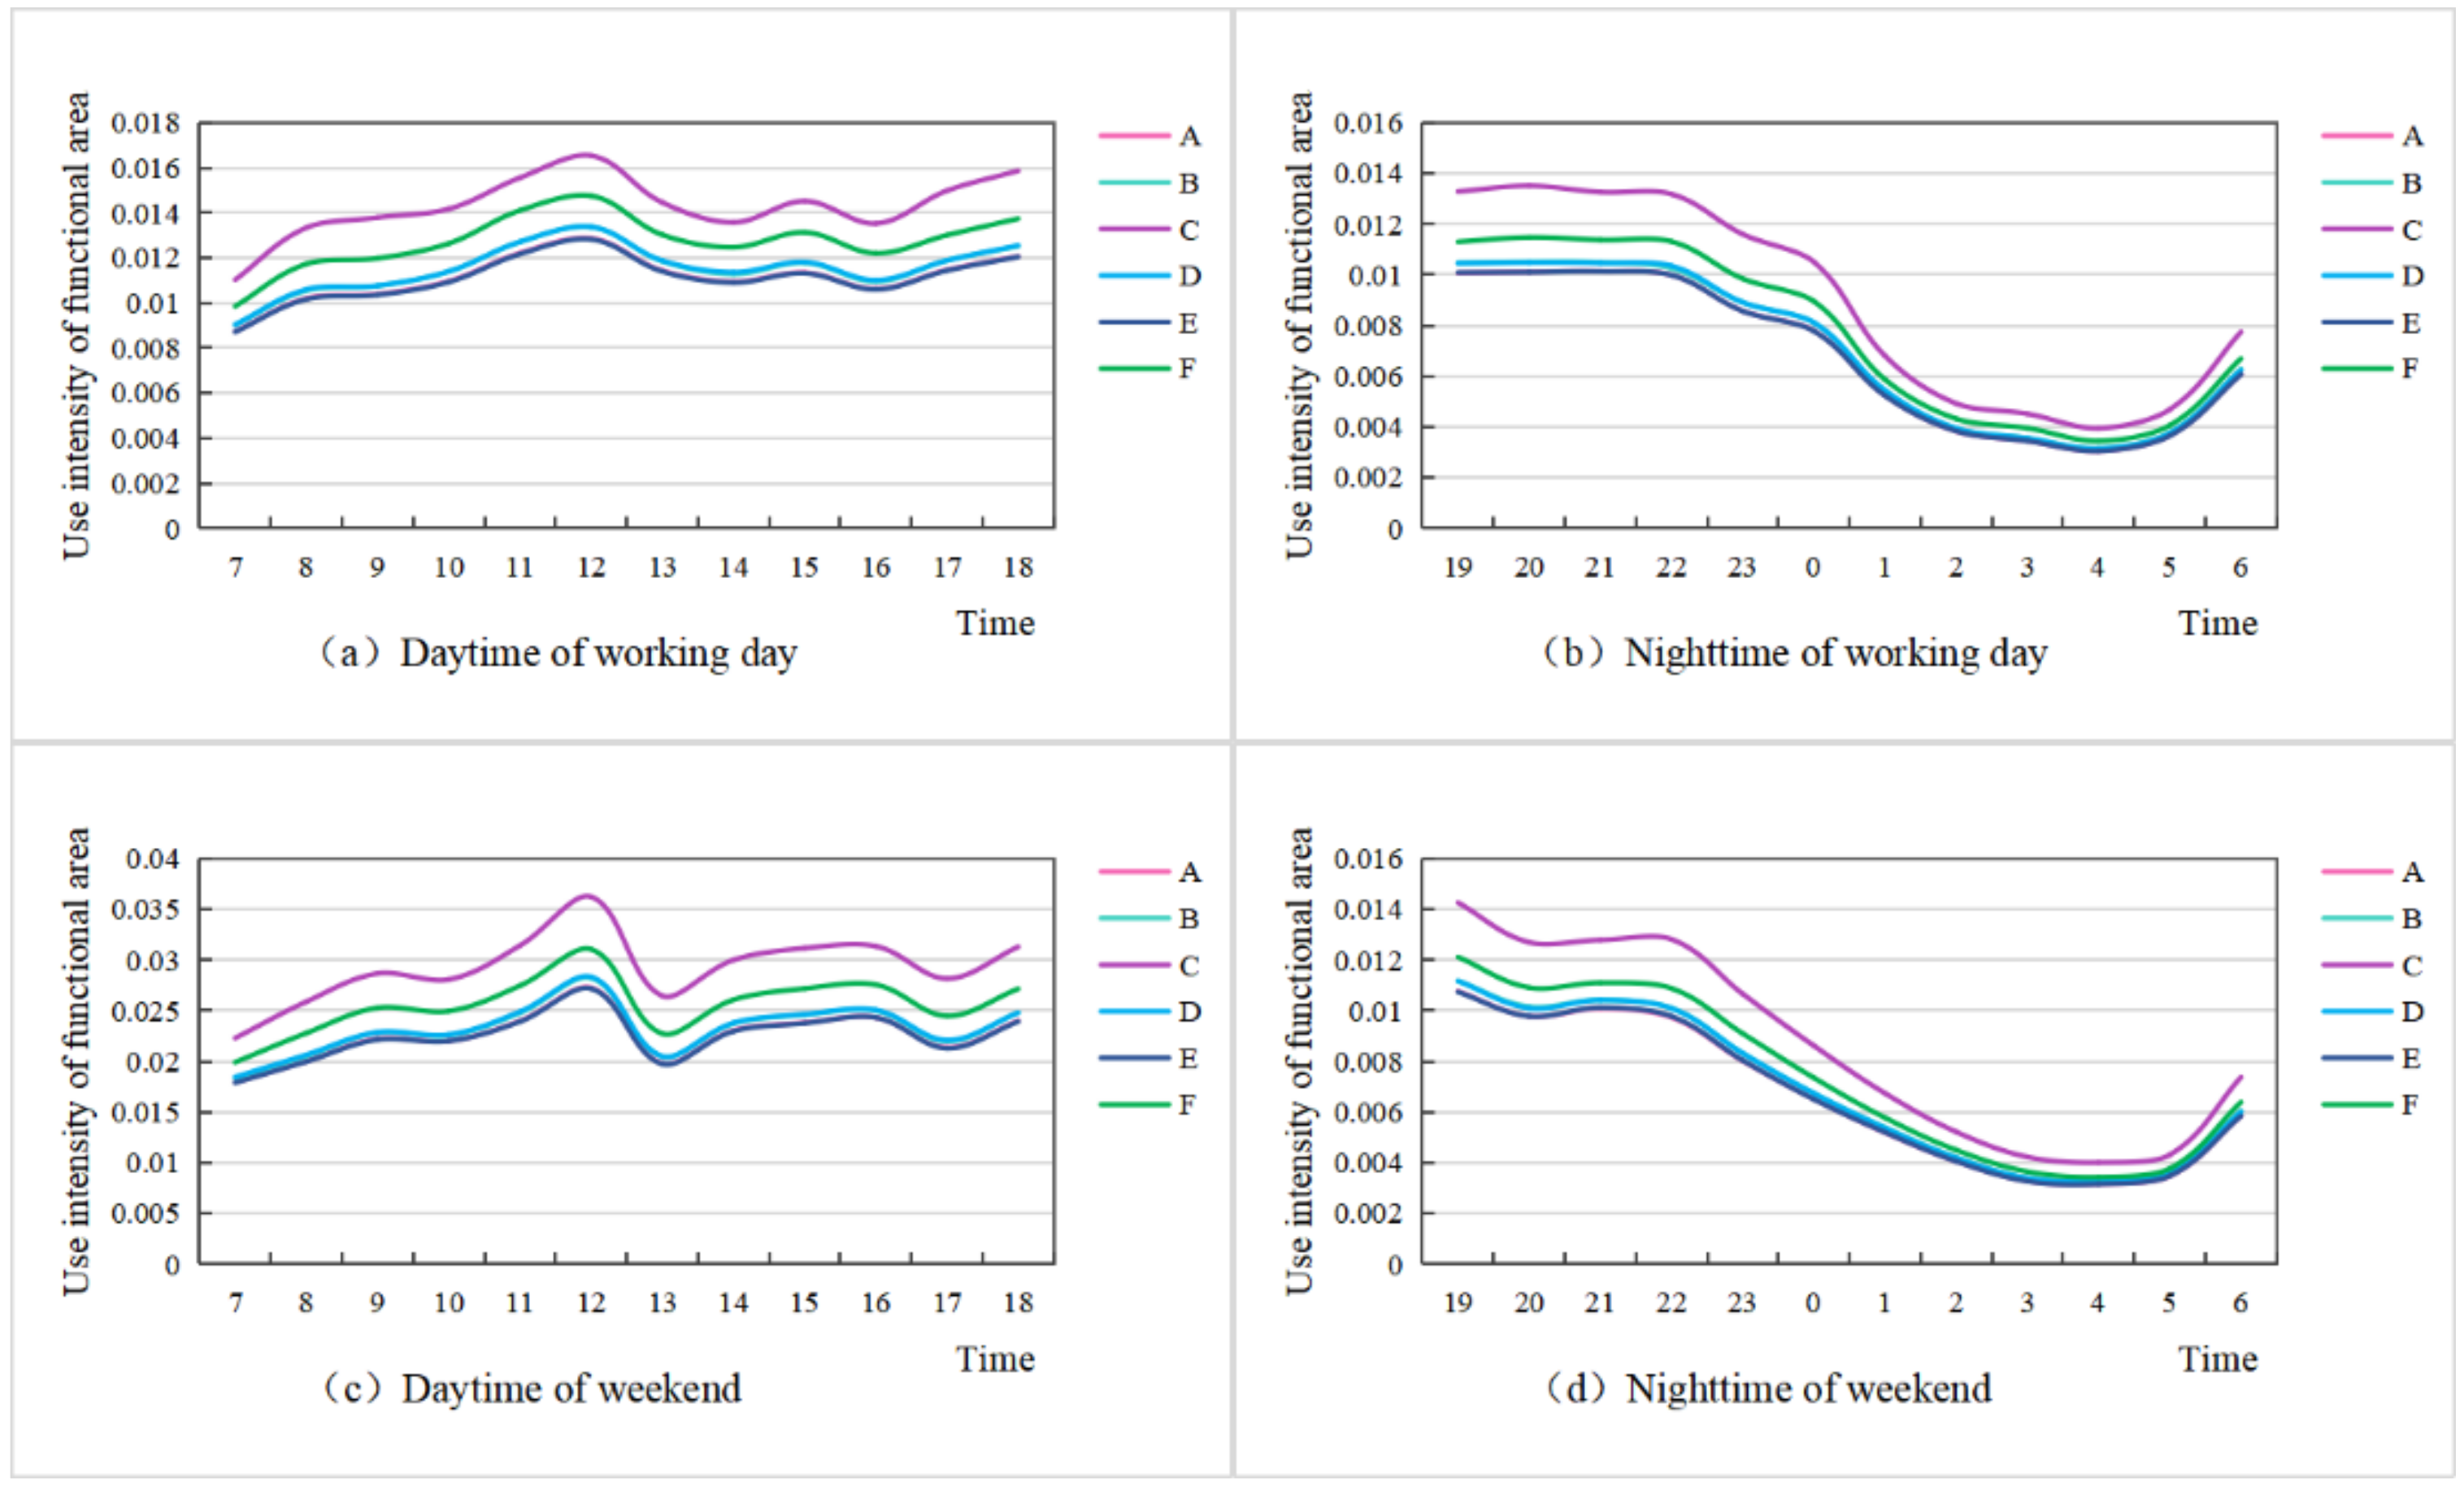
The time difference of the use intensity of various functional facilities was further analyzed.
Figure 12 presents the use intensity values of functional areas during the daytime and nighttime of workdays and weekends. The use intensity of the six types of functional facilities fluctuates greatly at 12:00 and 22:00 and is minimal at 4:00. During this time period, various functional facilities are in rest mode. Regardless of whether the day is a workday or part of the weekend, in addition to residential facilities, green space and square land facilities show the highest use intensity, thereby highlighting the tourist characteristics of Jinan City. The functional facilities with the lowest use intensity are roads and transport facilities. The maximum use intensity of functional facilities occurs at 12:00 in the daytime; however, in the weekend, the use intensity of these functional areas fluctuates greatly from 12:00 to 13:00 and generally shows a rapid decline, thereby indicating that the public has a completely different rhythmic life on workdays and weekends. In each time period studied, the difference in the use intensity of business facilities, public management and service facilities, and industrial facilities is relatively small, which indicates that the development of these three types of industries is relatively balanced. These findings collectively indicate that the urban spatial structure is related to the distribution density of service facilities but also to individuals’ temporal and spatial activity patterns.
4. Conclusions
This paper proposed a GIS-based field model for hot-spot extraction based on POI data and analyzed the use intensity of various functional areas by using Tencent location data. We also employed a generalized symmetric structure spectrum and digital field-based hierarchical geo-information Tupu to express the spatial distribution characteristics and hierarchical scale of various facility hot spots comprehensively. We then introduced a use intensity index to quantify differences in the use intensity of different functional areas between workdays and weekends and between daytime and nighttime. A refined study of these functional areas was realized from a dynamic perspective. The main findings of the study are as follows:
(1) Business facilities in Jinan are distributed in a scattered pattern without large areas of high density; green space and square land facilities are mainly distributed in Lixia District, Tianqiao District, and City Central District with high degrees of concentration; (2) the distribution of all types of functional areas presents the characteristics of “circular structures,” which form a spatial pattern of “multi-center” group and “single/mixed” functional areas; (3) the central and northern parts of Tianqiao District and the western part of Huaiyin District have low degrees of mixing and use intensity. Regardless of whether the day is a workday or part of the weekend, aside from residential facilities, green space and square land facilities have the highest use intensity, thus highlighting the tourist characteristics of Jinan City.
The above findings highlight the imbalance of development between the eastern and western regions of Jinan, and the difficulty in solving the problems left over by industrialization in the northern region. The construction of the districts of Tianqiao and Huaiyin on the basis of adhering to the development direction of “expanding from east to west, extending from south to north” could be strengthened to solve this problem. For example, in 2021, the Jinan Municipal Government proposed the building of a starting area for the conversion of new and old kinetic energy in Tianqiao District in an effort to achieve the overall coordinated and balanced development of the region. The planning direction also verifies the accuracy of the results of this study. The results of the present research show that the distribution of road and transport facilities in the study area is relatively concentrated and that high-value hot spots are mostly distributed in the central area. However, existing studies have shown that the central area is the core area of traffic congestion and is generally characterized by poor traffic mobility [
34,
35]. The urban traffic mobility system determines the spatial development pattern of urban frameworks and functional facilities [
36,
37]. Therefore, the government should rationally design traffic routes and develop a comprehensive traffic mobility system based on the city’s unique topography and economic development characteristics; such a system could relieve the traffic pressure in the central region while strengthening progress in the surrounding areas of the city. The construction of regional functional facilities could include urban subcenters and fringe city clusters so that the distribution of urban space facilities is better balanced. In addition, the government should make full use of the accessibility of traffic lines to link various urban functional facilities closely and expand new urban areas. The above measures can promote the balanced development of urban areas, rationalize the urban spatial structure and organizational layout, optimize the spatial layout of urban functional facilities, improve traffic congestion, and promote the sustainable and healthy development of the city.
In summary, this paper discovered a large potential development space in some areas of the research area coinciding with the current regional planning policy of Jinan. As such, this research has important reference value for urban area development and planning. However, because of limited data accuracy and richness, the research and data processing methods may still be improved. For example, the weight value of various facilities directly represents the accuracy of functional areas. In future work, we will develop methods based on natural language to process POI data to endow our functional area recognition and refinement research with greater objectivity and accuracy.


