2.1 Structure of SAPPA
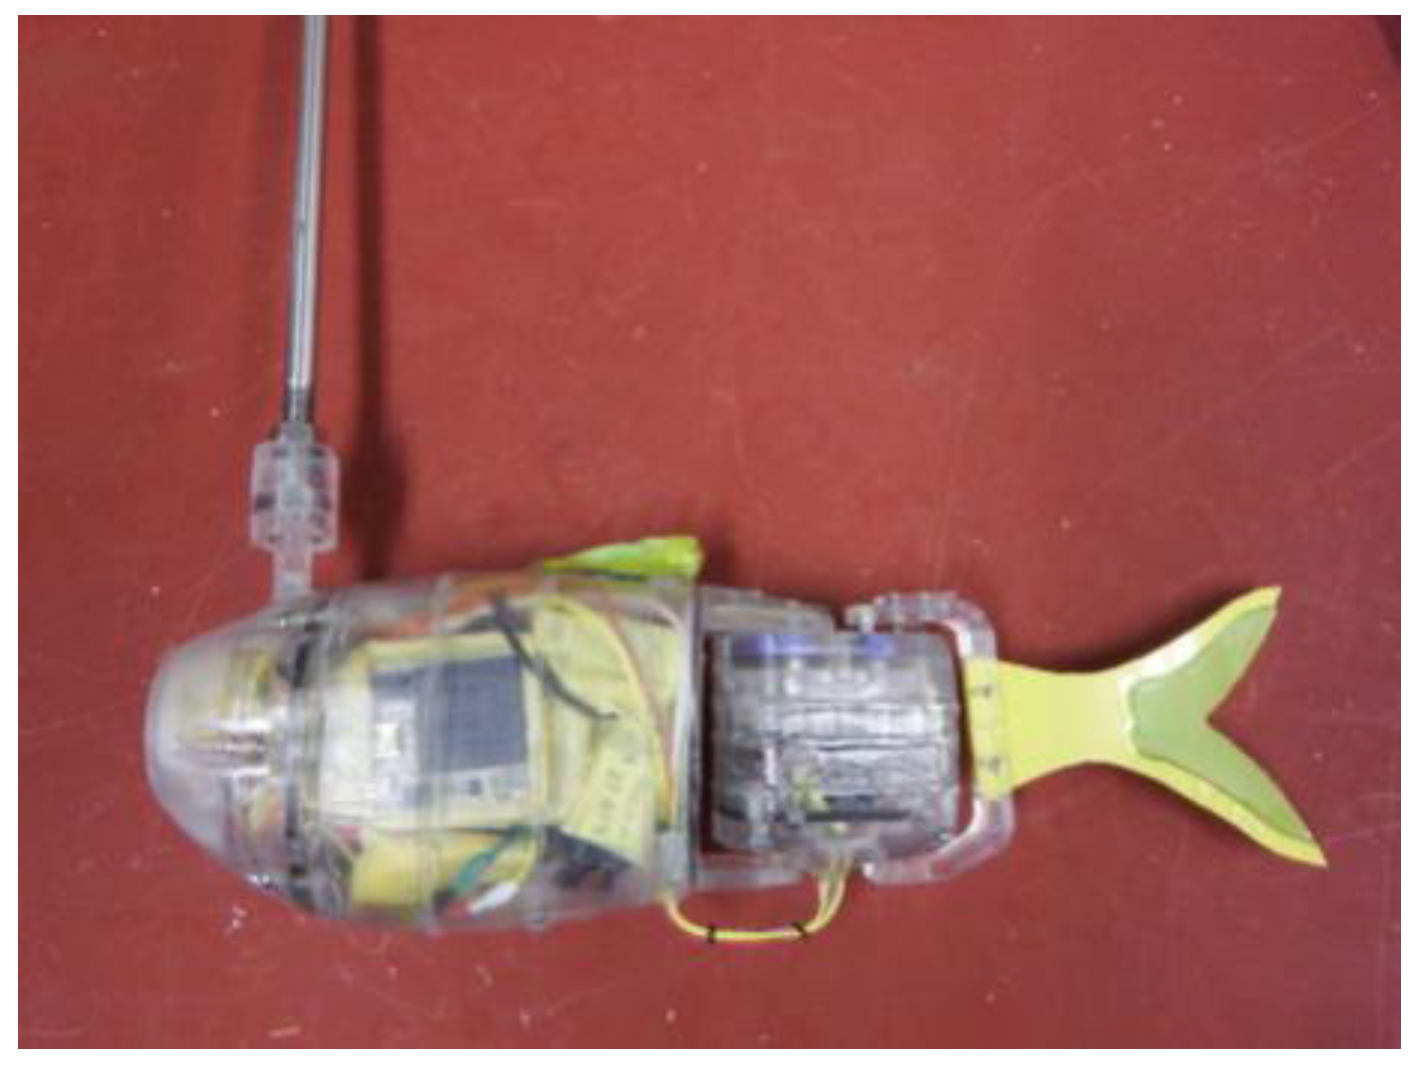
Figure 1 shows a photograph of SAPPA, and a schematic of its internal structure is shown in
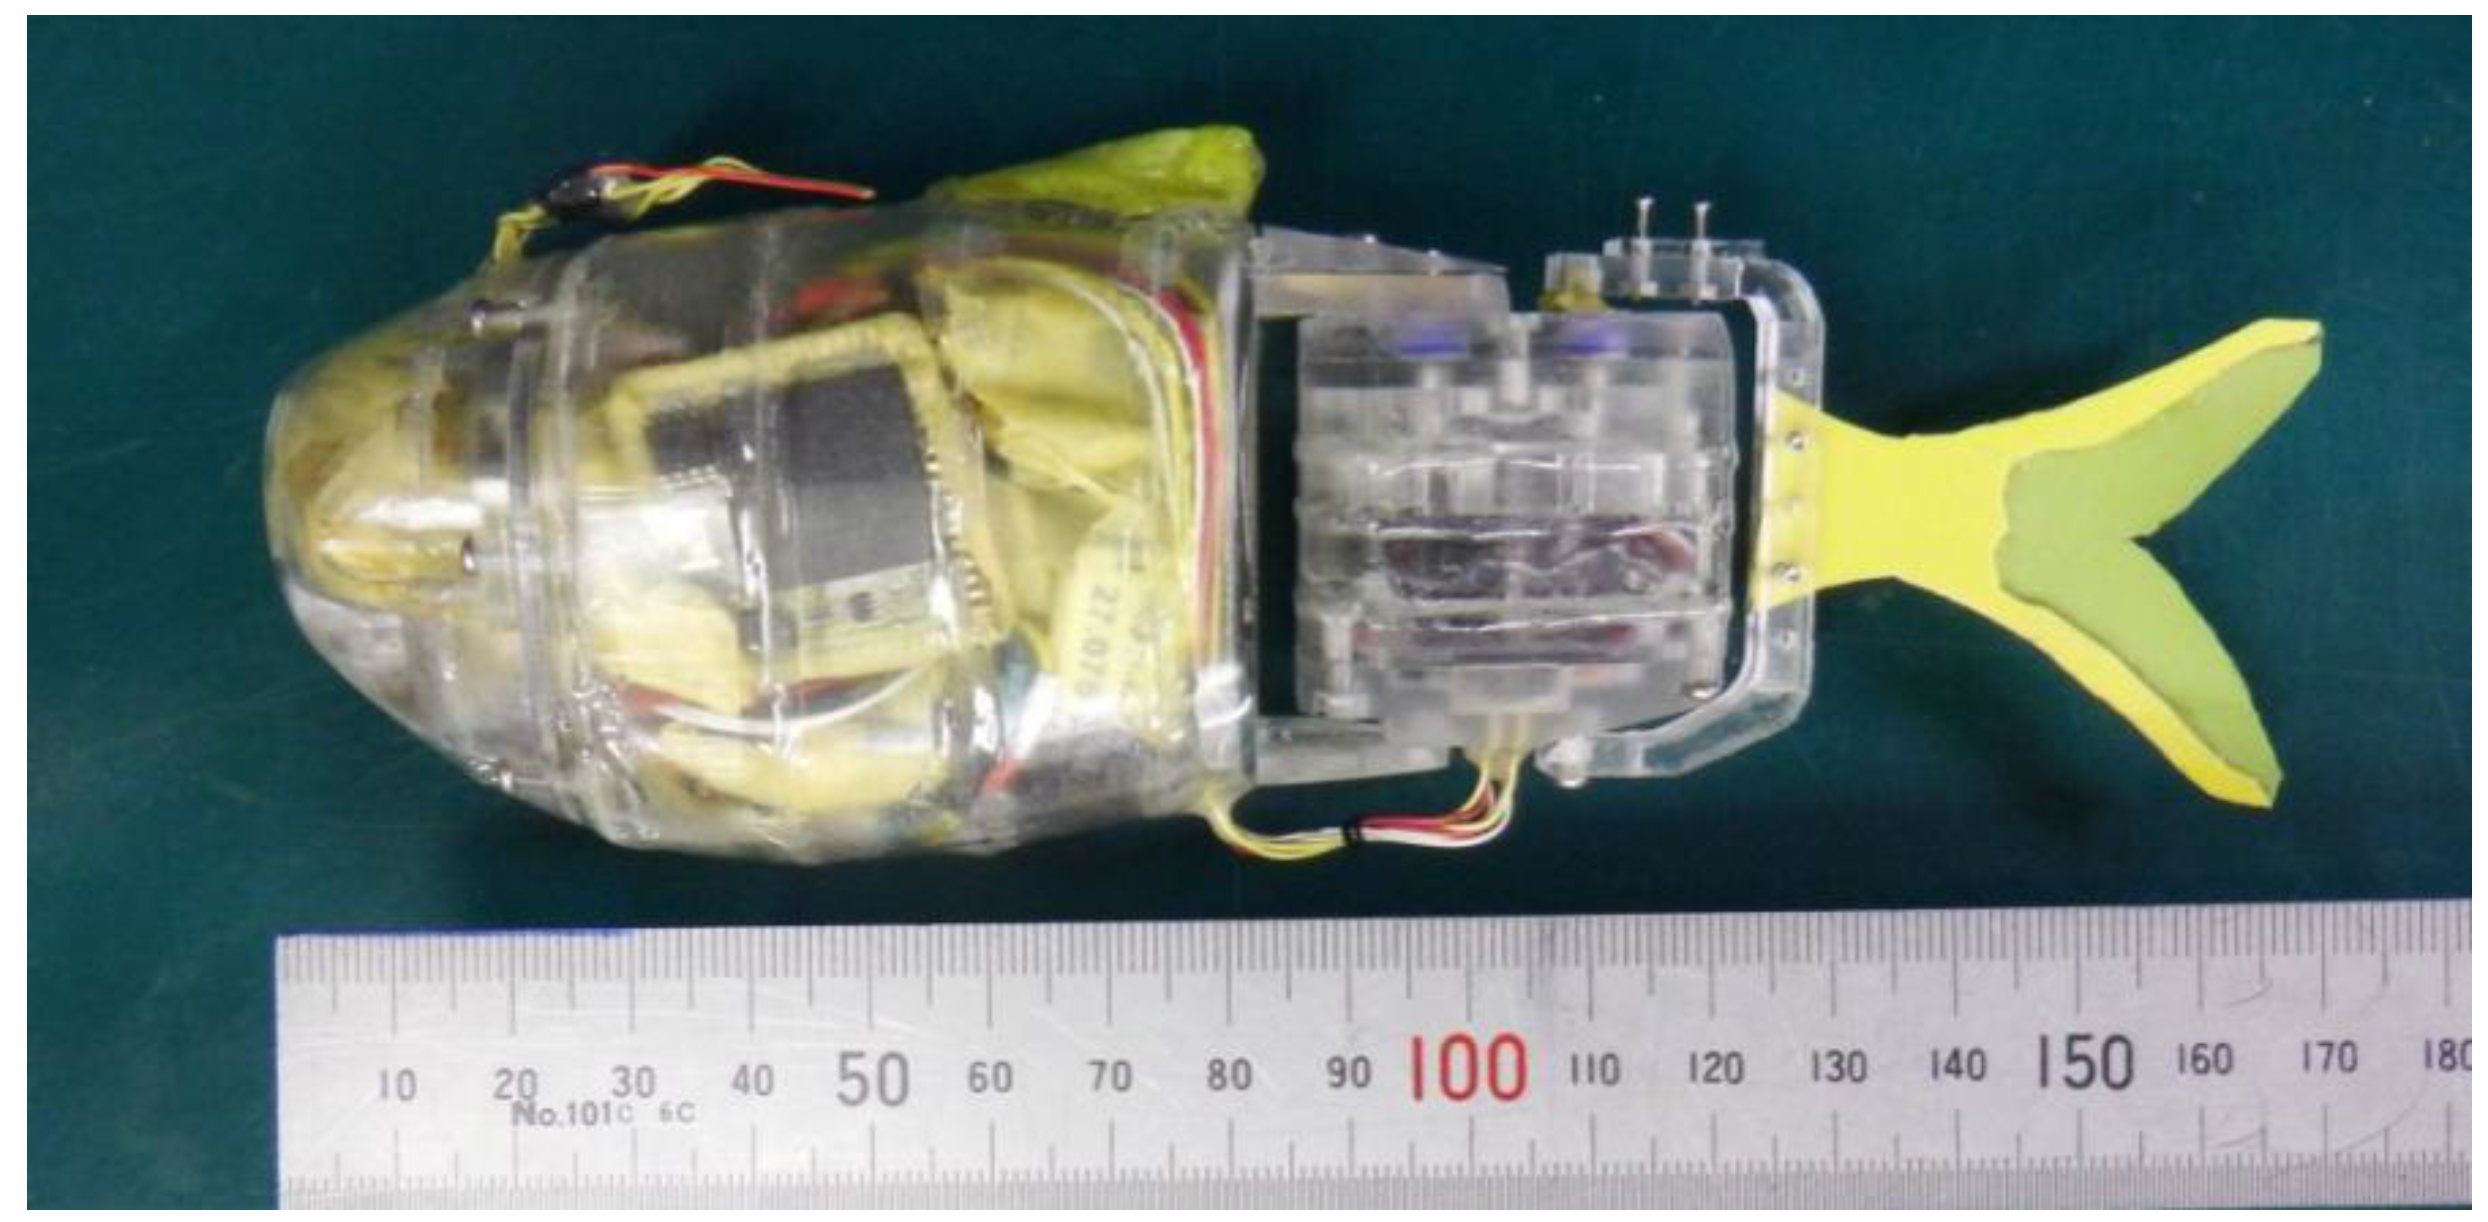
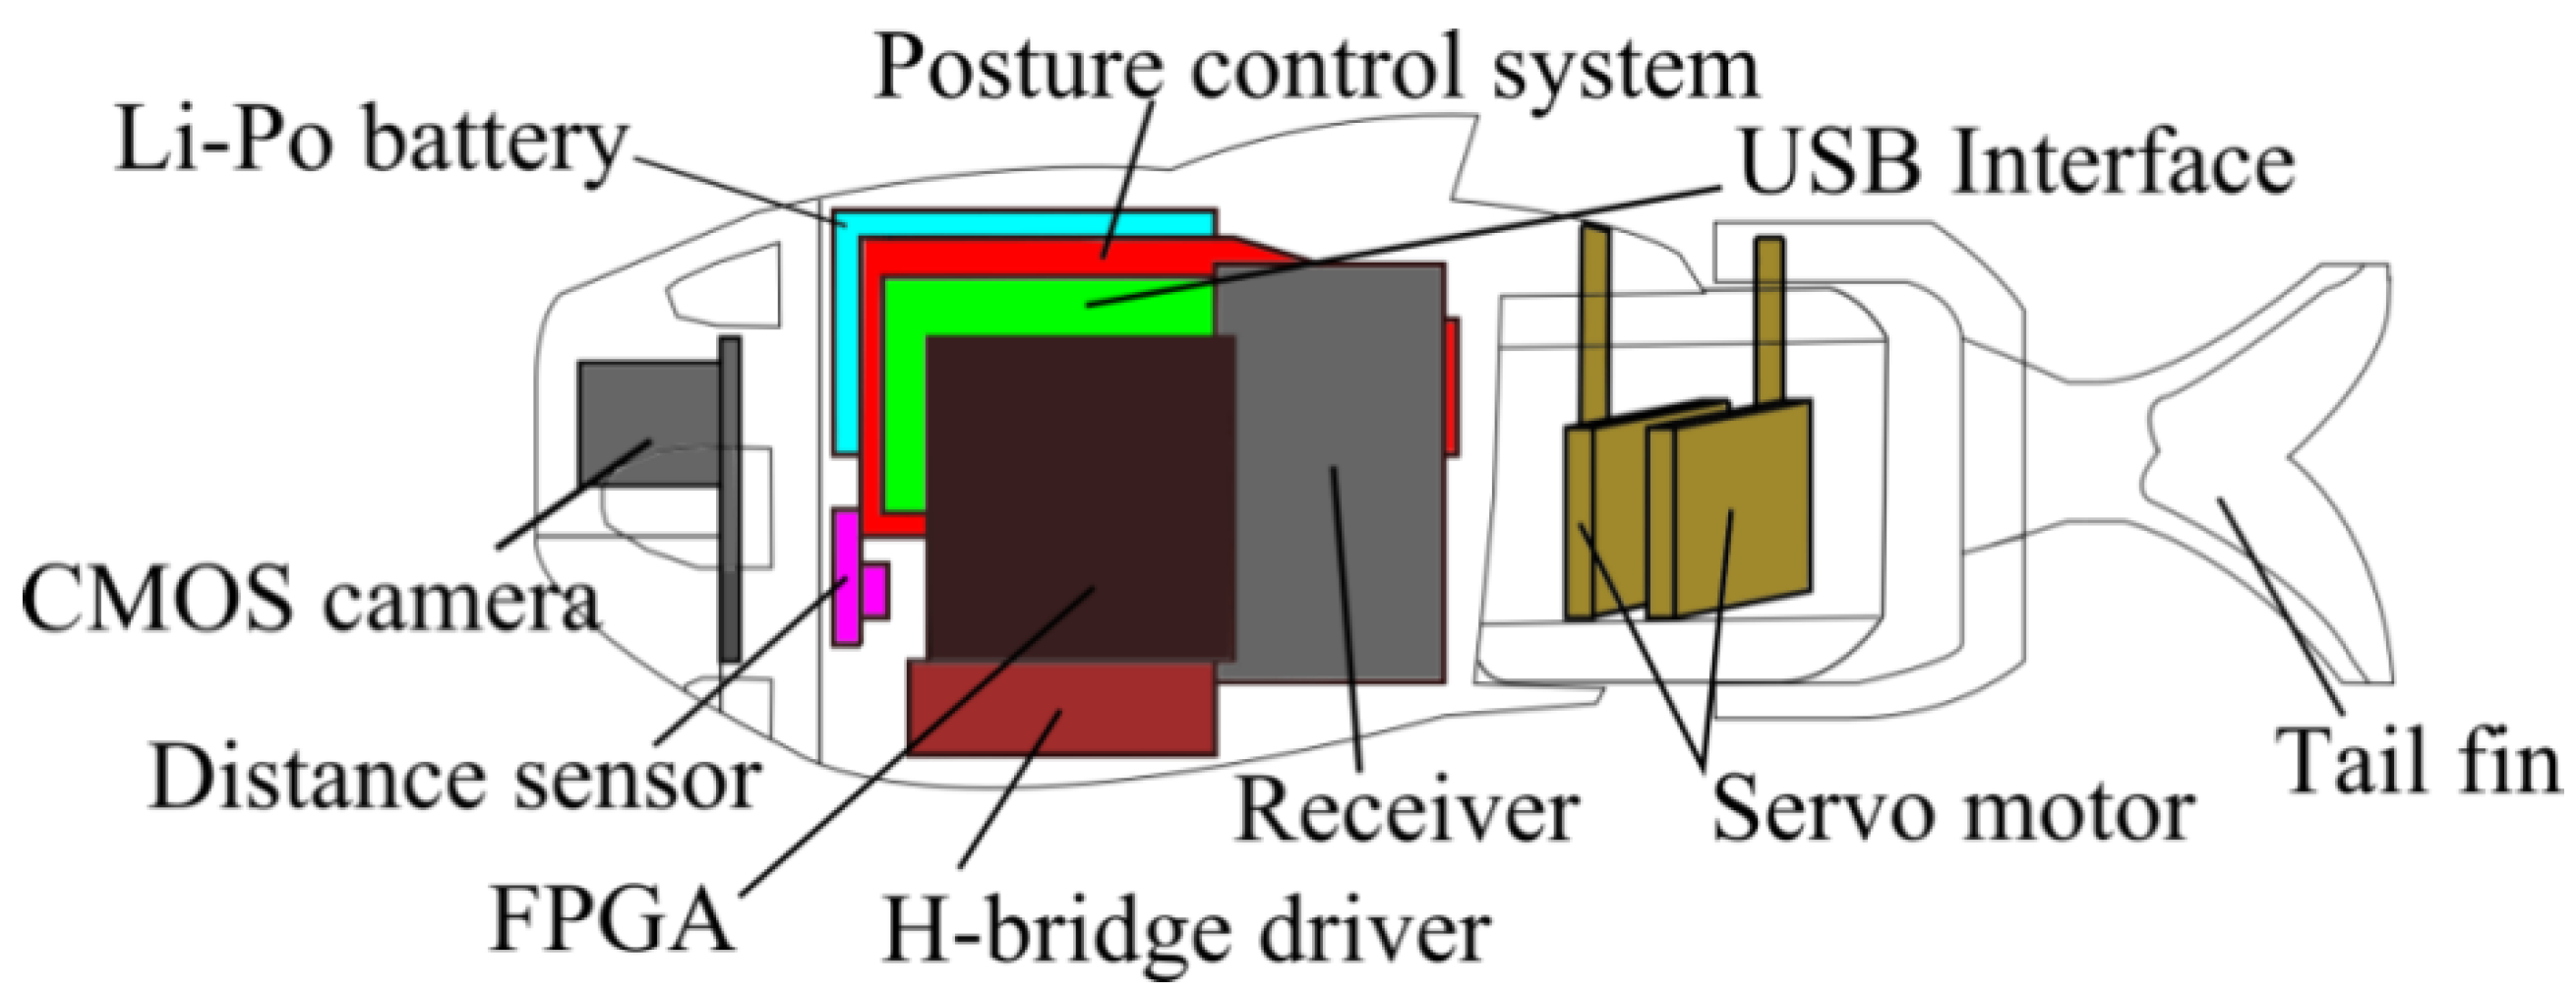
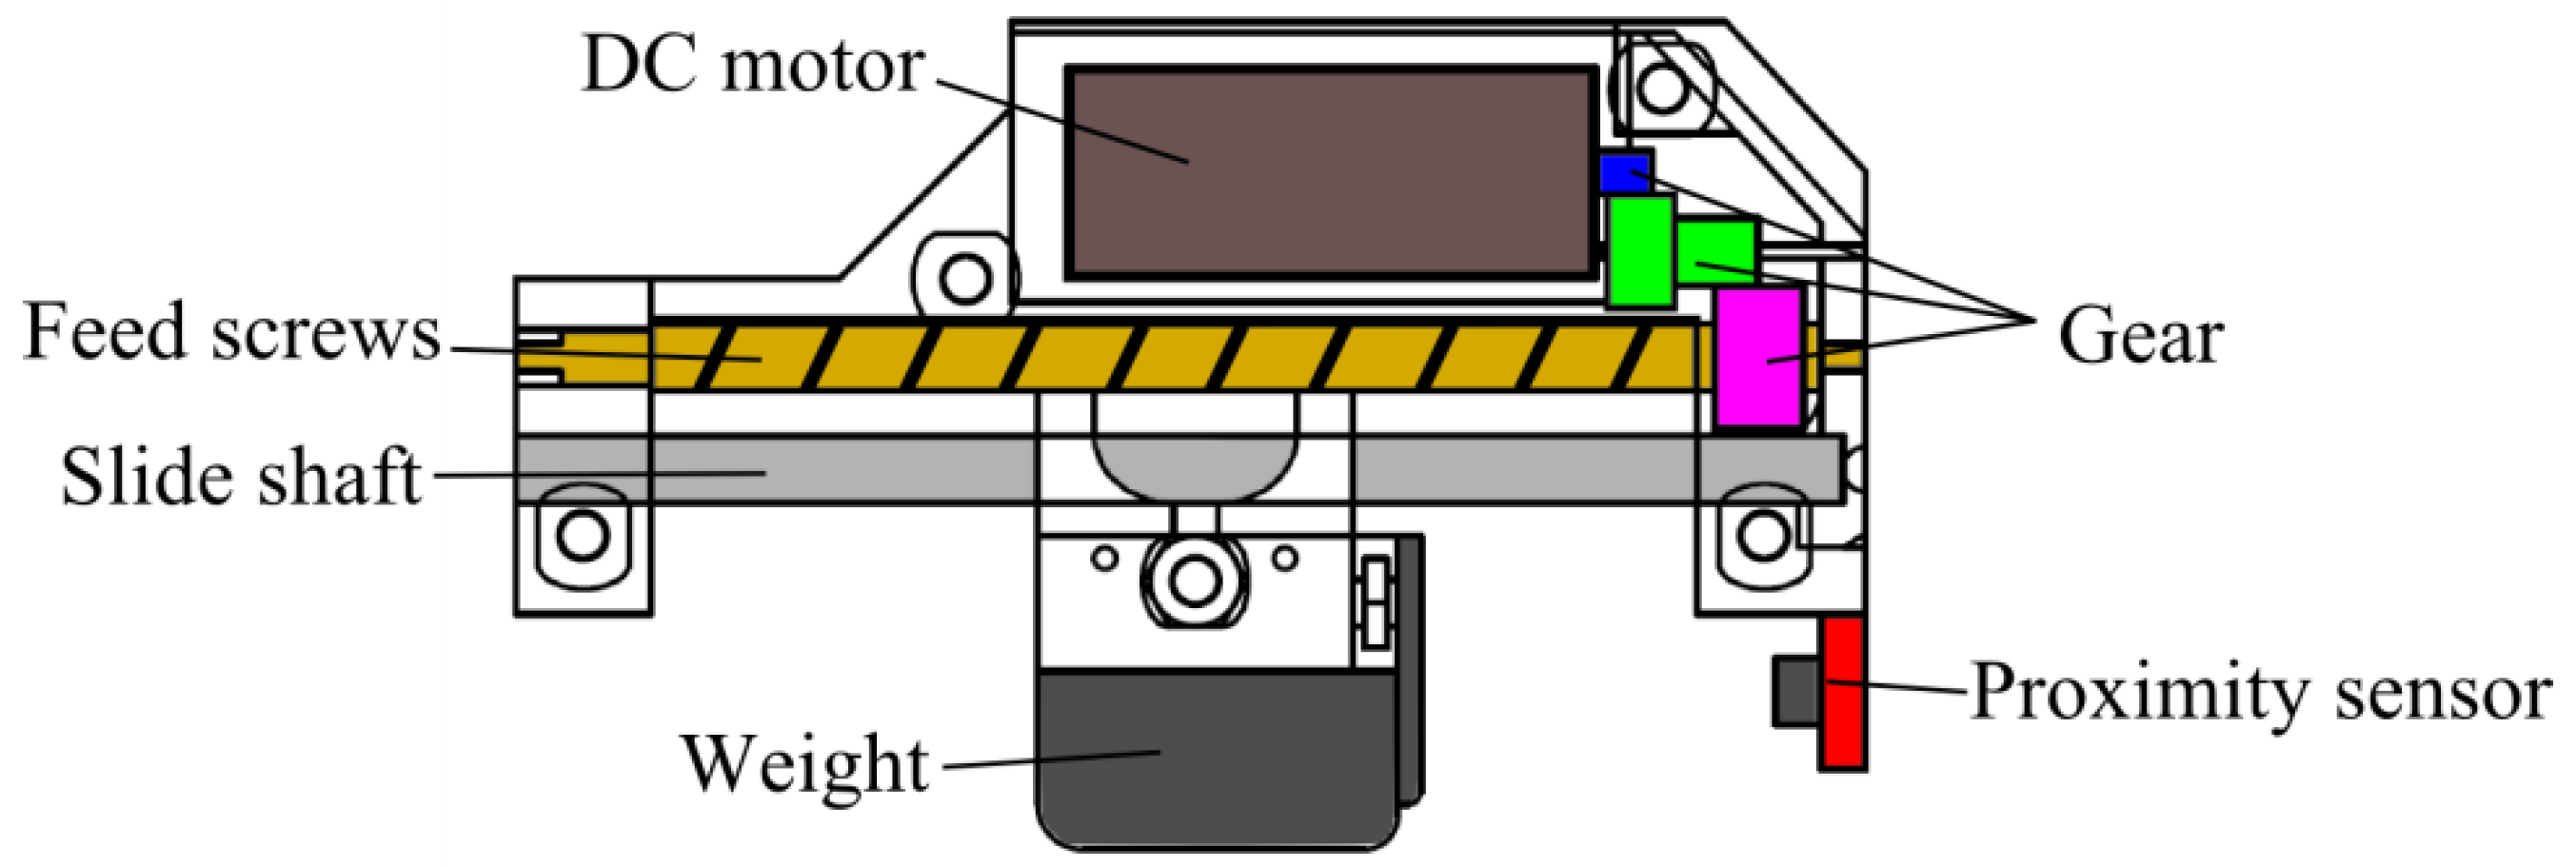
Figure 2. It has a total length of 170 mm, a height of 65 mm, a width of 40 mm, and a weight of 140 g as determined by aerial gravimetry. Its outer shell is constructed from acrylic parts. The tail fin is connected to the main body by a two-joint driving mechanism containing two servomotors (Nine Eagles, NE-53070017, Shanghai, China). The driving force produced by each motor moves the tail fin from side to side. Since a real fish can move upwards or downwards by changing its direction of travel, the robot has a posture control system to change its direction of propulsion, as shown schematically in
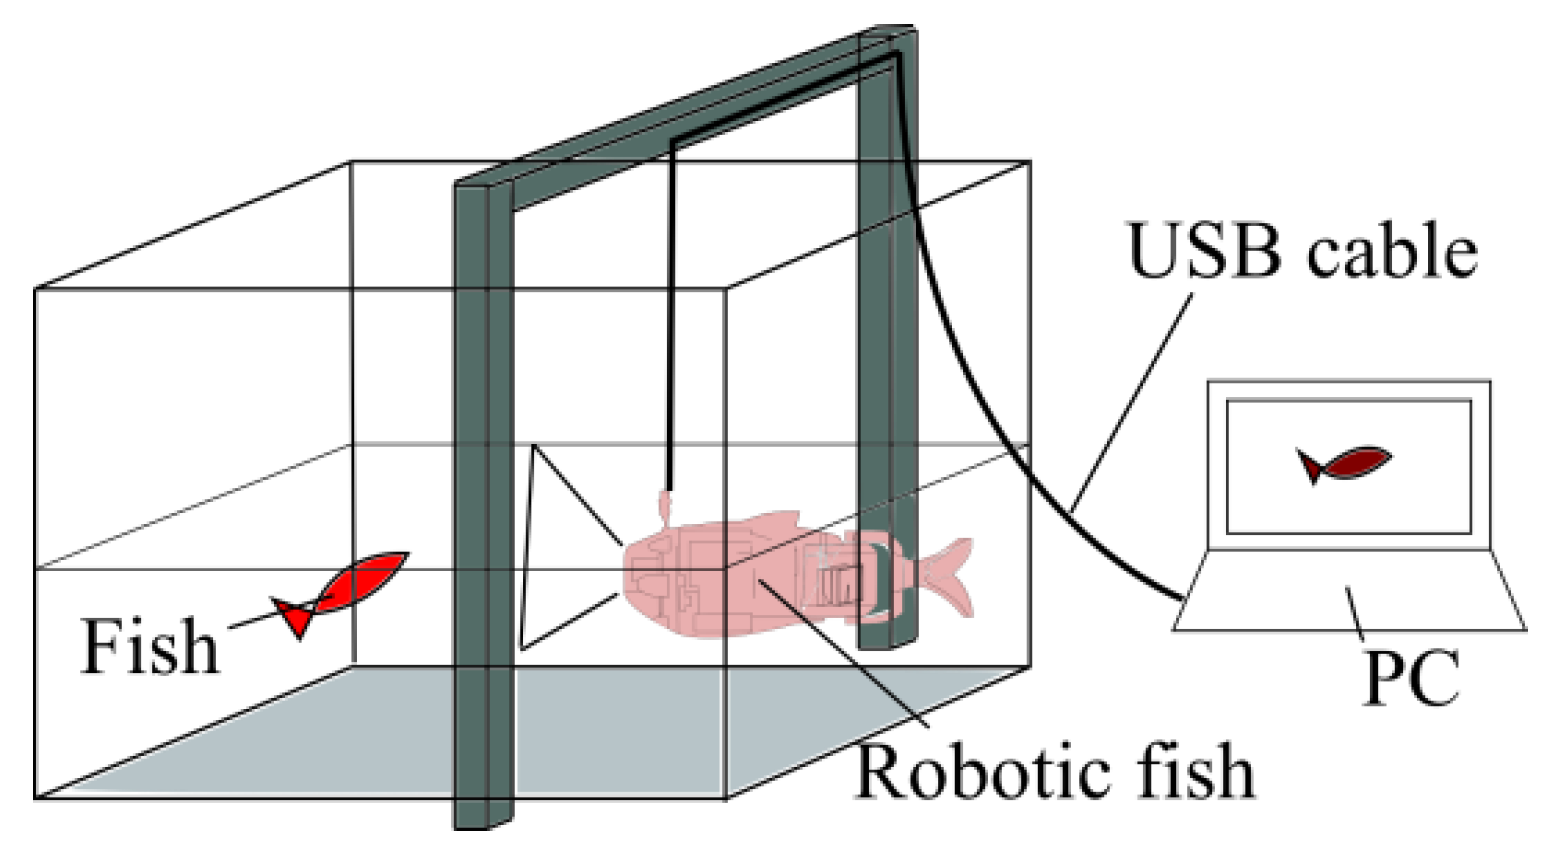
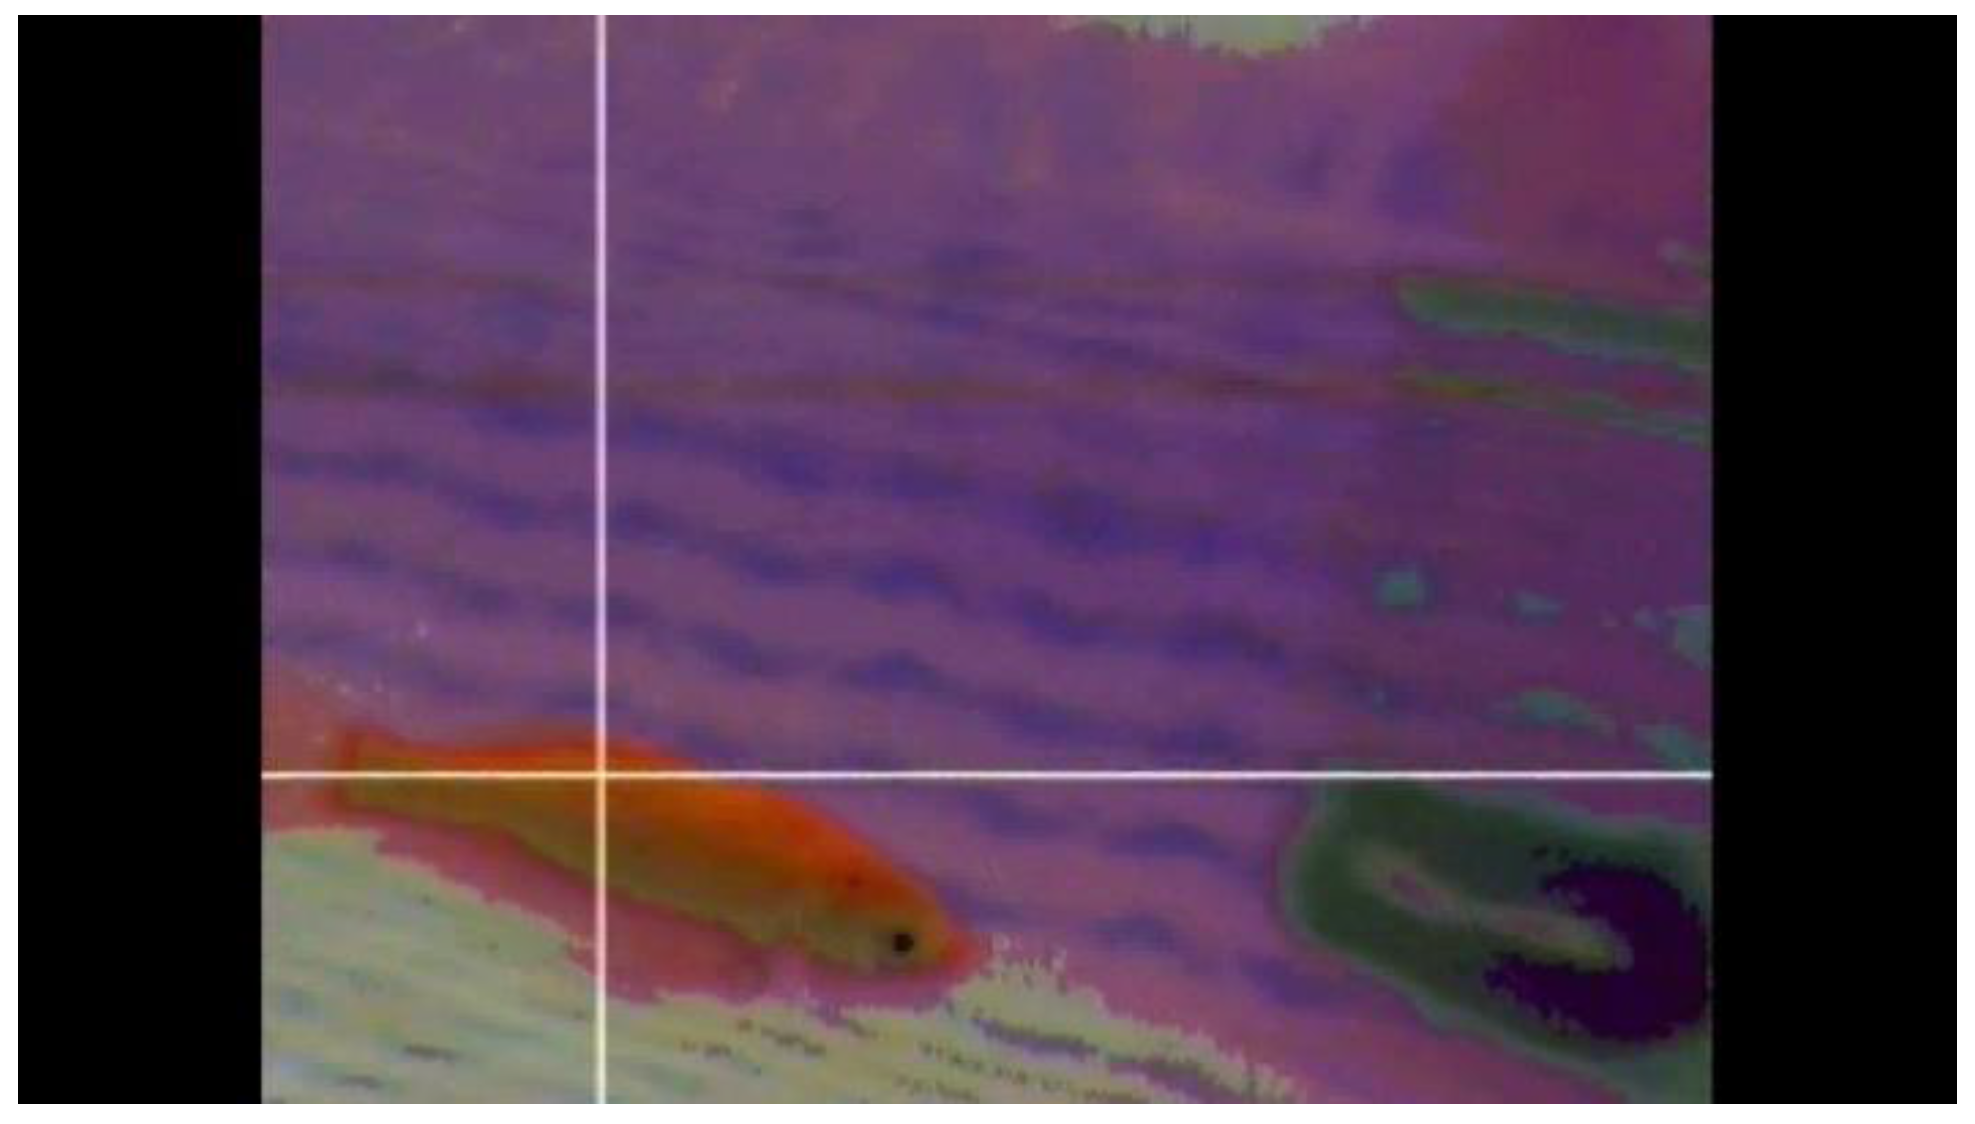
Figure 3. A weight is moved by a DC motor, and the position of the weight is measured with a proximity sensor (AsakusaGiken, AS-PROX, Chiba, Japan) to control the center of gravity of the robot. When the weight moves forward, the robot swims downwards, and when it moves backward, the robot swims upwards. The robot has an RGB CMOS camera (NIPPON CHEMI-CON, NCM03-S, Tokyo, Japan) in its head to take pictures of red goldfish, and a USB interface to connect to a PC in order to check the images.
Figure 1.
Robotic fish SAPPA (BL = 170 mm).
Figure 1.
Robotic fish SAPPA (BL = 170 mm).
Figure 2.
Structure of SAPPA.
Figure 2.
Structure of SAPPA.
Figure 3.
Posture control system for changing depth.
Figure 3.
Posture control system for changing depth.
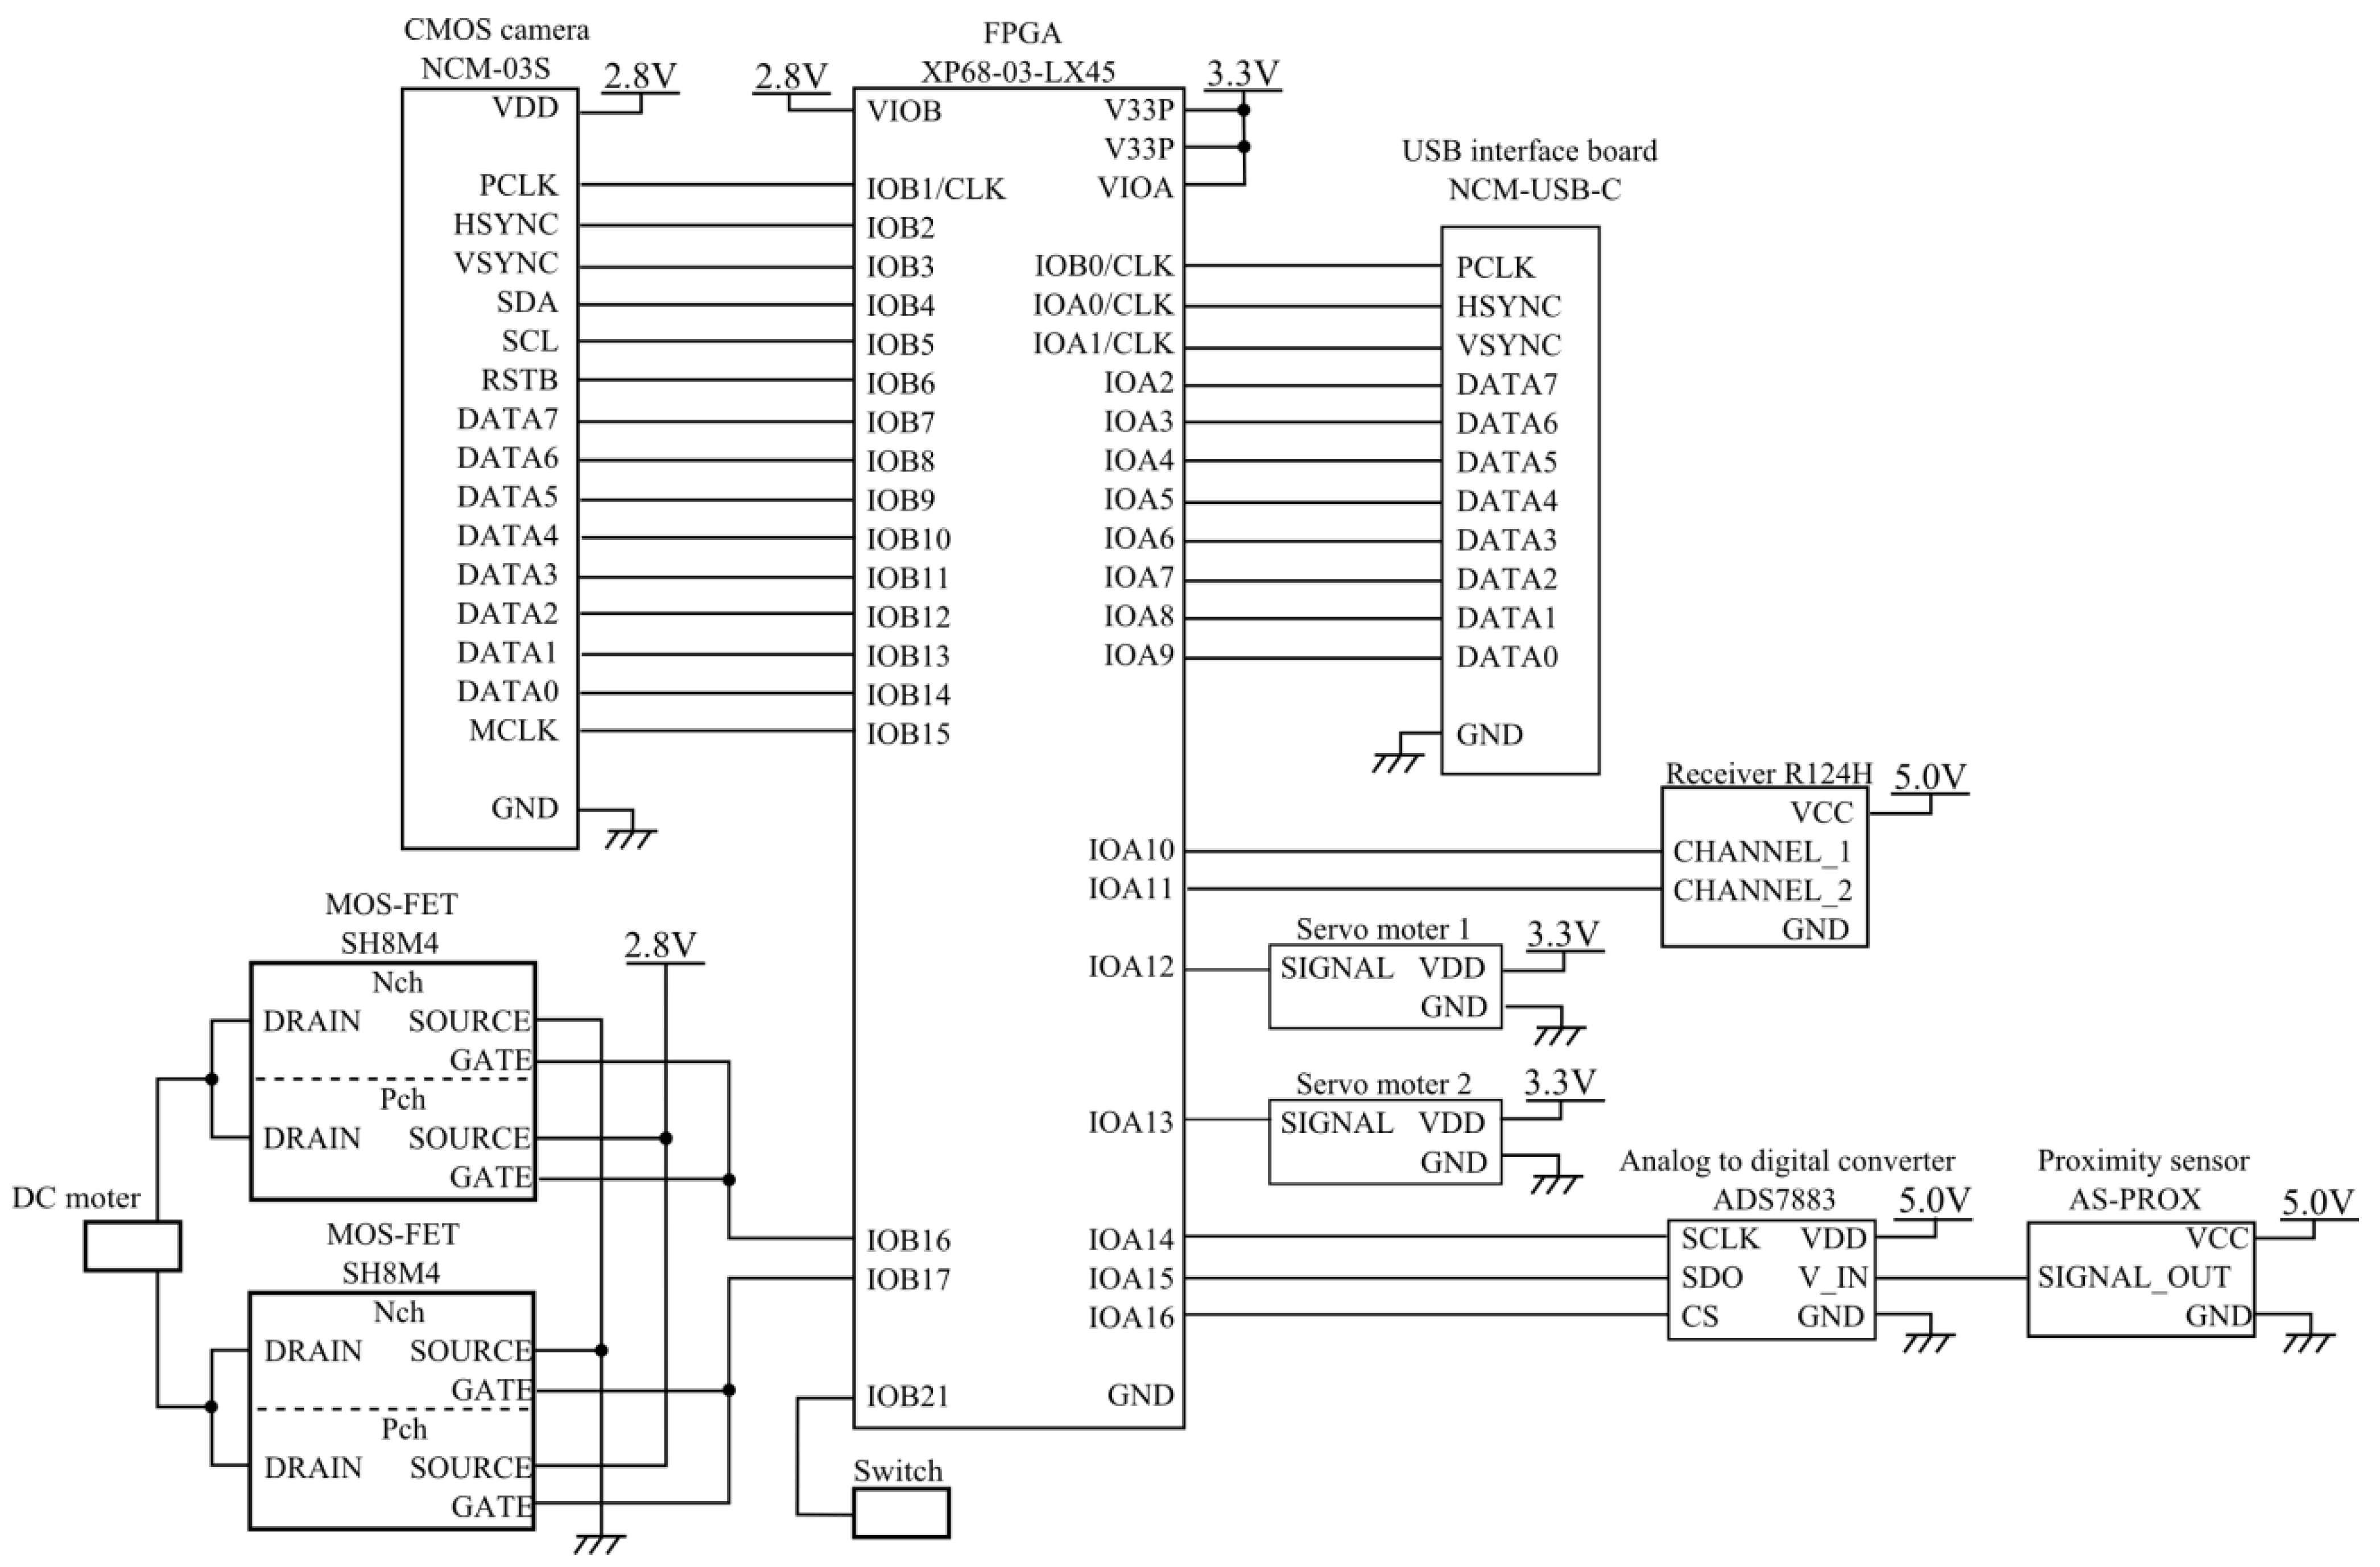
A lithium polymer battery (3.7 V, 240 mAh) is used as the electric power source. In order to remote control SAPPA, the robot is equipped with a receiver (Futaba, R124H, Chiba, Japan). The receiver has a range of up to 3 m. Commands to control and perform image processing are issued by a field-programmable gate array (FPGA) board (HUMANDATA, XP68-04-LX45, Osaka, Japan) containing a Spartan-6 XP68-03-LX45 (Xilinx).
A circuit diagram of the electronic system is shown in
Figure 4. Data from the RGB camera (DATA0 to DATA7) are received from the input terminals (IOB14 to IOB7). The data are analyzed in the FPGA and the output signals are sent to the USB interface board via the output terminals (IOA9 to IOA2). The tail fin is driven by Servo motor 1 and Servo motor 2. The weight in the posture control system is driven by the DC motor and power MOSFET circuit.
Figure 4.
Circuit diagram for SAPPA.
Figure 4.
Circuit diagram for SAPPA.
Figure 5.
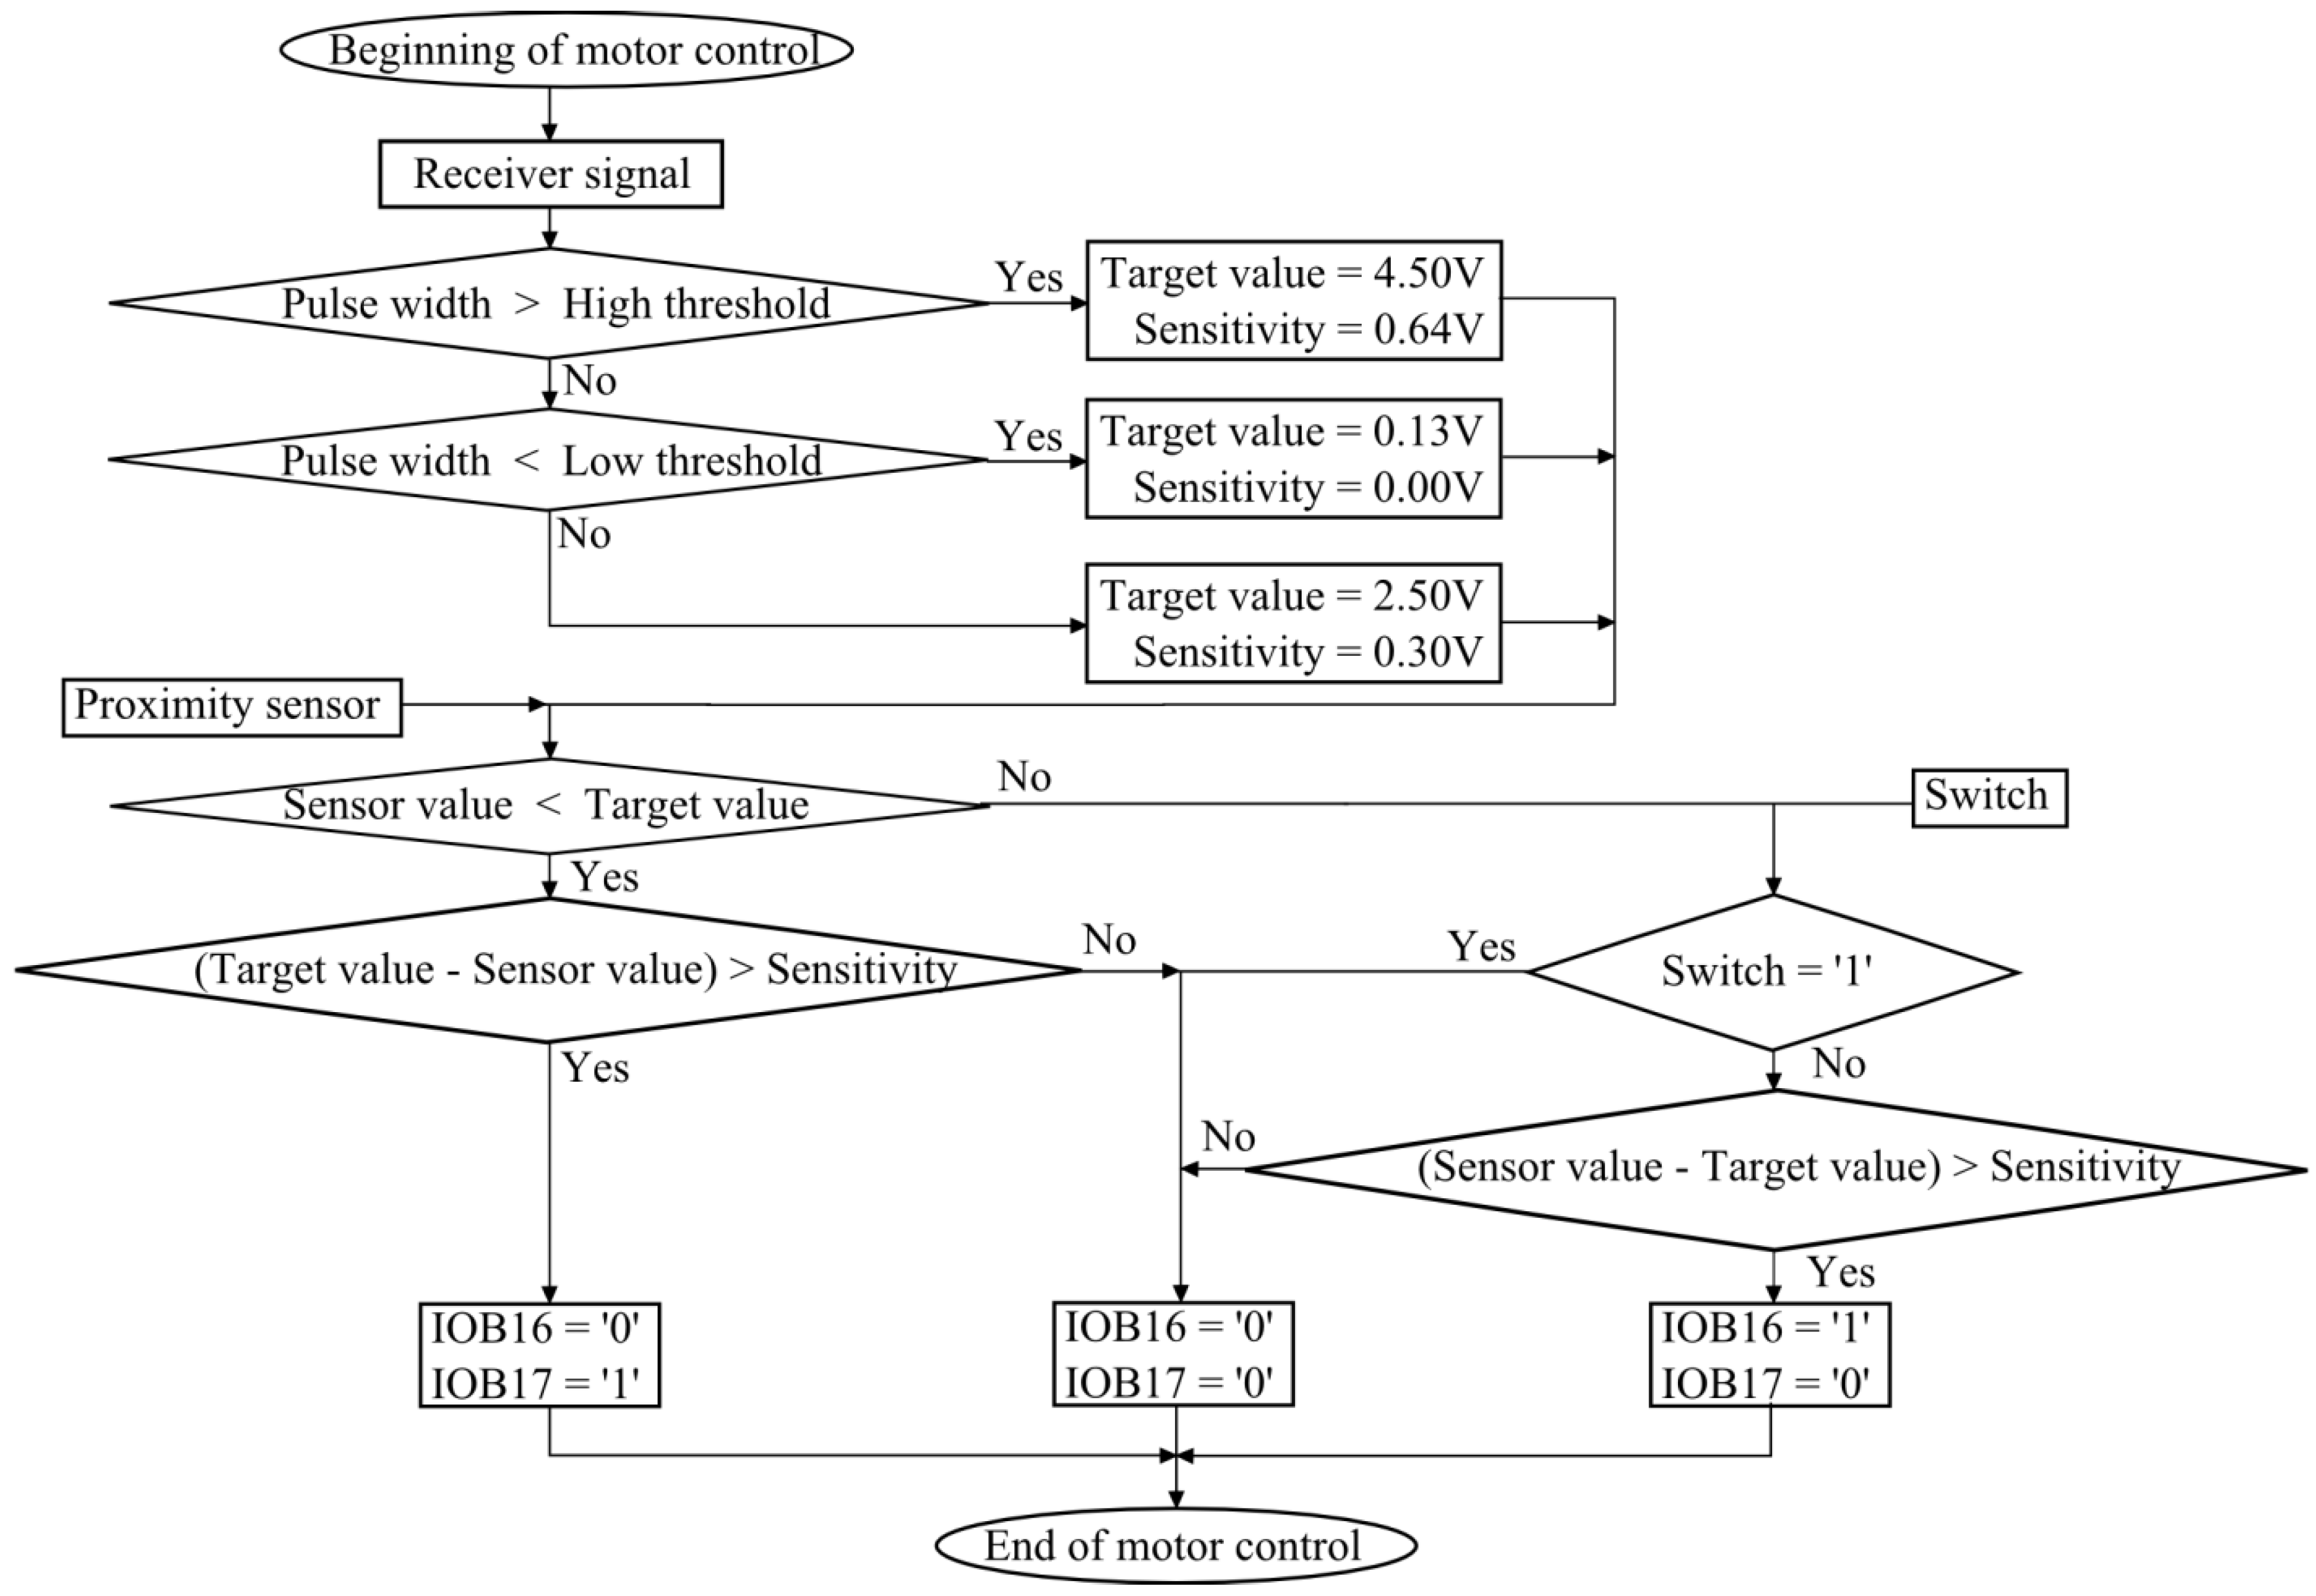
Control flowchart of posture control system.
Figure 5.
Control flowchart of posture control system.
SAPPA can change its altitude to move upwards or downwards by a posture control system. The posture control system is equipped with a weight and a DC motor which moves the weight back and forth. The weight position changes the center of gravity.
Figure 5 shows the flowchart to control the DC motor in the posture control system. The position of the weight is measured with a proximity sensor. An analog-digital conversion element (Texas Instruments Japan Limited, ADS7883, 12 bit, 3 MS/s, Tokyo, Japan) receives a signal from the proximity sensor and converts the analog signal to a digital signal. The FPGA compares the value of the digital signal and a target value. According to the difference of these values, the FPGA determines a signal to control the DC motor. The way to control the DC motor is ON or OFF. To avoid the vibration of the weight, a parameter concerning the sensitivity for the difference of the proximity sensor value is prepared in the VHDL code. Here, the target value and sensitivity are determined three ways according to the signal received from the receiver;
- (1)
Target value is 4.50 V and sensitivity is 0.64 V,
- (2)
Target value is 0.25 V and sensitivity is 0.30 V,
- (3)
Target value is 0.13 V and sensitivity is 0.00 V.
The ON or OFF position of the motor is determined according to these target value and the value of the proximity sensor through the flowchart shown in
Figure 5. When IOB16 = “0” and IOB17 = “1”, the weight moves forward. Then when IOB16 = “1” and IOB17 = “0”, the weight moves back. If IOB16 and IOB17 are “0”, then the weight does not move.
2.2 Swimming Experiments
In order to investigate the propulsive performance of SAPPA, a pool was prepared to conduct swimming experiments. The pool was 2390 mm long, 1500 mm wide, and 580 mm deep (the water depth was 250 mm).
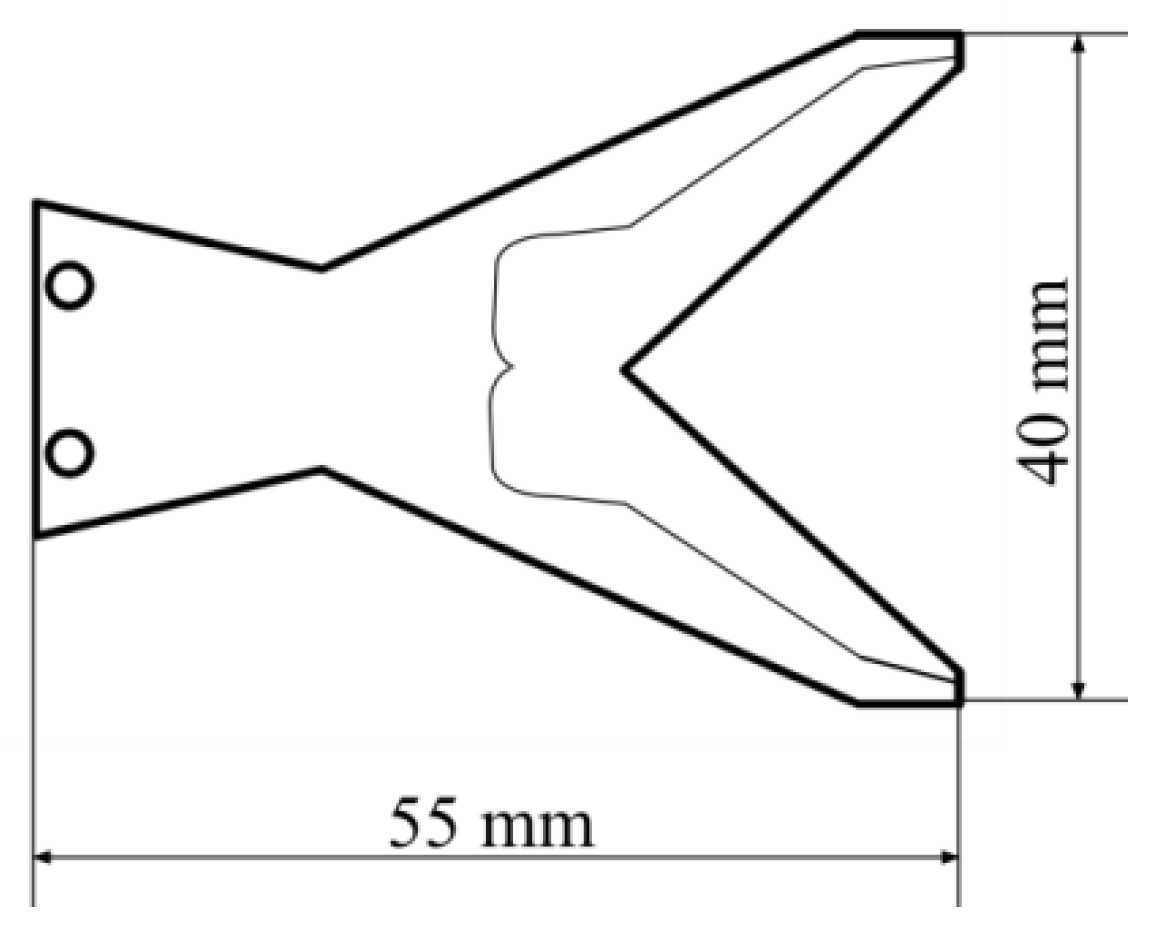
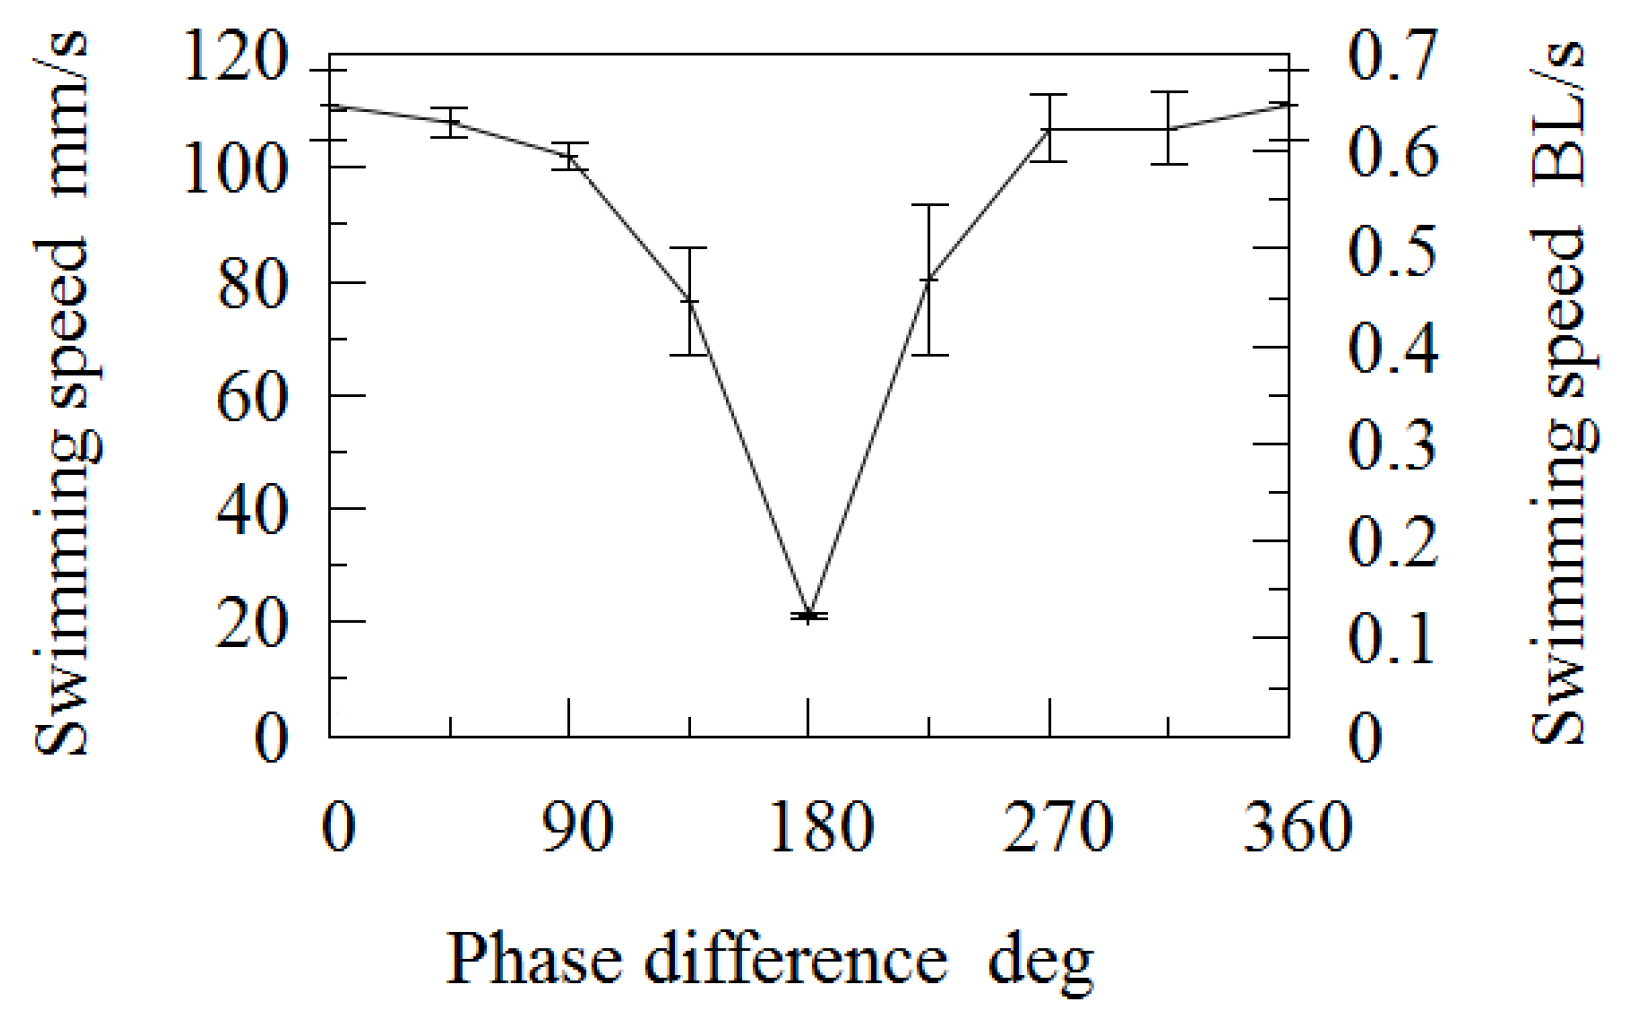
Figure 6 shows a schematic of the tail of the robot, which was constructed from polypropylene (thickness: 0.5 mm) and natural rubber (thickness: 0.3 mm). In the experiment, the phase difference between the angles of the two servomotors was varied in steps of 45°. Since the robot requires a certain distance to reach full speed, it was allowed to swim for 1000 mm, and then the time taken for it to swim a further 500 mm was measured. This experiment was conducted six times for each phase difference, and the average speed was obtained, as shown in
Figure 7. The vertical axis of
Figure 7 on the left and right side show measurements in mm/s and BL/s, respectively. The maximum speed was 0.653 BL/s (111 mm/s) for a phase difference of 0°.
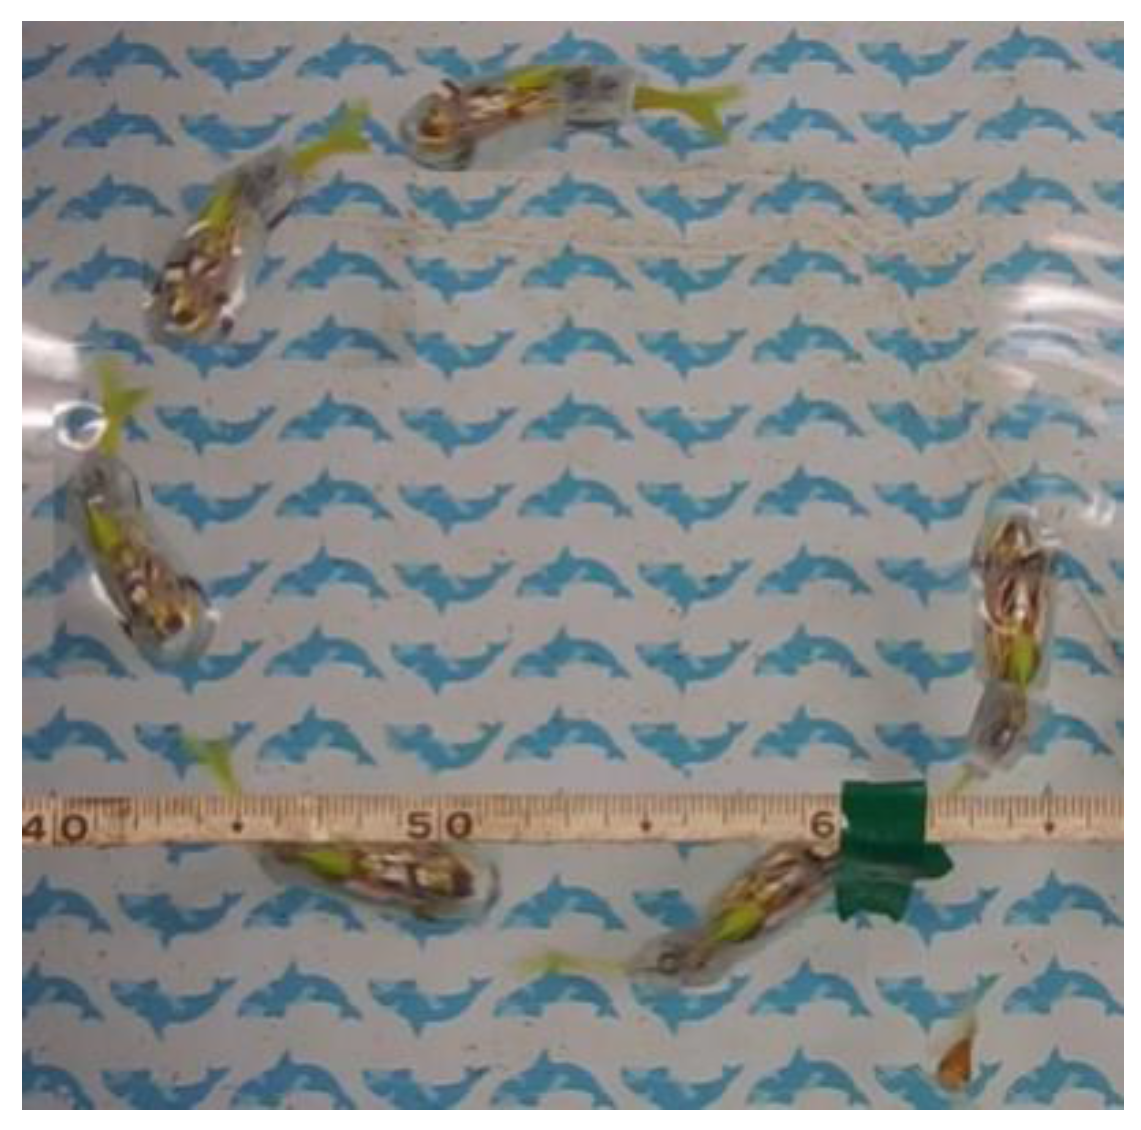
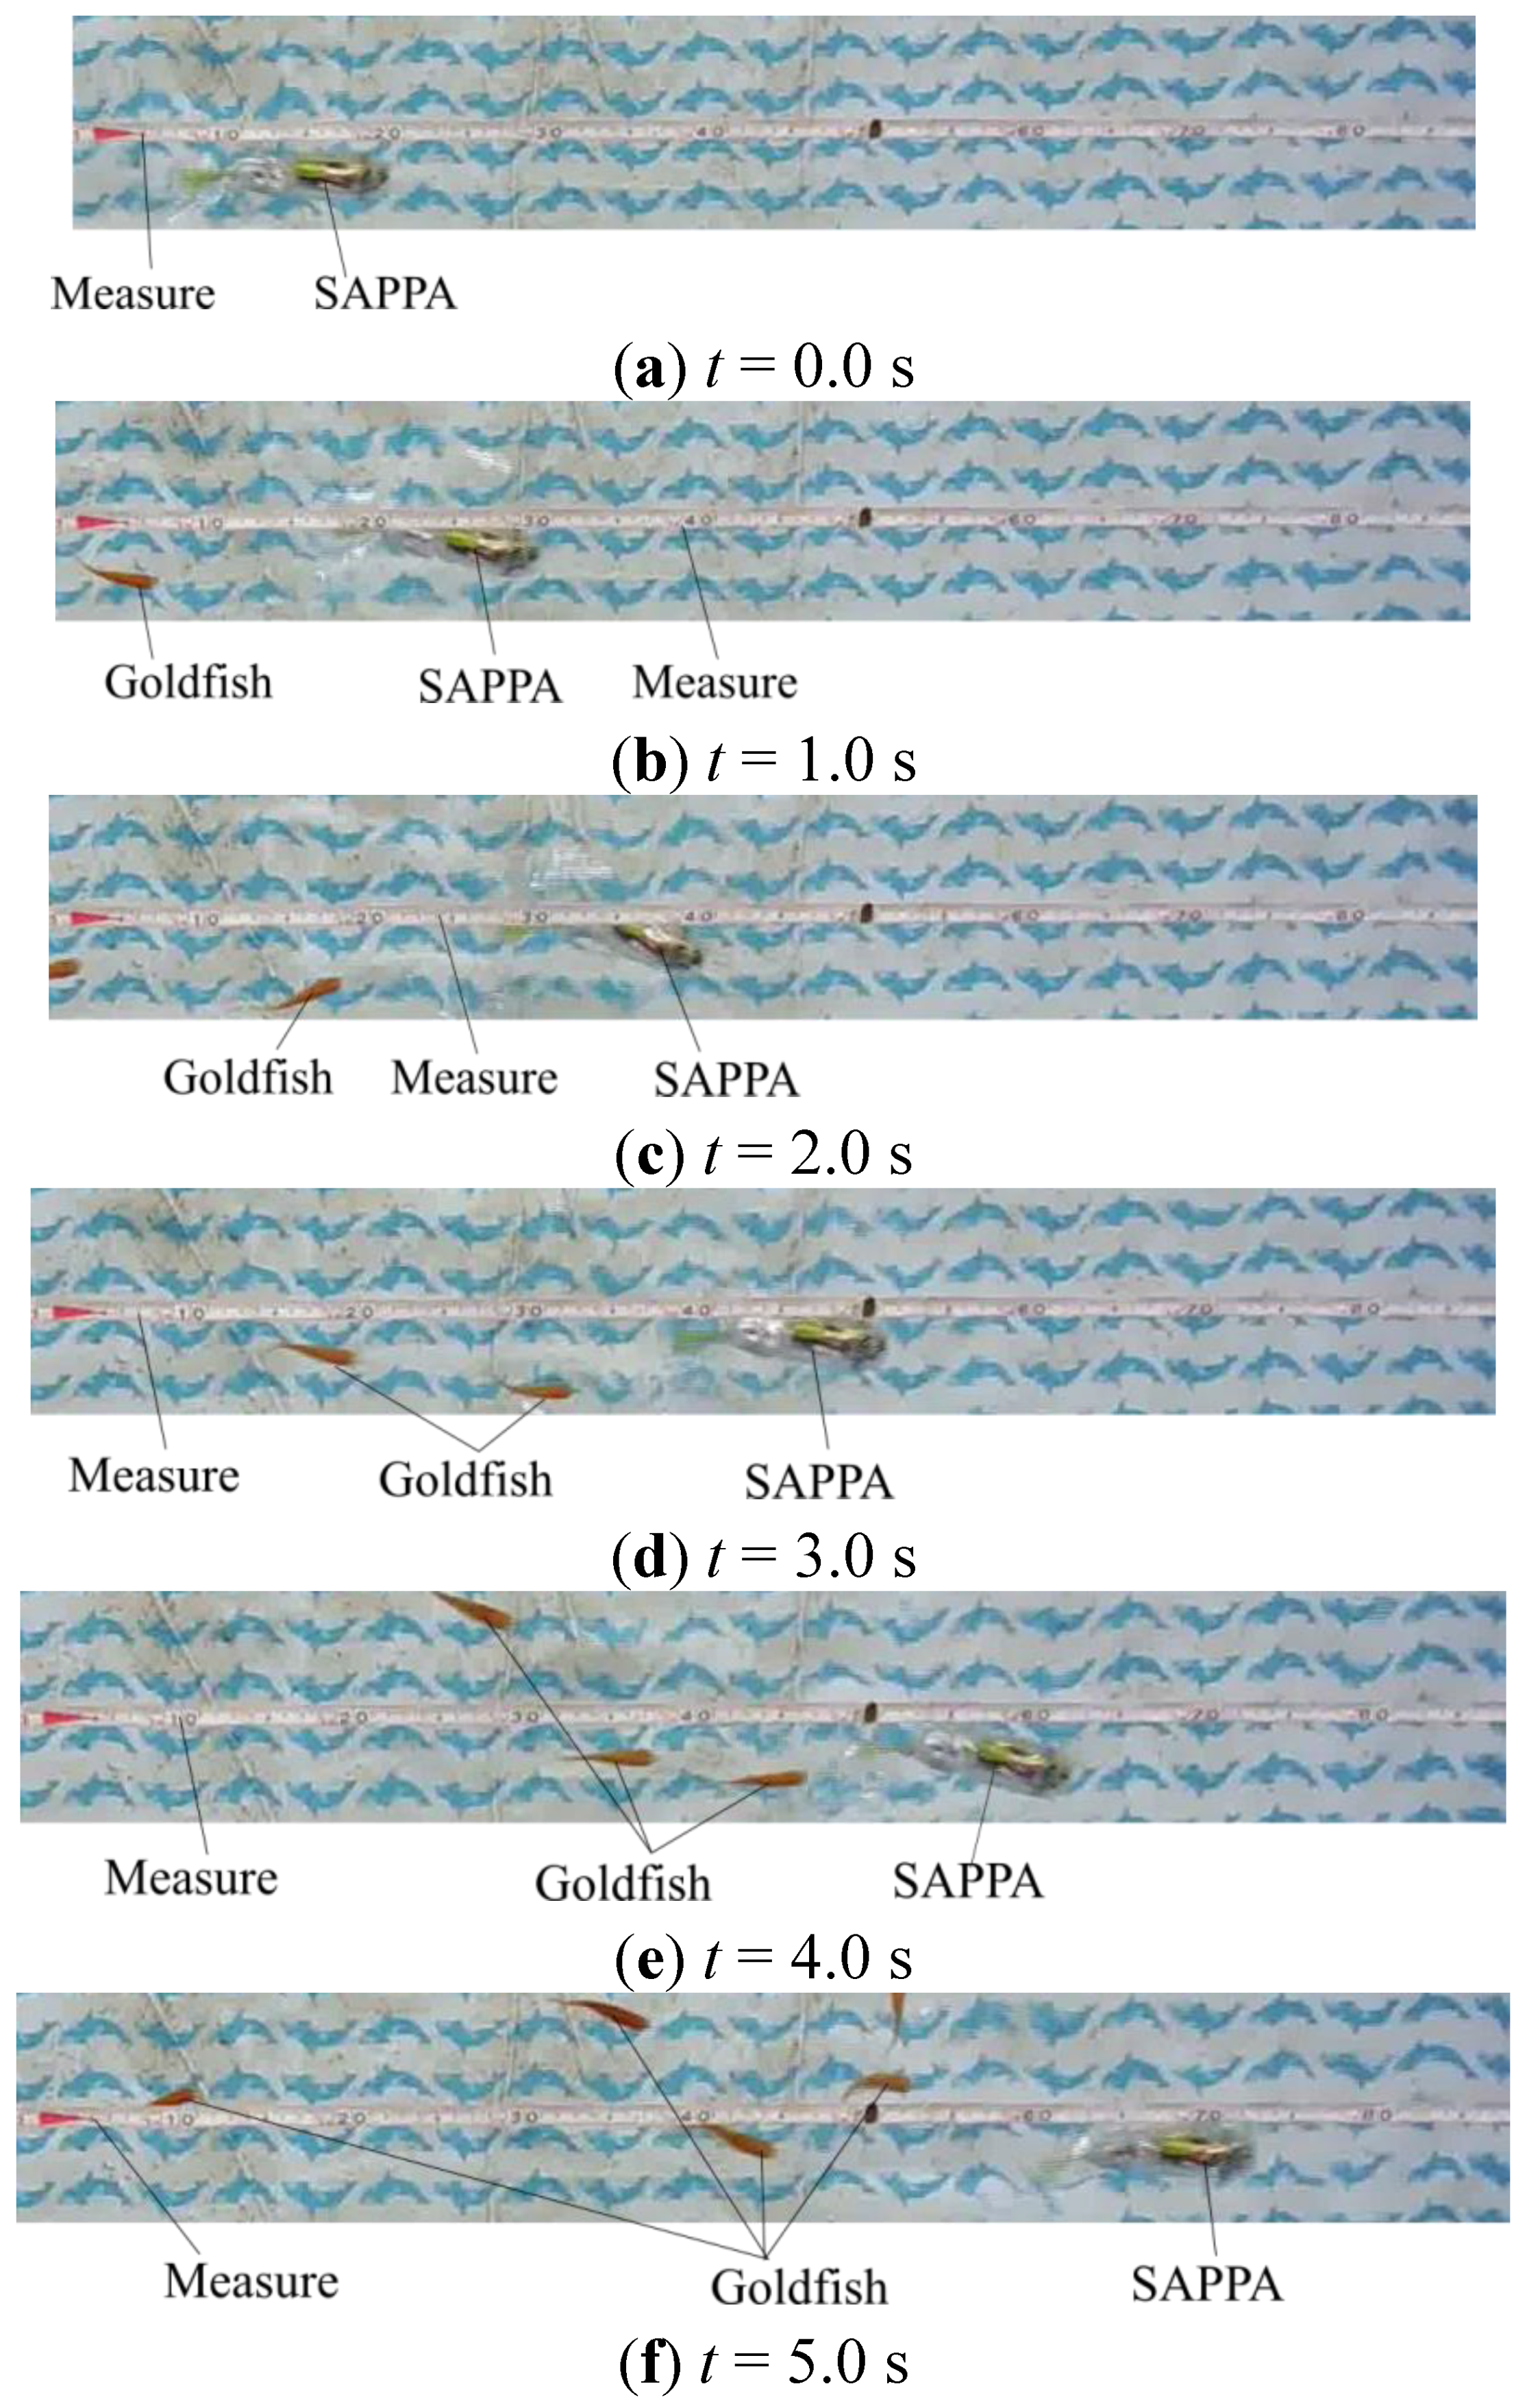
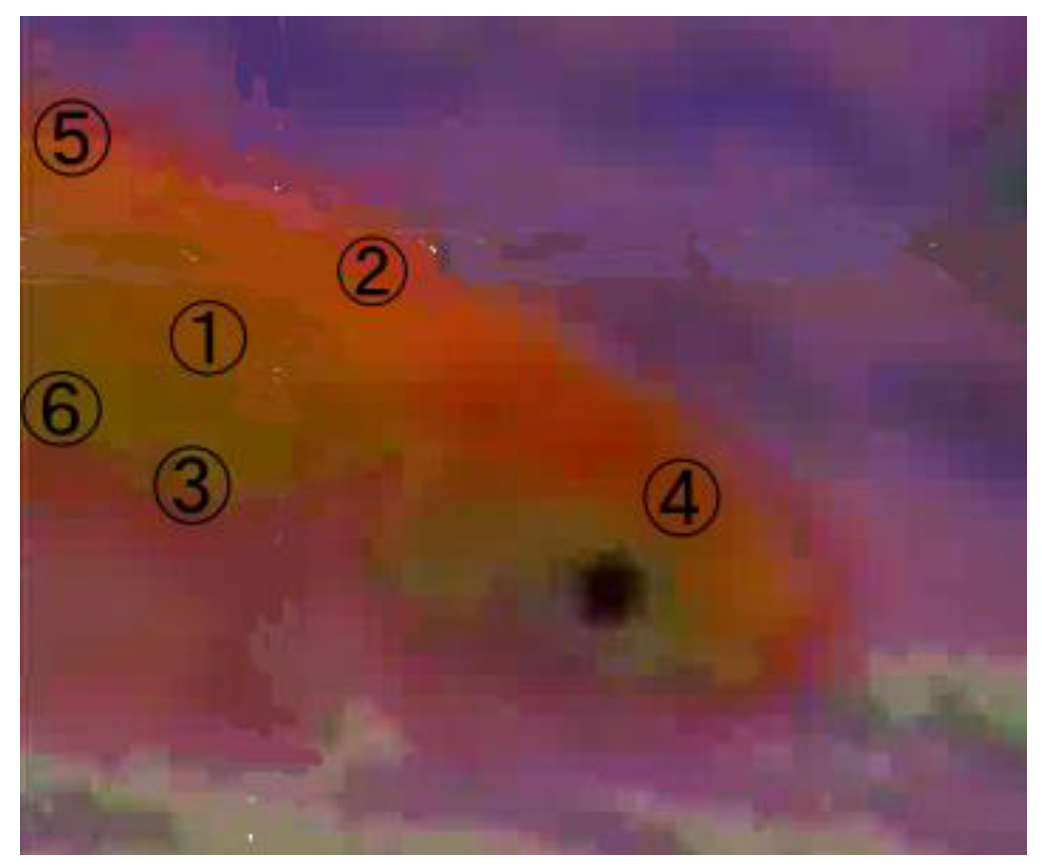
Figure 8 shows a series of snapshots taken at one-second intervals when the robot was swimming at maximum speed. It can be seen that several goldfish followed SAPPA during the experiment, showing that it does not frighten live fish.
Figure 6.
Schematic of robot tail.
Figure 6.
Schematic of robot tail.
Figure 7.
Dependence of swimming speed on phase difference.
Figure 7.
Dependence of swimming speed on phase difference.
Then, the turning radius of the robot and its ability to move upwards and downwards were evaluated. The experimental results are shown in
Figure 9 and
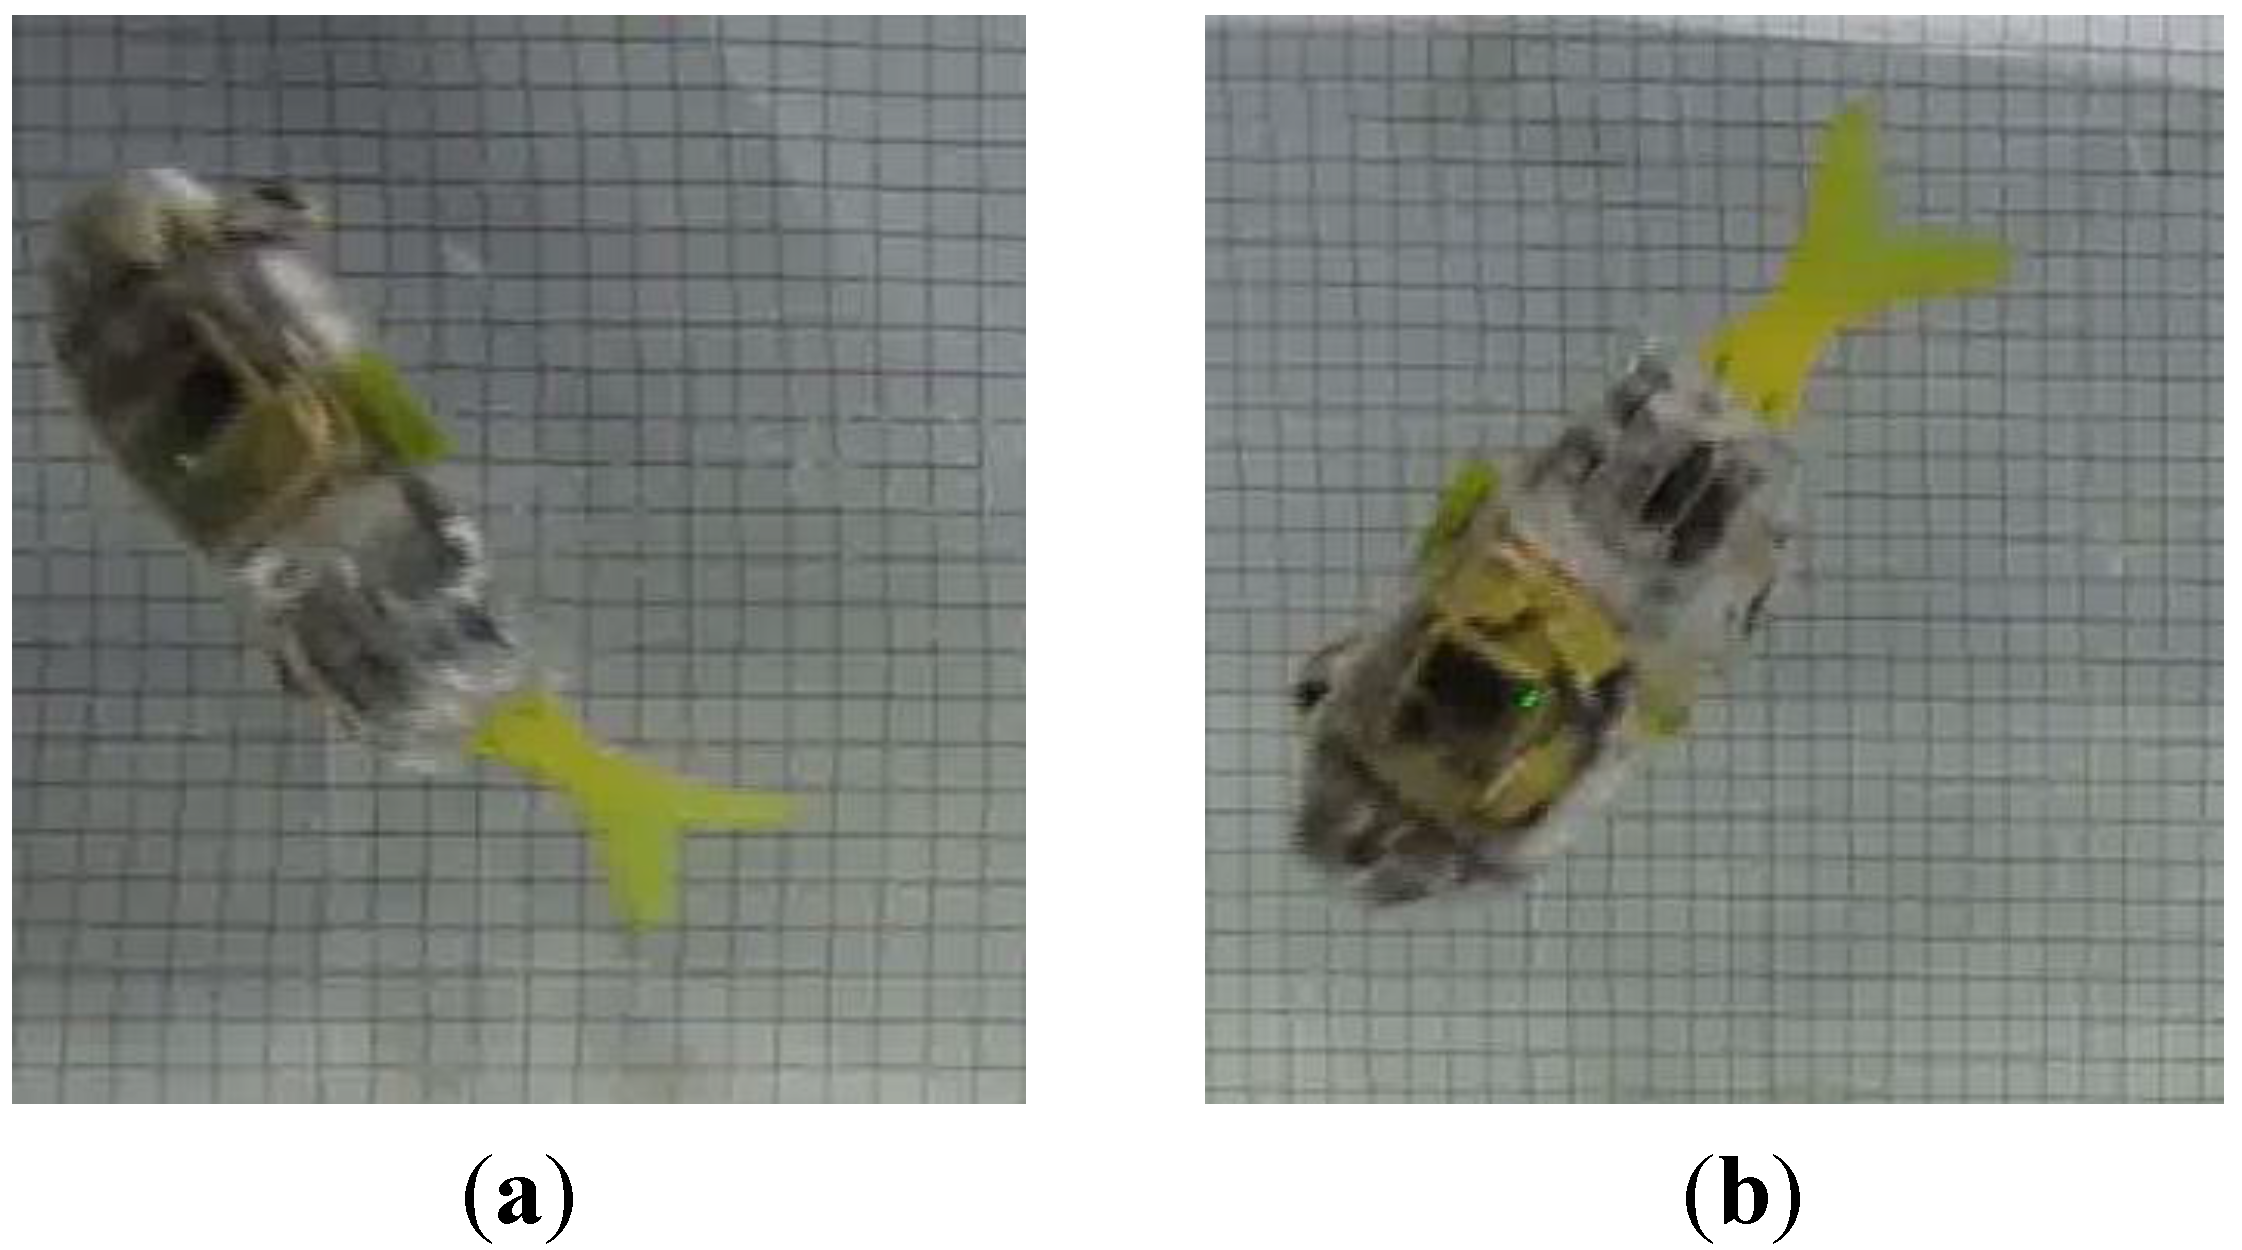
Figure 10. The turning radius was found to be 0.735 BL (125 mm) at 0.305 BL/s (51.9 mm/s). The robot was capable of rising at up to 60° and sinking at up to 50° from the horizontal position, respectively.
Figure 8.
Propulsive performance measurements (phase difference 0°).
Figure 8.
Propulsive performance measurements (phase difference 0°).
Figure 9.
Turning radius.
Figure 9.
Turning radius.
Figure 10.
SAPPA moving upwards and downwards. (a) Rising (60°); (b) Sinking (50°).
Figure 10.
SAPPA moving upwards and downwards. (a) Rising (60°); (b) Sinking (50°).
2.3 Evaluation of Propulsion Performance
Nagai
et al. proposed a propulsive performance index
Sw for real or robotic fish [
9]. It is referred to as the “swimming number”, and it is the ratio of the distance swum during one period of the tail fin’s reciprocating motion to the total length of the fish. It is calculated using Equation (1), where
f (Hz) is the movement frequency of the tail fin,
L (m) is the total length of the fish, and
u (m/s) is the swimming speed. Larger values of
Sw are an indication of more efficient swimming.
In the case of SAPPA, the total length is 170 mm, the frequency of the tail fin is 2 Hz, and the maximum propulsion speed is 111 mm/s. Therefore,
Sw has a value of 0.326, which is considerably larger than that for the previously developed robotic fish FOCUS [
7]. The swimming number of FOCUS is 0.146.
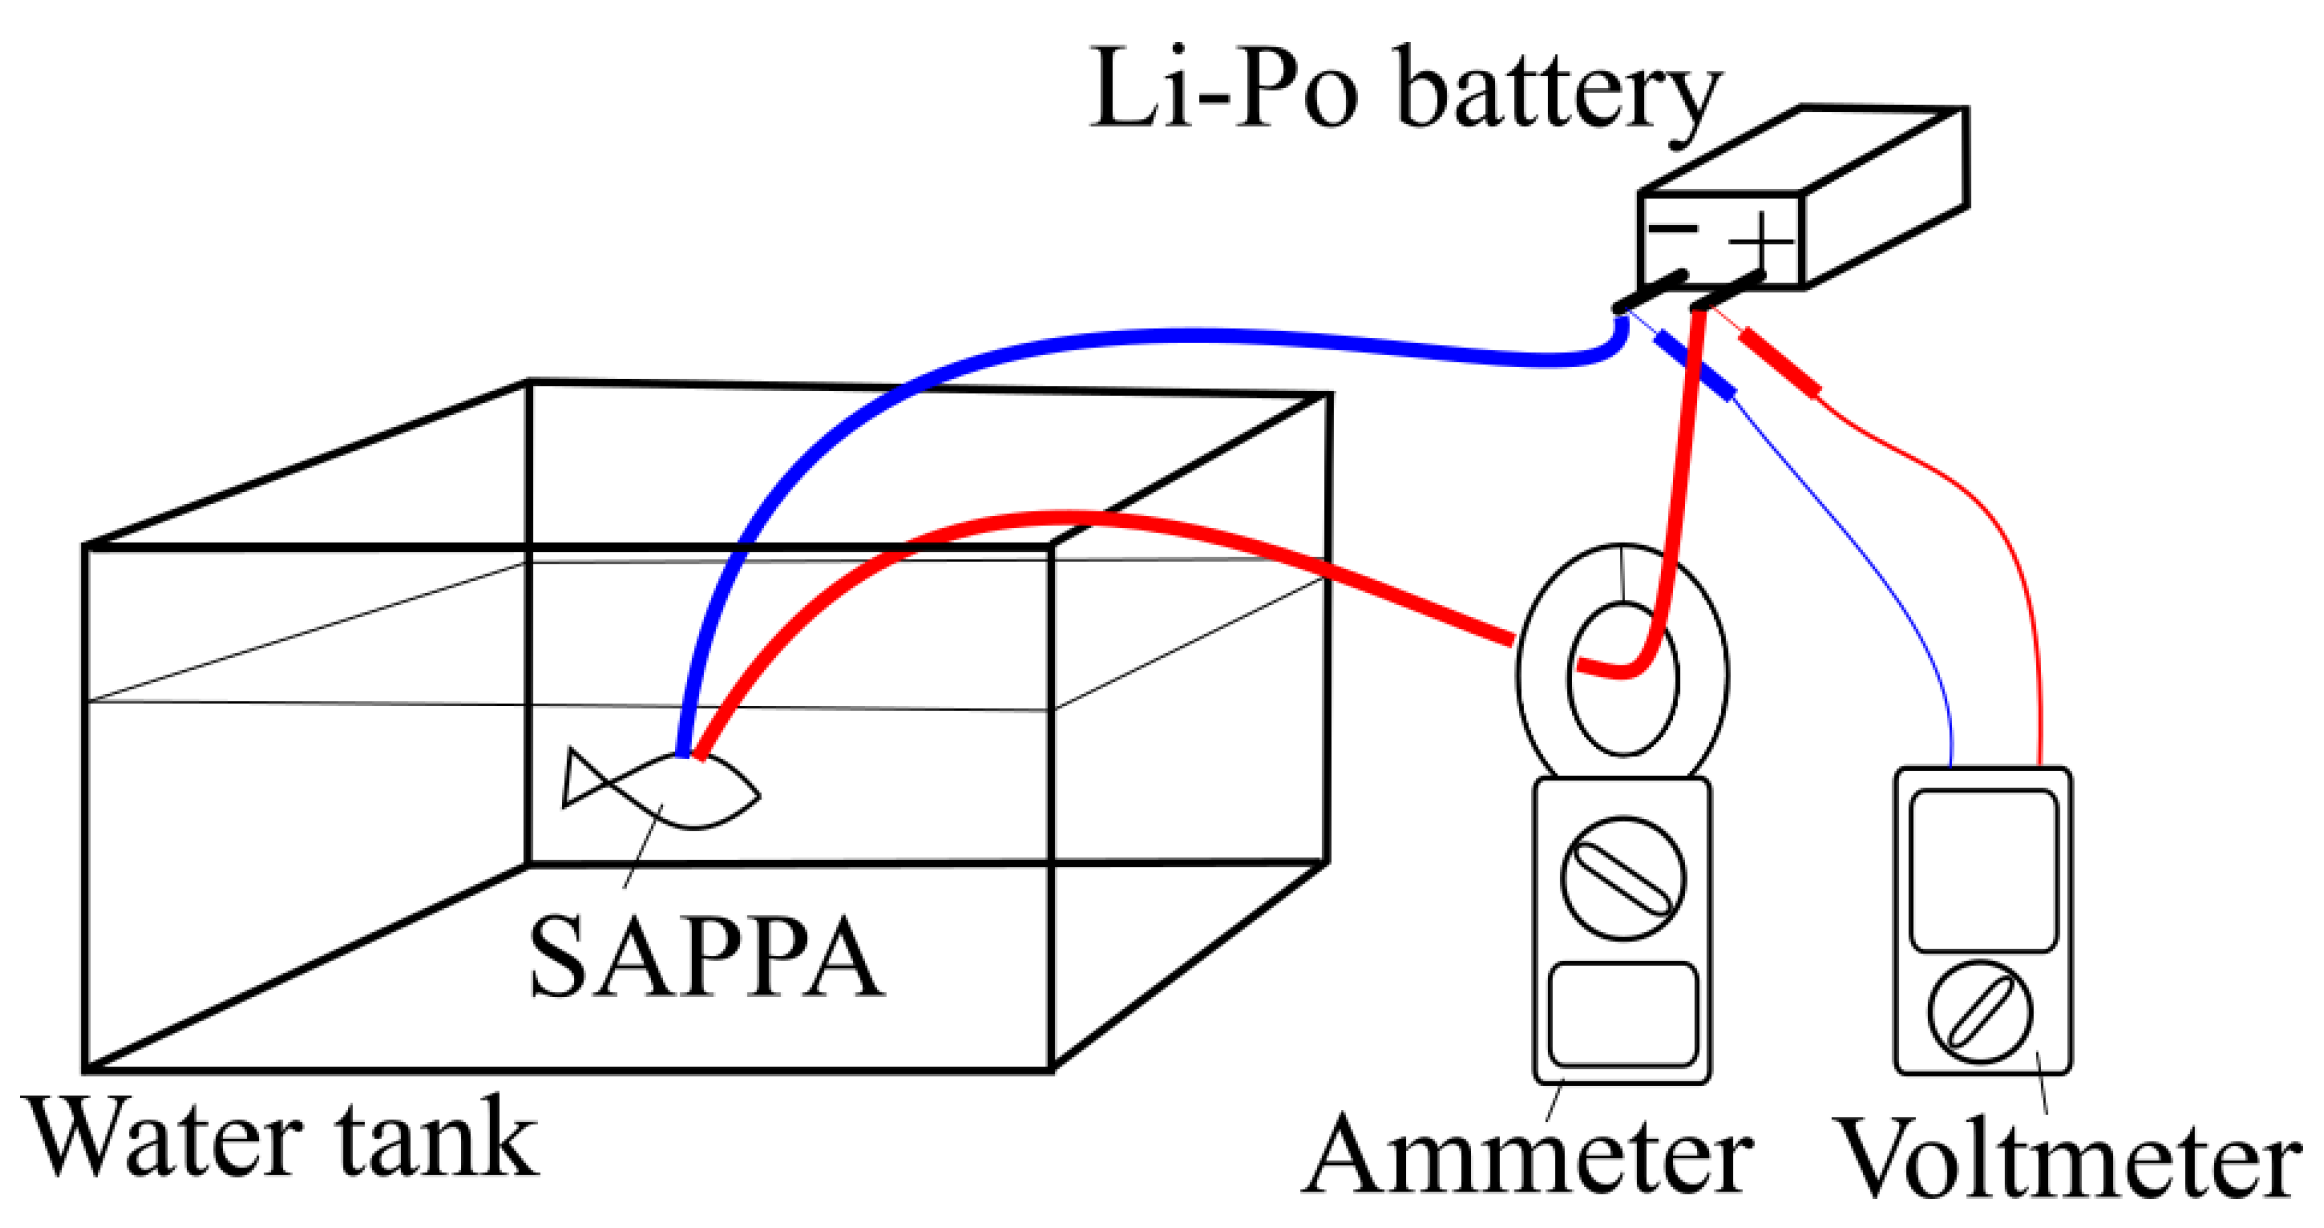
To estimate the propulsive efficiency of SAPPA, the power consumption and propulsive force were measured. The power consumption was determined by measuring the voltage and the electric current from the battery in the robot when it was swimming.
Figure 11 shows a scheme of measuring the voltage and the electric current. If the Li-Po battery is in SAPPA, it is difficult to measure the voltage and the current. We supplied electricity to SAPPA from outside to measure the voltage and the current. The lead wires were slackened to prevent tension from influencing propulsion of the robot. We used the voltmeter PC510 and ammeter DCM400AD (SANWA ELECTRIC INSTRUMENT CO., LTD, Tokyo, Japan). However, it was difficult to measure the propulsive force when the robot was swimming. Therefore, it was assumed that the drag force when the robot was held motionless in circulating water was equal to the propulsive force [
10,
11,
12,
13] that would be exerted by the robot when it was swimming at the same speed as the circulating water. Equation (2) gives the propulsive efficiency
η, where the drag force is
D (N), the velocity is
u (m/s), and the power consumption is
P (W).
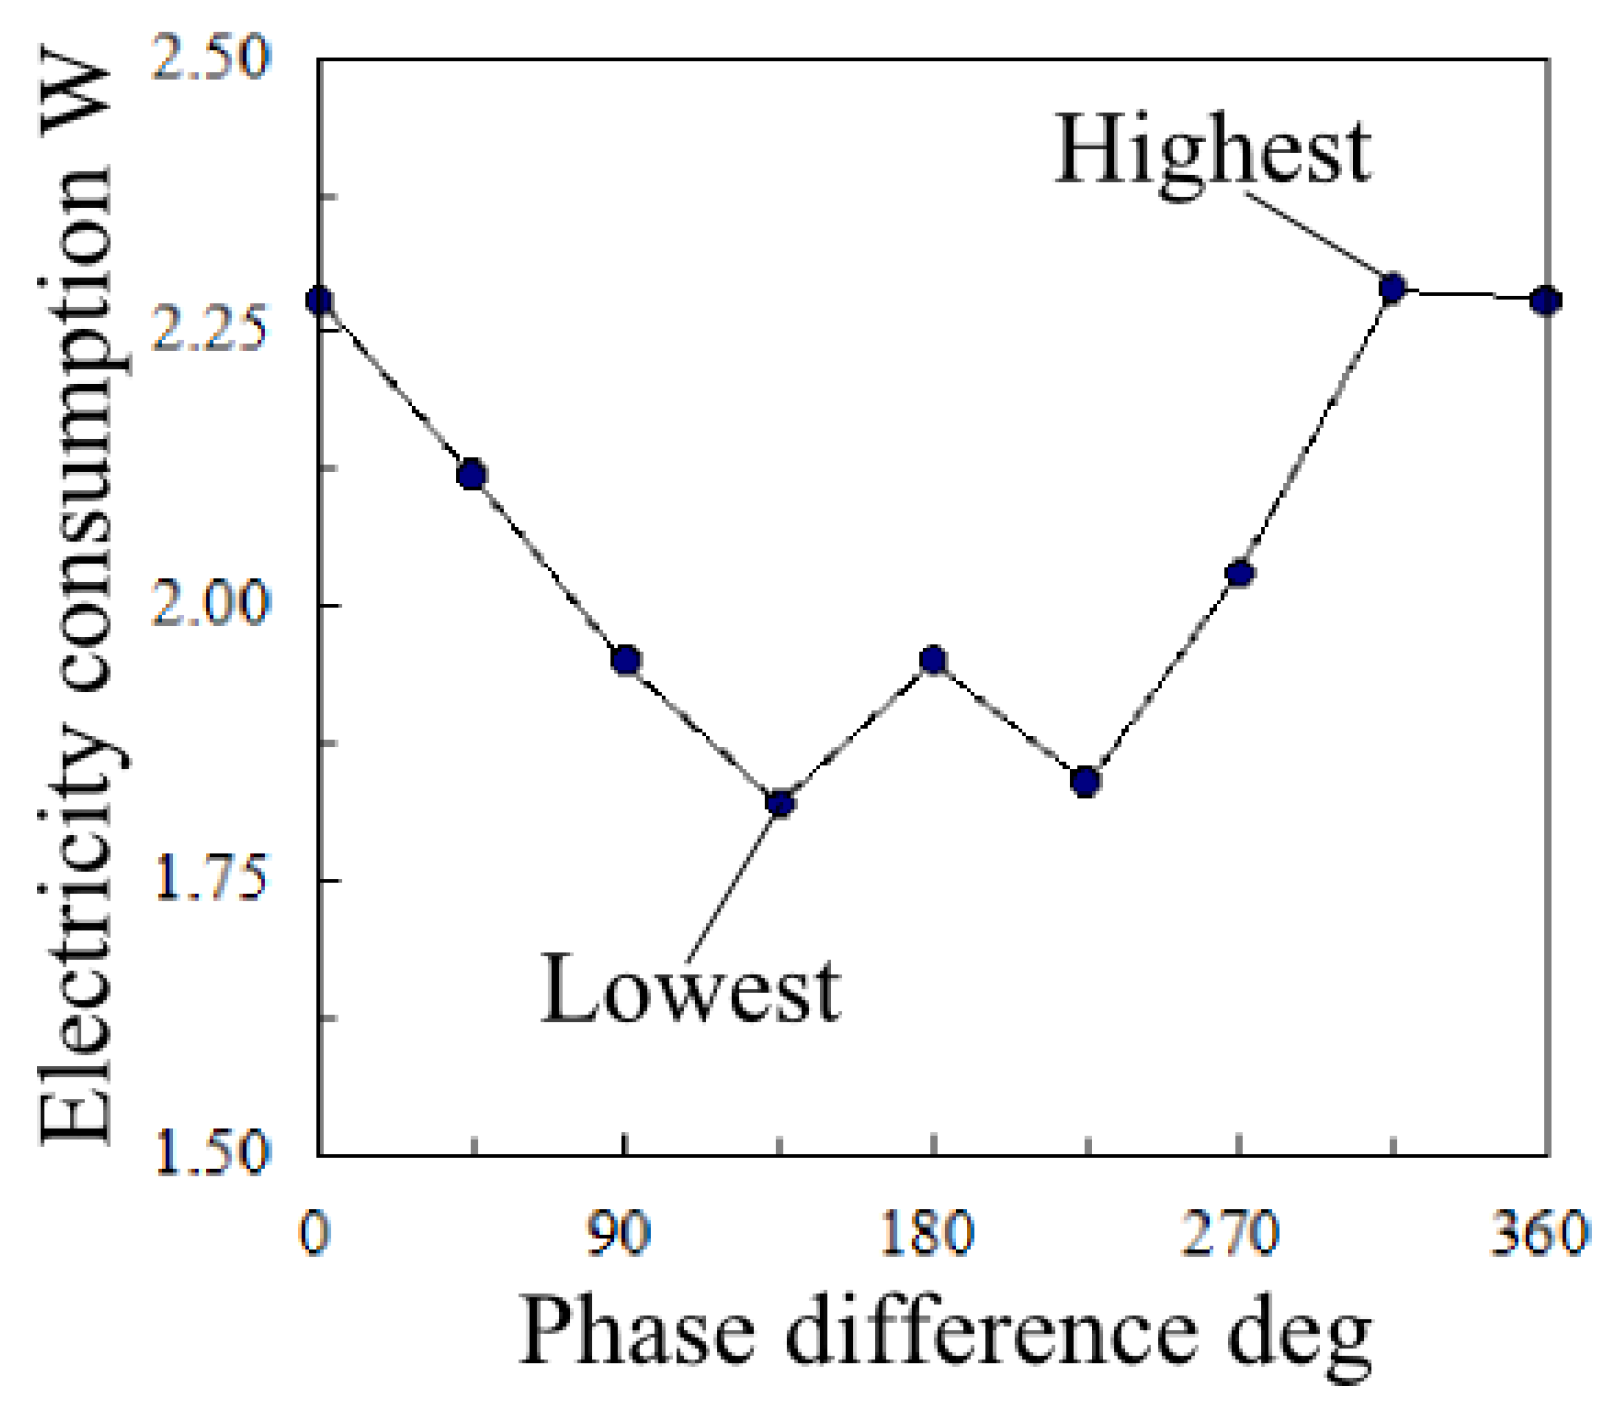
The power consumption of SAPPA was measured while varying the phase difference between the two tail-fin motors in steps of 45°, and the results are shown in
Figure 12.
Figure 11.
Experimental setup for measuring power consumption.
Figure 11.
Experimental setup for measuring power consumption.
Figure 12.
Dependence of electricity consumption on phase difference.
Figure 12.
Dependence of electricity consumption on phase difference.
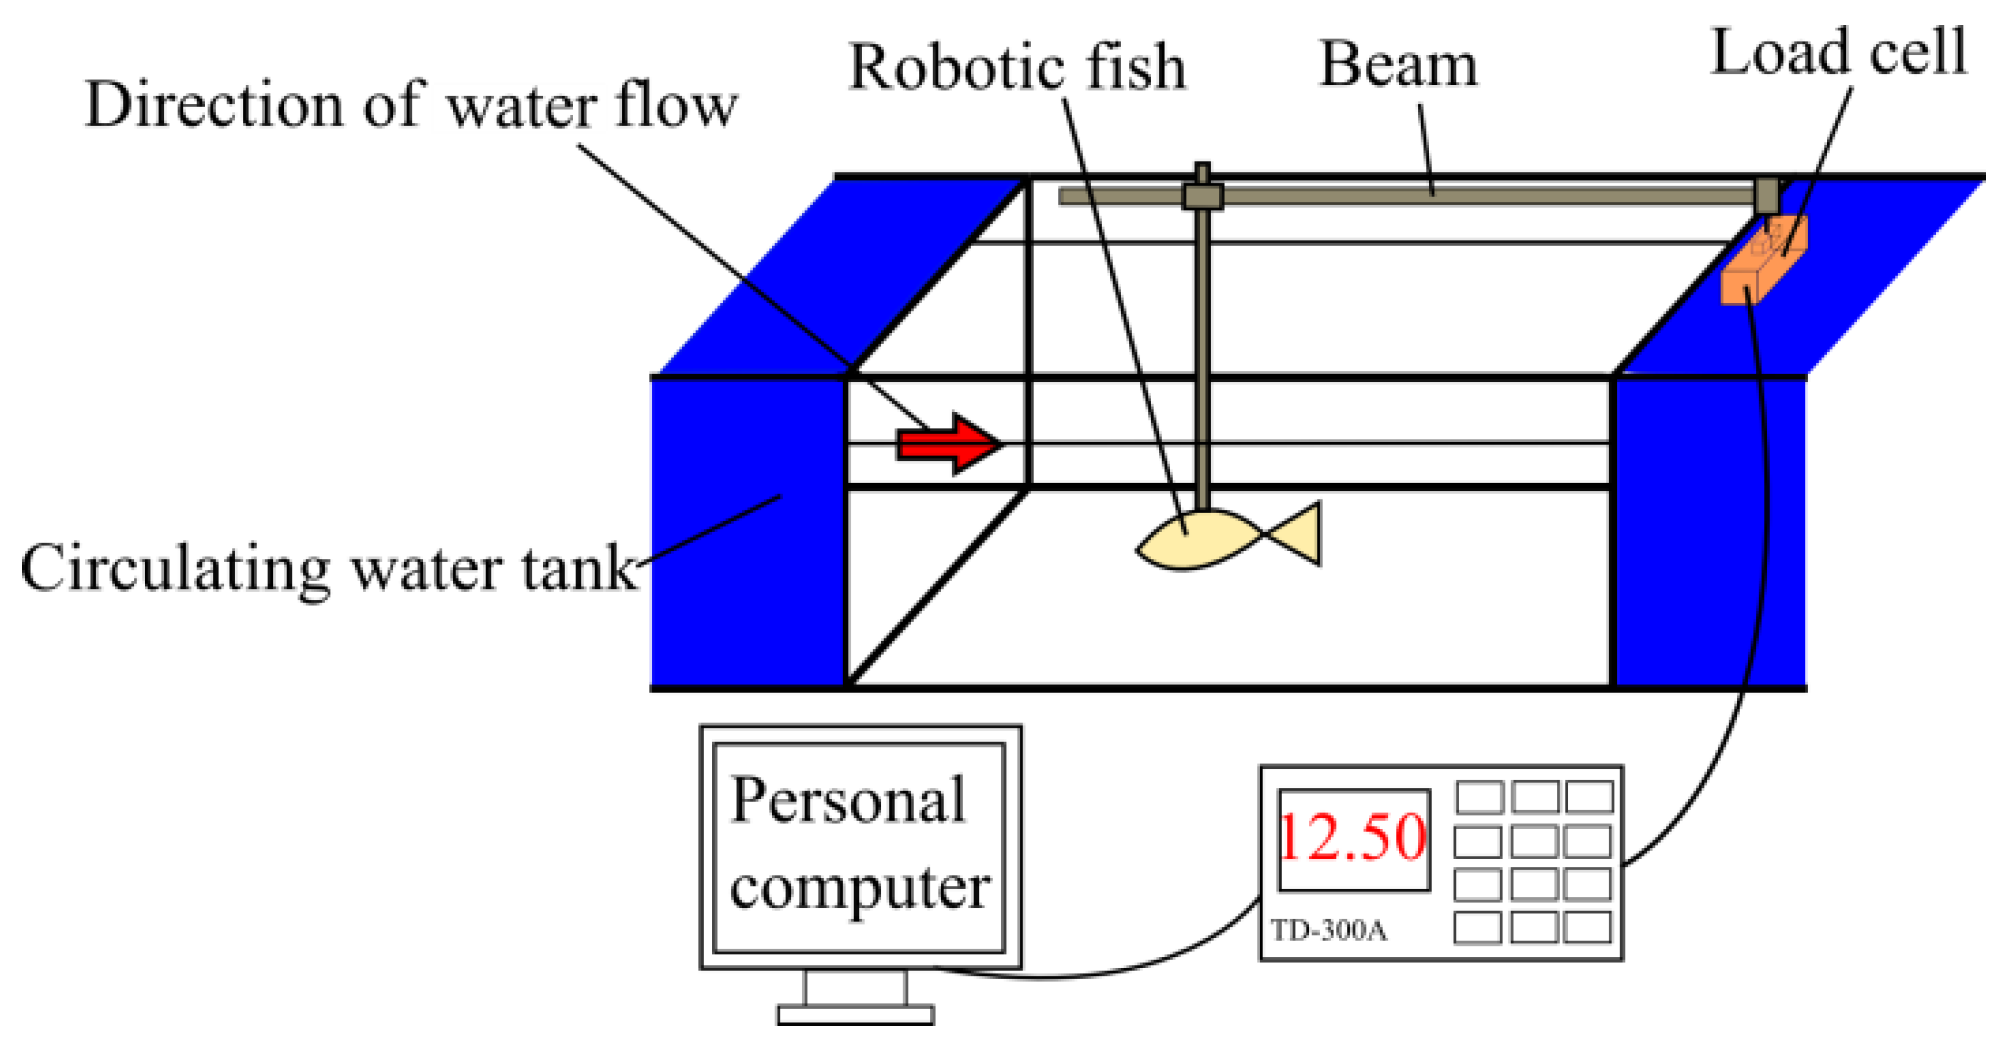
Figure 13 shows SAPPA when the drag force was measured, and
Figure 14 shows a schematic of the experimental setup. A shaft was installed on the head of the robot to attach it to the experimental system, which was composed of a circulating water tank (WEST JAPAN FLUID ENGINEERING LABORATRY CO., LTD, P-70, Nagasaki, Japan), a load cell (A&D Co., Ltd., LC4001-G120, Tokyo, Japan), a load cell amplifier (TEAC, TD-300A, Tokyo, Japan), a power supply, and a personal computer (PC). The PC was equipped with an analog-to-digital convertor board with a PCI interface, allowing it to read the output of the load cell amplifier. The electric current and the voltage of the battery in the robot were simultaneously measured.
Figure 13.
Robotic fish held by shaft.
Figure 13.
Robotic fish held by shaft.
Figure 14.
Experimental setup for drag force measurement.
Figure 14.
Experimental setup for drag force measurement.
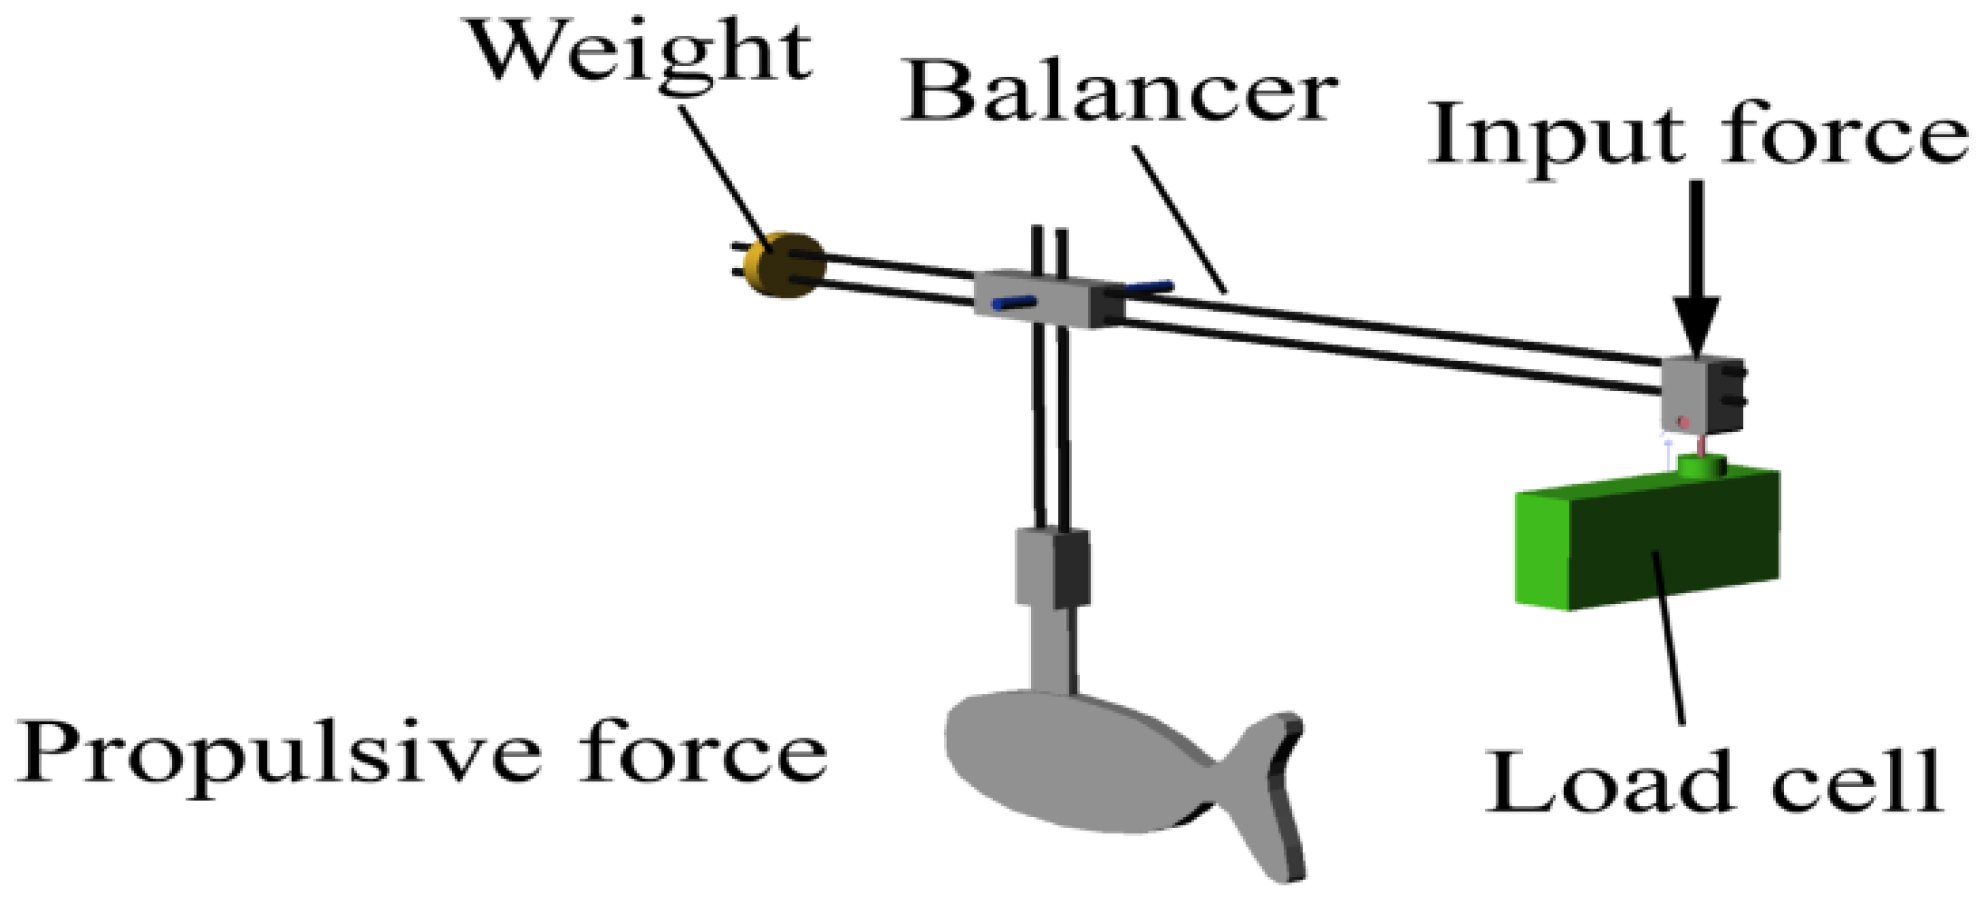
The circulating water tank was an impeller type and was driven by a three-phase 200 W AC motor. The water speed in the circulating water tank can be controlled in 0 mm/s to 570 mm/s by a small inverter (VfnC1-2002P). The drag of each propulsive speed was measured as we changed the water speed in the circulating water tank according to the propulsive speed of the robotic fish. An overview of the apparatus for measuring the drag force is shown in
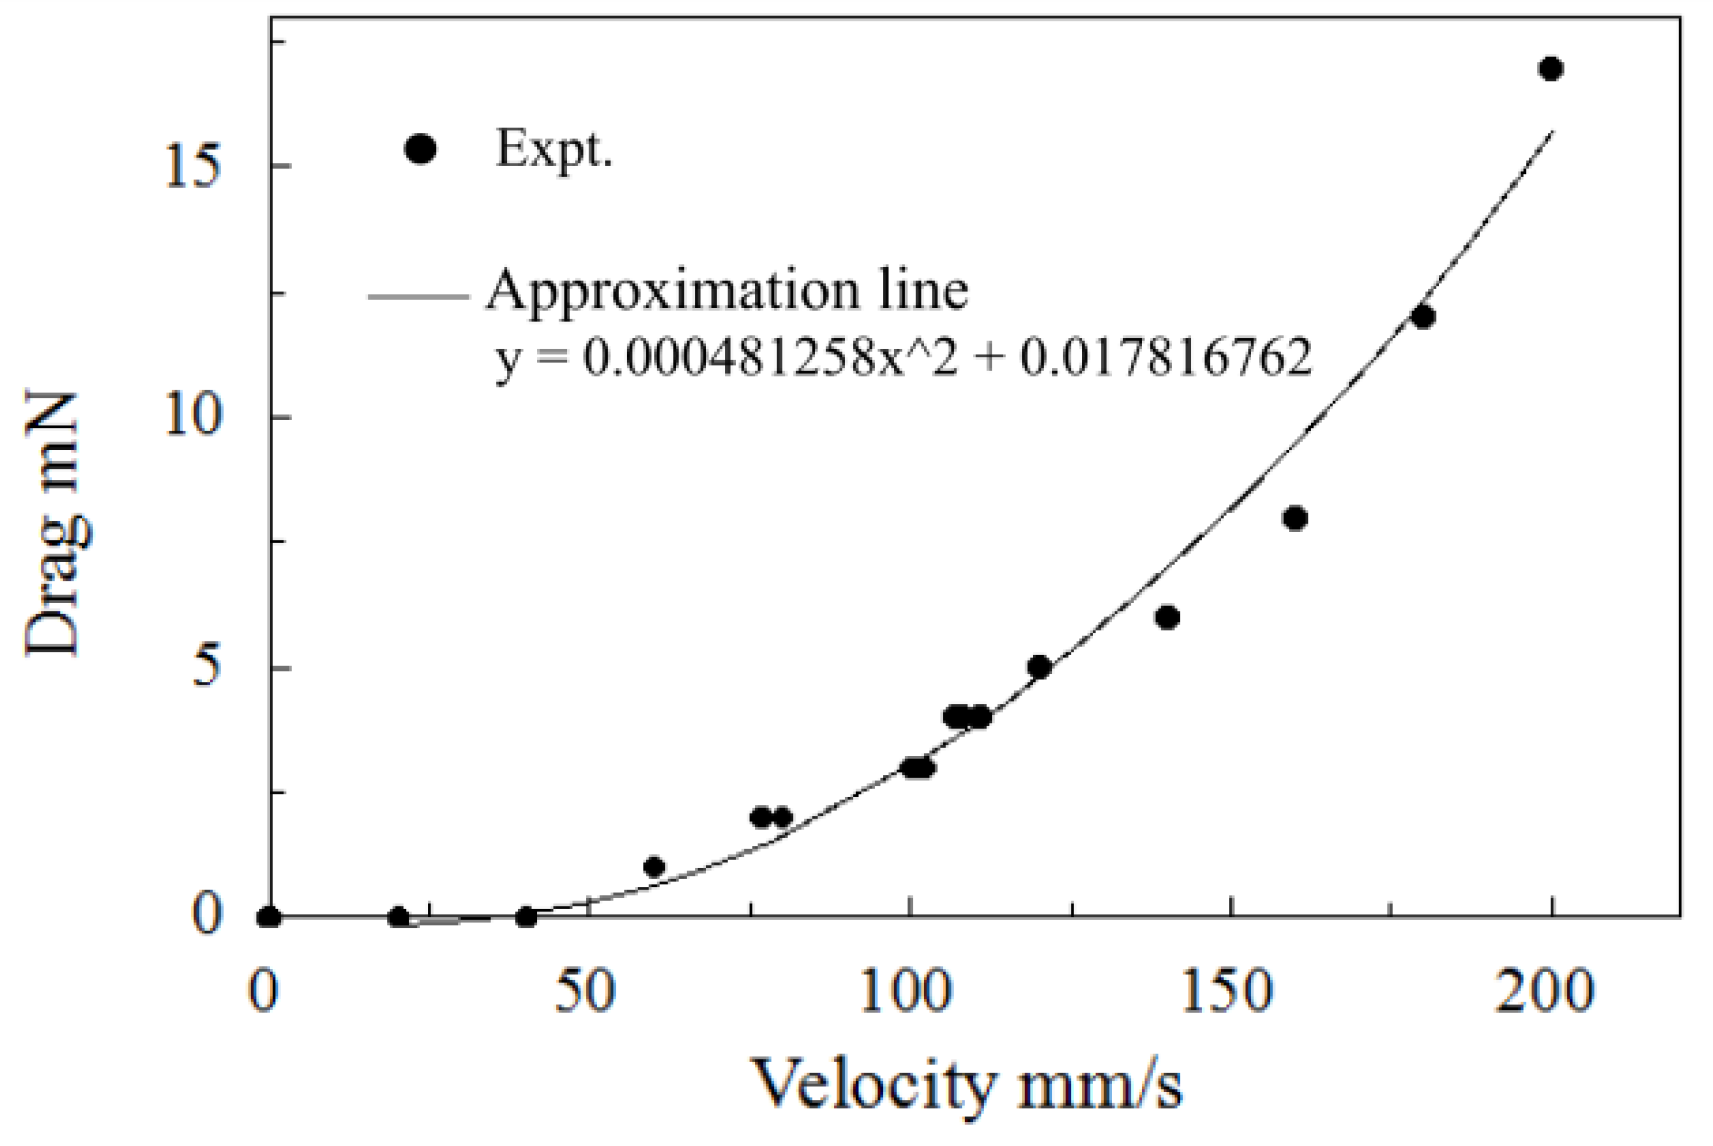
Figure 15. The robot was fixed to the measuring apparatus so that it could not move, allowing the drag force in the circulating water to be measured by the load cell. Since the robot was fixed, the drag force varied with the water flow speed. The drag force was measured for water flow speeds of 20 to 200 mm/s in steps of 20 mm/s. In addition, the drag force was also measured for water flow speeds corresponding to the actual measured speeds of the robot during the swimming experiments. These were 21, 77, 80, 102, 107, 108, 110, and 111 mm/s, and were obtained by changing the phase difference between the tail-fin motors. The results are shown in
Figure 16.
Figure 15.
Measurement apparatus for drag force.
Figure 15.
Measurement apparatus for drag force.
Figure 16.
Dependence of drag force on water flow speed.
Figure 16.
Dependence of drag force on water flow speed.
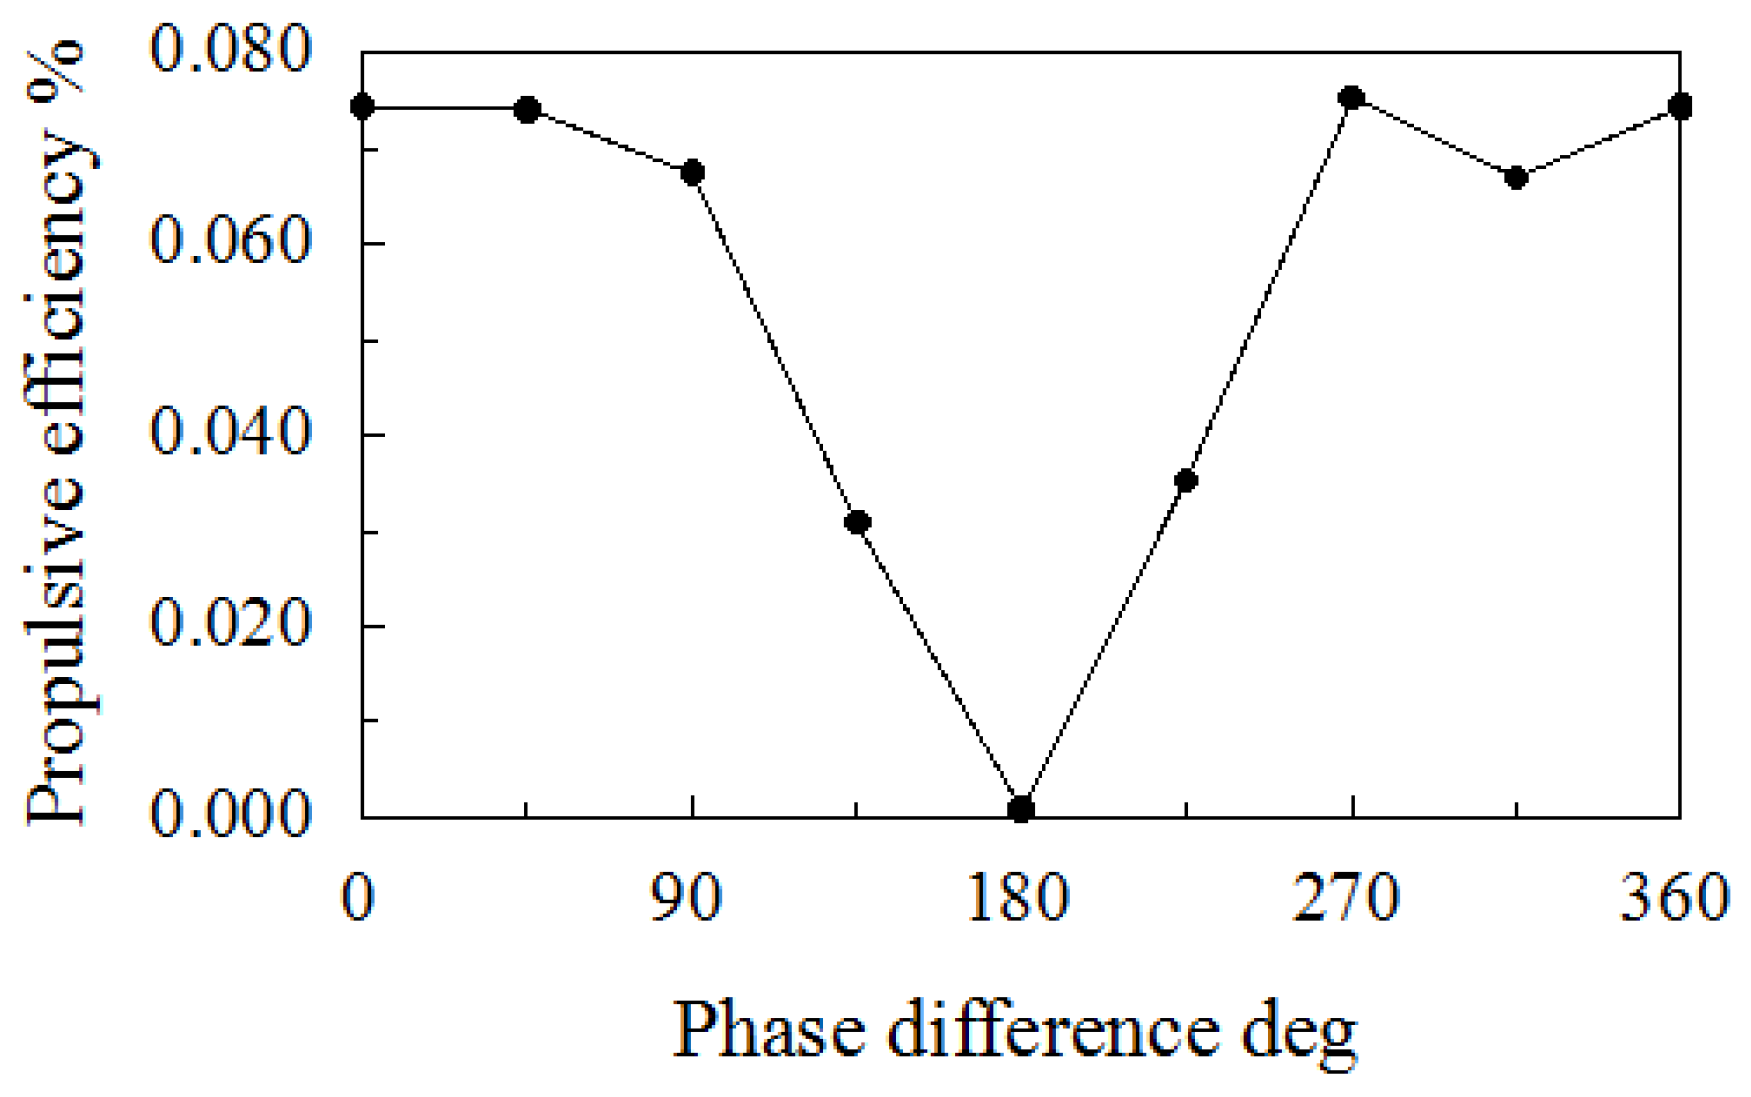
Figure 17.
Dependence of propulsive efficiency on phase difference.
Figure 17.
Dependence of propulsive efficiency on phase difference.
For a phase difference of 0°, a swimming speed of 111 mm/s, an estimated drag force of 3.9 mN, and a power consumption of 2.26 W, the propulsive efficiency was calculated to about 0.0756%.
Figure 17 shows the dependence of the propulsive efficiency on the phase difference. The highest value was 0.0756% for a phase difference of 270°. Therefore, for a drag
D = 0.0048 N, a density of water ρ = 999.97 kg/m
3, a frontal projected area of
A = 6540 mm
2, and a swimming speed of
u = 111 mm/s, the drag coefficient
CD can be obtained as 0.382 using Equation (3). It is thought that the propulsive efficiency is low. We think that a cause is the motors used for SAPPA. The motor that was used for SAPPA is NE-53070017 (Nine Eagles, Shanghai, China). It is very a small servomotor with a size of 15 mm × 20 mm × 5 mm. It generates heat because of its large electrical current. It seems that a large amount of energy is lost as thermal energy in the servomotor.


