1. Introduction
Visual odometry (VO) estimates camera motion from a sequence of images and serves as a basic component for autonomous visual navigation. In lightweight robotic platforms, including unmanned aerial vehicles (UAVs), a minimal VO module may be preferred when the goal is to characterize local ego-motion behavior without deploying a complete Simultaneous Localization and Mapping (SLAM) stack. This UAV-oriented motivation is treated here at the component level: the paper studies sparse visual ego-motion on repeatable synthetic RGB-D sequences and isolated edge-hardware solver timings, not a complete onboard navigation system. The specific technical issue addressed in this paper is narrower than full robotic deployment: monocular sparse VO recovers translation only up to an unknown metric scale, whereas depth-capable sensing can supply metric three-dimensional structure for pose estimation [
1,
2,
3,
4]. The mathematical advantage of using depth via Perspective-n-Point (PnP) solvers over monocular Essential Matrix estimation is a well-established geometric fact, since calibrated two-view pose estimation is classically associated with the five-point relative pose problem [
5], whereas the PnP-family formulation exploits 3D-to-2D constraints when metric 3D points are available [
6]. Therefore, the purpose of this study is not to propose a new VO algorithm or to prove the known geometry, but to quantify how this known backend difference behaves inside minimal sparse VO pipelines when the frontend correspondences are held fixed.
The complete SLAM stacks involving dense mapping, keyframes, loop closure, local bundle adjustment, or global map reuse are intentionally excluded from the present investigation. Such systems, including ORB-SLAM2 [
7], SVO [
8], and DSO [
9], include multiple compensating modules that make it difficult to isolate the contribution of the geometric pose estimation backend itself. The primary objective of this study is therefore limited to a UAV-relevant controlled synthetic ablation: route the same sparse image correspondences through an RGB-only Essential Matrix backend or an RGB-D PnP backend; then measure the resulting accuracy, scale behavior, robustness, failure modes, and isolated solver latency.
The comparative analysis is performed with a fixed sparse two-dimensional (2D) frontend, using either Oriented FAST and Rotated BRIEF (ORB) feature matching or Kanade–Lucas–Tomasi (KLT) optical-flow tracking. The first backend is based on Red–Green–Blue (RGB)-only two-view geometry using the Essential Matrix and RANSAC, thereby generating a scale-ambiguous relative pose. The second backend incorporates RGB-D geometry, where identical image correspondences are supplemented with corresponding depth maps to support three-dimensional (3D) back-projection and metric relative pose estimation via PnP and RANSAC. All experimental evaluations are conducted on the 32-sequence validation split of the simulated TartanAir multimodal dataset [
10]. This split provides flight-like synthetic RGB-D scenes and motion regimes relevant to UAV visual navigation while retaining synchronized RGB, aligned dense depth, calibrated intrinsics, and noise-free ground truth. This controlled setting allows the backend effect to be observed without uncontrolled real-sensor confounders. Consequently, the results should be interpreted as a diagnostic upper-bound study under oracle aligned depth, not as evidence of real-flight robustness or complete onboard deployment readiness.
The present investigation is limited to a single-agent frame-to-frame VO pipeline. Multi-agent perception, cooperative map fusion, shared relocalization, obstacle avoidance, and closed-loop flight control fall outside the scope of the current paper. The practical relevance for UAV computer vision is instead that the study identifies when aligned depth improves a minimal sparse backend, when this benefit breaks down because the frontend correspondences or depth-supported inlier set become unreliable, and how large the isolated geometry-solver cost is on a Raspberry Pi-class edge board.
The main contributions of this work are as follows:
A UAV-relevant controlled RGB-only versus RGB-D backend ablation under fixed sparse frontends, where the geometric pose estimation backend (Essential Matrix versus PnP with RANSAC) is the principal modified component between paired configurations;
An evaluation across the 32-sequence TartanAir validation split of flight-like synthetic RGB-D scenes under temporal subsampling parameters (strides ) and five deterministic RGB degradation presets, with an explicit Sim(3)/SE(3) alignment policy for separating monocular scale effects from trajectory-shape error;
A failure-mode analysis showing that the RGB-D PnP benefit depends on frontend stability: the advantage is strong at small strides but KLT-PnP fails to improve ATE at coarser strides where 2D tracking is degraded;
A statistical assessment integrating mean ± std, median with Interquartile Range (IQR), bootstrap 95% confidence intervals, finite-coverage counts, and paired Wilcoxon signed-rank tests with Holm–Bonferroni correction across the family of 16 baseline comparisons;
An isolated geometry-solver runtime benchmark on a Raspberry Pi 4 Model B edge platform (Broadcom BCM2711 System on a Chip (SoC); quad-core ARM Cortex-A72 at nominal 1.5 GHz; 64-bit Raspberry Pi OS), alongside a workstation reference, explicitly excluding full-pipeline camera, feature extraction, depth handling, and thermal effects;
Public release of the TartanAir 32-sequence validation split with exploratory data analysis [
11], and the open-source evaluation codebase containing the sparse frontends, geometric backends, deterministic RGB degradations, and metric scripts [
12].
The structure of the paper is outlined as follows.
Section 2 reviews visual ego-motion, multimodal data fusion, the scale and depth trade-off, and sparse correspondence evaluation paradigms.
Section 3 describes the experimental protocol and dataset.
Section 4 reports the obtained metrics and comparative analysis.
Section 5 discusses the limitations of the adopted synthetic setup. Finally,
Section 6 summarizes the bounded findings and identifies future validation steps.
3. Materials and Methods
This section defines the controlled experimental protocol used to compare monocular RGB-only and RGB-D geometric pose estimation backends. The frontend is fixed within each comparative evaluation; as a result, the measured difference is generated by changing the geometric backend and adding aligned depth to the identical sparse 2D correspondences.
3.1. Scope and Comparison Policy
Direct comparison with full SLAM systems such as ORB-SLAM2 [
7], SVO [
8], or DSO [
9] is intentionally excluded from the scope of this study for the following reasons:
First, these systems combine keyframe selection, local bundle adjustment, loop closure, and global map optimization, which together compensate for and obscure the effects of the per-frame geometric backend considered here as the variable of interest.
Second, SVO and DSO are direct or semi-direct photometric methods and do not share a sparse 2D correspondence interface with the present ORB- and KLT-based frontends. As a result, any difference in their reported numbers would mix frontend design, photometric optimization, and the isolated change in the geometric backend.
Third, the main problem investigated is not which open-source pipeline is most accurate, but how much trajectory accuracy is recovered by changing only the geometric backend from the scale-ambiguous Essential Matrix solver to the metric PnP solver on identical 2D correspondences.
The evaluation reports paired comparisons of the four {ORB, KLT} × {Essential, PnP} configurations on identical input frames, and the reported ATE magnitudes should be interpreted as frame-to-frame integration without keyframing, local bundle adjustment, or loop closure, rather than as a benchmark against full SLAM stacks.
3.2. Multimodal Dataset and Data Preprocessing
The TartanAir dataset [
10] was used because it provides synchronized RGB images, aligned dense depth maps, camera poses, and camera calibration parameters in repeatable simulated flight-like scenes. This dataset serves as the controlled instrumentation environment for the geometric ablation and should not be considered direct evidence of real-world UAV deployment performance. Temporal subsampling and deterministic RGB degradations were then applied as described below, and the identical sparse frontend and geometric backends were re-evaluated under each condition.
3.2.1. Temporal Subsampling and Visual Degradation
The integer frame stride
was applied so that only every
k-th dataset frame is presented to the pipeline. This emulates a lower effective imaging rate relative to the native TartanAir timeline and increases the motion baseline between consecutive views. The ground-truth translations for ATE and RPE were subsampled with the identical stride. Separately, five deterministic RGB-only corruption presets were synthesized prior to feature extraction. The exact parameters used in all reported experiments are listed in
Table 1, making the protocol reproducible from the manuscript alone; the corresponding implementation is released as open-source code [
12].
The selected parameter values are deliberately moderate proxies for failure modes documented in airborne RGB sensing, rather than calibrated reproductions of any specific sensor. The two Gaussian blur kernels emulate small () and large () defocus or vibration-coupled motion blur on the image. The additive Gaussian noise with on the 0–255 8-bit intensity range corresponds to read-noise levels typically observed on small consumer Complementary Metal-Oxide-Semiconductor (CMOS) sensors at moderate gain settings. The Joint Photographic Experts Group (JPEG) quality factor of 25 is positioned in the strongly lossy regime, approximating aggressive onboard recompression used for bandwidth-constrained wireless transmission to a ground station. The gamma value darkens the image by a factor of roughly 2 on average and emulates dusk-like or under-exposed indoor conditions while preserving full dynamic range. These perturbations are artificial and do not model the full set of real UAV camera failure modes, such as rolling-shutter distortion, auto-exposure transients, synchronization error, vibration-coupled rolling-shutter wobble, or missing depth. The depth maps were deliberately left uncorrupted to stress the visual correspondence layer while holding an oracle depth channel fixed. Consequently, the robustness results should be interpreted as synthetic backend ablation results rather than real-world RGB-D sensor robustness predictions.
3.2.2. Exploratory Data Analysis (EDA)
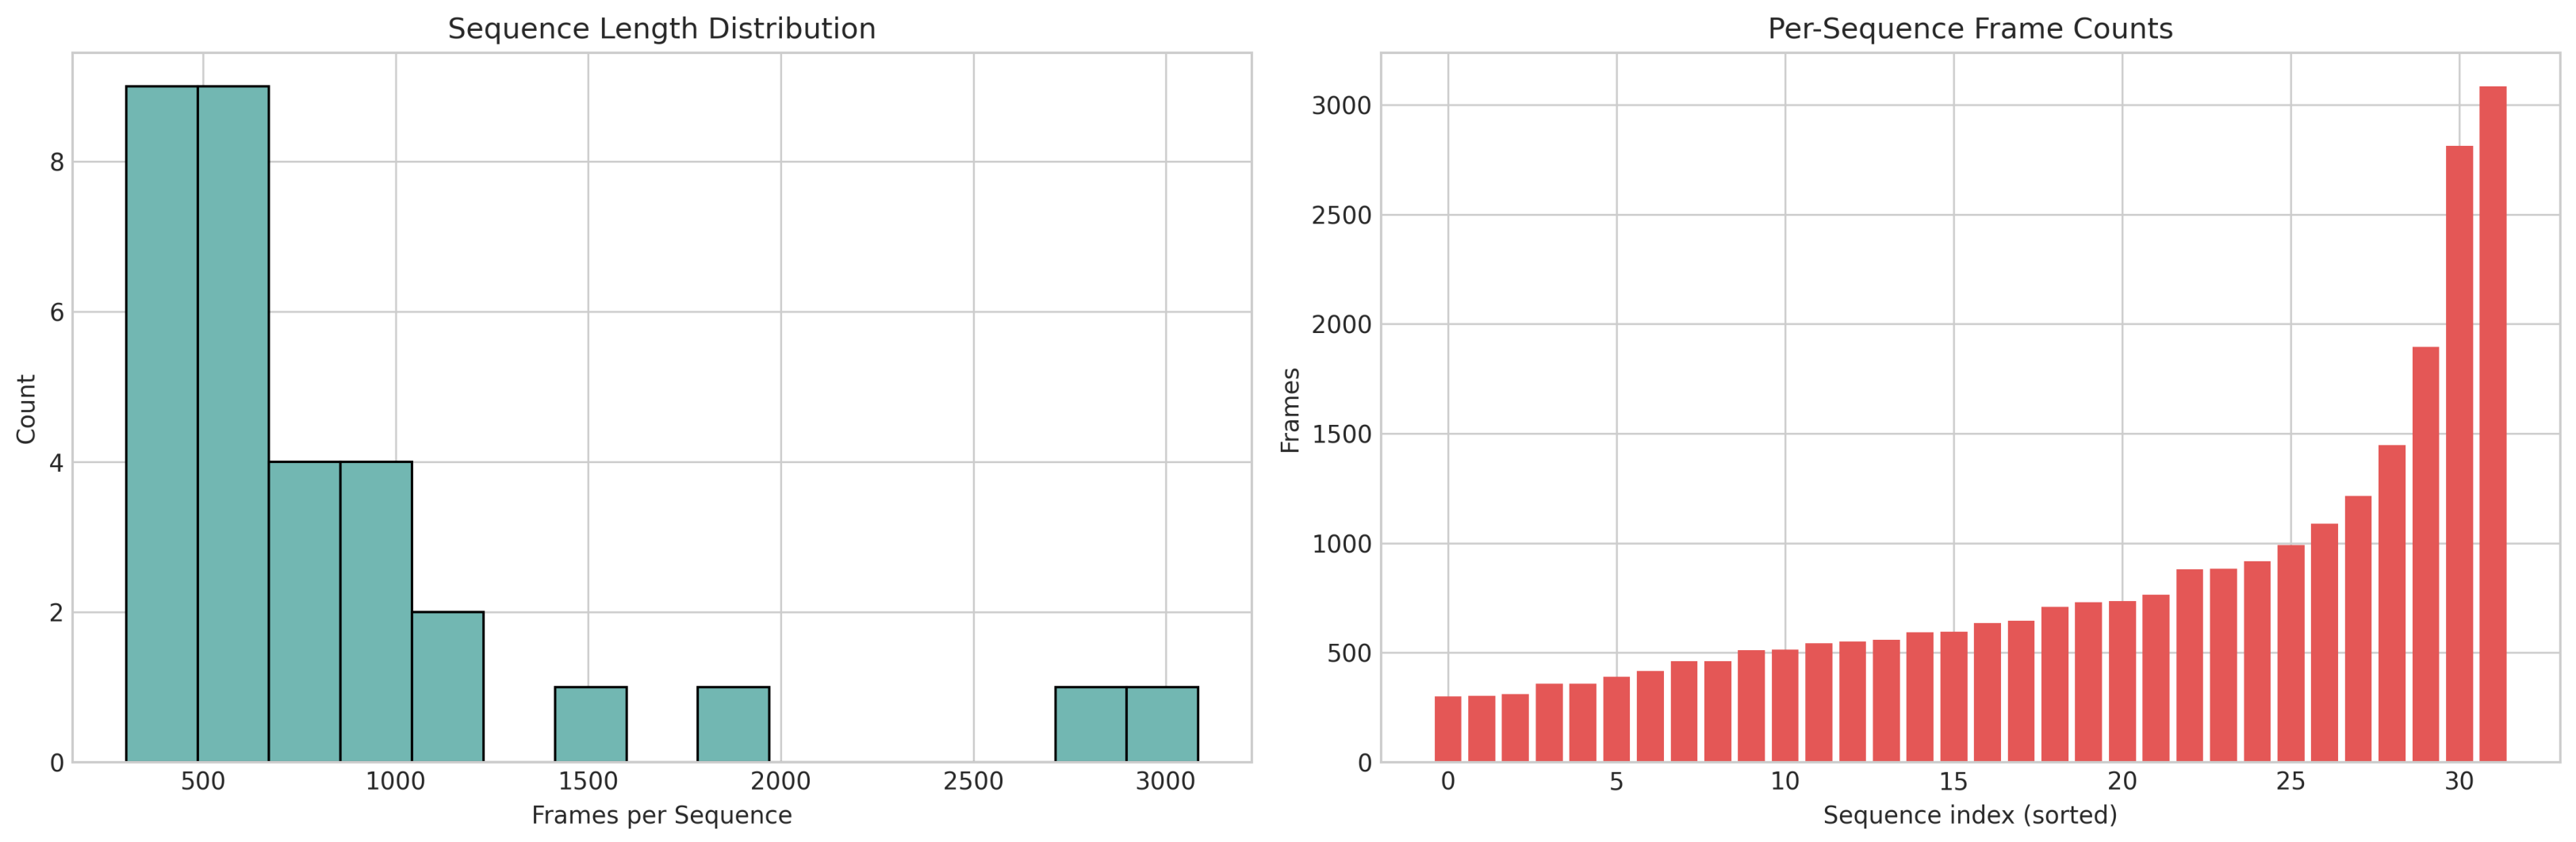
The dataset subset comprises 32 sequences across 18 environments (abandonedfactory, abandonedfactory_night, amusement, carwelding, endofworld, gascola, hospital, japanesealley, neighborhood, ocean, office, office2, oldtown, seasidetown, seasonsforest, seasonsforest_winter, soulcity, westerndesert). A statistical breakdown by environment and difficulty level is presented in
Table 2. The distribution of sequence lengths, shown in
Figure 1, includes both short and long trajectories.
The official TartanAir Visual SLAM ME/MH challenge split was considered, but ultimately not used for the RGB-D ablation, because aligned depth maps are not part of the monocular challenge archive and the testing split withholds the ground-truth poses to preserve leaderboard integrity. Since this study depends on per-sequence ATE and RPE values, the 32-sequence TartanAir validation split used by DROID-SLAM [
20] and DPVO [
21], which is derived from the public TartanAir training trajectories, was selected as the de facto standard community validation benchmark instead. For reproducibility, the exact dataset split used in the experiments is published on Kaggle [
11]. This subset exposes the pipelines to the structural extremes typical of UAV navigation, including both feature-rich outdoor baselines and indoor environments with textureless walls, repetitive structures, and artificial lighting. The inclusion of both easy (smooth flight) and hard (aggressive rotational motion) sequences exposes specific failure regimes and supports comparison of the trade-offs between RGB-only and RGB-D backends under both regimes.
3.3. Sparse 2D Correspondence Extraction
Two sparse correspondence frontends were used. The KLT optical-flow tracking [
25,
26] detects up to 1000 Shi–Tomasi corners and tracks them with pyramidal Lucas–Kanade optical flow using a
window and three pyramid levels. The ORB [
27] detects up to 2000 binary keypoints, matches descriptors with Hamming distance, and applies a Lowe ratio threshold of 0.7. For synthetic correspondence evaluation, an inlier ratio of 0.6 was used. These parameters were kept fixed when switching between the Essential Matrix and PnP backends.
3.4. Pose Estimation Backends
The two isolated geometric backends were evaluated using the previously extracted sparse correspondences.
For the monocular configuration, the 2D-to-2D correspondences established between consecutive frames are passed to Essential Matrix estimation based on the epipolar constraint , where and represent normalized image coordinates. In contrast to the PnP branch, no depth gating is applied to these correspondences. RANSAC is used for outlier rejection and recovery of the Essential Matrix ; the relative rotation and translation direction are then decomposed via singular value decomposition (SVD). Consequently, this backend generates a scale-ambiguous monocular motion estimate, which requires an external scale prior for absolute trajectory reconstruction.
In contrast to the monocular setup, the multimodal configuration pairs the identical 2D image correspondences directly with the corresponding per-pixel depth maps to recover metric-scale translations. Reference-frame points are back-projected into 3D Cartesian space using the standard transformations , , and . Only finite depth samples bounded within the interval m are accepted by the PnP backend. The camera intrinsics are fixed at , , and for all images. The metric relative pose is estimated with OpenCV PnP-RANSAC, using the EPNP algorithm, 100 iterations, a 2-pixel reprojection threshold, a confidence level of 0.99, a minimum of 12 inliers, and a maximum accepted translation norm of 5 m.
3.5. Geometric Interpretation and Expected Failure Modes
The central distinction between the compared backends is the observability of metric translation scale. In the RGB-only branch, each normalized correspondence satisfies the epipolar constraint.
where
is the relative rotation and
is the translation direction. Scaling the translation vector by any positive scalar leaves the epipolar constraint unchanged. The two-view Essential Matrix backend therefore recovers the translation direction but not its metric magnitude without an external scale prior. This explains why the monocular trajectory is evaluated after a Sim(3) alignment with scale, and why scale drift accumulates during frame-to-frame integration.
The RGB-D PnP branch changes the problem from 2D-to-2D epipolar geometry to 3D-to-2D reprojection geometry. For each accepted depth value, the reference-frame image coordinate is lifted to a metric 3D point,
and the relative pose is estimated by minimizing the reprojection residuals,
Depth supplies metric scale before pose estimation. PnP is therefore expected to reduce translational drift when the 2D correspondences, camera intrinsics, depth values, and RGB-D alignment are mutually consistent.
This advantage holds under conditions. Perturbing the back-projected 3D point gives the first-order relation
which shows that depth noise, intrinsic-calibration error, RGB-D registration error, and feature localization error all enter directly into the 3D point consumed by PnP. In an actual flight environment, further effects such as rolling-shutter distortion, vibration, exposure changes, depth invalidation, and RGB-depth time offset can perturb the reprojection residuals. Under these conditions, the metric depth channel may no longer dominate the error budget. A PnP estimate based on corrupted depth-supported inliers can then become less stable than an Essential Matrix estimate that requires only consistent two-view bearing directions.
On this basis, the expected qualitative behavior is as follows. First, PnP should provide the largest benefit at small temporal strides and under visually stable conditions, because the frontend supplies coherent correspondences and the oracle depth fixes metric scale. Second, the benefit should be stronger for translational trajectory metrics than for pure rotational error, since the main contribution of depth is scale observability. Third, KLT-based PnP should degrade at large temporal strides, when optical-flow tracking violates its small-displacement assumption and transfers poor correspondences into the metric solver. Finally, the isolated solver latency measurements should be read only as backend-call costs, because the end-to-end timing of a real UAV perception stack also depends on sensing, synchronization, rectification, feature extraction, depth handling, and thermal behavior.
3.6. Evaluation Metrics and Alignment Policy
The estimated trajectory is compared with the ground-truth trajectory using the ATE and translational RPE metrics. Since the Essential Matrix backend produces scale-ambiguous translation directions, the ATE for the corresponding Essential trajectories is computed after global Sim(3) Umeyama alignment with scale. For the PnP trajectories, the same Umeyama alignment is applied, but the scale is fixed to one, functioning de facto as an SE(3) alignment. This policy avoids unfair penalization of monocular estimates caused by arbitrary global scale, while preserving the distinction that only the RGB-D PnP framework estimates metric translation during online pose integration.
The ATE is formally reported as the Root Mean Square Error (RMSE) of the aligned translation residuals. The RPE is computed after the same alignment procedure and is represented as the RMSE of the local translation-increment errors, while the rotational RPE captures angular drift over the equivalent increments:
where
denotes the aligned estimated trajectory and
throughout all reported tables. Missing or non-finite sequence-level ATE/RPE values, which can arise from degenerate saved trajectories or non-finite alignment outcomes, are excluded from the finite summary statistics.
For each aggregated table entry, the finite sequence-level errors are summarized by providing the mean, standard deviation, median, IQR, and a bootstrap 95% confidence interval over the sequence means. The detailed per-sequence result table is retained as a reproducibility artifact.
The solver-level latency experiment complements the geometric distinction formalized in
Section 3.5. The Essential Matrix branch relies on five-point sampling inside RANSAC [
5,
31], whereas the evaluated RGB-D branch uses the EPnP solver family inside PnP-RANSAC [
6]. Although the smaller effective sample requirements characteristic of PnP-family solvers can reduce the overall RANSAC complexity, the empirical runtime is additionally dependent on the OpenCV implementation, the chosen solver, and the total correspondence count.
The algorithmic latency associated with the isolated geometric backends was benchmarked on synthetic correspondences using both a local workstation and a Raspberry Pi 4 Model B edge board. The workstation runs Linux (Windows Subsystem for Linux (WSL2), kernel 6.6) on an AMD Ryzen 9 7900X CPU (Advanced Micro Devices, Inc., Santa Clara, CA, USA; 12 cores, 24 hardware threads) with 64 GB system Random Access Memory (RAM); the reported solver times are CPU-only and bypass Graphics Processing Unit (GPU) acceleration. The edge device is a Raspberry Pi 4 Model B board (Raspberry Pi Holdings plc, Cambridge, UK) running Raspberry Pi OS (64-bit Advanced RISC Machine (ARM) Linux) on the Broadcom BCM2711 SoC (Broadcom Inc., Palo Alto, CA, USA); these measurements similarly use the Cortex-A72 CPU cores and avoid off-loading the geometric solvers to the VideoCore GPU. The software stack was Python 3.10 with OpenCV 4.13.0.92, NumPy 2.2.6, SciPy 1.15.3, evo 1.36.3, and Matplotlib 3.10.9. The mean execution time and latency variance across varying quantities of correspondences () were recorded. These timings measure solely the geometry-solver call and exclude feature extraction, image acquisition, camera bus latency, memory pressure, and the impact of thermal throttling.
3.7. Use of Generative Artificial Intelligence Tools
GenAI tools were not used to generate the dataset, experimental measurements, numerical result tables, figures, or final scientific conclusions reported in this study. Where AI-assisted suggestions were used for manuscript organization, language editing, LaTeX/formatting assistance, or revision drafting, the corresponding text, scripts, numerical outputs, tables, figures, and scientific claims were reviewed and verified by the authors before inclusion.
4. Results and Discussion
Section 4 reports the ATE, ATE under Sim(3) alignment, translational and rotational RPE, robustness trends, qualitative trajectories, and isolated geometry-solver latency for the four sparse VO configurations. The quantitative results must be read within the scope and comparison policy of
Section 3.1. They represent a controlled synthetic ablation of the geometric backend on fixed frontend correspondences. They are not a direct comparison with full SLAM systems or an end-to-end UAV deployment benchmark. The configurations integrate relative poses frame-to-frame without keyframes, local bundle adjustment, or loop closure, and therefore accumulate more drift than typical full SLAM pipelines.
4.1. Key Observations
Before presenting the detailed tables, the main empirical observations can be summarized as follows:
RGB-D PnP gives the clearest translational benefit at small temporal strides. For KLT, ATE decreases by 61.8% at stride 1 and 55.5% at stride 2. For ORB, the reductions are 29.1% and 50.3%.
The benefit depends on the frontend. KLT-PnP loses its ATE advantage at strides 4–8. ORB-PnP keeps a lower mean ATE at all evaluated strides, though the stride-8 ORB ATE gain is small and not statistically significant after correction.
Sim(3) re-alignment of PnP trajectories shows that metric-scale drift explains only 7–16% of the absolute PnP ATE. Most remaining error is trajectory-shape error from correspondence quality, frame-to-frame integration, and solver robustness.
Rotational RPE improves more uniformly than translational ATE under PnP for both frontends. This indicates that the coarse-stride KLT failure is mainly a translation and inlier-quality problem, not a complete rotational collapse.
The Raspberry Pi 4 Model B timings support only a solver-level conclusion. PnP is faster than Essential Matrix estimation at 500 correspondences and above in this implementation. The measurement excludes acquisition, feature extraction, depth handling, and thermal effects.
4.2. Baseline Trajectory Accuracy
The baseline ATE results acquired without RGB degradation are summarized in
Table 3, whereas the corresponding translational RPE values are organized in
Table 4.
For KLT operating at stride 1, the RGB-D PnP backend decreases ATE from m to m, corresponding to a 61.8% reduction. The RPE also decreases from m/frame to m/frame, marking an approximate 61.6% reduction. At stride 2, the identical KLT-PnP configuration remains effective, reducing ATE by 55.5% and RPE by 44.1%.
Nevertheless, the observed KLT behavior changes at coarser temporal strides. At stride 4, KLT-PnP produces slightly higher ATE than KLT-Essential ( m versus m), while the RPE is only marginally lower ( m/frame versus m/frame). At stride 8, KLT-PnP also has worse ATE ( m versus m), although it maintains lower RPE ( m/frame versus m/frame). These results show a distinct depth-assisted advantage at small inter-frame baselines while contradicting the assumption of a uniform ATE advantage across all temporal subsampling conditions.
For ORB, PnP is more consistently favorable throughout the tested baseline conditions. At stride 1, ORB-PnP reduces ATE from m to m and RPE from m/frame to m/frame. At strides 2 and 4, the measured ATE reductions are 50.3% and 45.2%, respectively, with corresponding RPE reductions of 49.7% and 45.6%. At stride 8, the ATE reduction is smaller (9.2%), whereas the RPE remains lower by 23.2%.
The detailed baseline ATE and translational RPE statistics with median, IQR, 95% bootstrap confidence intervals, and per-cell coverage (finite sequence-level estimates out of 32) are reported in
Table 5 and
Table 6, respectively.
To decouple trajectory-shape error from metric-scale drift, the PnP ATE re-aligned with Sim(3) is reported in
Table 7 and
Table 8. For KLT-PnP, Sim(3) alignment reduces ATE from
m to
m at stride 1 and from
m to
m at stride 8; for ORB-PnP, the corresponding reductions are
m to
m at stride 1 and
m to
m at stride 8. Across all four strides, metric-scale drift accounts for 7–16% of the absolute PnP ATE, while the dominant remainder is trajectory-shape error that scale alignment cannot remove. Even after this Sim(3) correction, the PnP trajectory-shape error remains
% lower than the (already Sim(3)-aligned by design) KLT-Essential baseline at stride 1 and
% lower than ORB-Essential at the same stride. These results show that the depth-assisted advantage is not solely a metric-scale phenomenon.
The rotational RPE, reported in
Table 9 and detailed in
Table 10, exhibits a stronger and more uniform PnP advantage than the translational metrics. At stride 1, the rotational RPE is reduced by the depth-assisted PnP from
deg/frame to
deg/frame for KLT (an
% reduction) and from
deg/frame to
deg/frame for ORB (a
% reduction). The PnP advantage is preserved at every tested stride and for both frontends: the KLT-PnP rotational RPE is
%,
%, and
% lower than KLT-Essential at strides 2, 4, and 8, while the ORB-PnP rotational RPE is
%,
%, and
% lower than ORB-Essential at the same strides. In contrast to the KLT-PnP ATE breakdown at strides 4–8, the rotational advantage is not lost at coarser temporal subsampling. This is consistent with the interpretation that the failure mode of KLT-PnP at coarser strides is dominated by translational scale-drift accumulation, not by rotational instability.
The normalization of ATE by the ground-truth trajectory length, reported alongside the absolute values in
Table 5, places these magnitudes between
% and
% of the integrated trajectory length: the best baseline (KLT-PnP, stride 1) drifts at
% of trajectory length and the worst case (KLT-PnP, stride 8) at
%. These percentages are consistent with frame-to-frame relative pose integration without keyframes, local bundle adjustment, or loop closure.
The main small-stride effects are supported by the paired Wilcoxon signed-rank tests over the 32 sequences. The raw and Holm–Bonferroni corrected
p-values across the family of 16 baseline tests (two frontends × four strides × two metrics) are reported in
Table 11. For KLT at strides 1–2, the PnP-vs-Essential ATE differences remain significant after correction (
and
under the one-sided test), and the RPE differences are also significant after correction. For KLT at stride 4, neither ATE nor RPE gives a significant PnP advantage even at the raw level. For ORB, the one-sided PnP-better hypothesis is significant for ATE and RPE at strides 1–4 (
throughout); at stride 8, the ATE one-sided test is not significant after correction, while the RPE remains significant. At KLT stride 8, the two-sided tests indicate that PnP differs from Essential on both ATE and RPE under Holm correction, but the signs of the median differences disagree: PnP is worse on ATE (median
m) and better on RPE (median
m/frame), which is consistent with the frontend-dependent breakdown discussed above.
4.3. Isolated Geometry-Solver Latency
To quantify the solver-level computational scaling, the Essential Matrix estimation and PnP were measured on synthetic correspondences at
. The isolated-backend latency on the local workstation and on the Raspberry Pi 4 Model B is reported in
Table 12 and
Table 13, respectively, with hardware stated in each table caption. Only the geometric solver call is measured by these timings; feature extraction, image acquisition, memory pressure, and thermal effects are not included.
On the local workstation, PnP was faster than Essential Matrix estimation for all tested correspondence counts, ranging from ms versus ms at 100 correspondences to ms versus ms at 5000 correspondences. On the Raspberry Pi 4 Model B, the pattern is not uniform at the smallest sample size: at 100 correspondences, PnP is slower ( ms) than Essential Matrix estimation ( ms). Nevertheless, for 500 correspondences and above, PnP is faster, reaching ms at 5000 correspondences compared with ms for Essential Matrix estimation.
These timings show that the PnP backend has favorable isolated-solver scaling for moderate and large correspondence sets in this implementation. They do not establish end-to-end real-time UAV feasibility, because the full image-processing and hardware pipeline was not benchmarked.
4.4. Robustness to Effective Frame Rate and RGB Degradation
The protocol described in
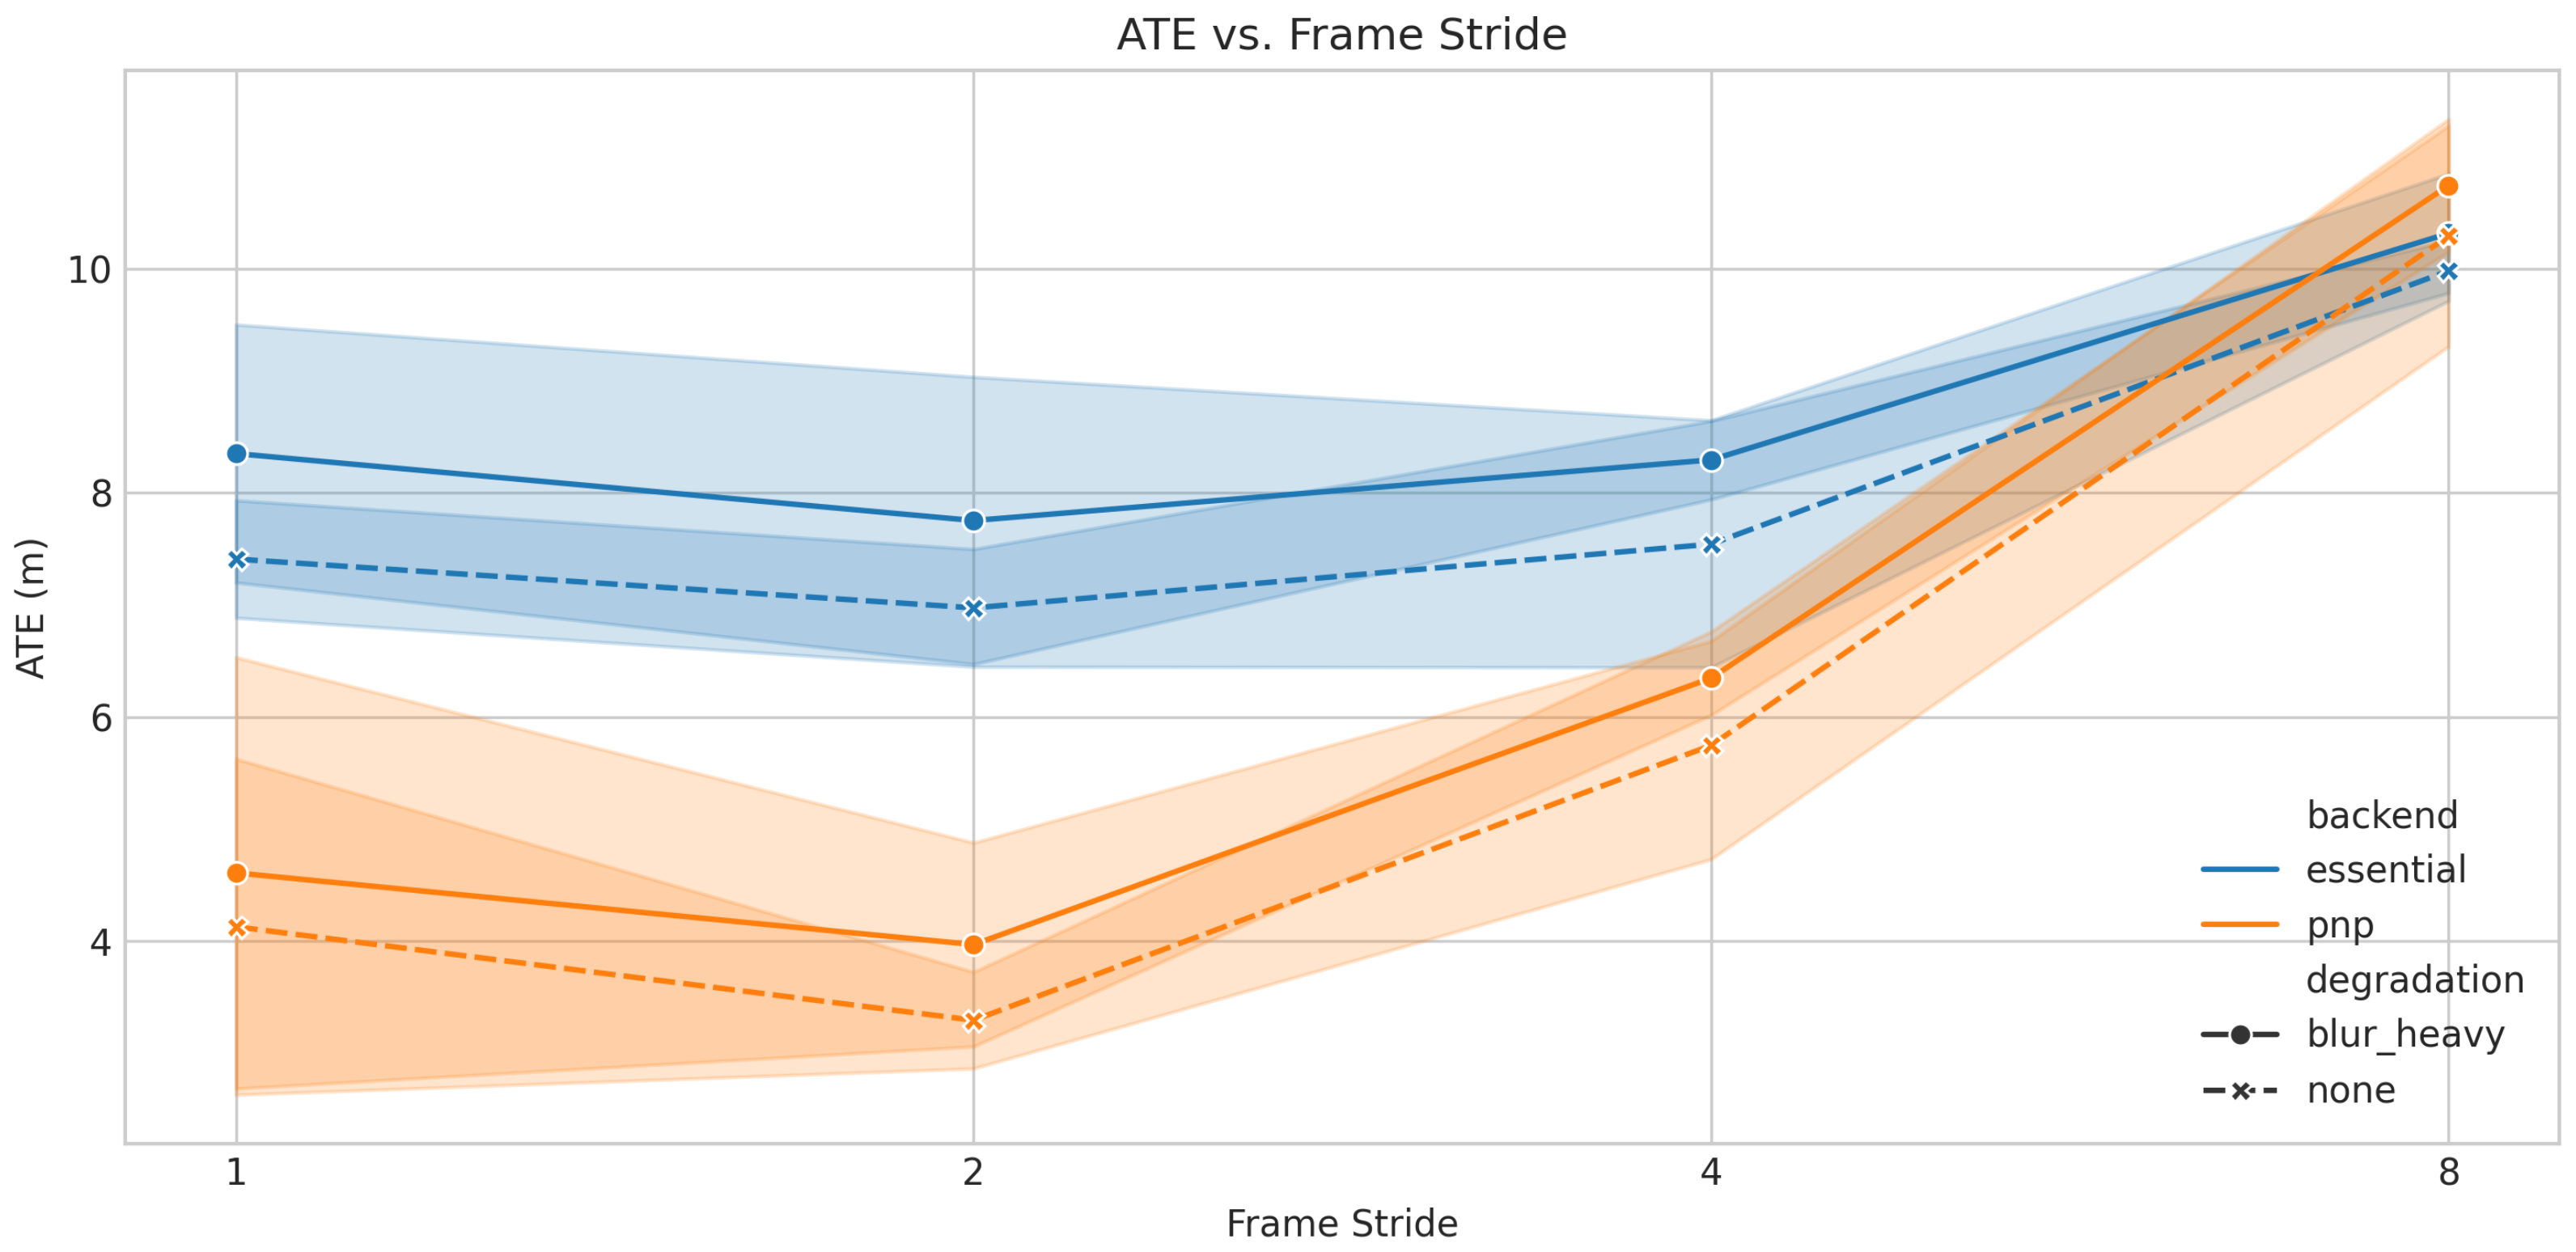
Section 3.2.1 was executed for every combination of frontend, backend, temporal stride, and RGB degradation preset. The mean ATE values at stride 4 are reported in
Table 14, and the trend over temporal stride and degradation is shown in
Figure 2.
The robustness results show that RGB degradation and temporal subsampling increase both error and variance, but do not produce a single monotonic ranking across all frontend/backend pairs. At stride 4, ORB-PnP remains much better than ORB-Essential under all listed degradations. In contrast, KLT-PnP remains close to KLT-Essential and can be slightly worse in the no-degradation condition. This pattern suggests that depth integration is not sufficient by itself when tracked KLT correspondences become less reliable under larger inter-frame motion.
The finite sequence-level ATE and RPE values were produced by all baseline no-degradation configurations. Under degraded ORB configurations, nine non-finite ATE entries were observed, all on the same sequence (ocean_hard_p009) and each affecting one sequence out of 32 in its aggregate. The inspection of the saved trajectories shows that these cases are degenerate zero-motion trajectories caused by insufficient usable ORB correspondences under blur or coarse temporal stride; the affected sequence is excluded from the corresponding finite means.
4.5. Qualitative Trajectory and Depth Examples
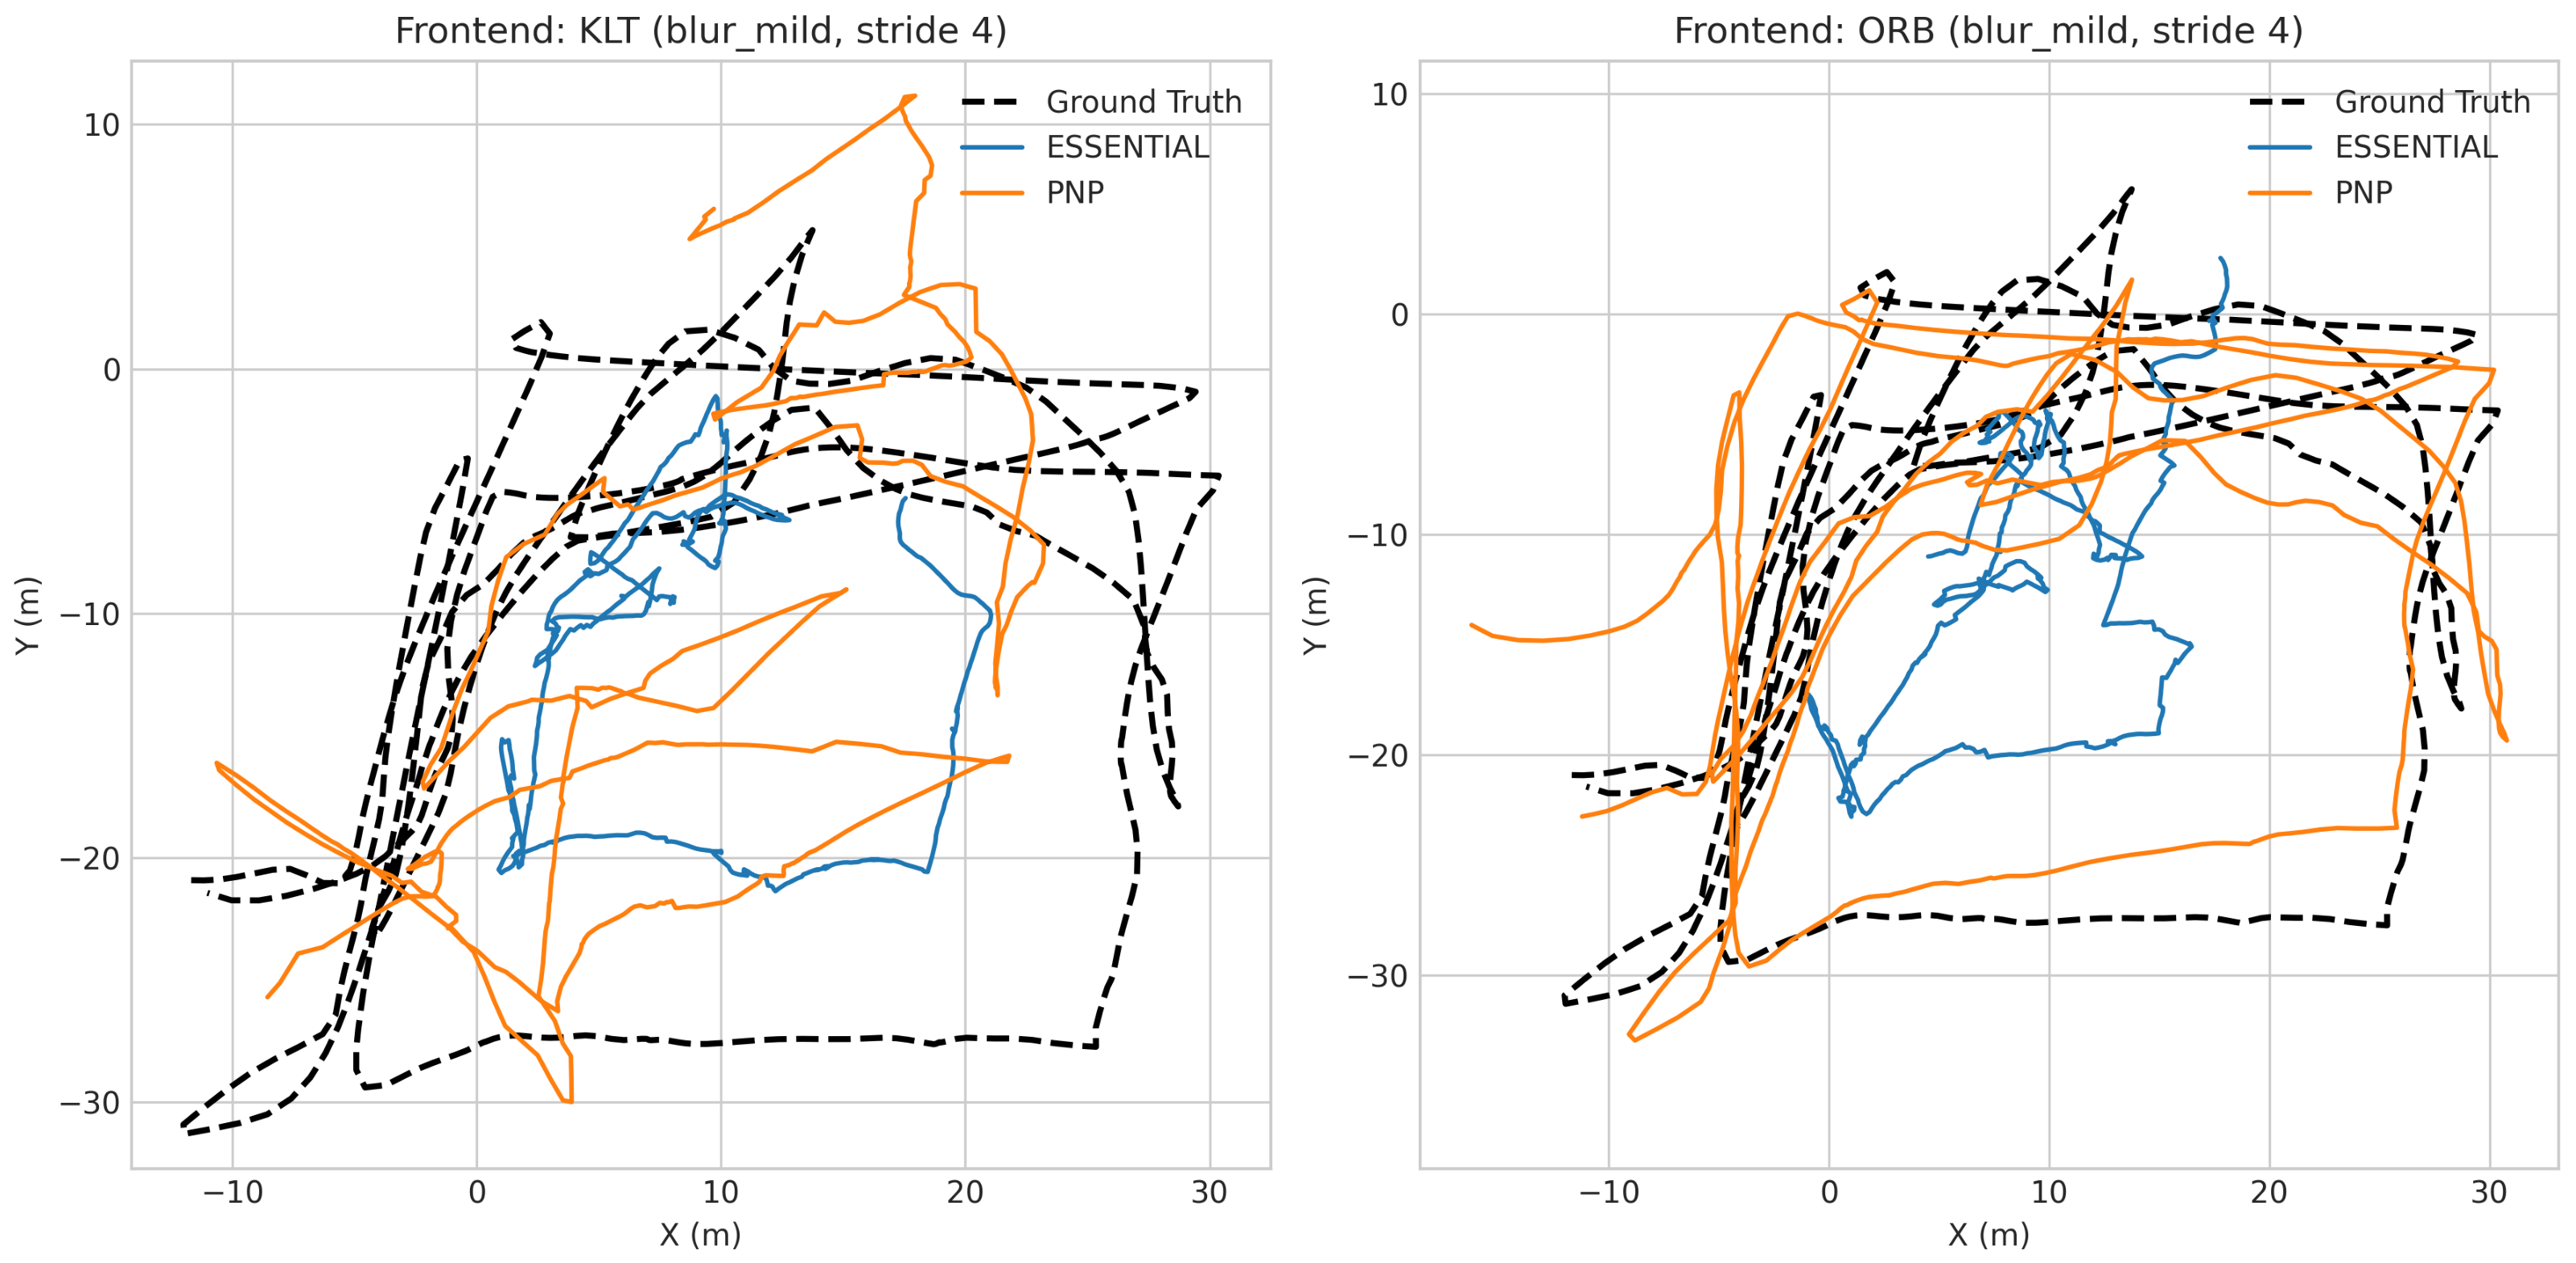
The typical difference between the monocular and RGB-D branches under the selected example sequence is illustrated by the qualitative trajectory comparison in
Figure 3. Because the monocular Essential backend is evaluated after global Sim(3) alignment, the visualization should be read as the comparison of trajectory shape after post hoc scale correction, not as the demonstration that the metric scale was recovered online by the monocular method.
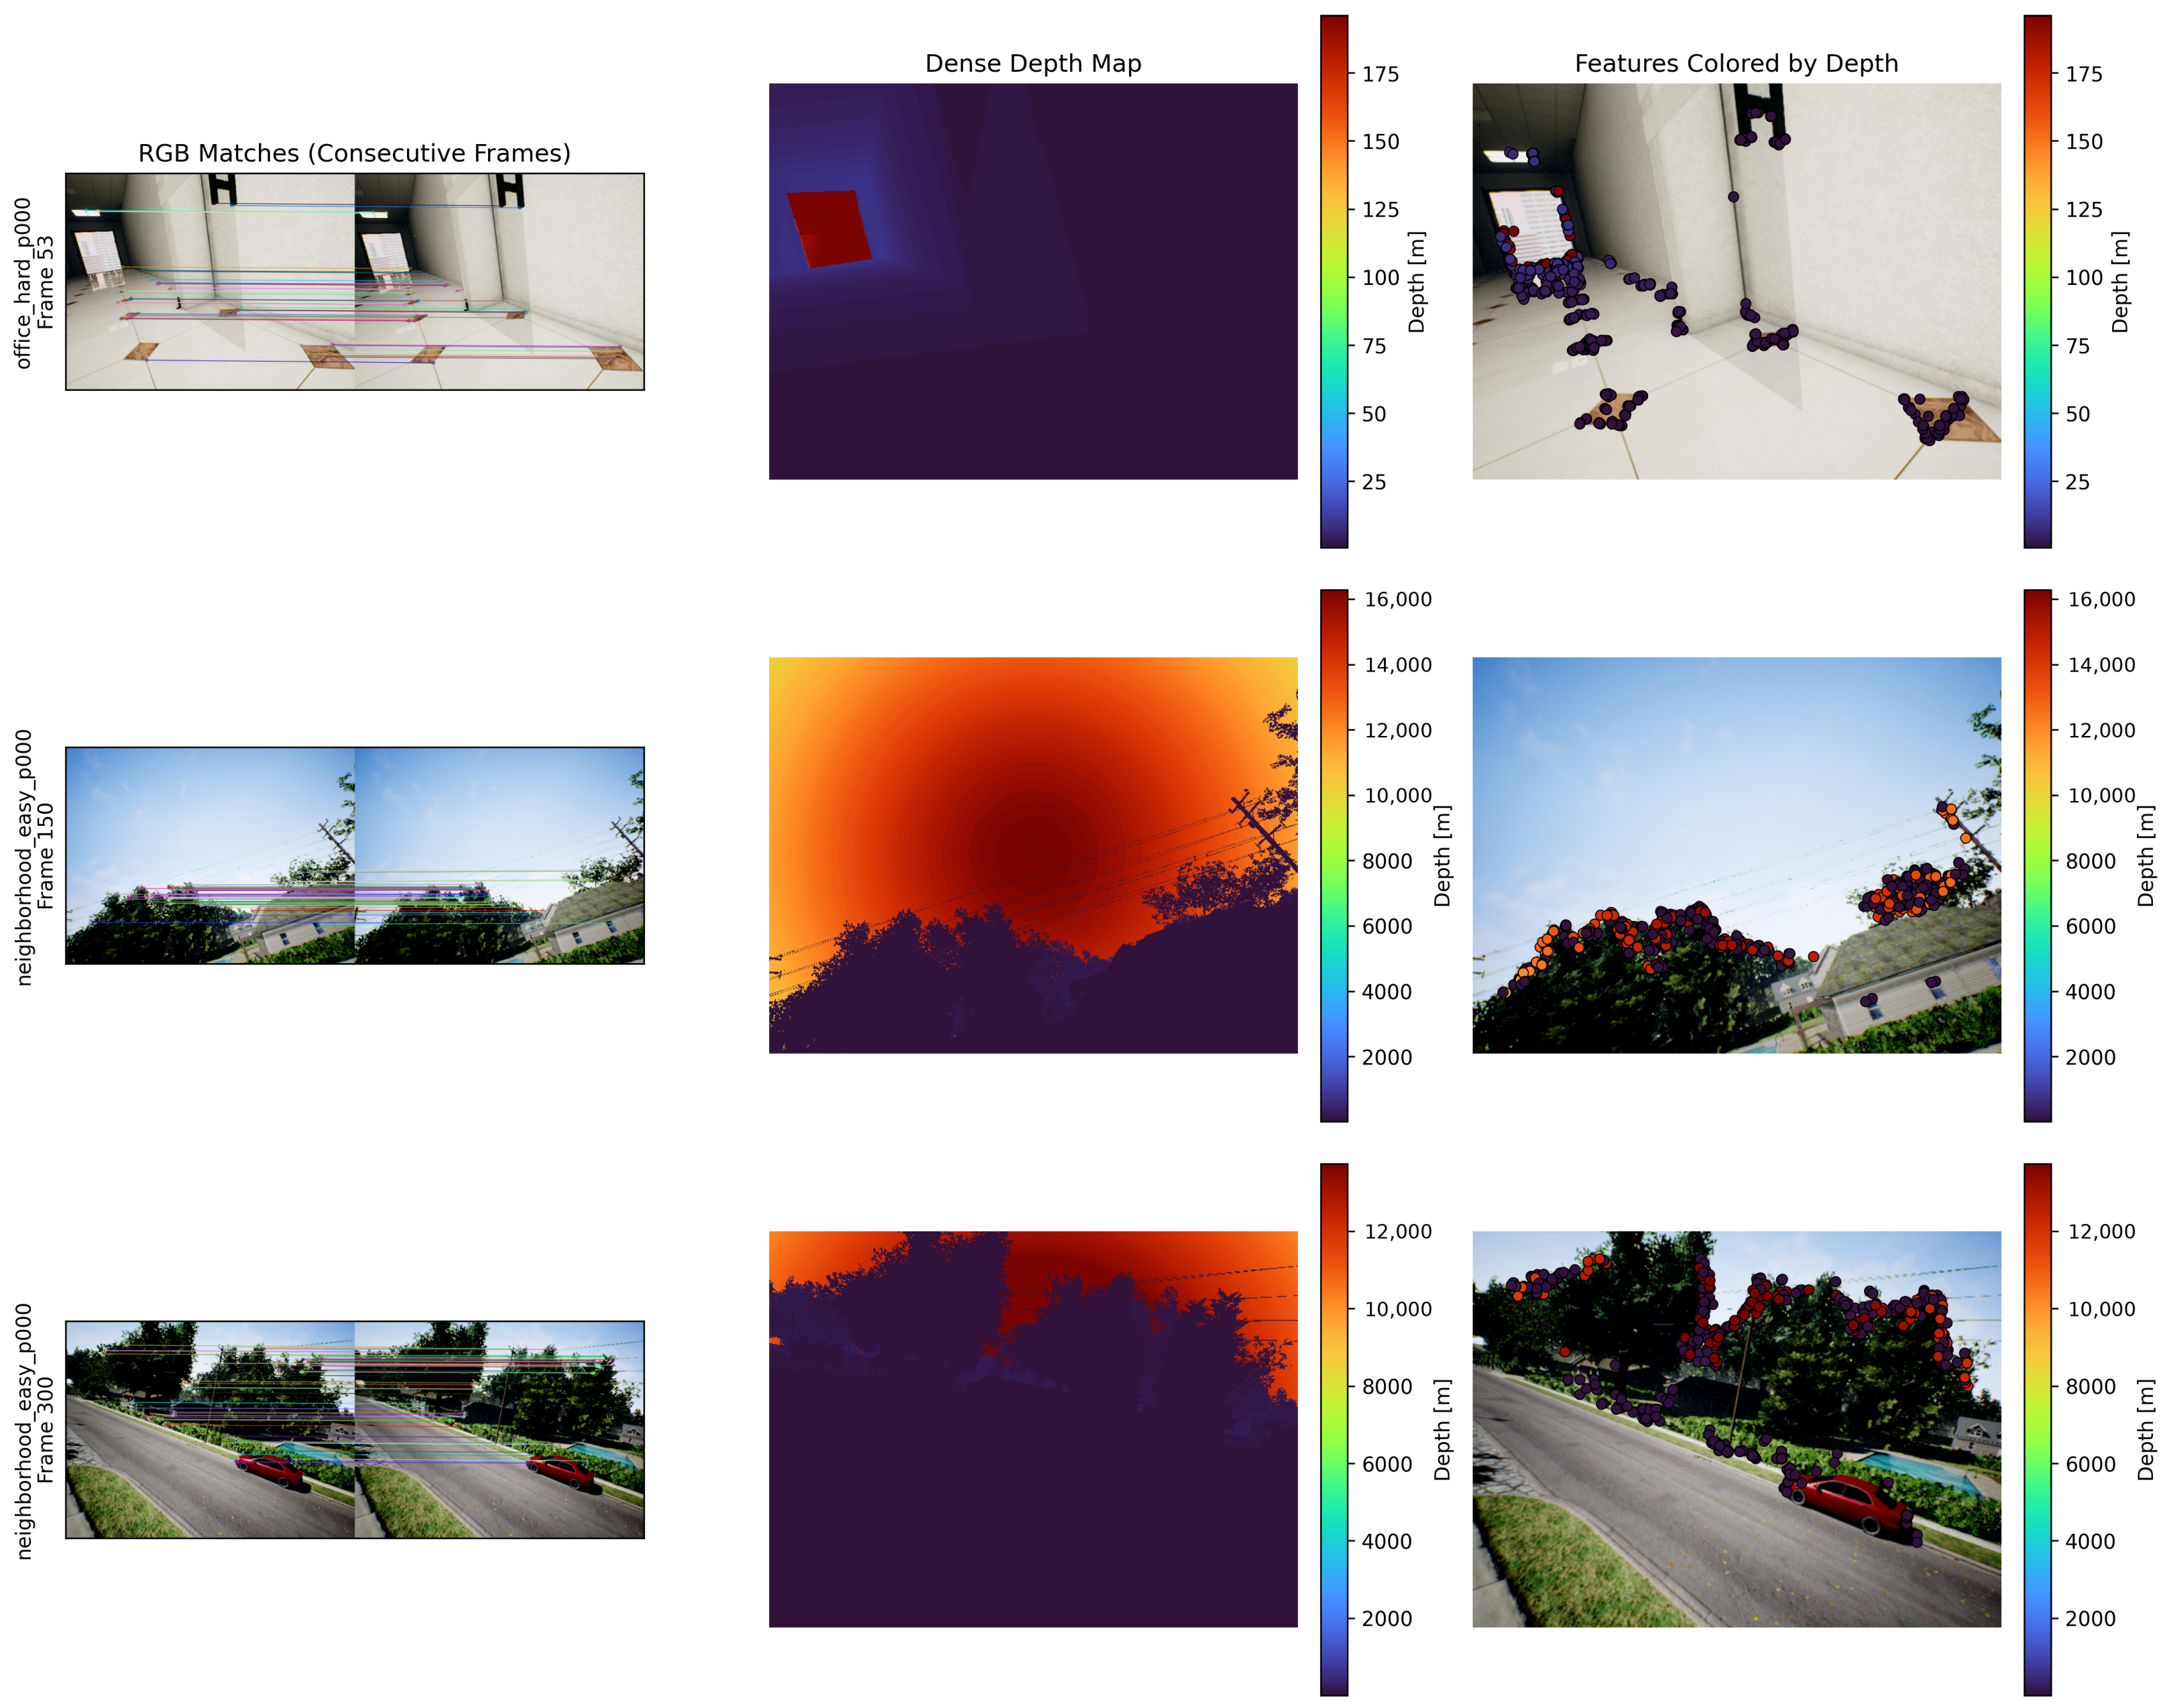
The representative RGB correspondences and aligned depth values are shown in
Figure 4. Very large simulator far-depth values may be included in the displayed depth maps, especially in outdoor sky regions. Not all displayed pixels are used by the PnP backend: only finite depth samples in the configured valid range
m are accepted for 3D back-projection.
5. Limitations
The reported evaluation is formulated as a controlled synthetic ablation. Several limitations are stated explicitly to prevent the empirical claims from extending beyond the conducted protocol.
All experimental evaluations are executed on the simulated TartanAir validation split. The dataset is used as a controlled instrumentation environment, featuring synchronized RGB streams, aligned dense depth, calibrated intrinsics, and noise-free ground-truth poses. In contrast to this controlled regime, real UAV imagery introduces rolling-shutter distortion, auto-exposure transients, time-synchronization errors between RGB and depth sensors, and platform-induced vibration coupling. This limitation is a deliberate design choice, because authentic real-world sensor noise would obscure the pure algorithmic differences distinguishing the compared backends. The results should therefore be interpreted as a theoretical upper bound of performance for minimal perception systems, supplying clean data for the design of robust vision-based control loops.
The implemented RGB-D branch consumes the simulator’s dense, aligned depth maps as an oracle channel, and the depth values are not perturbed under any condition. Real RGB-D sensors, in contrast, generate range-dependent noise (typically growing with the square of the metric range for stereo and time-of-flight devices), exhibit missing or invalid depth readings on glossy and far-field surfaces, and produce multi-path artifacts in time-of-flight devices alongside stereo disparity failures in textureless regions. Thus, the presented RGB-D results characterize the theoretical upper bound of the contribution provided by aligned metric depth to the geometric backend, rather than the behavior of a specific real-world depth sensor. A more realistic synthetic protocol—one that incorporates depth-magnitude-dependent noise alongside random per-pixel invalidation applied directly to the simulator depth maps on the basis of stereo-disparity dropouts and time-of-flight outliers—is reserved for future work and is expected to narrow the reported PnP advantage, particularly at the higher end of the standard operating range.
The protocol assumes the RGB image, depth map, intrinsics, and ground-truth pose timestamps are calibrated and time-aligned. This assumption is rarely exact in real UAV flights. Small errors in focal length, principal point, lens distortion, RGB-D extrinsics, timestamping, or depth-to-color registration perturb the back-projected 3D points used by PnP. Such errors can turn a valid depth-supported correspondence into a biased reprojection constraint. Platform vibration and rolling shutter can also break the rigid global-shutter camera model assumed by both backends. These effects lie outside the present ablation by design. They are expected to reduce the observed RGB-D advantage, unless calibration, synchronization, and depth-validity checks are maintained on board.
The evaluated frontend space is deliberately restricted to two classical correspondence pipelines, namely KLT optical-flow tracking and ORB descriptor matching. Advanced learned detectors and matchers, such as SuperPoint [
33] and SuperGlue [
34], as well as more recent dense matchers, are intentionally excluded from the present evaluation. Since the reported frontend-dependent breakdown of the PnP advantage at coarse temporal strides is a property of the underlying 2D correspondence layer, the conclusions regarding when depth provides a benefit should not be directly extrapolated to learned frontends without re-running the identical backend ablation with those specific correspondences.
The application of the five RGB perturbations summarized in
Table 1 employs deliberately moderate, fixed parameter values, avoiding the implementation of complex per-sequence sensor-calibrated noise models. These perturbations are intended as a controlled methodological probe of frontend robustness, not as a substitute for modeling the full image signal pipeline of an authentic UAV camera.
As detailed in
Section 3.1, fully integrated SLAM systems, such as ORB-SLAM2, SVO, and DSO, are deliberately excluded from the applied comparison baselines. Such systems routinely incorporate keyframing, local bundle adjustment, loop closure mechanisms, and frequently photometric direct optimization, all of which would compensate for and obscure the per-frame geometric backend effect isolated within this study.
Each evaluated system configuration commits to a single geometric backend applied uniformly across the whole sequence: the RGB-only pipelines continuously execute Essential Matrix estimation, and the RGB-D pipelines continuously use PnP, regardless of the fluctuating per-frame correspondence quality. The observed breakdown of KLT-PnP specifically at coarse temporal strides, where the depth-supported inlier set becomes degraded while the classical two-view Essential geometry remains usable, suggests that an adaptive dynamic selector—one capable of switching between PnP and Essential per frame on the basis of the depth-supported inlier count, the residual reprojection statistics, or the quantified validity rate of the depth channel—could recover the superior performance of both backends without modifying the implemented frontend. Since such a selector is neither implemented nor evaluated, the reported quantitative data should be interpreted as the behavior of two fixed backend policies, rather than the maximum achievable envelope of a dynamic backend.
The timing results acquired on the Raspberry Pi 4 Model B and the local workstation, documented in
Table 12 and
Table 13, measure the computational latency of the geometric solver call executed on synthetic correspondences. In contrast to this isolated measurement, authentic end-to-end onboard pipeline timing would include camera I/O, image rectification, feature extraction or tracking, depth-stream handling, memory pressure, and thermal throttling, all of which can dominate the computational budget on constrained edge platforms. The stated numbers bound the geometry-solver contribution to the overall cycle budget, but cannot establish the achievable end-to-end real-time VO or SLAM throughput capacity for any specific UAV hardware configuration.
All four evaluated algorithmic configurations are designed to integrate relative pose on a frame-to-frame basis and avoid the implementation of keyframe selection, sliding-window bundle adjustment, or loop closure techniques. The measured absolute ATE magnitudes therefore accumulate a higher level of drift than any comparably tuned full SLAM stack subjected to the identically provided data; the obtained percentage drift should be considered as a baseline representing simple frame-to-frame integration, rather than a metric indicative of a full SLAM result.
The presented methodological evaluation models a single-agent ego-motion algorithmic pipeline. For comprehensive perception and mapping executed cooperatively by multiple interconnected robots, this local pipeline must be augmented on the basis of reliable map fusion, relative positioning algorithms, and complex distributed bundle adjustment frameworks. Nevertheless, the development of an optimized, lightweight local odometry module remains a mandatory prerequisite for any functional multi-agent system. The anticipated multi-UAV or advanced swarm-level extensions are discussed in
Section 6; the controlled per-agent backend characterization detailed here is intended to serve as a building block for those extensions, rather than as a substitute for them.
6. Conclusions
This paper evaluated the algorithmic trade-offs of minimal sparse VO pipelines through a controlled synthetic ablation. The primary contribution is not a new VO algorithm or a complete UAV navigation system, but a reproducible diagnostic comparison of RGB-only Essential Matrix and RGB-D PnP geometric backends under fixed ORB and KLT frontends, executed on the 32-sequence TartanAir validation split and accompanied by an embedded-platform characterization of the isolated geometry solver. The limitations of this controlled setup are summarized in
Section 5.
The numerical outcomes show that depth-assisted PnP can reduce trajectory error under favorable, small-baseline conditions. Within the baseline stride-1 setting, KLT-PnP reduces the ATE from 6.885 m to 2.633 m (61.8%) and decreases the translational RPE from 0.155 m/frame to 0.061 m/frame (∼61.6%); ORB-PnP reduces the ATE from 7.933 m to 5.627 m (29.1%) and suppresses the translational RPE from 0.203 m/frame to 0.118 m/frame (41.9%). The evaluated rotational error exhibits a stronger and more uniform PnP-related advantage: at stride 1, the rotational RPE drops from 15.119 deg/frame to 2.134 deg/frame for KLT (85.9%) and from 11.801 deg/frame to 2.674 deg/frame for ORB (77.3%), while this reduction is preserved across every tested temporal stride for both frontends. The decomposition of the PnP ATE via Sim(3) alignment demonstrates that a small portion (7–16%) of the absolute accumulated error is directly attributable to metric-scale drift, with the remainder constituting trajectory-shape error that standard scale correction cannot remove. The main caveat is equally important: depth assistance is not sufficient by itself. KLT-PnP fails to improve ATE at coarser temporal strides, where the underlying 2D tracking and depth-supported inlier set become less reliable, whereas ORB-PnP retains a measurable ATE advantage across all tested strides. Thus, the observed benefit of aligned depth is conditional on the stability of the frontend correspondences and the validity of the 3D-to-2D constraints.
The Raspberry Pi 4 Model B measurements in
Table 13 characterize only the isolated geometry-solver call. They indicate that the PnP backend is not the dominant computational obstacle in this controlled setup, but they do not establish end-to-end onboard real-time performance. A deployed VO or SLAM pipeline would also include image acquisition, feature extraction or tracking, depth-stream handling, memory pressure, synchronization, thermal behavior, and integration with higher-level control. Therefore, the results are best interpreted as backend-level evidence for lightweight VO design rather than as validation of a complete UAV, edge, or swarm perception system.
The next research step is to migrate the evaluated protocol from pure simulation onto representative real-world robotic platforms or more realistic sensor models, while maintaining the comparison policy detailed in
Section 3.1. Several concrete research directions, aligned with the limitations outlined in
Section 5, are as follows:
The identical controlled backend ablation protocol should be re-run on representative indoor and small Micro Aerial Vehicle (MAV) real-world datasets, including EuRoC MAV [
36] and TUM RGB-D [
4], using KITTI Odometry [
37] as an established outdoor ground-vehicle comparative reference. This would expose the evaluated algorithmic backends to genuine hardware sensor noise, complex rolling-shutter artifacts, and motion regimes that the currently used synthetic TartanAir validation split does not reproduce.
Before initiating that real-world transition, the underlying synthetic protocol itself should be modified to use a more realistic parameterization. Specifically, adding depth-magnitude-dependent stochastic noise (featuring a variance that grows proportionally with the recorded range to mirror established stereo and time-of-flight hardware characteristics) alongside random per-pixel invalidation applied directly to the simulator depth maps would allow the identical TartanAir split to probe how much of the reported PnP advantage survives once the depth channel stops acting as an oracle, without losing the controlled instrumentation benefits of simulation.
The evaluated frontend space should be widened from the classical KLT and ORB implementations towards learned detectors and modern matchers, including SuperPoint [
33] and SuperGlue [
34] functional pairings, as well as more recent dense matchers. Because the reported translational advantage demonstrated by PnP is dependent upon the frontend formulation and the motion-regime characteristics observed at coarse temporal strides, re-running the identical controlled backend ablation under learned correspondences would clarify whether stronger 2D matches narrow, preserve, or invert the performance gap that the classical frontends presently expose.
Motivated by the documented frontend-dependent operational breakdown of KLT-PnP at coarse strides—whereas KLT-Essential remains usable—a promising algorithmic extension is a dynamic backend selector that routes each consecutive frame through PnP when the depth-supported inlier count, the calculated depth validity ratio, and the PnP reprojection residuals lie within a statistically confident range, while falling back to the Essential algorithm otherwise. Such a selector would preserve the present comparison’s fixed frontend design and could transform the empirical operational caveat reported here into a concrete scientific contribution.
The idealized oracle depth assumption should be replaced by realistic RGB-D streams generated by flight-deployable hardware sensors, such as Intel RealSense D435i, Microsoft Azure Kinect DK, and Luxonis OAK-D-class smart cameras. This would allow the algorithmic contribution of depth to be re-quantified directly under range-dependent depth noise, widespread invalid pixels, and systematic field-of-view mismatch. OAK-D-class devices are especially relevant to the embedded processing thread because they couple a dedicated stereo depth pipeline with a specialized on-device Movidius-class Vision Processing Unit (VPU), which can off-load demanding feature detection, description, or matching from the constrained host CPU.
The presently recorded embedded measurements should be extended from the isolated solver latency evaluation to the end-to-end onboard pipeline throughput analysis executed directly on the Raspberry Pi 4 Model B, NVIDIA Jetson Orin-class high-performance platforms, and specialized OAK-D-style smart-camera edge modules, reporting the accumulated drift measured over total flight time, the algorithmic recovery rate achieved after severe depth dropouts, and the total wall-clock VO/SLAM execution latency—simultaneously including camera Input/Output (I/O), initial feature extraction, and complete depth handling operations, rather than evaluating the isolated geometry solver alone.




 ,
,