Abstract
Loss of hand functions, often manifesting in the form of weakness or spasticity from conditions like stroke or multiple sclerosis, poses challenges in performing activities of daily living (ADLs). The broad area of rehabilitation robotics provides the tools and knowledge necessary for implementing efficient restorative therapies. These therapies aim to improve hand functionality with minimal therapist intervention. However, the human hand evolved for various precision and power gripping tasks, with its intricate anatomy featuring a large number of degrees of freedom—up to 31—which hinder its modeling in many rehabilitation scenarios. In the process of designing prosthetic devices, instrumented gloves, and rehabilitation devices, there is a clear need to obtain simplified rehabilitation-oriented hand models without compromising their representativeness across the population. This is where the concept of kinematic reduction, focusing on specific grasps, becomes essential. Thus, the objective of this study is to uncover the intra-finger dependencies during finger flexion/extension by analyzing a comprehensive database containing recorded trajectories for 23 different functional movements related to ADLs, involving 77 test subjects. The initial phase involves data wrangling, followed by correlation analysis aimed at selecting 116 dependency-movement relationships across all grasps. A regularized generalized linear model is then applied to select uncorrelated predictors, while a linear mixed-effect model, with reductions based on both predictor significance and effect size, is used for modeling the dependencies. As a final step, agglomerative clustering of models is performed to further facilitate flexibility in tradeoffs in hand model accuracy/reduction, allowing the modeling of finger flexion extensions using 5–15 degrees of freedom only.
1. Introduction
The worldwide increasing occurrence of the hindrance of hand functions, often caused by conditions such as stroke or multiple sclerosis, poses challenges in performing activities of daily living (ADLs) and represents a growing societal challenge. Ensuring timely, frequent, and intensive administration of physical therapy, crucial for effective recovery, is challenging [1]. The recent literature suggests that utilizing robotic-assisted rehabilitation emerges as a viable solution to this issue, with minimal therapist interventions [2]. The human hand, characterized by its intricate anatomy featuring up to 31 degrees of freedom (DOFs) [3], evolved to perform various precision and power gripping tasks. However, designing prosthetic devices, instrumented gloves, and rehabilitation devices to mimic anthropomorphic hand features entirely is not feasible due to the high dimensionality of the kinematic problems, spatial constraints, and hand dexterity. Therefore, one of the primary challenges in designing hand robotic rehabilitation devices involves selecting appropriate movement subsets or grasp typologies to optimize the recovery of ADL. Kinematic models should incorporate the minimal possible number of DOFs while fully satisfying the intended functionality and possessing the capability to accurately predict grasping types essential for performing ADLs, such as opening a bottle, using a knife, or holding a pen [4].
To develop reduced and representative kinematic models, conducting research and comprehending hand kinematics through experimentally recorded hand movements is imperative [5]. In [6], the authors implemented a musculoskeletal model of the upper extremity, including the wrist, index finger, and thumb, while the authors in [7] extended the research to include other fingers, both using OpenSim [8]. Authors in [3] utilized the AnyBody Modeling System™ to implement a comprehensive model. The intention of the mentioned studies was primarily to present detailed hand models for comprehensive musculoskeletal research, rather than focusing on reducing the DOFs. In the studies [8,9], reduced kinematic models were presented. Still, they were based on a limited number of subjects, usually less than 10, while the considered grasps were divided into prismatic and circular types only. In [10], the authors developed a pneumatically driven soft robotic hand based on a kinematic model derived from experiments conducted on only six subjects. They relate proximal interphalangeal (PIP) and distal interphalangeal (DIP) joints linearly. In [11], the authors characterized fingertip trajectories during reach-and-grasp studies on 10 healthy subjects performing five different grasps. Using correlation analysis, they found the approximate linearity in the relationship between PIP and metacarpophalangeal (MCP), as well as DIP and PIP joint angles. However, they obtained a relatively low PIP–DIP slope of 0.3, compared to [9,10], which suggested a higher PIP–DIP slope of ⅔. In [12], the authors focused on hand model kinematic reductions using principal component analysis (PCA), but with six subjects grasping cylinder shapes only. The study conducted by [13] involved 22 subjects, which facilitated grouping 26 grasps with similar kinematics related to ADLs, and identifying five sparse hand synergies using PCA. In [14], 24 subjects participated in 24 ADLs, utilizing PCA with Varimax rotation to minimize the number of DOFs in each synergy, resulting in truly sparse synergies. Two core synergies associated with PIP and MCP finger joint flexions were identified. Conversely, Ref. [15] argues, based on data from six subjects grasping nine objects, that the commonly used PCA method in synergy detection fails to reveal sparse synergies, instead utilizing a combination of all available DOFs. Consequently, alternative methods such as l1 regularization and sparse dictionary learning have been proposed.
The focus of this study is to present grasp-oriented intra-finger dependencies, aiming to obtain relatively accurate yet simple and applicable sparse models of human hand movements. If successfully developed, these models would enable the development of far more versatile and anthropomorphic robotic rehabilitation devices and prosthetic hands. For modeling joint dependencies during grasping, we utilized the largest known database of human hand movements [16], comprising synchronously collected values of joint angles in degrees [4]. These data encompass 77 test subjects performing 23 different functional movements (grasps) related to ADLs. Due to the variety of subjects and grasps present in the database, authors analyzing synergies using the same dataset and PCA approach [17] obtained 12 synergies to account for only 80% of the variability, a much higher number than presented in the recent literature. However, since each synergy is a linear combination of all available DOFs, implementing all 12 synergies for prosthetic or rehabilitation device design or control is a complex task. Thus, we attempted to complement the synergy-based approach by introducing simpler 1-to-1 joint dependency relations.
The first step of the approach involved decoupling each grasp into its constituent joint movements and focusing only on 16 finger joints performing flexion/extension. Due to the hand anatomy, these joints cover most of the hand’s ranges of motion (ROM) [18]. Then, the dataset was prepared using summary statistics and joint anatomical ROM. We grouped the prepared constituent joint movements into pairwise intra-finger joint dependencies, followed by computing correlation matrices between the pairs belonging to each finger, to achieve an insight into possible relationships. Based on correlations, we identified 116 highly to very highly correlated dependency-movement relationships for modeling (i.e., motions belonging to certain grasps). Each relationship is modeled using a regularized and relaxed generalized linear model (GLM) [19] for uncorrelated predictor selection. The selected predictors are then used in a weighted linear mixed-effects model to include both subject random-effects and dependency fixed-effects. The models are further reduced using both predictor significance and effect size. Subsequently, we conducted agglomerative model clustering based on similarity to reduce the number of necessary models for kinematic reduction from 116 to the proposed 30. Finally, we synthesized the results by presenting the remaining independent DOFs for finger flexions/extensions during each of the 23 grasps.
Following the described approach, our study achieved several key contributions:
- We introduced refined procedures for data wrangling, generating a meticulously curated dataset for the comprehensive modeling and analysis of human hand movements.
- Our novel approach to modeling intra-finger dependency-movement relationships enabled the establishment of motion patterns for each dependency across all subjects. It generated interpretable and sparse, yet accurate, integrated models. Additionally, it significantly reduced the total number of DOFs involved in grasping for all investigated functional movements.
- Applying hierarchical model clustering enabled flexibility in reducing the number of models capable of describing all 116 identified dependencies with a desired error margin. Based on the similarity in coefficients, we proposed 30 such model clusters.
2. Materials and Methods
The analysis in the performed study is based on the publicly available NinaPro multimodal database [16], which comprises a large dataset of human hand movements [4]. It includes kinematic data from 77 healthy subjects acquired with a Cyberglove-II fitted with 22 resistive sensors. A linear relationship is assumed between the output and the measured angle for all the sensors. The experiment comprises two exercises: (1) basic movements of the fingers and (2) grasping and functional movements. In this chapter, we outline data wrangling procedures to curate the dataset, modeling methodology, and error metrics.
2.1. Data Relabeling
The dataset was released as part of three multimodal datasets, each with different sampling rates (DB1: 100 Hz, DB2: 2 kHz, and DB5: 200 Hz), including calibrated kinematic data from 27, 40, and 10 subjects, respectively [4]. It should be noted that both hand configurations and functional movements in the DB1 database needed to be relabeled (2 → 1 and 3 → 2, respectively) due to incorrect numbering. Additionally, since several databases have been stitched together, the subject numbering does not coincide with that in DB9_Index [16], so it has also been relabeled. Forty different hand movements have been recorded, along with an additional rest position. Two exercises from [4] are included: Exercise B, labeled (1), and Exercise C, labeled (2).
Exercise B(1):
- 8 isometric and isotonic hand configurations;
- 9 basic movements of the wrist.
Exercise C(2):
- 23 grasping and functional movements (everyday objects).
In the original DB2 dataset, with subjects numbered 28 to 67, the movements for Exercise 2 (referred to as restimulus in the original dataset) had to be renumbered from 1. This was achieved by subtracting 17 from each exercise ID number. The cleaned data is saved for each subject and exercise in a separate .parquet file format (see Table 1 for identifiers).

Table 1.
Identifier table for the cleaned dataset.
The cleaned data is then concatenated by rows into one file (s1-77_e1-2.parquet), consisting of 183,773,343 data points and 22 features containing joint angle values (joint names: Carpometacarpal (CMC), Metacarpophalangeal (MCP), Interphalangeal (IP), Proximal Interphalangeal (PIP), Distal Interphalangeal Joint (DIP), WRIST; finger numbers: 1…5; the notation “f” for flexion/extension, “a” for abduction), along with 9 identifier column, as shown in Table 1.
2.2. Data Preprocessing
The dataset is analyzed using Apache Spark 3.1 in conjunction with the tidyverse package [20] and its R interface, sparklyr [21]. It is important to note that the data preprocessing step is crucial, particularly given the inherent errors in this type of experimental data acquisition, which can result in certain data points representing anatomically impossible movements. In the first step, all not available (NA) values in the dataset are isolated, which leads to the conclusion that the abduction/adduction difference between the index and middle finger contains only NA values. In [4], it is mentioned that those measurements were not included due to sensor noise. Therefore, the MCP2_a column is also omitted in this study. In the resulting dataset, only distinct rows are retained. This decision is made due to the data being sampled over time without timestamps, where certain points were likely duplicated multiple times.
In the second step, only Exercise 2(C) is isolated because it contains grasps and functional movements. All abduction/adduction movements are dropped because they contain angle differences between two adjacent fingers, rather than an absolute finger deviation from the reference point. The rest position is also dropped, reducing the dataset to 25 columns and 50,866,742 rows.
The dataset is further grouped based on subject motion and joint angle. Boxplot data is then generated, including the number of observations (n), as well as the minimum, maximum, mean, median, 1st (Q1), and 3rd (Q3) quartiles. Additionally, the interquartile range (IQR) is calculated as the difference between the cutoff values for the lowest 25% (Q1) and the highest 75% (Q3). The boxplot data is presented at the subject level, disregarding different repetitions, but separately for each joint angle associated with a certain movement. The boxplot data for Exercise 2 are detailed in Table 2. Each subject’s median joint angle is used to construct the boxplots in Figure 1a,b.
Table 2.
Exercise 2 boxplot data explanation.
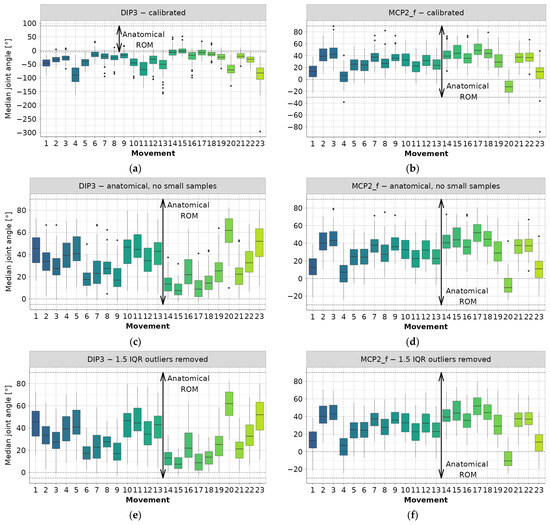
Figure 1.
Example steps for joint angle data preprocessing (colors correspond to movements): (a) DIP3—calibrated data, (b) MCP2_f—calibrated data, (c) DIP3—filtered to anatomical ROM and small samples removed, (d) MCP2_f—filtered to anatomical ROM and small samples removed, (e) DIP3—outliers removed using iterative 1.5 IQR rule, (f) MCP2_f—outliers removed using iterative 1.5 IQR rule.
Only examples containing DIP3 and MCP2_f data are shown, while complete boxplots can be found in the main authors’ GitHub repository [22]. From Figure 1a, it is evident that nearly all median joint angle values fall outside the anatomical angle range. Therefore, it can be concluded that a negative sign has been used for the DIP3 flexion angle. The same observation applies to CMC5, DIP4, and DIP5. The authors of the database [4] also stated that:
“DIP sensors provide reliable angles when a subject’s hand size is large (i.e., when the glove properly fits the hand). They may provide partial results when the hand of the subject is small. Therefore, attention needs to be taken when using the information.”
The same restriction applies to this work. The range of median values for the other joint angles typically aligns with the anatomical range, as demonstrated by the MCP2_f example in Figure 1b. Upon examination of the diagram depicting median joint values for PIP3 and PIP4, it is observed that many measurements fall outside the anatomical range. However, this phenomenon is most likely attributed to sensor noise and hand anthropometrics [4].
The next preprocessing step is to obtain only “valid” data, that is, the data located inside the anatomical range. Therefore, in Figure 1c,d, the sign of the previously mentioned joint angles data is reversed, and all invalid values (i.e., those outside of anatomical ROM according to Table 3) are filled with NA values. The rationale behind filling invalid data with NA, instead of dropping the entire row (observation), is to conserve the data as much as possible for later inferences, since one noisy sensor reading does not imply that all other readings were noisy too.
Table 3.
Anatomical ROM of digits [2,6,9].
The data for each joint angle is aggregated next, per joint type and motion, and the boxplot data are calculated. Then, the mean IQR, averaging all subject IQRs, is calculated to determine the angular range in which 50% of each joint movement is expected to occur (see Figure 1). Data filtering is performed due to the lack of diversification for proper modeling using the following criteria:
- If the sample size is too small (n < 100), fill with NA values;
- If a too-small part of the entire motion is captured (), fill with NA values.
The first phase of filtering resulted in the removal of a large number of outlier values, as evident by comparing the example diagrams in Figure 1a–d. However, a significant number of outlier values still remain in the data, prompting the incorporation of a second elimination phase. This phase involves an iterative procedure, where the 1.5 IQR rule [23] for outlier detection is applied. Joint angle data is once again aggregated per joint type and movement, and medians per subject are used to calculate grouped IQR, as well as the 1st (Q1) and 3rd (Q3) quartiles. Subsequently, all subject median angles falling outside the range between Q1 − 1.5 IQR and Q3 + 1.5 IQR are deemed outliers and removed from the dataset. Data is processed through 6 iterations to remove all outliers, as shown in the examples in Figure 1e,f.
2.3. Data Analysis and Sampling
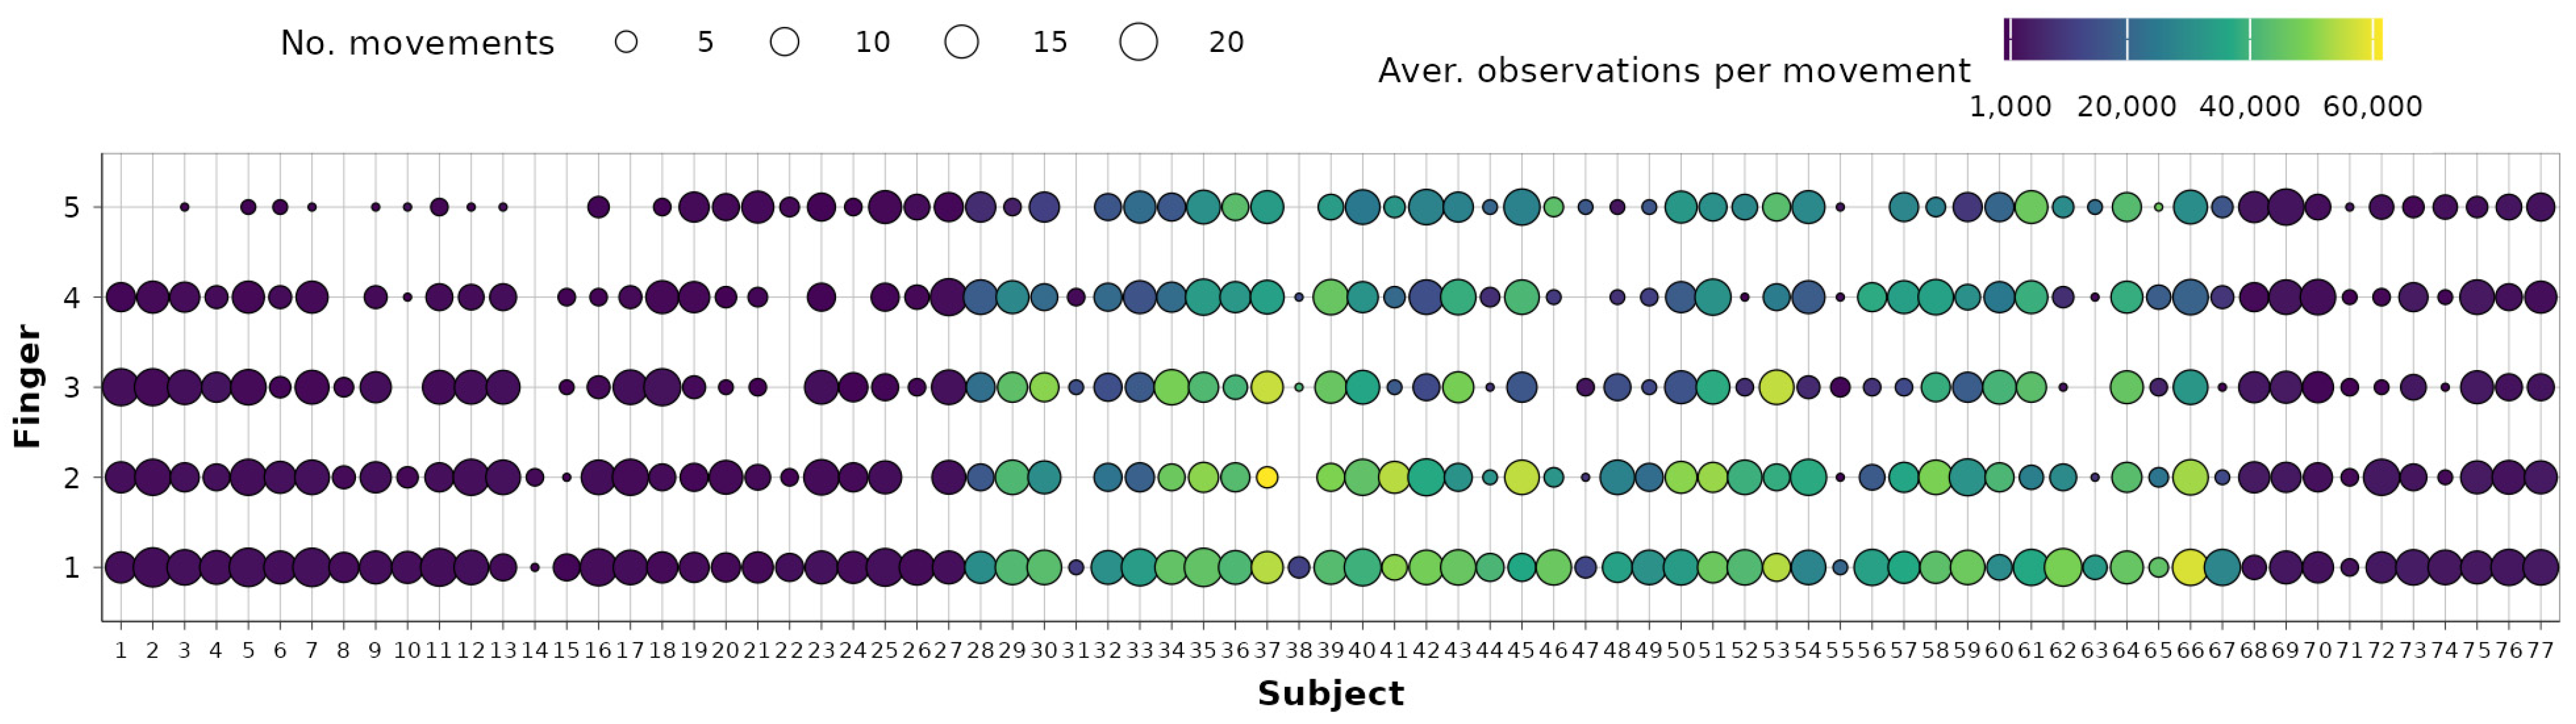
The representativeness of each subject in the entire dataset is also investigated using subject–movement contingency tables for each finger. A condensed table showing the distribution of observations across fingers and subjects is presented in Figure 2. The shape size represents the remaining number of movements (1–23) per subject and for each finger, while the shape fills denote the average number of observations per each movement. It is evident that a clear imbalance exists in the dataset. Specifically, the first 27 subjects, as well as subjects numbered 68–77, typically have up to 3000 observations per movement (including repetitions). In contrast, subjects 28–67, belonging to the second database, usually have between 20,000 and 60,000 observations per movement. This imbalance could pose challenges when using models based on the entire dataset without appropriate sampling strategies.

Figure 2.
Subject–fingers contingency tables after data preprocessing.
Examining Figure 2 further, it is evident that in the case of certain subjects (e.g., subjects 14 and 38), a notable portion of the data was eliminated during earlier preprocessing stages. Additionally, due to the same reason, subjects 1–15 will have minimal impact on little-digit joint dependency modeling. To minimize the effect of unbalanced data and retain variability and generalization ability, it is therefore decided that dependencies will be observed on a repetition level, and each subject repetition will be used as a self-sufficient unit for data analyses.
For further analysis and modeling, a total of 18 intra-finger dependencies are identified, taking into account only 16 finger joints performing flexion/extension, as presented in Table 4. The dependencies are obtained as a combination of all joints comprising a single finger. For the movement basis, a joint closer to the root of the kinematic chain is always selected.
Table 4.
Investigated inter-finger dependencies.
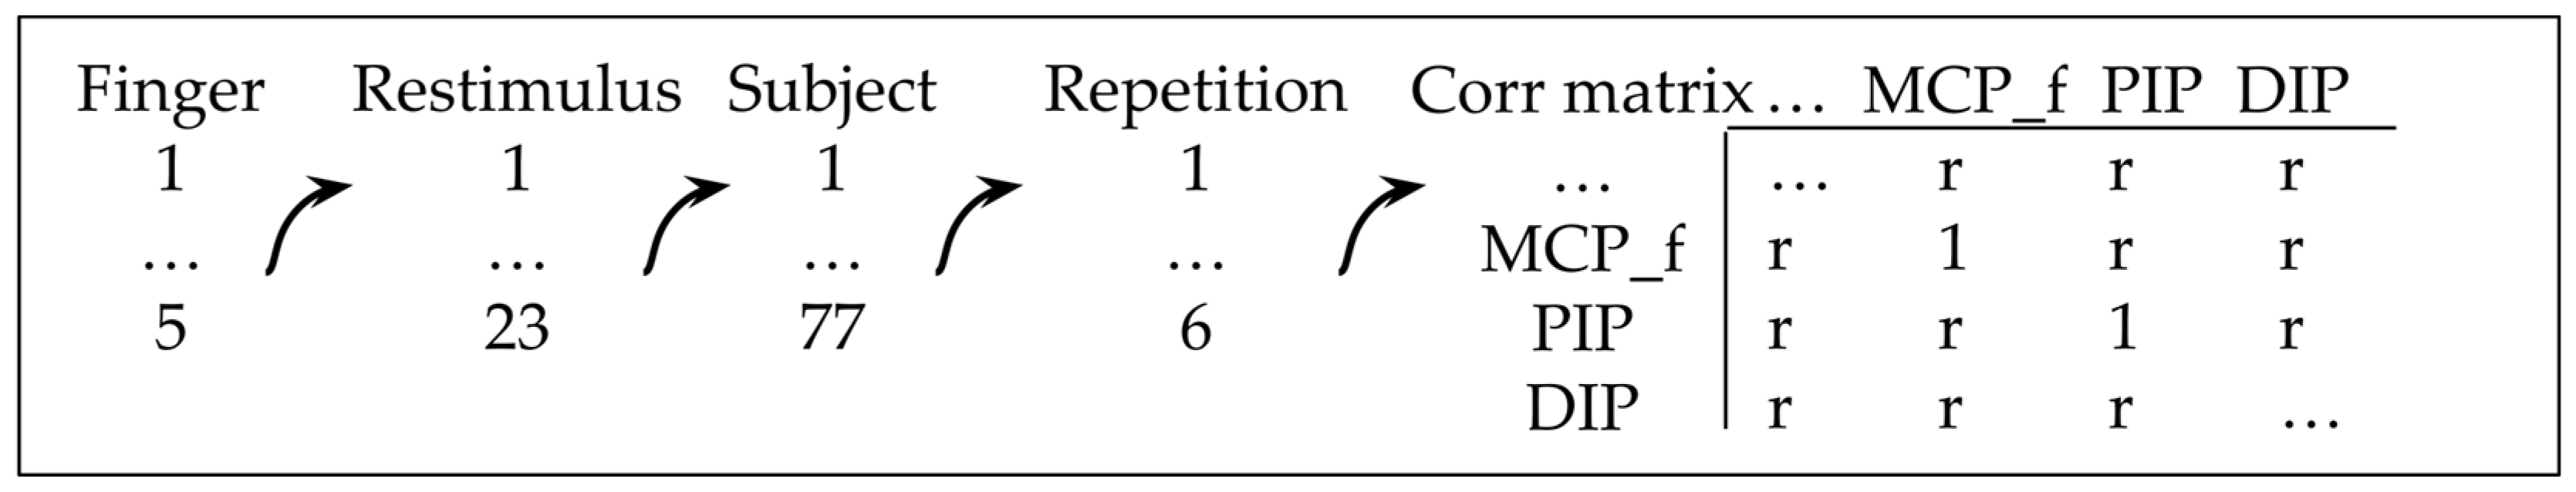
Correlation matrices, which serve as indicators of linearity, are generated for all flexion/extension joints belonging to the same finger, as well as for each motion, subject, and repetition separately, using the procedure outlined in Figure 3. It should be noted that 71,328 correlation coefficients (r) are obtained, ranging between −1 and 1, with between 56 and 358 coefficients present for each joint dependency. This provides, in the authors’ opinion, sufficient statistical power to conclude the nature of the dependency. The significance level for the correlation coefficients was set to 5%.

Figure 3.
The procedure of obtaining correlation matrices.
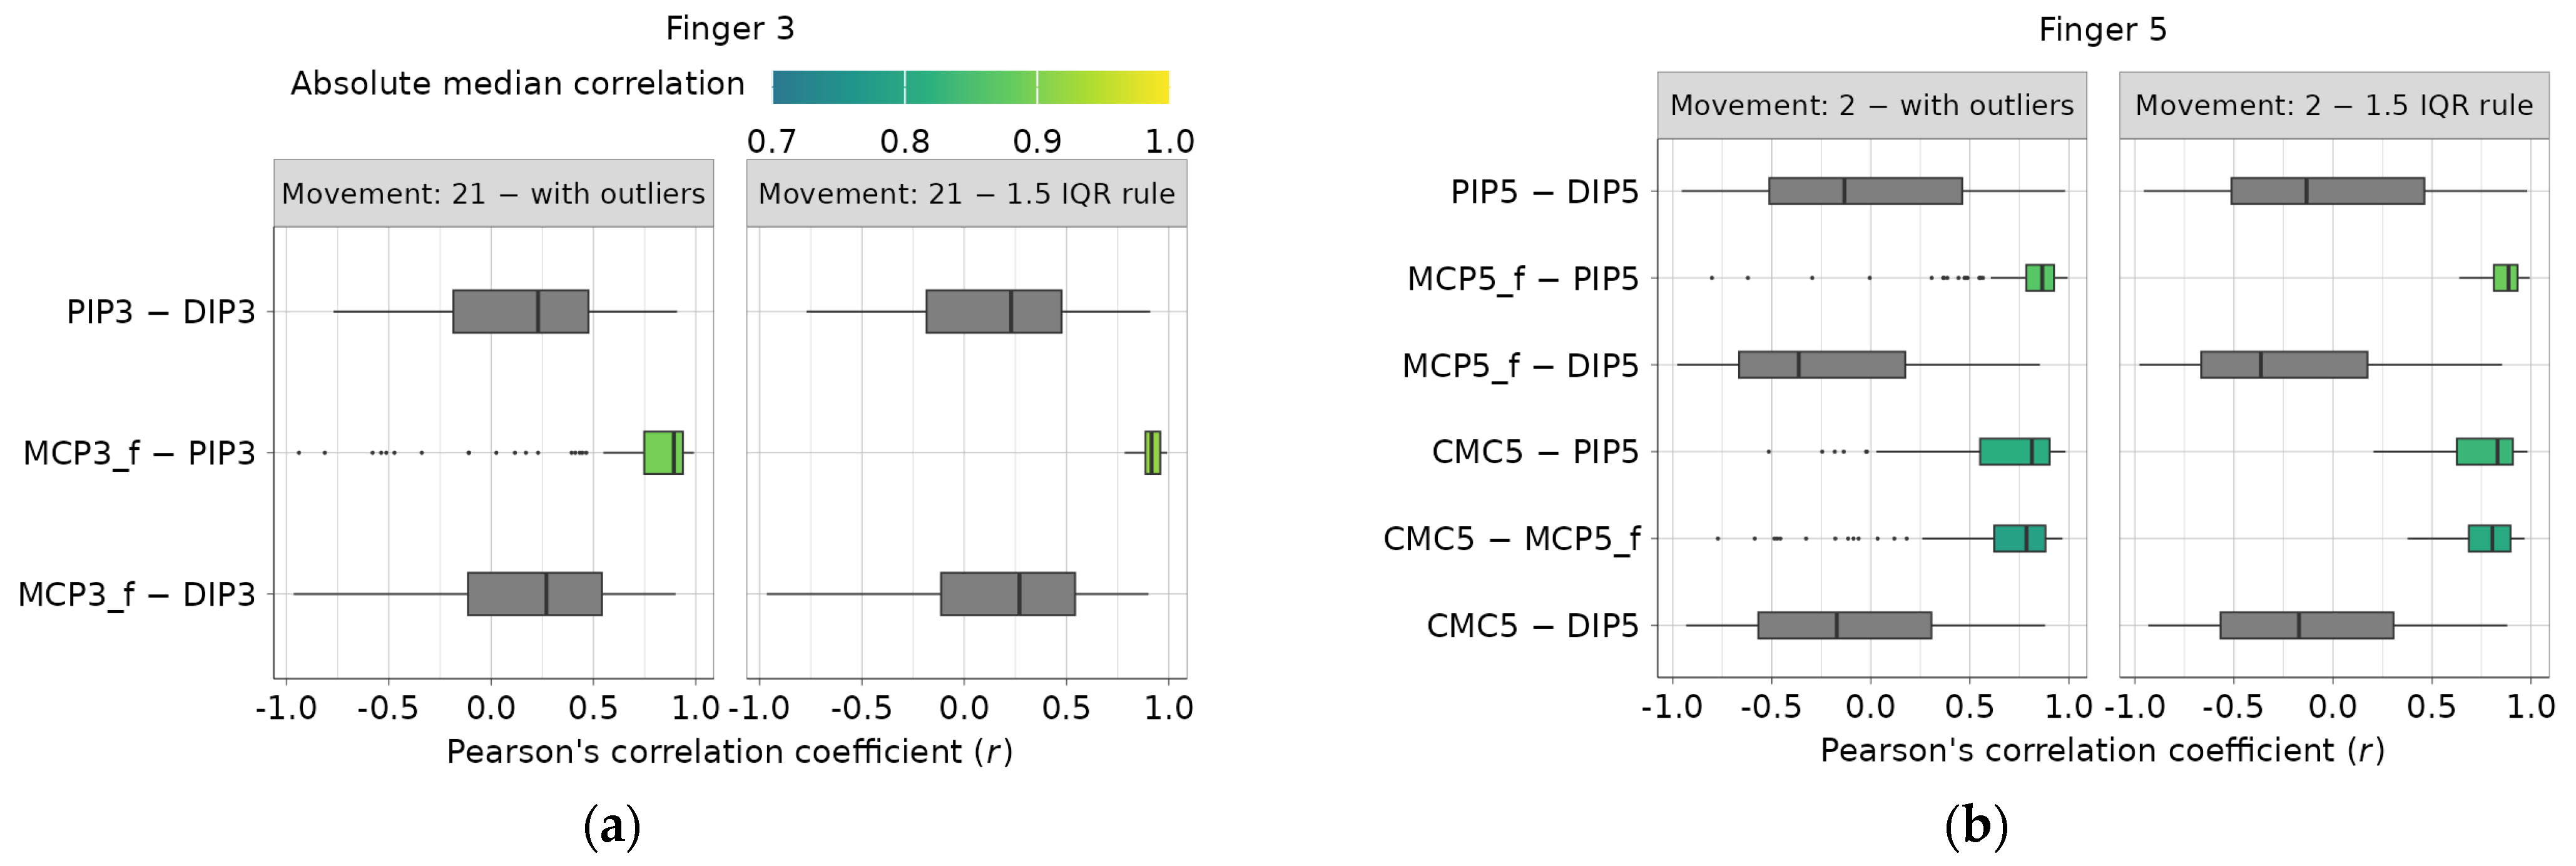
Two examples of investigated intra-finger dependencies for the third and fifth digits are presented in Figure 4a,b. All obtained correlation coefficients related to a single finger dependency and a single movement are summarized using boxplots, and their median values are calculated. Only highly correlated dependencies (absolute median r ≥ 0.7), identified using the recommendations from [24], are highlighted using a color map. The right diagram in Figure 4a,b shows boxplot examples with outliers removed using the iterative IQR rule, resulting in the removal of 4037 outlier values, while leaving 67,291 correlation coefficients. Complete diagrams for all fingers and movements can be found in the main authors’ GitHub repository [22].
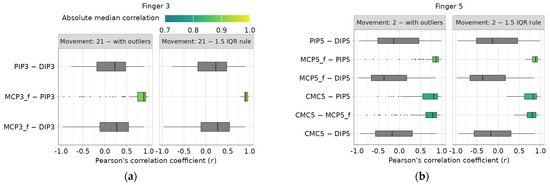
Figure 4.
Example of intra-finger correlation dependencies before and after 1.5 IQR outlier removal: (a) finger 3 dependencies during movement 21, (b) finger 5 dependencies during movement 2.
Next, only dependencies with an absolute median correlation coefficient greater than or equal to 0.7, highly and very highly correlated, per [24], are investigated. After visually inspecting the scatter plots, it is concluded that some repetitions only partially describe motion, lacking completeness. Two additional sampling methods, previously mentioned, are applied, but this time at the repetition level rather than the subject level:
- Repetitions with too-small ROM, compared to median dependency-movement, are discarded: ;
- Newly generated outlier values are removed using the iterative 1.5 IQR rule based on correlation coefficients.
The sampling yields 11,643 usable correlation coefficients. In Figure 5, the dependency-movement diagram assigns each point a median correlation coefficient, illustrating the grouping of highly correlated intra-finger dependencies per movement.
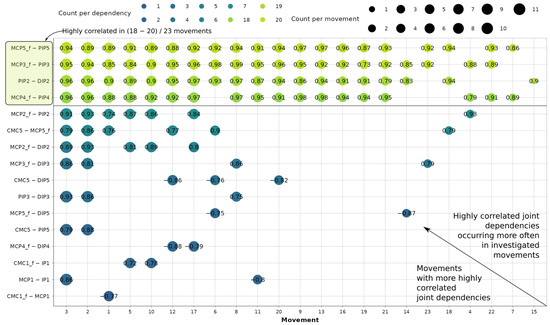
Figure 5.
Correlation analysis of joint dependencies and movements where they occur most often.
Out of 18 defined dependencies, 16 are correlated in at least 1 of the 23 movements. This leads to the conclusion that flexions PIP5—DIP5 and PIP4—DIP4 are not kinematically associated during any of the grasping movements present in the dataset. During movements 2 and 3, respectively, 10 and 11 dependencies are highly correlated. On the other hand, during movement 15, a high correlation is present only for the PIP2—DIP2 dependency. It can also be concluded that MCP flexion/extension is very frequently correlated with PIP flexion/extension for digits 3, 4, and 5, occurring in 18 to 20 out of 23 different movements. For the index finger, the same dependency is highly correlated in only 7 movements. Additionally, second-digit PIP2 and DIP2 flexion/extension are highly correlated in 19 movements. Also, it can be concluded that during thumb movement the incidence of intra-finger relationships is very rare, as indicated by their grouping at the bottom of the diagram in Figure 5. Only 5 relationships are revealed across 5 movements, making the thumb the most independent digit, agreeing with [11]. Overall, 116 dependency-movement relationships are therefore identified for further investigation.
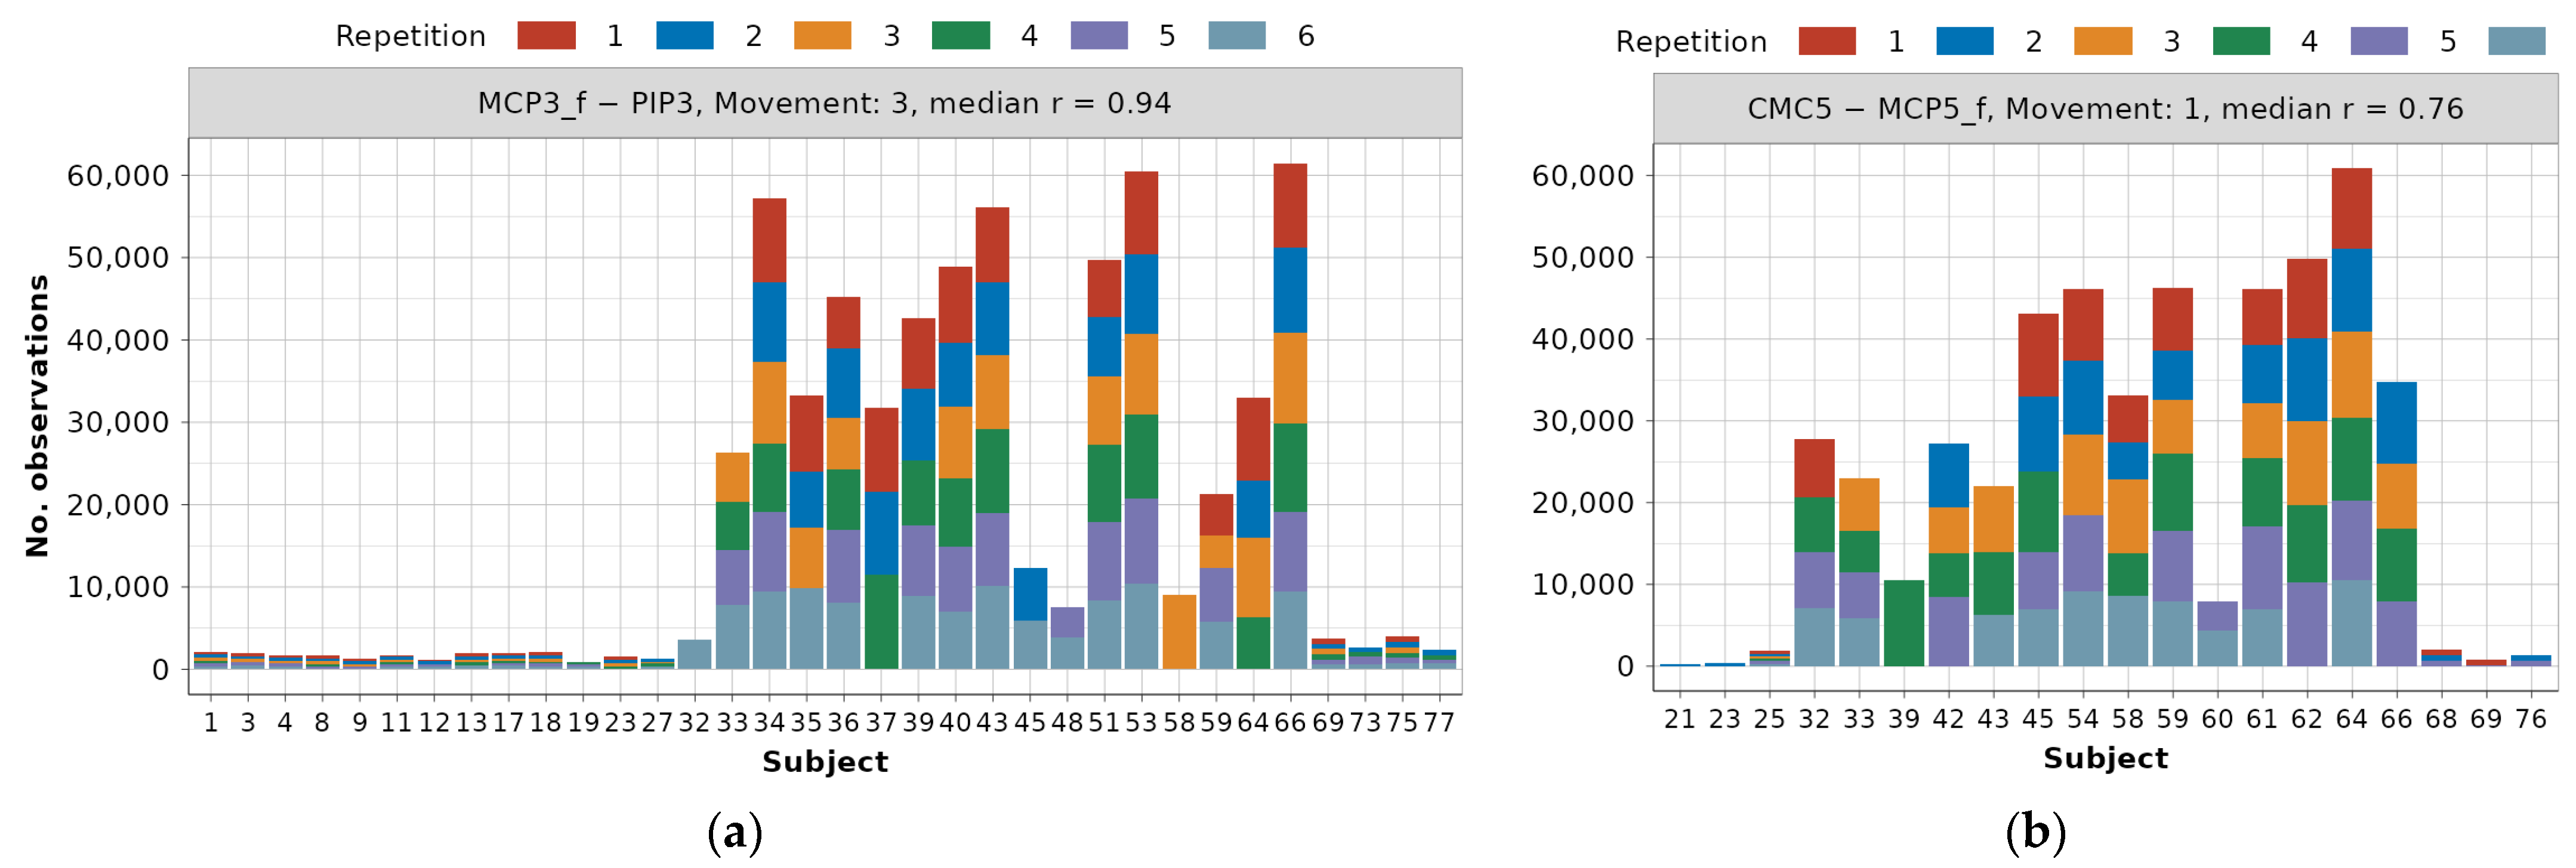
Examples of frequency distributions for one highly correlated (MCP3_f—PIP3) and most often occurring dependency, as well as one (CMC5—MCP5_f) with r = 0.76 occurring less frequently, are presented in Figure 6.
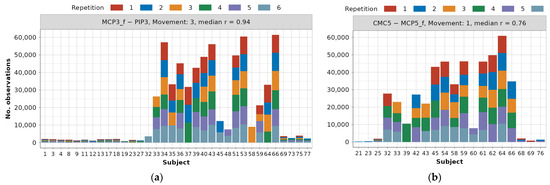
Figure 6.
Data distribution example for dependencies across subjects and repetitions after 1.5 IQR outlier removal: (a) MCP3_f—PIP3 dependency for movement 3, (b) CMC5—MCP5_f dependency for movement 1.
Distributions for all dependencies can be found in the main authors’ GitHub repository [22]. Due to the previously described data preservation techniques, for modeling the MCP3_f—PIP3 relationship during movement 3, there are as many as 34 subjects, 155 repetitions, and 634,050 observations. On the other hand, for modeling the CMC5—MCP5_f relationship during movement 1, 20 different subjects, 75 repetitions, and 485,267 observations are available. It can also be observed that in the first example, there is a balanced number of subjects from DB1 and DB2, and only 4 subjects from DB3 are available. In the second example, subjects from DB2 constitute a large majority, but this claim cannot be generalized to the rest of the dependencies.
To validate the captured variation, a summary of the remaining data per dependency-movement is shown in Figure 7. The minimum number of subjects in the subsequent modeling part is 9 per single dependency-movement relationship, although, in the middle 50% of cases, it spans 19 and 33. The number of repetitions, which will be observed as a single enclosed data unit, ranges between 25 and 274 per dependency-movement. The midspread of repetitions per subject is between 3 and 4.5.
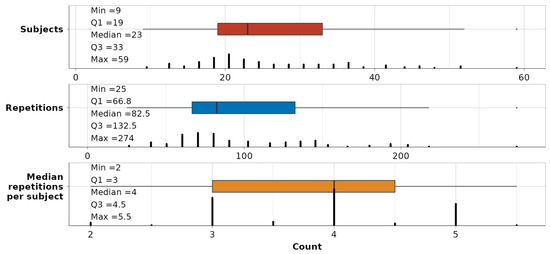
Figure 7.
Summary statistics on the number of subjects (red), repetitions (blue), and median number of repetitions per subject (orange) across all 116 dependency-movement relationships.
2.4. Machine Learning-Based Intra-Finger Dependency-Movement Relationship Modeling
Traditional machine learning principles are applied to dependency-movement modeling, with a larger portion of the data allocated for training models (~80% of repetitions) and the remaining reserved for testing purposes (~20% of repetitions). Additionally, an assumption is made that both the movement reaching phase and the “returning to the rest position” phase follow the same trajectory. Due to the previously mentioned imbalance in the data, since each of the three dataset parts is sampled using significantly different sampling rates, the data is sampled for each dependency-movement relationship in a way that entire repetitions are set aside, ensuring they belong to different subjects to increase the representativeness of the models. Additionally, a customized version of stratified sampling is utilized to split the training data into k folds for hyperparameter tuning through cross-validation. To determine the appropriate number of folds, we consider the minimum number of different subjects (9) and repetitions (25) from Figure 7. A minimum of 5 different repetitions per stratum is deemed sufficient to ensure the necessary set variability. The data describing a certain dependency-movement is then split into 5 folds, with 1 fold (20% of repetitions) used as a test set and the rest for 4-fold cross-validation and hyperparameter tuning. In the authors’ opinion, the highest representativeness is introduced in each fold by maximizing the number of different subjects (diversifying repetitions from the same subject) in each fold, so the stratified sampling is performed using subjects (1–77) and repetitions (1–6) for each dependency-movement relationship, rather than using observations directly. The customized version of stratified sampling is performed in the following way:
- A vector of fold IDs is generated for each relationship, containing repeating sequences in the 1–5 range, with a length equal to the number of repetitions.
- The vector of subjects is randomly shuffled, followed by the random shuffling of repetitions belonging to each subject, resulting in a random list of repetitions.
- Randomly listed repetitions are assigned to folds sequentially.
Using the described procedure, more unique subjects are present in each fold, resulting in more consistent 4-fold cross-validation compared to simple random repetition folds’ assignments. Each fold contains, therefore, an uneven number of observations and an approximately even number of repetitions.
As elaborated above and illustrated in Figure 6, the dataset exhibits imbalances. However, each repetition must hold equal weight when modeling a certain relationship. A simple approach that could be applied involves the repetition of observations. However, this approach would add additional data points to an already very large dataset and is hence not utilized in this study. Instead, observation weighting is introduced. The process begins by counting the total number of observations and repetitions per dependency-movement relationship. By dividing these figures, the total weight coefficient for each repetition is determined. Then, the number of observations within each repetition is counted, and each observation is assigned the proper weight wi by dividing the total repetition weight coefficient by the number of observations counted. The weighting procedure ensures that each repetition equally contributes to the model-building process for the dependency.
Three predicting variables are chosen for the modeling process. For each dependency, in addition to the dependee joint, the subject height and weight are also selected. All variables are transformed using polynomial (second order) and exponential transformations and fed to the model matrix consisting of all mentioned variables, their first order interactions, and intercept, totaling 46 terms. The entire model matrix is then standardized (centered and scaled) by first subtracting the mean from each explanatory variable and dividing it by its standard deviation to conclude both the variable significance and effect size. It is important to note that the standardization procedure is performed separately for each of the 116 modeled dependencies. Also, the dependent variables are standardized before model fitting.
Two different modeling approaches are employed, the first serving as a baseline and a variable selection model and the second as a main model for inferring about the modeled dependencies. For variable selection, a regularized generalized linear model (GLM), implemented in the R library glmnet [19], is used as an extension of ordinary linear regression (OLS). The GLM model consists of three parts: a linear combination of predictors, probability distribution of the dependent variable, and a link function enabling the transformation of the predictor. For a probability distribution, a normal distribution is used, with the identity function as a link function, yielding a model in the following standardized form:
where denotes expectation of a random variable, y the dependent joint, all previously described predictors, variable mean, variable standard deviation, and the standardized model coefficients.
A previously set goal is to obtain sparse models, so lasso regression [19] is used to tackle the correlations between variables and promote sparsity in selecting predictors. A coefficient approximation is implemented as a minimization problem with a negative log-likelihood term, as well as a regularization term using the hyperparameter λ and the l1 norm of the sum of the coefficients [19]:
Another employed strategy, i.e., relaxation of coefficients during GLM fitting, involves fitting both regularized lasso and ordinary least-square (OLS) regression (without regularization), using the same subset of predictors selected by the lasso. Subsequently, a convex combination of coefficients is utilized to obtain the relaxed coefficients:
where represents the relaxed coefficient, the mixing parameter, the regularized coefficient, and the coefficient obtained through OLS fitting. By applying this strategy, some of the parameter shrinking due to lasso is undone (relaxed) and better estimates for the coefficients are explored. A final GLM strategy involves penalizing specific predictors to ensure their consistent retention in the final output.
The second model, utilized as the final one for inferring dependencies, is a linear mixed-effect (LME) model, implemented in the R library lme4 [25]. It is selected due to the natural grouping of the data by subjects, as observed during visual inspection, and by incorporating previous knowledge from experiments (involving one glove size but different subject hand sizes) conducted in [4]. The respective modeling procedure involves initially grouping the data to account for random effects and then conducting linear regression with fixed effects to address the remaining residual variance. The selected type of the LME model is a random intercept with fixed slopes, where each subject represents a single level in the multilevel modeling or a random effect. Therefore, for each subject (denoted as a set S), we compute its intercept term, while the slopes are computed as an estimate for the entire population. The relation describing the used LME model is:
where the same nomenclature as in (1) applies, with the alteration in standardized intercept terms referring to the j-th subject. Considering subjects as a random effect, and assuming the underlying data is representative of the population, we can estimate the mean and variance across the subject intercept terms. This information enables us to make reasonable predictions about the subjects who were not part of this study.
After detailing data splitting, stratified sampling, cross-validation, weighting, standardization, and modeling strategies, the comprehensive procedure for obtaining sparse and representative models is elaborated next. The following comprehensive modeling procedure is applied to each dependency-movement relationship. Due to the inclusion of randomized stratified sampling in the modeling process, the entire process is repeated in 10 runs to assess the degree of variation in the selected predictors and the obtained coefficients in the LME model. The variation in the obtained coefficients and the selected predictors is extremely small, and the resulting models are selected using:
- Primary criteria: selecting a model with similar coefficient values consistently occurring across different runs,
- Secondary criteria: selecting a model with the lowest error metrics (as described in the Results and Discussion sections).
During GLM modeling, a regularization tuning parameter λ is varied in a grid of 100 values ranging between 0.05 and 0.1. For tuning the hyperparameter γ, five values spanning between 0 (complete relaxation) and 1 (no relaxation) are selected. During the 4-fold cross-validation, the resulting model is not chosen as the one with the minimum mean cross-validated error but rather as the most regularized (sparse) model for which the cross-validated mean error is within one standard deviation from the minimum mean error. Additionally, observation weights are supplied to GLM models. The GLM model fitting is conducted by using maximal likelihood estimation, with linear, polynomial, and exponential transformations of the dependee joint being penalized to ensure they are always retained in the resulting model for consistency. Large sample sizes (ranging from 84,000 to 740,000 observations in the training dataset, as shown in Table S1 in the Supplementary Materials) and the introduction of variable standardization help reduce the problem of multicollinearity by decreasing standard errors.
After identifying the influential predictors and establishing a baseline GLM model, the LME model is constructed using initially the same predictors, along with the same 4 folds utilized during GLM cross-validation. Typically, a prerequisite for LME modeling is to have at least five distinct levels for random effects, which is fulfilled by a minimum of 9 different subjects present in each subset of the training dataset (the median value is 23 subjects, whereas the maximum is 58). To align with one of the key objectives of the paper, which is to introduce reduced and simplified models, reductions in the LME model are determined by both the effect size and its statistical significance. Given that regression coefficients are standardized, the model can be simplified, as one standardized regression coefficient often has a significantly smaller magnitude compared to another. Standardized coefficients can therefore be compared similarly to correlations, where higher values imply stronger practical relationships between variables. The cutoff level for effect size, based on Cohen’s guidelines [26], is set to retain only medium (0.30–0.49) and large (>0.50) effect size predictors in the reduced model, while the significance level is set to retain only highly significant predictors (p-value < 0.001).
By interchangeably selecting the highly significant subset of predictors and the subset with a medium to high effect size, three iterations are required during the model reduction process to obtain the final model. After obtaining the final reduced LME models and reporting them according to [27], the rationale for grouping data by subjects is validated by computing the intraclass correlation coefficient (ICC). The latter compares the variance of the random effect (subject intercept) to the total variance (the sum of the random effect and the residual variance ) within the model as
Thus, the ICC coefficients inform about a percentage of variance that can be explained using random effects (subject-to-subject variations), which implies the reliability of the modeling approach. Guidelines according to [28] can be adopted, where values
- <0.5 indicate poor reliability,
- 0.5–0.75 indicate moderate reliability,
- 0.75–0.9 indicate good reliability,
- >0.9 indicate excellent reliability.
2.5. Error Metrics
To validate the models, two error metrics are used, both weighted to balance the dataset. Since the data contained outliers, as an absolute error metric for evaluating the models, the weighted mean absolute error (WMAE) is selected:
where n represents the length of the train or test dataset, the previously computed observation weight, the observation of the dependent joint, and the predicted dependent joint value. Another, relative metric, called double-weighted mean absolute percentage error (WWMAPE) is used:
with the same nomenclature as in (6). WWMPAE is chosen since the metric behaves well for smaller, larger, and close-to-zero joint angle values.
3. Results
Here we present summary statistics for random and fixed effect predictors, error analyses, clustering of LME models, and standardized coefficient analyses.
3.1. Random and Fixed Effect Predictors
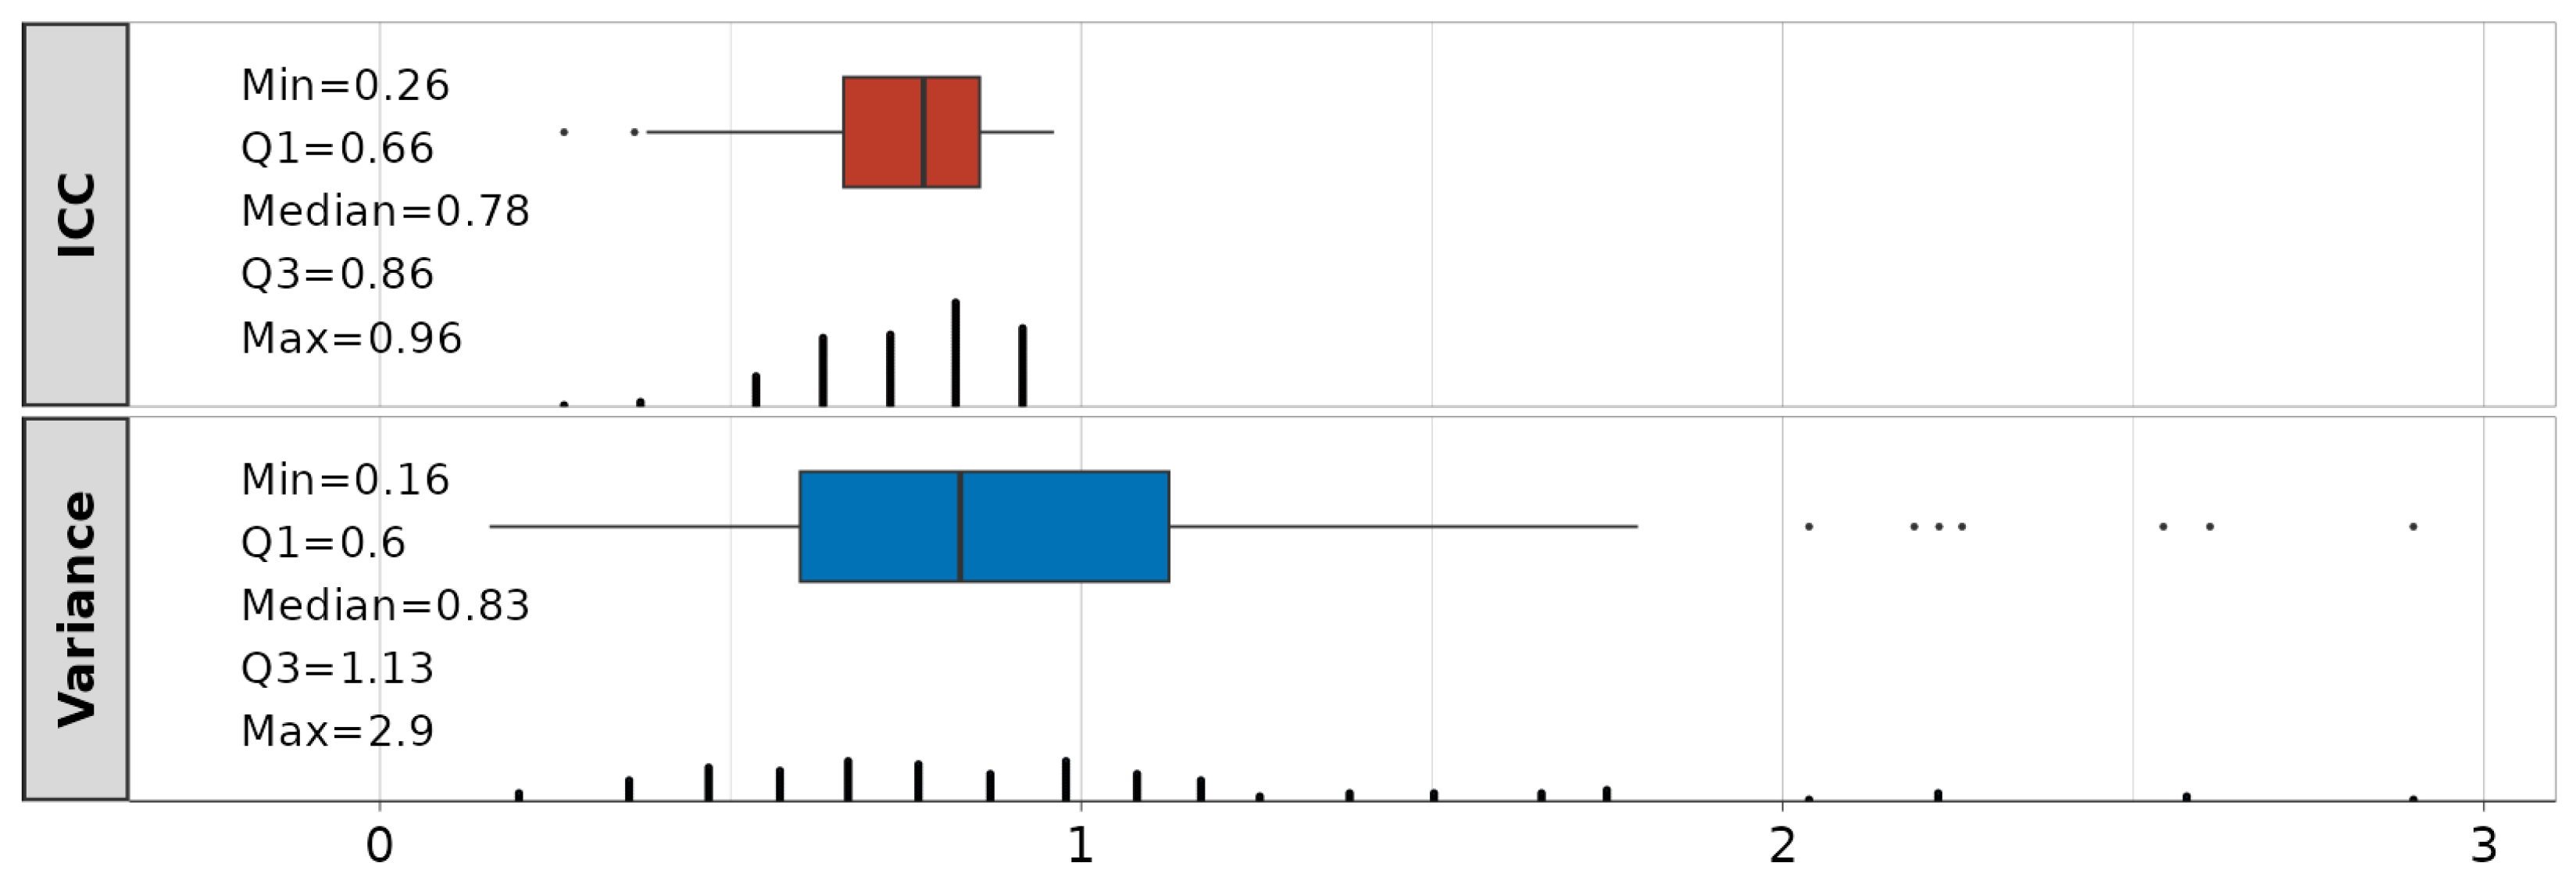
The summary statistics on the obtained ICCs and the variance of the random effects are shown in Figure 8. The median value across all 116 models is 0.78, suggesting good approach reliability. A total of 4 models have ICCs < 0.5 (poor), 46 are in the range of 0.5–0.75 (moderate), 51 are in the range of 0.75–0.9 (good), and 15 have ICCs > 0.9 (excellent). Although the inclusion of random effects in 4 models (23:MCP3_f—DIP3, 4:MCP4_f—PIP4, 17:MCP4_f—DIP4, 2:MCP2_f—PIP2) is questionable with ICCs < 0.5, the selection of dependencies for the modeling is performed via mean correlations (see Figure 5), and they will be kept. The variance of the random effects (subject intercepts) is also represented as a summary statistic across all 116 obtained LME models. It ranges from 0.16–2.9, with IQR values between 0.6–1.13. Detailed information is in Table S2.

Figure 8.
Intraclass correlation coefficients (ICC, red) and variance (blue) of random effects related to linear mixed-effect (LME) models.
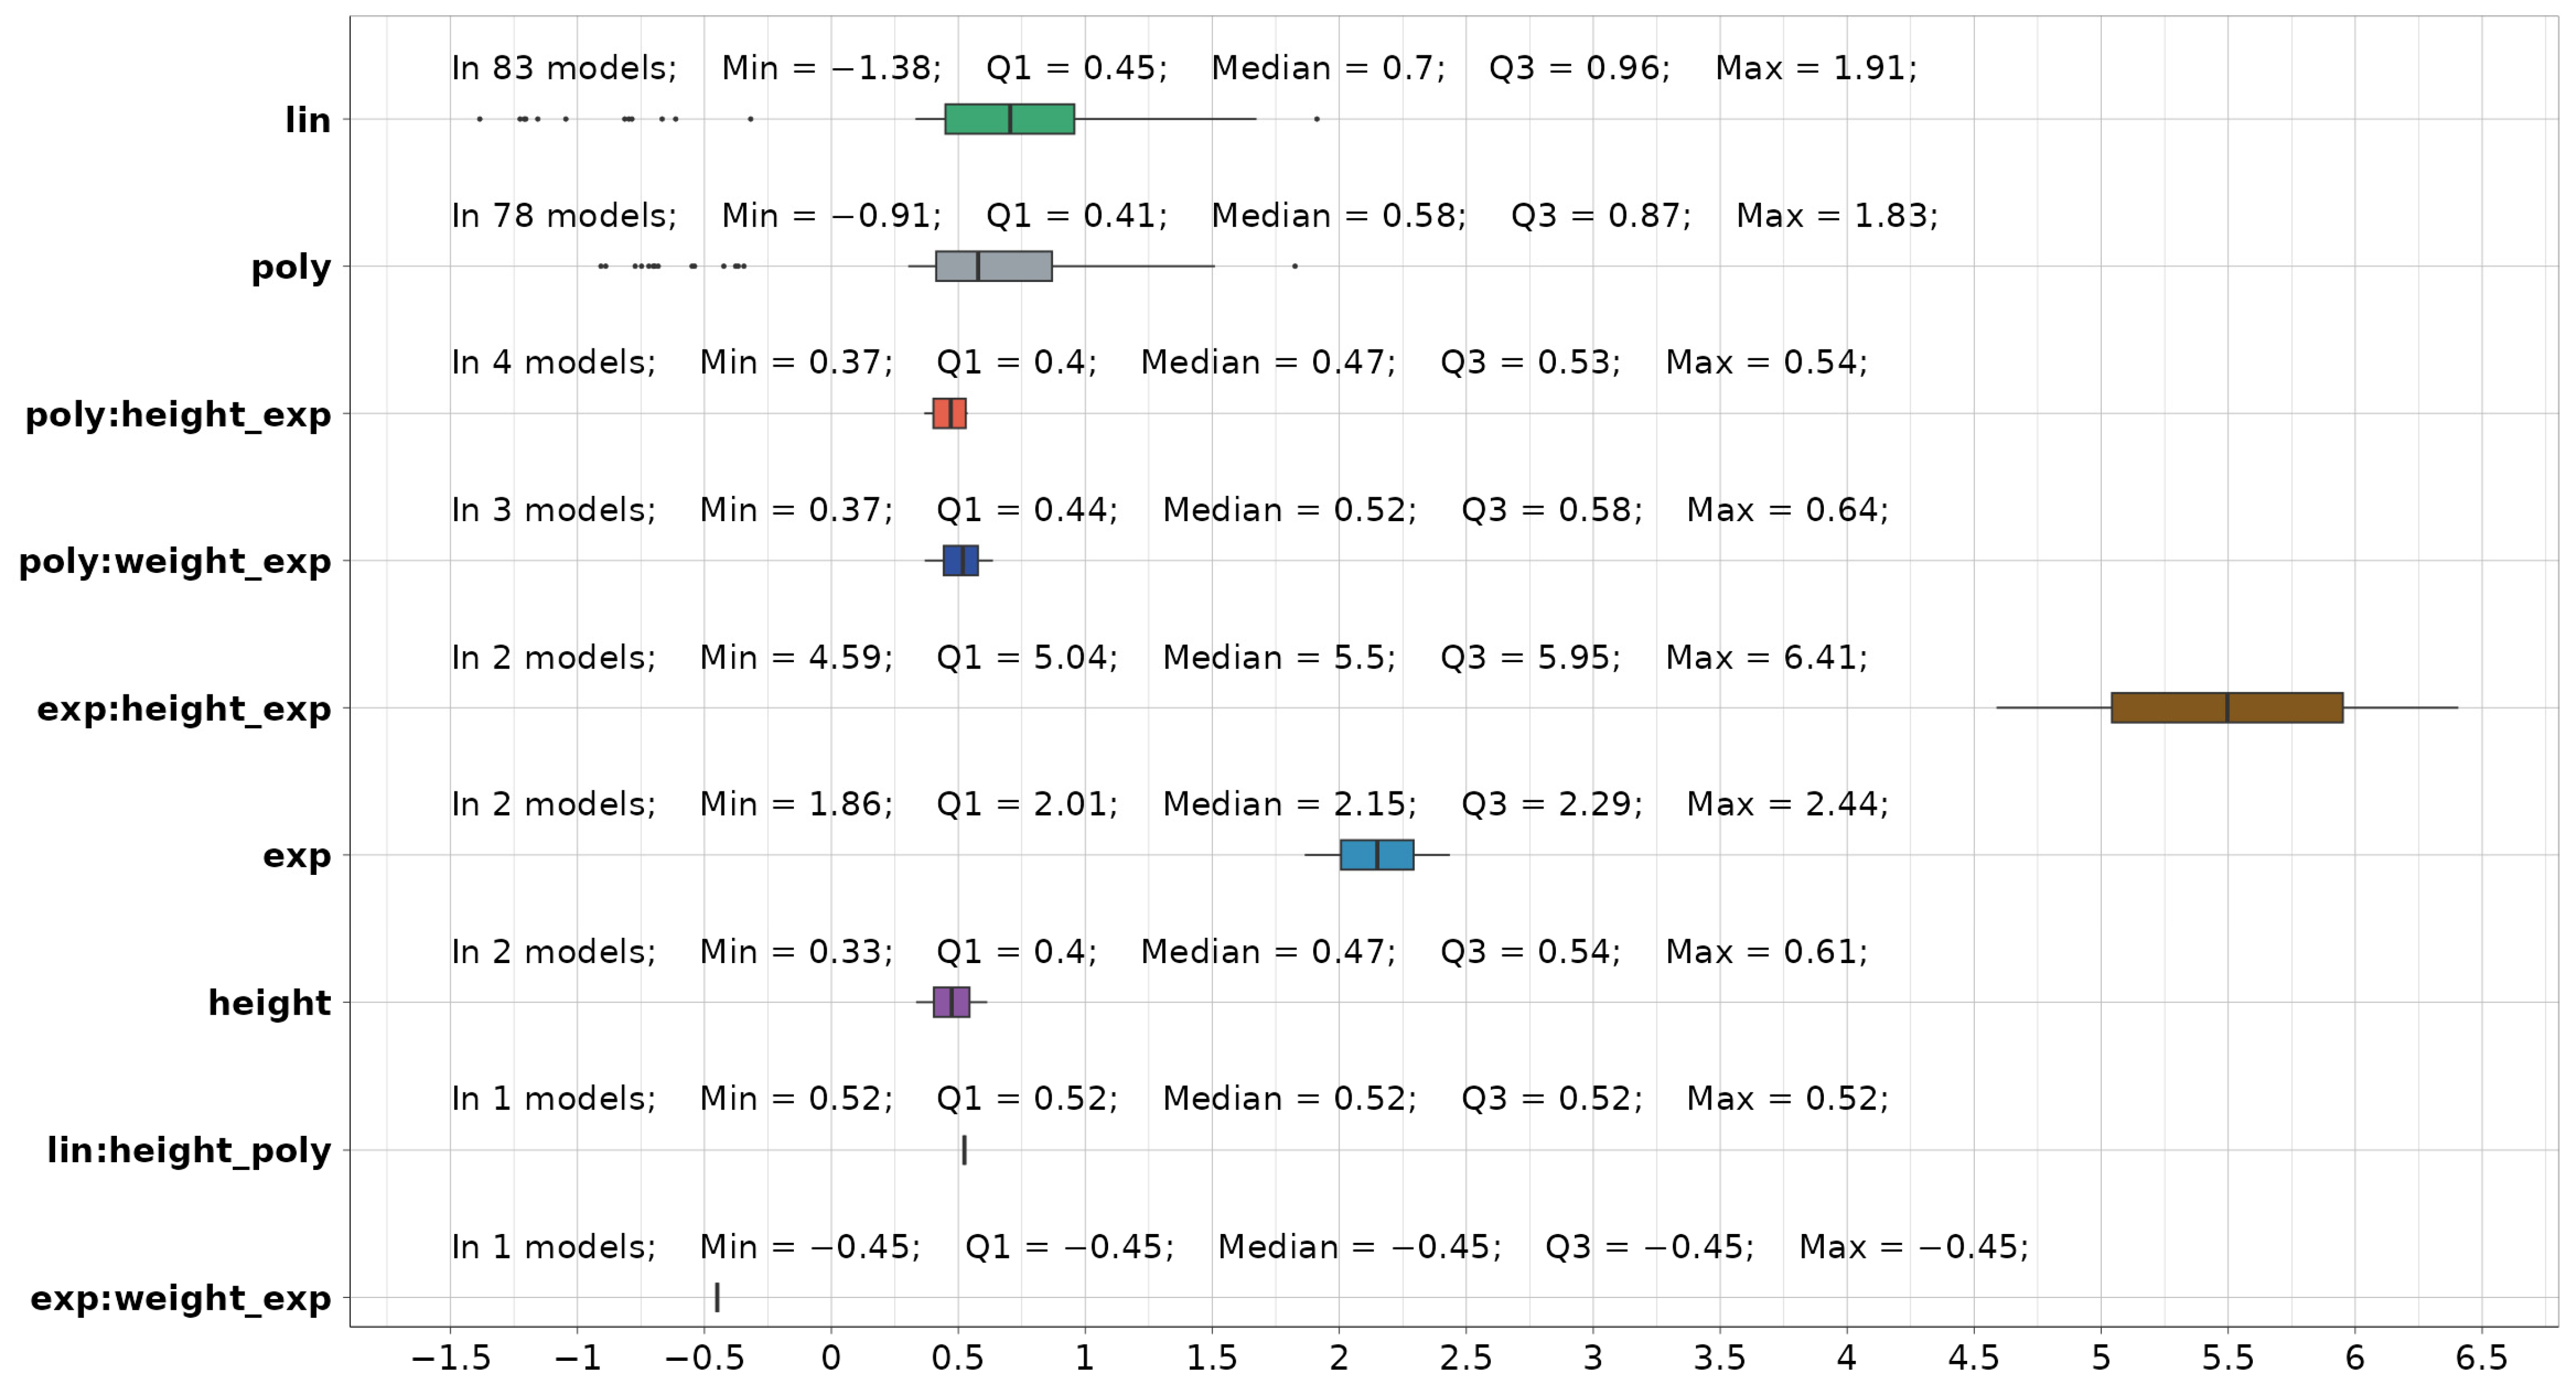
A summary statistic on selected predictors in the final LME models, both significant and with medium to strong effect, is provided in Figure 9. Four standardized predictors are identified: linear (lin), polynomial (poly), and exponential (exp) transformations of the dependee, as well as subject height. Additionally, five standardized interactions (denoted with “:”) are identified:

Figure 9.
Summary statistics on selected predictors (colored differently) in the final LME models.
- polynomial and exponential transformation of height (poly:height_exp),
- polynomial and exponential transformation of weight (poly:weight_exp),
- exponential and exponential transformation of height (exp:height_exp),
- linear and polynomial transformation of height (lin:height_poly),
- exponential and exponential transformation of weight (exp:weight_exp).
If random subject intercept is counted, the average number of predictors per model is 2.5. Out of the 116 provided models, 83 contain linear, 78 contain polynomial, and 45 contain both types of coefficients. Additionally, 11 models incorporate other predictors or interactions besides linear or polynomial terms. The comprehensive model coefficient analysis is presented in Appendix A (Figure A1 and Figure A2). After presenting the fixed effect coefficients for each model, the best approach for dealing with the random (subject) effect is to present the intercept means across all subjects used for modeling. Those intercepts can be further generalized and used as an unbiased estimator for the entire population; they are also represented in Figure A2.
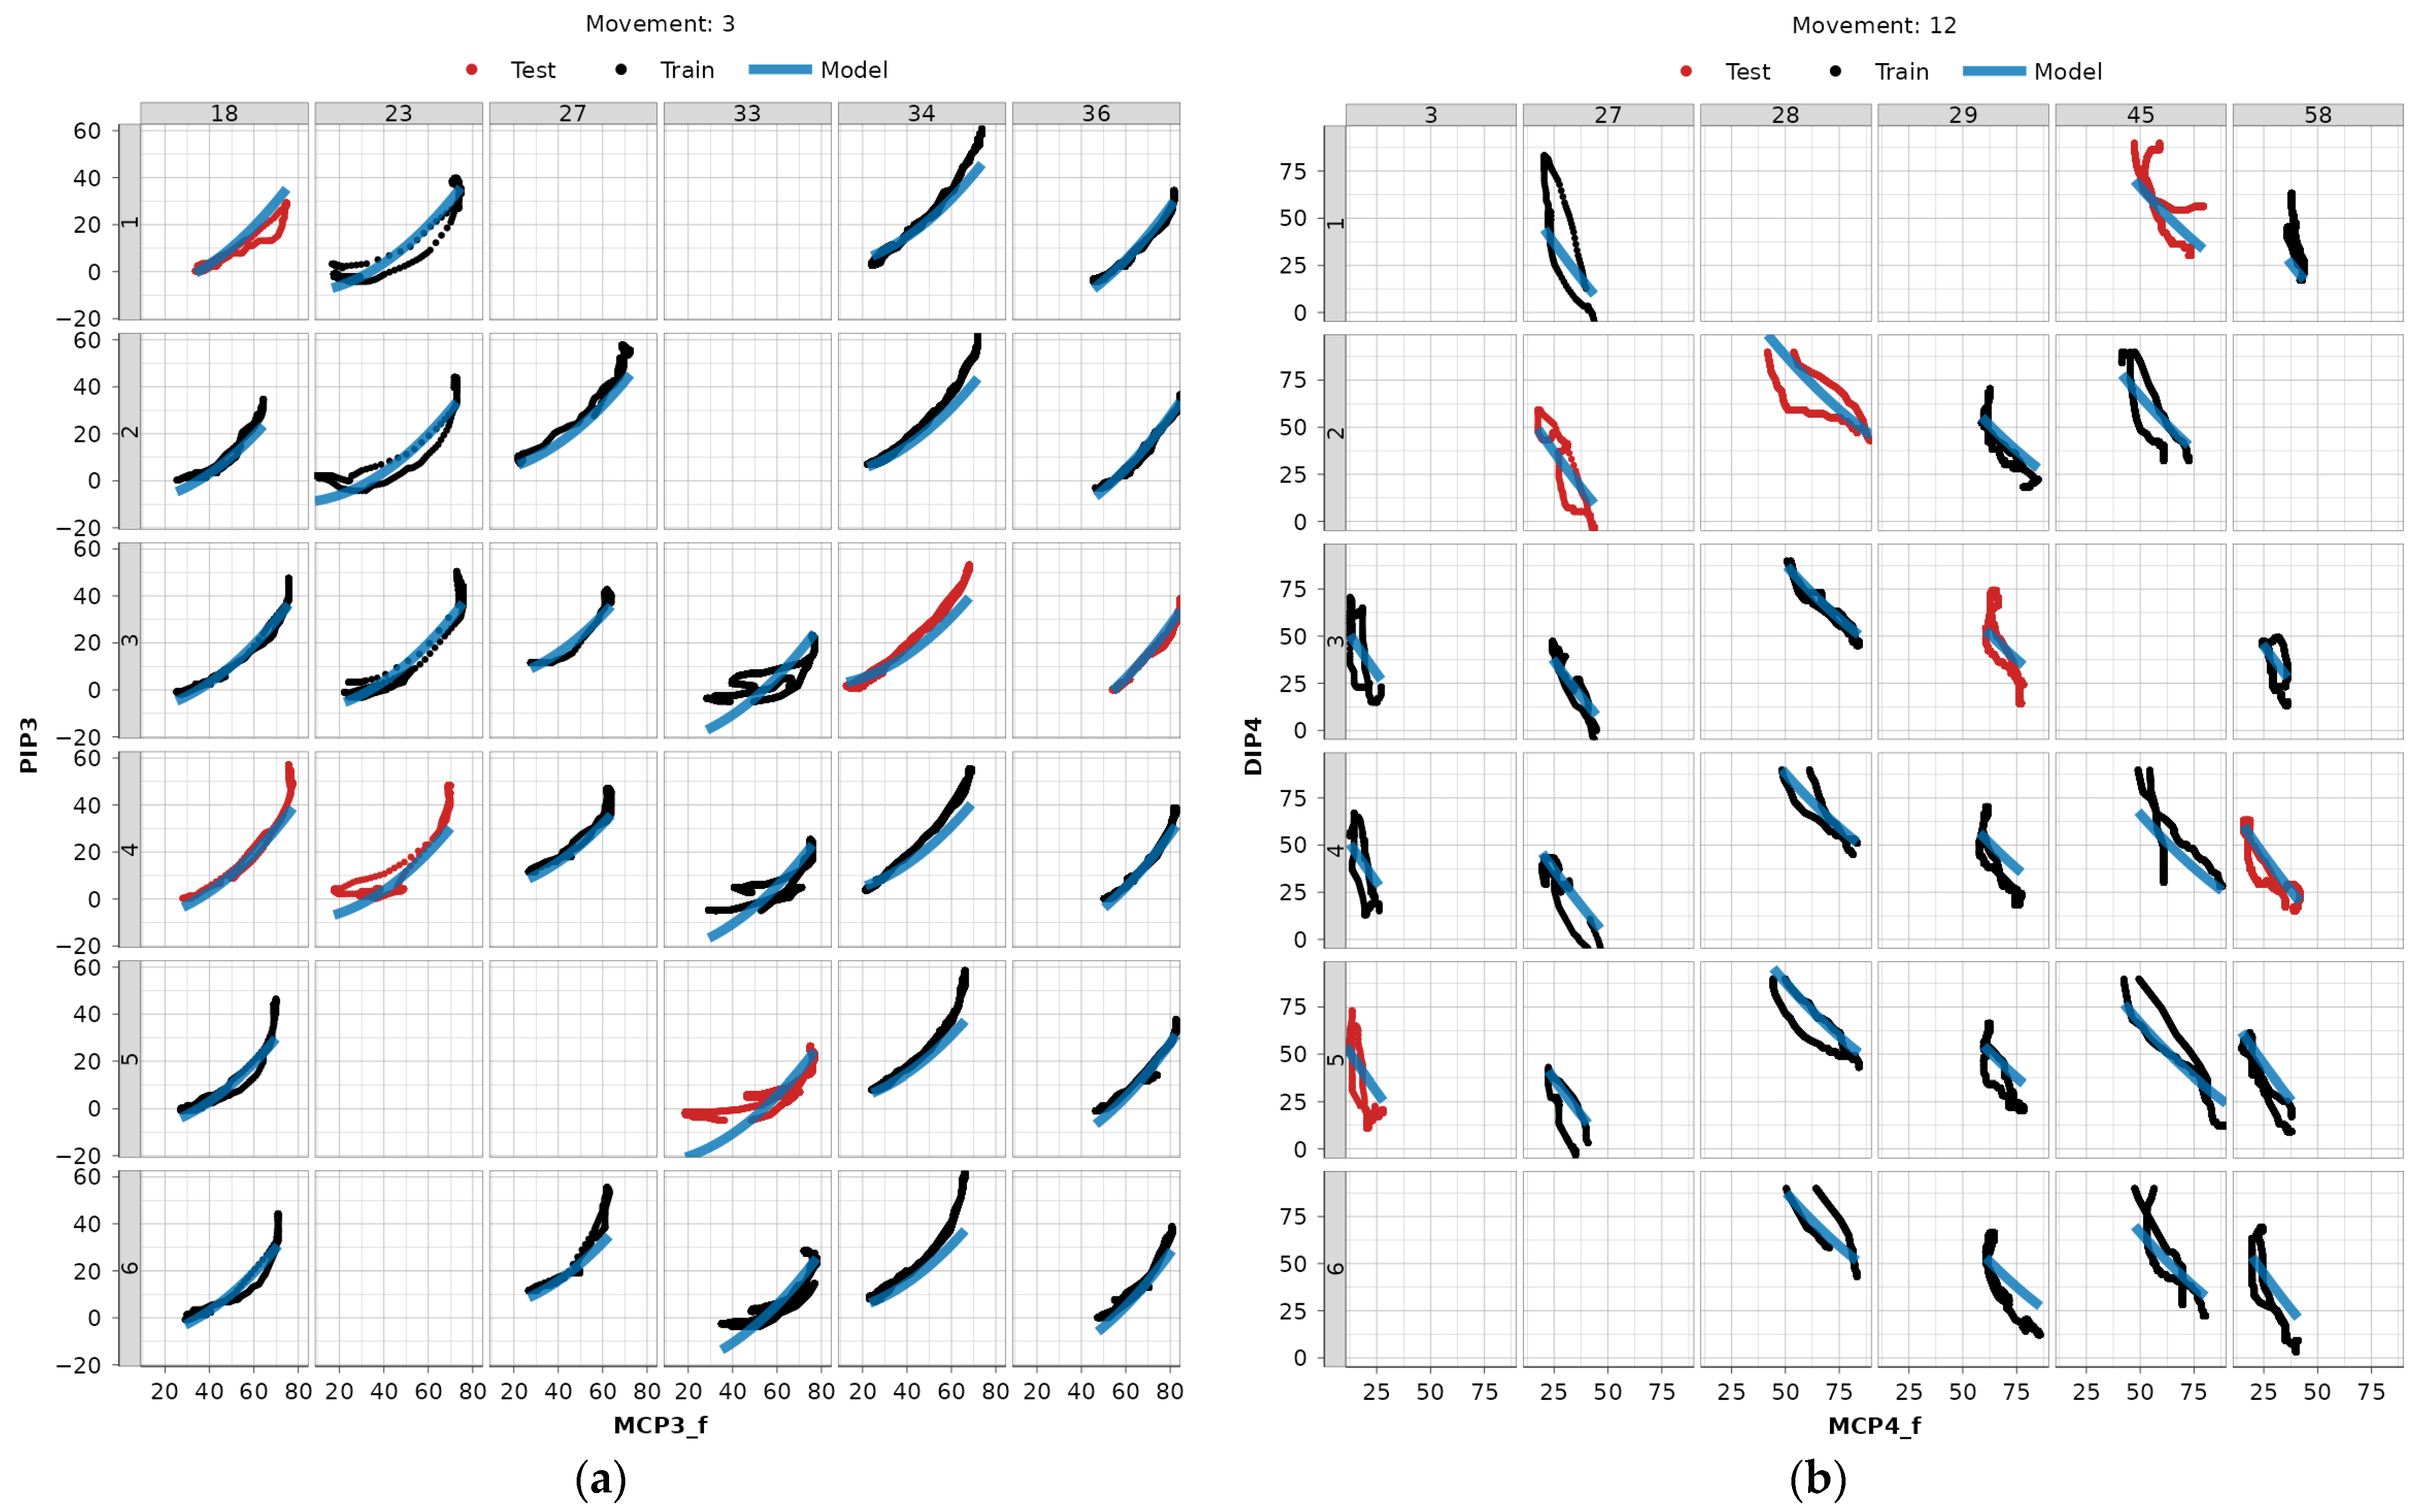
In Figure 10, we present two distinct dependency-movement relationships across a subset of subjects and repetitions, used for both training and testing data to visually validate the LME modeling approach: one with a higher correlation coefficient (3:MCP3_f—PIP3) and the other with a lower one (12:MCPF4_f—DIP4). A clear, natural grouping of the data based on subjects is evident. Scatter plots for all modeled dependencies and subjects can be found in the authors’ GitHub repository [22].
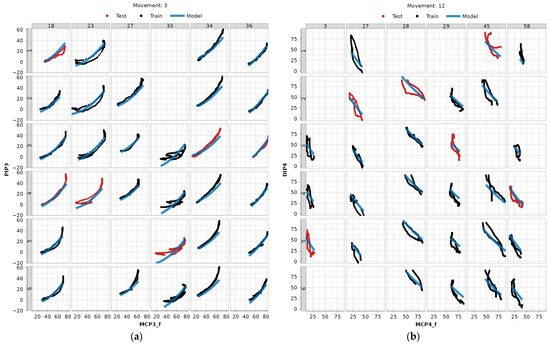
Figure 10.
Examples of LME model fitted to data (blue) with repetitions belonging to train data (black) and test data (red). Numeration at the top represents the subject ID, and numeration to the left the repetition ID: (a) MCP3_f—PIP3 dependency for movement 3 (fixed hook grasp), (b) MCP4—DIP4 dependency for movement 12 (precision sphere grasp).
3.2. Model Error Metric Analysis
A summary of the statistics on the error metrics is depicted in Figure 11. It is evident that, when compared to GLM models, the LME models fit the data with much smaller absolute and relative errors. The absolute WMAE for the LME approach across models ranges from 2.4° to 16° (median 7.5°) on the test dataset and from 1.8° to 15.2° (median 7.2°) on the train dataset. The relative WWMAPE for the same approach ranges from 11% to 56.1% (median 27.9%) on the test dataset, and from 8.2% to 57.9% (median 28.7%) on the training dataset. The detailed graphical results of the error metric analyses are provided in Appendix A (Figure A3 for WMAE and Figure A4 for WWMAPE), while a detailed table representation for readers’ reference can be found in Table S1.
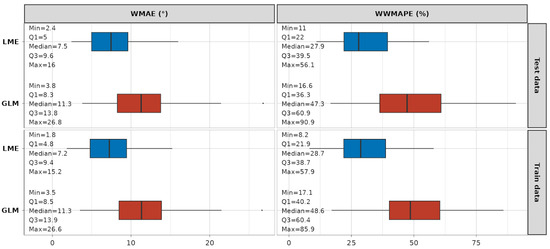
Figure 11.
Summary statistics on WMAE and WWMAPE error metrics for LME (blue) and GLM (red) models.
3.3. Clustering Based on Model Coefficient Analysis
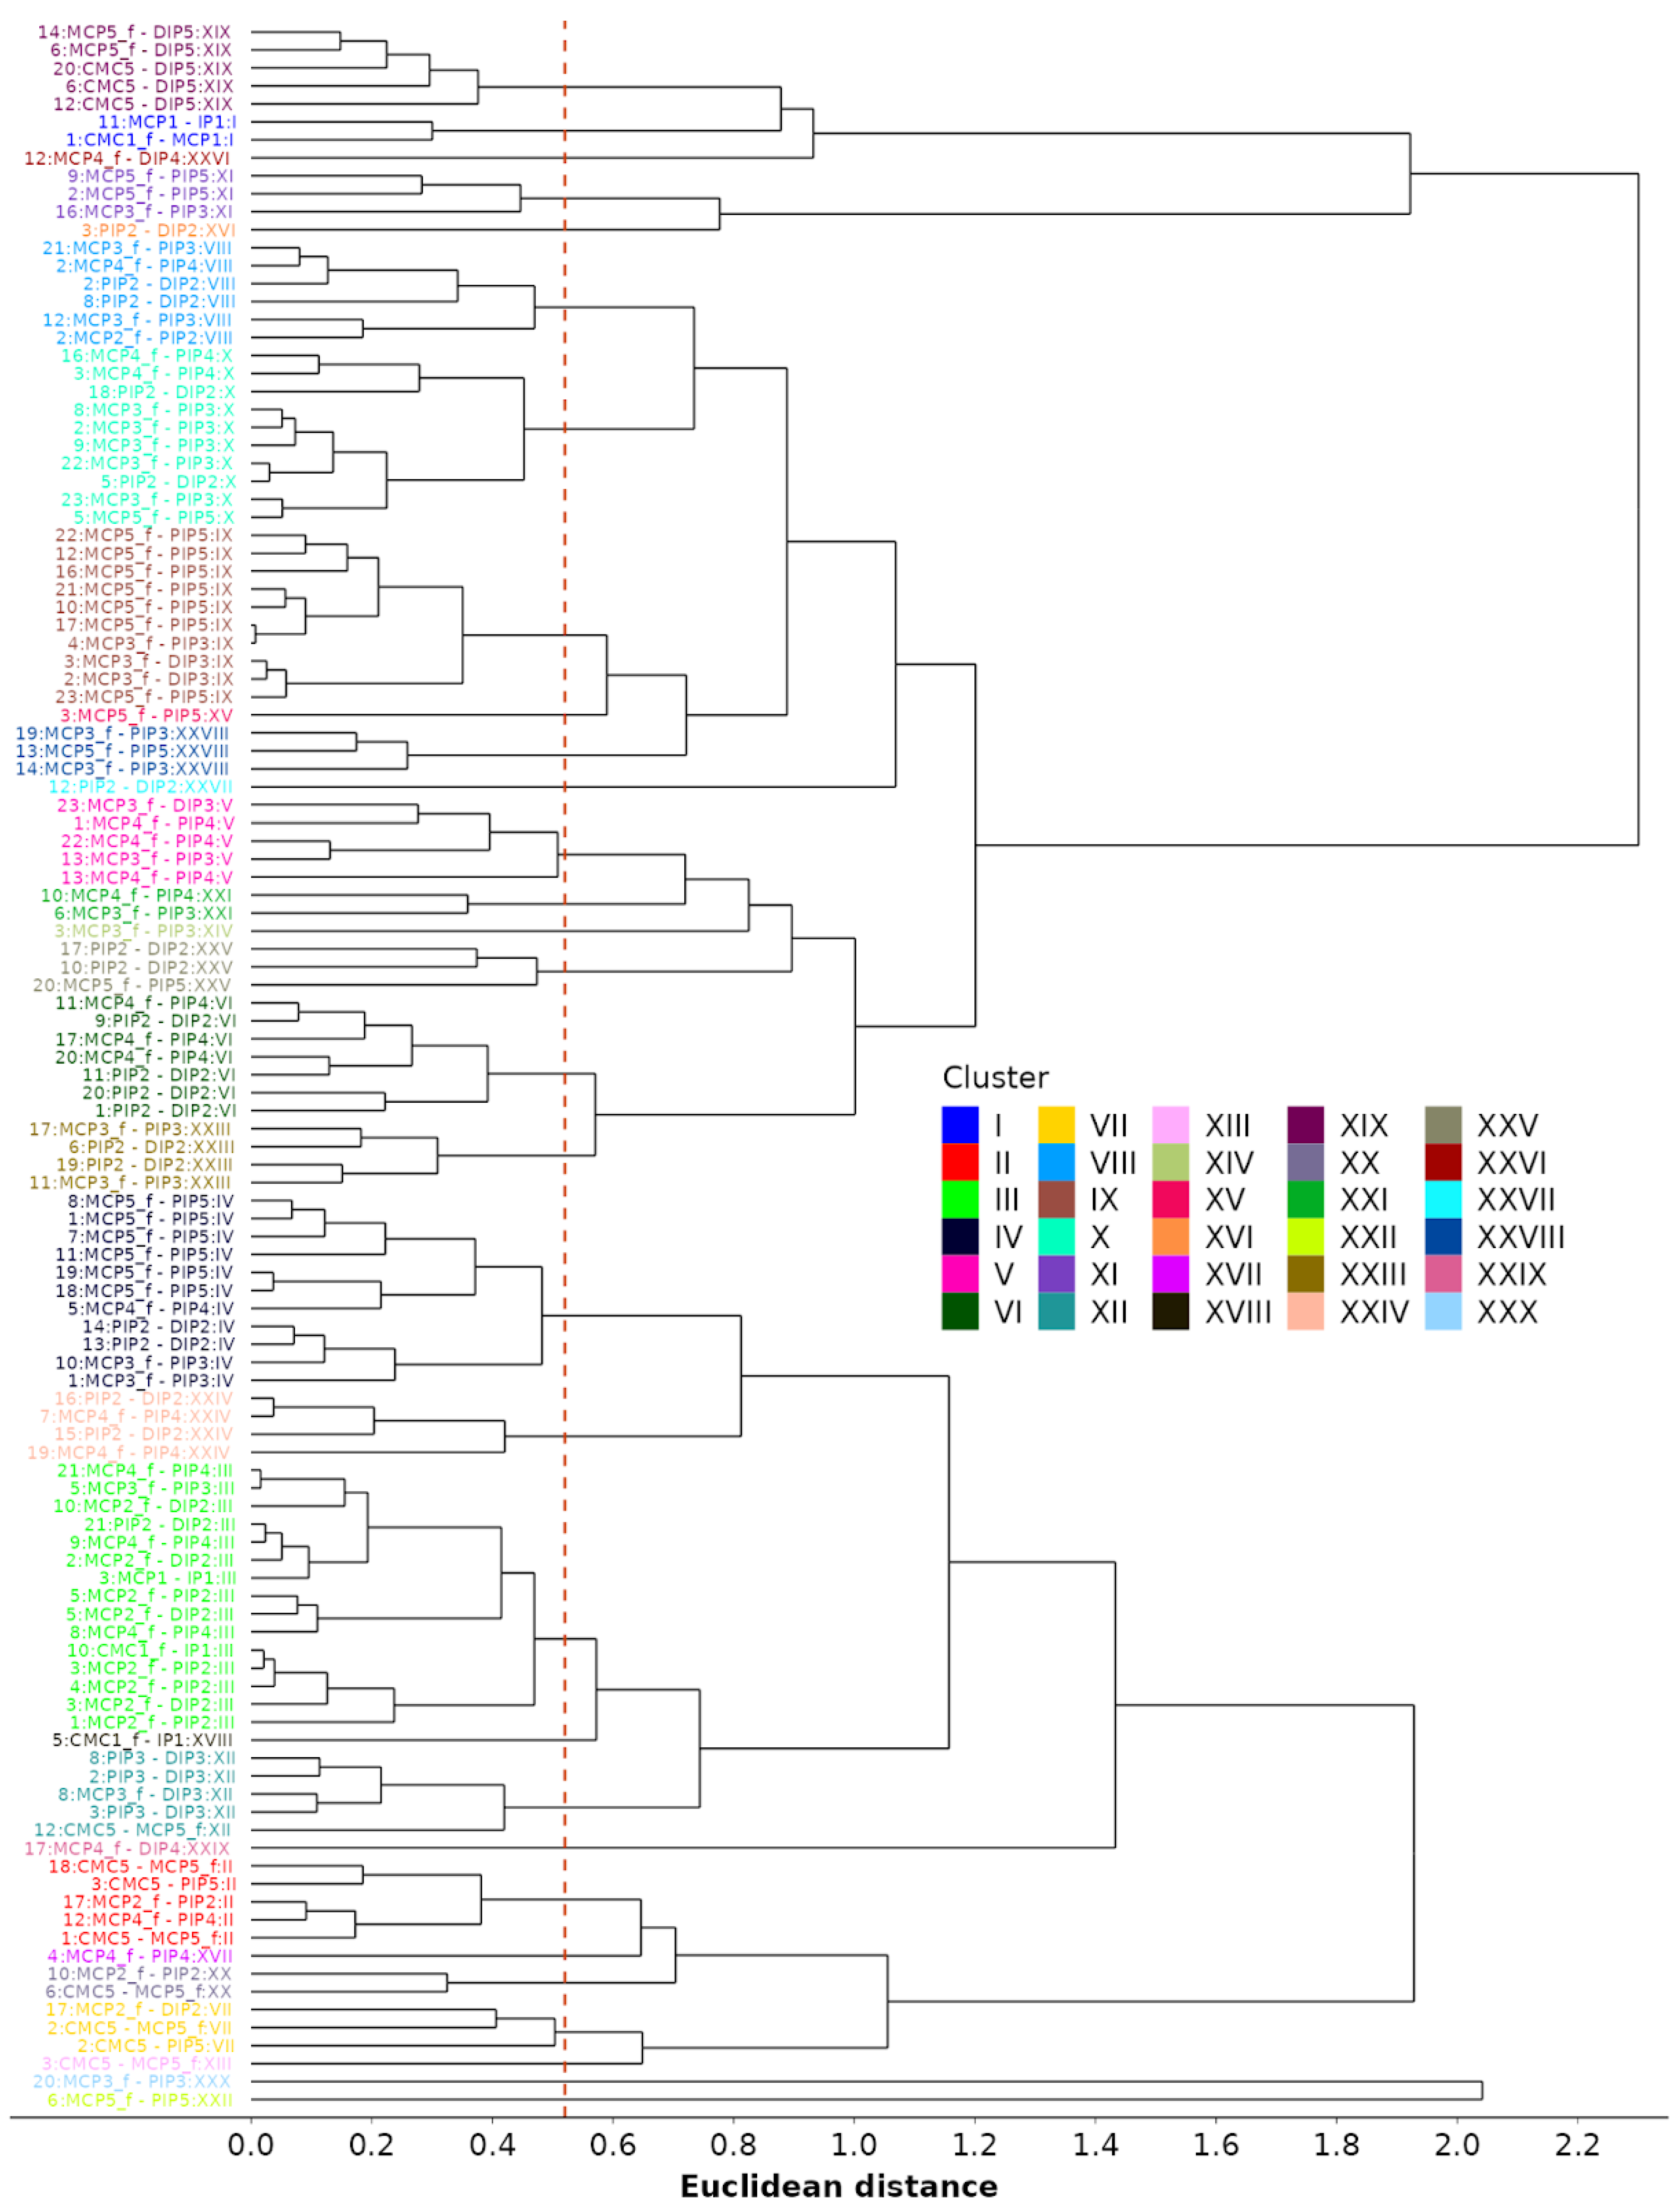
Lastly, we perform agglomerative clustering based on standardized coefficients. The goal is to identify similarities between dependencies across different motions. The clustering is performed using both fixed and random effects from the LME models and by substituting the missing coefficients with zeros. The distance matrix with pairwise distances between each of the 116 identified models is computed using Euclidean distance as a metric for similarities between model coefficients. Then, clustering is performed using “complete” linkage, where the metric for joining existing clusters is the largest distance between two dependencies (one from each cluster). The method is also called “farthest neighbor clustering”. The resulting dendrogram is depicted in Figure 12. The authors estimate that 30 color-coded clusters, obtained by cutting the tree at a distance of 0.52, are appropriate for reducing the number of models. This number was obtained by visually inspecting the dendrogram in Figure 12, as well as by ensuring that the average absolute difference between standardized coefficients, when taking into account an average of 2.5 coefficients per model, remained below 0.33. The clustering method not only reduces the number of models required to describe all kinematic reductions from 116 to 30 but also the number of models used for the kinematic characterization of each grasp type (see Table 5). The investigation of the finger flexion/extension during all functional movements, initially involving 16 DOFs, can therefore be reduced by up to 11 DOFs, with a median of 4. Thus, the remaining flexion/extension grasp models comprise between 5 and 15 independent DOFs, with a median of 12. Considering model clustering, the number of reduction models per grasp ranges from one to nine, with a median of four.
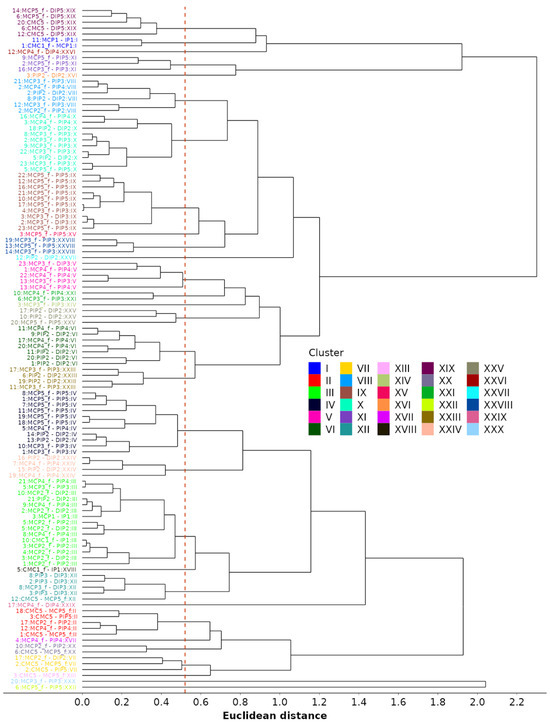
Figure 12.
Agglomerative (hierarchical) clustering of models based on the similarity of standardized coefficients, including a proposed cutoff line (dotted red).
Table 5.
Remaining movement DOFs and reduction models after reductions.
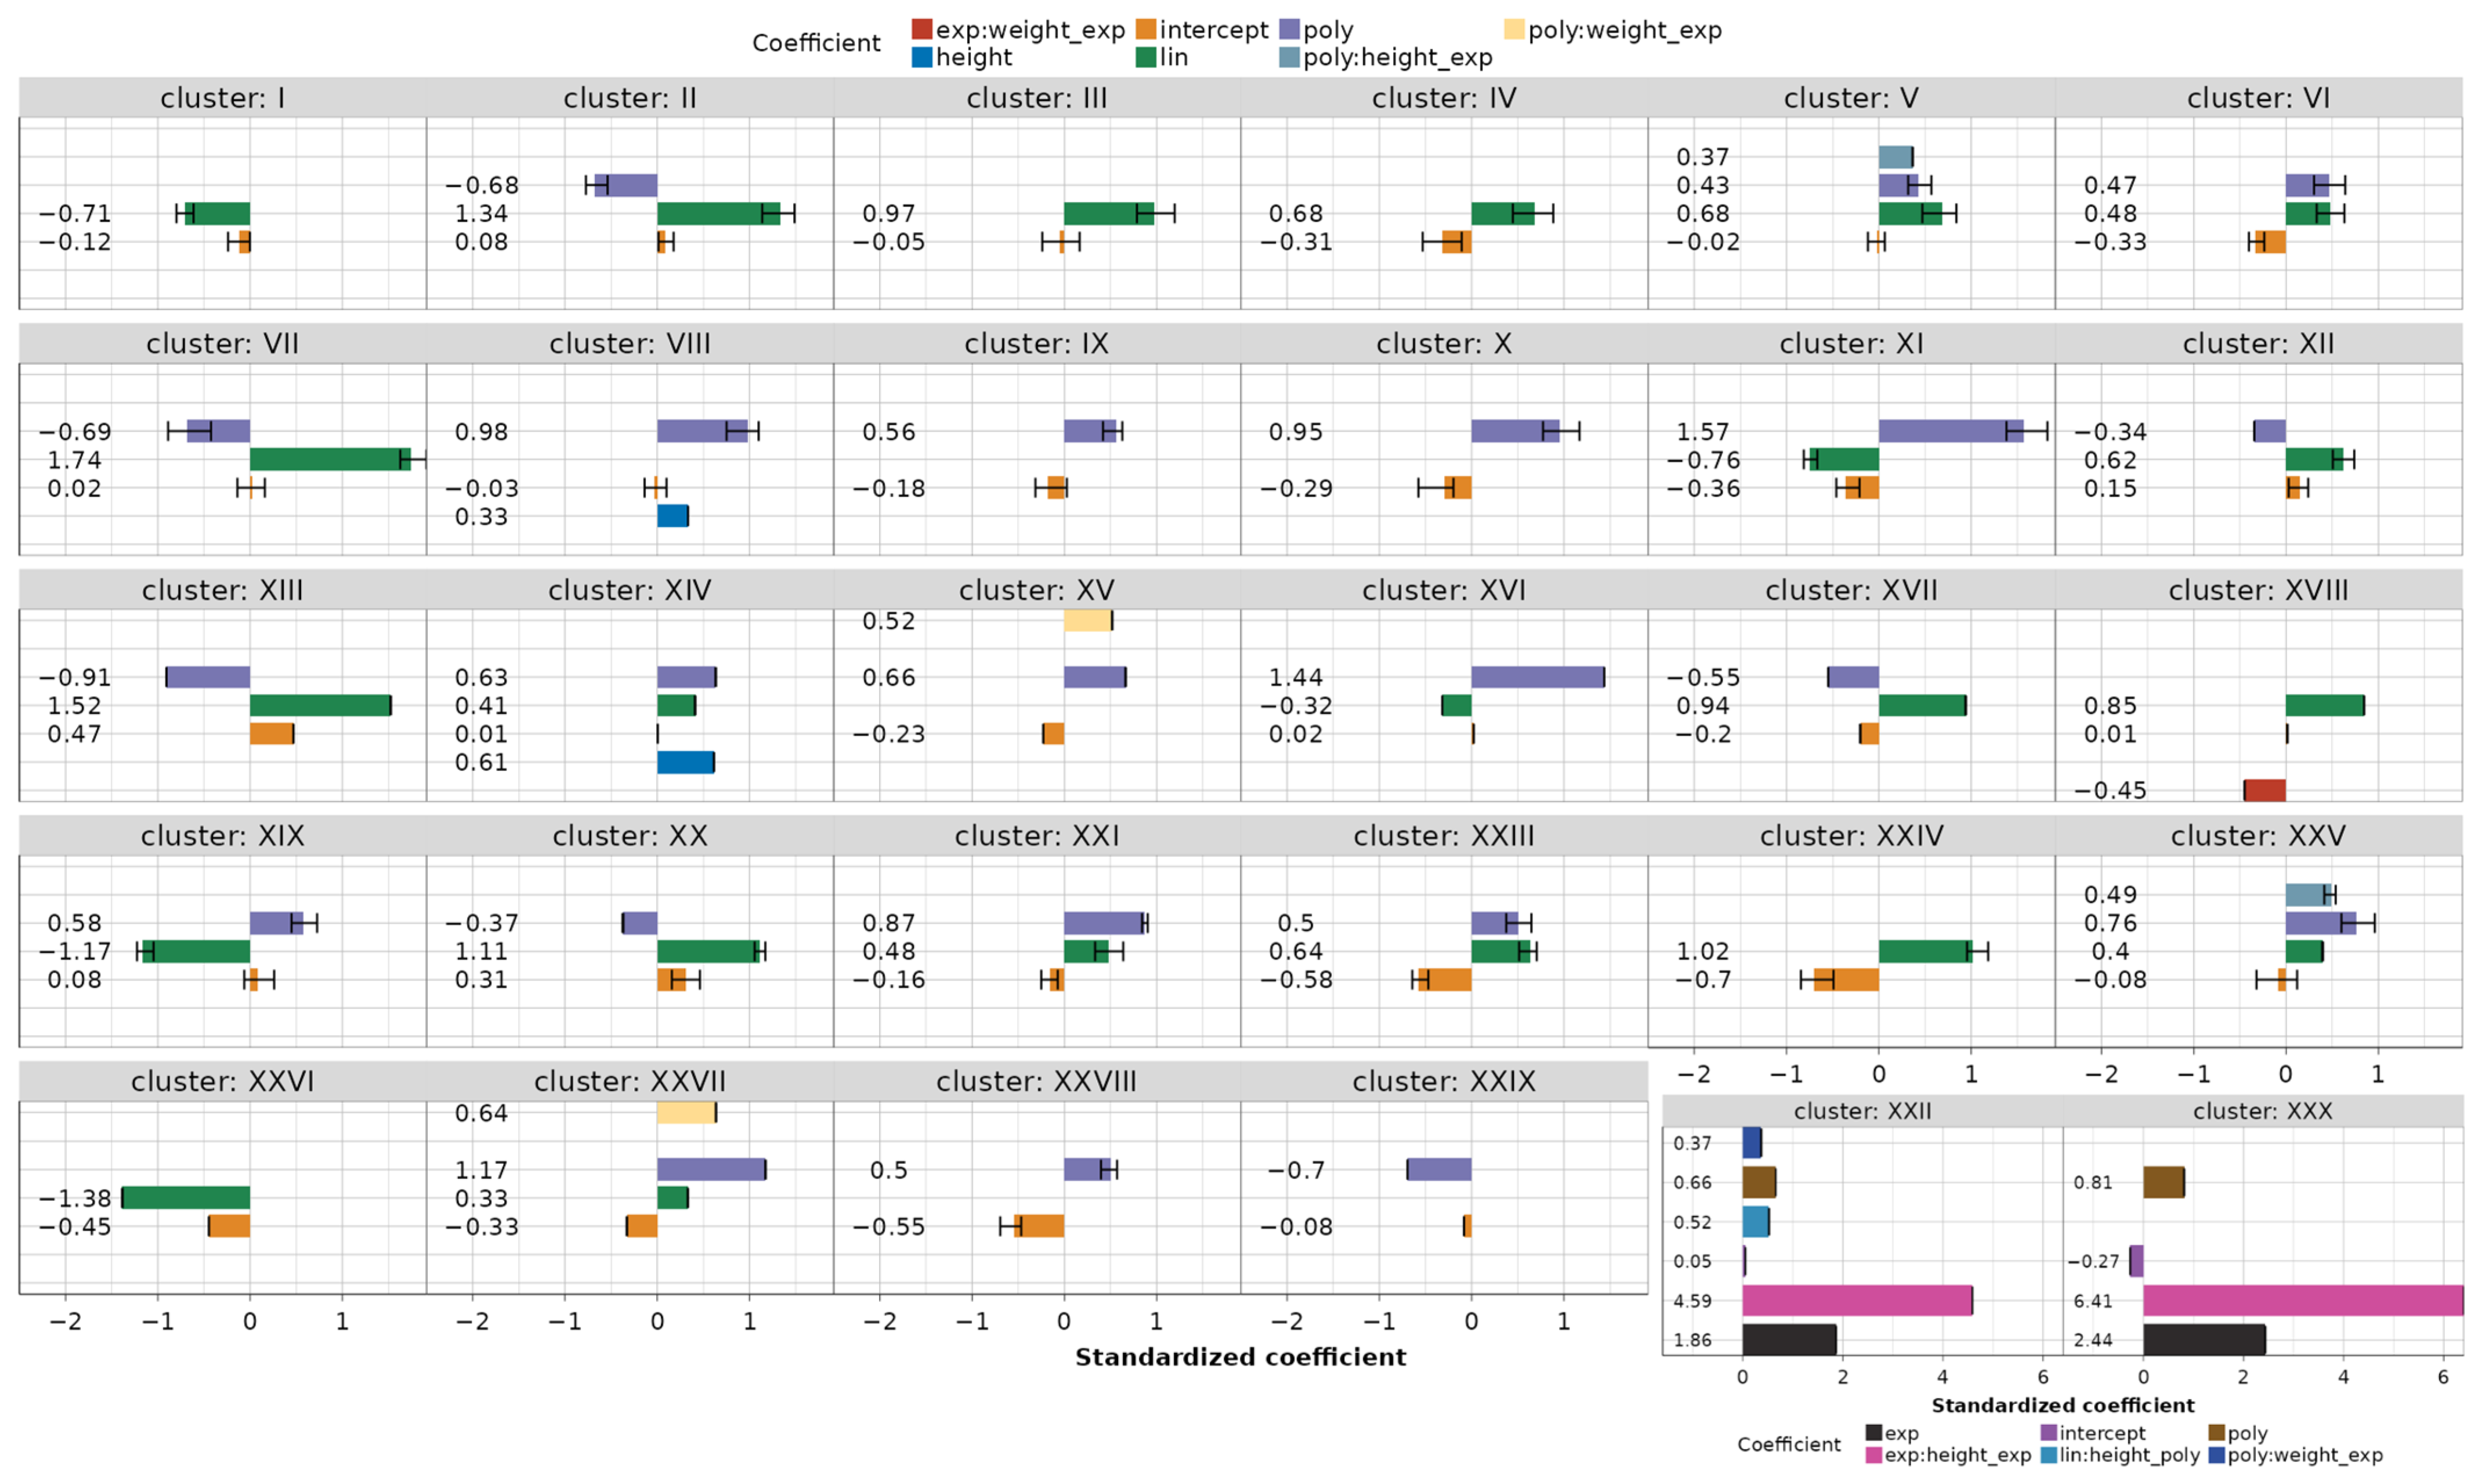
When the models are grouped into 30 clusters, the coefficients for each cluster can be estimated as the mean values of the standardized coefficients (refer also to Figure A1 and Figure A2) belonging to the clustered models, as depicted in Figure 13. In the figure, the minimum and maximum coefficient values per cluster are also presented, as are the singular clusters containing only one model.
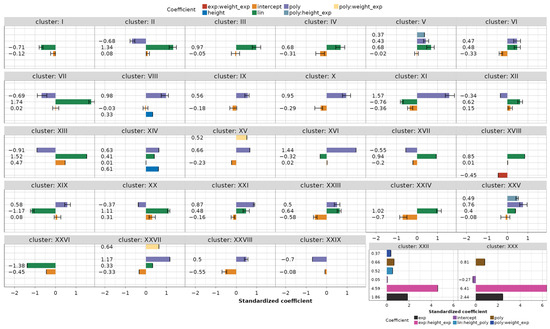
Figure 13.
Clustered models with mean, minimum, and maximum coefficient values.
The results of the LME modeling, performed in this work, still show that the major factor in explaining the variance during the kinematic modeling and the model reduction of flexion/extension angles is the subject-to-subject variation (modeled as a random effect), with a median value of 78% variance explained by such “per subject” grouping structure. This finding could potentially be attributed to the calibration protocol for the database, which involved a post-processing procedure performed according to [29]. This procedure utilized 10 subjects and 65 guided movements as the basis for computing sensor gain values, as referenced in [4], which were used by all subjects. It is also very interesting to note that the only selected coefficient for “per subject” grouping was intercept, which allows shifting the data by a constant. So, for each of the 116 developed models in this paper, all subjects used during the modeling process exhibited a similar pattern during the grasping motion but shifted by a subject-specific constant.
4. Discussion
The study described in this work presents a comprehensive investigation of grasp-oriented intra-finger dependencies, intending to develop accurate yet simple and applicable sparse kinematically reduced models of human hand movements. It is based on the large open-source database comprising synchronized joint angle values from 77 test subjects performing 23 different functional movements related to ADLs.
The method serves as a supplement to the extensively researched synergy-based PCA methods [11,12,13,14,17], intending to further alleviate control challenges and reduce the number of required actuation mechanisms. Since only intra-finger dependencies have been investigated in the paper, the proposed method views joint dependencies from a different perspective in terms of simpler and easier-to-implement 1-to-1 joint relationships, considering only joints located physically close to each other. Authors analyzing the same large dataset using a PCA-based approach [17] obtained a large number of 12 synergies to account for only 80% of the variance during grasping. Designing devices based on all of those synergies would be extremely challenging since existing devices typically utilize only 1–3 synergies [30,31]. Furthermore, there is a downside to the mechanical aspect of implementing PCA-obtained synergies. Devices based on synergistic control typically retain all degrees of freedom (DOFs) while reducing only the control aspect, leading to challenges in complex device design and necessitating trade-offs due to limited space for actuator placement. For instance, in [30], the authors omitted five joint actuators (all DIP + IP) and fixed the joints due to this constraint. Conversely, in [31], only the first postural synergy was used during device design, explaining 60% of the movement variance, resulting in evident reductions in DOFs. However, significant residual variance remained during the investigated activities of daily living (ADL) grasps. The mechanical design of the synergy was implemented as a multichannel pulley, with some compliance added to the transmission. The anthropomorphism of both designs could be further enhanced for certain grasps by introducing customized transmission elements using relationships proposed in this paper. Our methodology also enables the design of single-finger actuators as independent units, in contrast to synergies that involve multiple finger joints.
We initially introduced data wrangling techniques to curate the dataset. By focusing on finger flexion/extension movements and employing rigorous data preparation techniques, we identified 116 highly to very highly correlated dependency-movement relationships across all grasps. Subsequently, each relationship was modeled using a regularized and relaxed GLM for uncorrelated predictor selection. This was followed by further refinement by employing, as the final modeling technique, a weighted LME, where model reductions were based on both predictor significance and effect size. Both models were validated using the WMAE and WWMAPE metrics. For the final reduced LME models on the test datasets, the absolute WMAE ranged from 2.4° to 16° (median 7.5°), while the relative WWMAPE ranged from 11% to 56.1% (median 27.9%).
Through the use of hierarchical model clustering, we attained flexibility in reducing the number of models capable of describing the identified dependencies. This was achieved while maintaining the error margin, quantified by the Euclidean distance between standardized coefficients, to a lower value than 0.52. That is, starting from 116 models, the approach allowed a reduction down to 30 models. While all the data preparation and processing steps must be conducted offline, the resulting models are suitable for real-time implementation in rehabilitation devices and prosthetic hands. We synthesized the results by presenting the remaining independent DOFs for the fingers’ flexions/extensions during each of the 23 ADL grasps. Notably, the trajectories involved in different functional movements exhibited numerous correlations, allowing for a significant reduction in the total number of DOFs, with certain grasps requiring 5–15 DOFs (median 12) for kinematic characterization. This validation aligns well with the authors’ initial assumption regarding the application of grasp-oriented models during the rehabilitation procedures.
While the authors aimed to concisely present both the methodology and results for reducing grasp-oriented hand kinematic models, the complexity of the underlying problem and the wide variety of 21 ADL grasps led to the identification of as many as 30 clustered reduction relations. Some grasp models, including holding and cutting with a knife, turning a screwdriver, prismatic and tip pinching, prismatic four-finger grasp, and parallel extension grasp, posed greater challenges for reduction. The reduction in DOFs for these grasps ranged between 1 and 3. Thus, alternative approaches may be necessary to simplify the design of rehabilitation devices or prosthetic hands for such grasping types. Although the study analyzed a large number of subjects and grasps, the identified dependencies may not fully represent the diversity of hand movements across the entire population, as hand coordination can vary among individuals.
The direction for further research, along with an additional limitation, involves exploring inter-finger joint dependencies. The intention is to present these dependencies using the devised methodology and prepared dataset in this paper. Such a study could offer additional assistance in the development of anthropomorphic devices, leading to further reductions in the DOFs and simplification of design and control complexity.
Overall, this study lays the groundwork for future research in the field of prosthesis design and hand rehabilitation. It offers in-depth insights and structured methodologies that can contribute to the advancement of robotic rehabilitation devices.
Supplementary Materials
The following supporting information can be downloaded at: https://www.mdpi.com/article/10.3390/robotics13060082/s1, Table S1: Modelling information and error metrics; Table S2: Random effects; Table S3: Means and standard deviations for variable standardization.
Author Contributions
Conceptualization, T.B. and E.K.; methodology, T.B.; software, T.B.; validation, T.B., E.K., G.M. and S.Z.; formal analysis, T.B.; investigation, T.B.; resources, E.K. and S.Z.; data curation, T.B.; writing—original draft preparation, T.B. and E.K.; writing—review and editing, T.B., E.K., G.M. and S.Z.; visualization, T.B.; supervision, E.K.; funding acquisition, E.K. and S.Z. All authors have read and agreed to the published version of the manuscript.
Funding
This research was funded by the University of Rijeka; grant numbers: UNIRI-INOVA-1-22-10, uniri-iskusni-tehnic-23-47, and uniri-tehnic-18-32.
Institutional Review Board Statement
Not applicable.
Informed Consent Statement
Not applicable.
Data Availability Statement
The primary author, T.B., made the code available at https://github.com/tbazina/kinematic-database, accessed on 2 April 2024.
Acknowledgments
The research was conducted as part of the following projects: Rehabilitation devices based on the principles of soft robotics and biomechatronic sensors, Developing advanced rehabilitation devices using machine learning methods, and Innovative mechatronic structures for smart technological solutions.
Conflicts of Interest
The authors declare no conflicts of interest.
Appendix A. LME Model Coefficients’ Detailed Analysis and Model Error Metric Analyses
Figure A1 and Figure A2 provide standardized values of obtained LME model coefficients across all 116 dependency-movement relationships. Combining the same modeled dependency-movements in Figure A1 and Figure A2 gives a complete picture of the coefficients.
Figure A2 separates only linear (lin) and polynomial (poly) coefficients, with the inclusion of the mean subject intercept as a random effect for all 116 models. Dependencies in Figure A1, besides lin and/or poly, include up to seven additional model coefficients. The following predictors proved both significant and with medium-to-high effect:
- Subject height or its transformed interaction with other predictors in 9/116 models,
- Transformed subject weight in interaction with other predictors in 4/116 models.
For potential model coefficient users, the authors recommend standardizing the variables before using the coefficients and then back-transforming the scaling and centering on the dependent variable y using either the self-acquired means and standard deviations or Table S3 in the Supplementary Materials.
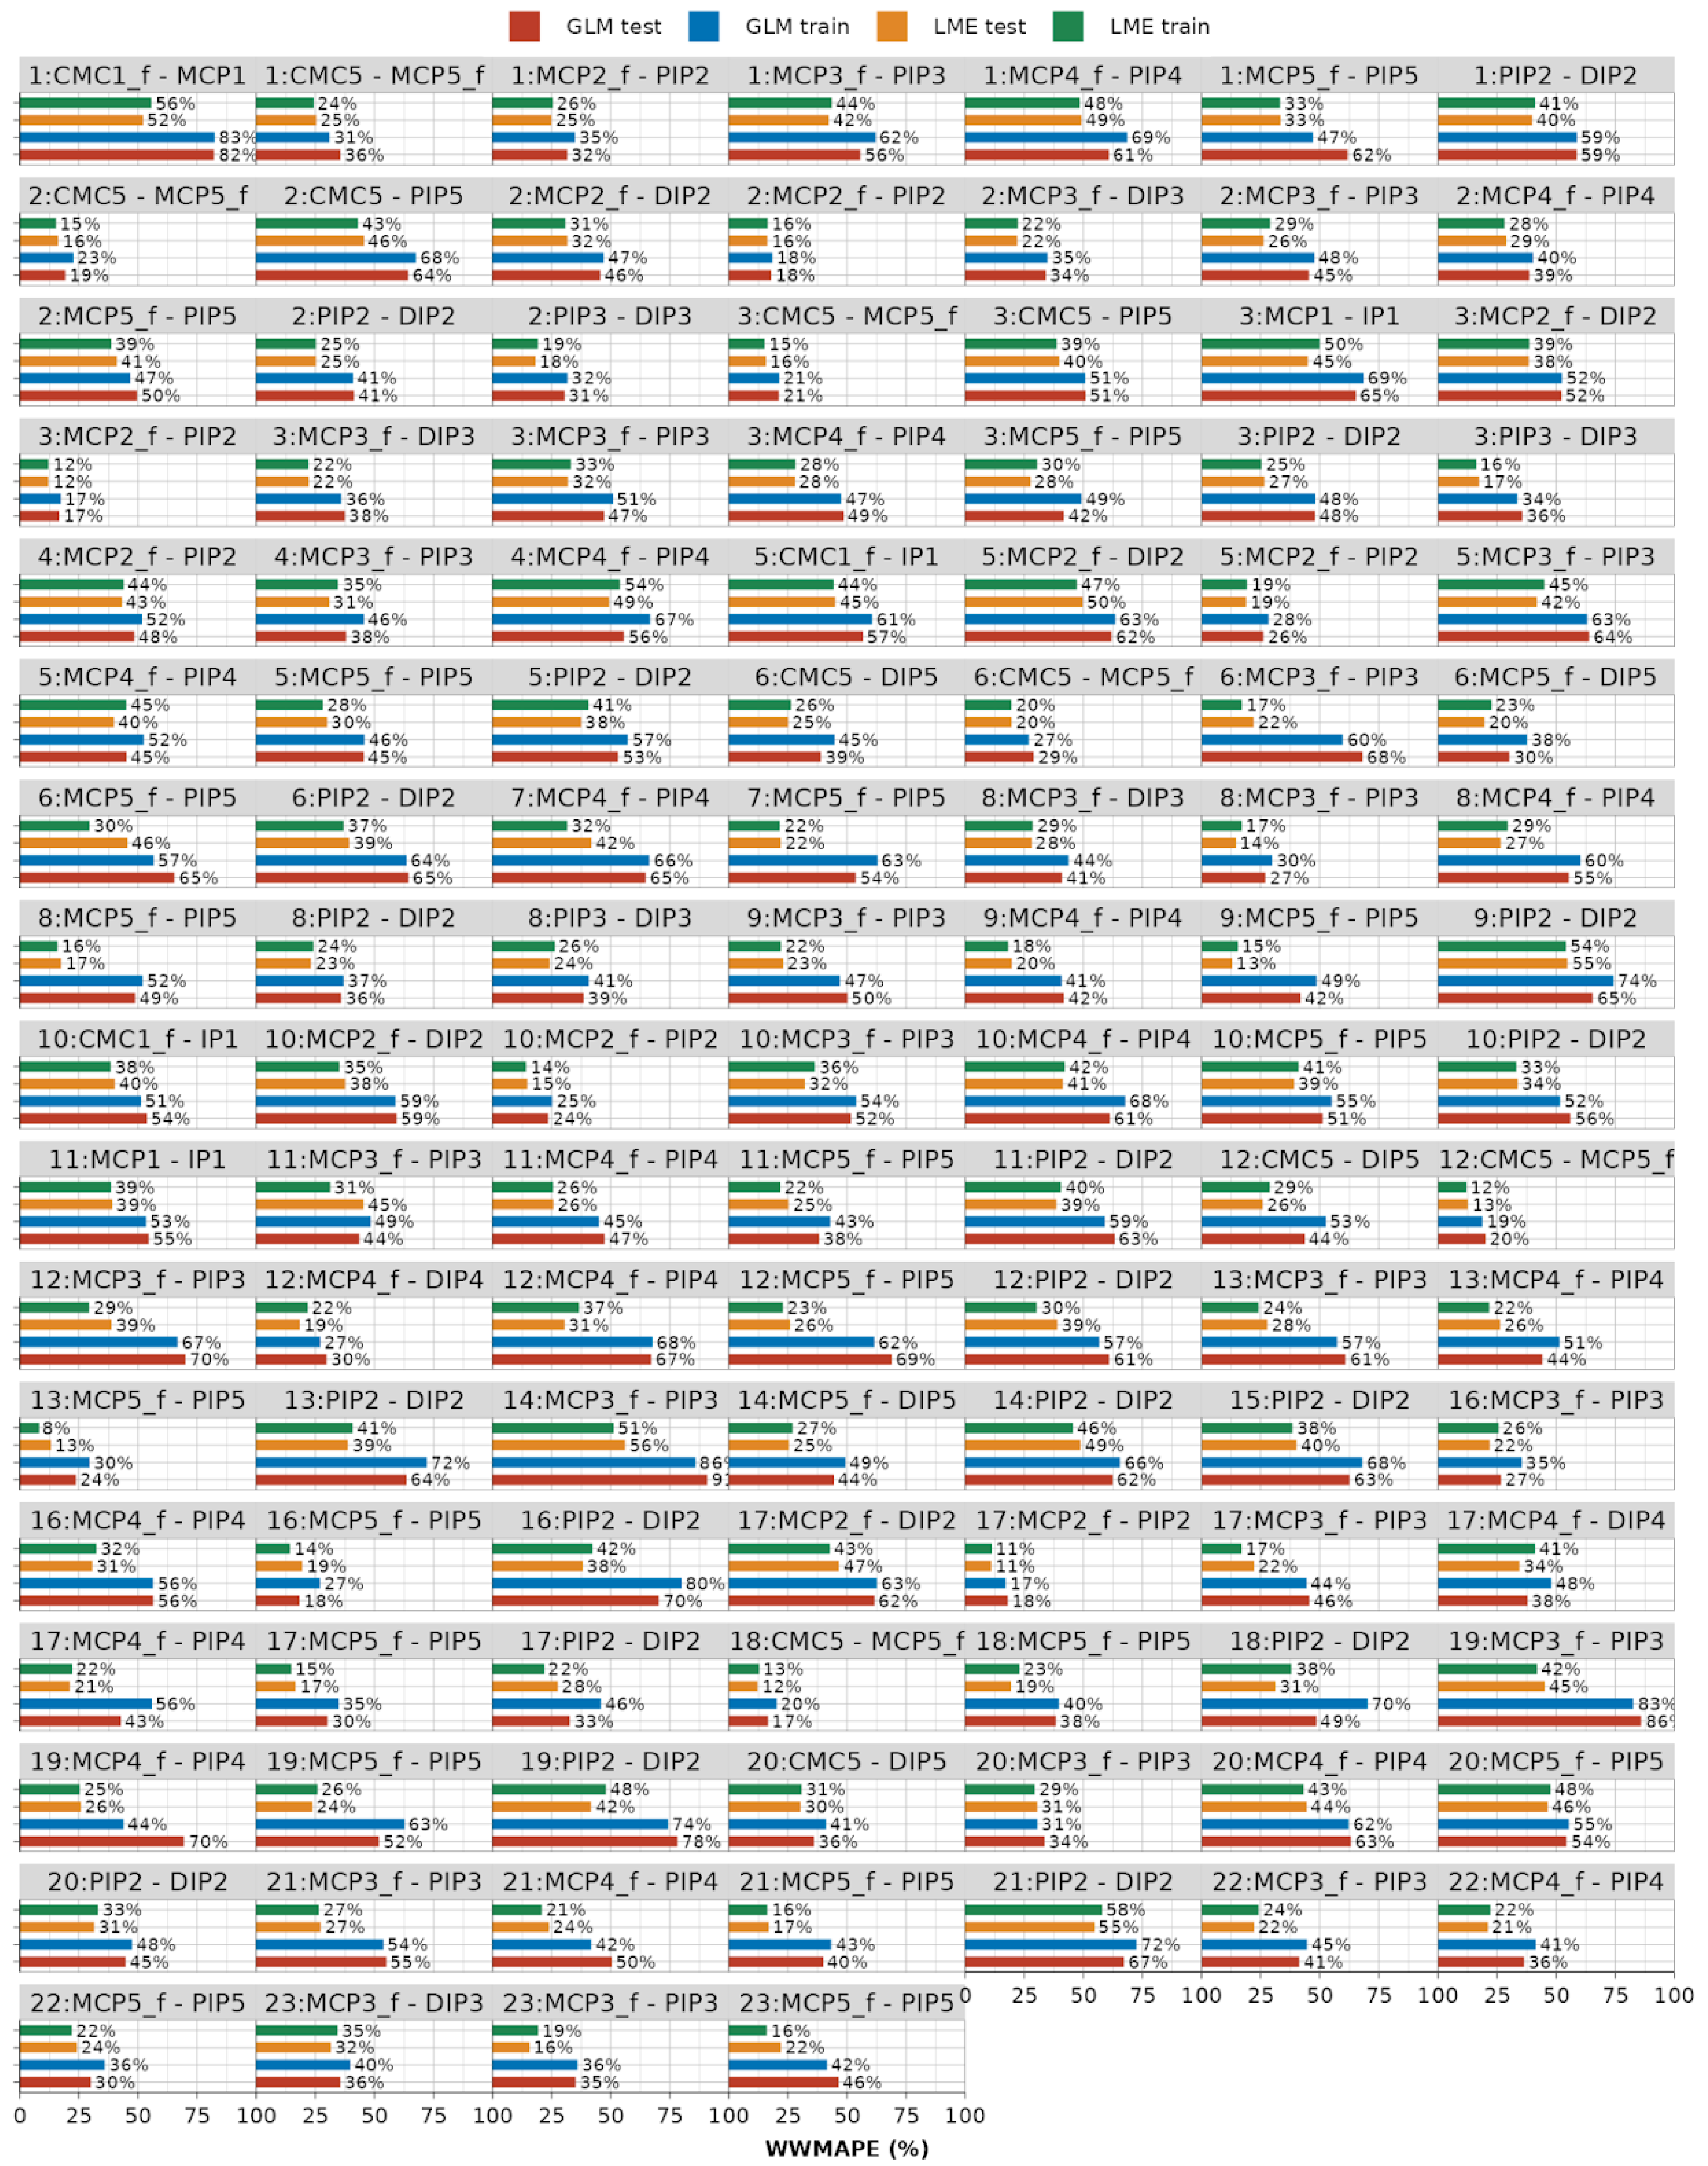
Figure A3 depicts the detailed analysis of the weighted mean absolute error (WMAE), while Figure A4 shows the overall results of the weighted mean absolute percentage error (WMAPE) on the train and the test datasets for all 116 identified models using both GLM and LME methods. The error metric is calculated according to Equations (6) and (7) provided in the main text. For readers’ convenience, a table representation of these results is provided in Table S1 within the Supplementary Materials.
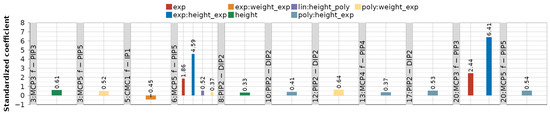
Figure A1.
Standardized coefficient values for modeled dependencies that comprise linear (lin) and/or polynomial (poly) and other predictors and interactions: exponential (exp), height, and weight (“:” denotes interaction).
Figure A1.
Standardized coefficient values for modeled dependencies that comprise linear (lin) and/or polynomial (poly) and other predictors and interactions: exponential (exp), height, and weight (“:” denotes interaction).
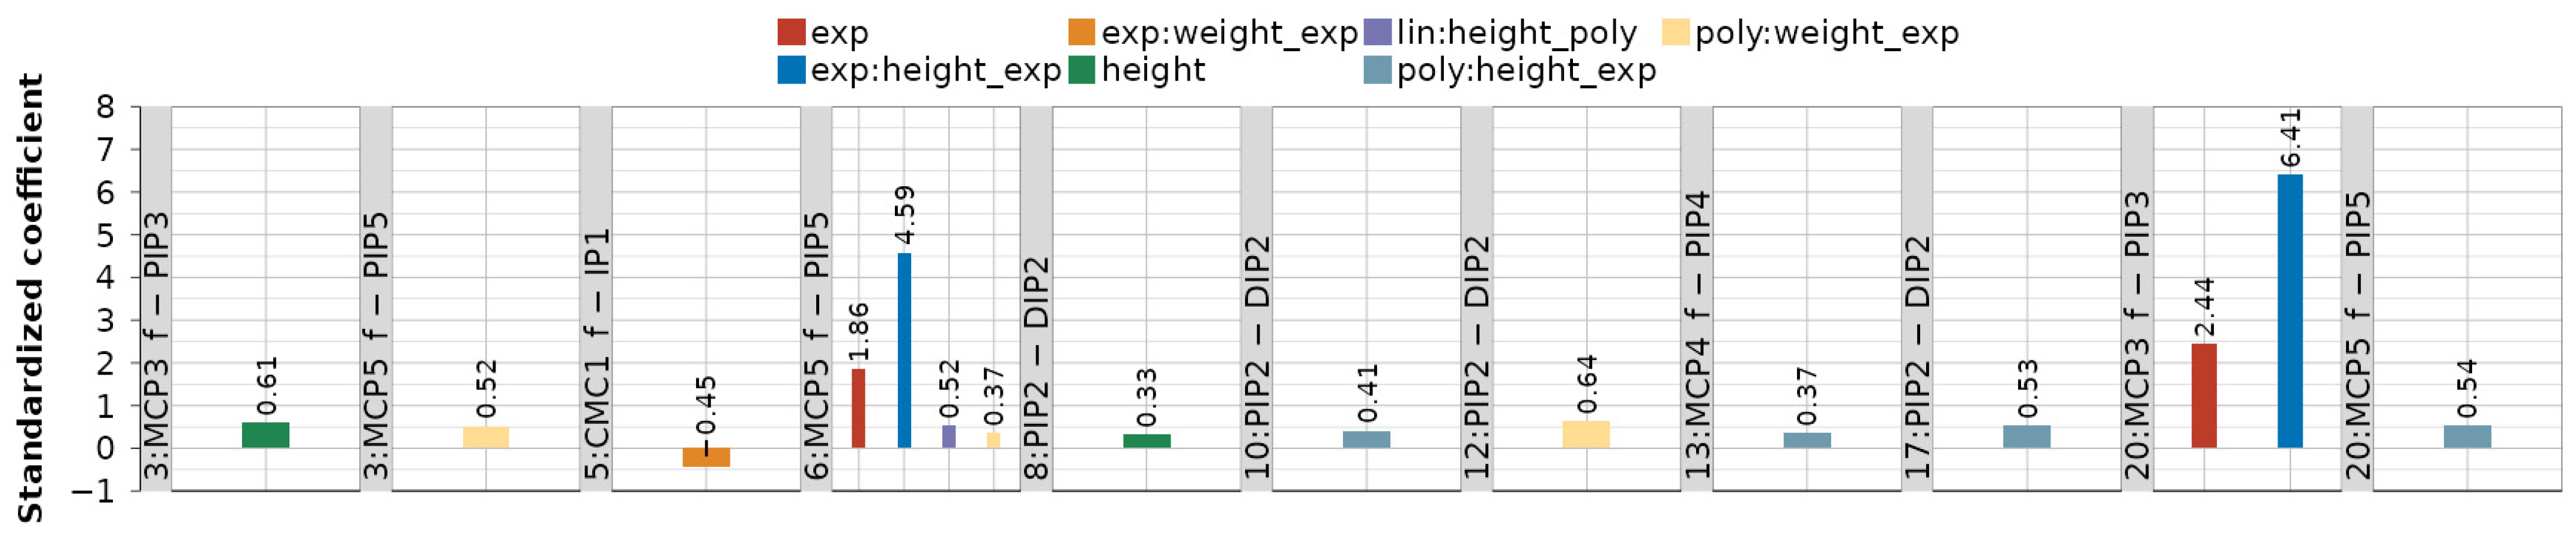
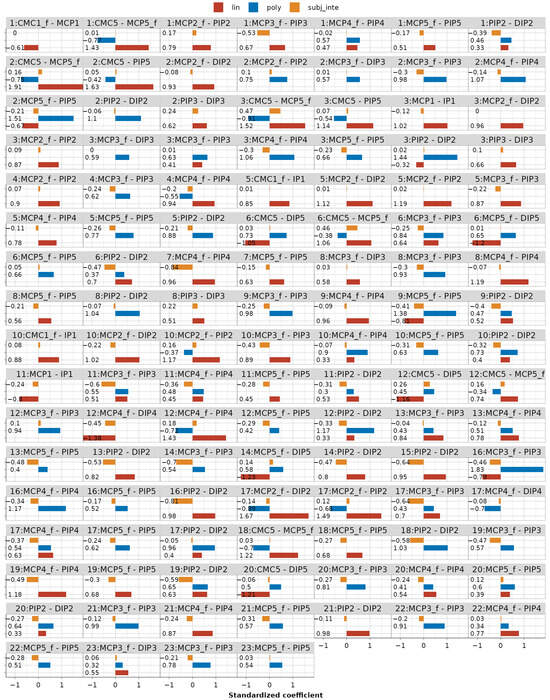
Figure A2.
Standardized coefficient values for all modeled dependencies that consist of random effects—subject intercept (subj_inte) and fixed effects—linear (lin) and polynomial (poly).
Figure A2.
Standardized coefficient values for all modeled dependencies that consist of random effects—subject intercept (subj_inte) and fixed effects—linear (lin) and polynomial (poly).
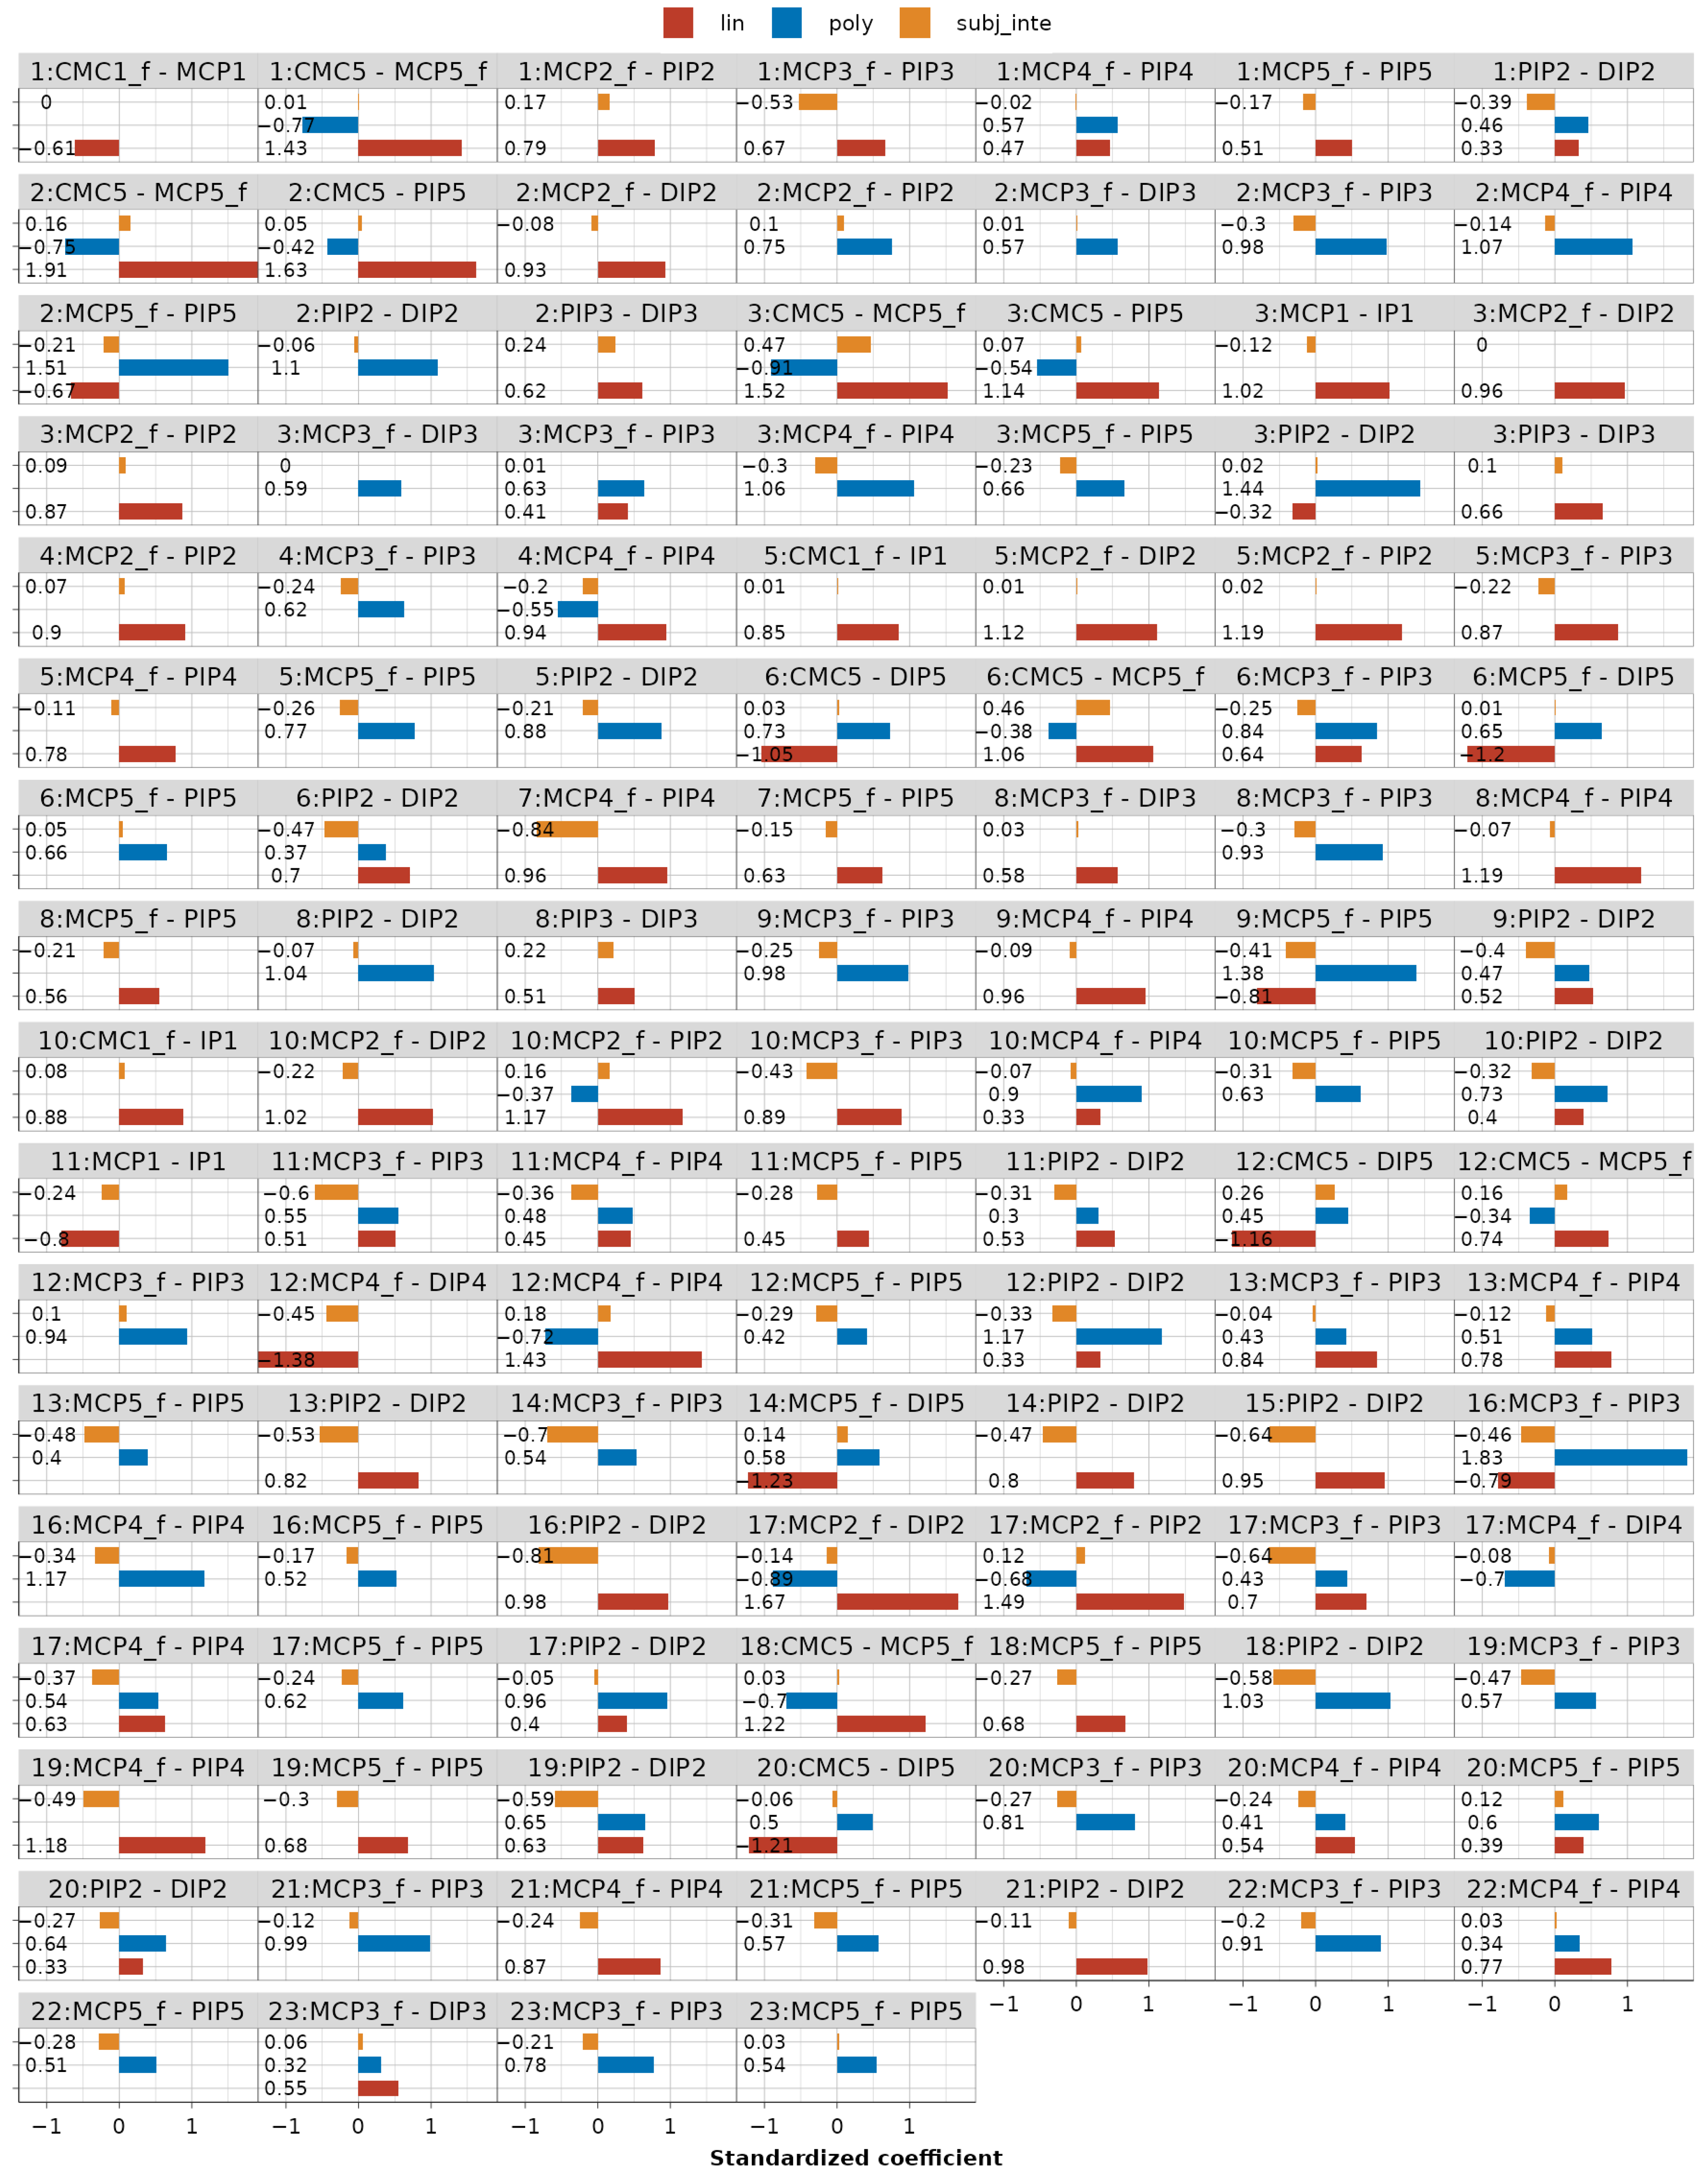
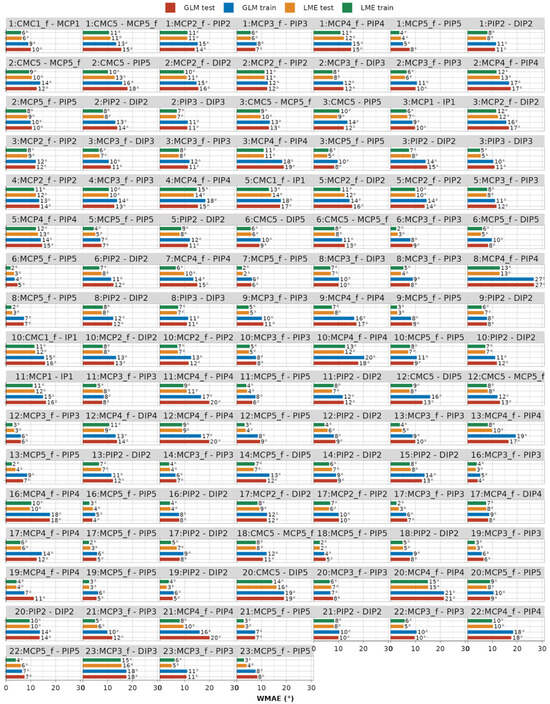
Figure A3.
Weighted mean absolute error (WMAE) on train and test datasets across all 116 modeled dependencies for both GLM and LME models.
Figure A3.
Weighted mean absolute error (WMAE) on train and test datasets across all 116 modeled dependencies for both GLM and LME models.
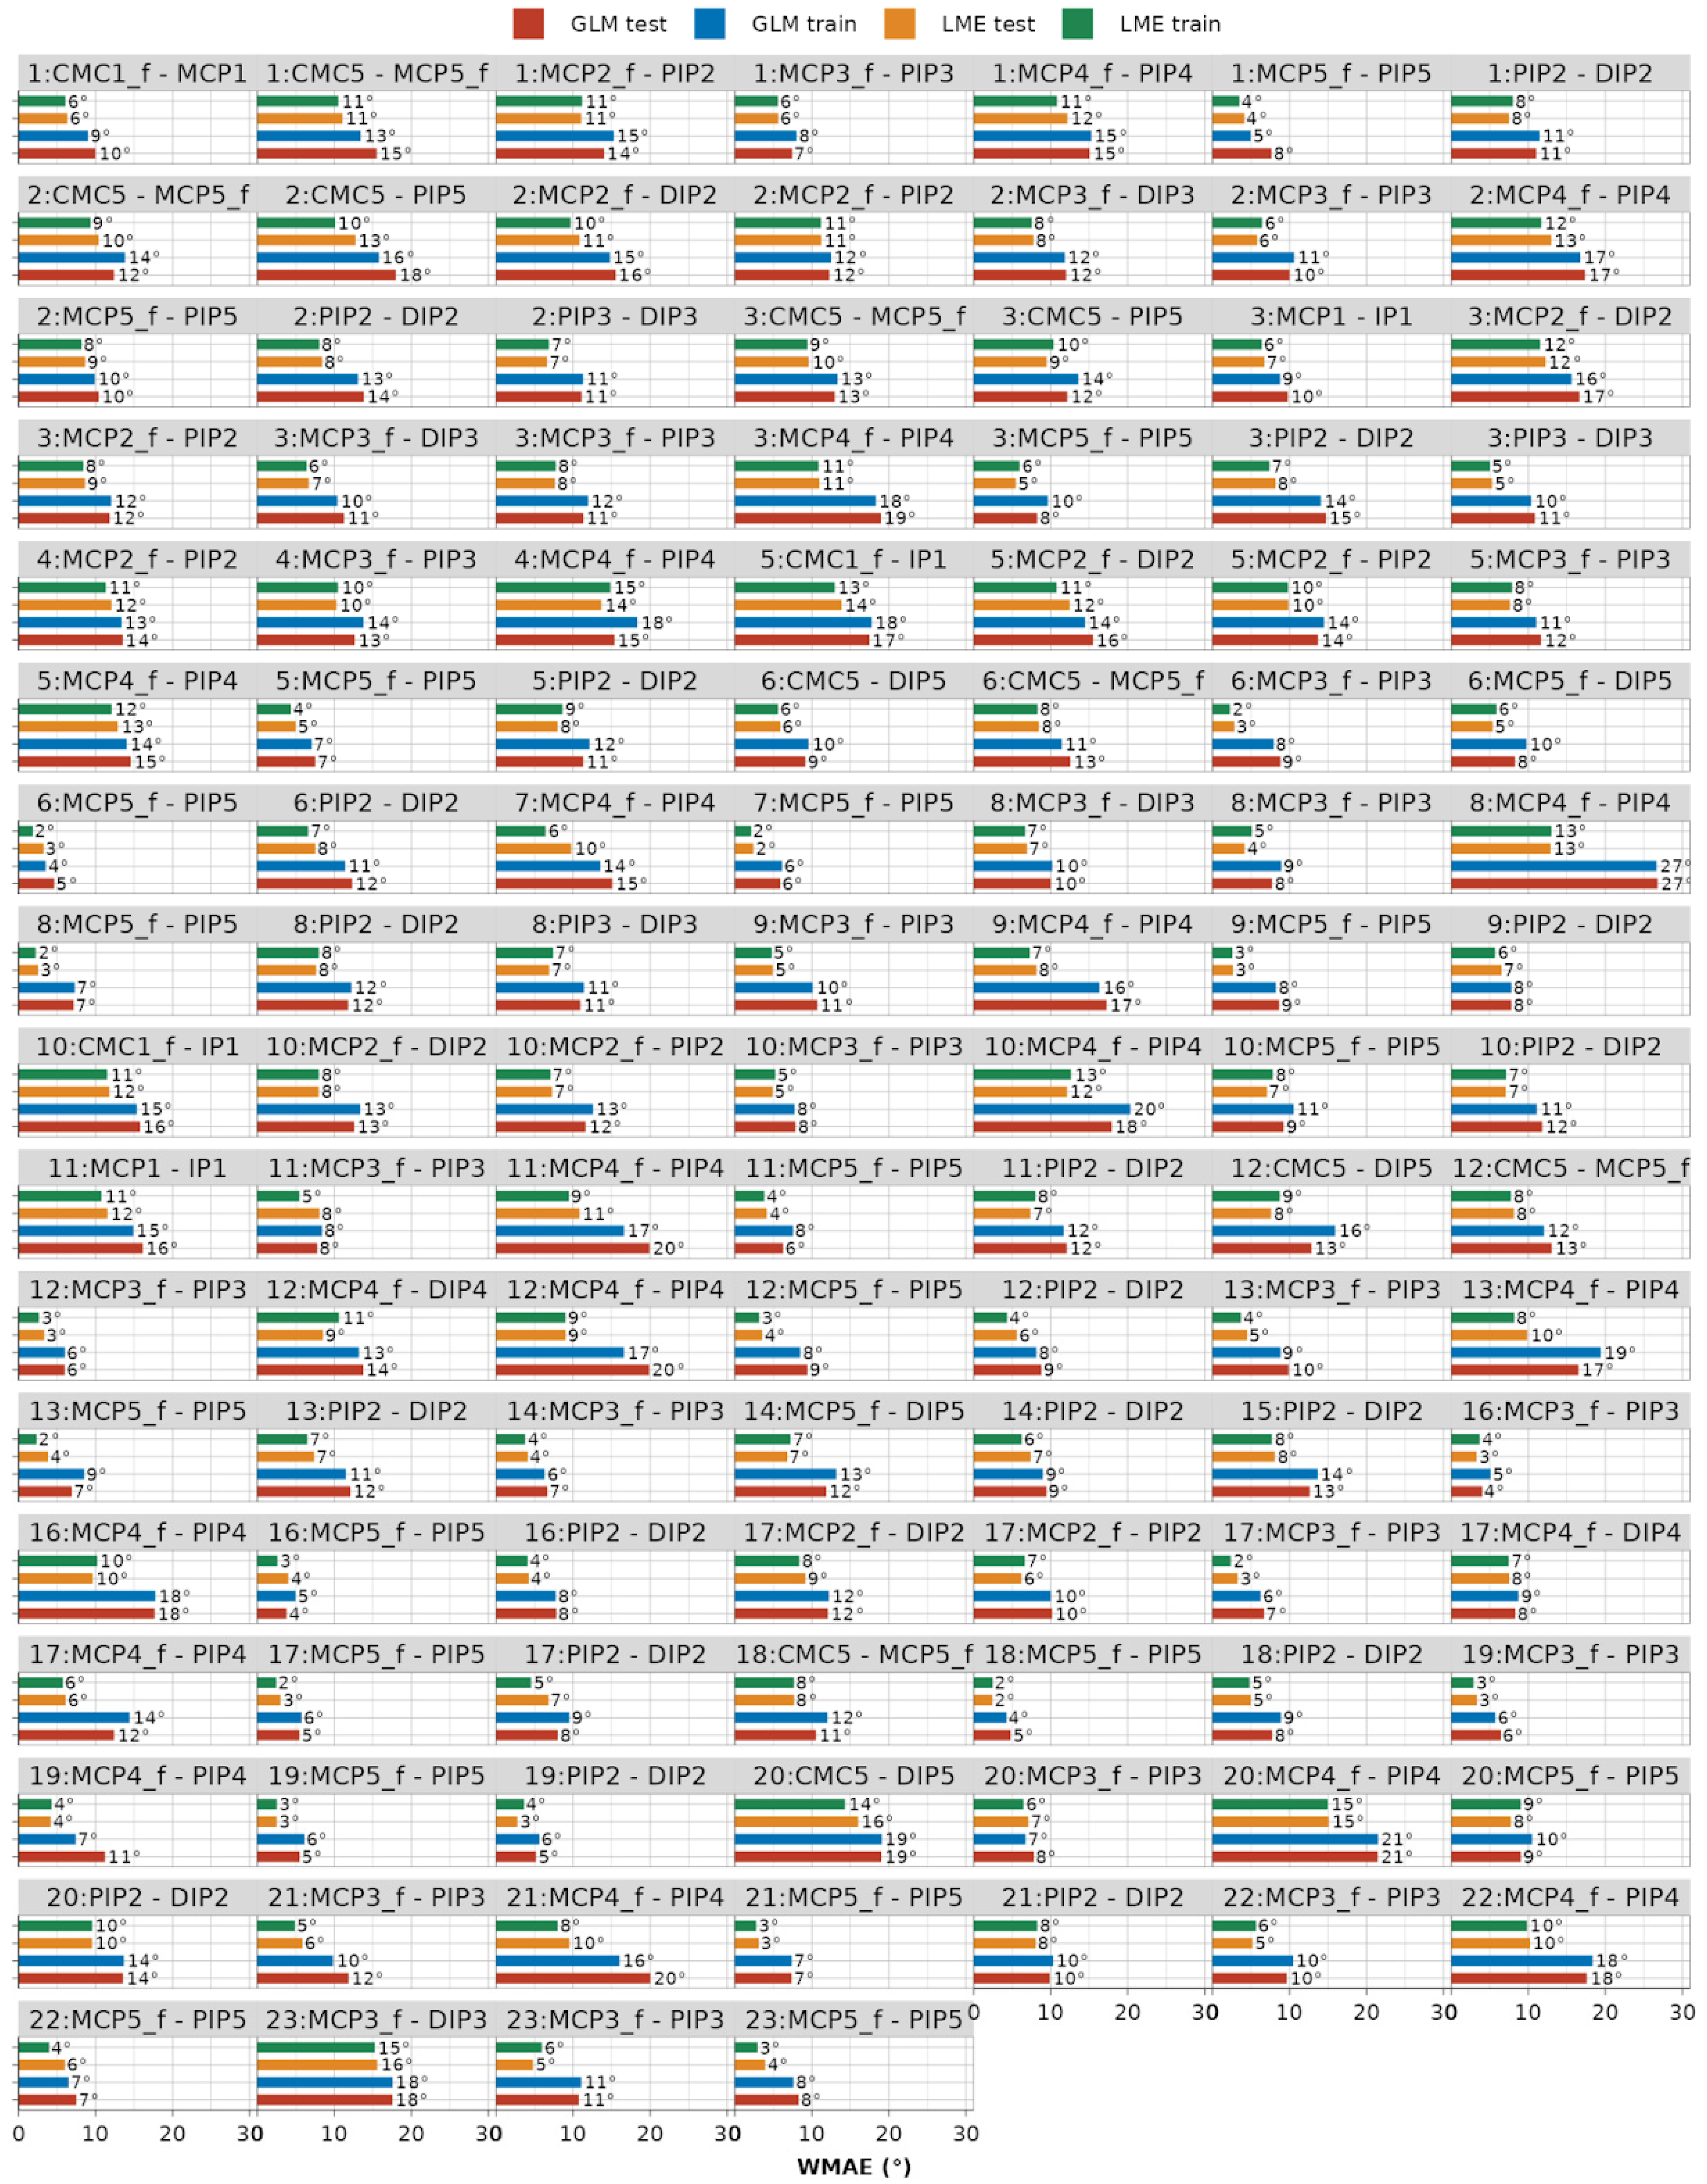
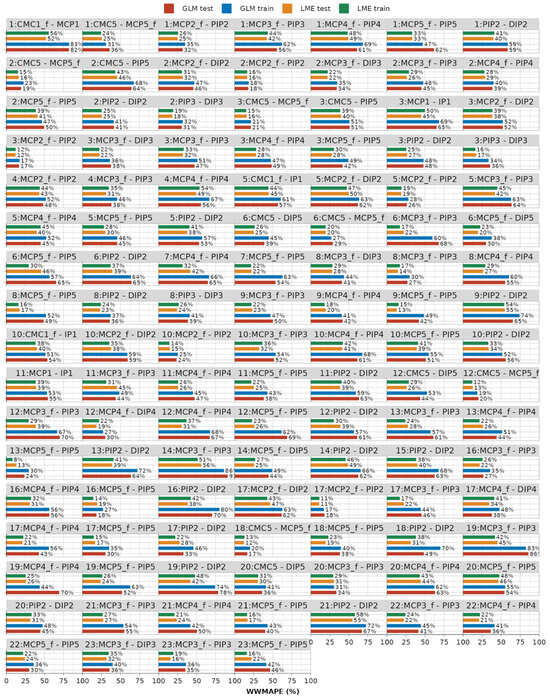
Figure A4.
Double-weighted mean absolute percentage error (WWMAPE) on train and test datasets across all 116 modeled dependencies for both GLM and LME models.
Figure A4.
Double-weighted mean absolute percentage error (WWMAPE) on train and test datasets across all 116 modeled dependencies for both GLM and LME models.
References
- Lang, C.E.; Lohse, K.R.; Birkenmeier, R.L. Dose and timing in neurorehabilitation: Prescribing motor therapy after stroke. Curr. Opin. Neurol. 2015, 28, 549–555. [Google Scholar] [CrossRef]
- Colombo, R.; Sanguineti, V. Rehabilitation Robotics: Technology and Application; Academic Press: London, UK, 2018. [Google Scholar]
- Engelhardt, L.; Melzner, M.; Havelkova, L.; Fiala, P.; Christen, P.; Dendorfer, S.; Simon, U. A new musculoskeletal AnyBody™ detailed hand model. Comput. Methods Biomech. Biomed. Engin 2020, 24, 777–787. [Google Scholar] [CrossRef] [PubMed]
- Jarque-Bou, N.J.; Atzori, M.; Müller, H. A large calibrated database of hand movements and grasps kinematics. Sci. Data 2020, 7, 12. [Google Scholar] [CrossRef] [PubMed]
- Li, R.; Wang, H.; Liu, Z. Survey on Mapping Human Hand Motion to Robotic Hands for Teleoperation. IEEE Trans. Circuits Syst. Video Technol. 2022, 32, 2647–2665. [Google Scholar] [CrossRef]
- Holzbaur, K.R.; Murray, W.M.; Delp, S.L. A model of the upper extremity for simulating musculoskeletal surgery and analyzing neuromuscular control. Ann. Biomed. Eng. 2005, 33, 829–840. [Google Scholar] [CrossRef] [PubMed]
- Ma’touq, J.; Hu, T.; Haddadin, S. A validated combined musculotendon path and muscle-joint kinematics model for the human hand. Comput. Methods Biomech. Biomed. Engin 2019, 22, 727–739. [Google Scholar] [CrossRef] [PubMed]
- Delp, S.L.; Anderson, F.C.; Arnold, A.S.; Loan, P.; Habib, A.; John, C.T.; Guendelman, E.; Thelen, D.G. OpenSim: Open-Source Software to Create and Analyze Dynamic Simulations of Movement. IEEE Trans. Biomed. Eng. 2007, 54, 1940–1950. [Google Scholar] [CrossRef] [PubMed]
- Cobos, S.; Ferre, M.; Ángel Sánchez-Urán, M.; Ortego, J.; Aracil, R. Human hand descriptions and gesture recognition for object manipulation. Comput. Method. Biomec. 2010, 13, 305–317. [Google Scholar] [CrossRef] [PubMed]
- Zhang, N.; Zhao, Y.; Gu, G.; Zhu, X. Synergistic control of soft robotic hands for human-like grasp postures. Sci. China Technol. Sci. 2022, 65, 553–568. [Google Scholar] [CrossRef]
- Kamper, D.G.; Cruz, E.G.; Siegel, M.P. Stereotypical Fingertip Trajectories During Grasp. J. Neurophysiol. 2003, 90, 3702–3710. [Google Scholar] [CrossRef]
- Jarque-Bou, N.; Gracia-Ibáñez, V.; Sancho-Bru, J.; Vergara, M.; Pérez-González, A.; Andrés, F. Using kinematic reduction for studying grasping postures. An application to power and precision grasp of cylinders. Appl. Ergon. 2016, 56, 52–61. [Google Scholar] [CrossRef] [PubMed]
- Jarque-Bou, N.J.; Vergara, M.; Sancho-Bru, J.L.; Gracia-Ibáñez, V.; Roda-Sales, A. Hand Kinematics Characterization While Performing Activities of Daily Living Through Kinematics Reduction. IEEE Trans. Neural Syst. Rehabil. Eng. 2020, 28, 1556–1565. [Google Scholar] [CrossRef] [PubMed]
- Gracia-Ibáñez, V.; Sancho-Bru, J.L.; Vergara, M.; Jarque-Bou, N.J.; Roda-Sales, A. Sharing of hand kinematic synergies across subjects in daily living activities. Sci. Rep. 2020, 10, 6116. [Google Scholar] [CrossRef] [PubMed]
- Prevete, R.; Donnarumma, F.; d’Avella, A.; Pezzulo, G. Evidence for sparse synergies in grasping actions. Sci. Rep. 2018, 8, 616. [Google Scholar] [CrossRef] [PubMed]
- Ninapro. Available online: https://ninapro.hevs.ch/ (accessed on 26 March 2024).
- Jarque-Bou, N.J.; Scano, A.; Atzori, M.; Müller, H. Kinematic synergies of hand grasps: A comprehensive study on a large publicly available dataset. J. Neuroeng. Rehabil. 2019, 16, 63. [Google Scholar] [CrossRef] [PubMed]
- Bazina, T.; Kamenar, E.; Zelenika, S.; Črnjarić-Žic, N.; Schnurrer-Luke-Vrbanić, T. Hand model with dependency constrained joints for applications in rehabilitation robotics. Med. Flum. 2022, 58, 385–398. [Google Scholar] [CrossRef]
- Tay, J.K.; Narasimhan, B.; Hastie, T. Elastic Net Regularization Paths for All Generalized Linear Models. J. Stat. Softw. 2023, 106, 1–31. [Google Scholar] [CrossRef] [PubMed]
- Wickham, H.; Averick, M.; Bryan, J.; Chang, W.; McGowan, L.D.A.; François, R.; Grolemund, G.; Hayes, A.; Henry, L.; Hester, J.; et al. Welcome to the Tidyverse. J. Open Source Softw. 2019, 4, 1686. [Google Scholar] [CrossRef]
- Luraschi, J.; Kuo, K.; Ruiz, E. Mastering Spark with R: The Complete Guide to Large-Scale Analysis and Modeling; O’Reilly Media: Newton, MA, USA, 2019. [Google Scholar]
- GitHub. Available online: https://github.com/tbazina/kinematic-database (accessed on 2 April 2024).
- Rousseeuw, P.J.; Hubert, M. Robust statistics for outlier detection. Wires Data Min. Knowl. 2011, 1, 73–79. [Google Scholar] [CrossRef]
- Mukaka, M.M. Statistics corner: A guide to appropriate use of correlation coefficient in medical research. Malawi Med. J. 2012, 24, 69–71. [Google Scholar]
- Bates, D.; Mächler, M.; Bolker, B.; Walker, S. Fitting Linear Mixed-Effects Models Using lme4. J. Stat. Softw. 2015, 67, 1–48. [Google Scholar] [CrossRef]
- Nieminen, P. Application of Standardized Regression Coefficient in Meta-Analysis. BioMedInformatics 2022, 2, 434–458. [Google Scholar] [CrossRef]
- Meteyard, L.; Davies, R.A. Best practice guidance for linear mixed-effects models in psychological science. J. Mem. Lang. 2020, 112, 104092. [Google Scholar] [CrossRef]
- Koo, T.K.; Li, M.Y. A Guideline of Selecting and Reporting Intraclass Correlation Coefficients for Reliability Research. J. Chiropr. Med. 2016, 15, 155–163. [Google Scholar] [CrossRef] [PubMed]
- Gracia-Ibáñez, V.; Vergara, M.; Buffi, J.H.; Murray, W.M.; Sancho-Bru, J.L. Across-subject calibration of an instrumented glove to measure hand movement for clinical purposes. Comput. Methods Biomech. Biomed. Eng. 2016, 20, 587–597. [Google Scholar] [CrossRef]
- Laffranchi, M.; Boccardo, N.; Traverso, S.; Lombardi, L.; Canepa, M.; Lince, A.; Semprini, M.; Saglia, J.A.; Naceri, A.; Sacchetti, R.; et al. The Hannes hand prosthesis replicates the key biological properties of the human hand. Sci. Robot. 2020, 5, eabb0467. [Google Scholar] [CrossRef]
- Alicea, R.; Xiloyannis, M.; Chiaradia, D.; Barsotti, M.; Frisoli, A.; Masia, L. A soft, synergy-based robotic glove for grasping assistance. Wearable Technol. 2021, 2, e4. [Google Scholar] [CrossRef]


Disclaimer/Publisher’s Note: The statements, opinions and data contained in all publications are solely those of the individual author(s) and contributor(s) and not of MDPI and/or the editor(s). MDPI and/or the editor(s) disclaim responsibility for any injury to people or property resulting from any ideas, methods, instructions or products referred to in the content. |
© 2024 by the authors. Licensee MDPI, Basel, Switzerland. This article is an open access article distributed under the terms and conditions of the Creative Commons Attribution (CC BY) license (https://creativecommons.org/licenses/by/4.0/).